ph.d. dissertation in agricultural extension faculteit...while there is no consensus on a...
TRANSCRIPT

Shiraz University
Faculty of Agriculture
Ph.D. Dissertation
In Agricultural Extension
EXPLAINING THE EQUILIBRIUM
BETWEEN LIVESTOCK AND RANGELAND
USING FUZZY LOGIC
By
HOSSEIN AZADI NASRABAD
Supervised by
Dr. Mansour Shahvali
Dr. Nezameddin Faghih
December 2005

IN THE NAME OF GOD
EXPLAINING THE EQUILIBRIUM
BETWEEN LIVESTOCK AND RANGELAND
USING FUZZY LOGIC
BY
HOSSEIN AZADI NASRABAD
DISSERTATION
SUBMITTED TO THE SCHOOL OF GRADUATE STUDIES IN PARTIAL
FULFILMENT OF THE REQUIREMENTS FOR THE DEGREE OF
DOCTOR OF PHILOSOPHY (PH.D.)
IN
AGRICULTURAL EXTENSION
SHIRAZ UNIVERSITY
SHIRAZ
ISLAMIC REPUBLIC OF IRAN
EVALUATED AND APPROVED BY THE THESIS COMMITTEE AS: EXCELLENT
MANSOUR SHAHVALI, Ph.D., …………………………………………… ASSOCIATE PROF., DEPT. OF AGRICULTURAL EXTENSION & EDUCATION, SHIRAZ UNIVERSITY.
Supervisor
(Chairman)
NEZAMEDDIN FAGHIH, Ph.D., ……...……………...…………………… PROF., DEPT. OF MANAGEMENT, SHIRAZ UNINIVERSITY.
Supervisor
JAN VAN DEN BERG, Ph.D., ..…………………………………..………… ASSOCIATE PROF., DEPT. OF COMPUTER SCIENCE, ERASMUS UNIVERSITY ROTTERDAM.
Advisor
HOSSEIN MARZBAN, Ph.D., ……...……………………...……………….. ASSISSTANT PROF., DEPT. OF ECONOMICS, SHIRAZ UNIVERSITY.
Advisor
AHMAD KHTOONABADI, Ph.D., .…………………………...……………
ASSISSTANT PROF., DEPT. OF RURAL DEVELOPMENT, ISFAHAN UNIVERSITY OF TECHNOLOGY.
Advisor
MOHMMAD JAVAD ZAMIRI, Ph.D., …………………………………..... PROF., DEPT. OF ANIMAL SCIENCE, SHIRAZ UNIVERSITY.
Advisor
DECEMBER 2005

Dedicated to:
Anahita
for all her sympathies

i
Acknowledgements
All praises belong to Allah, The Most Gracious and Most Merciful, for His blessings that enabled me to accomplish this dissertation. This study is a product of many hands that directly and indirectly pushed me to gait the next steps. It is my pleasure to express my gratitude to individuals for their help and supports. My special word of thanks goes to Dr. Mansour Shahvali, my first supervisor, for his continuous supports not only during the course of this study but also in all other my academic activities. I am also grateful to Dr. Nezameddin Faghih, my second supervisor for his directions to set up this research, especially during the initial stages of planning the work. It would be a great honor for me to convey my sincere gratitude to Dr. Jan van den Berg, for his great contribution to solve my educational and residential problems during my stay in the Netherlands. My sincere gratitude goes to Dr. Hossein Marzban, Dr. Ahmad Khatoonabadi and Dr. Mohammad Javad Zamiri for sharing their knowledge and experiences to conduct this study. Many thanks go to Dr. Gholam Hossein Zamani; the head of Department of Agricultural Extension and Education at Shiraz University and my other respected teachers, Prof. Dr. Ezatollah Karami, Dr. Dariush Hayati and Mohammad Bagher Lari for all their supports during my university studies. I am also thankful to Mr. Ali Kheradmand, Mr. Asghar Sahranavard, Ms. Tooran Jezghani, Khalighzadeh, Adeli, and Paydar for all their helps. Special thanks go to my dearest classmate, Dr. Kiumars Zarafshani who is the best friend for me. Also, to my other classmates, especially Dr. Nozar Monfared and Dr. Ahmad Abedi. I am grateful to the pastoralists and the experts of various administrations in Fars province, especially Talati, Riahi, Haddadi, Mansoori and Mohseni. My greatest gratitude goes to my beloved wife, Anahita Aghaei for her supports, prayers, and unlimited patience during this long-term study. My special gratitude goes to Jozef Caluwaerts and my mother-in-law for all their continual supports. Finally, to my mother, father and family for all their endless supports.
Hossein Azadi Nasrabad
Shiraz University, Iran
December 2005

ii
Abstract
While there is no consensus on a definition, it is widely recognized that the concept of sustainability has economic, environmental and social dimensions. We used fuzzy logic as a well-suited tool to handle the vague, uncertain, and polymorphous concept of sustainability. For recognizing the major important indicators in defining sustainability in rangeland management, several semi-structured interviews with an open-ended questionnaire were held in three different areas of the Fars province in Southwest Iran. Different groups of ‘experts’ were chosen by using the ‘socio-metric’ sampling method, and were interviewed. Pastoralists’ experts recognized that sustainability in rangeland management is a function of three major components (inputs) which are the Stocking Rate in a rangeland, the amount of Plantation Density per hectare, and the Number of
Pastoralists who live in a rangeland where the output of the model is the Right
Rate of Stocking. Based on pastoralists’ insights we developed a model called Equilibrium Assessment by Fuzzy Logic (EAFL) which provides a mechanism for assessing sustainability in rangeland management. The EAFL model exhibits five important characteristics. First, it permits the combination of various aspects of sustainability with different units of measurement. Second, it overcomes the difficulty of assessing certain attributes or indicators of sustainability without precise quantitative criteria. Third, it supports researcher with an easy to use and interpret. Fourth, considering the sequence "crisp input – fuzzifier – inference engine – defuzzifier – crisp output", it illustrates the uncertainity that exists in such a complex vague concept as sustainable rangeland management, and fifth, it also well adjusts to usual ambigious linguistic statements of individuals. To deal with the heterogeneity of experts’ knowledge, which should be considered either as a reality or necessity, a multi-fuzzy model was developed. In order to find the final output of the multi-fuzzy model, different ‘voting’ methods were applied. The mean method simply uses the arithmetic average of the primary outputs as the final output of the multi-fuzzy model. This final output represents an estimation of the Right Rate of Stocking. By harmonizing the primary outputs such that outliers get less emphasis, an unsupervised voting method calculating a weighted estimate of the Right Rate of Stocking was introduced. This harmonizing method is expected to provide a new useful tool for policymakers in order to deal with heterogeneity in experts’ opinions: it is especially useful in cases where little field data is available and one is forced to rely on experts’ knowledge only. By constructing the three fuzzy models based on the heterogeneous knowledge and using some harmonized methods, our study tried to show the multi-dimensional vaguenesses which generally exist in rangeland management, and solve the conflict that especially exists in economical and conservational views in the Iranian rangeland management. Finally, by comparing the estimated Right Rate of
Stocking, which elicited from both experts' opinions and Matlab Fuzzytoolbox Editor, with its medium range, the models verified overgrazing in the three regions of the Fars province in Southwest Iran.

iii
Contents Acknowledgement ……………………………………………………………………… i Abstract ………………………………………………………………………………….. ii Chapter One – Introduction …………………………………………………………… 1
1.1. Prelude …………………………………………………………………………... 1
1.2. Population Growth ……………………………………………………………… 3
1.3. Current challenges in rangeland management ………………………………… 4
1.4. Defining the problem …………………………………………………………… 6
1.5. Objectives ……………………………………………………………………….. 9
1.5.1. General goal ………………………………………………………………… 9 1.5.2. Specific goals ……………………………………………………………….. 9
1.6. The structure of dissertation ……………………………………………………. 10
Chapter Two - Population Growth: Consequences …………………………………. 11
2.1. Population growth ………………………………………………………………. 11
2.1.1. A general view ……………………………………………………………… 11 2.1.2. Three possible scenarios ……………………………………………………. 13
2.1.2.1. Low scenario …………………………………………………………… 14 2.1.2.2. Medium scenario ……………………………………………………….. 16 2.1.2.3. High scenario …………………………………………………………… 18
2.2. Consequences …………………………………………………………………… 20
2.2.1. A historical challenge ………………………………………………………. 21 2.2.2. Food security ………………………………………………………………... 23 2.2.3. Food consumption …………………………………………………………... 26 2.2.4. Agricultural research ………………………………………………………... 28 2.2.5. Biotechnology ………………………………………………………………. 30 2.2.6. Arable land ………………………………………………………………….. 33 2.2.7. Water scarcity ………………………………………………………………. 37 2.2.8. Forestry and fisheries ……………………………………………………….. 42 2.2.9. Rangelands …………………………………..……………………………... 43
2.3. Conclusion ………………………………………………………………………. 45
Chapter Three - Sustainability: Basic Challenges ………………………………...… 48
3.1. Importance ……………………………………………………………………… 48
3.2. Definitions ……………………………………………………………………… 51
3.3. Dimensions ……………………………………………………………………… 53
3.4. Modeling problems ……………………………………………………………... 55
3.5. Conclusion ……………………………………………………………………… 59
Chapter Four - Rangeland Management: Basic Challenges and Principles ………. 61
4.1. A review of literature …………………………………………………………… 61
4.2. Rangeland management: Art or science? ……………………………………… 63
4.3. Equilibrium and disequilibrium systems in rangeland management …………. 64
4.4. Current challenges in rangeland management ………………………………… 66
4.4.1. Overgrazing ………………………………………………………………… 66 4.4.2. Carrying capacity …………………………………………………………… 68
4.5. Basic principles in rangeland management ……………………………………. 70
4.6. Conclusion ……………………………………………………………………… 77
Chapter Five - Application of Fuzzy Logic in Sustainable Rangeland Management ………………………………………………………
82
5.1. Fuzzy Logic: A shifting paradigm ……………………………………………... 82

iv
5.2. Foundations of fuzzy logic ……………………………………………………... 85
5.2.1. Crisp models ………………………………………………………………... 85 5.2.2. Boolean vs. Fuzzy ………………………………………………………….. 86 5.2.3. Towards soft computing ……………………………………………………. 87 5.2.4. Towards fuzzy sets ………………………………………………………….. 89 5.2.5. Operators on fuzzy sets ……………………………………………………... 89 5.2.6. Linguistic variables …………………………………………………………. 90 5.2.7. Knowledge representation by fuzzy IF-Then rules …………………………. 91 5.2.8. Architecture of fuzzy systems ………………………………………………. 92 5.2.9. Fuzzy reasoning …………………………………………………………….. 92
5.3. Theoretical frameworks ………………………………………………………… 94
5.3.1. Architecture the EAFL model ………………………………………………. 94 5.3.2. Architecture of multi-fuzzy model …………………………………………. 96
Chapter Six - Research Method ……………………………………………………….. 100
6.1. The population of study ………………………………………………………… 100
6.2. The area of study ………………………………………………………………... 103
6.3. Research method ………………………………………………………………... 106
6.3.1. Multiple-case study …………………………………………………………. 108
6.4. Sampling method ………………………………………………………………... 109
6.5. Data collection and applied techniques ………………………………………... 110
6.5.1. Data analysis ………………………………………………………………... 111 Chapter Seven - Fuzzy Analysis and Discussion ……………………………………. 112
7.1. Development the EAFL model ………………………………………………… 112
7.1.1. Determining the relevant input and output variables ……………………….. 112 7.1.2. Defining linguistic values …………………………………………………... 112 7.1.3. Constructing membership function …………………………………………. 113 7.1.4. Determining the fuzzy rules ………………………………………………… 114 7.1.5. Computing degree of membership of crisp inputs ………………………….. 116 7.1.6. Detemining approximate reasoning ………………………………………… 117 7.1.7. Computing crisp output (defuzzify) ………………………………………… 118 7.1.8. Assessing the model performance ………………………………………….. 119
7.2. Development the multi-fuzzy model …………………………………………... 121
7.2.1. Computing the crisp primary outputs ………………………………………. 124 7.2.2. Implementing voting ………………………………………………………... 128
7.2.2.1. Method 1: Calculating the mean of outputs ……………………………... 128 7.2.2.2. Method 2: Minimizing the sum of squared errors ……………………….. 130 7.2.2.3. Method 3: Minimizing an approximation of the sum of squared errors …... 130 7.2.2.4. Method 4: Harmonizing the primary outputs ……………………………. 131
7.2.3. Comparison of Method 1 and Method 4 ……………………………………. 134
Chapter Eight - Summary and Conclusions ………………………………………….. 139
8.1. Summary ………………………………………………………………………… 139
8.2. Conclusions ……………………………………………………………………... 141
Bibliography …………………………………………………………………………….. 145
APPENDIX 1 ………………………………………………………………………….... 165
APPENDIX 2 ………………………………………………………………………….... 166

v
Tables Table 2.1. The projection of world population (Medium scenario) 1950-2050. …………. 16 Table 2.2. Water scarcity by country groups. ……………………………………………. 41 Table 6.1. General information of the three regions of the study. ……………………….. 105 Table 6.2. Some personal characteristics of 9 nominated experts at the first round of
study……………………………………………………………………………
109 Table 7.1. Linguistic values used in the EAFL model. …………………………………... 113 Table 7.2. The complete rules base (33 = 27) used to construct the overall experts’
knowledge base. …...………………………………………………………….
115 Table 7.3. Assessing the performance of the EAFL model by using real data. ………….. 119 Table 7.4. Inputs, linguistic values and fuzzy range of each experts. ……………………. 122 Table 7.5. Characteristics of the output (RRS) for three fuzzy models. ………………….. 124 Table 7.6. Computing the outputs of the first model with 5 cases for each region. ……… 125 Table 7.7. Computing the outputs of the second model with 5 cases for each region. …... 126 Table 7.8. Computing the outputs of the third model with 5 cases for each region. …….. 127 Table 7.9. Finding the final outputs by calculating the mean of primary outputs. …….… 128 Table 7.10. Estimating the final output RRSf by calculating the sum of weighted outputs
for separated regions according to Method 4. ………………………………..
133

vi
Figures Fig. 2.1. World population: Three possible futures. ……………………………………... 13 Fig. 2.2. World Population and Arable Land, 1700 – 1990. ……………………………... 35 Fig. 5.1. Diagrammatic representation of the linguistic variable stocking rate in a
rangeland having linguistic values low, medium, and high defined by a corresponding membership function. …………………………………………..
91 Fig. 5.2. Building blocks of a Fuzzy Inference System (FIS). …………………………… 92 Fig. 5.3. Scheme of development of the EAFL model applying approximate reasoning to
assess the Right Rate of Stocking (RRSp) based on the inputs values (I1p, I2p, and
I3p). …...…………………………………………………………………………
95 Fig. 5.4. Architecture of the multi-fuzzy model to deal with different experts’
knowledge. ……………………………………………………………………...
98 Fig. 7.1. Membership functions for a) Stocking Rate, b) Plantation Density, and c)
Number of Pastoralists. ………………………………………………………...
114 Fig. 7.2. Linguistic values and fuzzification of crisp inputs for a) Stocking Rate, b)
Plantation Density, and c) Number of Pastoralists ……………………………..
116 Fig. 7.3. Graphical illustration of the EAFL model for approximate reasoning and
defuzzification. …………………………………………………………………
118 Fig. 7.4. Comparison of the RRSf for the harmonized method and mean method. ………. 135
1
Chapter One
Introduction
1.1. Prelude
At the beginning of this century, it is important to care the scarcity of
resources and food for everyone. This shortage has made a major
challenge for policy-makers. Population growth on one hand and
production diversification on the other has made a dilemma in natural
resources management. At the ecological level, land scarcity is
causing food scarcity for the ever-increasing population. Brown et al.,
(2000) believe that:
• Resources are becoming scarce,
• Natural species and forests are destroyed which also leads to
destruction of wildlife and fisheries, and
• Air pollution is causing contamination faster than it can be
recovered.
Scientists believe that the number one cause of environmental
contamination is “over consumption”. In spite of major development
in 1950s and 1960s, the recent socio-cultural and environmental crises
have caused a major destruction in sustaining natural resources. This
has led to the new development under the label of sustainability.
Sustainable Development (SD) is nowadays the goal in words at least,
of most politicians and decision makers (Rigby et al., 2001). Since
publication of the Brundtland report in 1987 (WCED, 1987; p. 43), the
concept of SD was defined as "development that meets the needs of

2
the present without compromising the ability of future generations to
meet their own needs".
Demands for natural resources are recently high among rural areas.
Most people in developing countries are agrarians and pastorals. In
1988 some 65 percent of the population in what the World Bank
classified as low-income countries were living in rural areas. The
share of the labour force engaged in agriculture in these countries was
a bit higher, and agriculture accounted for about 30 percent of GDP.
In industrial countries, by contrast, agriculture accounted for 6 percent
of the labour force and 2 percent of GDP (Dasgupta and Maler, 1995).
For most part developing countries have biomass-based subsistence
economies, in that rural people live on products obtained directly from
plants and animals (Dasgupta, 1996). Studies in Central and West
Africa have shown how vital natural resource products are to the lives
of rural inhabitants (Falconer, 1990; Falconer and Arnold, 1989).
Come what may, developing countries will remain largely rural
economies for sometimes. Thus, it seems obvious that any
management techniques in natural resources in developing countries
should take into account the enormous importance of these countries’
natural resources base. Forty years of research on maintaining
equilibrium between supply and demand on the natural resources
among pastorals has failed to do so. This is because the current
management strategies have taken a "black and white" logic in their
attitudes. In the case of range or pastures, the only way to reduce
degradation is to not use them, and this is unlikely to be the right
approach. However, an optimal pattern of use seems appropriate for
sustaining these resources. In order to reach an optimal pattern, we
need to reconsider our range management views. Thus, an informed

3
management must define values of rangeland use by pastorals as well
as values of natural resources as inputs in production. Of the many
factors that affect natural resource management, such as property
right, population growth, and discounting and access to markets,
population growth gains the most important.
1.2. Population Growth
Rapid population growth directly contributes to range and pasture
degradation. Also, population growth may break down social norms
and resource management systems, further contributing to natural
resource degradation. The relationship between population growth and
natural resource degradation is positive. Pastorals depend more on
basic natural resources. While, population growth rate and their
consumption level affect poverty and natural resource degradation,
degradation affects the capacity of the pastorals (Pender, 1999). The
future scenarios on population growth and its effects can be
summarized as follows:
• The world’s population is growing by 200,000 people a day. It
is expected to nearly double by 2050, from 5.7 billion in 1994
to about 10 billion people (Peterson, 1998). Nearly, all the
growth will occur in the developing world (UNFPA, 2005)1;
• Absolute number of poor will remain quite high (FAO, 2003);
• Land per capita availability will go down (PAI, 2005);
• Environmental pollution likely to worsen (UNEP, 2000); and
1. Between 1980 and 2030, the population of low- and middle-income countries will be more than
double - to 7.0 billion, compared with 1 billion for high-income countries. In the next 35 years, 2.5 billion people will be added to the current population of 6 billion (World Bank, 1998).

4
• Global climate change will have serious effect on agriculture
and rural pastorals (Kautza and Gronski, 2003).
Responding to the needs of a rapidly growing population can
challenge a country’s ability to manage its natural resources on a
sustainable basis. People may not be able to get access to safe water
because more and more households, farms and factories are using
increasing amounts of water. The air may become polluted as people
crowd into cities, the number of cars increases, people use more and
more energy, and economies continue to industrialize. Deforestation
may occur as trees are cut to provide fuel for cooking, building
materials, or land for grazing and agriculture. Desertification may
occur as land that has been intensively farmed becomes depleted of its
nutrients or eroded when trees whose roots systems once anchored the
soil are gone (World Bank, 1998). Land degradation is one of the
other consequences of mis-management of land and results frequently
from a mismatch between land quality and land use (Reich et al.,
2001).
1.3. Current challenges in rangeland management
Literature on rangeland grazing management is being published at an
accelerating rate, even though the use of rangelands for domestic
stock production is increasingly questioned on conservation and
sustainability grounds in the world (Walker and Hodgkinson, 2000).
There are some references which indicate that the only way to reduce
degradation is not to utilize natural resources, and this is unlikely to be
the right approach. However, an alternative pattern of use seems to be
possible where a balance is reached between grazing and conserving

5
these resources. In order to reach this pattern, we need to reconsider
our range management views. An informed management must define
values of pasture use by pastorals as well as values of natural
resources as inputs in production. Demand for natural resources is
recently high among rural areas. Most people in developing countries
are agrarian and pastoralist. There are an estimated 190 million
pastoralists in the world (NGO Forum for Food Sovereignty, 2002).
The majority of them suffer from the effects of settlement,
encroachment on their traditional rangelands, lack of infrastructure,
hostile market mechanisms, and difficulties of marketing their
products, forcing large numbers to abandon their rural livelihoods and
seek employment in cities. Human interference keeps numbers at
artificially high levels, e.g. by feeding imported fodder and household
residues to animals that then have the energy to go to the last
grasslands. “Without interference, livestock numbers respond to the
laws of population dynamics” (NGO Forum for Food Sovereignty,
2002; p. 3). In this case, therefore, with increasing population growth
(specially in developing countries like Iran), the increased number of
livestock would be expected. This continuous overgrazing has
changed the composition of the pasturage and is reflected in a decline
in the animal quality. Thus, it seems obvious that any management
techniques in natural resources in developing countries should take
into account the enormous importance of these countries’ natural
resources base. Forty years of research projects and activities on
maintaining equilibrium between supply and demand on the natural
resources among pastorals has failed to do so, because the projects
have focused mostly on grazing management. Although grazing
management is important, because this is where theory is put into

6
practice, however, successful grazing management will be based on
the ability to accomplish three objectives:
1. To control what animal graze,
2. To control where they graze, and
3. To monitor the impact on both the environment and the animal
(Walker, 1995).
Governments and international donor agencies have over the years
supported a variety of interventions aimed at improving the
rangelands. These interventions include (i) sedentarization, i.e. the
placing of pastoralists in permanent settlements and providing an
alternative livelihoods such as irrigated agriculture; (ii) controlled
grazing schemes, such activities established and enforced land
management rules which are conducting in Iran, Kenya and Tanzania;
and (iii) construction of boreholes to provide water for pastoralists and
their livestock (Azadi et al., 2003; Lusigi and Acquay, 1999).
1.4. Defining the problem
A claim is commonly made that the rangelands of the world are
overgrazed and hence producing edible forage and animal produce at
less than their potential. Globally, rangelands are also at risk from
numerous pressures. The most important pressure arises from
overgrazing of livestock. Livestock, therefore, have been a key factor
in the SD in rangeland management. But what will their role be in the
future and how should the science of rangeland management change
to meet the challenges of the future?
The recent literature on rangelands disequilibrium model calls into
question any specific measures of carrying capacity, whether the range
is stocked or unstocked, managed or mis-managed. Ideally, such

7
objections can be taken into account for any individual carrying
capacity estimated by accepting that it has to be determined on a case
- by - case basis in the field. Once one knows the size of the grazing
and browsing animals, and once one knows the biomass production of
the area, the pattern of range management, and so on, she/he can - so
this argument goes - produce a site specific carrying capacity
estimated for the range area under consideration. But, it cannot pack
livestock into a given rangeland, without at some point deteriorating
that range demonstrably. The fact get higher importance when we
notice that biomass production, surely is going down on rangelands
because carrying capacity has been exceeded for so long, even taking
into account factors such as drought and climate changes (Hardesty et
al., 1993).
As a result, carrying capacity is the most important variable in range
management (Walker, 1995). At a time, when the planet's limited
carrying capacity seems increasingly obvious, the rationale and
measures of rangelands carrying capacity are increasingly criticized.
One of the elements of rangeland capacity is stocking rate. According
to Roe (1997), if stocking rate is not close to the right level, then,
regardless of other grazing management practices, employed
objectives will not be met. Thus, a major problem facing range
management is the range disequilibrium. This applies to a regular
topic of books, articles and symposia, and a common justification for
further research in many countries, including Iran (Conference on
Sustainable Range Management, 2004; Iranian Nomadic
Organization, 1992).
It seems that under environmental conditions of great uncertainty, the
notion of rangeland equilibrium would still be ambiguous and

8
confused. Moreover, since environmental conditions are highly
uncertain for the dry rangelands of the world such as Iran, current
understanding of rangeland equilibrium turns out to be all the more
questionable. There is no workable, practical equation for rangeland
management in general, and carrying capacity in particular, nor could
there ever be. But fortunately, there is an alternative formulation for
rangeland equilibrium, which is considerably more realistic if not
more useful than even the conventional methods, named as fuzzy
logic.
Iran has approximately 90 million hectares of rangeland, 9.3 million
hectares of which are considered in ‘good’ conditions while the
remaining in ‘fair’ or ‘poor’ conditions. The country’s rangelands in a
normal year produce around 10 million tons of dry matter (dm), of
which 5.8 million tons may be available for grazing. The remaining
amount is the minimum required for reproduction and soil
conservation. The later amount of dm can support 38.5 million animal
units (au) for duration of 8 months. At the moment there are 115.5
million of au in Iran and only 16.5 of them are fed from other sources
including by agricultural products. The above figures prove that the
rangelands are being utilized at three times more than their peak
capacities in a non-drought year. This results in severe degradation of
the rangelands and accelerates soil erosion. As the rangeland is
considered by its users as "free resource" it is subject to heavy abuse,
which further exacerbates the drought (FAO, 2004a; Iranian Nomadic
Organization , 1992; Mesdaghi, 1995; UNCT, 2001).
The purpose of this dissertation is to design a model for solving the
mis-management of rangelands in Iran. Specifically, this study

9
discusses the application of fuzzy logic in rangeland management in
the Fars province of Southwest Iran.
1.5. Objectives
1.5.1. General goal
The above scenarios make it clear that the rangeland grazing
management is a complex and confusing phenomenon. Thus, the main
objective of this dissertation is “To Explain the equilibrium between
livestock and rangeland by using fuzzy logic”.
1.5.2. Specific goals
More specifically, we focus on the following goals:
1. Defining basic challenges and principles in rangeland
management;
2. Selecting the indicators of Sustainable Rangeland
Management (SRM) based on experts’ knowledge;
3. Explaining the applicability of fuzzy logic in SRM;
4. Estimating the Right Rate of Stocking (RRS) based on
homogenous experts’ knowledge;
5. Estimating primary the RRS based on heterogeneous experts’
knowledge;
6. Dealing with heterogeneous experts’ knowledge to find the
final the RRS; and
7. Evaluating the behaviour of fuzzy homogenous and
heterogeneous models.

10
1.6. The structure of dissertation
In this dissertation, fuzzy logic is proposed as a systematic
methodology for the assessment of sustainability in rangeland
management. Based on this methodology, we develop several fuzzy
systems, which use different experts’ knowledge to estimate carrying
capacity of the Fars rangelands in Southwest Iran.
A new model is developed, called Equilibrium Assessment by Fuzzy
Logic (EAFL), which provides a mechanism for assessing
sustainability in rangeland management in the studied areas.
Furthermore, to deal with the diversity of different experts’
knowledge, we construct a multi-fuzzy model. By introducing several
voting methods, we estimate the weights of each model. Finally, we
evaluate the behaviour of the models.
The dissertation is organized as follows: In Chapter 2, we review
population growth and its consequences. Chapter 3 gives a discussion
regarding sustainability and its major concerned issues. Chapter 4
explains basic challenges and principals in rangeland management,
which cause (dis)equilibrium. In Chapter 5, we introduce fuzzy logic
as a powerful tool to deal with these challenges. Designing theoretical
frameworks in this chapter, we conduct a field study that is reported in
Chapter 6. Findings and their fuzzy analyses are extensively explained
in Chapter 7. Finally, Chapter 8 presents a summary and conclusions.

11
Chapter Two
Population Growth: Consequences
Mahatma Gandhi: "The world has enough for everybody’s
need, but not for everybody’s greed" (Takle, 2001).
2.1. Population growth
2.1.1. A general view
Overpopulation is the greatest problem of our age. In the next hour,
9,000 babies will be born. By this time, tomorrow, the world will have
an additional 200,000 mouths to feed. Each baby will be a unique
individual with the potential to live a full life and be a contributing
world citizen. Unfortunately, most of these babies will be born into
poverty and hunger. Many will die in infancy (Brown et al., 2000).
The earth is increasing its population by 90 million people per year,
and yet we still have approximately 6 billion people left to feed and to
give shelter (Mitchell, 1998). Along with the increase in the
population, there are also more people on Earth who are living longer
lives. The global population boom has coincided with the
improvement of health, and of productivity, around the world. On
average, the human population today lives longer, eats better,
produces more, and consumes more than at any other time period in
the past. Agriculture feeds people, but will it be able to feed the
expanding global population, especially with its exponential increase
(Einstein, 1998).

12
Growth will not be uniform across the globe. In general, the
population booms now underway in South Asia and southern Africa
follow the reduction in infant mortality. According to the Population
Reference Bureau, 98 percent of today's population growth is taking
place in developing regions. Development and birth control, however,
tend to control population growth, and population is now stabilized in
the industrialized world. Asia will continue to be the largest, with 60
percent of the world's population. Asia alone will add almost 3 billion
people in the 21st century. Africa will experience spectacular
growth. Between now and 2100, its population will quadruple, and its
percentage of the world's population will double from 13 percent to 25
percent. Only 45 years ago Africa's population was 40 percent of
Europe's. Today they are equal. In 2100, Africa will be four times
larger. In fact, Africa is potentially a time bomb. Its huge population
growth will occur alongside the world's lowest standard of living,
greatest poverty, highest illiteracy, poorest infrastructure, least
industry, and shakiest history of stable governments. Latin America's
percentage will remain constant at 8 percent, while North America's
will drop from 5 percent today to 3 percent at the Year 2100. Europe's
population will actually shrink in the next 100 years: its percentage of
the world's population will fall from 13 percent now to 6 percent (van
der Werff, 1998).
One of the key variables determining future outcomes, the growth rate
of world population, has been on the decline since the second half of
the 1960s. The UN demographic assessment of 1996 has a variant
projection indicating further deceleration, from 1.4 percent currently
(1995-2000) to 1 percent in 2020 and to 0.4 percent by the middle of
the 21st annually. However, the absolute increments in world

13
population are currently very large, about 80 million persons, over 90
percent of who are added in the developing countries. Such high
annual increments may persist for another 15-20 years, but with
declines in prospect for the longer-term future, falling to some 40
million (30 million in the new projections) by 2050. Demographic
growth in sub-Saharan Africa will increasingly dominate the total
additions to world population: it will account for one half of the world
increment by 2050, compared with only one fifth currently
(Alexandratos, 1998).
The aboved-described projections may make individuals confused by
various figures. But what will really be happened in the future?
2.1.2. Three possible scenarios
Historically, as we come up to the new situations, especially by
economic, scientists in different disciplines would align in different
parties of prediction the world population. According to their
estimations, there are three possible scenarios, which are presented by
those who underestimate (low scenario), some who normal estimate
(medium scenario) and the rest who overestimate (high scenario).
They are shown in Fig. 2.1.
Fig. 2.1. World population: Three possible futures.

14
2.1.2.1. Low scenario
Many researchers expect the world's population to level off between
ten and eleven billion people. They predicted that "world food
production could grow significantly more slowly than the current rate,
and there would still be enough food for 10 billion mouths by the time
they come." They believe that the earth can provide all the food
needed for the foreseeable future (Milne, 2002). So why are so many
saying we must take powerful measures, like widespread abortion, to
control world population?
But the "present rate" was already declining, and the world now
doubles about every 82 years. And more conservative scholars had
pointed this out years ago. As the standard of living of a country
increases, its doubling time also increases. Thus, the developed
nations are close to stability now, and as less developed nations
become more industrialized their population growth also slows. That
is the basis on which many experts predict that the world population
will stabilize at about ten to eleven billion people (Milne, 2002).
The study reports that the most recent UN assessment of global
population trends indicates a drastic slowdown in world population
growth. The UN, for example, reset the 2010 population level of 7.2
billion people projected in 1995, in 1998 at 6.8 million, or about 400
million fewer people. This recalibration in population level is due in
part to changes in the world population growth rate, which has fallen
from 2.1 percent per year in the later half of the 1960's to 1.3 percent
in the late 1990's. This growth rate is predicted to continue dropping
over the next three decades, reaching 0.7 percent by 2030. According
to the latest UN projections, the most likely scenario for population in
2050 will be around 8.9 billion, and will peak out slightly above 10

15
billion after 2200. By 2050 the global population growth rate is
expected to have dropped as low as 0.3 percent. But population
estimates are notoriously inexact, especially those that peer deep into
the future. Even though the rate of growth is slowing, the two billion
people below age 20 will be raising a lot of children over the next
couple of decades. Contrary to popular belief, this group believes the
world's population is not increasing exponentially. Indeed, the growth
rate has fallen steadily since the late 1960’s and is now about 1.5
percent annually. The annual population increase peaked in the late
1980’s and has declined to 85 million/year. The increase will drop to
58 million/year in the second quarter of the 21st century and to 19
million/year by its end. It will be growing at an average of 1.1 percent
a year up to 2030, compared to 1.7 percent annually over the past 30
years. At the same time, an ever-increasing share of the world's
population is well-fed. As a result, the growth in world demand for
agricultural products is expected to slow further, from an average 2.2
percent annually over the past 30 years to 1.5 percent per year until
2030. In developing countries, the slowdown will be more dramatic,
from 3.7 percent for the past 30 years to an average of 2 percent until
2030. However, the developing countries with low to medium levels
of consumption, accounting for about half of the population in
developing countries, would see demand growth slowing only from
2.9 to 2.5 percent per year, and per caput consumption increasing
(FAO, 2002).
The number of hungry people in developing countries is expected to
decline from 777 million today to about 440 million in 2030. This
means, that the target of the World Food Summit in 1996, to reduce
the number of hungry will be met by 2030 (EuropaWorld, 2003).

16
2.1.2.2. Medium scenario
Interestingly, the number of births is expected to remain relatively
constant at 135 million/year for the next four decades or more,
whereas the number of deaths will rise steadily from the present 50
million/year (van der Werff, 1998).
According to Dr. Norman Borlaugh, a Noble Peace, called the father
of the "green revolution," the world will have to increase food
production 50 percent in 30 years, just to feed the world at today's
substandard level and double it to provide everyone with the quality
and abundance of food enjoyed in America. The world scientist noted
that world population stood at 1.6 billion people when he was born in
1914. In 1995 it stood at 5.7 billion. Borlaugh says, "We are adding
100 million (100,000,000) people each year, a billion per decade."
But, he says, "That (doubling) will never happen. That will be
impossible" (Serf Publishing Inc., 2001) (Table 2.1).
Table 2.1. The projection of world population (Medium scenario) 1950-2050.
Estimated population (millions)
Percentage distribution
Major Areas
1950 2000 2050 1950 2000 2050
Oceania 13 31 47 0.5 0.5 0.5 Northern America 172 314 438 6.8 5.2 4.7 Latin America and the Caribbean 167 519 806 6.6 8.6 8.6 Europe 548 727 603 21.8 12.0 6.5 Africa 221 794 2000 8.8 13.1 21.5 Asia 1399 3672 5428 55.5 60.6 58.2 World 2519 6057 9322 100 100 100
NOTE: Information for 2050 is from medium-fertility variant projections (UNPD, 2003).
Future demand for livestock and dairy products can be met, but the
consequences of increased production must be addressed. Production
will shift away from extensive grazing systems towards more
intensive and industrial methods. This could pose a threat to the

17
estimated 675 million rural poor whose livelihoods depend on
livestock. Without special measures, the poor will find it harder to
compete and may become marginalized, descending into still deeper
poverty. If the policy environment is right, the future growth in
demand for livestock products could provide an opportunity for poor
families to generate additional income and employment."
Environmental and health problems of industrial meat production
(waste disposals, pollution, the spread of animal diseases, overuse of
antibiotics) also need to be addressed (FAO, 2002).
Climate change could increase the dependency of some developing
countries on food imports. The overall effect of climate change on
global food production by 2030 is likely to be small. Production will
probably be boosted in developed countries. Hardest hit will be small-
scale farmers in areas affected by drought, flooding, salt-water
intrusion or sea surges. Some countries, mainly in Africa, are likely to
become more vulnerable to food insecurity. With many marine stocks
now fully exploited or overexploited, future fish supplies are likely to
be constrained by resource limits. The share of capture fisheries in
world production will continue to decline, and the contribution of
aquaculture to world fish production will continue to grow. The
capacity of the global fishing fleet should be brought to a level at
which fish stocks can be harvested sustainably. Past policies have
promoted the build-up of excess capacity and incited fishermen to
increase the catch beyond sustainable levels. Policy makers must act
to reverse this situation (FAO, 2002).

18
2.1.2.3. High scenario
If world population continues to grow at the current rate, world
population will be doubled from six billion to twelve billion in fifty
years (Harris, 2001). Half of this growth will occur in just six
countries; which are India, China, Pakistan, Nigeria, Bangladesh, and
Indonesia. Each of these nations faces a steady shrinkage of grainland
per person and thus risks heavy future dependence on grain imports.
This raises two important questions (Larsen, 2002): Will these
countries be able to afford to import large quantities of grain as land
hunger increases? And will grain markets be able to meet their
additional demands?
In India, where one out of every four people is undernourished, 16
million people are added to the population each year. The grain area
per person in India has shrunk steadily for several decades and is now
below 0.10 hectares—less than half that in 1950 (EDC News, 2003).
As land holdings are divided for inheritance with each succeeding
generation, the 48 million farms that averaged 2.7 hectares each in
1960 were split into 105 million farms half that size in 1990, when
India's grainland expansion peaked. The average Indian family, which
now has three children, will be hard pressed to pass on viable parcels
of land to future generations (Larsen, 2002).
Pakistan, with five children per family, is growing even more rapidly.
In 1988, Pakistan's National Commission on Agriculture was already
linking farm fragmentation and a rising reliance on marginal lands to
declining farm productivity in some areas. Since then, the country has
grown from just over 100 million to almost 150 million. Its per person
grain area is now less than 0.09 hectares (Larsen, 2002; Larsen, 2003).

19
In China, the grain area per person has also shrunk dramatically to a
diminutive 0.07 hectares, down from 0.17 hectares in 1950. Shifting
agricultural production to higher-value crops, like fruits and
vegetables, and converting farms to forest for conservation accounts
for some of the grainland contraction, along with losses to nonfarm
uses such as buildings and roads (Coulter, 2002).
Though the shrinkage of farmland available per person in China has
slowed in concert with declining family size, this country—whose
population of 1.3 billion is as large as the entire world's in 1850—is
still expected to add 187 million people to its ranks in the next 50
years. The robustness of China's economy enables it to turn to world
markets to import grain, but this does not guarantee that those markets
can support massive additional demand without hefty price increases
(Larsen, 2003).
The scarcity of arable cropland in sub-Saharan Africa helps to explain
the region's declining production per person in recent decades.
Nigeria, for example, Africa's most populous country, has seen its
population quadruple since 1950 while its grainland area doubled—
effectively halving the grainland per person. In northern Nigeria,
pastoralists and farmers fleeing the encroaching Sahara, which
annually claims 350,000 hectares of land (about half the size of the
U.S. state of Delaware), have increased demands on the already scarce
land elsewhere in the country, sparking ethnic tensions (Coulter, 2003;
Larsen, 2002; Larsen, 2003).
Most of the 3 billion people to be added to world population in the
next 50 years will be born in areas where land resources are scarce. If
world grainland area stays the same as in 2000, the 9 billion people
projected to inhabit the planet in 2050 would each be fed from less

20
than 0.07 hectares of grainland—an area smaller than what is
available per person today in land-hungry countries like Bangladesh,
Pakistan, and Afghanistan (EDC News, 2003).
By 2050, India and Nigeria would cultivate 0.06 hectares of grainland
for each person, less than one tenth the size of a soccer field. China,
Pakistan, Bangladesh, and Ethiopia would drop even lower, to 0.04-
0.05 hectares of grainland per person. Faring worse would be Egypt
and Afghanistan with 0.02 hectares, as well as Yemen, the Democratic
Republic of the Congo, and Uganda, with just 0.01 hectares. These
numbers are in stark contrast to those of the less densely populated
grain exporters, which may have upwards of 10 times as much
grainland per person. For Americans, who live in a country with 0.21
hectares of highly productive grain land per person, surviving from
such a small food production base is difficult to comprehend (UNDP,
2003).
With most of the planet's arable land already under the plow and with
additional cropland being paved over and built on each year, there is
little chance that the world grain area will rebound. At the same time,
the annual rise in cropland productivity of 2 percent from 1950 to
1990 has decreased to scarcely 1 percent since 1990, and may drop
further in the years ahead. This slowing of productivity gains at a time
when the land available per person is still shrinking underlines the
urgency of slowing world population growth (Coulter, 2003).
2.2. Consequences
Population growth will create some major threats to challenge. The
threats come from poverty, agriculture perhaps not sustaining its

21
productivity growth of recent decades, environmental degradation,
and scarcity of water for both agriculture and human health.
2.2.1. A historical challenge
Since Robert Thomas Malthus published his anonymous ‘Essay on the
Principle of Population’ in 1798, people have been disputing his
contention: “population grows exponentially, but food supplies grow
arithmetically”. This means that the graph of population curves
upward, while the graph of food supply is straight. Malthus said,
shortages of food would cause chaos and famine (Office of News and
Public Affairs, 1999). Malthus assumed that food supplies would
always limit population growth. But in the two hundred years since he
wrote, this has not been the case. The pronouncement was fearsome
enough to earn economics this splendid moniker: the "dismal science."
But it wasn't just economists who rebelled. Karl Marx also denounced
Malthus. By one means or another farmers and agricultural scientists
have always found a way to increase farm production to keep up with
population growth. But we have yet to find efficient ways to get food
from where it is produced to where it is needed most (Milne, 2002).
Afterwards, Paul Erhlich, in his 1968 book; The Population
Explosion, announced the approaching food crisis; “...Then, in 1965-
66 came the first dramatic blow...mankind suffered a shocking defeat
in...the war on hunger” (Dean, No date p.1). In 1966, while the
population of the world increased by some 70 million people, there
was no compensatory increase in food production. He continues by
laying out likely scenarios of the world being rocked by food
rebellions that will lead to nuclear war and the devastation of the
planet (Milne, 2002).

22
In 1989, Erhlich wrote another book, The Population Explosion.
Doom was again close: "In 1988, for the first time since World War II,
the United States consumed more grain than it grew...only the
presence of large carryover stocks prevented a serious food crisis. It is
not clear how easy it will be to restore those stocks."
Fortunately, Erhlich was wrong. In 1968, he quotes Louis H. Bean
approvingly: "My examination of the trend of India's grain production
over the last eighteen years leads me to the conclusion that the present
(1967-68) production...is at a maximum level." But in seven years,
India increased its grain production by nearly 26 percent! By 1992, it
had increased it 112 percent! By 1990, world grain production, again
came up by 50 percent from 1988! And it has continued to increase to
the present (Williams, 2000).
In the book of Genesis, Adam and Eve were given the command to
multiply and fill the earth. In Genesis, Noah is given the same charge.
We must consider the rest of the creation as we determine if we have
yet fulfilled that command. But world population is not the problem
(Milne, 2002).
We share the planet with 5.7 billion people. If one could stand all the
people in the world, men, women and children two feet apart, how
much of the world would they take up?
Famines are the exception in most countries, and even then absolute
lack of food is usually not the problem. In a Scientific American
article on world population one author says: "Food surpluses exist in
many nations, and even when famines do occur the cause is much less
the absence of food than its mal-distribution which is often
accentuated by politics and civil war, as in the Sudan." This passing
comment touches on the real problem. Most famines in the last twenty

23
years are a direct result of internal wars in African nations (Milne,
1995).
Whether in Ethiopia, Sudan, or Somalia, the devastating famines and
the hopeless faces of dying children we have all seen on TV are the
result of politics. As one segment of the population wars against
another, starvation is often a political weapon. And in each of the
famine-torn countries of Africa one can show that it has been
disrupted distribution more than low food production that has caused
people to starve to death (Milne, 2002).
2.2.2. Food security1
One of the most important questions facing most of societies today is,
how to produce enough food to feed the increasing human population
on this planet (Kanwar, 2003), which is discussed as the main goal of
development (Seers, 1982). Few who are alive today remember the
"great depression" and "dust bowl" of the 1930's or the food ration of
World War II in the 40's. American's, Briton's and other citizens of the
highly developed countries have enjoyed an almost unprecedented
abundance of the earth's blessings for over half a century. How long
can it continue?
World population has recently passed the sixth billion, however, the
number of hungry people is still growing who are stimated
approximately two billion people (Raven, 2004). FAO discussed
concerning the future, a number of projection studies have addressed
and largely answered in the positive the issue whether the resource
base of world agriculture, including its land component, can continue 1. The UN Food and Agriculture Organization defines food security as a "state of affairs where all
people at all times have access to safe and nutritious food to maintain a healthy and active life" (Blundon, 2001).

24
to evolve in a flexible and adaptable manner as it did in the past, and
also whether it can continue to exert downward pressure on the real
price of food (see for example Pinstrup-Andersen, and Pandya-Lorch,
1999). The largely positive answers mean essentially that for the
world as a whole there is enough, or more than enough, food
production to meet the growth of effective demand, but potentially
(FAO, 2004b).
Since the mid-1980s, the upward trend in annual per capita food
production appears to be levelling off. Per capita world food
availability grew by 6 percent in the 1960s and 1970s, then by 4.6
percent in the 1980s. Per capita crop production has been in decline
since 1985. Per capita grain production expanded by 40 percent
between 1950 and 1984 but has declined after this period. Some
economists argue that this decline is due more to economic policies
and low grain prices than to natural resource limits. The issue is
important, since grain provides more than half of all calories
consumed by people, directly or in (PAI, 2005).
These prospects, particularly the demographic ones, are somewhat
different from those used some five years ago to produce FAO’s
assessment of world food and agriculture prospects to 2010, with
particular reference to the developing countries, in the study "World
Agriculture: Towards 2010"(Alexandratos, 1998) and subsequent
modifications used in the technical documentation of the World Food
Summit of 1996. However, the essence of our findings as concerns
key variables of food security at the level of large country groups and
the world, as a whole, remains largely valid. The main findings,
including selected preliminary findings from ongoing work to update

25
the study and extend the time horizon to 2015 and 2030, are
summarized below:
The incidence of undernutrition in the developing countries may
decline in relative terms (from 21 percent to 12 percent of the
population) but, given population growth, there will be only modest
declines in the numbers undernourished. The current level of over 800
million persons is expected to decline to about 680 million by 2010.
The end result of the detailed projections (for individual countries and
crops) indicates that the growth of the average yields of the
developing countries (other than China) will be slower than in the
past, 1.5 percent (from 1.9 tons/ha in 88/90 to 2.6 tons/ha in 2010),
compared with 2.2 percent in the preceding 20 years (average yield of
wheat, rice paddy and coarse grains). Nine years into the projection
period (1989-98), the average cereal yield grew as predicted at 1.5
percent, though rice yield grew by less than predicted, that of maize
by more and that of wheat as predicted. Continued growth of average
yields, even at the lower rates projected here compared with the past,
will not come about without effort. Growth in average yields will
depend crucially on policies that attach high priority to efforts at
agricultural research and technology development and diffusion, as
well as on a more active role of the state in the areas of infrastructure,
education and the creation of conditions for markets to work
(Alexandratos, 1998).
The prospect that the production growth rate in the exporting countries
needs to be lower than in the past does not in itself guarantee that it is
a feasible proposition. In particular, environmental concerns related to
intensive agriculture in the high-income countries (nitrate pollution,
soil erosion, perceived risks from genetically modified organisms,

26
etc.) may contribute to slow down the rate at which progress may be
made in achieving the required yield increases. In fact, the rate of
growth in agricultural production is declining; world grain reserves
have fallen to record lows; the demand for imported grain is
increasing; and commitments of aid to agricultural development have
decreased. This against a backdrop of expanding world population,
intensifying demands on agricultural resources, and a growing
recognition that the agri-food system is not sustainable (The Online
Newsletter of the Bahá'í International Community, 1996).
2.2.3. Food consumption
By 2050, some 4.2 billion people may not have their daily basic needs
met (Council for Biotechnology Information, 2004). All the primary
sources of food crops, livestock and seafood depend on resources that
are renewable but finite. In each case, limits now coming into view
undermine the prospects for meeting future food demand (PAI, 2005).
Concurrent with a decreasing population growth rate, individual food
consumption rates (measured as Kcal/person/day) will continue to
raise in developing countries. Citing the latest FAO assessment of
under nourishment, the study reports that the percent of the world's
undernourished has been dropping since the late 1960s. Projections of
food consumption will continue to rise in developing countries over
the next 30 years, moving from an average of 2626 kcal in the 1990s
to nearly 3000 kcal in 2015. The average daily consumption rate in
developing countries is expected to exceed 3000 kcal by 2030. By
2015, the report estimates, 6 percent of the world population (412
million people) will still live in countries with very low food
consumption levels (under 2200 kcal) (FAO, 2000a).

27
The per-person food availability of the developing countries as a
whole will continue to increase from 2580 Kcal/day (in 1994/96) to
about 2750 Kcal/day by 2010. However, there will be only very
modest gains in the currently very low average food availability of
sub-Saharan Africa, while South Asia may still be in a middling
position by 2010. The other developing regions, already starting from
better levels now, are expected to be close, or above, 3000 Kcal/day
(Alexandratos, 1999).
One does not need sophisticated analytics to prove this point: any
country starting with per-person food supplies of 2000 Kcal/day (and
some countries start with less) and a population growth rate of 2.5
percent-3.0 percent would need a growth rate of aggregate food
demand of about 5 percent in 15 years if, by 2010, it were to have
2700 Kcal/day, a level usually associated with significantly reduced
undernutrition (provided inequality of distribution is not too high)
(Alexandratos, 1998). Obviously, this kind of growth rates of
aggregate demand for food can only occur in countries with "Asian-
tiger" rates of economic growth sustained over decades. Few of
today’s poorest countries with very low food consumption levels face
such prospects. As noted, the recent crisis that hit several economies
of East and South-East Asia will also take its toll. The rapid pace of
progress of the recent past, particularly in diet diversification towards
livestock products, is being interrupted and some countries (e.g.
Indonesia) are suffering outright reversals (FAO, 1999).
At the end of the 1980s, about 251 million people lived in 14 countries
where average per capita food supply was less than 2,100 calories per
day. Another 1.4 billion people lived in 31 countries in which daily
per capita availability was between 2,100 and 2,400 calories. In most

28
of these food-scarce countries, per capita production is declining. The
averages also hide wide disparities within countries. However, the
World Bank and the FAO are optimistic that global food supplies will
be adequate and prices low at least through 2010, but analysts with
both organizations assume that growth in yields and production will
continue along current trend lines. A recent independent analysis that
also considered potential environmental and socio-economic
constraints predicted that without increased investment in agricultural
research and technology, the next two decades will see food
production shortages and accelerated environmental degradation (PAI,
2005).
We simply cannot say for certain whether current or future
populations can be fed sustainably. No single ingredient can provide
such a guarantee. We know, however, one thing is the most important:
how we can increase the yield of agricultural production by research?
2.2.4. Agricultural research
One way for the over-population of today and tomorrow to live in
harmony in regards to nourishment provided by the environment is to
be able to intensify agricultural yields. With a projected population of
10 billion people, an increase of global average grain yields from 2 to
5 tons of grain per hectare would ensure a per capita diet of 6,000
calories and would save a land area twice the size of Alaska
(Waggoner, 1994). Most of the world’s increased output is no longer a
result of expansion of area used in agriculture, but resulting from the
intensification of production on existing agricultural areas (Einstein,
1998). The "Green Revolution" of Norman Borlaugh's day only served
to delay the growing crisis (Serf Publishing Inc., 2001).

29
In fact, some believe that agricultural researches can counteract the
population time bomb. Perhaps an extension agent will bring a more
productive variety of rice or demonstrate a more efficient method of
irrigation. Mark Rosegrant, Senior Research Fellow at the
Washington-based International Food Policy Research Institute and
co-author of a study of agricultural production in India believes that
investment in agricultural research and extension is and will continue
to be the driving force in India's increased ability to feed their growing
population. He also discussed, increased family incomes by growth in
agricultural production, together with improved education, results in a
reduction in population growth. This double benefit of agricultural
research will alleviate misery today and gradually ease the world’s
population woes (Rao, 1999).
FAO (2000a) reports that there is a need for continued support of
agricultural research and policies in developing countries. The report
states that by 2030 three-quarters of the projected world crop
production will occur in developing countries compared to just over
half of world production in the early 1960s. Most of these future
increases in crop productivity will come from a further intensification
of crop production. The bulk of the increases in production will come
from increasing plant yield and through more intensive land use (e.g.,
multicropping or high cropping intensities).
These projections and complex challenges facing the world’s future
food supply are prompting international food and agricultural experts
and policymakers - including the U.N. Food and Agriculture
Organization and the World Health Organization - to call plant
biotechnology a critical tool to help feed a growing population in the
21st century (Council for Biotechnology Information, 2002).

30
The Green Revolution’s success in fending off starvation even as Asia
and Latin America’s population doubled, from less than 2 billion to
nearly 4 billion people, was a remarkable feat. Millions of human
beings would not be able to survive today without the key innovations
that launched the revolution. Foremost among these were advanced
techniques of cross breeding that allowed development of rice, wheat
and corn strains with increasingly higher yields per hectare. With
sufficient access to irrigation water, fertilizers and pest controls,
farmers could gain higher yields and, often, multiple crops in the same
year, all with less labour. But there have been tradeoffs. Some Green
Revolution technologies accelerate soil erosion, often beyond the
thresholds of how much soil loss the land can tolerate without losing
productivity. Fertilizers and pesticides have polluted groundwater
supplies, while crop pests have developed resistance to common
pesticides. Irrigated land is being abandoned as soils become
waterlogged or contaminated by salt. Small-scale farmers, many of
them women, have been pushed from ownership to tenancy, or off the
land altogether, because the expenses and economies of scale required
by the Green Revolution favour large farms and affluent farmers (PAI,
2005).
2.2.5. Biotechnology
According to the Consultative Group on International Agricultural
Research (CGIAR), world crop productivity could increase by as
much as 25 percent through the use of biotechnology to grow plants
that resist pests and diseases, tolerate harsh growing conditions and
delay ripening to reduce spoilage. Biotechnology also offers the
possibility for scientists to design “farming systems that are

31
responsive to local needs and reflect sustainability requirements,” said
Calestous Juma, director of the Science, Technology and Innovation
Program at the Center for International Development and senior
research associate at the Belfer Center for Science and International
Affairs, both at Harvard University (Council for Biotechnology
Information, 2004).
Scientists are developing crops that can resist against diseases, pests,
viruses, bacteria and fungi, all of which reduce global production by
more than 35 percent at a cost estimated at more than $200 billion a
year (Council for Biotechnology Information, 2004).
Nowadays, scientists are busy with developing such crops, which can
tolerate extreme conditions, i.e. drought, flood and harsh soil. For
instance, researchers are working on a rice that can survive long
periods under water (Shah and Strong, 1999) as well as rice and corn
that can tolerate aluminium in soil (Council for Biotechnology
Information, 2004). A tomato plant has been developed to grow in
salty water that is 50 times higher in salt content than conventional
plants can tolerate and nearly half as salty as seawater (Owens, 2001).
About a third of the world’s irrigated land has become useless to
farmers because of high levels of accumulated salt (Council for
Biotechnology Information, 2004). Biotech crops could significantly
reduce malnutrition, which still affects more than 800 million people
worldwide, and would be especially valuable for poor farmers
working marginal lands in sub-Saharan Africa (UNDP, 2001).
While the Green Revolution kept mass starvation at bay and saw
global cereal production double as a result of improved crop varieties,
fertilizers, pesticides and irrigation, its benefits bypassed such regions
as sub-Saharan Africa. The new hybrids needed irrigation and

32
chemical inputs that farmers there couldn’t afford (Council for
Biotechnology Information, 2002). In contrast, the benefits of
biotechnology are passed on through a seed or plant cutting, so that
farmers anywhere around the world can easily adopt the technology.
That’s why biotechnology is particularly attractive to scientists and
rural development experts in poor countries where most of the people
farm for a living (Owens, 2001).
Biotech crops are “tailor-made for Africa’s farmers, because the new
technology is packaged in the seed, which all farmers know how to
handle," said Florence Wambugu, a Kenyan plant scientist who helped
develop a virus-resistant sweet potato (Council for Biotechnology
Information, 2004). Agreeing with Wambugu, the International
Society of African Scientists issued a statement in October 2001
calling plant biotechnology a major opportunity to enhance the
production of food crops (ISAS, 2001).
Despite, technology has been a viable part of higher productivity in
agriculture and innovations such as tractors, seeds, chemicals,
irrigation measures, fertilizers, pesticides, and genetic engineering
have played a major part in raising yields, however, is technology the
key to ensuring sustainable agriculture for a growing population?
(Einstein, 1998).
Many countries have tripled or even quadrupled the amount of grain
they produce. Unfortunately, yields have been decreasing while
population continues to increase. Grain yields per hectare have been
slowing since 1990, rising only 3 percent from 1990-1996 or 0.5
percent per year. This does not keep pace with population growth
which is at 1.6 percent per year (Brown, 1997).

33
Along with population growth, there is a growing demand for a more
calorie-filled diet, especially with the unprecedented rise in affluence
in Asia. Meat is becoming the food of choice rather than low calorie
wheat or vegetables. Since it takes more grain and water to produce
animal protein than vegetable protein, added pressure is placed on the
environment. From 1990 to 1995, China’s grain consumption
increased by 40 million tons; 33 million tons were consumed as
animal feeds (Brown, 1997). As economies grow, especially in
developing countries, consumption rates of resources rise in parallel.
For these countries, a choice needs to be made between slowing
population growth or sacrificing any hope of dietary improvement in
order to lessen the pressure that agriculture creates on environments
(UNFPA, 2003).
2.2.6. Arable land
Another important question is: how much crop land would be needed
to feed the growing population and what is the potential to further
expand land area for food grain production?
Increases in food production will have to come from existing
agricultural land (UN, 2000). Arable land could in theory be increased
by 40 percent, or 2 billion hectares, but most of the uncultivated land
is marginal, with poor soils and either not enough rainfall or too much.
Bringing it into production would require costly irrigation and water-
management systems and large-scale measures to enrich the soil.
Much of this land is now under forest, and clearing it would have
unforeseeable consequences for erosion, degradation and local climate
change, among others (UNFPA, 2003).

34
As population grows, subsistence farmers without access to new land
are forced to intensify production to feed their families. This can be
positive, if farmers can make the yield improvements last. Often,
however, the reality is quite different. As the National Research
Council notes, "fallow periods are often shortened to the point where
the land becomes so badly degraded that it is virtually useless for any
agricultural activity" (National Research Council, 1993).
The practice of leaving some land fallow was once universal in
agriculture, but in those areas where fallowing remains it is
disappearing. When farmers lack access to information and
technology—especially fertilizers—the abandonment of fallowing is
unsustainable and a contributor to declining yields (PAI, 2005).
Over the past three centuries, world population has increased eightfold
while the amount of arable land has increased only fivefold. More
intensive use of arable land has allowed food production to keep pace
with population growth despite the slower expansion of arable land.
There is limited potential, however, to expand arable land much
further. Continued population growth could result in unsustainable
demands on the earth's agricultural land and water resources in the
coming decades (Fig. 2.2).

35
Fig. 2.2. World Population and Arable Land, 1700 – 1990 (Richards, 1990).
Of the total of 13 billion hectares of land area on Earth, cropland
accounts for 11 percent, rangeland 27 per cent, forested land 32
percent, and urban lands 9 per cent. Most of the remaining 21 percent
is unsuitable for crops, pasture, and/or forests because the soil is too
infertile or shallow to support plant growth, or the climate and region
are too cold, dry, steep, stony, or wet (Richards, 1990).
In 1960, when the world population numbered only 3 billion,
approximately 0.5 hectare of cropland per capita was available, the
minimum area considered essential for the production of a diverse,
healthy, nutritious diet of plant and animal products like that enjoyed
widely in the United States and Europe. But as the human population
continues to increase and expand its economic activity and related
artifacts, including transport systems and urban structures, vital
cropland is being covered and lost from production (Pimentel and
Wilson, 2005).

36
The decline of per-capita cropland is aggravated by the degradation of
soils. Throughout the world, current erosion rates are higher than ever.
According to a study for the International Food Policy Research
Institute, each year an estimated 10 million hectares of cropland
worldwide are abandoned due to soil erosion and diminished
production caused by erosion. Another 10 million hectares are
critically damaged each year by salinization, in large part as a result of
irrigation and/or improper drainage methods. This loss amounts to
more than 1.3 percent of total cropland annually. Most of the
additional cropland needed to replace yearly losses comes from the
world's forest areas. The urgent need to increase crop production
accounts for more than 60 percent of the massive deforestation now
occurring worldwide (Pimentel et al., 1996).
Land expansion will continue to be a significant factor in the growth
of agriculture in those developing regions where the potential for
expansion exists (many countries in sub-Saharan Africa and South
America) and the prevailing farming systems and more general
demographic and socio-economic conditions favour land expansion
(FAO, 1999). It is estimated that the developing countries outside
China have some 2.5 billion ha of land of varying qualities, which has
potential for growing rainfed crops at yields above an "acceptable"
minimum level. Of this land, some 720 million ha (plus another 36
million ha of desert land reclaimed through irrigation) are already in
cultivation in the developing countries outside China (arable land and
land in permanent crops). Most of the remaining 1.8 billion ha is in
Latin America and sub-Saharan Africa (FAO, 2003). At the other
extreme, there is virtually no spare land available for agricultural
expansion in South Asia and the Near East/North Africa region. Even

37
within the relatively land-abundant regions, there is great diversity
among countries and sub-regions as concerns land availability per
person, both quantity and quality. For example, in sub-Saharan Africa
land is scarce in East Africa and relatively abundant in the Central
Africa. Land expansion may add some 90 million ha to the above
estimates of cultivated land of the developing countries (other than
China). Such expansion will account for about 20 percent of the
increase in their aggregate crop production (Alexandratos, 1998).
The intensification of agriculture, especially under irrigated
conditions, has brought new environmental problems including soil
erosion, land degradation and decreased water quality. Intensive
agricultural production systems were introduced in 1960’s with the
advances in improved crop varieties, mechanization, and increased
availability of pesticide and fertilizers. More recent experiences, in the
developed countries, especially Europe and USA, have shown that
modern and intensive agricultural production systems have increased
land degradation and water contamination (Kanwar, 2003).
2.2.7. Water scarcity
Another parallel question facing the society is, how much water would
be needed to produce enough food to feed the increasing population in
the world? Answer to this question is also not easy. Increased
population rates have added more than 4.4 billion people on earth
between 1900 and 2000, and average food production has kept pace
with the increases in population. Also, between 1900 and 2000,
irrigated area has increased from about 50 million hectares to 250
million hectares. Agricultural water use continues to make 85 percent
of all consumptive use on a global basis (Kanwar, 2003).

38
As a country struggles to feed its people, on one hand, vital resources
such as water for irrigation are dwindling (UNFPA, 2003). Scientists
are finding ways to replenish groundwater aquifers and use irrigation
in less wasteful ways that will not reduce food production (Rao,
1999). On the other hand, conflicts within countries are also of
mounting concern to national governments (UNFPA, 2003).
Among all contaminations, water pollution is a major threat to
maintaining ample fresh water resources. Although considerable water
pollution has been documented in developed nations like the United
States, the problem is of greatest concern in countries where water
regulations are not rigorously enforced or do not exist. This is
common in most developing countries, which (according to the World
Health Organization) discharge 95 percent of untreated urban sewage
directly into surface waters. For instance, of India's 3,119 towns and
cities, only 209 have even partial sewage treatment facilities, and a
mere eight possess full facilities. Downstream, the polluted water is
used for drinking, bathing, and washing (Pimentel and Wilson, 2005).
Also, of all the environmental trends, water shortages may be the
biggest. The report predicts, "By 2050, fully two-thirds of the
population could be living in regions with chronic, widespread
shortages of water." Agriculture must have adequate supplies of water
if we are to meet future food needs, and those needs are huge
(Truelsen, 2003). "Water scarcity is now the single greatest threat to
human health, the environment, and the global food supply," said
David Seckler, director general of the Water Institute and an author of
the study with Randolph Barker and Upali Amarasinghe. "It also
threatens global peace as countries in Asia and the Middle East seek to
cope with shortages."…"Water scarcity is already a major

39
destabilizing force within countries because different sectors of the
economy are vying for scarce water resources," said Seckler (Wilson,
1999). Within the next 25 years, there is great potential for more water
conflict not just within countries but also between them. Historically,
Egypt has threatened to go to war to protect its water supplies if
necessary. And just last week, President Gaddafi of Libya warned
that, “the next Middle East war would be over dwindling water
supplies” (Mesbahi, 2004).
The study divides the countries into four categories (Table 2.2). The
first category includes those countries that are most water scarce and
in 2025 will not have enough water to maintain 1990 levels of per
capita food production from irrigated agriculture and meet industry,
household, and environmental needs. The countries, defined as facing
"absolute water scarcity," include 17 countries in the Middle East,
South Africa, and the dryer regions of western and southern India and
northern China, which account for more than 1 billion people today
and are projected to account for as many as 1.8 billion in 2025. The
study notes that while India and China will not have major water
problems on average, there will be massive regional variations in
water availability.
The second category includes countries that have sufficient potential
water resources to meet projected 2025 requirements, but will have to
more than double their efforts to extract water to do so. Twenty-four
countries, mainly in Sub-Saharan Africa, are defined as extremely
water scarce and include some 348 million people today and are
projected to include some 894 million in 2025. Because it will be
extremely difficult for these countries to find the financial resources to
build enough water development projects, such as dams and irrigation
40
systems, they are classified as having "economic water scarcity"
(Wilson, 1999).
The remaining countries of the world are in categories three and four
and include North America and Europe. For these countries, there will
be substantially less pressure on water supplies with moderate needs
to increase water development efforts.
The single greatest impact of water scarcity will be on the food
supplies of the poor. To meet the world food supplies in 2025, the
study provides two scenarios a "business as usual scenario" where no
increases in irrigation efficiency are foreseen, and a scenario where
irrigation efficiency is dramatically increased. Under the business-as-
usual scenario, 60 percent more water will be required for irrigation to
meet the world food supplies in 2025. Even if irrigation efficiency is
greatly increased, between 13 and 17 percent more water will be
needed and still 2.7 billion people will remain short of water. The
study uses the United Nations "medium" projection for population
growth (Wilson, 1999).
Many countries, including China, India, Iran, Pakistan, Mexico and
nearly all of the countries of the Middle East and North Africa, have
literally been having a free ride over the past two or three decades by
rapidly depleting their groundwater resources, said Seckler. This could
have catastrophic results in terms of limiting their ability to produce
enough food to feed their populations (Table 2.2).

41
Table 2.2.Water scarcity by country groups (Wilson, 1999). Category 1 Afghanistan Egypt Iran Iraq Israel Jordan Kuwait Libya Oman Pakistan Saudi Arabia Singapore South Africa Syria Tunisia United Arab Emirates Yemen (China)* (India)*
Category 2 Angola Benin Botswana Burkina Faso Burundi Cameroon Chad Congo Cote d'Ivoire Ethiopia Gabon Ghana Guinea-Bissau Haiti Lesotho Liberia Mozambique Niger Nigeria Paraguay Somalia Sudan Uganda Zaire
Category 3 Albania Algeria Australia Belize Bolivia Brazil Cambodia Central African Republic Chile Colombia El Salvador Gambia Guatemala Guinea Honduras Indonesia Kenya Lebanon Madagascar Malaysia Mali Mauritania Morocco Myanmar Namibia Nepal New Zealand Nicaragua Peru Senegal Tanzania Turkey Venezuela Zambia Zimbabwe
Category 4 Argentina Austria Bangladesh Belgium Bulgaria Canada (China)* Costa Rica Cuba Denmark Dominican Republic Ecuador Finland France Germany Greece Guyana Hungary (India)* Italy Jamaica Japan Mexico Netherlands North Korea Norway Panama Philippines Poland Portugal Romania South Korea Spain Sri Lanka Surinam Sweden Switzerland Thailand UK Uruguay USA Vietnam
Definitions: Category 1: These countries face "absolute water scarcity." They will not be able to meet water
needs in the year 2025. Category 2: These countries face "economic water scarcity." They must more than double their
efforts to extract water to meet 2025 water needs, but they will not have the financial resources available to develop these water supplies.
Category 3: These countries have to increase water development between 25 and 100 percent to meet 2025 needs, but have more financial resources to do so.
Category 4: These countries will have to increase water development modestly overall on average, by only five percent to keep up with 2025 demands.
*These countries have severe regional water scarcity. A portion of their populations (381 million people in China in 1990 and 280 million people in India in 1990) are in Category 1. The rest of their populations are in Category 4.

42
2.2.8. Forestry and fisheries
Forest management goals will increasingly shift from wood
production to safeguarding the environmental functions of forests. The
role of industrial forest plantations to provide timber is expected to
increase strongly, with its share reaching one-third of total supply by
2015. Use of fuel wood is expected to continue to grow over the next
two decades before stabilizing or even declining marginally. More
than 60 percent of the wood harvested globally in 1995 was used as
fuel (FAO, 2004b).
Average world consumption of fish per person could grow from 16 kg
a year in 1997 to 19-20 kg by 2030, raising total food use of fish to
150-160 million tonnes. The yearly sustainable yield of marine
capture fisheries is estimated at no more than 100 million tonnes. "The
bulk of the increase in supply therefore will have to come from
aquaculture" (FAO, 2000b).
In some developing countries, fish provide a critical source of high-
quality protein and needed oils. Fisheries currently provide less than
one percent of the calories the world consumes, however, and this
percentage is almost certain to decline. The annual fish catch peaked
at 100 million metric tons in 1989 and has been stable at slightly
lower levels since. The Food and Agriculture Organization of the
United Nations has concluded that annual marine yields are adversely
affected at extraction levels exceeding 80 million tons, and the
organization predicts no growth in catches from lakes, streams and
inland seas. Aquaculture supplies about 12 million tons of fish, but its
growth is constrained by competition for fresh water and the challenge
of keeping fish free from disease (PAI, 2005).

43
2.2.9. Rangelands
With limited potential to expand food production either from fisheries
or range-fed livestock, cultivated land will be pressed to supply ever
increasing proportions of the world’s food. But arable land, too, faces
severe constraints. We appear to be entering a period in which all
food-producing systems must function well almost all the time.
Calculations of the sunlight, water and plant nutrients available for
growing crops suggest that farmers could feed—at least in theory—
many more people than the current world population. In the real
world, however, weather and pests may not cooperate, and farmers
and other food suppliers perform at human rather than theoretical
levels of efficiency. Storage and transportation of food on massive
scales contribute to spoilage (PAI, 2005).
For many food deficit low-income countries, feeding a growing
population means coaxing more food out of the same amount of land.
Canadian geographer Vaclav Smil estimated that the minimum
amount of land needed to supply a vegetarian diet for one person
without any use of artificial chemical inputs is 0.07 hectare, or slightly
less than a quarter of an acre. Based on this, Population Action
International estimated that currently some 420 million people live in
land-scarce developing countries. If fertility and population growth in
developing countries continue to fall, there could be 560 million by
2025. If not, there could be 1.04 billion such people (UNFPA, 2003).
According to IFPRI, a "demand-driven livestock revolution is under
way in the developing world with profound implications for global
agriculture, health, livelihoods and the environment". IFPRI projects
that meat demand in the developing world will double between 1995
and 2020 to 190 million metric tons. Demand for meat in the

44
developing world is expected to grow much faster than for cereals—
by close to 3 per cent per year for meat compared with 1.8 per cent for
cereals. In per capita terms, demand for meat will increase 40 per cent
between 1995 and 2020 (Pinstrup-Andersen, and Pandya-Lorch,
1999). What this means is that demand for cereals to feed livestock
will double in developing countries over the next generation. By 2020,
feed grain demand is projected to reach just less than 450 million
metric tons. Given this trend, well under way in much of Asia,
demand for maize (corn) will increase much faster than any other
cereal, growing by 2.35 per cent per year over the next 20 years.
Nearly two thirds of this increased demand will go towards feeding
livestock (UNFPA, 2003).
In China, rising incomes and changing diets have resulted in a
tremendous demand for meat, particularly poultry and pigs. Over the
next two decades total demand for meat will double, increasing
pressure on grain producers. It takes 4-5 kilograms of feed to produce
1 kilogram of meat (Pinstrup-Andersen and Cohen, 1998).
As urbanization develops and incomes grow, the world food economy
is increasingly fuelled by a demand for livestock products. The last 20
years have witnessed spectacular growth in meat demand in
developing countries - expanding at an annual rate of 5.5 percent -
although many countries with the greatest need for higher protein
consumption did not participate in this process. The poultry sector has
seen dramatic gains, with the share in meat output more than doubling
to 28 percent over the last three decades. As the developing world's
demand for meat begins to level off and with consumption slackening
in industrial countries, FAO projects a slowdown in the growth of the
world meat economy (FAO, 2000b).

45
On land, pastures and rangelands are being grazed at or beyond
capacity. Sustainable grazing of livestock is dependent on balancing
the scale of use with the capacity of land, water and vegetation to
tolerate that use over time. In most regions, grazing is now
accompanied by soil erosion and adverse changes in plant species
composition. At the same time, the world’s livestock population is
growing even more rapidly than its human one. Moreover, rangeland
alone can support only a portion of the world’s cattle and sheep, and it
is of no use for raising pigs and poultry. Today, 37 percent of the
world’s grain is used to feed livestock (World Resources Institute,
1994).
2.3. Conclusion
It is now well accepted that, at least over the medium term, there
appear to be no major global constraints to expanding world food
production at a rate sufficient to match the growth of the effective
demand for food. Yet the world still faces a fundamental food security
challenge. Despite steadily falling fertility rates and family sizes, the
world population is expected to grow. Despite progress on average per
capita consumption of food, people in many countries still suffer from
food insecurity, and malnutrition will still persist (Pretty and Hine,
2001).
The deceleration over time of the effective demand for food
contributes materially to this "happy" state of affairs. Such
deceleration results from both positive and negative developments
from the standpoint of human welfare. The positive ones are the
slowdown in population growth due to voluntary reductions in fertility
around the world and the fact that an ever growing proportion of

46
world population gradually achieves sufficient levels of nutrition
beyond which there is only limited scope for further increases in per-
person food demand. The negative aspects are the contributions of
higher mortality to the slowing of global population growth, and the
role of poverty in depressing demand for food. Even if demand for
food is decelerated, the reason is because a significant part of world
population with still very inadequate consumption levels lacks
purchasing power and has no way to express their need to increase
consumption in the form of solvable demand in the marketplace. This
is why the problems of food insecurity afflicting many countries and
population groups remain as severe as ever, regardless that price
trends in world markets indicate once again an overabundance of food
relative to effective demand at the global level. World market prices
do not reflect adequately the problems of the poor and the food
insecure (Alexandratos, 1998).
Concerning the environmental and sustainability dimensions of the
expansion and further intensification of agriculture, we note that (a)
the foreseen land expansion need not be associated with the rapid rates
of tropical deforestation observed in the past, though there is no
guarantee that this will be so; (b) there will be further increases in the
use of agrochemicals (fertilizer, pesticides) in the developing
countries, though at declining rates compared with the past; (c)
increased use of fertilizer is often indispensable for sustainability (to
prevent soil mining); and (d) the need to accept trade-offs between
production increases and the environment will continue to exist in the
foreseeable future and the policy problem is how to achieve such
increases while minimizing adverse impacts on natural resources and
the wider environment (Alexandratos, 1998). Considering these

47
consequences, the population monster must be controlled. At the
world's current rate of growth it will be impossible to fed the entire
world and insure food security for everyone. World population will far
outgrow food production. To avoid the harsh outcomes projected for
the future, we must stop world population growth, and conserve our
land, water, and energy resources that are vital for a sustainable
economy and environment (Pimentel and Giampietro, 2001). It is also
important to understand that each and every factor, political, gender,
population, and others too all intertwine and influence each other. Not
only must these factors be overcome but also other factors such as
environmental degradation, finances, and geographical factors must be
considered. If these factors are not overcome, our world will not be
able to feed itself in the twenty-first century (Blundon, 2001).
Effective and lasting solutions to problems related to food insecurity
must be found in the policies and actions which pay adequate attention
to those processes of development that aim primarily toward
strengthening the human (Nshimbani, 2004). In the next chapter, we
will show how these policies and resource management strategies can
be affected to intensify or decline the consequences of population
growth.

48
Chapter Three
Sustainability: Basic Challenges
3.1. Importance
As we enter the new millennium, one of the most challenging
questions, if not the most challenging one to be addressed, is how to
assess, build, and maintain a sustainable economy that will allow the
human society to enjoy a sufficiently high standard of living without
destroying its natural and biological support (Andriantiatsaholiniaina,
2001). The first in a new series on population and SD provides new
ways of thinking about population trends in the 21st century. While
the 20th century was the century of population growth with the
world's population increasing from 1.6 to 6.1 billion, the 21st century
is likely to see the end of world population growth and become the
century of population ageing. At the moment we are at the crossroads
of these two different demographic regimes, with some countries still
experiencing high population growth, while others are already faced
with rapid ageing. As it has become more and more clear that it is
technically feasible to provide enough food for projected populations,
the concept of sustainability has broadened to cover the environmental
impacts of agriculture. This is a welcome development, but it is not
enough as there are many ways in which food requirements and
demand can be met.
Based on general estimation of available natural resources, scientists
of the Royal Society and the U.S. National Academy of Sciences have

49
issued a joint statement reinforcing the concern about the growing
imbalance between the world's population and the resources that
support human lives (RS and NAS, 1992). This is the main reason
why sustainability issues have gained substantial importance on the
political agenda in the recent years.
SD is nowadays the goal, in words at least, of most politicians and
decision-makers. Since publication of the Brundtland report in 1987
(WCED, 1987), the concept of sustainability has gained increasing
attention among policy-makers and scientists, which culminated
during the 1992 Earth Summit held in Rio de Janeiro. Among the
results of the Earth Summit, Agenda 21 is a comprehensive list of
actions needed to achieve SD (UNCED, 1992). Leaders from over 150
states committed themselves to undertaking actions, which will render
future development sustainable but without scientific tools to guide
policy-making towards a sustainable path (HMSO, 1994). Decisions
leading to SD require a pragmatic approach to assess sustainability
based on good science and adequate information. The latter is
provided in the form of data about environmental, social, and
economical factors known as indicators of sustainability. Sustainable
projects and optimal strategies for development necessitate answering
four fundamental questions: “why unsustainable development occurs”,
“what is sustainability”, “how can it be measured”, and “which factors
affect it” (Atkinson et al., 1999).
There is evidence that development is currently unsustainable. Ozone
depletion, global warming, depletion of aquifers, species extinction,
collapse of fisheries, soil erosion, and air pollution are among the
obvious signs of ecological distress (Brown et al., 2000). Our society
is also showing similar signs due to poverty, illiteracy, AIDS, social

50
and political unrest, and violence (IUCN/UNEP/WWF, 1991; UNEP,
1992).
Sustainability is an inherent vague and complex concept. As pointed
out in the literature, it is not that sustainability indicators are lacking
but their fragmentary and polymorphous nature hampers their direct
usefulness in the quest of strategies for SD (Brink et al., 1990; OECD,
1994). Despite the fact that the concept of SD is ill-defined, policy-
makers should strive towards it and scientists should find scientific
ways to assess and improve upon it. The development of sustainable
policies is a necessity if we adopt the precautionary approach of
development and if we want to avoid nasty surprises species as the
ozone depletion or irreversible actions such as species extinction. Of
course, even then, no one can guarantee complete avoidance of
surprises given our incomplete state of knowledge of an extremely
complex environment, but at least we do our best.
Although sustainability is a goal for international and national policy-
makers, there is no measuring yardstick against which to assess
practical policy (WCED, 1987). Sustainability is difficult to define or
measure because it is an inherently vague and complex concept. Fuzzy
logic, due to its capability to emulate skilled humans and its
systematic approach in handling vague situations where traditional
mathematics are ineffective, seems to be a natural technical tool to
assess sustainability.
What we need is adequate information that is tailored to quantitative
sustainability objectives. Brink (1991) states that such information
should: (a) give a clear indication as to whether objectives of
sustainability are met, (b) concern the system as a whole, (c) have a
quantitative character, (d) be understandable to non-scientists, and (e)

51
contain parameters which can be used for periods of one or more
decades. The need for a practical tool to assess sustainability is crucial
to policy-makers if they are to secure future development. Since such
a tool is not available, management by trial-and-error instead of
management by knowledge and prediction is currently the only way
used to establish sustainable policies. A deadlock further impeding the
measurement of sustainability lies in the fact that scientists are waiting
for important political issues to be raised by policy-makers, while
policy-makers are waiting for important ecological issues and
ecological indicators of sustainability to be defined by scientists
(Brink, 1989). Unfortunately, unsustainability may not be easily
reversible because the natural and biological support systems of an
economy are subject to thermodynamic laws and irreversibility.
3.2. Definitions
The fundamental question is: “what is sustainability and how
sustainable is an economic system” (Procter and Gamble, 2005). Since
SD is a vague continually evolving concept, it is difficult to define it
in an appreciate way (McKeown et al., 2002; Pembleton, 2004). The
commonly used definition of SD was put forward by the Report of the
World Commission on Economy and Environment (the "Brundtland
Report") in 1986: "To meet the needs of the present without
compromising the ability of future generations to meet their own
needs" (WCED, 1987; p. 43). The precise meaning of SD has been
widely debated (Wikipedia, 2005). For example, two years after the
Brundtland Commission's Report popularised the term, over 140
definitions of SD had been catalogued. Before the widespread use of
the term sustainable industries, the terms sustainable economy and SD

52
were prevalent. Their popularization started with the United Nations
Conference for Environment and Development (the Earth Summit) in
1992. The conference was prompted by the report Our Common
Future (1987, World Commission on Environment and Development,
also known as the Brundtland Commission), which called for
strategies to strengthen efforts to promote sustainable and
environmentally sound development. Caring for natural resources and
promoting their sustainable use is an essential response of the world
community to ensure its own survival and well-being (Nationmaster,
2005). The issue of intergenerational responsibility also is raised. The
Bruntland report does not denounce the depletion of non-renewable
resources. Serageldin suggested that "sustainability is to leave future
generations as many opportunities as, if not more than, we have had
ourselves" (Takle, 2001). This is a very far-reaching principle that
admits a wide range of activities to allow residents of the planet -
present and future - to live fulfilling lives. One definition of SD that
appears to have more resonance with the general public is that used by
the United Kingdom government: "SD is about ensuring a better
quality of life for everyone, now and for generations to come." This
focus of SD on improving quality of life is becoming more widely
accepted by governments, companies, civil society organizations, and
others (Holliday and Pepper, 2005). A quality of life focus makes the
concept more aspirational, and it changes the tone and content of the
SD debate so that the emphasis is more on solutions than the
problems. Another definition of SD, demands that “we seek ways of
living, working and being that enable all people of the world to lead
healthy, fulfilling, and economically secure lives without destroying
the environment and without endangering the future welfare of people

53
and the planet” (Cumber, 2004). Based on this definition, we are
constantly required to re-evaluate our values and decisions: for
example, the present realities of malnutrition, lack of suitable housing,
and lack of safe drinking water, suggest that significant development
is needed for the present generation.
3.3. Dimensions
A series of seven UN conferences followed on environment and
development. The first UN Conference on Environment and
Development (UNCED or the Rio Summit) has emphasized this shift
of attention in the form of Agenda 21. Since then, countries and
regions have been formulating strategies towards the achievement of
sustainability in various sectors of national and regional development
(GLEAM, 2002). These strategies will have to cover the
environmental, social, economic (Hart, 2000), and recently, is more
defined by adding the fourth, which is institutional dimension
(GLEAM, 2002). SD is also one of the issues addressed by
international environmental law and focuses on the overall
performance or health of ecosystems. Social sustainability seeks to
reduce the vulnerability of various segments of the society,
particularly the poor, and maintain the health of social and cultural
systems. Economic sustainability aims to maximize the flow of
income, while maintaining the stock of assets required for these
benefits. The institutional dimension reflects the whole set of norms
and beliefs on which personal preferences and attitudes as well as
private and public organizations are built. Institutional sustainability
links to the availability of mechanisms to implement the other
dimensions of sustainability as well as the long-term viability of the

54
institutions in them. In all cases each system's capability to withstand
shocks (vulnerability and resilience) is an important aspect of
sustainability (Ibid). In other words, the environmental dimensions of
sustainability refer to the need to maintain (or restore) the physical
resource base so that it endures indefinitely to meet the needs of the
present without compromising the capacity of future generations to
meet their needs. This also highlights the underlying and fundamental
time component inherent in sustainability. Economic sustainability is
equally conditional on the use of resources so as to avoid their
overexploitation either in terms of their quality or quantity, or the use
of resources which results in the generation of waste in excess
capacity of the environment's to absorb it effectively. The balance
between environmental and economic sustainability is mediated
through the institutional arrangements that shape and condition the
management and use of the land, and those social norms that influence
community values. In effect, the different dimensions of sustainability
constitute the key components of the system, and act in concert to
either promote or constrain the achievement of sustainability (MAF,
2000). Land use is the visual expression of the interplay among those
different dimensions and as such can be an important indicator of the
health of the overall ecosystem. Therefore, SD calls for long-term
structural change in our economic and social systems, with the aim of
reducing the consumption of the environment and resources to a
permanently affordable level, while maintaining economic output
potential and social cohesion (ARE, 2005).
While, environmental sustainability identifies energy, fresh water, and
reversing land and soil degradations as priorities, especially for
developing countries to protect their natural resource base (EC, 2002;

55
Pembleton, 2004), social sustainability seeks to reduce the
vulnerability of various segments of the society, particularly the poor,
and maintain the health of social and cultural systems.
In general, we can divide all these dimensions in two categories: the
technical definition being "a sound balance among the interactions of
the impacts (positive and/or negative), or stresses, on the four major
quality systems: People, Economic Development, Environment and
Availability of Resources," and the none-technical definition being "a
sound balance among the interactions designed to create a healthy
economic growth, preserve environmental quality, make a wise use of
our resources, and enhance social benefits". When there is a need to
find a solution to a problem or a concern, a sound solution would be to
choose a measure or conduct an action, if possible, which causes
reversible damage as opposed to a measure or an action causing an
irreversible loss (Earth Government for Earth Community, 2003).
3.4. Modeling problems
Modeling sustainable systems has seen considerable improvement in
its application and utilization since the Rio Summit. This has been
driven partly by the development and negotiation about various
Multilateral Environmental Agreements and by the need for scientific
assessments in support of these negotiations. The UN Framework
Convention for Climate Change has generated a broad variety of
integrated assessment models focussing on the climate issue. Some
trend setting examples of these models are AIM (NIES, Japan),
MARIA (Tokyo University), IMAGE (RIVM, The Netherlands),
MESSAGE (IIASA, Austria) and MiniCam (PNNL, USA). Also, the
integrated models try to provide a powerful tool to undertake such

56
analyses and evaluations (Morita et al., 2000). Until recently, such
assessment modeling efforts have been typically limited in
geographical focus and in the sectors and issues covered. Some of
these models are gradually being expanded in order to cover the
broader perspectives of sustainability, vulnerability, durability and
human security, but they are still insufficient. Substantial model
development is required to cover the different dimensions of
sustainability and the spatial and temporal variety within these
dimensions. While some models try to include environmental
dimension, they neglect socio-economic dimensions. On the other
hand, while socio-economic dimensions are emphasized by the rest,
the environmental dimension has been neglected (GLEAM, 2002).
In practice, both researchers and policy-makers have found these
characteristics of sustainability difficult to handle. There is no good
conceptual framework available to untangle financial/environmental
links. The fundamental institutional changes that sustainability may
require, may themselves need strength of political will not readily
secured. Consequently, in most countries, policy efforts have focused
on the incorporation of sustainability within existing operational and
ideological frameworks. More effort has been spent on issues of inter-
generational transfer than to any redistribution of resources within any
one-generation. Equally more environmental legislation, determined
on traditional lines, has often been substituted for efforts to better
integrate environmental values into all decision making. To this extent
environmental policies more frequently remain a "tag-on" to existing
economic strategies, and production and environmental policies have
generally remained polarised and apart, despite rhetoric to the contrary
(MAF, 2000).

57
As the concept of sustainability represents a fundamental challenge at
the theoretical and methodological levels, reorientation within the
social sciences themselves is required, implying (UNESCO, 1996):
• Firstly, to give more attention to current vital issues such as
land use, social use of natural resources like water or wood,
production and consumption patterns, loss of biodiversity, etc.;
• Secondly, to expand the problem-oriented cooperation between
the social and the natural sciences on issues and questions of
sustainability. The crucial importance is that natural and social
sciences cooperate on an equal basis, starting from the phase of
defining the problems under study; and
• Thirdly, to develop and improve interdisciplinary cooperation
among the various disciplines. This is necessary to achieve a
more integrated and comprehensive understanding of
development processes, as well as the relationships between
individuals and the environment in their social, political,
economic, psychological and cultural aspects. With regard to
this, the historical boundaries between the disciplines must be
re-examined and methodologies of interdisciplinary research are
to be developed.
With the increasing attention given to the economic, social and
ecological impacts of SD, the need for interdisciplinary approaches in
agricultural research is likely to continue growing. However, the
experiences of the last few decades of interdisciplinary approaches
such as Farming Systems Research (FSR) and Farming Systems
Research/Extension (FSRE) are not very promising: disciplinary
conflict is common, productive interaction seems difficult to achieve

58
and practical results have been disappointing (Hawkins, 1997). Within
the realm of agricultural research, farming systems research (FSR) and
land use planning are areas where interdisciplinary is indispensable
(Aenis and Nagel, 2000). However, as Hawkins (1997) reports, only
few FSR projects have reached interdisciplinary status involving both,
technical and social sciences. Sustainability in social, economic, and
ecological terms is the central goal of R&D projects in the field of
natural resource management. Up until now, impacts seem to be
marginal (Pretty, 1995). As a consequence, a change with regard to
institutionalizing and organizing participation of all relevant actors is
necessary. But which efforts ensure participation? How to manage this
process? Which structures support efficient outputs? (Aenis and
Nagel, 2000).
Some practical experiences have been made in training small teams
for interdisciplinary studies and still, there is a growing scientific
knowledge on economic and ecological sound planning and
management techniques for natural resources. It is also argued that
interdisciplinary research requires: a) an appreciation of holistic
approaches; b) a common understanding of goals and objectives and
skills in planning methods to reach these; and c) effective
communication and management procedures to enable expert teams to
function efficiently (Hawkins, 1997a). This group of experts help to
give better understanding of assessing the SD in the situation. They
have a lot of information on dimensions, indicators, and assessment of
them (Meadows, 1998).

59
3.5. Conclusion
It is fair to say that some clear measures or, at least, indicators of
sustainability exist, but the effectiveness of policies towards a goal of
sustainability cannot be assessed. Attempts have been made to
measure sustainability using economic, ecological, or combined
economic- ecological approaches, but the results still lack universal
acceptance. Examples of existing sustainability measurements are
Pearce and Atkinson, 1993; OECD, 1994; Sherp, 1994; IUCN/IDRC,
1995; Rennings and Wiggering, 1997.
For the sake of analysis, researchers have broken down sustainability
into a large number of individual components or indicators whose
synthesis into one measure appears to be next to impossible. As
pointed out in the literature, it is not so much that environmental and
socio-economical information is lacking but the fragmentary, often
qualitative, and very detailed nature of this information hampers its
direct usefulness in policy making (Brink et al., 1990). Not only are
there no common units of measurement for the indicators of
sustainability but quantitative criteria for certain values are also
lacking. A systemic method based on a reliable scientific methodology
is needed to combine multidimensional components and assess
uncertainty. Such a method should be flexible in the sense that one
can add or remove indicators to achieve a better assessment of the
system according to the context. In reality the border between
sustainability and unsustainability is not sharp but rather fuzzy. This
means that it is not possible to determine exact reference values for
sustainability and a scientific evaluation of uncertainty must always be
considered in the procedure of sustainability assessment. For this
reason, the use of natural language and linguistic values based on the

60
fuzzy logic methodology (Munda et al., 1994) seems more suitable to
assess sustainability. In the two next following chapters, we will first
explain sustainability in rangeland management and some basic
concerned challenges, which can be the causes of (dis)equilibrium.
Then, in Chapter 5, we will introduce fuzzy logic as a powerful tool to
deal with these challenges.

61
Chapter Four
Rangeland Management:
Basic Challenges and Principles
4.1. A review of literature
An accelerating rate of literature is being published on rangeland
management, although, the use of rangelands for domestic productions
is increasingly questioned on conservation and sustainability grounds
in all over the world (Fleischner, 1994, Grigg, 1995). However, much
recent literature on grazing management, particularly literature from
the arid to sub-humid regions, is at a theoretical level (e.g. Westoby et
al., 1989). This is in part because adaptive management research - to
determine appropriate management practices for extensively managed
rangelands - is now just beginning at the operational scale. Simulation
modeling and decision support systems are currently the only way to
explore the many possible management alternatives. Grazing
managers do not just adopt a new grazing system but rather they adapt
a suite of management changes in conjunction with implementing a
new grazing system. Savory and Butterfield (1999) are right in stating
that grazing management may not be researched in the manner of
normal biological research. There is a need to develop principles that
can be integrated using simulation modeling into grazing management
systems. Business schools have extensively studied management
practices of successful businesses by interviewing managers and
observing how successful businesses are operated (Peters and

62
Waterman, 1982), not by setting up replicate corporations based on
different management challenges and collecting data on them over a
number of years. However, even while modeling approaches are being
developed and validated, there is still a need now for some practical
guidelines for grazing management. Thus for the present and
foreseeable future common sense and rule of thumb solutions to
grazing management problems may be the most useful. This chapter
reviews some practical recommendations for managing grazing on
rangelands. In doing so, as most of nomadic people in the world and
especially in Iran live in the arid to sub-arid rangeland areas
(McMurphy et al., 1990), our focus would be around the conditions of
these areas which are faced by socio-economic and ecological
challenges, rather than the more humid areas where agronomic
challenges are widely survived.
The debate in preparing this chapter has been to understand why we
propound especial principles and challenges to reach equilibrium in
rangeland management. The main reason is, as we have discussed in
Chapter 5, a need to develop a new model; using fuzzy logic, which
needs some criteria as inputs of the model. This is particularly because
over 4,000 papers and books were published on the subject since 1970
to show how we can arrive at the challenges of grazing management
in practice (Walker and Hodgkinson, 2000). In the following, at first,
we give a discussion to find the concept of rangeland management; if
it implicates to art or/and science. Secondly, we describe equilibrium
and disequilibrium systems in rangeland management. Then, we
explain current challenges in pastoral systems, and finally, we explain
basic principles to reach equilibrium.

63
4.2. Rangeland management: Art or science?
Although the definition of rangeland management has changed
somewhat over the years, the part that states it is both an art and a
science has not. In 1943, Stoddart and Smith defined rangeland
management as "the science and art of planning and directing
rangeland use so as to obtain the maximum livestock production
consistent with conservation of the range resources" (Stoddart and
Smith, 1943). This definition implies a sustained yield of livestock
over a long period of time. The book leaves no doubt that the main
objective was to produce livestock. In the second edition (1955) of
their book, rangeland management was the science and art of
obtaining maximum livestock production from rangeland consistent
with the conservation of land resources. This definition asserts
rangeland management is closely related to animal husbandry and
plant ecology; a movement from livestock production to land
management in 12 years. Twenty years later (in the third edition)
Stoddart et al., (1975) defined rangeland management as "the science
and art of optimizing the returns from rangelands in those
combinations most desired by and suitable to society through the
manipulation of rangeland ecosystems. The science portion of
rangeland management provides a body of knowledge in which
principles are developed. Principles should not dictate management,
but provide guidelines for management. An artful management is
therefore, the skillful and/or ingenious application of scientific
principles, experience, and creativity to land management practices.
In new definitions, however, rangeland management is a lot more of
an art than science, since there is so much we do not know about
rangeland ecosystems’ mechanisms and processes that drive rangeland

64
ecosystems. Ecosystems are too complex and too dynamic in both
time and space to ever have fully figured out. This makes it easy for
interest or user groups from all perspectives to challenge us. We are
also challenged because many land management decisions were not
made in an artful manner (Miller, 1995).
4.3. Equilibrium and disequilibrium systems in rangeland
management
For the objectives of this dissertation, we consider equilibrium versus
disequilibrium continuum in pastoral systems. Equilibrium systems
are those that may change plant species composition in response to
grazing, but when grazing pressure is reduced, will return to their
former composition. These systems typically have a long evolutionary
history of grazing, are not susceptible to invasion by undesirable
plants, either woody or herbaceous, and can be managed using simple
models of succession. Disequilibrium systems are those that never
reach a steady state and are controlled primarily by unpredictable
factors such as rainfall and fire. These systems typically have a short
evolutionary history of grazing, are prone to invasion by undesirable
plants and are best managed using the state and transition model of
community dynamics (Walker and Hodgkinson, 2000).
Management of equilibrium systems is fairly straightforward because
these systems respond to change in total grazing pressure. Outcomes
must be described and criteria established to monitor progress. A
grazing management plan could be developed based on manipulating
livestock species, grazing season, distribution and stocking rate to
accomplish goals. For instance, if maximum sustainable production of
livestock products is the objective and distribution is not considered a
65
problem, then year-long continuous grazing using sheep and cattle at a
variable stocking rate tied to annual rainfall would be appropriate.
Decision support systems are currently available to monitor and adjust
stocking rate to match animal demand with primary production (Stuth
and Lyons, 1993). In equilibrium ecosystems, management to
maintain the right rate of stocking is the most important factor of
grazing management. This can be done with a simple rotation or even
continuous grazing system. Season or timing of use, livestock species
and distribution can be adjusted to increase carrying capacity or
accomplish other management objectives such as multiple uses. The
objectives of multiple uses will complicate the grazing management of
equilibrium systems, but in many cases there is commonality of states
that meet different objectives. For example, grazing management that
retains all palatable plant species will probably meet both biodiversity
and sustainable production goals (Walker and Hodgkinson, 2000).
Disequilibrium systems are more difficult to manage because even in
the absence of livestock they may be unstable, particularly if invasion
by undesirable plant and animal species is a problem. Invasion by
woody plants is a widespread problem, which although potentially
accelerated by grazing, typically will also occur in the absence of
grazing (Archer, 1996). Fire is the best tool for controlling woody
plant invasion, but the ability to use this tool is dependent upon
grazing systems to accumulate and manage grass fuel levels. In these
systems grass production will usually need to be managed both as
forage and as fuel (Kothmann et al., 1997). Because of the tendencies
of disequilibrium systems to cross thresholds to less productive states,
grazing systems that have been shown to advance succession will have
the greatest potential for maintaining plant communities in the desired
66
vegetation state. Because of the long deferment periods and resultant
increased grazing intensity on the grazed units, these types of systems
tend to be very sensitive to stocking rate particularly as it affects
animal performance. Another advantage of grazing systems with long
deferment periods is that they are the ones best adapted to accumulate
the grass fuel required for a successful prescribed fire program
(Howery et al., 2000).
We have purposefully avoided discussing grazing systems per se,
because there is no evidence to indicate that they provide any
advantage other than the flexibility that cross fencing and grouping of
animals provide for managing livestock distribution and timing of
grazing. However, as we learn more about how timing may be used to
provide either rest or grazing pressure at critical times to accomplish
vegetation management goals, this flexibility will be increasingly
important. Likewise, when prescribed fire becomes an integral part of
the grazing management plan the flexibility of multiple rangelands to
manage grass as forage or fuel becomes very important (Walker and
Hodgkinson, 2000).
4.4. Current challenges in rangeland management
4.4.1. Overgrazing
The most contentious and emotional rangeland use issue now and in
the foreseeable future is balancing private rights with the public
interest. This debate often terminates to overgrazing (private rights)
and sustainability (public rights) (Box, 1995). This issue will surface
in such different rangeland use debates as historical preservation,
endangered species, location of waste disposal facilities, and public
rangeland management. The controversy of overgrazing on public

67
rangelands, therefore, is not just about cows and grass. It is about
ownership of the public lands and it is about what rights pastoralists
can hold in a common resource (Box, 2002; Deadman, 1999).
Whenever pastoralists prefer to focus on their own rights and to
neglect the public rights, rangeland degradation will be unavoidable,
especially for next generations (Azadi et al., 2003).
In general, rangeland degradation falls into two broad categories: that
resulting from extended periods of drought, and that resulting from
overuse through cultivation or overgrazing (Hiernaux, 1996). With
uncontrolled grazing, most rangelands are overgrazed and the
vegetation is depleted. Due to overuse of resources, especially
overgrazing, and the application of non-suitable management practices
such as low recognition of prevalent natural vegetation cycles in grass
and thorn bush savannahs without considering long-term degradation
processes, the rangeland quality of many rangeland areas has declined
(Buss and Nuppenau, 2002). A visible decreasing appearance of
natural composition of grass and bush cover, bush encroachment and a
decreasing biodiversity indicate lower stocking potentials for domestic
livestock on large areas of rangeland, especially in developing
countries such as Iran (Mesdaghi, 1995). In this case, rangeland
degradation becomes an economical threat to falling pastoralists’
income, a social threat to the continuation of rural-urban immigration,
and an environmental threat to desertification. As a response, on one
hand, many pastoralists increase their livestock and overgraze the
rangelands. On the other hand, economic and political pressures push
them to produce red meat for a growing population, especially for
urban people. Plantation density, therefore, will decrease and
degradation will happen. Sometimes, government policies

68
inadvertently provide incentives that encourage overgrazing.
Overgrazing occurs, even though analysis demonstrates that maximum
net economic returns will occur below the maximum sustainable level
of livestock off-take per unit area (Buxton and Stafford Smith, 1996).
Financial crisis is another factor tempting graziers to push stocking to
the limit. Pastoral businesses facing insolvency are greatly tempted to
increase stocking rates in an effort to sustain their operation until
commodity prices or climate take a favourable turn. Carrying capacity
and the appropriate stocking rate cannot be determined until the
decisions relative to so species of livestock, season of use and
distribution have been revised (Taghi Farvar and Jandaghi, 1998;
Walker and Hodgkinson, 2000).
4.4.2. Carrying capacity
The science of rangeland management adapted carrying capacity
concepts to grazing systems on the rangelands. The logic basis for this
concern is the concept of rangeland carrying capacity. Carrying
capacity is considered to be the average number of animals that a
particular rangeland or range can sustain over time. Stocking Rate
(SR) is expressed as the number of animal unit months (aum)1
supplied by unit of area (e.g. hectare). An animal unit month is the
amount of forage required by an animal unit (au)2 grazing for one
month (Kopp, 2004). The responsibility of rangeland managers is to
try to balance livestock grazing pressure with the natural regenerative
1. The term aum is commonly used in three ways: (a) Stocking rate, as in "X unit of area per aum";
(b) forage allocations, as in "X aum(s) in Allotment A"; (c) utilization, as in "X aum(s) taken from Unit B (Glossary of Terms Used in Range Management, 2002).
2. An animal unit (au) is defined as an "average" live body weight equal to 1000 lbs (453.59 kg) (NRCS, 2000).

69
capacity of rangeland plants. The estimations of carrying capacity are
usually based on assumptions about the impact of livestock on plants
and plant succession. Heavy livestock grazing is thought to lead to a
decline in rangeland condition, and reducing or removing grazing
pressure assumed plant successional processes would restore the
rangeland to its previous condition. By knowing the rangeland
condition class1, the proper use factor, or the amount of forage to
leave to allow plant nutrients to be restored, and taking into account
distance to water, slope steepness, and other factors, carrying
capacities for a particular rangeland or pasture could be determined
(Miller, 2005). These managerial estimations have usually been used
in many countries such as Iran.
Before turning to the next section, it should be noted that in most
instances where rangelands are being grazed by domestic livestock in
an unsustainable manner, the root cause is the lack of well-matched
theory on grazing management. However, we believe that the below-
discussed principles can be understood to alleviate the most of above-
discussed challenges associated with grazing by domestic livestock.
Pastoralists can be expected to make rational decisions from their
point of view. In general, it should be noticed where grazing
management is poor, the theory may be wrong or incomplete, or it
may apply to only part of a system being managed. Other factors such
as social and economic may override consideration of grazing
management.
1. Rangeland condition class is defined by the percent of climax for the range site, classified as
"Poor" (0-25), "Fair" (26-50), "Good" (51-75), and "Excellent" (76-100) (Glossary of Terms Used in Range Management, 2002).

70
4.5. Basic principles in rangeland management
The purposes of grazing management is to minimise the adverse
impacts of domestic livestock and other herbivores that comprise the
total grazing pressure on the natural resources of soil and biota and to
maximise the probability that the grazing enterprise will be
sustainable. This statement does not imply that grazing is not
sustainable or that grazing is not an important ecological force in
many rangeland ecosystems (Milchunas et al., 1988). However, at the
level of individual plants, defoliation decreases production in the vast
majority of instances (Jameson, 1963) and in most instances the
purpose of grazing management is to ameliorate this negative effect
and maintain a competitive balance among the plant assemblage.
There are now multiple desired outcomes for a sustainable grazing
enterprise (Walker, 1995), and this trend is likely to increase. The
goals of grazing management may include control of undesirable
vegetation (Olson and Lacey, 1994), enhancing wildlife habitat
(Mosley, 1994), reduction of fire hazard, maintenance of biodiversity
(Landsberg et al., 1999), animal traction, manure, banking livestock
capital and, of course, for the profitable production of food and fibre.
Herbivores, including domestic livestock, highly select the plants and
plant parts they graze (Leigh and Mulham, 1966) and the parts of the
landscape they favour for grazing (Landsberg and Stol, 1996, Roshier
and Nicol, 1998). Plants are the victims of defoliation, overgrazing,
and suffer through reduction in the plant's resource capturing ability.
Ultimately, such reduction impairs the ability of rangeland plants to
survive times of resource scarcity (Hodgkinson, 1996). Ecosystem
functioning may also change under the impact of grazing and other
anthropomorphic influences. For example, the chance of fire may be

71
greatly reduced (Hodgkinson and Harrington, 1985) and competitive
relationships among plant species may be altered because of elevated
atmospheric CO2 that has resulted from the burning of fossil fuels
(Polley, 1997).
Development of a grazing management strategy for a pastoral
enterprise requires definition of the desired outcomes and of the
inherent constraints. From these, the solution space of the problem can
be defined and management can then adjust the stocking rate, grazing
patterns, livestock species and distribution of grazing animals in
different seasons. It should be recognised that any time domestic
livestock are grazed, related decisions to livestock species, timing of
grazing and stocking rate have to be made, either consciously or
unconsciously. Improving grazing distribution, however, normally
requires the investment in capital improvements such as fencing or
water development. Stocking rate is usually considered the most
important factor as well as the most abused factor in grazing
management. The importance of season of grazing is dependent upon
the climate of an area and whether cross fencing is in place that would
allow the implementation of a grazing management system. Existing
conditions in many areas dictate that on a large percentage of grazing
lands, season of grazing is not a factor that can be managed readily.
However, resting from grazing to foster plant recovery and seed
production, and in some cases to prevent accelerated mortality of
domestic stock due to forage and water scarcity, is desirable in
ecosystems of non-seasonal rainfall. This can be achieved by lease
grazing, stock sale or feeding of livestock on forage reserved within
the property (Walker and Hodgkinson, 2000).

72
Choice of species of livestock is an under-utilized management tool at
the present time. The selection of the species of livestock best adapted
to a particular environment is often the simplest solution to grazing
management problems. However, many graziers are reluctant to make
such changes often for cultural reasons but also because of physical
reasons such as predators. In both developed countries with the
majority of pastoral business (e.g. the USA) and less developed
countries with the majority of nomadic people (e.g. Iran), the impact
of grazing on riparian areas, is one of the biggest grazing management
problems (Kauffman and Krueger, 1984). Overgrazing of riparian
areas affects biodiversity and water quality and is caused primarily by
a distribution problem. Whereas ribbon fencing of riparian areas is a
solution that has been used in some areas, a much simpler solution is
to change from cattle to sheep or goats, which prefer uplands to
riparian areas (Glimp and Swanson, 1994). Unfortunately, evaluating
the appropriate species of livestock, which should be the first
consideration in developing a grazing management plan, is seldom
considered. Control of undesirable plants is another example of a
problem that often is best solved by changing species of livestock. It is
a truism that plants dominating an area are the ones avoided by the
dominant herbivores in the system. Whereas determining the dietary
preferences of grazing livestock is often difficult, determining the
plants that are avoided is typically much easier. If a species of
livestock exists that has a preference for the undesirable plant,
changing livestock species is an easy solution. Classic examples
include the use of sheep or goats to control leafy spurge (Euphorbia
eusla L.; Johnson and Peake, 1960) or gorse (Ulex europaeus L.;
Radcliffe, 1985). Finally, if the management goal is to maximise

73
profit and minimise risk, then mixed species grazing, which has been
shown to accomplish this objective under a wide array of price ratios
(Connolly and Nolan, 1976) should be implemented. However, except
for a few areas where it is the cultural norm this practice is rarely used
(Walker, 1994).
Timing of defoliation may adversely affect a plant's ability to replace
tissue, reproduce and compete for resources. There are times when a
plant can be grazed safely and there are other times when grazing will
raise the probability of the plant's dying or its growth being impaired
(Blaisdell and Pechanec, 1949). Animal grazing preferences vary
seasonally and interact with seasonal plant responses. In temperate
climates with strong seasonal differences in temperature and
topography, seasonal grazing practices have evolved to meet stock and
natural resource requirements. Properties with contrasting soil types,
such as floodplains and runoff landscapes, also are a form of seasonal
grazing based on flooding patterns. Timing of grazing, for whatever
reason, will affect stocking rate because grazing at sensitive times will
reduce primary production and community stability unless grazing
levels are low. In areas with large topography differences,
phenological development may vary by 60 to 90 days between the
valley floor and the alpine grasslands. Grazing management
accommodates these differences in phenological development as
livestock are moved up the mountain following the green (Burkhart,
1996). Similarly, in those rangelands where properties are large and
rainfall is irregular in space and time, such as in semi-arid woodlands,
livestock may be moved to a paddock(s) where high rainfall from a
convective storm has generated a pulse of plant growth (Hodgkinson
and Freudenberger, 1997; Martin, 1978). Tactical grazing, particularly

74
in semi-arid areas, is a management option that is under-utilized. It is
time to reevaluate the appropriateness of continuous grazing (Holmes,
1996). The economic and ecological implications of grazing selected
rangeland areas only during the seasons or years with adequate rainfall
for plant requirements need urgent evaluation.
Landscape degradation and adverse vegetation change from
overgrazing was one of the primary factors leading to the development
of the discipline of range science. While the importance of proper
stocking rate is well recognised and techniques for assessing the
problem are available, overgrazing is still a major problem in many
countries such as Iran. However, it is more of a problem of wrong
mental models than inadequate technology and there are several
factors that tempt pastoralists to exceed the carrying capacity of a
property. These factors include the variable and unpredictable nature
of rainfall coupled with the overly optimistic attitude of graziers who
gamble on the ending of drought. Unfortunately, in many arid areas,
probability of a drought is greater than the probability of normal
rainfall (Riggio et al., 1987). Sometimes, government policies
inadvertently provide incentives that encourage overgrazing (Foran
and Stafford Smith, 1991; Holechek and Hess, 1995). Overgrazing
occurs even though analysis demonstrates that maximum net
economic returns will occur below the maximum sustainable level of
livestock per unit of area (Buxton and Stafford Smith, 1996).
Financial crisis is another factor tempting graziers to push stocking to
the limit. Pastoral businesses facing insolvency are greatly tempted to
increase stocking rates in an effort to sustain their operation until
commodity prices or climate take a favourable turn. Properties located
in the more arid regions with lower carrying capacities tend to be less

75
profitable because of higher fixed cost (Holechek and Hawkes, 1993).
Thus, the temptation to overgraze is often greatest in the areas that are
the most vulnerable. Carrying capacity and the right rate of stocking
cannot be determined until the decisions relative to species of
livestock, season of use and distribution have been made. Although,
the correct stocking rate is dependent upon these other three factors,
the overall success of the system will be dependent upon setting the
right rate of stocking. In general, when stocking rate is too high, the
system will not be sustainable even if the other components of grazing
management are correct.
Unsuitable spatial distribution is the cause of many problems
associated with grazing livestock (Holechek et al., 1989).
Furthermore, uneven distribution is caused by characteristics of both
the grazing animal as well as the plant community or landscape.
Distribution of livestock occurs at many levels and affects and is
affected by livestock species, season of use and stocking rate. Many
overgrazing problems are actually species of livestock or season of
grazing problems and are in a sense manifested as distribution
problems. Examples include overgrazing of riparian areas or grazing
prior to range readiness, both of which can cause adverse impacts at
very low grazing intensities. Carrying capacity in large pastures with
unsuitable livestock distribution is lower than on similar areas with
suitable distribution. Unsuitable distribution may buffer the effect of
changes in stocking rate on livestock performance compared to the
classic response curve where animals are well distributed (Stafford
Smith, 1996). Fencing and water development have traditionally been
used to improve distribution and the benefits from infrastructure
development can be modeled.

76
Grazing systems are based on manipulation of spatial and temporal
distribution of livestock grazing pressure. Because grazing systems
involve rotating animals among rangelands they actually determine
the distribution of livestock. There is a good evidence that any
production benefits that result from implementing grazing systems
arise from improved distribution and increased carrying capacity (Hart
et al., 1993) rather than altered foraging behaviour (Gammon and
Roberts, 1978) or increased primary production (Heitschmidt et al.,
1987). While most researches on animal distribution have been
conducted at the enclosure level, the effect of meta-scale distribution,
which involves transportation systems and grazing livestock only
during those seasons or years with adequate rainfall, deserves more
consideration in disequilibrium areas as a means of achieving
sustainable systems.
In contrast, when non-pastoral goals such as maintenance of
biodiversity become important grazing management objectives,
practices that improve livestock distribution may not be implemented
because they conflict with the other objectives (Landsberg et al.,
1997). Ensuring that parts of enclosures are ungrazed or lightly grazed
would meet biodiversity objectives at local scale. The most important
challenge and basic principles in rangeland management is, to devise
and implement strategies that will strike a balance between the needs
of pastoralists to consume rangeland at local level, and the needs of
future generations to conserve rangeland biodiversity at national
level.
The greatest impediment to these trade-offs is the value systems and
personality characteristics of pastoralists on one hand, and decision
makers, on the other hand (Thompson, 1995). These characteristics,

77
which are important for the successful settlement and development of
the current livestock production systems, tend to make people with
current tenure of the land very resistant to manage sustainably.
However, if one accepts the self-evident statement that "the only
sustainable rangeland management is profitable rangeland"
(Ainesworth, 1989) and the trends discussed above continue,
eventually economics will either transform pastoralists or cause a
change in ownership. Then the products and services produced on
rangelands will be more congruent with contemporary socio-economic
systems. This will also affect the types of information and technology
that will be demanded from rangeland specialists, although the
management principles can remain constantly (i.e., livestock species,
distribution, timing and stocking rate).
One of the best examples in this case is the current situation of Iranian
nomadic people. Where there is overstocking, this is environmentally
unfriendly since overgrazing and subsequent land degradation would
result. Iranian pastoralists have to be educated on limiting their
livestock according to the carrying capacity of the land somehow
overgrazing and degradation do not occur. In this case, a restocking
program for the districts is needed. Therefore, it is a challenge to
improve the management of livestock rising by introducing new
methods of rangeland management including zero grazing (Azadi et
al., In revision).
4.6. Conclusion
A claim is commonly made that the rangelands of the world are
overgrazed and hence producing edible forage and animal produce at
less than their potential (Wilson and Macleod, 1991). Globally,

78
rangelands are at risk from numerous pressures (Mitchell et al., 1999).
Some of these pressures arise from livestock/rangeland systems.
Livestock have been a key factor in the development of civilization,
but their role in the future is not clear as well as how the science of
rangeland management should change in order to meet the challenges
of the future. Carrying capacity is the most important variable in
rangeland management (Walker, 1995). At a time when the planet's
limited carrying capacity seems increasingly obvious, the rationale
and measures of rangelands carrying capacity are increasingly
criticized. One of the key elements of rangeland capacity is stocking
rate. Calculating stocking rate is relatively simple once the concept
and terminology are understood. The ability to calculate stocking rate
and make timely management decisions is vital to maximizing net
returns from the livestock operation (Redfearn and Bidwell, 2004). If
stocking rate is not close to the proper level related to equilibrium
rate, then, regardless of other grazing management practices employed
objectives will not be met (Roe, 1997).
The recent literatures on rangelands disequilibrium call in question
any specific measures of carrying capacity, whether the range is
stocked or unstocked, managed or mis-managed. The stocking rate of
a given area can vary in accordance with management decisions
(Kenny, 2004). Stocking rate should be based on average long-term
end-of-season standing crop values for an operation to remain
productive and sustainable. The procedure for calculating stocking
rates can be used on either forests or rangelands. Stocking rates are
based on the amount of forage that is standing at the end of the
growing season in an ungrazed condition. End-of-season standing
crop is not total production because much of the production has been

79
lost to decomposition and insects. Actual forage production is often
twice as large as the end-of-season standing crop. Forage production
information is useful but is very time consuming to obtain. That is
why end-of-season standing crop is used for estimating stocking rate
(Redfearn and Bidwell, 2004).
The common mathematical process used to estimate stocking rate
from herbage biomass is to determine the amount of herbage available
during the grazing season, which is the average value of the mean
monthly standing herbage biomass values for the grazing-season
months. The mean monthly standing herbage biomass should be
determined by clipping and weighing the dry herbage from each
pasture and averaging the weights over several years. The general
monthly herbage values on the herbage weight are the averages of
herbage production on well-managed pastures during years with
normal precipitation (Manske, 2004).
Recommended stocking rates are based upon results from grazing
research, local experience and clipped-plot yields (Lacey and Taylor,
2005). The recommended stocking rates for rangelands should also be
based on moderate utilization (economic long-term optimum) of the
annual forage standing crop and assume uniform grazing distribution.
It is also assumed that 50% of the annual peak standing crop can be
removed from the ecological site without negatively affecting the
plant community relative to species abundance or for beef cattle
production. This is the origin of the “take half and leave half” rule-of-
thumb that is often used. This is also the source of difference in
stocking rate management between rangeland and introduced forages
(Redfearn and Bidwell, 2004). The old rule of thumb “take half, leave
half” is well publicized, but may not be well understood. This rule

80
applies to average annual forage production. It does not mean that half
the forage can be allotted to grazing animals. Part of what is taken will
go to the animals, but part will disappear through trampling, decay
and insect damage. This disappearance is usually about 25 percent of
the average annual production. Therefore, only 25 percent is left for
the grazing animal (Lyons and Machen, 2005).
Ideally, such objections can be taken into account for any individual
carrying capacity estimated by accepting that it has to be determined
on a case - by - case basis in the field. Once one knows the size of the
grazing and browsing animals, the biomass production of the area, the
pattern of range management, and so on, he/she can - so this argument
goes - produce a site specific stocking rate estimated for the range area
under consideration. But, it cannot pack livestock into a given
rangeland, without at some point deteriorating that range
demonstrably. Surely, biomass production is going down on
rangelands precisely because stocking rate has been exceeded for so
long, even taking into account factors such as drought and climate
change (Hardesty et al., 1993).
The rationale and measures of rangeland carrying capacity are
increasingly criticized. It seems that even under environmental
conditions of great certainty, the notion of rangeland equilibrium
would still be ambiguous and confused. Moreover, since
environmental conditions are highly uncertain for the dry rangelands
of the world such as Iran, current understanding of rangeland
equilibrium turns out to be all the more questionable. There is no
workable, practical “equation” for rangeland management in general,
and carrying capacity in particular (Roe, 1997). Similar problems exist
in other field of sustainable rangeland management. Here, we have

81
observed a number of publications which used fuzzy logic as a
valuable tool (Andriantiatsaholiniaina, 2001; Cornelissen et al., 2001;
de Kok et al., 2000; Dunn et al., 1995; El-Awad, 1991; Ferraro, et al.,
2003; Gowing et al., 1996; Marks et al., 1995; Phillis and
Andriantiatsaholiniaina, 2001; Sam-Amoah and Gowing, 2001; Sicat
et al., 2005). In these studies, fuzzy logic is used to construct a model
for evaluating sustainability in different areas. These models promise
to be a valuable tool in evaluating the sustainability in general and
equilibrium specifically in this dissertation. The purpose of the next
chapter is to design a fuzzy model based on the experts’ knowledge
for solving the mis-management of the Iranian rangelands.

82
Chapter Five
Application of Fuzzy Logic in Sustainable
Rangeland Management
Albert Einstein: "So far as the laws of mathematics refer
to reality, they are not certain. And so far as they are
certain, they do not refer to reality" (Kosko, 1993).
5.1. Fuzzy Logic: A shifting paradigm
As we discussed in Chapter 4, there is a conflict that arises between
consumption (economic dimension) and conservation (environmental
dimension) in rangeland management. In general, interdisciplinary
problem-oriented projects have undergone substantial change over the
last few decades (Barendse and van der Hoek, 1996) since, social
scientists (social dimension) have tried to reconcile such a conflict
(Azadi et al., 2003) by creating interdisciplinary experts’ teams, which
are constructed by cooperation of technical scientists (Shaner et al.,
1982). This approach, which started in 1970s, has labelled differently1.
The interdisciplinary experts’ teams usually require not only thorough
specialist knowledge about problem sources, mechanisms and options
for solution(s), but also the ability to integrate knowledge from
different fields (Barendse and van der Hoek, 1996) to introduce new
methods of grazing management for reaching sustainability (Azadi et
1. FSA: Farming System Analysis, FSAR: Farming System Adaptive Research, FSCR: Farming
System Component Research, FSBDA: Farming System Base-line Data Analysis, NFSD: New Farming Systems Development, FSRAD: Farming Systems Research and Agricultural Development FSRE: Farming System Research Extension (Sands, 1986).

83
al., 2003). They try to develop a systematic approach for better
understanding the complex situation of pastoralists. But as the
interdisciplinary team tries to implement various ideas belonging
different experts for the same situation (FAO, 2004c; Shaner et al.,
1982; Zilberman and Alix, 2005), the members often fail to reach an
identical understanding of this complex situation (Shahvali and Azadi,
1999). More clearly, the main problems involved in interdisciplinary
teams are as follows:
� Misunderstandings and misconceptions because of different
disciplinary languages (jargons) (Pickett et al., 1999);
� Overestimating or underestimating the contribution of their own
discipline in analyzing and solving problems (Heemskerk et al.,
2003);
� Lack of knowledge about integrating knowledge and insights
from different disciplinary fields (Barendse and van der Hoek,
1996); and
� Lack of knowledge about integrating methods and techniques
(Barendse and van der Hoek, 1996; Pickett et al., 1999).
Thereby, when presenting their ideas concerning the sustainability in
rangeland management, they usually: (Azadi et al., 2003)
� Select rangeland equilibrium indicators differently;
� Weigh the indicators unequally; and
� Assess them in different ways.

84
The above-mentioned problems exist in other field of SD. To solve
these problems we use fuzzy sets theory to assess sustainability, and to
deal with different experts’ knowledge in rangeland management.
Fuzzy logic is one of the fastest growing methodologies in systems
engineering (Grint, 1997). In 1965, Lotfi A. Zadeh laid the foundation
of fuzzy logic theory. Since then and, especially, after the
announcement of the first fuzzy chips in 1987, the literature on both
theory and applications of fuzzy logic has been growing (Berkan and
Trubatch, 1997).
In a broad sense, fuzziness is the opposite of precision. Everything
that cannot be defined precisely (that is, according to some broadly
accepted criteria or norms of precision) and everything that has no
clearly described boundaries in space or time is considered a bearer of
fuzziness. In a narrow sense, fuzzy logic relates to the definition of
fuzzy sets as proposed by Zadeh (Zimmermann, 1996): sets, the
belongingness to which is measured by a membership function whose
values are between 1 (full belongingness) and 0 (non- belongingness).
According to ‘Principle of Incompatibility’, “as the complexity of a
system increases, human ability to make precious and relevant
(meaningful) statements about its behaviour diminishes until a
threshold is reached beyond which the precision and the relevance
become mutually exclusive characteristics” (Zadeh, 1973, p. 29). It is,
therefore, that fuzzy statements are the only bearers of meaning and
relevance. Zadeh used this principle for extending the applicability of
his fuzzy sets theory and fuzzy logic to the analysis of complex
systems. It is now realized that complex real-world problems require
intelligent systems that combine knowledge, techniques, and
methodologies from various sources. These intelligent systems are

85
supposed to do better in changing environment, and explain how they
make decisions or take actions (Jang et al., 1997). Ecological studies
are known to be complex in nature (Silvert, 1997) and therefore fuzzy
logic seems to be an appropriate technique to solve the dichotomy that
is inherent in sustainability of natural resources
(Andriantiatsaholiniaina, 2001; Cornelissen et al., 2001; Dunn et al.,
1995; Marks et al., 1995).
5.2. Foundations of fuzzy logic
The mathematics of fuzzy sets and fuzzy logic is discussed in detail in
many books (e.g., Lee, 1990; Driankov et al., 1996; Ruspini et al.,
1998; Zimmermann, 1996). Here, we provide only a very basic aspect
of the mathematics of fuzzy logic.
5.2.1. Crisp models
In quantitative sciences where mathematical models are used for
analyzing real-world phenomena, (stochastic) variables are introduced
having a ‘well-defined’ meaning. During their scientific work, the
corresponding scientists apply mathematical tools from calculus, from
the theory of differential equations, from discrete mathematics, from
(vector) algebra, from numerical methods, from (complex) function
theory, and more (van den Berg, 2004). The resulting models offer an
‘idealized’ world, an ‘objective and structured reality’ with, hopefully,
rather general validity. Uncertainty is usually described in
probabilistic and statistical terms like probabilities on crisp events (i.e.
events that do occur or do not occur at all), expected values, statistical
tests (that are either rejected or not rejected), interval estimations, et
cetera (Zimmermann, 1996). Propositions within these approaches are

86
usually supposed to be either true or false (and sometimes unknown).
In line with this way of working as applied in physics, chemistry,
econometrics, and other ‘hard sciences’, the first knowledge-based
systems developed in the community of Artificial Intelligence were
founded on the ‘physical symbol system hypothesis’ expressing that
symbols (and only symbols) can represent states of the world and
statements about the world. Again, the only ‘epistemological
commitments’ allowed for these statements are either true, false or
unknown. The physical symbol system hypothesis has still to be
proven (van den Berg, 2004).
5.2.2. Boolean vs. Fuzzy
Three hundred years B.C., the Greek philosopher, Aristotle came up
with binary logic (0,1), which is now the principle foundation of
Mathematics. It came down to one law: A or not A, either this or not
this. For example, a typical rose is either red or not red. It cannot be
red and not red. Every statement or sentence is true or false or has the
truth-value 1 or 0. This is Aristotle's law of bivalence and was
philosophically correct for over two thousand years (Kosko, 1993).
Two centuries before Aristotle, Buddha, had the belief which
contradicted the black-and-white world of worlds, which went beyond
the bivalent cocoon and see the world as it is, filled with
contradictions, with things and not things. He stated that a rose, could
be to a certain degree completely red, but at the same time could also
be at a certain degree not red. Meaning that it can be red and not red at
the same time. Conventional (Boolean) logic states that a glass can be
full or not full of water. However, suppose one were to fill the glass
only halfway. Then the glass can be half-full and half-not-full.

87
Clearly, this disproves Aristotle's law of bivalence. This concept of
certain degree or multivalence is the fundamental concept, which
propelled Zadeh at the University of California in 1965 to introduce
fuzzy logic. The essential characteristics of fuzzy logic founded by
him are as follows (Abdul Aziz, 1996):
• In fuzzy logic, exact reasoning is viewed as a limiting case of
approximate reasoning,
• In fuzzy logic everything is a matter of degree,
• Any logical system can be fuzzified,
• In fuzzy logic, knowledge is interpreted as a collection of
elastic or, equivalently, fuzzy constraint on a collection of
variables, and
• Inference is viewed as a process of propagation of elastic
constraints.
The third statement hence, defines Boolean logic as a subset of Fuzzy
logic.
5.2.3. Towards soft computing
It is clear from history that the hard sciences have been and still are
quite successful in many areas. Based on this success, they have
obtained a strong and predominant position and many scientists
working in this field seem to believe that their approach of crisp, two-
valued logical, precise mathematical modeling where uncertainty is
modeled within a probabilistic, statistical framework, is the one and
only true, applicable approach (van den Berg, 2004).
88
For several reasons, however, like ‘irrelevance’ and ‘complexity’, one
may doubt whether hard computing is always the right tool.
Considering ‘Principle of Incompatibility’, we try to answer the
following series of questions related to problems with increasing
complexity. They may convince you of the validity of Zadeh’s
principle: (1) How sustainable is a rangeland? (2) Which measures are
important for a sustainable rangeland management? (3) How much is
the stocking rate of a sustainable rangeland? (4) How much is its
plantation density? (5) How much annual rainfall is needed in a
sustainable rangeland? (6) How many pastoralists’ families can live
in?
Another, every-day, example related to the irrelevance of information
may also be illustrative. This example shows that offering some short,
incomplete information can be much more relevant than
communicating an extensive and precise message: if you are
sauntering on a road and a car is approaching you with high speed, the
warning “A car of length 4.65 m and height 1.54 m with mass 1348.7
kg is approaching you with a speed of 56.645 kmph” is probably
much less relevant than the quite fuzzy cry: “Look Out!!”. From the
context, the saunterer will probably immediately understand the
meaning of this message and undertake appropriate action (by running
away).
In the world of Artificial Intelligence, similar lessons have been
learned. While, implementing systems based on ideas like the above-
mentioned physical symbol hypothesis, problems arose related to the
modeling of the likeliness of a certain conclusion and to the lack of
robustness and flexibility. Apparently, the tools as made available by
the hard sciences also have their limitations when trying to apply

89
‘intelligent techniques’. In several cases, it has been shown that
alternative approaches with fuzzy or other ‘vague’ ingredients work
better. Successful fuzzy modeling projects exist since 1975 on topics
like automatic control, printed character recognition, target selection
for marketing purposes, financial modeling, SD, and more (van den
Berg, 2004).
5.2.4. Towards fuzzy sets
Let U be a collection of objects u which can be discrete or continuous.
U is called the universe of discourse and u represents an element of U.
A classical (crisp) subset C in a universe U can be denoted in several
ways like, in the discrete case, by enumeration of its elements: C =
{u1, u2 ,… , uP} with ∀i: ui ∈ U. Another way to define C (both in the
discrete and the continuous case) is by using the characteristic
function χF: U→{0, 1} according to χF (u) = 1 if u ∈ C, and χF (u) =
0 if u ∉ C. The latter type of definition can be generalized in order to
define fuzzy sets. A fuzzy set F in a universe of discourse U is
characterized by a membership function µF which takes values in the
interval [0, 1] namely, µF: U→[0, 1].
5.2.5. Operators on fuzzy sets
Let A and B be two fuzzy sets in U with membership functions µA and
µB, respectively. The fuzzy set resulting from operations of union,
intersection, etc. of fuzzy sets are defined using their membership
functions. Generally, several choices are possible:

90
Union: The membership function BA∪
µ of the union A∪B can be
defined by )}(),(max{: uuu BABA µµµ =∀ ∪ or by
).()()()(: uuuuuBABABA
µµµµµ −+=∀∪
Intersection: The membership function BA∩
µ of the union for all
A∩B can be defined by )}(),(min{: uuu BABA µµµ =∀ ∩ or by
).().(: uuu BABA µµµ =∀ ∩
Complement: The membership function of the
complementary fuzzy set Ac of A is usually defined by
)(1)(: uuu AAc µµ −=∀ .
5.2.6. Linguistic variables
Fuzzy logic enables the modeling of expert knowledge. The key
notion to do so is that of a linguistic variable (instead of a quantitative
variable) which takes linguistic values (instead of numerical ones).
For example, if stocking rate (SR) in a rangeland is interpreted as
linguistic variable, then its linguistic values could be one from the so-
called term-set T(SR) = {low, medium, high} where each term in
T(SR) is characterized by a fuzzy set in the universe of discourse, here,
e.g., U = [0, 5]. We might interpret low as a “stocking rate of less than
approximately 1.5 aum/ha”, medium as a “stocking rate close to 2
aum/ha”, and high as a “stocking rate of roughly more than 2.5
aum/ha” where the class boundaries are fuzzy. These linguistic values
are characterized by fuzzy sets whose membership functions are
shown in Fig. 5.1.

91
3 1
2
medium high low
5 0
1
SR (aum/ha)
µi(SR)
Fig. 5.1. Diagrammatic representation of the linguistic variable stocking rate in a rangeland having linguistic values low, medium, and high defined by a corresponding membership function.
5.2.7. Knowledge representation by fuzzy IF-Then rules
Fuzzy logic is a scientific tool that permits simulation of the dynamics
of a system without a detailed mathematical description. In an expert-
driven approach, knowledge is represented by fuzzy IF-THEN
linguistic rules having the general form
where x1, … , xm are linguistic input variables with linguistic values
A1, … , Am respectively and where y is the linguistic output variable
with linguistic value B.
To illuminate we consider animal unit and plantation density as the
principal factors for having equilibrium. Then the relevant fuzzy rules
could be:
- IF amount of animal unit is low AND plantation density is
poor THEN equilibrium is medium.
- IF amount of animal unit is medium AND plantation density
is poor THEN equilibrium is weak.
- IF amount of animal unit is high AND plantation density is
poor THEN equilibrium is very weak.
, is THEN is AND is AND is If 2211 ByAxAxAx mmΛ

92
5.2.8. Architecture of fuzzy systems
Fuzzy Inference Systems or, shortly, Fuzzy Systems (FSs) usually
implement a crisp input-output (IO) mapping consisting of basically
four units, namely
• A Fuzzifier transforming crisp inputs into the fuzzy domain,
• A Rule Base of fuzzy IF-THEN rules,
• An Inference Engine implementing fuzzy reasoning by
combining the fuzzified input with the rules of the Rule
Base,
• A Defuzzifier transforming the fuzzy output of the Inference
Engine to a crisp value (Fig. 5.2).
Fig. 5.2. Building blocks of a Fuzzy Inference System (FIS).
In some practical systems, the Fuzzifier or the Defuzzifier may be
absent namely in cases where fuzzy input data are available or the
fuzzy system output can be interpreted directly in linguistic terms.
Corresponding "approximate reasoning techniques" are available (see,
e.g., Jang et al., 1997).
5.2.9. Fuzzy reasoning
Probably, the hardest part to understand is the precise way fuzzy
reasoning can be implemented. An extensive discussion of this topic is
outside the scope of this dissertation so we limit ourselves here to

93
present just the basic idea. Classical logic is our starting point using
the classical reasoning pattern ‘modus ponens’:
Given fact “x is A” and rule “IF x is A, THEN y is B”, we conclude “y
is B”.
“Applying fuzzy reasoning, classical modus ponens can be
generalized to an ‘approximate reasoning’ scheme of type.”
Given fact “x is A' ” and rule “IF x is A, THEN y is B”, we conclude
that “y is B' ”.
Here, the assumption made is that the closer A' to A, the closer will B'
be to B. It turns out that especial combinations of operations on fuzzy
sets like ‘max-min’ and ‘max-product’ composition can fulfill this
requirement. The complete fuzzy reasoning in a FS can be set up as
follows:
1. The fuzzification module calculates the so-called ‘firing
rate’ (or degree of fulfillment) of each rule by taking into
account the similarity between the actual input A' defined by
membership function µA'(x) (and in case of a crisp input xp
defined by the value µA(xp) and the input A of each rule
defined by membership function µA(x).
2. Using the firing-rates calculated, the inference engine
determines the fuzzy output B' for each rule, defined by
membership function µB'(y).
3. The inference engine combines all fuzzy outputs B' into one
overall fuzzy output defined by membership function µ(y).
4. The defuzzification module calculates the crisp output yp
using a defuzzification operation like ‘centroïd of gravity
(area)’.
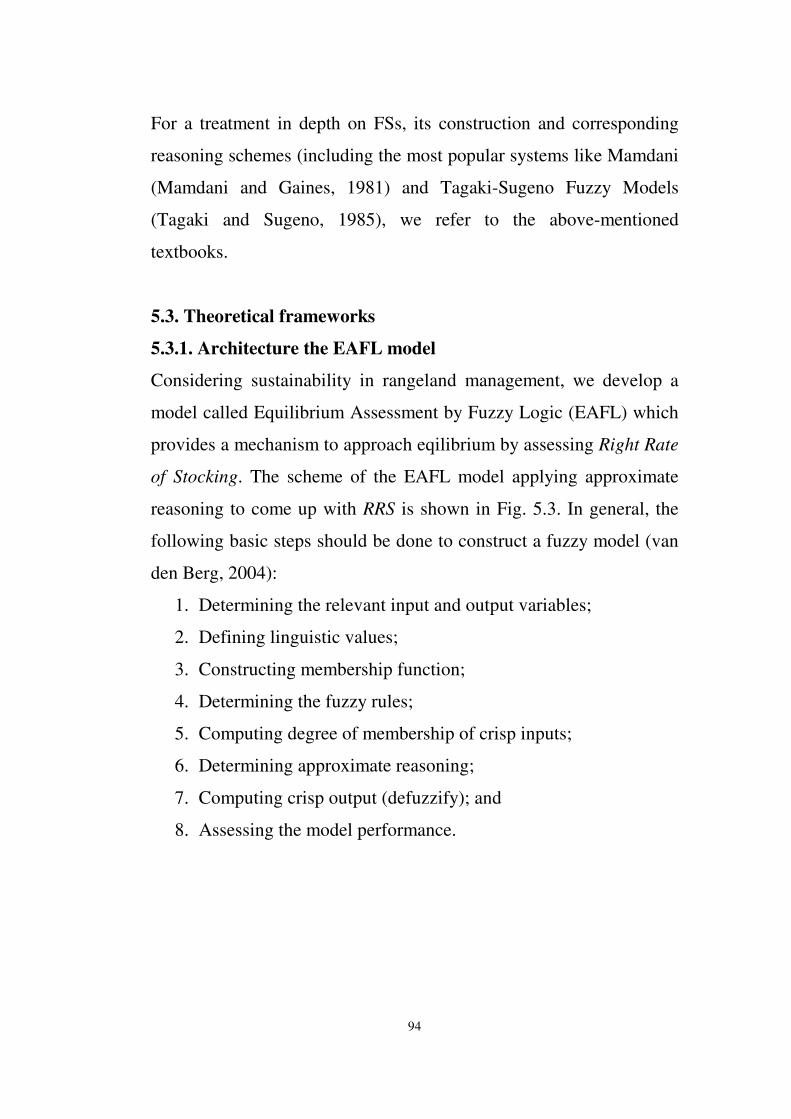
94
For a treatment in depth on FSs, its construction and corresponding
reasoning schemes (including the most popular systems like Mamdani
(Mamdani and Gaines, 1981) and Tagaki-Sugeno Fuzzy Models
(Tagaki and Sugeno, 1985), we refer to the above-mentioned
textbooks.
5.3. Theoretical frameworks
5.3.1. Architecture the EAFL model
Considering sustainability in rangeland management, we develop a
model called Equilibrium Assessment by Fuzzy Logic (EAFL) which
provides a mechanism to approach eqilibrium by assessing Right Rate
of Stocking. The scheme of the EAFL model applying approximate
reasoning to come up with RRS is shown in Fig. 5.3. In general, the
following basic steps should be done to construct a fuzzy model (van
den Berg, 2004):
1. Determining the relevant input and output variables;
2. Defining linguistic values;
3. Constructing membership function;
4. Determining the fuzzy rules;
5. Computing degree of membership of crisp inputs;
6. Determining approximate reasoning;
7. Computing crisp output (defuzzify); and
8. Assessing the model performance.

95
Fig. 5.3. Scheme of development of the EAFL model applying approximate reasoning to
assess the Right Rate of Stocking (RRSp) based on the inputs values (I1p, I2p, and
I3p)2 (adapted from Cornelissen, 2003, p.51).
1. To simplify the model, we have shown three inputs, however, the number can be higher or
lower. 2. The grey color notifies the fuzzy parts of the model.
Input3 1 Input2 Input1
L.V.(I3) L.V.(I2) L.V.(I1)
Determining inputs
Defining linguistic values
µi(I1), µj(I2), µk(I3)
Constructing membership functions
µi(I1p), µj(I2p), µk(I3p)
IF – THEN rules Determining fuzzy rules
Determining approximate reasoning
Computing degree of membership of crisp inputs
Step 1
Step 5
Step 6
Step 4
Step 3
Step 2
Given: µi(I1p), µj(I2p), µk(I3p) ; derive:µi(RRSp)
Computing crisp output (defuzzy) RRSp = COG µ(RRS)
Assessing the model performance
Step 7
Step 8 Assessing & fine-tuning

96
5.3.2. Architecture of multi-fuzzy model
While fuzzy specialists usually use homogeneous experts’ knowledge
to construct fuzzy models, it is much more difficult to deal with
knowledge elicited from a heterogeneous group of experts. They
usually try to elicit and deal with homogenous experts’ knowledge and
hardly refer to heterogeneous experts. Experts’ knowledge, however,
is influenced by individual perspectives and goals (Ford and Sterman,
1998). This issue especially holds in the area of the sustainable
rangeland management. One way to deal with the diversity of
opinions is to develop a fuzzy system for all experts and to combine
all these so-called primary systems into one multi-fuzzy model. When
constructing a fuzzy model, an important consideration is how to deal
with differences in personal experience. The effect of these
differences is assumed to be smaller in a homogeneous (e.g. only
pastoralists) than in a heterogeneous group (e.g. different experts). As
experts have graduated in different disciplines, they may come to a
different evaluation of sustainable rangeland management than, for
example, pastoralists. Such differences, however, are not necessarily
disadvantageous. A heterogeneous group of experts, can be an
advantage over a homogeneous group through considering all
knowledge and, compensating for dissenting points of view by more
liberal ones (Cornelissen, 2003). However, the heterogeneity in
experts’ knowledge makes unclear decisions in rangeland
management for reaching equilibrium in practice.
Here, based on three Mamdani-type of fuzzy models (three EAFL
models), we have designed a specific multi-fuzzy model (Fig. 5.4) to
assess the final Right Rate of Stocking (RRSf). The following basic
steps are also suggested to enable to calculate the final crisp output:

97
1. Constructing several EAFL models (described in the last
section); based on the experts’ knowledge resulting from the
semi-structured interviews (described in the next chapter);
2. Computing, for several typical cases, the crisp primary outputs
of the models and comparing them; and
3. Combining different outputs using a voting process and
calculating the final crisp output.
The architecture of the multi-fuzzy model is depicted in Fig. 5.4.

98
Ii
Ii
Ii
Ii
Ii
Ii
Ii
Ii
Ii
Fu
zzif
ier
1
Fu
zzif
ier
2
Fu
zzif
ier
3
Rules Base (ni)
Rules Base (ni)
Rules Base (ni)
Inference Engine1
Inference Engine 2
Inference Engine 3
Defu
zzif
ier
1
Defu
zzif
ier
2
Defu
zzif
ier
3
RRSi
RRSi
RRSi
Vo
tin
g P
roc
es
s
Fig. 5.4. Architecture of the multi-fuzzy model to deal with different experts’ knowledge. The primary outputs RRSi (i = 1,2,3,…n) of three Mamdani fuzzy systems having different input variables and different number of rules base (ni), are combined into output value RRSf using a weighted voting process to calculate final output.
Mo
de
l 1
M
od
el 3
M
od
el 2
W1
W2
W3
Mamdani fuzzy systems
RRSRRSRRSRRSffff = = = = i
i
i RRSw∑=
3
1

99
To apply the above holistic approach, we conducted a multiple case
study in three different areas of the Fars province in Southwest Iran.
In the next chapter, we give some details concerning the research
methodology of this study.

100
Chapter Six
Research Method
6.1. The population of study
It can be stated that the majority of the Iranian people were engaged in
pastoral subsistence and animal breeding for a long time (Sogol, No
date). One third of the total area in Iran (164 million hectares) is
unusable for any purpose other than pastoralism (Emadi, 2003).
Today, there are over 1.5 million nomads in Iran. Many of nomad
tribes such as the Kurds, Bakhtiyaris (Bactrians), Lors, Guilaks, and
the Baloochs are descendants of the original invaders who came from
Central Asia to settle in the Iranian plateau (Iran Rozaneh, 2003).
Most of the tribes of Central Iran are pure Aryan, while others such as
Khoozestan and Khorasan's Arabs, Qashqai, Turkaman (decendants of
Mongols), Shahsavan and Afshar's tribes in Azarbaijan had ancestors
who passed through Iran (Travel Explorations, 2004).
By 1920, nomadic pastoral tribes constituted over a quarter of the
Iranian population. Their number declined sharply as a result of forced
settlement between 1920s and 1930s. Continued pressures as well as
the lure of the cities and settled life have resulted in a further sharp
decline since 1960s (Iran Rozaneh, 2003).
A public census conducted on the Iranian nomadic tribes in 1987 puts
the number of tribes in 96 tribes and 547 clans consisting of 180,223
families or 1,152,099 people (597,774 men and 554,325 women).
Holding the results of next public census, some 96 independent tribes

101
and 547 clans have been registered in Iran in 1988. Iranian tribesmen
have been scattered throughout the country, mainly in the provinces of
East and West Azarbaijan, Kordestan, Gorgan and Gonbad, Lorestan,
Fars, Kerman, Khorasan, and Sistan and Balouchestan. In 1991, public
census on the Iranian population does not mention to the tribesmen. It
rather mentions urban and rural residents and non-resident people. It is
not known whether the non-residents, as mentioned in 1991, are the
same as tribesmen (Namey-e-Otaq-e-Bazargani, 1996).
According to the Statistic Centre of Iran in 1996, the number of non-
residents is approximately 2,110,406. Though the tribes and clans are
scattered in distinct areas of the country, this in itself denotes the
influence of the central rule on such realms. At times, due to political
reasons, tribes were compelled to migrate to other regions. Such an
example can be Kordestan's Kurds who migrated to the territory in
Northern Khorasan. But it can be stated that each tribe withheld its
own cultural and social traditions wherever they resided; such as
Shahsavan in Northern Azarbayjan and Kordestan's Kurds, even so,
between Qashqaie and Bakhtiyari's tribes. Historical surveys reveal
that some of the Iranian tribes have a common ancestor. A large
portion of the tribes in Central and Western Iran has Lor dialect.
These are divided in two groups; Lor-e-Bozorg (Greater Lors) and
Lor-e-Koochak (Smaller Lors). Branches of these tribes were
decamped to the mountainous regions in Central Iran. Tribes such as
the Bakhtiyari, Kohgilooyeh, Mamasani and Boyer Ahmad are of this
group, and yet are completely distinct from each other. During the
Safavid era, Afshar's tribes were decamped from Khorasan to
Azarbayjan, and still another group to Kohgilooyeh and Khoozestan.
By the Fars conquest tribes leaded Aqa Mohammad Khan Qajar in

102
1206 A.H., 12,000 families that proved rebellious were decamped
from Shiraz to Tehran. During Nasereddin Shah's regime, Hezareh's
tribe was decamped to Khorasan, but due to unrest and turmoil, was
compelled to scatter in smaller groups. Formerly, this dispersion
depended solely on the acquirement of pastoral vicinities. But
gradually this gained a political aspect, thus conserving limits and
distinctions as to the jurisdiction of tribes. Currently, the tribes are
dispersed in the following regions in Iran (Sogol, No date):
• North and Northwestern; the provinces of Golestan and
Khorasan - comprising of various clans such as the Turkaman
tribes.
• Northwestern; Shahsavan, Arasbaran, Afshar-e-Qezelbash,
Garahgozloo and various clans of Khamseh's tribe. These are
within the limits of Eastern and Western Azarbayjan, Hamadan,
Ardabil and Zanjan.
• Western; comprising of those having a Kurdish dialect, Kalhor,
Sanjabi, Gurkani and... They reside in the provinces of
Kermanshah, West Azarbayjan and Kordestan.
• Southwest and Southern; comprising of various clans such as
Khamseh, Qashqaie, Arab and Lor-e-Koochak which are settled
in the provinces of Fars, Khoozestan and Lorestan.
• Southeastern; comprising Baloochi tribes residing in the
province of Sistan and Baloochestan.
• Center; these are namely Bakhtiyari, Boyer Ahmad, Doshman
Ziyari, Charam, Bavi, Bahmehyi, Tayebi, Mokran and... which
reside within the limits of the provinces of Chahar Mahal and
Bakhtiyari, Khoozestan, Kohgilooyeh and Kerman.

103
• Eastern and Northeastern; which comprising of various clans
settled in the province of Khorasan.
As noticed, in South Iran, especially the Fars province is rich in
pastoral groups usually specialised in sheep and these are described in
a number of monographs (e.g. Barfield, 1981; Barth, 1961; Bates,
1973; Black-Michaud, 1986; Irons, 1975)1. For centuries, the Fars
province has been a multi-ethnic region, in which tribal and pastoral
nomadic groups compose a large part of the population as follows
(Qashqai.net., 2003): Qashqaie's tribe consists of the following clans:
Darreh Shouri (5,265 families), Kashkooli Bozorg (4,862 families),
Shesh Boluki (4,350 families), Kashkooli Kuchak (650 families),
Qaracheh (430 families), Safi Khani (235 families), Rahimi (370
families), Farsi Madan (1,505 families), and Amaleh (5,397 families).
The above-mentioned pastoral nomads move - with their herds of
sheep and goats - between summer rangelands in the higher elevations
of “Zagros” in North of Shiraz and winter rangelands at low
elevations in South of Shiraz. Their migration routes are considered to
be among the longest and most difficult in all Iranian pastoral tribes
(Oldcarpet, 2005).
6.2. The area of study
In this study, we have focused on three different regions of the Fars
province in Southwest Iran: first, Cheshme-Anjir from Shiraz county
which covers 2575 hectares, 3200 livestock and 12 pastoral families;
1. It should also be noted that a significant body of literature on pastoral nomadism such as the
works of Barth (1961); Beck (1986); Digard (1990); Fazel (1971); Irons and Dyson-Hudson (1972); Mortensen (1993); Swee (1981) and Tapper (1979, 1983 and 1997) contributed to the development of better understanding of the socio-economic organization and migratory patterns of the Iranian tribal society.

104
second, Morzion from Sepidan county having 2000 hectares, 1570
livestock and 19 pastoral families; and third, Kheshti from Lamerd
county with 6900 hectares, 3804 livestock and 20 pastoral families.
The regions have different climatic and geographical conditions
(Table 6.1).
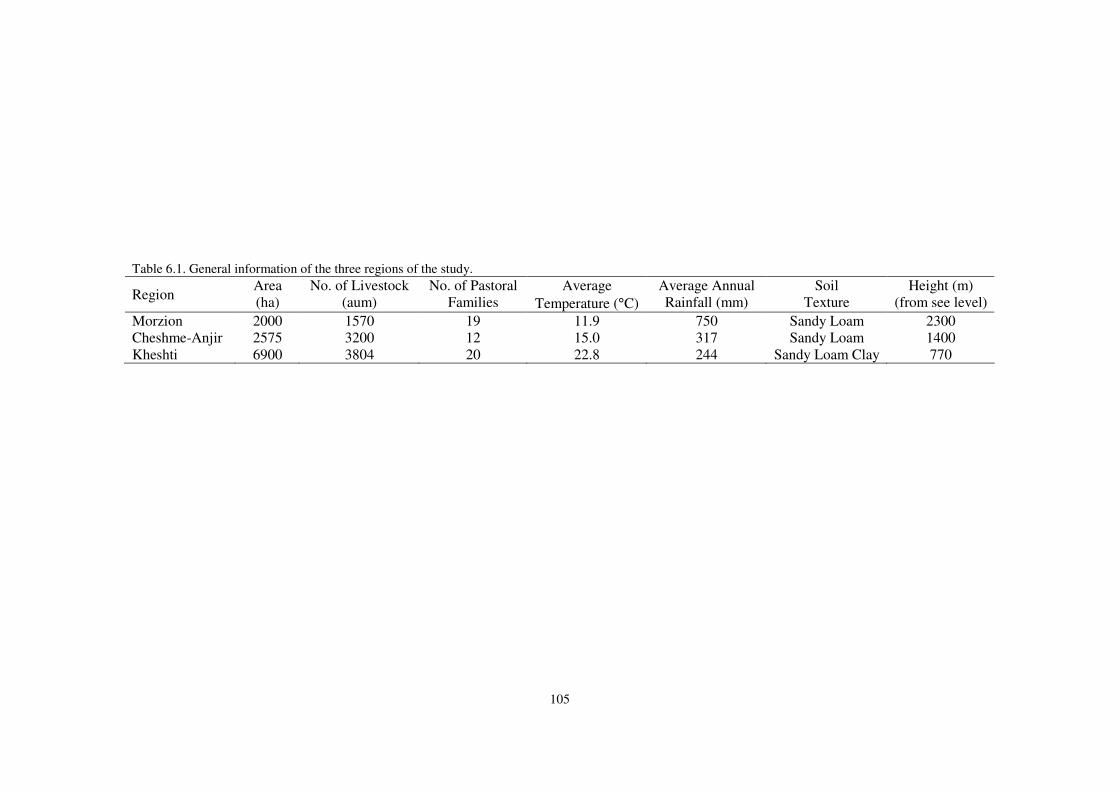
105
Table 6.1. General information of the three regions of the study.
Region Area (ha)
No. of Livestock (aum)
No. of Pastoral Families
Average
Temperature (°C)
Average Annual Rainfall (mm)
Soil Texture
Height (m) (from see level)
Morzion 2000 1570 19 11.9 750 Sandy Loam 2300 Cheshme-Anjir 2575 3200 12 15.0 317 Sandy Loam 1400 Kheshti 6900 3804 20 22.8 244 Sandy Loam Clay 770

106
The main reason for selecting these regions was the management
activities done by the Natural Resources Administration of Fars
Province (NRAFP) to balance livestock number and rangeland
conditions in these regions.
6.3. Research method
There is a growing body of opinion that argues that qualitative
research, including the case study, has an important place among the
variety of research methods available to the researcher. ‘Yet the
traditional case study still remains firmly within the domain of the
qualitative researcher’ (Tesch, 1990; p. 69).
Burns (1994) has argued that the case study, because of its intense
nature and its ability to generate rich subjective data, may generate
more intensive research. The case study allows for in-depth probing of
phenomena, as Burns stated:
...typically involves the observation of an individual unit...
to qualify as a case study, it must be a bounded system, an
entity in itself. A case study should focus on a bounded
subject/unit that is either very representative or extremely
atypical (Burns, 1994; p. 312).
Many approaches have been taken in terms of the development of case
studies. Tesch (1990) argued that a case study is an ‘intensive and
detailed study of one individual or a group as an entity, through
observation, self-reports, and any other means’ (Tesch, 1990; p. 39).
Others see the case study in more elaborate terms.
The case study is judged to be appropriate for this study somehow it
would allow in-depth interviews of issues that are important in
sustainable rangeland management. At the same time, it would impose
structure on the research and allow for judgment (Niblo and Jackson,

107
1999). Generally, case studies are the preferred strategy when "how"
or ‘why" questions are being posed, when the investigator has little
control over events, and when focus is on a contemporary
phenomenon within some real-life context. In more precise definition,
a case study is an empirical inquiry that: (1) investigates a
contemporary phenomenon within its real-life context; when (2) the
boundaries between phenomenon and context are not clearly evident;
and in which (3) multiple sources of evidence are used (Yin, 1989; p.
13).
This research method explores the problems for the qualitative
researcher in trying to explore a hidden phenomenon. The questions
should be asked in depth and be probing (Niblo and Jackson, 1999).
‘These “how” and “why” questions, capturing what researcher is really
interested in answering, lead him\her to the case study as the
appropriate strategy...’ (Yin, 1989; p. 30). That is to say, the
researcher has to leave room for material and information to emerge
during the course of the research project. Nevertheless, Yin also
argued that every exploration still should have a purpose. Some basic
skills that need to be mastered by case studier are (Yin, 1989):
• being able to ask questions,
• interpreting the answers,
• being a good "listener",
• being adaptive and flexible,
• having a firm grasp of the issues being studied, and
• being unbiased by preconceived notions.

108
6.3.1. Multiple-case study
The specific approach implemented in this study is a multiple-case
study in the framework of an exploratory research design to find
sustainability indicators in rangeland management in the views of
selected experts.
For each region of the research1, a case study involving both
observation and interviews with pastoralist’ experts was conducted.
The implementation of multiple-case studies allowed us to gather
more evidences and to make comparisons between regions with
different socio-economic and environmental conditions. The approach
is open-ended in that it allows researchers to go as far as possible
before exhausting the sources of information. Yin has discussed the
difference between ‘replication, not sampling logic, for multiple-case
studies’ (Yin, 1989; p. 53). Burns (1994; p. 316) also elaborated on
the concept of replication:
“A collection of case studies, which is called the multiple-
case study, is not based on the sampling logic of multiple
subjects in an experimental design. If the cases are not
aggregated it is convenient to apply the term case study to
such an investigation.”
For each region, then, an extensive case study was conducted which
provided the materials of the present research. The first step involved
the preparation of the detailed case studies through procedures of
direct observation and extensive in-depth interviewing and second,
abstracting from observations and interview materials in each of these
which are drawn upon for the explication of material relevant to the
questions which guided this research.
1. Since, we will finally estimate the RRS for each "pasture" in the regions, the pasture can be
considered as the case or the unit of analysis of this study.

109
6.4. Sampling method
Since fuzzy models usually use the expert knowledge, it is important
to identify an expert properly. For example, there are some differences
between stakeholders and experts (Cornelissen, 2003) and also
differences between experts and those people who are selected to
interview based on a few personal contacts, or on the basis of
availability during a short-term period (Davis and Wagner, 2003). In
this dissertation, an expert is defined as a person whose knowledge in
a specific domain (e.g. equilibrium in a rangeland) is obtained
gradually through a period of learning and experience (Bromme, 1992
and Turban, 1995 in Cornelissen, 2003).
To call a holistic approach, both homogeneous and heterogeneous
experts were selected based on the ‘socio-metric’ method. According
on this method, concerned information is obtained directly from key
informant experts who are nominated by the majority of stakeholders
(Ortega, 2002). Totally, in this study, based on several discussions
with the stakeholders of NRAFP at the first round of study, 9 experts
in three different categories nominated by them were interviewed
(Table 6.2).
Table 6.2. Some personal characteristics of 9 nominated experts at the first round of study.
Pastoralist experts
Expert no. Age (yr.) Education level Discipline/Job Experience (yr.)
1 55 Diploma Pastoralist All his life 2 63 Reading & Writing Pastoralist All his life 3 65 Reading & Writing Pastoralist All his life
Administrative experts
Expert no. Age (yr.) Education level Discipline Experience (yr.)
1 33 M.Sc. Desert Management 8 2 45 M.Sc. Animal Husbandry 18 3 48 M.Sc. Rural Development 10 4 47 M.Sc. Admin. Management 16
Researcher experts
Expert no. Age (yr.) Education level Discipline Experience (yr.)
1 42 Ph.D. Animal Husbandry 8 2 48 Ph.D. Rage management 10

110
During three rounds of data collection in a period of 18 months, by
conducting 9 main interviews and 21 follow-ups, we were led to
remove one administrative expert and both two researchers by
discounting others or even themselves1. In other words, they
eliminated others or even themselves and pointed to the rest who are
more expertized in this field.
It should be noted again that the experts who have different personal
characteristics are expertized differently within and between groups
according to their last and present background. NRAFP, for instance,
has hired a large number of experts who hold in bachelor and master
degrees in different disciplines of rangeland management.
6.5. Data collection and applied techniques
In order to construct a multi-fuzzy model, several semi-structured
interviews were held with elites2 who are called, in fuzzy studies,
experts. As Jones (1985) described, a semi-structured interview is:
• a social interaction between two people (the researcher and one
of his\her experts);
• in which the interviewer (researcher) initiates and varyingly
controls the exchange with the respondents (the experts);
• for the purpose of obtaining quantifiable and comparable
information (defining sustainability indicators); and
• relevant to an emerging or stated hypothesis (if-then rules for
making the balance between the different levels of the
indicators).
1. See appendix 1. 2. Elite interview conducts with prominent people. This technique provides valuable information
which can be obtained because the position of interviewees; Elite also can provide overall view his/her (Marshall and Rossman, 1995).

111
The entire script was written ahead of time, with an eye to an almost
total standardization of the interview from one expert to the next. The
standardized, open-ended interview was used when it was important to
minimize the variation of the questions posed to interviewees. This
helps to reduce the bias that can occur from having different
interviews with different experts (Patton, 1987). The open-ended
questionnaire was used to conduct interviews included a set of
questions which were carefully worded and arranged for the purpose
of taking each expert through the same sequence and asking him the
same questions with essentially the same words (Gamble, 1989). More
specifically, the main questions were conducting the experts i) to
introduce the main indicators of sustainability in range management,
ii) to define the labels (linguistic values), iii) to determine the fuzzy
ranges of each value label, and iv) to express the fuzzy if-then rules.
6.5.1. Data analysis
The qualitative techniques were used to analyze the elicited
knowledge of experts. The main techniques included open and axial
coding to find the main indicators (Strauss and Corbin, 1990). The
Matlab Fuzzy Toolbox (version 7) was used to construct the fuzzy
model. Finally, to deal with different experts’ knowledge, we used
Microsoft Excel 2003. More details and extensive discussions
regarding data analysis are given in the next chapter.

112
Chapter Seven
Fuzzy Analysis and Discussion
This chapter presents the analysis of data using fuzzy logic and an
extensive related discussion. To come up with a holistic approach in
the area of sustainable rangeland management, based on the
theoretical frameworks presented in Chapter 5, we will first construct
a fuzzy model called EAFL and explain its eight steps, and second, to
deal with different experts’ knowledge, we will develop a multi-fuzzy
model and introduce voting methods including (un)supervised
techniques.
7.1. Development the EAFL model
7.1.1. Determining the relevant input and output variables
Equilibrium between stocking rate and plantation density is difficult to
define but many experts recognize that it is a function of three major
components (inputs) which are:
� Stocking Rate in a pasture (SR),
� the amount of Plantation Density per hectare (PD), and
� the Number of Pastoralists in a pasture (NP).
7.1.2. Defining linguistic values
In the EAFL model, the linguistic values of each variable are
recapitulated in Table 7.1.

113
7.1.3. Constructing membership functions
Based on Pedrycz (1994; 2001) the experts' experience and knowledge
can be considered as a guide to define all membership functions which
in this study none of them are expressed continuous values. Therefore,
both triangular and shoulder shapes were suggested. The suggestion
was based on special range of values, which are stated by the experts
for each linguistic value. All experts proposed the left-shoulder shape
for the smallest and the right-shoulder for the largest linguistic values
and the triangular for the rest (Fig. 7.1).
Table 7.1. Linguistic values used in the EAFL model.
Variable Linguistic values
Stocking Rate (SR) low, medium, high
Plantation Density (PD) poor, acceptable, rich
Number of Pastoralists (NP) low, medium, high

114
70 50 55
medium high low
0
1
SR (aum/km2)
a µi(SR)
b
50 10
30
acceptable rich poor
0
1
PD (tn/km2)
µj(PD)
c
0.5 0.1
0.3
medium high low
0
1
NP (p/km2)
µk(NP)
Fig. 7.1. Membership functions for a) Stocking Rate, b) Plantation Density, and c) Number of Pastoralists 1
7.1.4. Determining the fuzzy rules
In this study, the rules are expressions of the role of interdependencies
among factors of equilibrium, which were elicited from pastoralists’
1. While most of the ranges were elicited by interview, the rest were calculated by means.

115
experts by interviews. They state different dimensions of
sustainability in range management. To determine the overall
equilibrium, the rule base needs 33 = 27 rules since we have 3
linguistic values and 3 linguistic variables (SR, PD and NP), which are
stated by pastoralists’ experts. The complete rules base used to
construct the overall experts’ knowledge base are summarized in
Table 7.2 for different linguistic values. All rules-base was elicited by
interviews and all pastoralists’ experts were agreed at the end with
several follow-ups.
1. Considering long-term consequences which is certainly back to "overgrazing", none of
pastoralists express "high" as the linguistic value of the output variable (RRS).
Table 7.2. The complete rules base (33 = 27) used to construct the overall experts’ knowledge base.
Rule r
if Stocking Rate
is
and Plantation Density
Is
and Number of Pastoralists
is
Then Stocking Rate
must be1
1 low Poor low Low
2 low Poor medium Low 3 low Poor high low 4 low Acceptable low low 5 low Acceptable medium low
6 low Acceptable high low 7 low Rich low medium 8 low Rich medium medium 9 low Rich high medium
10 medium Poor low low
11 medium Poor medium low 12 medium Poor high low 13 medium Acceptable low medium 14 medium Acceptable medium low 15 medium Acceptable high low
16 medium Rich low medium 17 medium Rich medium medium 18 medium Rich high medium 19 high Poor low low
20 high Poor medium low 21 high Poor high low 22 high Acceptable low medium 23 high Acceptable medium medium 24 high Acceptable high low 25 high Rich low medium 26 high Rich medium medium 27 high Rich high medium

116
7.1.5. Computing degree of membership of crisp inputs
We present a numerical example illustrating how the EAFL model can
compute degree of membership of crisp inputs. Suppose that
information concerning the input variables is expressed numerically as
follows: SR = 75 (aum/km2) (Fig. 7.2a), PD = 35 (tn/km2) (Fig. 7.2b),
and NP = 0.4 (p/km2) (Fig. 7.2c).
70 50 55
medium high low
0
1
SR (aum/km2)
a µi(SR)
75
50 10
30
acceptable rich poor
0
1
PD (tn/km2)
35
0.5
0.75
0.25
40
b µj(PD)
c
0.5 0.1
0.3
medium high low
0
1
NP (p/km2)
0.4
0.5
µk(NP)
Fig. 7.2. Linguistic values and fuzzification of crisp inputs for a) Stocking Rate, b)
Plantation Density, and c) Number of Pastoralists.

117
Fuzzification yields the following inputs for the inference engine:
Input 1: SR is high with membership grade µh(SR) = µh(75) = 1;
Input 2: PD is acceptable with membership grade
µa(PD) = µa(35) = 0.75
and rich with membership grade
µr(PD) = µr(35) = 0.25;
Input 3: NP is medium with membership grade
µm(NP) = µm(0.4) = 0.5
and high with membership grade
µh(NP) = µh(0.4) = 0.5.
7.1.6. Detemining approximate reasoning
Now, we compute the degree to which each rule is applicable to the
input. The only consistent rules are those in which SR is high, PD is
either acceptable or rich, and NP is either medium or high. These are
rules 23, 24, 26, and 27 of Table 7.2. The conclusions of these rules
are expressed as follows:
Rule 23: If SR is high with membership grade 1 and PD is acceptable
with membership grade 0.75 and NP is medium with membership
grade 0.5, then the output SR must be low with membership grade:
µPREMISE23 = min ({1, 0.75, 0.5}) = 0.5
With the same calculation:
µPREMISE24 = min ({1, 0.75, 0.5}) = 0.5
µPREMISE26 = min ({1, 0.25, 0.5}) = 0.25
µPREMISE27 = min ({1, 0.25, 0.5}) = 0.25

118
For the remaining rules of the rule base, we have µPREMISEr = 0. We
observe that rules 23, 24 and 27 assign the same linguistic value low
to SR with membership degree 0.5, 0.5 and 0.25 respectively. Now,
based on degree of membership of inputs value, the fuzzy outputs
µB'(RRS) of each rule are calculated and combined into one fuzzy
output µ(RRS) (Fig. 7.3).
7.1.7. Computing crisp output (defuzzify)
Finally, we use “Center Of Gravity” (COG) for defuzzifying (Jang et
al., 1997; Zimmermann, 1996) yielding the RRS. In the example, the
RRS was assessed by using the Matlab Fuzzy Toolbox (version 7)
yielding RRS = 32.9 (aum/km2) = 0.329 (aum/ha) (Fig. 7.3).
Fig. 7.3. Graphical illustration of the EAFL model for approximate reasoning and defuzzification. Approximate reasoning starts with a two-steps process comprising the implication process and the aggregation process yielding the overall fuzzy output µ i(RRSp) based on the fuzzy conclusions of the inputs (SRp, PDp and NPp) for each rule. Finally, the center of gravity method divides the area under curve into two equal sub-areas hereby determining the crisp output value: RRSp = 32.9 (Fuzzytoolbox in Matlab 7).
Rule 23
Rule 24
Rule 26
Rule 27

119
7.1.8. Assessing the model performance
Having available a large set of input-output data, the performance of
the system can be evaluated and parameters of the system can be fine-
tuned in order to achieve a low ‘generalization error’. In such a data-
rich situation, a training set is used to fit the models, a validation set is
used to estimate the prediction error for model selection and a test set
is used for assessing the generalization error of the final model chosen
(Hastie et al., 2001). If, like in our case, no large data sets are
available, the best way to assess model performance and fine-tune the
system is based on experts’ judgements (Davis and Wagner, 2003). By
using different real inputs and observing crisp outputs, judgement is
possible by experts. They can assess several scenarios and conclude
whether the performance of the model is (not) reasonable.
In our case, a small set of real input-output data appeared to be
available. This data set was used to describe the behaviour of the
EAFL model (Table 7.3).
Table 7.3. Assessing the performance of the EAFL model by using real data. Real Inputs
Area SR (aum/km2)
PD (tn/km2)
NP (p/km2)
Active Rules
Output: RRS 1
(aum/km2)
∆SR: (RRS – SR) (aum/km2)
Cheshme-Anjir 124 18 0.4 20, 21, 23, 24 32.1 – 91.9 Morzion 94 12 0.9 20, 23 26.1 – 67.9 Kheshti 55 28 0.3 11, 14 26.1 – 28.9
Table 7.3 shows three different outputs (RRSs) corresponding to three
real input data. By comparing the Right Rate of Stocking (RRS) with
the current Stocking Rate (SR) for each area, it becomes clear that the
current SR values are considerably higher than the RRS values: RRS =
1. Using Membership Function Editor of Fuzzytoolbox to automatically define membership
functions of the inputs, the outputs (RRSs) would be 44.2, 16.3, and 21.8 for the studied areas respectively that also confirm "overgrazing" in these areas.

120
32.1, 26.1 and 26.1 when SR = 124, 94 and 55, respectively. The
negative ∆SRs (– 91.9, – 67.9 and – 28.9 respectively) exhibit the
exceeding rate of SR compared to that of RRS and therefore suggest
general overgrazing in the three-prototypical areas in Southwest Iran.
All pastoralists’ experts in the study areas, on one hand, agree with
this result. They believe that most important issue nowadays they are
challenging with, is overgrazing and this is actually the reason why
they did not consider the “high” value for RRS as the output of the
model (Table 7.2). They are afraid that, by choosing this value, even
the favourite conditions (e.g. rules 8 and 16), overgrazing will
continue to happen and further be encouraged in the future.
By comparing the current SR to the RRS, on the other hand, the correct
decision can easily be made by pastoralists. In all three areas, to return
to an equilibrium state, pastoralists should decrease the following
amounts of their livestock per square kilometer:
∆SR1 = RRS – SR = 32.1 – 124 = – 91.9 (aum/km2) = – 0.9 (aum/ha)
∆SR2 = RRS – SR = 26.1 – 94 = – 67.9 (aum/km2) = – 0.6 (aum/ha)
∆SR3 = RRS – SR = 26.1 – 55 = – 28.9 (aum/km2) = – 0.2 (aum/ha)
Such a decision has a lot of consequenses. In this case, for example, as
they would loose a part of their major income, they usually do not
consider this option (decrease). Consequently, pastoralists will
experience unbalance and unavoidable degradation in their
rangelands. For making money to return to balance (without any
overgrazing), the Natural Resourse Administrations in Iran have
started to offer them the other jobs since 2000. These are included
handcrafts, horticulture, agronomy, animal husbandry and other jobs
related to agriculture. These jobs can be varied due to different

121
climaticand geographical conditions as well as the pastoralists’
experiences.
The current state of the majority of the Iranian rangelands, namely
overgrazing, of course, may change in the future. In fact, a pastoral
system is a dynamic system, where socio-economic conditions change
over the time. Therefore, it may be needed to change or add input
variables to the model or to redefine the membership functions,
yielding in different output rates. If so, “overgrazing” may change to
“normal grazing” or even, “undergrazing” based on different socio-
economic and dynamic ecological conditions in the future.
7.2. Development the multi-fuzzy model
Due to heterogeneous experts’ knowledge as collected in the semi-
structured interviews, we have constructed three different Mamdani-
types of fuzzy models. Each model has its own specific inputs,
linguistic values, fuzzy range and if-then rules (Table 7.4).

122
Table 7.4. Inputs, linguistic values and fuzzy range of each expert.
Expert His discipline Inputs (Ii) Linguistic values Fuzzy range Unit
PA Verylow,Low,Medium,High,Veryhigh 500,2500,5000,10000,20000 ha AR Verylow,Low,Medium,High,Veryhigh 100,200,350,600,800 mm
1
Desert Management
PD Verylow,Low,Medium,High,Veryhigh 10,25,35,55,70 %
PA Low,Medium,High 500,1000,2000 ha FTP Negative,Stable,Positive 20,50,70 % SP Deserts,Mountains 5,12 %
TP Low,Medium,High 100,450,1700 m2
2
Rural
Development
AR Verylow,Low,Medium,High 50,100,250,500 mm
FTP Negative,Stable,Positive 0,50,100 %
CC Low,Medium,High,Veryhigh 0.5,2,5,6 aum
3
Animal Husbandry
PS Poor,Normal,Good,Rich 25,50,75,100 %
Abbreviations: PA: Pasture Area, AR: Annual Rainfall, PD: Plantation Density, FTP: Future Trend of a Pasture, SP: Slope
of Pasture, TP: Topography of Pasture, CC: Carrying Capacity, PS: Pastoralists Situation.

123
Considering the second column with the third of Table 7.4 makes clear that
the different administrative experts, graduated in different disciplines, have
different knowledge concerning the indicators influencing the balance
between ‘consumption’ and ‘conservation’ in sustainable rangeland
management. They usually introduce those indicators which are most
related to their own discipline. Thereby, based on the experts’ knowledge,
we constructed three fuzzy models. The inputs of the first model are
Pasture Area, Annual Rainfall, and Plantation Density, where the second
model holds Pasture Area, Future Trend of a Pasture, Slope of Pasture,
Topography of a Pasture, and Annual Rainfall and the third model includes
Future Trend of a Pasture, Carrying Capacity and Pastoralists Situation as
the inputs (Table 7.4).
The administrative experts introduced different linguistic values for their
inputs. The first expert, for example, considered five levels (Very low, Low,
Medium, High, Very high) for all three of his own inputs, while, the second
expert considered two, three and four levels for his own indicators. Also,
the third expert deemed three and four levels for his own inputs. Table 7.4
also shows that for the same inputs (e.g. variable AR and FTP), experts
may have different ideas regarding the linguistic values to be used.
We also asked the experts to define the fuzzy ranges of the linguistic
values, i.e., the membership functions that define the linguistic values
selected. All experts considered the trapezoidal shape for the smallest and
the largest linguistic values and the triangular for the rest. In this way, we
defined both triangular and trapezoidal membership functions based on
administrative experts’ knowledge.

124
The experts were also asked to express their own knowledge in a set of
‘fuzzy IF-THEN rules’ while offering all possibilities. We prepared all
combinations of the inputs and asked the experts to fill out the output
column. Thereby, the number of if-then rules was determined based on the
number of inputs variables and their linguistic values1:
The number of if-then rules (Model 1) = 5 * 5 * 5 = 125
The number of if-then rules (Model 2) = 3 * 3 * 2 * 3 * 4 = 216
The number of if-then rules (Model 3) = 3 * 4 * 4 = 48.
Although the inputs of the three fuzzy models are different due to quantity
and linguistic values, the Right Rate of Stocking (RRS) is chosen as the only
output of the model (Table 7.5).
Table 7.5. Characteristics of the output (RRS) for three fuzzy models.
Model Linguistic values Fuzzy ranges Unit
1 Verylow,Low,Medium,High,Veryhigh 0.5,1.0,2.5,4.0,6.0 aum/ha 2 Low,Medium,High 0.5,0.6,1.0 aum/ha 3 Low,Medium,High 1.0,2.0,3.0 aum/ha
7.2.1. Computing the crisp primary outputs
Before being able to compute a final crisp output value of the multi-fuzzy
model, we must first calculate the primary outputs, i.e., the output of each
fuzzy model. To do so, we need a representative set of data. We have been
able to collect the inputs data of five prototypical cases for each region of
our study. Next, we computed the primary output values RRSi of each the
three fuzzy models developed. The results of this procedure are
summarized in Tables 7.6, 7.7 and 7.8.
1. See appendix 2.

125
Table 7.6. Computing the outputs of the first model with 5 cases for each region.
Model: 1
First region: Morzion
Real Inputs
Case PA (ha) AR (mm) PD (%)
Active Rules
Output RRS1 (aum/ha)
1 100 750 12 16,17,21,22 0.68 2 100 750 11 16,17,21,22 0.56 3 200 750 12 16,17,21,22 0.68 4 50 750 13 16,17,21,22 0.77 5 250 750 12 16,17,21,22 0.68
Second region: Cheshme-Anjir
Real Inputs
Case PA (ha) AR (mm) PD (%)
Active Rules
Output RRS1 (aum/ha)
6 100 315 18 6,7,11,12 1.07 7 200 315 19 6,7,11,12 1.11 8 300 315 17 6,7,11,12 1.02 9 250 315 18 6,7,11,12 1.07 10 300 315 16 6,7,11,12 0.97
Third region: Kheshti
Real Inputs
Case PA (ha) AR (mm) PD (%)
Active Rules
Output RRS1 (aum/ha)
11 200 240 20 6,7,11,12 1.15 12 500 240 22 6,7,11,12 1.23 13 200 240 19 6,7,11,12 1.11 14 300 240 20 6,7,11,12 1.15 15 700 240 20 6,7,11,12 1.15
Abbreviations: PA: Pasture Area, AR: Annual Rainfall, PD: Plantation
Density, and RRS: Right Rate of Stocking.

126
Table 7.7. Computing the outputs of the second model with 5 cases for each region.
Model: 2
First region: Morzion
Real Inputs
Case PA
(ha) FTP (%)
SP (%)
TP
(m2) AR
(mm)
Active Rules
Output RRS2
(aum/ha)
1 100 50 15.7 100 750 40 0.70 2 100 50 15.7 120 750 40,44 0.85 3 200 50 15.7 115 750 40,44 0.82 4 50 50 15.7 130 750 40,44 0.91 5 250 50 15.7 145 750 40,44 0.98
Second region: Cheshme-Anjir
Real Inputs
Case PA
(ha) FTP
(degree) SP (%)
TP
(m2) AR
(mm)
Active Rules
Output RRS2
(aum/ha)
6 100 55 13.4 180 315 39,40,43,44,63,64,67,68 1.12 7 200 55 13.4 160 315 39,40,43,44,63,64,67,68 1.12 8 300 55 13.4 200 315 39,40,43,44,63,64,67,68 1.13 9 250 55 13.4 185 315 39,40,43,44,63,64,67,68 1.12
10 300 55 13.4 170 315 39,40,43,44,63,64,67,68 1.12
Third region: Kheshti
Real Inputs
Case PA
(ha) FTP
(degree) SP (%)
TP
(m2) AR
(mm)
Active Rules
Output RRS2
(aum/ha)
11 200 20 8.6 30 240 2,3,14,15 0.45 12 500 20 8.6 20 240 2,3,14,15 0.45 13 200 20 8.6 35 240 2,3,14,15 0.45 14 300 20 8.6 40 240 2,3,14,15 0.45 15 700 20 8.6 25 240 2,3,14,15,74,75,86,87 0.45
Abbreviations: PA: Pasture Area, FTP: Future Trend of a Pasture, SP: Slope of
Pasture, TP: Topography of Pasture, AR: Annual Rainfall, and
RRS: Right Rate of Stocking.

127
Table 7.8. Computing the outputs of the third model with 5 cases for each region. Model: 3
First region: Morzion
Real Inputs
Case FTP (%) CC (aum) PS (%)
Active Rules
Output RRS3 (aum/ha)
1 50 0.27 60 18,19 0.84 2 50 0.25 65 18,19 0.84 3 50 0.22 60 18,19 0.84 4 50 0.26 55 18,19 0.80 5 50 0.28 65 18,19 0.84
Second region: Cheshme-Anjir
Real Inputs
Case FTP (%) CC (aum) PS (%)
Active Rules
Output RRS3 (aum/ha)
6 50 0.36 65 18,19 0.84 7 50 0.34 50 18 0.76 8 50 0.36 70 18,19 0.80 9 50 0.38 60 18,19 0.84 10 50 0.35 60 18,19 0.84
Third region: Kheshti
Real Inputs
Case FTP (%) CC (aum) PS (%)
Active Rules
Output RRS3 (aum/ha)
11 20 0.42 30 1,2,17,18 0.84 12 20 0.40 35 1,2,17,18 0.84 13 20 0.43 40 1,2,17,18 0.84 14 20 0.44 30 1,2,17,18 0.84 15 20 0.41 35 1,17 0.84
Abbreviations: FTP: Future Trend of a Pasture, CC: Carrying Capacity, PS:
Pastoralists Situation, and RRS: Right Rate of Stocking.
Table 7.6, 7.7 and 7.8 show that, for equal cases, the primary outputs
RRSi (i = 1, 2, 3) are usually different. It clarifies that our decisions to
select the best final output as an estimation of the RRS is not a trivial
task. Actually, we need to find a solution for dealing with the
differences among the primary outputs. More formally, we should find
an 'optimal' way to combine the primary outputs RRSi(I), based on a
given input vector I, in order to calculate one final crisp output value
RRSf(I) of our multi-fuzzy model. This combining process is
sometimes, especially in environments of supervised learning, termed
‘voting’1 (Hastie et al., 2001).
1. Voting and rating activities require the gathering of participants' opinions from large distances,
and therefore, they are closely connected to network issues and distributed processing (Kovács and Micsik, 2005).

128
7.2.2. Implementing voting
In the next sections, we introduce and discuss several ways to
implement voting, i.e., to calculate the weights for combining the
primary outputs.
7.2.2.1. Method 1: Calculating the mean of outputs
Table 7.9 shows the primary outputs of models 1, 2 and 3, and the
final output RRSf of 15 cases (c = 1,2,…,15) in three different study
regions. In this approach, all final crisp outputs are simply equal to the
arithmetic mean of the primary outputs of the three models, i.e.,
∑=
==3
1
),(3
1Mean)(
i
cicf IRRSIRRS where Ic represents the input vector for
the cth case.
Table 7.9. Finding the final outputs by calculating the mean of primary outputs.
First region: Morzion
Primary outputs: RRSi
Case Model 1 Model 2 Model 3
SD Mean (RRSf)
1 0.68 0.70 0.84 0.08 0.74 2 0.56 0.85 0.84 0.16 0.75 3 0.68 0.82 0.84 0.08 0.78 4 0.77 0.91 0.80 0.07 0.82 5 0.68 0.98 0.84 0.15 0.83
Second region: Cheshme-Anjir
Primary outputs: RRSi
Case Model 1 Model 2 Model 3
SD Mean (RRSf)
6 1.07 1.12 0.84 0.14 1.01 7 1.11 1.12 0.76 0.20 0.99 8 1.02 1.13 0.80 0.16 0.98 9 1.07 1.12 0.84 0.14 1.01 10 0.97 1.12 0.84 0.14 0.97
Third region: Kheshti
Primary outputs: RRSi
Case Model 1 Model 2 Model 3
SD Mean (RRSf)
11 1.15 0.45 0.84 0.35 0.81 12 1.23 0.45 0.84 0.39 0.84 13 1.11 0.45 0.84 0.33 0.80 14 1.15 0.45 0.84 0.35 0.81 15 1.15 0.45 0.84 0.35 0.81

129
As table 7.9 shows, different regions have different RRSf as the means
of the primary outputs. Since, the second region (Cheshme-Anjir)
gains the highest and the first region (Morzion) has the lowest means,
the third region (Kheshti) stands between them. Therefore, according
to these estimations, the second region can hold the most aum/ha,
while the capacity of the first region is the least. The standard
deviations of RRSi in the three regions have also been calculated.
Table 7.9 shows that the highest deviations of the primary RRSi are
found in the third and the lowest in the first region. The method of
calculating the mean of the primary outputs has some strengths and
weaknesses. It has some strengths because it concerns a simple
calculation and it covers all three primary outputs. It has some
weaknesses, as it uses all data in our calculations with equal weights.
By doing so, outliers are equally important as points close to the
expected value of the output. Therefore, we think it would be better to
look for voting methods where the primary outputs are calculated as a
weighted mean, i.e.,
∑=
=N
i
ciicf IRRSwIRRS1
)()( (1)
Here, in a more general setting, N equals the number of primary
models, where the weights wi are subject to the following constraints:
∑=
=N
i
iw1
1 and .0: ≥∀ iwi The underlying assumption of this weighted
approach is that ‘each expert has something to say’ and, in addition,
that ‘certain experts have something more to say than others’. We now
discuss several methods for calculating ‘optimal’ weight values wi.

130
7.2.2.2. Method 2: Minimizing the sum of squared errors
Where a training set of C input-output cases (Ic,RRSc), (c = 1, 2, …, C)
is available, we can calculate optimal weights wi by choosing the
weights wi such that the following sum of squared errors SSE is
minimized:
∑ ∑∑= ==
−=−=C
cc
N
icii
C
cccf
RRSIRRSwRRSIRRSSSE1
2
11
2 ))(())(( . (2)
This approach of supervised learning can be considered as a
regression method where the final outputs RRSf(Ic) of the multi-fuzzy
model are as much as possible equated to the correct output values
RRSc. If desired and needed, even more sophisticated supervised
methods from predictive data mining like ‘bagging’ and ‘boosting’
(Hastie et al., 2001; Ishibuchi et al., 1999) can be considered for
implementing optimal voting schemes.
Unfortunately, like in our case, the above-given methods of
supervised learning are not applicable where a set of correct input-
output values is not available. Therefore, we will not further discuss
method 2 in this study. Instead, we are challenged to come up with an
unsupervised method for implementing voting, i.e., a method where
we try to optimize the ‘consistency’ of the final output values of the
system by harmonizing the values of the primary outputs.
7.2.2.3. Method 3: Minimizing an approximation of the sum of
squared errors
One might wonder whether we can approximate the approach of
method 2 by using an approximation RRS′c of the correct output
values RRSc. Knowing the primary outputs RRSi, we can use as an

131
approximation ∑=
==N
i
cic IRRSN
RRS1
)(1
Mean' and next try to minimize the
approximation of the sum of squared errors SSE' defined as
∑ ∑∑∑= ===
−=−=C
c
N
i
ci
N
i
cii
C
c
ccf IRRSN
IRRSwRRSIRRSSSE1
2
111
2 ))(1
)(()')((' , (3)
where the above-given constraints 0: ≥∀i
wi and 11
=∑=
N
i
iw still hold.
Unfortunately, this method does not work since equation (3) has a
trivial minimum equal to zero, namely, in case Nwii
/1: =∀ resulting
into Method 1 from section 4.3.1, therefore, we should look for
another approach.
Below we shall look for ‘harmonizing methods’ where the
dissimilarities between the primary outputs RRSi are minimized.
7.2.2.4. Method 4: Harmonizing the primary outputs
A natural approach for harmonizing existing differences in the
primary outputs is to put less emphasis on outliers. By doing so, we
hope to find a more unbiased estimation RRSf of the right rate of
stocking. In addition, a smaller standard deviation SD of the weighted
primary outputs ii RRSw is expected to be found simply because the
primary output values close to the mean get more weight in the voting
process.
The above-given idea can be formalized as follows. Given input
vector Ic, let |)()(|)(, cjcicji IRRSIRRSI −=∆ represent the absolute value
of the difference between the primary outputs of model i and j. Using
all input vectors Ic available, we can calculate the sum ∆i of the
absolute differences between primary ouput RRSi and all other primary
outputs RRSj, j ≠ i, defined by

132
))()()()(()( 1,
1
1,2,1,
1
, ΛΛ +∆+∆++∆+∆=∆=∆ +
=
−
= ≠
∑∑∑ cii
C
c
ciicici
C
c ij
cjii IIIII . (4)
If ,ji ∆>∆ this means that model i generates, on average, more
outlying output values than model j and therefore, in our approach,
should get a lower weight. This can be implemented by giving model i
a weight which equals the normalized inverse of ∆i or, more precisely,
Λ+∆+∆+∆
∆=
∆
∆=∑ 321 /1/1/1
/1
/1
/1 i
j
j
iiw (5)
It should be clear that by providing the primary outputs RRSi the
weights wi as defined by equation (5), the above-mentioned
constraints 0: ≥∀i
wi and 11
=∑=i
iw are automatically fulfilled.
Having determined the weights of the primary outputs, the standard
deviation of the weighted primary outputs can be calculated. Since for
Method 4 outliers have received less weight, these standard deviations
are expected to be smaller than in case of using Method 1 where the
primary outputs have equal weights. Furthermore, the final output of
the multi-fuzzy model can be calculated using equation (1). We have
done these calculations using the available field data from each of the
different regions of study. The results found are summarized in Table
7.10.

133
Table 7.10. Estimating the final output RRSf by calculating the sum of weighted outputs for separated regions according to Method 4. First region: Morzion
Primary outputs (RRSi) Delta’s Sum of Deltas Weighted outputs
Case Model 1 Model 2 Model 3 ∆1-2 ∆2-3 ∆1-3 ∆1 ∆2 ∆3 w1RRS1 w2RRS2 w3RRS3
SD (RRSf)
Summation
1 0.68 0.70 0.84 0.02 0.14 0.16 0.18 0.16 0.3 0.18 0.24 0.31 0.06 0.74
2 0.56 0.85 0.84 0.29 0.01 0.28 0.57 0.3 0.29 0.15 0.29 0.31 0.09 0.76
3 0.68 0.82 0.84 0.14 0.02 0.16 0.3 0.16 0.18 0.18 0.28 0.31 0.06 0.78
4 0.77 0.91 0.80 0.14 0.11 0.03 0.17 0.25 0.14
0.21 0.31 0.30 0.05 0.83
5 0.68 0.98 0.84 0.3 0.14 0.16
0.46 0.44 0.3 Sum 0.18 0.34 0.31 0.08 0.84
Sum 1.68 1.31 1.21 4.2
Inverse 0.59 0.76 0.82 2.18
Weights(wi) 0.27 0.35 0.38 1.00
Second region: Cheshme-Anjir
Primary outputs (RRSi) Delta’s Sum of Deltas Weighted outputs
Case Model 1 Model 2 Model 3 ∆1-2 ∆2-3 ∆1-3 ∆1 ∆2 ∆3 w1RRS1 w2RRS2 w3RRS3
SD (RRSf)
Summation
6 1.07 1.12 0.84 0.05 0.28 0.23 0.28 0.33 0.51 0.45 0.38 0.20 0.12 1.03
7 1.11 1.12 0.76 0.01 0.36 0.35 0.36 0.37 0.71 0.46 0.38 0.18 0.14 1.02
8 1.02 1.13 0.80 0.11 0.33 0.22 0.33 0.44 0.55 0.43 0.383 0.19 0.12 1.00
9 1.07 1.12 0.84 0.05 0.28 0.23 0.28 0.33 0.51
0.45 0.38 0.20 0.12 1.03
10 0.97 1.12 0.84 0.15 0.28 0.13
0.28 0.43 0.41 Sum 0.40 0.38 0.20 0.11 0.98
Sum 1.53 1.9 2.69 6.12
Inverse 0.65 0.52 0.37 1.55
Weights(wi) 0.42 0.34 0.24 1.00
Third region: Kheshti
Primary outputs (RRSi) Delta’s Sum of Deltas Weighted outputs
Case Model 1 Model 2 Model 3 ∆1-2 ∆2-3 ∆1-3 ∆1 ∆2 ∆3 w1RRS1 w2RRS2 w3RRS3
SD (RRSf)
Summation
11 1.15 0.45 0.84 0.7 0.39 0.31 1.01 1.09 0.7 0.34 0.124 0.36 0.13 0.82
12 1.23 0.45 0.84 0.78 0.39 0.39 1.17 1.17 0.78 0.36 0.124 0.36 0.13 0.84
13 1.11 0.45 0.84 0.66 0.39 0.27 0.93 1.05 0.66 0.32 0.124 0.36 0.12 0.81
14 1.15 0.45 0.84 0.7 0.39 0.31 1.01 1.09 0.7
0.34 0.124 0.36 0.13 0.82
15 1.15 0.45 0.84 0.7 0.39 0.31
1.01 1.09 0.7 Sum 0.34 0.124 0.36 0.13 0.82
Sum 5.13 5.49 3.54 14.16
Inverse 0.19 0.18 0.28 0.65
Weights(wi) 0.29 0.28 0.43 1.00

134
As Table 7.10 shows, there are different weights for each region.
While the weights of the model 1, 2 and 3 for the first region are 0.27,
0.34, and 0.37, the weights for these models for the second region are
0.42, 0.33 and 0.23 and for the third region are 0.29, 0.27 and 0.42
respectively. In other words, when the first model gets the highest
weight in Cheshme-Anjir (w1 = 0.42), the second model gives the
highest weight in Morzion and Cheshme-Anjir (w2 = 0.34 and 0.33)
respectively, and the third model gains the highest weight in Kheshti
(w3 = 0.42). So, we have different weights in different regions showing
that the expertize of the experts in the various regions seems to be
different.
Now, by calculating the sum of weighted outputs, we can easily
estimate the final outputs:
∑=
=3
1i
iif RRSwRRS
Based on equation (6), again, we estimated the final output RRSf for
separated regions. As Table 7.10 shows, the estimations for various
regions are different. While the highest amount of RRSf (more than 1)
is estimated for the second region and the lowest for the first (less than
0.8), the third region has got more than 0.8. On the other hand,
although the estimations are different for the ‘between groups’, they
are approximately similar for the ‘within groups’. Comparing Table
7.9 and 7.10, the standard deviation has indeed been reduced, as
expected.
7.2.3. Comparison of Method 1 and Method 4
Based on the two applied methods (Mean and Harmonized), we
estimated the final Right Rate of Stocking (RRSf). In the first method
(6)
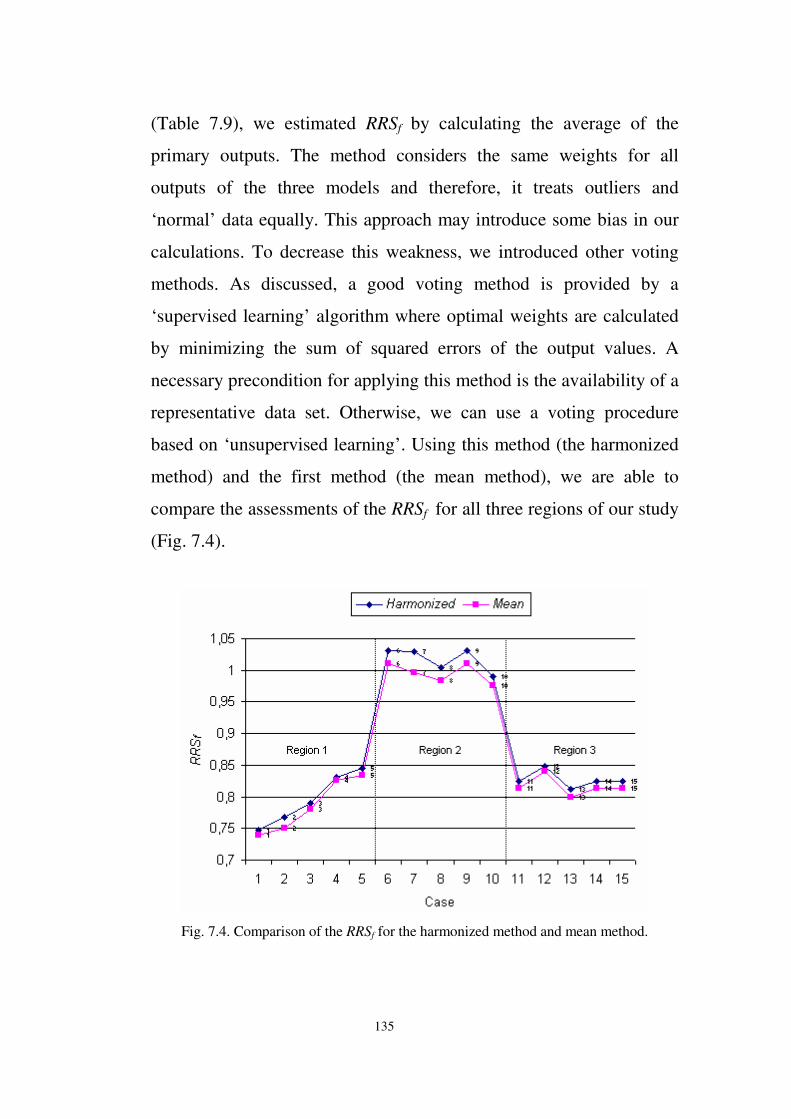
135
(Table 7.9), we estimated RRSf by calculating the average of the
primary outputs. The method considers the same weights for all
outputs of the three models and therefore, it treats outliers and
‘normal’ data equally. This approach may introduce some bias in our
calculations. To decrease this weakness, we introduced other voting
methods. As discussed, a good voting method is provided by a
‘supervised learning’ algorithm where optimal weights are calculated
by minimizing the sum of squared errors of the output values. A
necessary precondition for applying this method is the availability of a
representative data set. Otherwise, we can use a voting procedure
based on ‘unsupervised learning’. Using this method (the harmonized
method) and the first method (the mean method), we are able to
compare the assessments of the RRSf for all three regions of our study
(Fig. 7.4).
Fig. 7.4. Comparison of the RRSf for the harmonized method and mean method.
136
As Fig. 7.4 demonstrates both methods estimate the highest RRSf for
the second region and the least for the first where the third region
stands between them. Also, while the RRSf for the second region is
considerably different from the two other regions, the RRSf for the
first and third region are quite close. We observe here that differences,
even small ones, between the values of the Right Rate of Stocking
have serious consequences because of ‘scaling factor’. In other words,
since the total area of each region is very large (e.g. 2000 hectares in
Morzion, 2575 hectares in Cheshme-Anjir and 6900 hectares in
Kheshti), small differences become big ones if we multiply the
estimated values of the RRSf by the amount of pasture area.
A primary validation shows that all experts confirm the above-
mentioned outcomes. Considering our results, they believe that the
second region (Cheshme-Anjir) has the best conditions to reach
sustainability. These conditions include social, geographical and
environmental circumstances and are supposed to be strongly related
to the values of the input variables (indicators) of the fuzzy models
discussed above. The social problems are supped to be less in
Cheshme-Anjir because the region benefits by a good manager who
solves many of their problems, especially, those related to the usual
bureaucratic problems in the different Iranian administrations. The
region also benefits by higher education level of its expert. In
addition, the administrative experts believe that the second region has
better strategic conditions as it falls between the two main roads
which are near to Shiraz, the capital of the Fars province. Finally, as
the weather in this region is not very cold (like the first region in
Morzion) and not very warm (like the third region in Kheshti), the
temperate weather makes better environmental conditions in

137
Cheshme-Anjir. Thus, these conditions make the second region the
best prototypical case in comparison to the two other regions and can
explain the high differences between outcomes for the second area and
the rest.
The administrative experts also agree upon estimations of the RRSf for
the two other regions. As vegetation period in the third region
(Kheshti) is longer than the first region (Morzion), they expect a lower
and a higher RRSf for the first and third region respectively. They also
believe that the warm weather of Kheshti creates a longer time period
of grazing. In contrast, the cold weather of Morzion declines its
capacity to hold livestock to graze. The experts add, however, if we
neglect the time period of grazing, the capacity of the third region for
holding the RRS should decrease (as we have seen for the second
model). This can also be a good evidence to show that the experts
were differently expertized in the various regions.
In addition, since the experts consider 2-3 aum/ha as the medium
range of RRS (see Table 7.5), they believe that currently the three
regions of our study have a much smaller grazing capacity than might
be possible. This outcome confirms the general believe that many
pastoral regions in Iran are currently facing overgrazing and are
exacerbating by the unsustainable situation. By taking appropriate
measures, circumstances for SD may be improved in the future.
Consequently, the experts’ knowledge will change according to new
conditions and higher estimates are likely to be found.
As has been shown in Tables 7.4 and 7.5, the nominated experts in
Iran choose different indicators to estimate the Right Rate of Stocking,
even in the cases where the same social, environmental, and
geographical conditions hold. They come up with sustainability in

138
rangeland management by different environmental (e.g. Slope of
Pasture) and socio-economic indicators (e.g. Pastoralist Situations).
Therefore, our study supports the reality that sustainability in range
management is a multi-dimensional vague concept. We also wish to
emphasize here that the supervised voting process (Method 2) should
be tried out in future research, after we have collected a set of real
input-output data from the field. The collection of this data is,
however, a time consuming process, which may take several years.

139
Chapter Eight
Summary and Conclusions
8.1. Summary
A claim is commonly made that the rangelands around the world are
overgrazed and hence producing edible forage and animal products at
less than their potential Wilson and Macleod, 1991). Globally,
rangelands are at risk from numerous pressures (Mitchell et al., 1999).
Some of these pressures arise from livestock/rangeland systems.
Livestock have been a key factor in the development of civilization,
but their role in the future is not clear as well as how the science of
rangeland management should change in order to meet future
challenges in rangelands. Carrying capacity is the most important
issue in range management (Walker, 1995). At a time, when the
planet's limited carrying capacity seems increasingly obvious, the
rationale and measures of rangelands carrying capacity are
increasingly criticized. One of the key elements of rangeland capacity
is stocking rate. If stocking rate is not close to the proper level related
to equilibrium rate, then, regardless of other grazing management
practices employed equilibrium will not be met (Roe, 1997). This
applies to many countries, including Iran. It is a regular topic of
books, articles and symposia (Conference on Sustainable Range
Management, 2004; Iranian Nomadic Organization, 1992), and a
common justification for further research.

140
Iran has approximately 90 million hectares of rangeland, 9.3 million
hectares of which are considered in ‘good’ conditions while the
remaining in ‘fair’ or ‘poor’ conditions. The country’s rangelands in a
normal year produce around 10 million tons of dry matter (dm), of
which 5.8 million tons may be available for grazing. The remaining
amount is the minimum required for reproduction and soil
conservation. The later amount of dm can support 38.5 million animal
units (au) for duration of 8 months. At the moment there is 115.5
million of au in Iran and only 16.5 of them are fed from other sources
including by agricultural products. The above figures prove that the
rangelands are being utilized at three times more than their peak
capacities in a non-drought year. This results in severe degradation of
the rangelands and accelerates soil erosion. As the rangeland is
considered by its users as "free resource" it is subject to heavy abuse,
which further exacerbates the drought (FAO, 2004a; Iranian Nomadic
Organization, 1992; Mesdaghi, 1995; UNCT, 2001).
The recent literature on rangelands disequilibrium calls in question
any specific measures of carrying capacity, whether the range is
stocked or unstocked, and managed or mis-managed. Ideally, such
objections can be taken into account for any individual carrying
capacity estimated by accepting that it has to be determined on a case
- by - case basis in the field. Once one knows the size of the grazing
and browsing animals, the biomass production of the area, the pattern
of range management, and so on, she/he can - so this argument goes -
produce a site specific stocking rate estimated for the range area under
consideration. But, it cannot pack livestock into a given rangeland,
without at some point deteriorating that range demonstrably. Surely,
biomass production is going down on rangelands precisely because

141
stocking rate has been exceeded for so long, even taking into account
factors such as drought and climate changes (Hardesty et al., 1993).
However, the rationale and measures of rangeland carrying capacity
are increasingly criticized. It seems that even under environmental
conditions of great certainty, the notion of rangeland equilibrium
would still be ambiguous and confused. Moreover, since
environmental conditions are highly uncertain for the dry rangelands
of the world such as Iran, current understanding of rangeland
equilibrium turns out to be all the more questionable. There is no
workable and practical “equation” for rangeland management in
general, and carrying capacity in particular (Roe, 1997). Similar
problems exist in other field of SD. In most studies, Fuzzy Logic is
used to construct a model for evaluating sustainability in different
areas. These models promise to be a valuable tool in evaluating the
sustainability in general and equilibrium specifically in this study. The
main purpose of this dissertation was to design a fuzzy model based
on the experts’ knowledge for solving the mis-management of the Fars
rangelands in Southwest Iran.
8.2. Conclusions
Fuzzy logic appears to be well suited to provide quantitative answers
pertaining to sustainability in rangeland management. In this study,
we introduced a fuzzy logic-based model for sustainable rangeland
management where the RRS is assessed as the output of the model
from three input variables. All experts agreed with these three inputs
which are: Stocking Rate, Plantation Density and Number of
Pastoralists. By using the EAFL model, there will be three different
options:

142
i) increasing the Stocking Rate (pastoralists usually like to
do so),
ii) unchanging the Stocking Rate (the rangeland is already
in equilibrium), and
iii) decreasing the Stocking Rate (more probable option).
Evaluating the EAFL model presented in this dissertation, we
conclude that it exhibits three important characteristics:
• First, it permits the combination of various aspects of
sustainability with different units of measurement,
• Second, it overcomes the difficulty of assessing certain
attributes or indicators of sustainability without precise
quantitative criteria, and
• Third, the methodology is easy to use and interpret.
The model has, therefore, the potential to become a practical tool to
policy-makers and scientists. It is important to note that the model is
open for improvement, based on our better understanding of realities
in the future. For example, one may construct different fuzzy rules
(the number of indicators used to evaluate each linguistic variable of
sustainability may be changed according to need or the membership
functions of certain linguistic values can be redefined), or may enter
some other Boolean measurements (which are normally used by
rangelands’ scientists) in fuzzy analyses to emprove the validity of the
model.
We are aware that our EAFL model is just the first step. The
flexibility of our model is one of its advantages over existing static
methods. Considering the sequence "crisp input – fuzzifier – inference

143
engine – defuzzifier – crisp output" illustrates the uncertainity that
exists in such a complex vague concept as sustainable rangeland
management. It also well adjusts to usual ambigious linguistic
statements of individuals. Furthermore, fuzzy logic operations
compensate for the lack of full knowledge of our system. Uncertainty
is ubiquitous in sustainability problems, since we never have complete
knowledge of the complex interrelationship of ecological systems and
the human thinking. Therefore, the EAFL model is expected to
provide a new useful tool for policymakers in order to manage and to
predict the overall sustainability in rangelands.
Considering a multi-fuzzy model, which is developed in this
dissertation, we have come up with other conclusions. While fuzzy
specialists usually use homogeneous experts’ knowledge to construct
fuzzy models, it is generally much more difficult to deal with
knowledge elicited from a heterogeneous group of experts, especially
in the area of sustainable rangeland management. In this study, we
proposed a multi-fuzzy model to cope with the muti-dimensional
vagueness of sustainability in the field of range management. To deal
with the heterogeneity of experts’ knowledge, which should be
considered either as a reality or necessity, we introduced several
voting methods for estimating the Right Rate of Stocking as the final
output of several fuzzy models. The first method simply uses the
average of the primary outputs as the final right rate of stocking. We
also introduced a supervised voting method, which is applicable where
a real-world data set is available. In the absence of such a set, like in
our study, an unsupervised voting method can be applied which
estimates the weights of the primary right rate of stocking using a
harmonizing approach. Since this method puts less emphasis on

144
outliers, the harmonizing approach is supposed to result into a more
unbiased estimation. In addition, it turns out that the standard
deviation of the harmonized weighted primary outputs is smaller that
the standard deviation of equally weighted primary outputs.
The harmonized method is expected to provide a new useful tool for
policymakers in order to deal with heterogeneous experts’ knowledge.
By constructing the three fuzzy models based on the heterogeneous
knowledge and using some harmonized methods, our study tried to
show the multi-dimensional vaguenesses which generally exist in
rangeland management, and solve the conflict that especially exists in
economic and conservation views in the Iranian rangeland
management.
Finally, by comparing the estimated Right Rate of Stocking, which
elicited from both experts' opinions and Matlab Fuzzytoolbox Editor,
with its medium range, the models verified overgrazing in the three
regions of the Fars province in Southwest Iran.
145
Bibliography
Abdul Aziz, S., 1996. You fuzzyin' with me? Available on: http://www.doc.ic.ac.uk/~nd/surprise_96/journal/vol1/sbaa/articl
e1.html
Aenis, T. and Nagel, U.J., 2000. Participatory management of large interdisciplinary research teams - First experiences from a rural research and development project in Germany. Available on: http://www.zalf.de/home_zalf/sites/grano/publikation/aenis-
nagel2000.pdf
Ainesworth, E., 1989. LISA men have called you. Farm Journal, 113: 1.
Alexandratos, N., 1998. World Food and Agriculture: The Outlook for
the Medium and Longer Term. Rome: Global Perspective Studies Unit, FAO.
Alexandratos, N., 1999. Plants and population: Is there time? Available on: http://www.nap.edu/books/0309064279/html/5908.html
Andriantiatsaholiniaina, L.A., 2001. Sustainability Assessment Using
Fuzzy Logic. Ph.D. Dissertation. Chania: Department of Production Engineering and Management, Technical University of Crete, Greece.
Archer, S., 1996. Assessing and interpreting grass - woody plant dynamics. In: J. Hodgson, & A.W. Illius (Eds.), The Ecology and
Management of Grazing Systems (101-134). Wallingford: CAB International.
ARE., 2005. Sustainable development – Definition and constitutional status in Switzerland. Available on: http://www.are.admin.ch/are/en/nachhaltig/definition/
Atkinson, G., Dubourg, R., Hamilton K., Munashinge, M., Pearce, D. and Young, C. (Eds.), 1999. Measuring Sustainable
Development: Macroeconomics and the Environment (Second Edition). Northampton: Edward Elgar.
Azadi, H., Shahvali, M. and Faghih, N., 2003. Using fuzzy logic in solving conflict between sustainability and pasture. The
Proceedings of the 4th Seminar on Fuzzy Sets and its
Applications, 1-15. May 28-29, 2003, University of Mazandaran, Babolsar, Iran.
Azadi, H., Shahvali, M. and van den Berg, J., (In revision). Sustainable rangeland management using fuzzy Logic: A case study in Southwest Iran. Journal of Ecological Modeling.

146
Barendse, G.W.J. and van der Hoek, D., 1996. Interdisciplinary project teams on agriculture and environment: A problem-oriented approach. Journal of Agricultural Extension and
Education 1(3), 7. [online] Available on: http://library.wur.nl/ejae/v1n3-7.html
Barfield, T., 1981. The Central Asian Arabs of Afghanistan. Austin: University of Texas Press.
Barth, F., 1961. Nomads of South Persia: The Basseri Tribe of the
Khamseh Confederacy. London: Allen. Bates, D.G., 1973. Nomads and Farmers: A Study of the Yörük of
Southeastern Turkey. University of Michigan: Ann Arbor. Beck, L., 1986. The Qashqa’i of Iran. New Haven & London: Yale
University Press. Berkan, R.C. and Trubatch, S.L., 1997. Fuzzy Systems Design
Principles: Building Fuzzy IF-THEN Rule Bases. New York: IEEE Press.
Black-Michaud, J., 1986. Sheep and Land. The Economics of Power
in a Tribal Society. Cambridge: Cambridge University Press. Blaisdell, J.P. & Pechanec, J.F., 1949. Effects of herbage removal or
various dates on vigor of Bluebunch Wheatgrass and Arrowleaf Balsamroot. Ecology, 30, 298-305.
Blundon, A., 2001. The world food prize. Available on: http://www.worldfoodprize.org/Youthinstitute/2001YIProceeding
s/papers-html/Hoover%20High%20School.htm Box, T.W., 1995. Private Property Rights and Sustainable Rangeland
Use. University of California: Center for Forestry, UC Berkeley. Box, T.W., 2002. Future deserts and sustainable communities.
Available on: http://www.rala.is/rade/ralareport/Box.pdf Brink, B.J.E.T., 1989. Systematically in Search of Sustainable
Development. Memorandum GWWS 89.006, Tidal water division, The Hague.
Brink, B.J.E.T., Husper, S.H. and Colijn, F., 1990. A quantitative method for description and assessment of ecological systems: The AMOEBA approach. Proceedings of the International
Conference on the Environmental Management of Enclosed
Coastal Seas. Marine Pollution Bulletin, Kobe, Japan. Brink, B.J.E.T., 1991. The AMOEBA approach as a useful tool for
establishing sustainable development. In: O., Kuik, H., Verbruggen, (Eds.), Search of Indicators of Sustainable
Development. Kluwer Academic Publishers, The Netherlands.

147
Brown, L.R., 1997. Can we raise grain yields fast enough? Worldwatch, 10(4), 9-17.
Brown, L.R., Abramovitz, J.N., and Starke, L. (Eds.), 2000. State of
the World: A Worldwatch Institute Report on Progress Toward a
Sustainable Society. Publisher: W. W. Norton and Company, Inc. Burkhart, J.W., 1996. Herbivory in the Intermountain West: An
Overview of Evolutionary History, Historic Cultural Impacts and
Lessons from the Past. Station Bull. #58. Idaho Forest, Wildlife and Range Exp. Sta., Moscow Idaho.
Burns, R., 1994. Introduction to Research Methods. Melbourne: Longman.
Buss, H.J. and Nuppenau, E.A., 2002. More sustainable range use in semi-arid eco-systems through adapted management: A case study on Namibian farms based on bio-economic models. Contributed Paper and Poster, Deutscher Tropentag 2002,
Witzenhausen, 9. bis 11. October. Buxton, R. and Stafford Smith, M., 1996. Managing drought in
Australia's rangelands: Four weddings and a funeral. Rangeland
Journal, 18, 292-308. Conference on Sustainable Range Management, 2004. Proceedings of
the Conference on Sustainable Range Management, January 5 –
8. New Orleans, Louisiana. Connolly, J. & Nolan, T., 1976. Design and analysis of mixed grazing
experiments. Animal Production, 23, 63-71. Cornelissen, A.M.G., 2003. The Two Faces of Sustainability. Fuzzy
Evaluation of Sustainable Development. Ph.D. Thesis. Netherlands: Wageningen University.
Cornelissen, A.M.G., van den Berg, J., Koops, W.J., Grossman, M. and Udo, H.M.J., 2001. Assessment of the contribution of sustainability indicators to sustainable development: A novel approach using fuzzy set theory. Agriculture, Ecosystems and
Environment, 86, 173-185. Coulter, J., 2003. Sustainable population Australia. Available on:
http://www.population.org.au/pressrm/newslet/nl200303.pdf
Council for Biotechnology Information, 2002. Growing more food. How biotechnology in a seed can enhance global food security. Available on: http://www.whybiotech.com/index.asp?id=1821
Cumber, I.K., 2004. Chalmers. Annual Meeting of the Alliance for
Global Sustainability at Chalmers Workshop on Learning for
Sustainable Development, 22-24 March 2004.

148
Dasgupta, P., 1996. The economics of the environment. The British Academy. Proceedings of the British Academy, 90, 165-221.
Dasgupta, P. and Maler, K., 1995. Handbook of Development
Economics. Amsterdam: North Holland. Davis, A. and Wagner, J.R., 2003. Who knows? On the importance of
identifying “experts” when researching local ecological knowledge. Human Ecology, 31(3), 463-489.
Deadman, P.J., 1999. Modeling individual behavior and group performance in an intelligent agent based simulation of the tragedy of the commons. Journal of Environmental Management,
56,159-172 Dean, D., No date. World population. Available on:
http://www.ctm.org/arti/gentop/wdp.htm
de Kok, J.L., Titus, M. and Wind, H.G., 2000. Application of fuzzy sets and cognitive maps to incorporate social science scenarios in integrated assessment models: A case study of urbanization in Ujung Pandang, Indonesia. Integrated Assessment, 1, 177-188.
Digard, J-P., 1990. The Evolution of Nomadic Pastoralism in Iran 1960-1978: Problems and Interpretations. In: C. Salzman, & J.G. Galaty (Eds.), Nomads in a Changing World (165-175). Naples: Istituto Universitario Orientale.
Driankov, D., Hellendoorn, H. and Reinfrank, M., 1996. An
Introduction to Fuzzy Control. New York: Springer. Dunn, E.G., Keller, J.M., Marks, L.A., Ikerd, J.E., Fader, P.D. and
Godsey, L.D., 1995. Extending the application of fuzzy sets to the problem of agricultural sustainability. IEEE Proceedings of
ISUMA-NAFIPS ’95, Missouri-Columbia, USA. Earth Government for Earth Community, 2003. Earth government for
earth community: A grassroots process. Available on: http://members.shaw.ca/earthgov/ECGlobalConcepts.htm
EC., 2002. Strategic Guidelines and Priorities for Interventions to be
Financed in 2002 and 2003 under Regulation. No. 2493/2000 of the European Parliament and of the Council on Measures to Promote Environment in Developing Countries. European Commission, DG Development. DEV/2790/2002, Budget Line B7 – 6200.
EDC News, 2003. Population & land: Arable land per capita diminishing - serious implications. Available on: http://www.edcnews.se/Research/Population-Landhunger.html
El-Awad, O.M.A., 1991. Multicriterion Approach to the Evaluation of
Irrigation Systems Performance. Ph.D. Thesis. Greece:

149
University of Newcastle upon Tyne, Department of Civil Engineering.
Emadi, M.H., 2003. Bridging Epistemologies and Integrating
Indigenous Knowledge with Scientific Knowledge for Sustainable
Development: A Case Study. Research Deputy of Rural Research Center, (RRC), Tehran, Iran.
Einstein, D.E. 1998. Intensification: Can agriculture keep up with population growth? Available on: http://darwin.bio.uci.edu/~sustain/global/sensem/einstein298.htm
l
EuropaWorld, 2003. EuropaWorld. Available on: http://www.europaworld.org/week119/crowthinfood7303.htm
Falconer, J., 1990. The Major Significance of ’Minor’ Forest
Products. Rome: FAO. Falconer, J. and Arnold, J.E.M., 1989. Household Food Security and
Forestry: An Analysis of Socio-Economic Issues. Rome: FAO. FAO, 1999. Towards a hunger-free century. Available on:
http://www.fao.org/dg/1999/millen-e.htm
FAO, 2000a. FAO report: Enough food in the future--without genetically engineered crops. Available on: http://www.ucsusa.org/food_and_environment/biotechnology/pa
ge.cfm?pageID=331 FAO, 2000b. Food and population: FAO looks ahead. Available on:
http://www.fao.org/news/2000/000704-e.htm
FAO, 2002. World agriculture 2030: Main findings. Available on: http://www.fao.org/english/newsroom/news/2002/7833-en.html
FAO, 2003. World Agriculture: Towards 2015/2030. An FAO
Perspective. London: Earthscan Publications Ltd. FAO, 2004a. Grassland and pasture crops in the Islamic Republic of
Iran. Available on: http://www.fao.org/WAICENT/FAOINFO/AGRICULT/AGP/AGP
C/doc/Counprof/Iran/Iran.htm FAO, 2004b. Food topsource. Available on:
http://www.t21.ca/food/tp.htm
FAO, 2004c. Community Forestry. Rapid Appraisal. Note Number 3. FAO Corporate Document Repository. Forestry Department.
Fazel, G., 1971. Economic Organisation and Change among the Boyr
Ahmad: A Nomadic Pastoral Tribe in Southwest Iran. Ph.D. Thesis. Berkeley: University of California.

150
Foran, B.D. & Stafford Smith, D.M., 1991. Risk, biology and drought management strategies for cattle stations in Central Australia. Journal of Environmental Management, 33: 17-33.
Ford, D.N. and Sterman, J.D., 1998. Expert knowledge elicitation to improve mental and formal models. System Dynamics Review,
14(4), 309-30. Ferraro, D.O., Ghersa, C.M. & Sznaider, G.A., 2003. Evaluation of
environmental impact indicators using fuzzy logic to assess the mixed cropping systems of the Inland Pampa, Argentina. Agriculture Ecosystems & Environment, 96, 1-18.
Gamble, D., 1989. Two Techniques for Gathering Data and Building
Rich Pictures in Rural and Community Development Action
Research Projects. Hawkesbury: Hawkesbury Agricultural College.
Gammon, D. M. & Roberts, B. R., 1978. Patterns of defoliation during continuous and rotational grazing of the Matopos Sandveld of Rhodesia. 1. Selectivity of grazing. Rhodesian Journal of
Agricultural Research, 16, 117-31. Genesis, 2005. Online parallel Bible. Available on:
http://bible.cc/genesis/6-5.htm GLEAM., 2002. A Forum on sustainability modeling and assessment:
What's new? Available on: http://www.unu.edu/env/Gleam/Concept.html
Glimp, H.A. & Swanson, S.R., 1994. Sheep grazing and riparian and watershed management. Sheep Research Journal, Special Issue, 65-71.
Glossary of Terms Used in Range Management, 2002. Range sites of Florida. Glossary of terms used in range management. Available on: http://wfrec.ifas.ufl.edu/range/rangelands/glossary.htm
Gowing, J., Tarimo, A. and El-Awad, O., 1996. A rational methods for assessing irrigation performance at farm level with the aid of fuzzy set theory. Irrigation and Drainage Systems, 10, 319-339.
Grigg, G., 1995. Kangaroo harvesting for conservation of rangelands, kangaroos, and graziers. In: G.C. Grigg, P.T. Hale and Lunney D. (Eds.), Conservation Through Sustainable Use of Wildlife (161-165). Centre for Conservation Biology:University of Queensland.
Grint, K., 1997. Fuzzy Management. Oxford: Oxford University Press. Hardesty, L., Lawrence, J.H., Gill, S.J. and Chapman, R.C., 1993.
Private forest landowner’s perceptions of forest grazing in Washington State. Journal of Range Management, 46, 49-55.

151
Harris, J.M., 2001. Agriculture in a global perspective. Global Development and Environment Institute. Working Paper No. 01-04. Available on: http://ase.tufts.edu/gdae/publications/working_papers/agric4.wo
rkingpaper.PDF Hart, M., 2000. An introduction to sustainability. Available on:
http://www.sustainablemeasures.com/Sustainability Hart, R.H., Bissio, J., Samuel, M.J. & Waggoner, J.W., 1993. Grazing
systems, pasture size, and cattle grazing behavior, distribution and gains. Journal of Range Management, 46, 81-87.
Hastie, T., Tibshirani, R. and Friedman, J., 2001. The Elements of
Statistical Learning. Data Mining, Inference and Prediction. New York: Springer.
Hawkins, R., 1997. Training in interdisciplinary team research for agricultural development: The experience of ICRA. European
Journal of Agricultural Education and Extension, 4(1), 49-66. Heitschmidt, R.K., Dowhower, S.L. & Walker, J.W., 1987. 14- Vs.
42-Paddock rotational grazing: Above ground biomass dynamics, forage production, and harvest efficiency. Journal of Range
Management, 40, 216-223. Hiernaux, P., 1996. The Crisis of Sahelian Pastoralism: Ecological or
Economic? ODI Pastoral Development Network Paper 39a. 20p. London: Overseas Development Institute.
Heemskerk, M., Wilson, K. & Pavao-Zuckerman, M., 2003. Conceptual models as tools for communication across disciplines. Conservation Ecology, 7(3), 8. [online] Available on: http://www.consecol.org/vol7/iss3/art8/
HMSO, 1994. Sustainable Development: The UK Strategy. Cm 2429. HMSO, London.
Hodgkinson, K.C., 1996. A model for perennial grass mortality under grazing. In: N.E. West (Ed.), Rangelands in a Sustainable
Biosphere. Proceedings Vth International Rangeland Congress, Vol. I., pp. 240-241. Denver: Society for Range Management.
Hodgkinson, K.C. & Freudenberger, D.O., 1997. Production pulses and flow-ons in rangeland landscapes. In: J.A. Ludwig, D.J. Tongway, D.O. Freudenberger, J.C. Noble & K.C. Hodgkinson (Eds.), Landscape Function, Ecology and Management:
Principles from Australia's Rangelands (23-34). Melbourne: CSIRO.

152
Hodgkinson, K.C. & Harrington, G.N., 1985. The case for prescribed burning to control shrubs in Eastern semi-arid woodlands. Australian Rangeland Journal, 7, 64-74.
Holechek, J.L., & Hawkes, J., 1993. Desert and prairie ranching profitability. Rangelands, 15, 104-109.
Holechek, J.L. & Hess, K., 1995. The emergency feed program. Rangelands, 17, 133-136.
Holechek, J.L., Pieper, R.D. & Herbel, C.H., 1989. Range
Management Principles and Practices. Englewood Cliffs: Regents/Prentice Hall.
Holliday, C. and Pepper, J., 2005. Sustainability through the market: Our opportunity. Available on: http://www1.dupont.com/dupontglobal/corp/documents/US/en_U
S/news/speeches/wbcsdreport.pdf
Holmes, J.H., 1996. Diversity and change in Australia's rangeland regions: Translating resource values into regional benefits. Rangeland Journal, 19, 3-25.
Howery, L.D., Sprinkle, J.E., and Bowns, J.E., 2000. A summary of
livestock grazing systems used on rangelands in the Western
United States and Canada. Cooperative Extension, College of Agriculture & Life Sciences, The University of Arizona.
Iranian Nomadic Organization, 1992. Proceedings of Development
Strategy of Iranian Nomadic Life. Iran: Ashayeri Publications. Iran Rozaneh, 2003. Nomads in Iran. Available on:
http://www.rozanehmagazine.com/janfeb2003/aculture.html
Irons, W. and Dyson-Hudson, N. (Eds.), 1972. Perspectives on
Nomadism. Leiden: Brill. Irons, W., 1975. The Yomut Turkmen: A Study of Social Organization
among a Central Asian Turkicspeaking Population. Ann Arbor: University of Michigan.
ISAS, 2001. Biotech ‘Tailor-Made’ for Africa, researcher tells tufts conference. Council for Biotechnology Information, Washington, D.C., November 19, 2001. Available on: <index.asp?id=1156&redirect=con1309mid17%2Ehtml>
Ishibuchi, H., Nakashima, T. and Morisawa, T., 1999. Voting in fuzzy rule-based systems for pattern classification problems. Fuzzy Sets
and Systems, 103(1), 223-238. IUCN/IDRC (International Union for the Conservation of
Nature/International Development Research Center), 1995. Assessing progress towards sustainability: a new approach. In:

153
Thadeus, Trzuna (Eds.), A Sustainable World: Defining and
Measuring Sustainable Development (172-182). Sacramento. IUCN/UNEP/WWF (International Union for the Conservation of
Nature/United Nations Environment Program/WorldWide Fund for Nature), 1991. Caring for the Earth: A Strategy for
Sustainable Living. IUCN, Gland, Switzerland. Jameson, D.A., 1963. Responses of individual plants to harvesting.
The Botanical Review, 29, 532-594. Jang, J.-S.R., Sun, C.-T. and Mizutani, E., 1997. Neuro-Fuzzy and Soft
Computing, A Computational Approach to Learning and
Machine Intelligence. Prentice Hall. Johnston, A. and Peake, R.W., 1960. Effect of selective grazing by
sheep on the control of leafy spurge (Euphorbia esula L.). Journal of Range Management, 13,192-195.
Jones, R.A., 1985. Research Methods in the Social and Behavioral
Sciences. Massachusetts: Sinauer Association Inc. Kanwar, R.S., 2003. Environmental degradation and water security for
the world population. Available on: http://www.ucowr.siu.edu/proc/T9B.pdf
Kautza, T. and Gronski, R., 2003. Water ethic to renew the earth. Catholic Rural Life Magazine, 45(2). Available on: http://www.ncrlc.com/crl-magazine-articles/vol45no2/Gronski-
Kautza.pdf Kauffman, J.B. & Krueger, W.C., 1984. Livestock impacts on riparian
ecosystems and streamside management implications: a review. Journal of Range Management, 37, 430-438.
Kenny, G., 2004. Report to the productivity commission. Cost and stocking rate data for the Murweh Shire. Available on: http://www.pc.gov.au/inquiry/nativevegetation/consultancy/murw
eh1/murweh1.pdf
Kopp, J., 2004. Stocking Rates and AUM- frequently Asked Questions. Alberta government. Department of Agriculture, Food and Rural Development.
Kosko, B., 1993. Fuzzy Thinking. New York: Hyperion. Kothmann, M.M., Hinnant, R.T. & Taylor, C.A., 1997. The role of
grazing management in overcoming juniper. Proc. Juniper
Symposium. Texas Agric. Exp. Stn. Tech. Rep. Kovács, L. and Micsik, A., 2005. The design of voting and rating
services within Web4Groups. Available on: http://dsd.sztaki.hu/publications/cscwid97-
bangkok/BankokCikkFinal.htm

154
Landsberg, J.J., James, C. and Morton, S., 1997. Assessing the effects of grazing on biodiversity in Australia's rangelands. Australian
Biologist, 10, 153-162. Landsberg, J.J., O'Connor, T. G. and Freudenberger, D.O., 1999. The
impacts of livestock grazing on biodiversity in natural ecosystems. In: Proceedings Vth International Symposium on the
Nutrition of Herbivores. Landsberg, J.J. and Stol, J., 1996. Spatial distribution of sheep, feral
goats and kangaroos in woody rangeland paddocks. Rangeland
Journal, 18, 270-291. Larsen, J., 2002. Earth times. Population growth leading to land
hunger. Available on: http://www.sdearthtimes.com/et0403/et0403s9.html
Larsen, J., 2003. Population growth leading to land hunger. Earth Policy Institute. Available on: http://www.earth-
policy.org/Updates/Update21.htm Lacey, J. and Taylor, J., 2005. Montana guide to range site, condition
and initial stocking rates. Available on: http://www.montana.edu/wwwpb/pubs/mt8515.html
Lee, C.C., 1990. Fuzzy logic in control systems: Fuzzy logic controller–part I and II. IEEE Trans. Syst. Man Cyber., 20, 404-435.
Leigh, J. H. & Mulham, W.E., 1966. Selection of diet by sheep grazing semi-arid pastures of the Riverine Plain. 1. A bladder saltbush (Atriplex vesicaria) - cotton bush (Kochia aphylla) community. Australian Journal of Experimental Agriculture and
Animal Husbandry, 6, 460-467. Lusigi, W. and Acquay, H., 1999. Challenges facing pastoralists in the
drylands of subSaharan Africa. VIth International Rangeland
Congress Proceedings, 2, 83-84. Lyons, R.K. and Machen, R.V., 2005. Stocking rate: The key grazing
management decision. Available on: http://rangeweb.tamu.edu/extension/rangedetect/l5400_sr.pdf
MAF, 2000. Impediments to optimising the economic and environmental performance of agriculture. Available on: http://www.maf.govt.nz/mafnet/rural-nz/profitability-and-
economics/performance/impediments-to-optimum-
performance/impopt-05.htm Mamdani, E.H. and Gaines, B.R., 1981. Fuzzy Reasoning and its
Applications. London: Academic Press.

155
Manske, L.L., 2004. A method of determining stocking rate based on monthly standing herbage biomass. Available on: http://www.ag.ndsu.nodak.edu/dickinso/research/2003/range03s.
htm Marks, L.A. Dunn, E.G. Keller, J.M. and Godsey, L.D., 1995.
Multiple Criteria Decision Making (MCDM) using fuzzy logic: An innovative approach to sustainable agriculture. IEEE
Proceedings of ISUMA-NAFIPS ’95, Missouri-Columbia, USA. Marshall, C. and Rossman G.B., 1995. Designing qualitative research.
Available on: http://www.geocities.com/zulkardi/turmudi.html
Martin, S.C., 1978. Grazing systems -- What can they accomplish? Rangeman's Journal, 5, 14-16.
McKeown, R., Hopkins, C., Rizzi, R. and Chrystalbridge, M., 2002. Education for Sustainable Development Toolkit. Energy, Environment and Resources Center, University of Tennessee.
McMurphy, W.E., Gillen, R.L., Engle, D.M. & McCollum, F.T., 1990. The philosophical difference between range and pasture management in Oklahoma. Rangelands, 12, 197-200.
Meadows, D., 1998. Indicators and Information Systems for
Sustainable Development. A Report to the Balaton Group. Hartland: The Sustainability Institute.
Mesbahi, M., 2004. Water wars. Available on: http://www.countercurrents.org/en-mesbahi251104.htm
Mesdaghi, M., 1995. Management of Iran’s Rangelands. Mashhad: Imam Reza University.
Milchunas, D. G., Sala, O.E., and Lauenroth, W.K., 1988. A generalized model of the effects of grazing by large herbivores on grassland community structure. The American Naturalist, 132, 87-106.
Miller, D.J., 2005. Rangeland management in the Hindu Kush-Himalayas. International Centre for Integrated Mountain Development (ICIMOD). Available on: http://www.icimod.org/focus/rangelands/range3.htm
Miller, R., 1995. Range Management: The Art and Science. The Pacific Northwest Section, Society for Range Management Newsletter.
Milne, R., 1995. World food issues: Past and present. A Christian perspective on “population alarmism”. Available on: http://www.agron.iastate.edu/courses/agron342/milne.html
Milne, R., 2002. World population. Available on: http://www.leaderu.com/orgs/probe/docs/worldpop.html

156
Mitchell, J.D., 1998. Before the next doubling. Available on: http://www.worldwatch.org/may/1998/98-1.html
Mitchell, J.E., Joyce, L.A. and Bryant, L.D., 1999. Applicability of Montreal process criteria and indicators to rangelands. VIth
International Rangeland Congress Proceedings, 1, 183-184. Morita, T., Nakicenovic, N. and Robinson, J., 2000. The Relationship
between Technological Development Path and the Stabilization
of Atmospheric Greenhouse Gas Concentrations in Global
Emissions Scenarios. Center of Global Environmental Research (CGER). National Institute for Environmental Studies.
Mortensen, I.D., 1993. Nomads of Luristan. History, Material Culture
and Pastoralism in Western Iran. London: Thames & Hudson / Copenhagen: Rhodos.
Mosley, J.C., 1994. Prescribed sheep grazing to enhance wildlife habitat on North American rangelands. Sheep Research Journal,
Special Issue, 79-91. Munda, G., Nijkamp, P. and Rietveld, P., 1994. Qualitative
multicriteria evaluation for environmental management. Ecological Economics, 10, 97-112.
Namey-e-Otaq-e-Bazargani, 1996. The Life and Economy of Iranian Tribesmen in Iran. Journal of Chamber of Commerce, 3, 63-66. (The publication of the Chamber of Commerce, Industries and Mines of the Islamic Republic of Iran). [online]: http://www.kkhec.ac.ir/Iran%20information/life_and_economy_o
f_iranian_trib.htm National Research Council. 1993. Sustainable Agriculture and the
Environment in the Humid Tropics. Washington, DC: National Academy Press.
Nationmaster, 2005. Encyclopedia: Sustainable development. Available on: http://www.nationmaster.com/encyclopedia/sustainable-
development Niblo, D.M. and Jackson, M.S., 1999. Qualitative data & private
security in the hospitality industry: The hidden agenda. Available on: http://www.latrobe.edu.au/aqr/offer/papers/MNiblo.htm
NGO Forum for Food Sovereignty, 2002. Policies for mobile pastoralism, rangeland management, and arid lands. Available on: http://www.iucn.org/themes/ceep/Wkg_grp/SL/pastoralism%20p
olicies.pdf

157
NRCS, 2000. Animal unit. Delaware Nutrient Management Notes,
1(2). [online] Available on: http://www.state.de.us/deptagri/nutrients/newsltr/feb_00.shtml
Nshimbani, J., 2004. Zamculture for human and social development. Culture and Rural Development Research. Available on: http://africa.eduprojects.net/agriculture/index.php?action%5B%
5D=IArticleShow::showArticle('352') OECD (Organization for Economic Cooperation and Development),
1994. Environmental Indicators. OECD, Paris. Oldcarpet, 2005. Qashqai. Available on:
http://www.oldcarpet.com/qashqai.htm
Olson, B.E. & Lacey, J.R., 1994. Sheep: A method for controlling rangeland weeds. Sheep Research Journal, Special Issue, 105-112.
Ortega, R., 2002. Studies in the subject of opinion leadership. Available on: http://www.ciadvertising.org/student_account/spring_02/adv382j
/ortega/Theories.htm Owens, S., 2001. Salt of the earth. European Molecular Biology
Organization. Available on: http://www.monsanto.co.uk/news/ukshowlib.phtml?uid=5890
PAI, 2005. Conserving land. Population and sustainable food production. Committee for the National Institute for the Environment. Available on: http://www.cnie.org/pop/conserving/landuse.htm
Patton, M.Q., 1987. How to Use Qualitative Methods in Evaluation. London: SAGE Publications.
Pearce, D.W., Atkinson, G.D., 1993. Capital theory and the measurement of sustainable development: an indicator of weak sustainability. Ecological Economics, 8, 103-108.
Pedrycz, W., 1994. Why triangular membership function? Fuzzy Sets
and Systems, 64, 21-30. Pedrycz, W., 2001. Fuzzy equalization in the construction of fuzzy
sets. Fuzzy Sets and Systems, 119, 329-335. Pembleton, P.N., 2004. Sustainability and Impacts. Technical
Analysis Report. California Department of Transportation, Transportation Energy Efficiency and Conservation Project.
Pender, J., 1999. Rural population growth, agricultural change and natural resource management in developing countries: A review of hypotheses and some evidence from Honduras. International Food Policy Research Institute. Environment and Production

158
Technology Division. Available on: http://www.ifpri.org/divs/eptd/dp/papers/eptdp48.pdf
Peters, T.J. & Waterman, R.H., 1982. In Search of Excellence Lessons
from America's Best-Run Companies. New York: New York Harper & Row, Publishers.
Peterson, E., 1998. What earth day means to minority citizens. Available on: http://www.nationalcenter.org/NPA193.html
Phillis, Y.A. and Andriantiatsaholiniania, L., 2001. Sustainability: An ill defined concept and its assessment using fuzzy logic. Ecological Economics, 39, 435-456.
Pickett, S.T.A., Burch, W.R., and Grove, J.M., 1999. Interdisciplinary research: maintaining the constructive impulse in a culture of criticism. Ecosystems, 2, 302-307.
Pimentel, D. and Wilson, A., 2005. World population, agriculture, and malnutrition. Available on: http://www.energybulletin.net/3834.html
Pimentel, D. and Giampietro, M., 2001. US population growth factsheet. Available on: http://www.balance.org/articles/factsheet2001.html
Pimentel, D., Huang, X., Cordova, A., and Pimentel, M. 1996. Impact of population growth on food supplies and environment. Available on: http://dieoff.org/page57.htm
Pinstrup-Andersen, P. and Cohen, M. J., 1998. Aid to developing country agriculture: Investing in poverty reduction and new export opportunities. International Food Policy Research Institute. Available on: <http://www.ifpri.org/2020/briefs/number56.htm>
Pinstrup-Andersen, P. and Pandya-Lorch, R., 1999. Meeting food needs in the 21st century. How many and who will be at risk? Available on: http://www.ifpri.org/pubs/jhu/fed21century/fed21century_chapte
r01.pdf Polley, H.W., 1997. Implications of rising atmospheric carbon dioxide
concentration for rangelands. Journal of Range Management, 50, 561-577.
Pretty, J.N., 1995. Regenerating Agriculture – Policies and Practice
for Sustainability and Self-Reliance. Washington D.C.: Joseph Henry Press.
Pretty, J. and Hine, R., 2001. Reducing food poverty with sustainable agriculture: A summary of new evidence. SAFE-World Research Project. University of Essex, Centre for Environment and

159
Society. Available on: http://www2.essex.ac.uk/ces/ResearchProgrammes/SAFEWexecs
ummfinalreport.htm
Qashqai.net., 2003. A short historical overview (A meta-narrative?). Available on: http://www.qashqai.net/history.htm
Radcliffe, J.E., 1985. Grazing management of goats and sheep for gorse control. New Zealand Journal of Experimental Agriculture,
13, 181-190. Rao, L., 1999. Future harvest: Agriculture & overpopulation.
Magazine of the Cousteau Society, October. Available on: http://www.futureharvest.org/news/calypso.shtml
Raven, P.H., 2004. Feeding a hungry world: The moral imperatives of biotechnology. The Pontifical Gregorian University, Rome. Available on: http://vatican.usembassy.it/policy/events/Biotech2004/Raven.pdf
Redfearn, D.D. and Bidwell, T.G., 2004. Stocking rate: The key to successful livestock production. Available on:
http://www.osuextra.com Reich, P.F., Numbem, S.T., Almaraz, R.A. and Eswaran, H., 2001.
Land resource stresses and desertification in Africa. In: E.M. Bridges, I.D. Hannam, L.R. Oldeman, F.W.T. Pening de Vries, S.J. Scherr, and S. Sompatpaint (Eds.), Responses to Land
Degradation. Proc. 2nd. International Conference on Land Degradation and Desertification, Khon Kaen, Thailand. Oxford Press, New Delhi, India.
Rennings, K. and Wiggering, H., 1997. Step towards indicators of sustainable development: Linking economic and ecological concepts. Ecological Economics, 20, 25-36.
Richards, J.F., 1990. Land Transformation. In: B.L. Turner (Ed.), The
Earth as Transformed by Human Action. New York: Cambridge with Clark University.
Rigby, D., Woodhouse, P., Young, T. and Burton, M., 2001. Constructing a farm level indicator of sustainable agricultural practice. Ecological Economics, 39, 463-478.
Riggio, R., Bomar, G. and Larkin, T., 1987. Texas Drought: Its Recent
History (1931-1985). Texas Water Commission, Austin Texas LP 87-04. 74 pp.
Roe, E.M., 1997. Viewpoint: On rangeland carrying capacity. Journal
of Range Management, 50(5), 467-472. Roshier, D.A. and Nicol, H.I., 1998. Implications of spatio-temporal
variation in forage production and utililisation for animal

160
productivity in extensive grazingsystems. Rangeland Journal, 20, 3-25.
RS and NAS, 1992. The Royal Society and the National Academy of Sciences on Population Growth and Sustainability. Population
and Development Review, 18 (2), 375-378. Ruspini, E.H., Bonissone, P.P. and Pedrycz, W. (Eds.), 1998.
Handbook of Fuzzy Computation. Bristol and Philadelphia: Institute of Physics Publishing.
Sam-Amoah L.K. and Gowing, J.W., 2001. Assessing the performance of irrigation schemes with minimum data on water deliveries. Irrigation and Drainage Systems, 50, 31-39.
Savory, A. and Butterfield, J., 1999. Holistic Management: A New
Framework for Decision Making. Washington D.C.: Island Press. Seers, D. 1982. The meaning of development. In: G.E. Jones and M.J.
Rolls (Eds.), Progress in Rural Extension and Community
Development, 1, 7-24. John Wiley and Sons, Ltd. Sands, D.M., 1986. Farming systems research: clarification of terms
and concepts. Expl. Agric. 22, 87-104. Serf Publishing Inc., 2001. Food & Agriculture...A Growing World
Crisis! The U.S. Dept. of Agriculture, the former Ambassador Agricultural Research Department, Agresource Management Associates, Agrotech Research Group.
Shah, M. and Strong, M., 1999. Food in the 21st century: From science to sustainable. Consultative Group on International Agricultural Research (CGIAR). Available on: http://www.worldbank.org/html/cgiar/publications/shahbook/sha
hbook.pdf
Shahvali, M. and Azadi, H., 1999. Designing of extension research on the basis of paradisciplinary. A Quarterly Journal of Ightesade
Kishavarzi Va Towse'e 2(4), 21-56. Shaner, W.W., Philip, P.F. and Schmehl, W.R., 1982. Farming
Systems Research and Development: Guidelines for Developing
Countries. Westview Press. Sherp, J., 1994. What does an economist need to know about the
environment? Directorate General for Economics and Financial Affairs. Economic Papers of the European Commission No. 107.
Sicat, R.S., Carranza, E.J.M. and Nidumolu, U.B., 2005. Fuzzy modeling of farmers’ knowledge for land suitability classification. Agricultural Systems 83, 49-75.
Silvert, W., 1997. Ecological impact classification with fuzzy sets. Ecological Modelling, 96, 1-10.
161
Sogol, No date. Tribes of Iran. Available on: http://www.sogol.com/WHP/IINT/IRTRIBE.htm
Stafford Smith, M., 1996. Management of rangelands: Paradigms at their limits. In: J. Hodgson and A.W. Illius (Eds.), The Ecology
and Management of Grazing Systems (325-357). Wallingford: CAB International.
Stoddart, L.A. and Smith, A.W., 1943. Range Management (First Edition). McGraw-Hill, New York.
Stoddart, L.A. and Smith, A.W., 1955. Range Management (Second Edition). McGraw-Hill, New York.
Stoddart, L.A., Smith, A.W. and Box, T., 1975. Range Management (Third Edition). McGraw-Hill, New York.
Strauss, A. and Corbin, J., 1990. Basic Qualitative Research
Grounded Theory Procedures and Techniques. London: SAGE.
Stuth, J.W. and Lyons, B.G. (Eds.), 1993. Decision Support Systems
for the Management of Grazing Lands: Emerging Issues. Carnforth: The Parthenon PublishingGroup Inc.
Swee, G.M., 1981. Sedentarization: Change and Adaptation among
the Kordshuli Pastoral Nomads of Southwestern Iran. Ph.D. Thesis. Michigan: Michigan State University.
Taghi Farvar, M. and Jandaghi, M., 1998. Thematic Programme
Network III for Regional Co-operation under the Convention to
Combat Desertification (CCD). Tehran: The Government of the Islamic Republic of Iran and the Interim Secretariat of the Convention to Combat Desertification.
Tagaki, T. and Sugeno, M., 1985. Fuzzy identification of systems and its applications to modeling and control. IEEE Transactions on
Systems, Man and Cybernetics, 15(1), 116–132. Takle, E.S., 2001. Sustainable development. Available on:
http://www.iitap.iastate.edu/gccourse/develop/sust_develop_lectu
re.html Tapper, R., 1979. Pasture and Politics: Economics, Conflict and
Ritual among the Shahsevan Nomads of Northwestern Iran. London: Academic Press.
Tapper, R. (Ed.), 1983. The Conflict of Tribe and State in Iran and
Afghanistan. London: Croom Helm. Tapper, R., 1997. Frontier Nomads of Iran. Cambridge: Cambridge
University Press. Tesch, R., 1990. Qualitative Research: Analysis Types and Software
Tools. New York: The Falmer Press.

162
Thompson, P.B., 1995. The Spirit of the Soil: Agriculture and
Environmental Ethics. New York: Routledge. The Online Newsletter of the Bahá'í International Community, 1996.
The importance of agriculture. The Online Newsletter of the
Bahá'í International Community, 8(2). [online] Available on: http://www.onecountry.org/oc82/oc8202as.html
Travel Explorations, 2004. Trekking through the lands of the Iranians nomads – Part 1 of 2. Available on: http://www.travelexplorations.com/cparticle175488-18553a.html
Truelsen, S., 2003. Agriculture Faces Huge Task in Scenario for the Future. Available on: http://www.fb.org/views/focus/fo2003/fo0113.html
UN, 2000. Sustainable agriculture and rural development. Available on: http://www.un.org/documents/ecosoc/cn17/2000/ecn172000-
7add3.htm UNCED (United Nations Conference on Environment and
Development), 1992. Agenda 21. New York: UNCED. UNCT, 2001. United Nations inter-agency assessment report on the
extreme drought in the Islamic Republic of Iran. Available on: http://www.reliefweb.int/w/Rwb.nsf/0/08951820c13c2bc5c1256a
85005081e0?OpenDocument UNDP, 2001. Human development report. Available on:
http://hdr.undp.org/reports/global/2001/en/pdf/pr2.pdf UNDP, 2003. Earth policy news – Population growth & land hunger.
Available on: http://www.undp.org.vn/mlist/envirovlc/012003/post74.htm
UNEP, 1992. Caring for the Earth: A Learner’s Guide to Sustainable
Living. New York: United Nations. UNEP, 2000. Atmosphere. Available on:
http://www.unep.org/geo2000/english/0048.htm UNESCO, 1996. Enhancing Social Scientific Understanding of
Sustainability. Declaration on the occasion of the conference "Sustainability as a Social Science Concept" within the UNESCO-MOST Programme, held in Frankfurt, November 1996. Available on: http://www.unesco.org/most/sustdecl.htm
UNFPA, 2003. State of World Population 2003. Making 1 Billion Count: Investing in Adolescents’ Health and Rights. United Nations Population Fund. Available on: http://www.unfpa.org/swp/2003/english/ch1/
UNFPA, 2005. Population & demographic dynamics. Available on: http://www.unfpa.org/sustainable/demographics.htm

163
UNPD, 2003. World Population Prospects. The 2002 Revision (Vol. I: Comprehensive Tables). New York: UN Population Division.
van den Berg, J., 2004. Fuzzy methodologies for evaluating sustainable development. ICMCS Conference, Nigeria: Lagos.
van der Werff, T.J., 1998. Threats and opportunities in a new century. Available on: http://www.globalfuture.com/9512.htm
Waggoner, P., 1994. How Much Land Can Ten Billion People Spare
for Nature? Council for Science and Technology, Ames, Iowa. Walker, J.W., 1994. Multi-species grazing: the ecological advantage.
Sheep Research Journal, Special Issue, 52-64. Walker, J.W., 1995. Viewpoint: Grazing management and research
now and in the next millennium. Journal of Range Management,
48(4), 350-357. Walker, J.W. and Hodgkinson, K.C., 2000. Grazing management:
New technologies for old problems. http://sanangelo.tamu.edu/walker/incpaper.htm
WCED (World Commission on Environment and Development), 1987. Our Common Future. Oxford University Press, Oxford.
Westoby, M., Walker, B.H. & Noy-Meir, I., 1989. Opportunistic management for rangelands not at equilibrium. Journal of Range
Management, 42, 266-274. Wikipedia, 2005. Sustainable development. Available on:
http://en.wikipedia.org/wiki/Sustainable_development Williams, J.K., 2000. Churchpeople, socialism, and capitalism.
Available on: http://www.libertyhaven.com/noneoftheabove/religionandchristia
ns/churchpeople.html Wilson, E., 1999. One third of world's population 2.7 billion people
will experience severe water scarcity by 2025, says new study. Future Harvest. Available on: http://www.futureharvest.org/news/03171999.shtml
Wilson, A.D. and Macleod N.D., 1991. Overgrazing: Present or absent? Journal of Range Management, 44(5), 475-482.
World Bank, 1998. Population growth rate. Available on: http://www.worldbank.org/depweb/english/modules/social/pgr/index03.html
World Resources Institute, 1994. World Resources 1994-95. New York: Oxford.
Yin, R.K., 1989. Case study research design and methods. Available on: http://www.geocities.com/zulkardi/turmudi.html

164
Zadeh, L.A., 1973. Outline of a new approach to the analysis of complex systems and decision processes. IEEE Transactions on
Systems, Man, and Cybernetics, 1 (1), 28–44. Zadeh, L.H., 1965. Fuzzy sets. Information and Control, 8, 338–353. Zilberman, D. and Alix, J., 2005. Principles of environmental
policymaking. Department of Agricultural and Resource Economics University of California at Berkeley. Available on: http://are.berkeley.edu/courses/ARE253/2004/handouts/envpolic
ymaking.pdf Zimmermann, H.J., 1996. Fuzzy Set Theory and its Applications
(Third Edition). Boston: Kluwer Academic Publishers.

165
APPENDIX 1
General information of data collection Number of studied area 3 regions
Number of data collection 3 rounds
Spent time of data collection 18 months
Number of conducted major interviews 9 sessions
Number of conducted minor interviews 21 follow-ups
Average time of major interviews at first round 3 hours
Average time of major interviews at second round 3 hours
Average time of major interviews at third round 5 hours
Average time of minor interviews 2 hours

166
APPENDIX 2
If–Then Rules
EAFL Model:

167
Multi Fuzzy Model: Model 1

168

169

170
Model 2

171

172

173

174

175

176
Model 3

177