phase diagrams for surface alloys - dtu research database · 56 phase diagrams for surface alloys...
TRANSCRIPT
General rights Copyright and moral rights for the publications made accessible in the public portal are retained by the authors and/or other copyright owners and it is a condition of accessing publications that users recognise and abide by the legal requirements associated with these rights.
Users may download and print one copy of any publication from the public portal for the purpose of private study or research.
You may not further distribute the material or use it for any profit-making activity or commercial gain
You may freely distribute the URL identifying the publication in the public portal If you believe that this document breaches copyright please contact us providing details, and we will remove access to the work immediately and investigate your claim.
Downloaded from orbit.dtu.dk on: Jun 03, 2020
Phase diagrams for surface alloys
Christensen, Asbjørn; Ruban, Andrei; Stoltze, Per; Jacobsen, Karsten Wedel; Skriver, Hans Lomholt;Nørskov, Jens Kehlet; Besenbacher, Flemming
Published in:Physical Review B
Publication date:1997
Document VersionPublisher's PDF, also known as Version of record
Link back to DTU Orbit
Citation (APA):Christensen, A., Ruban, A., Stoltze, P., Jacobsen, K. W., Skriver, H. L., Nørskov, J. K., & Besenbacher, F.(1997). Phase diagrams for surface alloys. Physical Review B, 56(10), 5822-5834.http://link.aps.org/doi/10.1103/PhysRevB.56.5822

PHYSICAL REVIEW B 1 SEPTEMBER 1997-IIVOLUME 56, NUMBER 10
Phase diagrams for surface alloys
A. Christensen, A. V. Ruban, P. Stoltze, K. W. Jacobsen, H. L. Skriver, and J. K. No”rskovCenter for Atomic-scale Materials Physics (CAMP), Department of Physics, Technical University of Denmark,
DK-2800 Lyngby, Denmark
F. BesenbacherCenter for Atomic-scale Materials Physics (CAMP), Institute of Physics and Astronomy, University of Aarhus,
DK 8000 Aarhus, Denmark~Received 22 November 1996!
We discuss surface alloy phases and their stability based on surface phase diagrams constructed from thesurface energy as a function of the surface composition. We show that in the simplest cases of pseudomorphicoverlayers there are four generic classes of systems, characterized by the sign of the heat of segregation fromthe bulk and the sign of the excess interactions between the atoms in the surface~the surface mixing energy!.We also consider the more complicated cases with ordered surface phases, nonpseudomorphic overlayers,second layer segregation, and multilayers. The discussion is based on density-functional calculations using thecoherent-potential approximation and on effective-medium theory. We give self-consistent density-functionalresults for the segregation energy and surface mixing energy for all combinations of the transition and noblemetals. Finally we discuss in detail the cases Ag/Cu~100!, Pt/Cu~111!, Ag/Pt~111!, Co/Cu~111!, Fe/Cu~111!,and Pd/Cu~110! in connection with available experimental results.@S0163-1829~97!07534-6#
esa
os
tahee
er
erut tsesrth
loatdemminbyuiln
ite
eme
ogyces ofbyho-re-
sity-tedsis-
tor-be
s oflatercussx-m-
sity-the
ionen-
ms.
g-
f as-of
I. INTRODUCTION
When one metal is deposited on another, one observnumber of different phenomena. The deposited metal mform islands on the substrate or it may alloy into the firstdeeper layers.1–7 Alloying may take place both in casewhere the two metals form an alloy in the bulk8–17 and incases where they do not.16,18–26,28Also, one observes newoverlayer phases with a structure and periodicity substially different from that of the substrate. Furthermore, tmismatch between the overlayer and the substrate may blarge that misfit dislocation structures are formed even aftsingle layer has been deposited.27,29,30 In some cases thestructures that are formed during deposition reflect the thmodynamic ground state of the system, but often the sttures are metastable, and the observations partly refleckinetics of the deposition, diffusion, and growth processe
The wealth of phenomena that has been reported makimportant to be able to categorize the observed behaviosome way, and the recent literature shows many efforts indirection of developing the thermodynamics of surface alformation.31–35In this endeavor it is important to note thatordinary temperatures the entropy driven diffusion of theposited material into the bulk is usually slow. Hence, at tiscales which are long in terms of kinetics but short in terof bulk diffusion, a local equilibrium may be establishedthe surface region.35 As a result, surface structures formeddepositing elements on surfaces are very stable in partictemperature ranges and one may therefore consider equrium not in the infinitely large system but in a local regionear the surface with a finite concentration of the deposelement.
With this quasiequilibrium in mind we concentrate in thpresent paper on the thermodynamics of surface alloy fortion. In particular, we suggest a transparent way of und
560163-1829/97/56~10!/5822~13!/$10.00
ay
r
n-
soa
r-c-he.
itine
y
-es
larib-
d
a-r-
standing the phase diagram of a surface alloy, in analwith phase equilibria in the bulk. We construct a surfaphase diagram, and introduce a number of generic classesystems with similar behavior. We support the analysiscalculations of the detailed energetics of a few systems csen to illustrate the different classes. The system-specificsults presented are based on self-consistent, denfunctional ~DFT! calculations and the more approximaeffective-medium theory. We do not consider small islanof one metal on another or the kinetics by which theselands are formed or agglomerated during the approachequilibrium. Our analysis therefore applies only to flat sufaces or at least large islands where edge effects mayneglected.
We start by a very general discussion of the energeticmetal on metal systems and introduce the concepts usedin the paper. For each of the cases we consider, we disthe calculation of the phase diagram in the light of the eperimental results for the system. Finally, we present a coplete database constructed from the self-consistent denfunctional calculations of the segregation energies andsurface mixing energies for all combinations of the transitmetals. This database may serve as a first entry into theergetics of surface alloys.
II. THE ENERGETICS OF A SURFACE ALLOY
We first define the surface energy in rather general terConsider an alloy consisting ofNA atoms of typeA andNB
atoms of type B, the total number of atoms beinN5NA1NB. Of theseN atomsNs are residing at the surface, while the remainingNb5N2Ns are bulk atoms. Weassume, for simplicity, that all surface and bulk atoms ogiven kind (A or B) are equivalent. The description can eaily be generalized if this is not the case. The composition
5822 © 1997 The American Physical Society

56 5823PHASE DIAGRAMS FOR SURFACE ALLOYS
FIG. 1. ~a! Sketch of a pure pseudomorphic overlayer phase and a pseudomorphic surface alloy phase.~b! Sketch of surface energyversus coveragex of deposited material. We have also illustrated the common tangent principle in this figure. See text for details.
nd
rlk
he
e
eneola
d
.yac
r
he
ys-be-sur-lk,
omlyur-tialon--
eg-
oterthels.
rgy
ot
the surface may differ from the bulk. We denote byNsA the
number ofA atoms in the surface with a similar conventiofor the number ofB atoms. We refer to the surface, bulk, anaverage concentration ofB atoms asxs ,xb , andx, respec-tively, and we only consider the case, where a single layethe surface has a composition different from that of the buThe formulas below are easily generalized to the case, wseveral layers deviate from the bulk composition.
We have collected the notation with the relations betwethe variables below:
N5NA1NB5Ns1NbNA,B5NsA,B1Nb
A,BNx5Nsxs1Nbxb ,
xs5Ns
B
Ns, xb5
NbB
Nb, x5
NB
N. ~1!
We write the total energy of the alloy system~in the limitN→`) as
E~NsA ,Ns
B ;NbA ,Nb
B!5Nses~xs ,x!1Neb~x!. ~2!
In the following, upper and lower case letters refer to extsive and intensive~per atom! quantities, respectively. Thbulk state is the reference state, which may be a dilute stion, an ordered, or a random alloy. The bulk state hasaverage energyeb(x) per atom. Since we work with a fixenumber ofA andB atoms, only two variables in Eq.~2! areindependent. The first term,es , on the right-hand side of Eq~2! is the surface energy per surface atom as can easilseen by calculating the energy with and without a surfpresent:
es51
Ns@E~Ns
A ,NsB ;NA2Ns
A ,NB2NsB!2E~0,0;NA,NB!#.
~3!
We will also consider the energy of surface segregation foB atom. We define this as the energy of interchanging aBatom in the bulk with anA atom atom in the surface:
in.re
n
-
u-n
bee
a
esegr5E~NsA21,Ns
B11;NbA11,Nb
B21!
2E~NsA ,Ns
B;NbA ,Nb
B!, ~4!
5NsFesS xs11
Ns,xD2es~xs ,x!G
5]es~xs ,x!
]xs. ~5!
The equilibrium surface concentration~at T50) is found byminimizing the surface energy or equivalently by setting tsegregation energy to zero.
A small amount of deposited material on a pure host crtal (x50) is always metastable at nonzero temperaturescause there are many more sites in the bulk than in theface. Hence the gain in entropy by dissolving into the buwhich is roughlyDS5kln(Nb /Ns), will drive the depositedmaterial away from the surface. However, close to rotemperature bulk diffusion in a metal is usually extremeslow, and a quasiequilibrium may be established in the sface region. It is therefore also of interest to study the parequilibrium at a surface even when the surface is at a nequilibrium concentration relative to the bulk. In the following we discuss on the basis of Eq.~3! the quasiequilibriumthat occurs, when diffusion between bulk and surface is nlible.
We now concentrate on the surface layer~or perhaps thefirst few surface layers! and ask the question whether the twcomponents in the surface layer will mix or form separaislands, and if they mix, whether they will mix randomly oform ordered structures. This is completely analogous tousual treatment of the thermodynamics of two bulk metaThe energetics of the two-dimensional~2D! alloying prob-lem at the surface is determined by the surface enees(xs ,x) as a function ofxs . In generales(xs ,x) for a fixedtotal compositionx may look as shown in in Fig. 1~b!. Werefer to this as a surface energy curve. In Fig. 1~b! we havealso illustrated the general common tangent principle.36,37
Given the surface energy curvees(x), the surface alloy withoverall concentrationx0 of B atoms may choose either tform a homogeneous solution (H) or to separate into distinc

ue
n
lieu
io
thra
e,liburopth
ac
rareb
o
hacthrizf
li
on
heon,
ns,7edns
ndfacetal-or
umcon-
npu-on-ap-
n-blebye-
g autsicaler
s-perc-
ffi-s ison-ifymble
lo-ra-
theesese.
yer
terdif-
fersdo-es,rgeed.
5824 56A. CHRISTENSENet al.
phases, say (S) and (P) with concentrationxS and xP , re-spectively, if the conditionxS,x0,xP is fulfilled. Due tooverall mass conservation, the relative abundance of (S) and(P) will scale according to the lever rule asxP2x0 tox02xS , which also implies that the energy of the phase eqlibrium of (S) and (P) will be a straight line between thpoints (S) and (P) in the surface energy diagram.
Phase separation occurs depending on whether (H) is be-low or above (SP) in Fig. 1~b!. If the surface energy curvees(x) is smooth, a general condition for phase separatiothat xS andxP embrace an interval, wherees(x) has a nega-tive curvature and that (S) and (P) are points on a commontangent~or an endpointx50 or x51) touchinges(x) at themost stable phase combination. If, however, many famiof phases compete, e.g., having different underlying strtures each with surface energy curveses
a(xsa),es
b(xsb), . . . ,
negative curvature is not a condition for phase separatWe will discuss such cases later.
The above considerations applies to theT50 limit. Atfinite temperatures one must include entropy effects andthermodynamic equilibrium is then determined by the oveminimum of the free energy
G5E2TS, ~6!
whereS is the entropy. Similar to the 3D bulk alloying caswe may include entropy effects for the surface quasiequirium by adding the entropy term of different disordered sface phases. Neglecting differences in the vibrational entrdue to alloying, the main dependence of the entropy onconcentration is the mixing entropy, given by38
smix52k@xsaln~xs
a!1~12xsa!ln~12xs
a!#, ~7!
wherexsa is the concentration of the disordered phasea ~or-
dered phases have vanishing mixing entropy!.In analogy with the 3D bulk case, we also define a surf
mixing energy by
esmix5es2e02xs~e12e0!, ~8!
wheree0 ande1 are the surface energies of the pure substand the surface covered with a monolayer of impurities,spectively. The 2D quasiequilibrium is then determinedthe minimum of the surface free energy of mixing
gmix5esmix2Tsmix ~9!
under the constraint that the average surface impurity ccentration is fixed toxs .
III. CALCULATIONAL DETAILS
We have employed two different computational tecniques to obtain surface energies for different binary surfalloy systems. Since we focus on energetic principles rathan the calculations themselves, we only briefly summaour computational approaches and refer to the literaturemore extensive details.
A. CPA calculations
The surface energies were calculated by means of theear muffin-tin orbitals~LMTO! method in the tight-binding
i-
is
sc-
n.
ell
--ye
e
te-
y
n-
-eere
or
n-
representation using the atomic-sphere approximation~ASA!in conjunction with the coherent-potential approximati~CPA! and a Green’s-function technique39–43 for the semi-infinite surface. The calculations were performed within tlocal-density approximation for exchange and correlatiusing the Perdew-Zunger44 and Vosko-Wilk-Nusair45 param-etrizations for paramagnetic and spin-polarized calculatiorespectively. For the bulk calculations, 240, 285, and 28kpoints in the irreducible wedge of the Brillouin zone are usfor fcc, bcc, and hcp, respectively. For surface calculatio90, 64, and 90 specialk points46 in the irreducible polygon ofthe surface Brillouin zone are used for fcc~111!, bcc~110!,and hcp~0001!, respectively. We have included potential adensity perturbations in three vacuum layers and nine surlayers, the deeper layers being assumed bulklike. For melic systems this is sufficient, due to efficient screening. Fthe Fe/Cu~111! and Co/Cu~111! calculations we have in-cluded potential and density perturbations of three vaculayers and 15 surface layers, because in these cases wesider concentration variations deeper into the bulk.
B. Effective-medium theory „EMT … calculations
The LMTO-ASA method is efficient and accurate whelattice relaxations at the surface or locally around an imrity may be neglected. When relaxation effects and recstructions become important, we have used the moreproximative effective-medium theory~EMT! to calculate thesurface energies. As we will show later, surface mixing eergies obtained by CPA and EMT are in quite reasonaagreement, indicating that including relaxation effectsmeans of EMT is a reasonable procedure. In effective mdium theory a semiempirical potential is constructed, usinfunctional form derived from density-functional theory, bwith parameters adjusted to reproduce a database of phyquantities and provide a reliable interpolation in othsituations.47,48The potential includes many-body effects~be-yond a pair potential!. The surface energies are obtained uing a slab geometry and the potential has short rangeconstruction ~it includes second nearest-neighbor interations!. All quantities are calculated in real space in a sucient large unit cell. For ordered phases, finite-size effectimmaterial, but in cases of possible incommensurable recstructions we have varied the size of the unit cell to verour results. In the case of random surface phases, enseaverages have been performed explicitly. In cases wherecal relaxations are included, each random atomic configution in the ensemble is relaxed locally before evaluatingenergy of the atomic configuration. The average of thenergies is the energy of the corresponding random pha
IV. PSEUDOMORPHIC MONOLAYER SURFACE ALLOYS
We first consider the simplest case where the overlagrows pseudomorphically on a substrate ofA atoms and weneglect the possibility of ordered overlayer structures. Lawe consider cases where the deposited metal takes on aferent, ordered structure along the surface or where it preto migrate to the second or third layer. The case of a pseumorphic surface phase naturally divides into two subcaswhere either pure surface layer phases in the form of lapatches with like atoms or surface alloy phases are form

r
tio
th
i
r
e.
th
heilibti
os
rta
wa
thd
ith
eu
tuon
tiv
pa-
r a
eest-
east ofeub-
mustt cer-le
. 2es
y,atede
om
iteT toredxed
thethemiccon-
red
acra. A
they
56 5825PHASE DIAGRAMS FOR SURFACE ALLOYS
This is illustrated in Fig. 1~a!. In both subcases, the first layehas compositionA12xBx , and the bulk, which is pureA, isassumed infinite. This is therefore the zero concentralimit of the impurity B in metalA.
If we plot the surface energy per substrate atom ofsystem as a function of the concentrationx of the depositedatomsB in the first layer, the surface energy curves aremost cases even simpler than suggested in Fig. 1~b!. Thesesurface energy curves fall into fourgeneric classes. An ex-ample of a binary alloy system belonging to each geneclass is shown in Fig. 2.
Consider now the case where metalB is deposited onpure metalA. If the segregation energy is negative, i.des /dx,0, cf. Eq.~5! at x50, as in Fig. 2~upper row!, thedeposited material stays in the surface layer. If, on the ohand, the segregation energy is positive as in Fig. 2~lowerrow!, the deposited material will eventually dissolve into tbulk. As discussed above, the global thermodynamic equrium state may not be established immediately for kinereasons and a metastable surface state where the depmaterial stays in the surface region may exist.
The surface energy curve possesses another impofeature, namely its curvature, expressing theB-B excess in-teractions in the surface layer. By excess interactionsmean interactions beyond that in an ideal solution, whereatomic arrangements~alloyed or dealloyed! are equallystable. A straight line connecting the surface energy ofclean surface (x50) and that of a monolayer of depositematerial (x51) represents the ideal solution behavior wno B-B excess interactions, see Fig. 2~dotted lines!. Oneway to realize a situation with no excessB-B interactions isby having large areas ofA andB phases in the surface. Thdotted line therefore also represents the surface energy cfor the case of 2D phase separation.
The difference between the straight line and the accurve is the mixing energy of the random surface solutiWhen this is negative, corresponding to repulsiveB-B ex-cess interactions, as in Fig. 2~left column!, surface alloying,stable or metastable, occurs. If the mixing energy is posi
FIG. 2. Examples of surface energy curves belonging to egeneric class obtained by LMTO-CPA calculations. For subststructure and lattice constant the proper bulk values are usedcalculations were performed in the paramagnetic state.
n
e
n
ic
,
er
-cited
nt
ell
e
rve
al.
e
on the other hand, as in Fig. 2~right column!, correspondingto attractiveB-B excess interactions, we expect phase seration ~island formation! in the surface solid solution.
There are obviously more possibilities if theB-B excessinteractions depend on the coverage, but typically, fogiven alloy system, the sign of theB-B excess interactions isthe same for all concentrationsx and the four cases in thfigure will encompass the most common cases. It is intering to note, that in the Ag-Cu~100! system, see Fig. 2, theAg-Ag excess interaction in the surface is repulsive, wherit is attractive in the bulk phase, as seen from the bulk heamixing.49 This sign reversal is driven by strain effects in thsurface layer, caused by the size mismatch with the Cu sstrate in the second layer.
V. ORDERED STRUCTURES AT SURFACES
There are a number of cases where additional phasesbe considered. For instance, ordered phases may exist atain stoichiometric ratios$x%. If these phases are more stabthan the corresponding random state in cases like Fig. 2~leftcolumn! or the phase-separated state in cases like Fig~right column!, phase transitions involving these structurmay occur. As an example we consider Ag on Cu~100! inmore detail. In Fig. 3, we plot the surface mixing energwhich is the energy difference between the phase-separ~dotted line! and surface alloy phases in Fig. 2. In Fig. 3, whave shown the mixing energy of the unrelaxed randphase ~dashed curves! obtained by LMTO-CPA and byEMT. It is seen that the CPA and EMT results are in qureasonable agreement, and we may therefore use the EMconsider relaxation effects and the mixing energy of ordealloy phases. The energy difference between the unrela~dotted curve! and relaxed~solid curve! random phase showthat relaxation effects are large in this surface alloy inAg-rich end. These large relaxation effects are due tolarge size mismatch, Ag atoms having a 13% larger atoradius than the Cu atoms, that fixes the substrate latticestant.
We have also included in Fig. 3 the energy of an orde
hte
ll
FIG. 3. Surface~mixing! energy of different Ag/Cu surfaceoverlayer phases on a Cu~100! substrate obtained by LMTO-CPAand by EMT. The mixing energy is the difference betweenphase-separated state~straight line in Fig. 2! and the surface energcurve.

gy
d
A
heo
n
sion
ctet-ad-
yabg
eoh
sef.
ach
-r
in
bes-
n a
i.e.,hein
o bebeareistsde-the
l be
leorm
toformre-ate-ills
rera
. 4,,by
e the
um.
5826 56A. CHRISTENSENet al.
phase, thec(232) structure~bold dot! at x5 12. At each side
of the c(232) point we have calculated the mixing enerof the c(232) structure with defects~dash-dotted curve!,i.e., for x, 1
2 Ag atoms in thec(232) structure are replaceby Cu atoms and vice versa forx. 1
2. The numerical value ofthe slope is different on each side ofx5 1
2 on this curve,because the change in mixing energy when exchanging aatom with a Cu atom in thec(232) matrix differs from thechange in mixing energy when exchanging a Cu atom witAg atom in thec(232) matrix. The curvature gives thdefect-defect interaction energy, and this is also differenteach side ofx5 1
2. It is seen that thec(232) is more stablethan the random phase aroundx5 1
2. The reason is that thelarge Ag atoms repel each other, and a structure withAg-Ag nearest neighbors is preferred.
VI. NONPSEUDOMORPHIC CASES
In Fig. 4 we have included yet another overlayer phaThe pseudomorphic surface layers with Ag-rich compositare rather strained, even after local relaxation. This straireleased, if the Ag-rich surface layer reconstructs intoclose-packed phase with an Ag-Ag interatomic distanclose to that of pure Ag. We have plotted some candida~triangles! of hexagonal symmetry in Fig. 4. Many compeing hexagonal phases exist, but the most stable we hfound is thec(1032) at x50.9, which is the one observeexperimentally.27 This will be discussed in more detail below.
We now summarize theT50 phase diagram. For verlow Ag coverages the random alloy phase is the most stone. Due to the Ag-Ag repulsion, there will be a short-rancorrelation between Ag atoms in the surface layer. Atx.0.3the underlyingc(232) ordering tendency will become morand more prominent. For 0.38,x,0.9, a phase transition tthe c(1032) hexagonal phase is expected to occur. Tcommon tangent is shown in Fig. 4 as a thin dotted line.
Since the energies of the different competing phaseFig. 4 are extremely small, we have to include entropyfects for a complete description even at room temperature
FIG. 4. Surface~mixing! energy of the Ag/Cu surface overlayeon a Cu~100! substrate obtained by LMTO-CPA and by EMT undvarious conditions. The thin dotted line shows the expected phtransition to hexagonal phases atT50 K.
g
a
n
o
e.nisaes
ve
lee
e
in-In
Fig. 5 we have added the entropy term corresponding to ephase from Eq.~7! at T5300 K. At this temperature, theentropy stabilizes the disordered phases@the random and partially orderedc(232) phases# by an amount of the orde0.01–0.02 eV per surface site. The ordered [email protected].,c(232) and hexagonal# will have vanishing entropy contri-bution.
When we include entropy effects, thec(232) structure isnot stable, and the phase transition towardsc(1032), asshown by the thin dotted line in Fig. 5, is predicted to begat x;0.24 compared tox;0.38 atT50. It should be notedthat the very small calculated energy differences musthandled with caution, and that the purpose is only to illutrate the different effects that may have to be included icomplete description of a surface alloy phase.
VII. ALLOYING AND ORDERINGIN THE SECOND LAYER
The cases where the segregation energy is positive,des /dx.0, the deposited metal is expected to go into tbulk, dissolving or forming new phases there. However,many cases, it is found that the deposited metal prefers tin the second layer, that is to stay at the surface but tocovered by a layer of substrate material. These casesdivided into important subclasses. The first subclass consof nonmiscible metals where the surface energy of theposited metal is much larger than the surface energy ofsubstrate. The Fe/Cu~111! and Co/Cu~111! systems are ex-treme examples of this behavior and these systems wildiscussed in more detail in Sec. VIII.
In the other subclass, which typically consists of miscibmetals, the deposited material may alloy and perhaps fordered structures in the subsurface layers. This is likelyhappen, if the deposited element and the substrate maybulk ordered alloys and one would expect local order corsponding to that in the bulk ordered phase in the substrrich concentration region. As an example of this we wdiscuss Pd on Cu~110! in this section. Another example iAu on Ag~110!.50,51
According to the bulk phase diagram52 there is only one
se
FIG. 5. Surface free energies of mixing of the phases in Figbut now atT5300 K, obtained by adding the mixing entropy termEq. ~7!. The entropy term shifts down the disordered phasesapproximately 0.01 eV/atom. This decreases the coverage wherphase transition to hexagonal phases begins, tox;0.24 ~dottedline!. We have only included phases that determine the equilibri

hefe
endr
ithsue
u
Cm
d
thutiow
r Fe
hic
thesi-.sotionwithver-rily
en-
hendy
ace,
ee
P
ed
ed-
ed-
56 5827PHASE DIAGRAMS FOR SURFACE ALLOYS
ordered phase of CuPd in the Cu-rich region, Cu3Pd, havingthe L12 structure. There are two different types of~110!layers in this ordered phase: pure Cu~110! layers andPdCu~231! ordered layers with -Pd-Cu- chains along t@110# direction. Thus, one may expect an energetic preence for the formation of such a type of ordered structurethe Cu~110! surface during deposition of Pd.
In Fig. 6 we show the surface energies of orderCuPd~231! and random alloys in either the first or secolayer of an otherwise pure Cu~110!. There is complete ordefor x50.5 and partial order forxÞ0.5. To determine themost stable structure for a Pd coverage less than 0.5 ML,noted that all other energy points in Fig. 6 lie above tdot-dashed line between the points corresponding to theface energy of pure Cu~110! and the surface energy of thcompletely ordered alloy in the second layer~full square atx50.5). This means that if we haveuPd,0.5, then there willbe a phase separation of the system into regions of pCu~110! surface and regions~islands! with an ordered~231! CuPd alloy in the second layer, covered by a purelayer. The island structure is thus identical to the equilibriustructure of a Cu3Pd~110! surface which is also terminateby a Cu layer.
VIII. CASES WHERE COMPLETE PHASE SEPARATIONOCCURS: Fe/Cu„111… AND Co/Cu„111…
The final case we will consider here is the case wheredeposited element forms multilayer structures on the sstrate. Again, in this case the common tangent construcmay be used as discussed above and in this section we
FIG. 6. Calculated surface energies for random and orderedstructures in either the first or second layers of a Cu~110! surface, asa function of the fractionx of Pd. The dash-dotted line indicates thphase transition between the pure Cu~110! surface and the ordere~231! CuPd alloy in the second layer for Pd coveragesx,0.5.
FIG. 7. The surface energies of Cu and Fe on Cu~111! for cov-erages up to a monolayer.
r-at
d
iser-
re
u
eb-nill
demonstrate such a construction for the case of multilayeand Co structures on Cu~111!.
In Fig. 7 we show the surfaces energies of pseudomorpFexCu12x and CoxCu12x on Cu~111! up to a coverage ofone monolayer. In principle these alloy systems belong togeneric class in the lower left corner of Fig. 2, having potive segregation energy atx50 and negative curvatureHowever, the bulk mixing energy in these alloy systems islarge, that for a certain overlayer coverage the segregaenergy becomes negative, and the surface energy dropsincreasing coverage. In fact increasing the Fe and Co coage beyond 1 ML may turn the surface energy arbitranegative, the reason being that the bulk phase separationergy is counted as surface energy.
We illustrate this in Figs. 8 and 9 where we show tsurface energies of different multilayer structures of Fe aCo on Cu~111!, respectively, for coverages up to manmonolayers. The solid lines with open circles are the surfenergies ofXn/Cu~111! as functions of the number of layersn. In the followingX denotes either Fe or Co. One may s
d
FIG. 8. The surface energies of Cum/Fen/Cu~111! multilayerstructures as functions of the numbersn ~open circles! and m~stars!. The common-tangent construction is shown by the dashdotted curve. See text for further details.
FIG. 9. The surface energies of Cum/Fen/Cu~111! multilayerstructures as functions of the numbersn ~open circles! and m~stars!. The common-tangent construction is shown by the dashdotted curve. See text for further details.

linthesn
tin
orn-
o
f C
Cren
th
noaibib
hes
oury
eeg
u
leer
, rnitialasacaiothti
aveeri-
. 5un-
rates
-
ntly
d
theasthe
, inainsbe-sCud
inAtn-,s
f the
aseara-y.
al-ons
tothe
itiveAgereora-s-the
rna--
5828 56A. CHRISTENSENet al.
that in both cases the surface energy drops practicallyearly with the number of layers. This is a consequence offact that there is a strong phase separation in these systand thus, in the grand canonical ensemble when there iinfinite source of Fe and Co atoms, the system will costantly undergo phase separation~the slope of the curve an→` is equal to minus the solution energy of Fe and CoCu!.
The dotted curves with stars starting from the points cresponding to theXn/Cu~111! structures are the surface eergies of Cum /Xn/Cu~111!, i.e., Xn/Cu~111! covered bymCu layers. The following features can be seen to be commfor the two systems:~1! the surface energy of theXn/Cu~111!structure is decreasing when it is covered by Cu atoms;~2!the surface energy does not depend on the number olayers covering a single layer of Fe or Co on Cu~111! while,if the number of Fe or Co layers is greater than one, theXn/Cu~111! structure has the lowest surface energy. Thefore, if the number of Fe and Co layers is greater than othe most stable structure at the surface terminates wimonolayer of Cu.
We may now discuss, whether a single Fe or Co molayer covered by a monolayer of Cu is stable against seption into other structures. As both these systems exhstrong phase separation we may safely exclude the possity of ordered structures~there are no ordered phases in tbulk phase diagrams of the Fe-Cu and Co-Cu system!.Thus, the remaining possibility is a ‘‘phase separation’’the multi-layer structures, for instance into patches of pCu surface and two-layer Fe islands covered by a monolaof Cu. The corresponding ‘‘mixing island’’ energy is
Emixisl~1!5Esurf
Cu/X/Cu~111!21
2~Esurf
Cu~111!1EsurfCu/X2 /Cu~111!
!, ~10!
which is found to be 0.18 eV for Co and 0.34 eV for FFrom this one may conclude that the monolayer structurunstable. The common tangent construction correspondinEq. ~10! is shown by dashed-dotted curves in Fig. 8.
The procedure may be repeated for the two-layer strtures @to check against separation into pure Cu~111! andthree-layer structure# and iterated until the final most stabmultilayer structure is found. It is easy to show, howevthat for largen, Emix
isl(n)→2/(n11)EinterX2Cu, whereEinter
X2Cu is theCu-X interface energy. For the~111! surface of Cu-Fe andCu-Co these energies are approximately 0.1 and 0.2 eVspectively. Thus, the island mixing energy is positive for an. This does not mean that such a separation of an inmultilayer structure never ends in real systems. First ofthe island mixing energies become very small with increing n. Second, in our model we have not included the fthat such an island separation leads to the formation ofditional linear and surface defects, which also make theland separation energetically unfavorable. Therefore, as sas the island mixing energies are sufficiently large andconcentration of the defects accompanying island separais small, the multilayer structures should be created.
-e
ms,an-
-
n
u
u/-
e,a
-ra-itil-
feer
.isto
c-
,
e-yall,-td-s-oneon
IX. DISCUSSION IN CONNECTIONWITH EXPERIMENTAL OBSERVATIONS
In this section we discuss the specific systems that hbeen used as examples above in the light of available expmental results. First, consider the case of Ag on Cu~100!.The findings in the quite complicated phase diagram in Figare in good qualitative agreement with recent scanning tneling microscopy~STM! investigations by Sprungeret al.27
Here, it is found that at low substrate temperatures~T , 250K!, Ag deposition results in ac(1032) overlayer structure@Fig. 10~a!# on Cu~100!. The Ag-c(1032) consists of a hex-agonal Ag overlayer placed on top of the square substlattice@Fig. 10~b!#. This structure is also reported in previoustudies employing low-energy electron diffraction,53 electronenergy-loss spectroscopy,54 angle-resolved ultraviolet photoemission spectroscopy,55 and photoelectron diffraction.56
If Ag is deposited at room temperature and subsequeimaged at lower temperatures (, 200 K!, STM results show,see Fig. 10~c!, that silver atoms are substitutionally alloyeinto Cu~100!. In Fig. 10~c! where Ag 5 0.4 ML, a smalldensity of Ag-c(1032) domains similar to the Ag-c(1032)low-temperature structure are observed, but in this caseAg-c(1032) islands are located within the first Cu layer,revealed from the measured height difference betweenAg islands and the surrounding Cu substrate. Moreoverthe interstitial regions between these hexagonal Ag domatom-size depressions, attributed to individual Ag atomsing alloyed into the Cu~100! surface, are revealed. Thishows the coexistence of two silver phases within thesurface:~i! individual Ag atoms alloyed into the surface an~ii ! domains of phase-separatedc(1032) hexagonal Ag is-lands.
Figure 10~d! shows an STM image, acquired at 180 K,which only 0.07 ML of Ag has been deposited at 440 K.this low Ag coverage only individual Ag atoms, substitutioally arranged within the Cu~100! surface lattice, are depictedwhile no hexagonal Ag-c(1032) islands are observed. It habeen shown that a critical Ag coverage of 0.13 ML exists27 atwhich a phase separation occurs into coexisting areas oalloyed Ag-Cu~100! phase and hexagonal Ag-c(1032) is-lands. The experiments thus agree with the calculated phdiagram, except that the critical coverage for phase seption is 0.13 ML rather than the 0.24 ML found theoreticallThe experiments show no sign of an orderedc(232) phase.This is in agreement with the calculated results, but the cculations did not have an accuracy to make any predictiabout this. The experiments also show no tendency for Agmove into the second or deeper layers, in agreement withresults in Fig. 2~a!.
From the Ag/Pt~111! surface energy curve in Fig. 2~b! itis seen that the system Ag deposited on Pt~111! is character-ized by having a negative heat of segregation and a posheat of mixing. Thus one would expect that the depositedpreferentially segregate to or stay in the surface layer whAg and Pt should phase separate. The STM studies by R¨deret al.28 have shown that if Ag is deposited at room tempeture on Pt~111!, monatomic height, commensurate Ag ilands nucleate and grow at descending step edges. Ifsurface is annealed to temperatures above 620 K or, altetively, if the Ag is deposited on Pt~111! at elevated tempera

r
es
lnt
,
f7
56 5829PHASE DIAGRAMS FOR SURFACE ALLOYS
FIG. 10. STM images of Agdeposited on Cu~100!: ~a! image,revised acquired at 160 K aftedeposition of 0.4 ML of Ag at 225K, showing growth of Ag-c(1032) overlayer islands on Cuterraces and against step edg~8003 800 Å2; ~b! atomically re-solved details of the Ag-c(1032) superstructure and locapseudohexagonal arrangeme~see superimposed grids! ~42344Å 2); ~c! image, acquired at 170 Kof same surface as shown in~a!after annealing to 425 K, showingAg-c(1032) patches within Cusurface ~see arrows! surroundedby Ag-Cu alloy ~1203120 Å2);~d! image, acquired at 180 K, osurface deposed with only 0.0ML of Ag at 440 K showingsingle Ag atoms ~protrusions!pseudomorphically alloyed intoCu~100! surface ~56356 Å2).From Sprungeret al. ~Ref. 27!.
AAgio
iseinsmndm
lenllyveioceel
st
myth. Iio8
ofndsees,
outTMis
.
tinglayerrm
o
onssdis-ricinssur-rate
tures, the Ag dissolves into the Pt surface layer as smallislands. The dissolution of Ag into Pt proceeds from thewetted steps, and numerous small protrusions/depresswith a diameter of 10 Å evolve on the Pt~111! terraces andwithin the Ag islands, respectively. The Ag/Pt dissolutionconfirmed by the apparent height difference between thembedded protrusions/depressions and their surroundWhen the Ag-Pt dissolution is fully completed, the mostable cluster sizes correspond to 7, 10, and 12 Ag atoThe Ag islands are confined to the topmost Pt layer, aincreasing the Ag coverage to one monolayer leads to acreasing density of Pt clusters embedded in Ag until a coplete demixing of the two metals is achieved and one iswith a complete monatomic Ag overlayer on top of the noalloyed Pt~111! substrate. Thus the experimental results fusupport the theoretical findings discussed above. Howethe stability of various island sizes, shapes, and orientatare finite-size effects. Such information cannot be dedufrom the presented calculations, which applies to infinitlarge surface phases.
For the Pt/Cu~111! system in Fig. 2~c! a variety of experi-mental studies have been carried out in recent years,Refs. 57–61. All studies suggest a layer by layer growmode of Pt/Cu~111!, at least for the first three layers at rootemperature. From core-level photoelectron spectroscophas been suggested57 that there exists a sharp interface wialmost no evidence for interdiffusion at room temperaturea later study58 the same authors conclude that the formatof a Pt/Cu alloy does not occur below a temperature of 5
g
ns
segs.ts.de--
ft-
r,nsd
y
eeh
it
nn0
K. A very recent STM study by Bo¨nicke et al.62 points to-wards a different behavior for the submonolayer growthPt/Cu~111!. At room temperature single Pt atoms are fouto be alloyed into the Cu~111! surface for low Pt coverage(; 0.1 ML!. For higher coverages, still below 0.5 ML, thformation of an ordered row-type structure at the step edgas well as the formation of finger-shaped islands growingfrom the steps on the lower terraces are revealed in the Sstudies. It is tentatively suggested that the row structureassociated with the formation of an ordered Cu3Pt surfacealloy, but this is at the moment subject to further study62
The most recent STM studies thus agrees with Fig. 2~lowerrow left!.
For the final case in Fig. 2~d!, Ru/Au~111!, we know ofno experiments at present. This is also the least interescase from a surface science perspective, since the overwill dissolve deeper in the crystal and is expected to fo~metastable! islands on the surface.
The growth of Pd on Cu~110! discussed in Fig. 6 has alsrecently been studied using STM by Murrayet al.63 At lowcoverages~Pd,0.02 ML!, the deposited Pd atoms alloy intthe Cu~110! surface to form ordered linear Cu-Pd chaialong the@110# direction. The periodicity of the Pd atomalong the chains, corresponding to two nearest-neighbortances, is equivalent to that found in a stoichiometCu3Pd bulk alloy. At higher Pd coverages, the linear chadisappear. The Pd atoms become incorporated into subface sites, i.e., they become covered, partly with subst

anththhca
Cm
or
o
nPeayth
w. Itios.rioer
inthreh
esth-re
nothegidtio
attiorgi-tu
a-vAispufa
d intion
tednde
thethem
srity
eis-fit
for
.-
-eeen
n,the
ing
n-ce.ngt thethey isand
ig.n-
5830 56A. CHRISTENSENet al.
atoms squeezed out during additional surface alloying,partly by substrate atoms removed from terraces. Sincemechanism requires more metal atoms to be displacedPd atoms deposited, this results in a rough surface morpogy with a large number of islands and pits. The islandsbe interpreted as regions with an ordered~231! PdCu struc-ture in the subsurface layer which is covered with a purelayer, i.e., the island structure is identical to the equilibriustructure predicted by the calculations.
The growth of Co and Fe on Cu~111!, the last type ofsystem included here, has been extensively studied. Freview we refer to the paper by Kief and Egelhoff.64 Thereare many experimental results showing a bilayermultilayer epitaxial growth mode for these systems65–67 andthe segregation of Cu to the surface has also been seeelevated temperatures. The recent STM observations byersenet al.68 show three-layer Co islands. At high temperture there is a tendency to coverage of the Co island bmonolayer of Cu. All of this is in very good agreement withe results of Figs. 7, 8, and 9.
In all cases where experimental results were available,have found satisfactory agreement with our calculationsthis paper we have proposed a very simple classificascheme for surface alloys, based on four generic classesome cases a more complex behavior appeared for vareasons, but in these cases the proposed classification sas a useful starting point.
X. SEGREGATION AND SURFACE MIXING ENERGIESFOR THE TRANSITION METALS
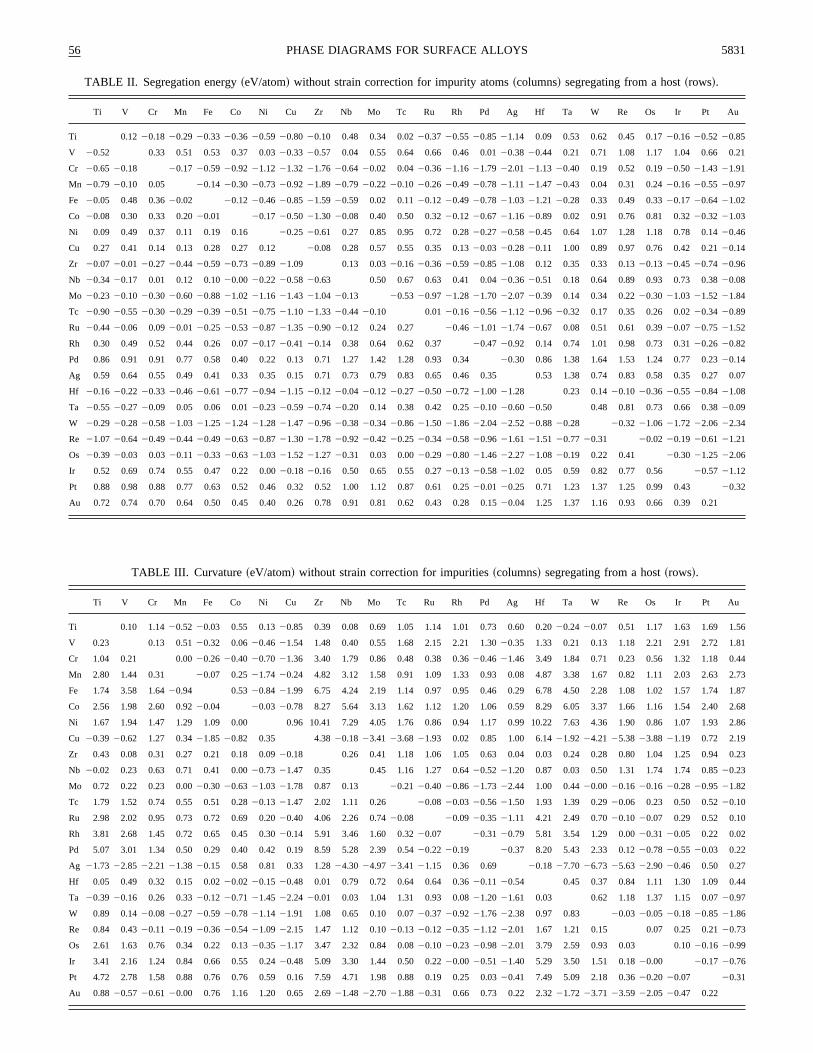
It is clear from the discussion above that a good startpoint for an understanding of surface alloy phases arefirst and second derivatives of the surface energy withspect to the concentration of one of the two elements. Twill immediately indicate which of the four generic classof Fig. 2 the system belongs to. The first derivative givessegregation energy through Eq.~5!, and the second derivative determines whether the two metals will mix in the suface layer or not: If the curvature is positive there will bmixing, and if it is negative the two metals will not mix ithe surface. Knowledge of these two derivatives will ncover the more complex cases discussed above, whereare ordered phases, nonpseudomorphic overlayers or sgation to the second layer, but will still be useful as a guance for studies of transition metals in and on other transimetals.
Prompted by the above considerations, we have calculthe first and second derivatives in the zero-concentralimit ~the initial slope and curvature of the surface enecurves cf. Fig. 2! for all transition- and noble-metal combnations for close-packed surfaces of the equilibrium strucof the host metal, i.e.,~111!fcc, ~110!bcc, and~1000!hcp.The first derivatives are listed in Table II, while the curvtures are listed in Table III. The values in the tables habeen calculated from first principles using the LMTO-CPmethod, described in Sec. III. The main limitation of thmethod is the neglect of lattice relaxations around the imrity. However, since both the segregation energy and surmixing energies aredifferencesin energy for an impurity in
disanol-n
u
a
r
atd-
-a
ennInusved
ge-
is
e
-
terere--n
edn
y
re
e
-ce
the bulk and at the surface, in a large island, or dispersethe substrate in the first layer, we expect some cancellaof the relaxation energy contributions.
To investigate this issue in more detail we have calculathe lattice relaxation energy for impurities at the surface ain the bulk for all host-impurity combinations of the lattransition/noble metals~Ni, Cu, Pd, Ag, Pt, Au! using EMT,which describes these metals reasonable well. We definerelaxation energy as the change in total energy, whenimpurity and its neighboring atoms are allowed to relax frothe perfect crystalline sites defined by the host lattice.
In Fig. 11~a! we show the relaxation energy for impuritieinserted into fcc crystal structures versus the host-impusize mismatchsA2sB , sA, and sB being the Wigner-Seitzradii of metalA andB, respectively. It is observed, that threlaxation energy is rather well correlated with the size mmatchsA2sB . We have also shown a simple anharmonicto the data of the form
Dejrelax~sA2sB!52k jF S sA2sB
j j21D 3
11G2
, ~11!
which may be used for the common size mismatchestransition metals, -0.8 a.u.,sA2sB,0.8 a.u., to interpolatethe relaxation energy from our data. Subscriptj refers to thelattice structure. The two fitting parameters (k j ,j j ) in Eq.~11! are given in Table I for impurities in different lattices
Papanikolaouet al.69 have recently calculated the relaxation energy around Cu impurities in all the 3d and 4d tran-sition metals using the full-potential Korringa-KohnRostoker ~KKR! Green’s-function method. We havincluded these results in Fig. 11 as open symbols. It is sthat the agreement between theirab initio calculations andour EMT results is rather good. Theab initio results, whichinclude other transition metals than our EMT calculatioseem to fall on the same curve, supporting the idea thatrelaxation energy follows a universal curve, only dependon the lattice structure and size mismatch.
In Fig. 11~b! we have plotted the relaxation energy for aimpurity in the fcc~111! surface. It is observed, that the relaxation energy is on average slightly larger at the surfaThis is due to the fact that the impurity and surroundiatoms at the surface have more freedom to relax and thafinal, locally relaxed structure is less frustrated, than inbulk. The relaxation correction to the segregation energthe difference between the relaxation energy for the finalinitial situation, see Eq.~5!. The result of subtracting thesurface and bulk impurity relaxation energy is shown in F11~c!. As anticipated, most of the relaxation energy is ca
TABLE I. Elastic form parameters derived from EMT.
j k j ~eV! j j ~a.u.!
fcc 0.327 1.835bcc 2.060 3.699fcc~111! 0.465 1.920
Curvature relaxation shift
fcc~111! 20.800 1.828
1
0.07
1
4
2.73
1.87
2.68
3 2.86
0.23
4
56 5831PHASE DIAGRAMS FOR SURFACE ALLOYS
TABLE II. Segregation energy~eV/atom! without strain correction for impurity atoms~columns! segregating from a host~rows!.
Ti V Cr Mn Fe Co Ni Cu Zr Nb Mo Tc Ru Rh Pd Ag Hf Ta W Re Os Ir Pt Au
Ti 0.12 20.18 20.29 20.33 20.36 20.59 20.80 20.10 0.48 0.34 0.0220.37 20.55 20.85 21.14 0.09 0.53 0.62 0.45 0.1720.16 20.52 20.85
V 20.52 0.33 0.51 0.53 0.37 0.0320.33 20.57 0.04 0.55 0.64 0.66 0.46 0.0120.38 20.44 0.21 0.71 1.08 1.17 1.04 0.66 0.2
Cr 20.65 20.18 20.17 20.59 20.92 21.12 21.32 21.76 20.64 20.02 0.0420.36 21.16 21.79 22.01 21.13 20.40 0.19 0.52 0.1920.50 21.43 21.91
Mn 20.79 20.10 0.05 20.14 20.30 20.73 20.92 21.89 20.79 20.22 20.10 20.26 20.49 20.78 21.11 21.47 20.43 0.04 0.31 0.2420.16 20.55 20.97
Fe 20.05 0.48 0.3620.02 20.12 20.46 20.85 21.59 20.59 0.02 0.1120.12 20.49 20.78 21.03 21.21 20.28 0.33 0.49 0.3320.17 20.64 21.02
Co 20.08 0.30 0.33 0.2020.01 20.17 20.50 21.30 20.08 0.40 0.50 0.3220.12 20.67 21.16 20.89 0.02 0.91 0.76 0.81 0.3220.32 21.03
Ni 0.09 0.49 0.37 0.11 0.19 0.16 20.25 20.61 0.27 0.85 0.95 0.72 0.2820.27 20.58 20.45 0.64 1.07 1.28 1.18 0.78 0.1420.46
Cu 0.27 0.41 0.14 0.13 0.28 0.27 0.12 20.08 0.28 0.57 0.55 0.35 0.1320.03 20.28 20.11 1.00 0.89 0.97 0.76 0.42 0.2120.14
Zr 20.07 20.01 20.27 20.44 20.59 20.73 20.89 21.09 0.13 0.0320.16 20.36 20.59 20.85 21.08 0.12 0.35 0.33 0.1320.13 20.45 20.74 20.96
Nb 20.34 20.17 0.01 0.12 0.1020.00 20.22 20.58 20.63 0.50 0.67 0.63 0.41 0.0420.36 20.51 0.18 0.64 0.89 0.93 0.73 0.3820.08
Mo 20.23 20.10 20.30 20.60 20.88 21.02 21.16 21.43 21.04 20.13 20.53 20.97 21.28 21.70 22.07 20.39 0.14 0.34 0.2220.30 21.03 21.52 21.84
Tc 20.90 20.55 20.30 20.29 20.39 20.51 20.75 21.10 21.33 20.44 20.10 0.0120.16 20.56 21.12 20.96 20.32 0.17 0.35 0.26 0.0220.34 20.89
Ru 20.44 20.06 0.0920.01 20.25 20.53 20.87 21.35 20.90 20.12 0.24 0.27 20.46 21.01 21.74 20.67 0.08 0.51 0.61 0.3920.07 20.75 21.52
Rh 0.30 0.49 0.52 0.44 0.26 0.0720.17 20.41 20.14 0.38 0.64 0.62 0.37 20.47 20.92 0.14 0.74 1.01 0.98 0.73 0.3120.26 20.82
Pd 0.86 0.91 0.91 0.77 0.58 0.40 0.22 0.13 0.71 1.27 1.42 1.28 0.93 0.34 20.30 0.86 1.38 1.64 1.53 1.24 0.77 0.2320.14
Ag 0.59 0.64 0.55 0.49 0.41 0.33 0.35 0.15 0.71 0.73 0.79 0.83 0.65 0.46 0.35 0.53 1.38 0.74 0.83 0.58 0.35 0.27
Hf 20.16 20.22 20.33 20.46 20.61 20.77 20.94 21.15 20.12 20.04 20.12 20.27 20.50 20.72 21.00 21.28 0.23 0.1420.10 20.36 20.55 20.84 21.08
Ta 20.55 20.27 20.09 0.05 0.06 0.0120.23 20.59 20.74 20.20 0.14 0.38 0.42 0.2520.10 20.60 20.50 0.48 0.81 0.73 0.66 0.3820.09
W 20.29 20.28 20.58 21.03 21.25 21.24 21.28 21.47 20.96 20.38 20.34 20.86 21.50 21.86 22.04 22.52 20.88 20.28 20.32 21.06 21.72 22.06 22.34
Re 21.07 20.64 20.49 20.44 20.49 20.63 20.87 21.30 21.78 20.92 20.42 20.25 20.34 20.58 20.96 21.61 21.51 20.77 20.31 20.02 20.19 20.61 21.21
Os 20.39 20.03 0.0320.11 20.33 20.63 21.03 21.52 21.27 20.31 0.03 0.0020.29 20.80 21.46 22.27 21.08 20.19 0.22 0.41 20.30 21.25 22.06
Ir 0.52 0.69 0.74 0.55 0.47 0.22 0.0020.18 20.16 0.50 0.65 0.55 0.2720.13 20.58 21.02 0.05 0.59 0.82 0.77 0.56 20.57 21.12
Pt 0.88 0.98 0.88 0.77 0.63 0.52 0.46 0.32 0.52 1.00 1.12 0.87 0.61 0.2520.01 20.25 0.71 1.23 1.37 1.25 0.99 0.43 20.32
Au 0.72 0.74 0.70 0.64 0.50 0.45 0.40 0.26 0.78 0.91 0.81 0.62 0.43 0.28 0.1520.04 1.25 1.37 1.16 0.93 0.66 0.39 0.21
TABLE III. Curvature ~eV/atom! without strain correction for impurities~columns! segregating from a host~rows!.
Ti V Cr Mn Fe Co Ni Cu Zr Nb Mo Tc Ru Rh Pd Ag Hf Ta W Re Os Ir Pt Au
Ti 0.10 1.1420.52 20.03 0.55 0.1320.85 0.39 0.08 0.69 1.05 1.14 1.01 0.73 0.60 0.2020.24 20.07 0.51 1.17 1.63 1.69 1.56
V 0.23 0.13 0.5120.32 0.0620.46 21.54 1.48 0.40 0.55 1.68 2.15 2.21 1.3020.35 1.33 0.21 0.13 1.18 2.21 2.91 2.72 1.8
Cr 1.04 0.21 0.0020.26 20.40 20.70 21.36 3.40 1.79 0.86 0.48 0.38 0.3620.46 21.46 3.49 1.84 0.71 0.23 0.56 1.32 1.18 0.4
Mn 2.80 1.44 0.31 20.07 0.2521.74 20.24 4.82 3.12 1.58 0.91 1.09 1.33 0.93 0.08 4.87 3.38 1.67 0.82 1.11 2.03 2.63
Fe 1.74 3.58 1.6420.94 0.5320.84 21.99 6.75 4.24 2.19 1.14 0.97 0.95 0.46 0.29 6.78 4.50 2.28 1.08 1.02 1.57 1.74
Co 2.56 1.98 2.60 0.9220.04 20.03 20.78 8.27 5.64 3.13 1.62 1.12 1.20 1.06 0.59 8.29 6.05 3.37 1.66 1.16 1.54 2.40
Ni 1.67 1.94 1.47 1.29 1.09 0.00 0.96 10.41 7.29 4.05 1.76 0.86 0.94 1.17 0.99 10.22 7.63 4.36 1.90 0.86 1.07 1.9
Cu 20.39 20.62 1.27 0.3421.85 20.82 0.35 4.3820.18 23.41 23.68 21.93 0.02 0.85 1.00 6.1421.92 24.21 25.38 23.88 21.19 0.72 2.19
Zr 0.43 0.08 0.31 0.27 0.21 0.18 0.0920.18 0.26 0.41 1.18 1.06 1.05 0.63 0.04 0.03 0.24 0.28 0.80 1.04 1.25 0.94
Nb 20.02 0.23 0.63 0.71 0.41 0.0020.73 21.47 0.35 0.45 1.16 1.27 0.6420.52 21.20 0.87 0.03 0.50 1.31 1.74 1.74 0.8520.23
Mo 0.72 0.22 0.23 0.0020.30 20.63 21.03 21.78 0.87 0.13 20.21 20.40 20.86 21.73 22.44 1.00 0.4420.00 20.16 20.16 20.28 20.95 21.82
Tc 1.79 1.52 0.74 0.55 0.51 0.2820.13 21.47 2.02 1.11 0.26 20.08 20.03 20.56 21.50 1.93 1.39 0.2920.06 0.23 0.50 0.5220.10
Ru 2.98 2.02 0.95 0.73 0.72 0.69 0.2020.40 4.06 2.26 0.7420.08 20.09 20.35 21.11 4.21 2.49 0.7020.10 20.07 0.29 0.52 0.10
Rh 3.81 2.68 1.45 0.72 0.65 0.45 0.3020.14 5.91 3.46 1.60 0.3220.07 20.31 20.79 5.81 3.54 1.29 0.0020.31 20.05 0.22 0.02
Pd 5.07 3.01 1.34 0.50 0.29 0.40 0.42 0.19 8.59 5.28 2.39 0.5420.22 20.19 20.37 8.20 5.43 2.33 0.1220.78 20.55 20.03 0.22
Ag 21.73 22.85 22.21 21.38 20.15 0.58 0.81 0.33 1.2824.30 24.97 23.41 21.15 0.36 0.69 20.18 27.70 26.73 25.63 22.90 20.46 0.50 0.27
Hf 0.05 0.49 0.32 0.15 0.0220.02 20.15 20.48 0.01 0.79 0.72 0.64 0.64 0.3620.11 20.54 0.45 0.37 0.84 1.11 1.30 1.09 0.4
Ta 20.39 20.16 0.26 0.3320.12 20.71 21.45 22.24 20.01 0.03 1.04 1.31 0.93 0.0821.20 21.61 0.03 0.62 1.18 1.37 1.15 0.0720.97
W 0.89 0.1420.08 20.27 20.59 20.78 21.14 21.91 1.08 0.65 0.10 0.0720.37 20.92 21.76 22.38 0.97 0.83 20.03 20.05 20.18 20.85 21.86
Re 0.84 0.4320.11 20.19 20.36 20.54 21.09 22.15 1.47 1.12 0.1020.13 20.12 20.35 21.12 22.01 1.67 1.21 0.15 0.07 0.25 0.2120.73
Os 2.61 1.63 0.76 0.34 0.22 0.1320.35 21.17 3.47 2.32 0.84 0.0820.10 20.23 20.98 22.01 3.79 2.59 0.93 0.03 0.1020.16 20.99
Ir 3.41 2.16 1.24 0.84 0.66 0.55 0.2420.48 5.09 3.30 1.44 0.50 0.2220.00 20.51 21.40 5.29 3.50 1.51 0.1820.00 20.17 20.76
Pt 4.72 2.78 1.58 0.88 0.76 0.76 0.59 0.16 7.59 4.71 1.98 0.88 0.19 0.25 0.0320.41 7.49 5.09 2.18 0.3620.20 20.07 20.31
Au 0.88 20.57 20.61 20.00 0.76 1.16 1.20 0.65 2.6921.48 22.70 21.88 20.31 0.66 0.73 0.22 2.3221.72 23.71 23.59 22.05 20.47 0.22

lloe
at
lab
wingthoigonum
on
vo-n
-
0no. Ri-asth
y,e
er.ec-
ofw-atment
es,Pt,
ofof
les.lute
en-
con-. Infoursec-cen-ga-rgyrst
-nd
ofas
atteo.u
rgyift
-
5832 56A. CHRISTENSENet al.
celled between the surface and the bulk, and for most acombinations the relaxation correction to the segregationergy is neglible. A closer inspection reveals, that the signvery rarely changed by including relaxation corrections. Whave therefore only presented the raw, unrelaxed segregenergies in Table II.
We have also investigated the possible influence of reation effects on the curvature of the surface energy curveEMT calculations for the same alloys as above. In Fig. 12have plotted directly the change in curvature by includlattice relaxation. On average, relaxation effects makecurvature of the surface energy curve more positive. In mcases, inclusion of lattice relaxation will not change the sof the curvature. One observes, that significant fluctuatioccur around the fitted curve. Therefore we only presentrelaxed curvature data, but we have given the fitting paraeters for the fit shown in Fig. 12 in Table I. The relaxaticorrection can then easily be added, if necessary.
The calculated segregation energies compare very faably to experiments. Chelikowsky70 has collected experimental segregation tendencies~the sign of the segregatioenergy! for 40 combinations of transition metals and compared them to the results of the Miedema rules71. The resultsfrom Table II agree with experiment in 38 out of the 4cases. Only for Cr in Fe and Cu in Pt do we predictsegregation, while the experiments suggest segregationcent experiments72 for the Cr/Fe system do, however, indcate that Cr deposited on Fe moves to the second layer,the case for Pd on Cu. The segregation energy for Cr tosecond layer of pure Fe~110! is 20.08 eV calculated byLMTO-CPA. In the experiment referred to by Chelikowskonly a Cr surfaceregion enrichment was concluded on th
FIG. 11. Relaxation energies for impurities.~a! in bulk fcc, ~b!at a fcc~111! surface, and~c! the difference between the energyan fcc~111! surface and in bulk fcc. The energies were calculausing the effective-medium theory for all binary combinations~Ni, Cu, Pd, Ag, Pt, Au! shown along with the universal fit by Eq~11!. For comparison we have shown the full potential KKR calclations ~Ref. 69! for transition-metal impurities in a Cu crystal.
yn-iseion
x-y
e
estns
n--
r-
e-
ise
basis on Auger electron spectroscopy measurements.73 Dueto the finite escape depth of emitted Auger electrons, only;14 of the recorded signal originated from the surface layWe point out that the segregation energy for Cu to the sond layer of pure Pt~111! is also negative,20.21 eV calcu-lated by LMTO-CPA. However, surface layer enrichmentCu in Pt-rich alloys has also been observed by, e.g., loenergy ion scattering,74 and we expect ordered structuresthe surface to be the reason for the apparent disagreebetween experiments and our calculations.
The Miedema rules agree with experiment in 38 castoo, the deviations from experiment being Fe/Zr and Ni/which are well described by the present results. In termsthe sign of the segregation energy the DFT databaseTables II and III are therefore as good as the Miedema ruFurther, the present database should yield useful absonumbers, as well as predictions for the surface mixingergy.
XI. SUMMARY
In summary, we suggest that surface alloy phases areveniently discussed in terms of surface energy diagramsthe simplest case of pseudomorphic overlayers there aregeneric classes characterized by the sign of the first andond derivatives of the surface energy versus surface contration function. The first derivative is the surface segretion energy and the second is the surface mixing enedetermining whether the two components mix in the filayer or form islands.
We have presentedab initio results based on the LMTOCPA method of the two derivatives for all the transition anoble metals to the right of Sc for close-packed surfacesthe host. This provides a data base for surface alloy workan alternative to the empirical Miedema rules.71
df
-
FIG. 12. Estimated shift of the curvature of the surface enecurvees(x) caused by local relaxation effects. The curvature shhas been correlated with the size mismatchsA2sB between hostand impurity metal. All surface alloys in this figure are binary combination of the metals~Ni, Cu, Pd, Ag, Pt, Au!. See text for moredetails.
tnereb.c
ns-om
-nal
56 5833PHASE DIAGRAMS FOR SURFACE ALLOYS
Finally, we have considered a number of cases wheresimple pseudomorphic overlayer description is insufficieWe have shown that even complicated cases, where therordered structures, nonpseudomorphic structures, segtion to the second layer or multilayer formation, may alsotreated consistently in the present theoretical frameworkall cases considered the calculated phase diagrams aresistent with available experimental information.
yr
J/
-
ev
i,
ch
ch
nd
ch
ga
hy
rd,
rd,
rd
het.arega-eInon-
ACKNOWLEDGMENTS
The authors would like to thank Phil Sprunger, Ilva Bo¨n-icke, Morten O” . Pedersen, Erik Lægsgaard, and Ivan Stegaard for many useful discussions. Financial support frthe Danish Research Councils through theCenter for nano-tribology is gratefully acknowledged. Center for Atomicscale Materials Physics is sponsored by the Danish NatioResearch Foundation.
B
ga,
ev. B
ett.
ys.
d
.
.
.al
1U. Bardi, Rep. Prog. Phys.57, 939 ~1994!.2J. Wintterlin and R. J. Behm, inScanning Tunneling Microscop
I, 2nd ed., edited by H.-J. Gu¨ntherodt and R. Wiesendange~Springer-Verlag, Berlin, 1994!, pp. 39 and 253.
3R. Q. Hwang, C. Gu¨nther, J. Schro¨der, S. Gu¨nther, E. Kopatzki,and R. J. Behm, J. Vac. Sci. Technol. A10, 1970~1992!.
4C. Gunther, S. Gu¨nther, E. Kopatzki, R. Q. Hwang, J. Schro´der, J.Vrijmoeth, and R. J. Behm, Ber. Bunsenges. Phys. Chem.97, 3~1993!.
5D. D. Chambliss, K. E. Johnson, K. Kalki, S. Chiang, and R.Wilson, in Magnetic Ultrathin Films, Multilayers, and SurfacesInterfaces and Characterization, edited by B. T. Jonkeret al.,MRS Symposia Proceedings No. 313~Materials Research Society, Pittsburgh, 1993!, p. 713.
6D. D. Chambliss, R. J. Wilson, and S. Chiang, IBM J. Res. D39, 639 ~1995!.
7S. C. Wu, S. H. Lu, Z. Q. Wang, C. K. C. Lok, J. Quinn, Y. S. LD. Tian, F. Jona, and P. M. Marcus, Phys. Rev. B41, 3353~1990!.
8P. W. Murray, I. Steensgaard, E. Lægsgaard, and F. BesenbaPhys. Rev. B52, R14 404~1995!.
9P. W. Murray, I. Steensgaard, E. Lægsgaard, and F. BesenbaSurf. Sci.365, 591 ~1996!.
10M. Wuttig, Y. Gauthier, and S. Blugel, Phys. Rev. Lett.70, 3619~1993!.
11Y. Gauthier, M. Poensgen, and M. Wuttig, Surf. Sci.303, 36~1994!.
12H. P. Noh, T. Hashizume, D. Jeon, Y. Kuk, H. W. Pickering, aT. Sakurai, Phys. Rev. B50, 2735~1994!.
13R. G. P. van der Kraan and H. van Kempen, Surf. Sci.338, 19~1995!.
14D. D. Chambliss and S. Chiang, Surf. Sci.264, L187 ~1992!.15D. D. Chambliss, R. J. Wilson, and S. Chiang, J. Vac. Sci. Te
nol. A 4, 1993~1992!.16C. Nagl, E. Platzgummer, O. Haller, M. Schmid, and P. Var
Surf. Sci.331, 831 ~1995!.17S. Rousset, S. Chiang, D. E. Fowler, and D. D. Chambliss, P
Rev. Lett.69, 3200~1992!.18L. Pleth Nielsen, F. Besenbacher, I. Stensgaard, E. Lægsgaa
Engdahl, P. Stoltze, K. W. Jacobsen, and J. K. No”rskov, Phys.Rev. Lett.71, 754 ~1993!.
19G. Bozzolo, R. Ibanez-Meier, and J. Ferrante, Phys. Rev. B51,7207 ~1995!.
20J. Tersoff, Phys. Rev. Lett.74, 434 ~1995!.21L. Pleth Nielsen, F. Besenbacher, I. Stensgaard, E. Lægsgaa
Engdahl, P. Stoltze, and J. K. No”rskov, Phys. Rev. B74, 1159~1995!.
22J. Jacobsen, L. Pleth Nielsen, F. Besenbacher, I. Steensgaa
.
.
er,
er,
-
,
s.
C.
C.
, E.
Lægsgaard, T. Rasmussen, K. W. Jacobsen, and J. K. No”rskov,Phys. Rev. B75, 489 ~1995!.
23J. L. Stevens and R. Q. Hwang, Phys. Rev. Lett.74, 2078~1995!.24C. Nagl, M. Pinczolits, M. Schmid, and P. Varga, Phys. Rev.
52, 16 796~1995!.25C. Nagl, O. Haller, E. Platzgummer, M. Schmid, and P. Var
Surf. Sci.321, 237 ~1994!.26D. L. Adams, Appl. Phys. A62, 123 ~1996!.27P. T. Sprunger, E. Lægsgaard, and F. Besenbacher, Phys. R
54, 8163~1996!.28H. Roder, R. Schuster, H. Brune, and K. Kern, Phys. Rev. L
71, 2086~1993!.29H. Brune, H. Ro¨der, C. Boragno, and K. Kern, Phys. Rev. B49,
2997 ~1994!.30C. Gunther, J. Vrijmoeth, R. Q. Hwang, and R. J. Behm, Ph
Rev. Lett.74, 754 ~1995!.31C. R. Helms, Surf. Sci.69, 689 ~1977!.32Y. Liu, and P. Wynblatt, Surf. Sci.290, 335 ~1993!.33J. Y. Tsao, Surf. Sci.262, 382 ~1992!.34A. Mosser and A. Jouaiti, Surf. Sci. Lett.304, 427 ~1994!.35A. Senhaji, G. Treglia, B. Legrand, N. T. Barret, C. Guillot, an
B. Villete, Surf. Sci.274, 297 ~1992!.36P. W. Atkins,Physical Chemistry~Oxford University Press, Ox-
ford, 1990!.37J. W. Christian,Transformations in Metals and Alloys~Perga-
mon, New York, 1965!.38F. Ducastelle,Order and Phase Stability in Alloys~North-
Holland, Amsterdam, 1991!.39O. K. Andersen, O. Jepsen, and D. Glo¨tzel, in Highlights of Con-
densed Matter Theory, edited by F. Bassani, F. Fumi, and M. PTosi ~North-Holland, New York, 1985!.
40O. K. Andersen, Z. Pawlowska, and O. Jepsen, Phys. Rev. B34,5253 ~1986!.
41H. L. Skriver and N. M. Rosengaard, Phys. Rev. B43, 9538~1991!.
42A. I. Abrikosov, and H. L. Skriver, Phys. Rev. B47, 16 532~1993!.
43A. V. Ruban, I. A. Abrikosov, D. Ya. Kats, D. Gorelikov, K. WJacobsen, and H. L. Skriver, Phys. Rev. B49, 11 383~1994!.
44J. Perdew and A. Zunger, Phys. Rev. B23, 5048~1981!.45S. H. Vosko, L. Wilk, and M. Nusair, Can. J. Phys.58, 1200
~1980!.46S. L. Cunningham, Phys. Rev. B10, 4988~1974!.47K. W. Jacobsen, P. Stoltze, and J. K. No”rskov, Surf. Sci.366, 394
~1996!.48P. Stoltze, J. Phys. Condens. Matter6, 9495~1994!.49R. Hultgren, P. D. Desai, D. T. Hawkins, M. Gleiser, K. K
Kelley, and D. D. Wagman,Selected Values of the Therm

hy
h,
n
B.
J.c
rd
ld
and
r, E.. L.
ev.
Sci.
A.
ou,
urf.
5834 56A. CHRISTENSENet al.
Properties of Binary Alloys~ASG, Metals Park, OH, 1973!.50S. Rousset, S. Chiang, D. E. Fowler, and D. D. Chambliss, P
Rev. Lett.69, 3200~1992!.51C. T. Chan, K. P. Bohnen, and K. M. Ho, Phys. Rev. Lett.69,
1672 ~1992!.52M. Hansen and K. Anderko,Constitution of Binary Alloys
~McGraw-Hill, New York, 1958!.53P. W. Palmberg and T. N. Rhodin, J. Chem. Phys.49, 134~1968!.54J. E. Black, D. L. Mills, W. Daum, C. Stuhlmann, and H. Ibac
Surf. Sci.217, 529 ~1989!.55J. G. Tobin, S. W. Robey, and D. A. Shirley, Phys. Rev. B33,
2270 ~1986!.56D. Naumovic, P. Aebi, A. Stuck, P. Schwaller, J. Ostwalder, a
L. Schlapbach, Surf. Sci.307-309, 483 ~1994!.57R. Belkhou, N. T. Barrett, C. Guillot, A. Barbier, J. Eugne,
Carrire, D. Naumovic, and J. Osterwalder, Appl. Surf. Sci.65/66, 63 ~1993!.
58R. Belkhou, N. T. Barrett, C. Guillot, M. Fang, A. Barbier,Eugne, B. Carrire, D. Naumovic, and J. Osterwalder, Surf. S297, 40 ~1993!.
59J. Fusy, J. Menaucourt, M. Alnot, C. Huguet, and J. J. ErhaAppl. Surf. Sci.93, 211 ~1996!.
60U. Schrder, R. Linke, J.-H. Boo, and K. Wandelt, Surf. Sci.257/358, 873 ~1996!.
61Y. G. Shen, D. J. O’Connor, K. Wandelt, and R. J. MacDonaSurf. Sci. 357/358, 921 ~1996!; Phys. Rev. Lett.71, 2086~1993!.
s.
d
i.
t,
,
62I. A. Bonicke, M. O” . Pedersen, I. Stensgaard, E. Lægsgaard,F. Besenbacher~unpublished!.
63P. W. Murray, S. Thorshaug, I. Stensgaard, F. BesenbacheLægsgaard, A. Ruban, K. W. Jacobsen, G. Kopidakis, and HSkriver, Phys. Rev. B55, 1380~1997!.
64M. T. Kief and W. F. Egelhoff, Jr., Phys. Rev. B47, 10 785~1993!.
65J. de la Figuera, J. E. Prieto, C. Ocal, and R. Miranda, Phys. RB 47, 13 043~1993!.
66J. de la Figuera, J. E. Prieto, C. Ocal, and R. Miranda, Surf.307-309, 538 ~1994!.
67J. de la Figuera, J. E. Prieto, G. Kostka, S. Mu¨ller, C. Ocal, R.Miranda, and K. Heinz, Surf. Sci.349, L139 ~1996!.
68M. O” . Pedersen, I. A. Bo¨nicke, E. Lægsgaard, I. Stensgaard,Ruban, J. K. No”rskov, and F. Besenbacher~unpublished!.
69N. Papanikolaou, R. Zeller, P. H. Dederichs, and N. StefanPhys. Rev. B55, 4157~1997!.
70J. R. Chelikowsky, Surf. Sci.139, L197 ~1984!.71A. R. Miedema, P. F. de Chaˆtel, and F. R. de Boer, Physica B &
C 100, 1 ~1980!.72K. Pfandzelter, T. Igel, and H. Winter, Phys. Rev. B54, 4496
~1996!.73C. Leygraph, G. Hultquist, S. Ekelund, and J. C. Eriksson, S
Sci. 46, 157 ~1974!.74H. H. Brongesma, M. J. Sparnaay, and T. M. Buck, Surf. Sci.71,
657 ~1978!.