phase 2 - studies of marine mammals in welsh high tidal waters
TRANSCRIPT

JER3688 Welsh Assembly Government Planning & Development 28th March 2011 IMS J 0014v0
Assessment of Risk to Marine Mammals from
Underwater Marine Renewable Devices in
Welsh waters
Phase 2 - Studies of Marine Mammals in Welsh High Tidal Waters
On Behalf of
Welsh Assembly Government
This document is Printed on FSC certified, 100% post-consumer recycled paper, bleached using an elemental chlorine- free process.
Date: 28th March 2011 Our Ref: JER3688 RPS Conrad House Beaufort Square Chepstow Monmouthshire NP16 5EP Tel: (0)1291 621 821 Fax: (0)1291 627 827 Email: [email protected]

Studies of Marine Mammals in Welsh High Tidal Waters
Quality Management
Prepared by: Jonathan Gordon (Ecologic UK Ltd.)
Prepared by: Dave Thompson (SMRU)
Prepared by: Russell Leaper (University of Aberdeen)
Prepared by: Douglas Gillespie (SMRU)
Prepared by: Chris Pierpoint (Eurydice)
Prepared by: Susannah Calderan
Prepared by: Jamie Macaulay (Ecologic UK Ltd.)
Prepared by: Thomas Gordon (Vanishing Point)
Authorised by: Nicola Simpson
Date: 28th March 2011
Revision: 5
Project Number: JER3688
Document Reference: JER3688R110408JG Phase 2 - Studies of Marine Mammals in Welsh High Tidal Energy Waters v5.doc
Document File Path: O:\JER3688 - Marine renewable Strategy for Wales\STAGE 2\Project File\Task 1&2 Marine Mammals Collision Risk\JER3688R110408JG Phase 2 - Studies of Marine Mammals in Welsh High Tidal Energy Waters v5.doc
JER3688 Welsh Assembly Government Planning & Development 28th March 2011
i

Studies of Marine Mammals in Welsh High Tidal Waters
JER3688 Welsh Assembly Government Planning & Development 28th March 2011
DISCLAIMER
The opinions and interpretations presented in this report represent our best technical interpretation of the data made available to us.
However, due to the uncertainty inherent in the estimation of all parameters, we cannot, and do not guarantee the accuracy or
correctness of any interpretation and we shall not, except in the case of gross or wilful negligence on our part, be liable or
responsible for any loss, cost damages or expenses incurred or sustained by anyone resulting from any interpretation made by any
of our officers, agents or employees.
Except for the provision of professional services on a fee basis, Ecologic UK Ltd/SMRU/RPS does not have a commercial
arrangement with any other person or company involved in the interests that are the subject of this report.
RPS cannot accept any liability for the correctness, applicability or validity for the information they have provided, or indeed for any
consequential costs or losses in this regard. Our efforts have been made on a "best endeavours" basis and no responsibility or
liability is warranted or accepted by Ecologic UK Ltd/SMRU/RPS.
COPYRIGHT © RPS
The material presented in this report is confidential. This report has been prepared for the exclusive use of Welsh Assembly
Government and shall not be distributed or made available to any other company or person without the knowledge and written
consent of Welsh Assembly Government or Ecologic UK Ltd/SMRU/RPS.
ii

Studies of Marine Mammals in Welsh High Tidal Waters
Acknowledgement
Field Team
Boy Brendan Core Research Team:
Susannah Calderan
Jonathan Gordon
Thomas Gordon
Russell Leaper
Tim Lewis
Jamie Macauley
René Swift
Visitors on Boy Brendan:
Pia Anderwald
Alexander Coram
Emily Griffiths
Saana Isojunno
Mandy McMath
Hanna Nuuttila
Shore Observers:
Frances Hogan
Henry Horell
Nia Jones
Ramsey Sound shore observation supervision and lead on TPOD analysis:
Chris Pierpoint
The six TPODs used here were kindly provided by E.ON Renewables UK. We wish to thank the
captain and crew of the Boy Brendan, the vessel from which the TPODs and vertical arrays
were deployed, and boat surveys conducted. We particularly wish to extend our thanks to the
Countryside Council for Wales’ Skomer MNR team, Phil Newman, Kate Lock, Mark Burton and
volunteer wardens, who recovered the TPODs from Ramsey Sound.
JER3688 Welsh Assembly Government Planning & Development 28th March 2011
iii

Studies of Marine Mammals in Welsh High Tidal Waters
Executive Summary
S.1 Current driven tidal turbines are a promising source of renewable electrical power for
those countries, such as Wales, that have suitable high tidal energy areas off their
coasts. To ensure that such developments occur with as little adverse environmental
impact as possible it is important to better understand the ecology of the animals that
make use of tidal rapid habitats. Cetaceans, which are European Protected Species
(EPS) and seals, for which Special Areas of Conservation (SAC) have been designated
close to and encompassing areas of tidal rapid in Wales,, are groups of particular
interest, and for both there are concerns that they may suffer collisions with rotating
turbine blades. In addition, turbines may act as barriers to movement, especially if many
devices are deployed together in arrays. Marine mammals are often seen within tidal
rapids and there are some observations that suggest that these can be important areas
for them. However, our understanding of marine mammal distributions and behaviours
within high tidal energy areas is actually very poor for two reasons. In the first place,
tidal rapids are an extremely difficult environment in which to conduct research,
especially when currents are running strongly, which is exactly the time when the
potential risk of collision with turbines is greatest. Consequently, very little relevant
quantitative data has been collected from these habitats. The second consideration is
that these areas are a very small part of the range of any marine mammal species and
are so unusual, that it is not possible to extrapolate from observations of densities or
behaviour made on a much larger spatial scale outside these areas. The purpose of the
project reported here was to undertake directed research on marine mammals at tidal
rapid sites in Wales and to collect data relevant to assessing risks if tidal turbines were
installed at these sites. As this was very much a new area of investigation a variety of
research approaches were trialled and some new techniques were developed and
tested.
S.2 Cetacean research was conducted using a range of approaches: visual and towed
hydrophone acoustic surveys from a dedicated research vessel, passive acoustic
monitoring using static acoustic data loggers and visual observations from the shore. In
addition, a new system for measuring dive behaviour using a vertical hydrophone array
was developed and tested. Cetacean fieldwork took place in July and August of 2009 in
the tidal rapids around the Skerries and North and South Stacks in Anglesey and tidal
rapids in Ramsey Sound and off the Bishops and Clerks to the west of Pembrokeshire.
Fieldwork is always heavily dependent on weather conditions. July and August 2009
were exceptionally windy and this had a particularly deleterious effect on visual data.
JER3688 Welsh Assembly Government Planning & Development 28th March 2011
iv

Studies of Marine Mammals in Welsh High Tidal Waters
Seal behaviour was measured using high resolution GPS/GSM tags attached to newly
weaned pups at breeding beaches close to tidal rapid sites with tags being attached in
the autumn of 2009 and 2010.
S.3 A survey design was devised for boat based visual and acoustic surveys which reduced
the impact of tidal current on survey effort while ensuring that the survey areas were
covered evenly at all states of the tide. Towed acoustic surveys showed that porpoise
densities were high in both study areas. This was particularly the case off
Pembrokeshire where rates of acoustic detection were higher than have been reported
from any other locations so far. Calculated densities for both sites were also amongst
the highest so far reported. The data also indicated variation in porpoise densities and
distributions across the area which correlated with depth but was also related to tidal
height and current flow and their temporal variations. Static acoustic loggers (tPODs)
which were deployed at the Skerries and Ramsey Sound, were particularly effective in
revealing tidal and diurnal patterns. In most cases more acoustic detections were made
at night than during the day. Strong tidal patterns were also observed, but these were
typically quite different at different sites within each study area. In some cases sites
within a kilometre showed contrasting tidal and diurnal patterns. One pattern that
seemed to hold in both the POD and the towed hydrophone data was that porpoise
densities were higher in "flushing out" areas, areas of more turbulent waters "down
stream" from the area of strongest flow. In some cases, the location of these higher
density areas moved to the "other side" of the highest current areas when the tidal
stream reversed. These findings show that there are patterns of differential area use
within these sites which may affect collision risk and could also potentially be used to
reduce it.
S.4 Substantial numbers of common dolphins were also detected visually and acoustically in
the study area off the Bishops and Clerks west of Pembrokeshire. However, there were
insufficient independent encounters to model patterns of density and distribution.
S.5 The towed hydrophone data also provided interesting information on levels of high
frequency background noise at different locations and different states of the tide.
Overall, background noise correlated with current speed, increasing markedly once
currents rose above 1.5 m.s1. There were also discrete areas of extremely high noise
which may be caused by areas of moving sediment. This has implications for the use of
acoustic monitoring to detect marine mammals and the ability of marine animals to
detect and avoid tidal turbine devices acoustically.
JER3688 Welsh Assembly Government Planning & Development 28th March 2011
v

Studies of Marine Mammals in Welsh High Tidal Waters
S.6 The use of the water column by animals in tidal rapid areas has important implications
for collision risk but this is extremely difficult data to obtain from cetaceans. We
developed and tested a system for measuring the depth at which porpoise vocalisations
were made using a vertical hydrophone array deployed from a drifting vessel. This was
very much a feasibility study but also provided useful data showing that in the study
areas off Anglesey, porpoises appeared to be diving to the sea bed and making full use
of the water column. Trials conducted after the end of this study have shown that the
method provides accurate measures of depth and range and development of improved
analysis techniques are continuing.
S.7 Although a great deal of effort was expended on conducting visual surveys, both on the
vessel and from shore, very poor weather conditions meant that they yielded very little
additional useful data. However, the opportunity was taken to develop a
photogrammetric localisation technique better suited to the task of localising marine
mammals during shore observations.
S.8 With the exception of a few visual sightings made during cetacean surveys, all the
information on seal movements and behaviour has been collected using high resolution
fastloc GPS and depth tags which relay data back via the GSM mobile phone network.
These were attached to newly weaned seal pups at breeding beaches close to high tidal
current sites at the Skerries, Bardsey Island and Ramsey Sound in late October of 2009
and 2010. As the data from the second deployment of tags is still being collected, a
complete analysis has not yet been completed. However, some preliminary
observations are highly relevant. Typically, pups spent the first month or so in waters
close to their breeding beaches, spending most of this time in tidal rapid areas,
apparently drifting with the current and repeatedly diving to the bottom in a pattern
characteristic of foraging dives. With time, animals travelled more widely, one ranging
as far as the west of Brittany. In several cases however, seals found other high tidal
current areas and appeared to drift and forage within these in a similar way. It is thus
clear that during the first few months of life, when individuals might be expected to be
most vulnerable, young seals are making extensive use of high tidal current areas.
S.9 This has been one of the largest concerted attempts to study marine mammals in high
tidal current areas. It has provided the first quantitative information on densities,
distributions of marine mammals at potential tidal current sites and new information on
temporal patterns, movements and dive behaviour. The project has also made progress
in developing the tools and techniques required for studying marine mammals in such
challenging environments and in particular have highlighted the utility of passive acoustic
JER3688 Welsh Assembly Government Planning & Development 28th March 2011
vi

Studies of Marine Mammals in Welsh High Tidal Waters
techniques. Its limitations should also be acknowledged however, cetacean field work
was restricted to a few months in the summer of one year, effort was focused on only
one species, the harbour porpoise, and important tools (such as the vertical array) were
developed but there was insufficient time to use them to collect extensive data. Seal
telemetry work has so far been restricted to only a subset of the population, newly
weaned pups. We hope therefore that this will serve as a spring board to more
extensive and long term studies.
JER3688 Welsh Assembly Government Planning & Development 28th March 2011
vii

Studies of Marine Mammals in Welsh High Tidal Waters
Contents
Quality Management ..................................................................................................i
Acknowledgement....................................................................................................iii
Executive Summary..................................................................................................iv
Contents..................................................................................................................viii
Appendices ...........................................................................................................xviii
1 Introduction.........................................................................................................1
1.1 Background ..........................................................................................................1
1.2 Existing knowledge of porpoise distributions in study areas .........................2
1.3 Existing knowledge of grey seal distribution in study areas...........................4
1.4 Report structure ...................................................................................................6
2 Harbour Porpoise Work Schedule and Survey Effort ......................................7
3 Visual and Acoustic Boat Based Surveys for Harbour Porpoise and other
Marine Mammals in High Tidal Areas ....................................................................12
3.1 Introduction ........................................................................................................12
3.2 Methods...............................................................................................................12
3.3 Results ................................................................................................................22
3.4 Discussion ..........................................................................................................45
4 The Use of TPOD, Static Acoustic Loggers, to Describe Aspects of Harbour
Porpoise Ecology in High Tidal Areas...................................................................48
4.1 Introduction ........................................................................................................48
4.2 Methods...............................................................................................................49
4.3 Results ................................................................................................................54
4.4 Discussion ..........................................................................................................67
5 Using a Vertical Array to Investigate use of the Water Column by Harbour
Porpoise in High Tidal Areas..................................................................................71
JER3688 Welsh Assembly Government Planning & Development 28th March 2011
viii

Studies of Marine Mammals in Welsh High Tidal Waters
5.1 Introduction ........................................................................................................71
5.2 Methods...............................................................................................................72
5.3 Results ................................................................................................................76
5.4 Discussion ..........................................................................................................82
5.5 Further research.................................................................................................83
6 Shore Based Observations to Investigate Aspects of Harbour Porpoise
Ecology in High Tidal Areas ...................................................................................84
6.1 Introduction ........................................................................................................84
6.2 Methods...............................................................................................................84
6.3 Results ................................................................................................................89
6.4 Discussion ..........................................................................................................89
6.5 Further research.................................................................................................90
7 Grey Seal Telemetry Study ..............................................................................95
7.1 Introduction ........................................................................................................95
7.2 Methods...............................................................................................................95
7.3 Results ................................................................................................................98
8 General Discussion, Conclusions and Recommendations.........................110
8.1 Tidal rapids as habitats for marine mammals ...............................................110
8.2 Additional analysis of data collected on this project ...................................113
8.3 Lessons for future work ..................................................................................114
8.4 Impact and mitigation studies.........................................................................119
8.5 Further works at these sites............................................................................120
References .............................................................................................................121
Glossary .................................................................................................................127
JER3688 Welsh Assembly Government Planning & Development 28th March 2011
ix
Studies of Marine Mammals in Welsh High Tidal Waters
Tables and Figures
Tables
Table 3-1 Summary of covariates used in the modelling process ........................................ 21
Table 3-2 Porpoise group sizes estimated by Primary and Tracker observers from the
Skerries/Carmel Head and Bishops and Clerks surveys sites (number of groups, mean
group size and SD – standard deviation). ........................................................................... 27
Table 3-3 Summary of acoustic monitoring effort and marine mammal detections in the
Skerries/Carmel Head and Bishops and Clerks surveys sites. ........................................... 28
Table 3-4 comparison between detection rates and estimated densities measured from the
two study areas during this study and those reported from other areas. ............................ 46
Table 4-1 TPOD deployment & logging effort. ...................................................................... 49
Table 4-2 Version 4 TPOD scan settings.............................................................................. 51
Table 4-3 DPM from the 63-day in-sea calibration test, mean ranks and scale factors applied
when comparing daily DPM values of two or more TPODs. ............................................... 56
Table 4-4 Summary of % DPM values, an index of harbour porpoise activity levels. Detection
Positive Days (% DPD) is given as a measure of daily occurrence: the percentage of days
on which porpoises were recorded at each location. Locations have been ranked within
each study site by median daily % DPM. ............................................................................ 57
Table 4-5 Comparison of median daily DPM values recorded during the day and night. The
P-values are the results of Wilcoxon’s signed ranks test (two-sided). ................................ 59
Table 4-6 Comparison of median daily DPM values recorded during the day and night, flood
and ebb phases of the tide. The P-values are the results of Friedman tests. In cases where
a significant difference is indicated, all significant pair wise comparisons are shown......... 65
Table 6-1 Summary of land based survey effort at Carmel Head, Anglesey in July and
August 2009. ....................................................................................................................... 87
Table 6-2 Summary of survey effort expended in Ramsey Sound in September 2009. ....... 89
JER3688 Welsh Assembly Government Planning & Development 28th March 2011
x

Studies of Marine Mammals in Welsh High Tidal Waters
Table 8-1 Summary of some pros and cons of different methodologies for monitoring marine
mammals at high tidal current sites................................................................................... 116
Figures
Figure 1-1 The modelled at-sea usage for grey seals in the Irish Sea based on data from 19
satellite transmitters attached to adult grey seals in 2004. ................................................... 5
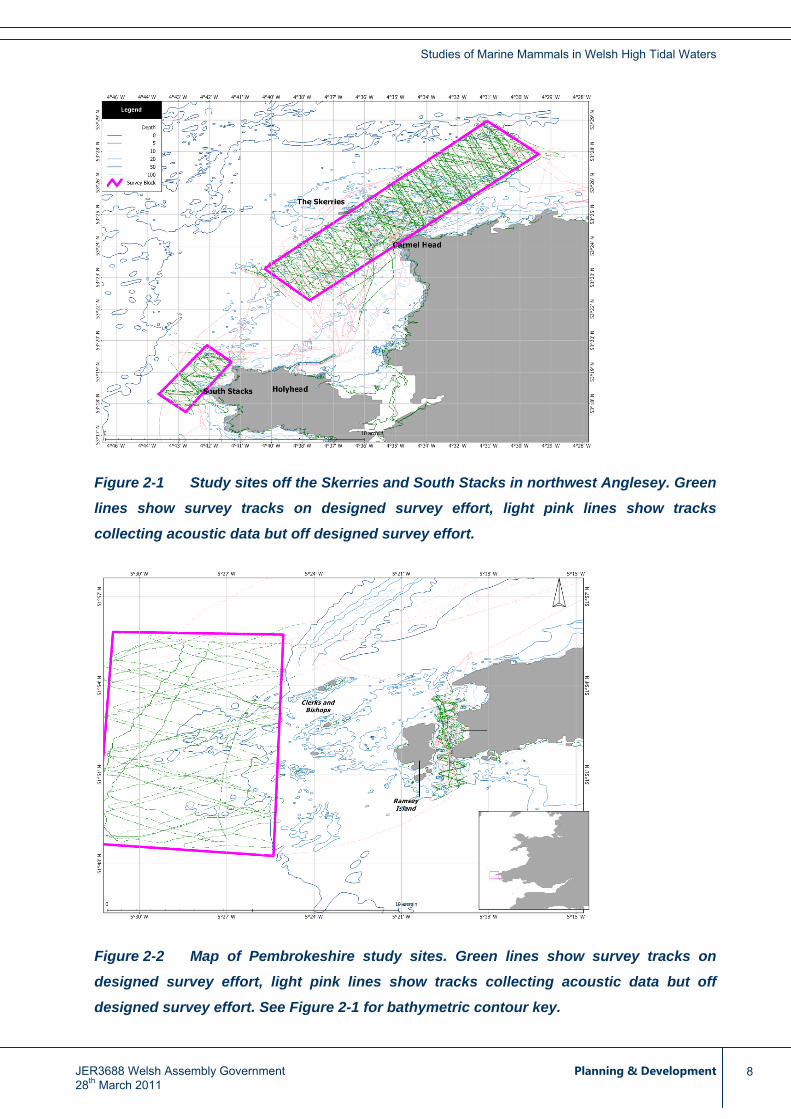
Figure 2-1 Study sites off the Skerries and South Stacks in northwest Anglesey. Green lines
show survey tracks on designed survey effort, light pink lines show tracks collecting
acoustic data but off designed survey effort.......................................................................... 8
Figure 2-2 Map of Pembrokeshire study sites. Green lines show survey tracks on designed
survey effort, light pink lines show tracks collecting acoustic data but off designed survey
effort. See Figure 2-1 for bathymetric contour key................................................................ 8
Figure 2-3 Mean daily wind speed during field work off Anglesey region based on data from
Liverpool Bay oceanographic data buoy (#62125 53.80°N 3.5°W). Orange line shows
threshold between force two and three which might represent the upper limit of “fair” visual
conditions for visually based porpoise research, red line shows boundary of force three and
four which is the upper limit for “possible” conditions for porpoise visual observations ...... 10
Figure 2-4 Mean daily wind speed off Pembrokeshire region during period of fieldwork based
on data from Pembrokeshire Bay oceanographic data buoy (#62303 51.603°N, 5.1°W).
Orange line shows threshold between force two and three which might represent the upper
limit of “fair” visual conditions for visually based porpoise research, red line shows
boundary of force three and four which is the upper limit for “possible” conditions for
porpoise visual observations............................................................................................... 11
Figure 3-1 Left panel: Boy Brendan, showing sonar bow mount on starboard bow and the
scaffolding viewing platform. ............................................................................................... 15
Figure 3-2 Schematic of data collections system developed for SCANSII survey. This system
was used for this survey but with only a single tracking station (the Port Tracker in the
scheme above).................................................................................................................... 16
Figure 3-3 The distribution of effort spatially and temporally within the Skerries Survey
Block. Bar charts show distribution of effort by tidal hour for two minutes (2 nautical miles)
of latitude sectors. ............................................................................................................... 23
JER3688 Welsh Assembly Government Planning & Development 28th March 2011
xi

Studies of Marine Mammals in Welsh High Tidal Waters
Figure 3-4 Distribution of all marine mammal species made off Anglesey during the summer
of 2009. All survey tracks are shown- Green designed effort, pink non designed effort. .... 24
Figure 3-5 Distribution of all marine mammal species made in Ramsey Sound and off the
Bishops and Clerks islands, Pembrokeshire during the summer of 2009. All survey tracks
are shown- Green tracks show designed effort, pink non designed effort. ......................... 25
Figure 3-6 Locations at which groups of feeding seabirds were noted within 100 m of the
track line off Anglesey in summer 2009. ............................................................................. 26
Figure 3-7 Location of areas of high noise when currents were running – thought to be due to
moving sediment. ................................................................................................................ 29
Figure 3-8 Plot of noise against current speed. The drop in noise level at higher current
speeds may be sampling artefacts due to lower number of samples for these faster
currents and/or the fact that such high currents were only encountered in a subset of areas,
which may have been "swept clean" of sediments. ............................................................ 30
Figure 3-9 Locations of all porpoise acoustic encounters in the study area; Carmel Head and
South Stacks, off Anglesey. See text for description of event types. Survey tracks are
shown- green is designed survey, pink is non-designed survey. ........................................ 31
Figure 3-10 Locations of all porpoise acoustic encounters in the study area; Bishops and
Clerks, off Pembrokeshire. See text for description of event types. Survey tracks are
shown- green is designed survey, pink is non-designed survey. ........................................ 31
Figure 3-11 Plot of perpendicular distance from the trackline for 88 good quality tracked
acoustic detections. The best fitting model, shown in red, was a half normal model with 2
cosine parameters. Akaike information criterion = 1035. Effective strip width 186 m 95% CI
157-22 2m. .......................................................................................................................... 32
Figure 3-12 Relative detection rate with received noise level at the hydrophone in porpoise
click frequency band for all data combined. ........................................................................ 34
Figure 3-13 Contour plot of noise levels as a function of predicted current speed and
distance to the closest observed gravel patches. Black lines show average levels, green
and red are plus and minus one standard error respectively. ............................................. 35
Figure 3-14 Contour plot of relative noise levels as a function of depth and slope. Blacks
lines show average levels, green and red are plus and minus one standard error
respectively. ........................................................................................................................ 36
JER3688 Welsh Assembly Government Planning & Development 28th March 2011
xii

Studies of Marine Mammals in Welsh High Tidal Waters
Figure 3-15 Relative noise levels as a function of predicted current speed and distance to
closest observed gravel patch............................................................................................. 36
Figure 3-16 Relative detection rate with depth. All data combined. ..................................... 37
Figure 3-17 Interaction between Latitude and Tidal Height for best fit model for Bishops and
Clerks. Highest detection rates were in the north of the block with high tidal heights.
Detection rates decreased towards the south with the lowest in the south at half tide. Black
lines show average levels, green and red are plus and minus one standard error
respectively. ........................................................................................................................ 38
Figure 3-18 Contour plot of distances to all tidal features as used in the best fit model in
Bishops and Clerks study area. Black lines show average levels, green and red are plus
and minus one standard error respectively. ........................................................................ 39
Figure 3-19 Predicted porpoise density surface for Bishops and Clerks survey areas at
mean high water springs. (Note: prediction becomes increasingly unreliable outside the
surveyed area). ................................................................................................................... 40
Figure 3-20 Predicted porpoise density surface for Bishops and Clerks survey areas at
mean sea level. (Note: prediction becomes increasingly unreliable outside the surveyed
area). .......................................................................................................................... 40
Figure 3-21 Predicted porpoise density surface for Bishops and Clerks survey areas at
mean low water springs. (Note: predictions become increasingly unreliable outside the
surveyed area). ................................................................................................................... 41
Figure 3-22 Contour plot of detection rates in relation to depth and maximum predicted
current flow on the flood tide in the Skerries (off Anglesey) survey area. Detection rates
were lowest in shallow, low energy areas and increased with depth and maximum current
flow. .......................................................................................................................... 42
Figure 3-23 Contour plot of detection rates in relation to distance from observed tidal races
and tidal height. Although a significant term in the best fit model, the plot is fairly flat but
with higher detection rates at low tidal heights close to tidal races or at high tidal heights
furthest away....................................................................................................................... 42
Figure 3-24 Distance from observed tidal race as a function of Latitude and Longitude. The
tidal race occurs across the centre of the box running approximately NW-SE, perpendicular
to the main current flow....................................................................................................... 43
JER3688 Welsh Assembly Government Planning & Development 28th March 2011
xiii
Studies of Marine Mammals in Welsh High Tidal Waters
Figure 3-25 Predicted porpoise density surface for Carmel Head/Skerries (off Anglesey)
survey areas at mean high water springs. (Note: prediction becomes increasingly unreliable
outside the surveyed area).................................................................................................. 44
Figure 3-26 Predicted porpoise density surface for Carmel Head/Skerries (off Anglesey)
survey areas at mean sea level. (Note: prediction becomes increasingly unreliable outside
the surveyed area). ............................................................................................................. 44
Figure 3-27 Predicted porpoise density surface for Carmel Head/Skerries (off Anglesey)
survey areas at mean low water springs. (Note: prediction becomes increasingly unreliable
outside the surveyed area).................................................................................................. 45
Figure 4-1 The location of TPOD moorings at Skerries/Carmel Head (Anglesey) (left) and the
Ramsey Sound (Pembrokeshire) (right) in 2009................................................................. 52
Figure 4-2 TPOD calibration: a) raw and b) scaled Detection Positive Minutes (DPM) during a
63 day deployment in Welsh waters. .................................................................................. 55
Figure 4-3 Daily detection positive minutes during deployments at five sites in the
Skerries/Carmel Head study area. ...................................................................................... 58
Figure 4-4 Daily detection positive minutes during deployments at four sites in the Ramsey
Sound study area. ............................................................................................................... 58
Figure 4-5 The Skerries / Carmel Head: day – night variation in porpoise acoustic detection
rates at each POD location ................................................................................................. 60
Figure 4-6 Ramsey Sound: day – night variation in porpoise acoustic detection rates at each
POD location. ...................................................................................................................... 61
Figure 4-7 The Skerries / Carmel Head: distribution of porpoise detections in relation to the
time of last HW.................................................................................................................... 62
Figure 4-8 Ramsey Sound: distribution of porpoise detections in relation to the time of last
HW. .............................................................................................................................. 63
Figure 4-9 An illustration of relative levels and dominant tidal phase of harbour porpoise
activity recorded at each POD location for (a) the Skerries (left) and (b) Ramsey Sound
sites (right). Symbol size is proportional to total DPM %. Arrows indicate the direction of
the tidal stream when peak detections were recorded. At both sites the flood tide has a
north going current and the ebb a south going current. ...................................................... 64
JER3688 Welsh Assembly Government Planning & Development 28th March 2011
xiv

Studies of Marine Mammals in Welsh High Tidal Waters
Figure 5-1 Diagram of a four element vertical array for determining the depth of porpoise
vocalisations........................................................................................................................ 73
Figure 5-2 Example plot of likelihood against depth and range (x) for a porpoise click
recorded on the vertical array. ............................................................................................ 76
Figure 5-3 Plot of typical inclinometer data showing angle from vertical in degrees of the
crane wire at the location of the bottom hydrophone pair (red dots) and the top of the
cable above water (blue dots). Samples are 0.2 seconds apart. ........................................ 77
Figure 5-4 Tracks of vessel while making drift recordings with vertical line array. Inset shows
tracks in Ramsey Sound. .................................................................................................... 78
Figure 5-5 Porpoise click waveforms recorded on four channels from the vertical array....... 79
Figure 5-6 Errors on range and depth measurements as a function of range. It can be seen
that the error on the range estimation is considerably greater than the error on the depth
estimation. This is a direct result of the vertical array geometry employed......................... 80
Figure 5-7 Depth(top panel) and range (bottom panel) for clicks localised within 100m of the
array. Vertical blue lines show breaks between clicks separated by>60 seconds. Clicks
between lines are likely to be from the same individual or group........................................ 81
Figure 6-1 Location of shore station on Carmel Head, Anglesey in July/August 2009. ......... 87
Figure 6-2 Locations of two shore stations overlooking Ramsey Sound used in September
2009. .......................................................................................................................... 88
Figure 6-3 Measurements taken from a still image to locate a surfacing harbour porpoise... 91
Figure 6-4 Recorded focal length of Canon EF-S 55-250 mm zoom lens against measured
size of a fixed object in pixels on image.............................................................................. 91
Figure 6-5 Frequency of observed distances to surfacing porpoises from Pen Anglas
(Fishguard) observation height 27 m. ................................................................................. 92
Figure 6-6 Locations of all surfacings of porpoises captured on still images, (x,y) co-ordinates
are relative to observation position. .................................................................................... 93
Figure 7-1 GPS Phone Tag.................................................................................................... 96
JER3688 Welsh Assembly Government Planning & Development 28th March 2011
xv

Studies of Marine Mammals in Welsh High Tidal Waters
Figure 7-2 GPS tracks of three grey seal pups tagged on Skerries, Anglesey. All three seals
spent an initial period foraging in the high tidal flow areas around Anglesey before moving
away. One remained in the area, using a haul-out site on the Llynn Peninsula for 10 weeks
before moving back to the Skerries. The others moved to haul-out sites in the Saltees,
Ireland. 100
Figure 7-3 GPS tracks of grey seal pups tagged on Bardsey Island. Both spent an initial
period of two weeks foraging in the vicinity of Bardsey Island. One was subsequently found
dead on the Llynn Peninsula. The other spent short periods foraging near Rosslaire in
Ireland, Scilly Isles and Lands End and made one extended but apparently unsuccessful
foraging trip to the west of Brittany. The seal was re-captured on 26/12/09 and taken to a
rehabilitation centre in Cornwall. ....................................................................................... 101
Figure 7-4 Example of the summary data transmitted by one of the grey seal pups tagged on
the Skerries. Blue bar graph at the top represents the summary dive behaviour, showing
maximum dive depth in two hr bins. Yellow dots indicate where full depth temperature
profiles were recorded. Depth profiles of all individual dives are transmitted and will be used
in analysis of 3D space usage. ......................................................................................... 102
Figure 7-5 Dive profiles of a juvenile grey seal swimming in high tidal current areas around
the Skerries off Anglesey, North Wales. of distances from shore at which seals crossed an
arbitrarily defined line stretching 8km from Carmel head passing through the Skerries.
Periods of typical flat bottomed foraging dives to the sea bed (a and b) were interspersed
with typical travelling dives (c)........................................................................................... 103
Figure 7-6 Proportion of time spent at different depths, expressed as a proportion of the
maximum depth, within individual dives (n=17000) by seal 07 while swimming within 15km
of the Skerries. .................................................................................................................. 104
Figure 7-7 Distribution of distances from shore at which seals crossed an arbitrarily defined
line stretching 8km from Carmel head passing through the Skerries................................ 106
Figure 7-8 Depth and distance from shore of seals crossing an arbitrarily defined line
stretching 8km from Carmel head passing through the Skerries. ..................................... 106
Figure 7-9 GPS tracks of grey seal pups tagged on Ramsey Island and the Skerries,
Anglesey in October/November 2010. Tracks represent the first foraging trips by naïve
weaned grey seal pups. The tracks of Skerries seals are similar to the early foraging trips
of the 2009 sample (see Figure 7-2 and Figure 7-3)......................................................... 108
JER3688 Welsh Assembly Government Planning & Development 28th March 2011
xvi

Studies of Marine Mammals in Welsh High Tidal Waters
Figure 7-10 (continued) GPS tracks of grey seal pups tagged on Ramsey Island and the
Skerries, Anglesey in October/November 2010. Tracks represent the first foraging trips by
naïve weaned grey seal pups. The tracks of Skerries seals are similar to the early foraging
trips of the 2009 sample (see Figure 7-2 and Figure 7-3)................................................. 109
JER3688 Welsh Assembly Government Planning & Development 28th March 2011
xvii

Studies of Marine Mammals in Welsh High Tidal Waters
JER3688 Welsh Assembly Government Planning & Development 28th March 2011
xviii
Appendices
Appendix 1 Vessel based survey log
Appendix 2 Vertical Array – additional analysis
Appendix 3 Seal Tags – parameter settings

Studies of Marine Mammals in Welsh High Tidal Waters
1 Introduction
1.1 Background
1.1.1 Renewable power generation is an important part of long-term plans for sustainable, low
carbon energy production. One technology that promises significant potential for some
coastal regions, including areas around the Welsh coast, is tidal power. Electrical power
would be generated by placing rotating turbines driving generators within areas of high
tidal current. While there could be long term environmental benefits from these devices
in terms of reduced emissions and improved sustainability, immediate local
environmental impacts from the construction and operation of tidal turbine plants must
also be considered. Areas with high tidal currents that have been identified as preferred
sites for tidal turbines are usually frequented by marine mammals; indeed there are
indications that such areas may be preferred habitats (e.g. Johnston et al., 2005a;
Johnston et al., 2005b; Pierpoint, 2008).
1.1.2 One of the most significant potential threats from tidal turbines has been identified as the
risk of collision between marine mammals and turbine blades (Wilson et al. 2007). The
extent to which this will prove a problem will be highly dependent on the degree to which
marine mammals are able to detect and avoid turbine blades, and this information will
only become available once observations can be made at operating devices. However,
it is a reasonable assumption that the probability of collisions will depend quite directly
on the amount of time that animals spend in the proximity of turbine blades, which
equates to a fine scale density distribution of marine mammals in high tidal current
areas. Because different turbines can be deployed at different depths and marine
mammals spend significant time underwater, the diving behaviour of marine mammals
and the proportion of time they spend at different depths are important parameters
affecting collision risk. What we need to know, in effect, are the three dimensional
distributions and densities of marine mammals and relate these to the potential site
choices for tidal turbines.
1.1.3 Another area of concern is the extent to which operating turbines might disturb marine
mammals, potentially excluding them from important habitats. In addition, arrays of tidal
turbines may act as barriers restricting animal's movements between important areas.
1.1.4 High tidal current areas are a small and unusual part of the range of any marine
mammal species. While there is a general belief that they may be important and
JER3688 Welsh Assembly Government Planning & Development 28th March 2011
1

Studies of Marine Mammals in Welsh High Tidal Waters
preferred areas, there is little understanding of the densities of animals in these areas, or
how they use these remarkable habitats. In part, this is because the strong tidal currents
and the rough sea conditions that they give rise to make these very difficult areas in
which to conduct standardised surveys. In fact they would normally be avoided. A further
complication is that it is expected, and has been reported, that the use of these areas by
marine mammals varies with the state of the tide. Thus any survey work needs to cover
the areas through all stages of the tides.
1.1.5 For these reasons, this project focused on fine scale and detailed surveys of cetaceans
in high tidal current areas including investigations of dive depth and underwater
behaviour, while attempting to gain an understanding of how these animals use high
tidal current systems and their significance as habitat for local populations. This type of
work poses severe challenges for conventional survey methods and there are no
existing agreed procedures to apply. For this reason we planned to use a number of
different and complementary approaches, allowing an assessment of methodologies to
be made, while providing the required data to provide us with an understanding of the
use of high tidal areas in Welsh waters.
1.1.6 The surveys undertaken and reported in the subsequent sections were not specifically
designed as species-specific harbour porpoise surveys e.g. visual surveys and acoustic
systems, and records of all species have been included in the report where appropriate.
However, due to the relatively high abundance of harbour porpoises compared to other
species within the study areas, most records (and consequently potential encounters
with marine renewable devices are likely to involve) harbour porpoises.
1.2 Existing knowledge of porpoise distributions in study areas
1.2.1 Two areas of high tidal energy for which there are already plans to install tidal turbines
were identified. The first was off the Skerries and South Stack in Anglesey and the
second in waters to the west of Pembrokeshire, including Ramsey Sound.
North Anglesey
1.2.2 Harbour porpoise are present year round off the coast of Anglesey, North Wales,
principally along the northern coast from Point Lynas in the east to South Stack in the
west, with an increase in sightings over the summer months (Calderan, 2003;
Shucksmith et al., 2009). The northern coastline of Anglesey is characterised by many
overlaying rocks, and a broken and uneven seabed of pinnacles and gullies with rapid
changes in bottom relief. The topography, in conjunction with the area’s strong currents
JER3688 Welsh Assembly Government Planning & Development 28th March 2011
2

Studies of Marine Mammals in Welsh High Tidal Waters
results in the presence of a range of fine-scale oceanographic tidal features with which
harbour porpoises are often associated (Shucksmith et al., 2009).
1.2.3 Lack of systematic survey work carried out on the northern coasts of Wales means that
harbour porpoise distribution and abundance in these areas is relatively poorly known
(Calderan 2003; Shucksmith et al. 2009; Reid et al., 2003b). However, some land-
based monitoring has been carried out, in particular by Marine Awareness North Wales.
This group also conducted boat-based visual line-transect surveys between 2002 and
2004. These vessel surveys estimated an absolute abundance of 309 animals along the
northern coast of Anglesey over the summer months. 65% of all porpoise detections
were in waters between 30 and 45 m deep, and 75% of sightings were made within 5 km
of land (Shucksmith et al., 2009).
1.2.4 Shucksmith et al. (2009) found the highest porpoise densities along the Anglesey north
coast to be at Point Lynas and South Stack, both of which the authors suggested as
foraging grounds for porpoises, with animals taking advantage of the tidal features which
are assumed to aggregate prey. Calderan (2003) also found regular harbour porpoise
presence in the waters around Middle Mouse (Ynys Badrig). Presence, absence and
apparent foraging behaviour at the site were strongly dependent on the state of tide, with
the highest densities and levels of activity being during the flood phase.
Pembrokeshire
1.2.5 The harbour porpoise is the most commonly encountered cetacean on the
Pembrokeshire coast (Reid et al., 2003a, Baines and Evans, 2009). The species is
present throughout the year (Evans et al., 2003, Pierpoint, 2001). A region-wide acoustic
and visual survey (Pierpoint, 2001) located concentrations of animals off the estuary of
the River Teifi, at Strumble Head and close to the Pembrokeshire Islands. The species
is believed to breed locally (Penrose and Pierpoint, 1999); approximately 24% of schools
observed in July included neonate calves. There is very little information on the local
movements of individual animals, or that identifies the factors that cause porpoises to
regularly occupy specific locations. The region however, has been identified as being of
particular importance for harbour porpoises within the UK (Evans and Wang, 2002).
1.2.6 A number of studies have been carried out at near-shore sites with good vantage points
that regularly attract aggregations of porpoises. Highest numbers of animals (< 100 at
any one time) have been recorded at Strumble Head (Pierpoint et al., 1994). Strumble
Head is a prominent headland about which extensive tidal races form. Harbour
porpoises are often observed within the tidal rips, upwellings and overfalls surfacing
JER3688 Welsh Assembly Government Planning & Development 28th March 2011
3

Studies of Marine Mammals in Welsh High Tidal Waters
amongst feeding seabirds. Land-based observations have been carried out at Ramsey
Sound since 1992 (Pierpoint, 1993; Barradell, 2009). Tidal races form in Ramsey Sound
where the tidal stream is constricted by coastal and seabed topography, between
Ramsey Island and the mainland. Pierpoint (2009) speculates that harbour porpoise
exploit a regular occurrence and accessibility of prey in Ramsey Sound. Porpoises
appear to occupy this site awaiting prey that is carried to them and concentrated by the
tide. This site supports groups of 1-18 animals. Newport Bay on the north
Pembrokeshire coast is an embayment without strong tidal features. A study using
passive acoustic data-loggers however, found that porpoise detection rates were far
higher at night than during daylight hours (Pierpoint et al., 2000). The nocturnal peak in
activity was again believed to be associated with the accessibility of prey, particularly in
the early winter when herring visit the bay to spawn.
1.3 Existing knowledge of grey seal distribution in study areas
Numbers of seals at haul-out sites
1.3.1 Data on the number of grey seals at haul-out sites around the Irish Sea are sparse. For
the analysis here (Chapter 7), data were taken from several sources:
Scotland and Northern Ireland: data from SMRU aerial surveys in 1996-2008
(SCOS 2009);
Irish Republic: data from aerial surveys and ground counts in 2003 (Cronin et al.
2004); and
Wales: ground count data (Wescott and Stringell, 2004; Keily et al., 2000).
1.3.2 Numbers of seals associated with all known haul-out sites are grouped together, based
on the telemetry data, to give a single figure for each of seven haul-out regions.
Telemetry data analysis and space use modelling
1.3.3 In previous tag deployments in Welsh waters, Argos location data were filtered to
smooth the tracks and minimise the error associated with the locations before being
included in the model. The high resolution GPS data provided by the current tags means
that this stage can be omitted from this study (see Section 7). Tracks for each animal
were split into individual trips, defined as beginning when an animal first dived to over 10
m after a haul-out period and ending when the animal hauled out again. Each trip was
assigned to one of the seven haul-out regions.
JER3688 Welsh Assembly Government Planning & Development 28th March 2011
4

Studies of Marine Mammals in Welsh High Tidal Waters
1.3.4 Data on seal movement (speed, trip duration, locations of haul-outs, and obstacles to
movement) were used to calculate the accessibility of points at sea as a function of
distance from the centre of a haul-out region (Matthiopoulos, 2003a). Maps of
accessibility were used to inform estimation of space use by each seal. Estimates of
uncertainty were calculated through combining estimates of usage for all tagged
individuals. Usage maps were weighted for the number of seals within each haul-out
region.
1.3.5 The main product from this analysis was a seal usage map, equivalent to a density
contour plot for the estimated distribution of seal activity at sea. The usage map
generated from deployment of 19 Argos satellite transmitters is shown in Figure 1-1 for
illustration.
Figure 1-1 The modelled at-sea usage for grey seals in the Irish Sea based on data
from 19 satellite transmitters attached to adult grey seals in 2004.
JER3688 Welsh Assembly Government Planning & Development 28th March 2011
5

Studies of Marine Mammals in Welsh High Tidal Waters
1.4 Report structure
1.4.1 This report is divided into the following chapters: Chapter 2 provides an overview of the
harbour porpoise work schedule and survey effort; Chapter 3 provides details and
discussion on the boat based visual and towed acoustic surveys; Chapter 4 on the use
of TPODs to describe aspects of harbour porpoise ecology in high tidal habitats; Chapter
5 on the use of vertical array for recording harbour porpoise activity; Chapter 6 provides
a brief overview of shore based observation of marine mammal activity; and Chapter 7
on the preliminary results the grey seal tagging trial. Chapter 8 provides a general
discussion and conclusions based on an overview of all of the surveys undertaken as
part of this project, and recommendation for future work in this field.
JER3688 Welsh Assembly Government Planning & Development 28th March 2011
6

Studies of Marine Mammals in Welsh High Tidal Waters
2 Harbour Porpoise Work Schedule and Survey Effort
2.1.1 There have been relatively few attempts to survey cetaceans in high tidal current areas.
The habitat poses some substantive challenges and there are no universally recognised
methods for conducting quantitative surveys. Thus, we started by adopting a broad
approach including methods utilising land and boat based visual observation as well as
towed and static acoustic monitoring for harbour porpoises. This would allow us to
gauge the potential and problems of different approaches and focus effort on the most
promising ones once identified.
2.1.2 Published studies have suggested that areas characterised by both the highest tidal
streams, and the areas of outflow and disturbed water either side, are particularly
important for marine mammals (Pierpoint, 2008, Johnston et al., 2005). These
observations were used to set the scale of our study areas, covering “tidal systems”
rather than simply small areas with the highest stream rates.
2.1.3 Off Anglesey, survey blocks were delineated for two areas, one based around the
channel between the Skerries and the mainland and the second in the area between
North and South Stacks (Figure 2-1). Off Pembrokeshire, the principal survey block was
an area to the west of the Bishops and Clerks islands, an area which, unlike Ramsey
Sound, cannot be observed from land and is comparatively poorly known in term of
cetacean densities, yet holds substantial potential interest as a site for tidal turbine
installations (Figure 2-2).
JER3688 Welsh Assembly Government Planning & Development 28th March 2011
7
Studies of Marine Mammals in Welsh High Tidal Waters
Figure 2-1 Study sites off the Skerries and South Stacks in northwest Anglesey. Green
lines show survey tracks on designed survey effort, light pink lines show tracks
collecting acoustic data but off designed survey effort.
Figure 2-2 Map of Pembrokeshire study sites. Green lines show survey tracks on
designed survey effort, light pink lines show tracks collecting acoustic data but off
designed survey effort. See Figure 2-1 for bathymetric contour key.
JER3688 Welsh Assembly Government Planning & Development 28th March 2011
8

Studies of Marine Mammals in Welsh High Tidal Waters
2.1.4 Vessel based work was undertaken in the Skerries field site between 20th July 2009 and
13th August 2009 and at the Pembrokeshire site between 14th August 2009 and 28th
August 2009 (a daily summary of boat based activities is provided in Appendix 1). Static
passive acoustic detection devices were also deployed at both sites between 21st July
2009 and 12th August 2009 in the Skerries and 17th August 2009 and 25th September
2009 at Ramsey Sound. Shore-based observations were conducted from Carmel Head
in the Skerries survey areas between 25th July 2009 and 11th August 2009 and in
Ramsey Sound between 2nd September 2009 and 18th September 2009. The success of
porpoise fieldwork, especially that involving visual observation, is highly dependent on
good weather conditions. Analysis of visual sighting survey data for harbour porpoises
shows that sighting rates fall off rapidly once sea state rises above Beaufort 1 (Palka,
1996). Conditions might be considered “fair” up to Beaufort 2 and any pretence at
conducting productive visual surveys is typically abandoned above Beaufort 3. Areas of
high tidal current with tidal features such as standing waves result in “sea states” that
diminish detectability even in the lowest wind speeds, and also exacerbate the effect of
wind speed on sea state and sighting conditions.
2.1.5 Figure 2-3 and Figure 2-4 show the daily average wind speeds for the periods of boat-
based field work off Anglesey and Pembrokeshire respectively, based on data from the
closest oceanographic data recording buoys. On these plots, the orange and red lines
show the thresholds for “fair” and “possible” conditions respectively for visual porpoise
surveys. It is clear that, although the survey periods were chosen to maximise the
probability of experiencing calm conditions, the weather was extremely poor, and much
worse than would be expected at this time of year in these locations. In fact, over the
entire study period, we experienced just two half days of good porpoise sighting weather
while we were working off Anglesey, and none at all off Pembrokeshire. This inevitably
seriously impacted field work, especially that which involved visual survey.
JER3688 Welsh Assembly Government Planning & Development 28th March 2011
9

Studies of Marine Mammals in Welsh High Tidal Waters
Figure 2-3 Mean daily wind speed during field work off Anglesey region based on data
from Liverpool Bay oceanographic data buoy (#62125 53.80°N 3.5°W). Orange line shows
threshold between force two and three which might represent the upper limit of “fair”
visual conditions for visually based porpoise research, red line shows boundary of force
three and four which is the upper limit for “possible” conditions for porpoise visual
observations
JER3688 Welsh Assembly Government Planning & Development 28th March 2011
10

Studies of Marine Mammals in Welsh High Tidal Waters
Figure 2-4 Mean daily wind speed off Pembrokeshire region during period of fieldwork
based on data from Pembrokeshire Bay oceanographic data buoy (#62303 51.603°N,
5.1°W). Orange line shows threshold between force two and three which might represent
the upper limit of “fair” visual conditions for visually based porpoise research, red line
shows boundary of force three and four which is the upper limit for “possible”
conditions for porpoise visual observations.
JER3688 Welsh Assembly Government Planning & Development 28th March 2011
11

Studies of Marine Mammals in Welsh High Tidal Waters
3 Visual and Acoustic Boat Based Surveys for Harbour Porpoise and other Marine Mammals in High Tidal Areas
3.1 Introduction
3.1.1 Boat based visual line transect survey is probably the commonest approach employed
for making population estimates of cetaceans, including harbour porpoise, and a
substantial amount of work has gone into developing methods to analyse data from such
surveys (Thomas et al., 2010). Large scale population surveys in both Europe,
(Hammond and Macleod, 2003; Hammond et al., 1995) and North America (Palka, 2000;
Barlow and Hanan, 1995) have relied on data collected from ship board surveys to
calculate abundance and population estimates for harbour porpoises. In recent years
towed acoustic survey equipment has increasingly been used alongside visual
techniques on ship board line transect surveys and these have proven particularly useful
on harbour porpoise surveys (Gillespie et al. In review; Chappell et al., 1996; Gillespie
and Chappell, 2002; Gillespie et al., 2005).
3.2 Methods
Survey design
3.2.1 Marine mammal surveys have rarely been carried out in areas of high tidal current and
there is as yet no consensus on the most appropriate methodologies to apply. High tidal
currents pose several survey design problems as discussed in the next few paragraphs.
3.2.2 When surveying from a vessel within a water mass that is moving at significant speeds,
there is a substantial difference between the vessel’s tracks and consequent survey
effort through the water and those over the seabed. Thus, a researcher needs to decide
at an early stage whether the survey is of a water mass or of a geographical space. In
some cases, which of these is appropriate will be clear. For instance, if surveying
passive plankton, one would design a survey of a water mass, whereas if the target
were a sessile benthic organism, such as a coral, one would survey geographical space.
The appropriate perspective is less clear-cut when surveying actively swimming animals,
such as marine mammals, that may or may not maintain station within currents. Design
is further complicated by the fact that the strength of current will vary both spatially and
temporally.
JER3688 Welsh Assembly Government Planning & Development 28th March 2011
12

Studies of Marine Mammals in Welsh High Tidal Waters
3.2.3 For this project, it was decided to consider the survey to be of a geographical space
rather than a moving water mass, principally because tidal turbines are certainly fixed in
space as, to a lesser extent, are tidal features in the water column, such as overfalls and
rips. Furthermore, some observations of marine mammals in high tidal stream areas
report individuals maintaining station in currents (e.g. Pierpoint, 2008).
3.2.4 A zig-zag survey design across and in the direction of the current was selected. The
angles of the survey tracks made in relation to the current direction were chosen such
that for a constant vessel speed through the water the speed over the bottom would be
the same at both zero current and at the maximum expected tidal current, and between
these extremes bottom speed would not vary by more than 7%. Maintaining constant
boat speed through the water was particularly important for the consistency of the
acoustic data since boat speed is a major factor determining noise. A number of survey
legs with turning angles of 44 degrees and different starting locations were laid out for
each survey block with a range of different starting points. For each survey run available
(i.e. not previously completed), tracks were chosen in a non-systematic manner.
3.2.5 To achieve these tracks it was necessary to adjust the vessel’s heading more or less
continuously over the course of each leg to allow for the effects of current. This required
constant attention from the helmsman but was certainly a more practical approach than
alternatives such as adjusting boat speed. Even so, maintaining the designed survey
tracks was challenging in areas with strong and variable tidal currents and with
numerous navigation hazards to avoid.
3.2.6 Because, by design, survey tracks would only be conducted in the direction of the
current, the vessel would often have to motor directly against the current between
consecutive survey routes, often on tracks that avoided the strongest currents. During
such “passages” full acoustic effort was maintained but often visual effort was reduced
to allow visual teams to rest or attend to other tasks. These data will not be treated as
part of the main survey but may provide useful additional distribution data (see Figure
2-1 and Figure 2-2).
3.2.7 Another important consideration when designing surveys in high tidal current areas is
that it is expected that the spatial distribution of animals will vary temporally in these
areas, in particular with the tidal state. Thus, in addition to attaining an even spatial
coverage (as one would seek to do in a standard survey) one would also like each area
to receive equal coverage during each state of the tide. To address this, the spatial
extent of the survey effort during different tidal states was computed and noted and,
JER3688 Welsh Assembly Government Planning & Development 28th March 2011
13

Studies of Marine Mammals in Welsh High Tidal Waters
where possible, the timing of surveys was adjusted to attempt to achieve near-even
spatial coverage over different tide states.
3.2.8 A final concern is the fact that the tidal flow affects the ease at which animals can be
detected. For instance, at the surface, tidal features such as standing waves, rough
patches and overfalls will all make animals harder to detect visually. In addition, levels of
underwater background noise can be affected by tidal currents, probably as a result of
water turbulence and the movements of sediments. This will affect acoustic detection.
These factors complicate conventional survey analyses and need to be taken into
account at the design stage. To partially address these issues, we employed two
completely different detection methods, visual and acoustic, which are likely to be
affected differently by such features. We also updated information on sighting conditions
within the sightings database frequently, whilst background noise was logged
continuously.
3.2.9 Some of these design and methodology issues were discussed at a workshop that
participants in this study were involved in organising. This was held at the University of
St Andrews Centre for Research in Ecology and Ecological Modelling (CREEM) in June
2009.
Research vessel
3.2.10 The vessel used as the survey platform for this project was “Boy Brendan”, a 55’
displacement motor vessel operated by Sea Wide Surveys, Falmouth. It was selected as
it had a number of features that suited it for this work. These included: (a) being
equipped with a capable crane and winches and a crew with extensive experience of
deploying and retrieving gear over the side; (b) mounts for depth sounders and sonar on
the bow and the beam; and (c) the ability to accommodate four scientists on board. A
scaffolding tower was constructed on the foredeck to provide a secure lookout location
for up to three observers with a height of eye of ~5m (Figure 3-1).
JER3688 Welsh Assembly Government Planning & Development 28th March 2011
14

Studies of Marine Mammals in Welsh High Tidal Waters
Figure 3-1 Left panel: Boy Brendan, showing sonar bow mount on starboard bow and
the scaffolding viewing platform.
Visual data collection
3.2.11 Visual data were collected using the highly automated system developed for the
SCANSII survey (Gillespie et al. in press) (see Figure 3-2). This is based on the Logger
data collection program originally supported and made available by IFAW (the
International Fund for Animal Welfare). The Logger software stores data in a single
integrated Microsoft Access database. Data validation and error checking were
performed, usually at the end of each working day, with the help of dedicated software
developed for the SCANSII survey in 2005.
JER3688 Welsh Assembly Government Planning & Development 28th March 2011
15

Studies of Marine Mammals in Welsh High Tidal Waters
Figure 3-2 Schematic of data collections system developed for SCANSII survey. This
system was used for this survey but with only a single tracking station (the Port Tracker
in the scheme above).
3.2.12 When conditions allowed, visual data were collected from the sightings platform by a
team of three observers. Two primary observers, one to port, the other starboard,
searched from the track line to the beam with the naked eye. These observers are
referred to as “primary” observers. Marine (7x50) binoculars were used as required to
investigate sightings further. A third observer, the “tracker”, was stationed between them
and searched a more restricted sector (approximately 60 degrees either side of the
trackline) using 7x50 binoculars coaligned with a high definition video-based range
measuring system. The three observers worked as a single team as, with only one small
platform, it was not feasible to use methods requiring independent observers.
JER3688 Welsh Assembly Government Planning & Development 28th March 2011
16

Studies of Marine Mammals in Welsh High Tidal Waters
JER3688 Welsh Assembly Government Planning & Development 28th March 2011
17
3.2.13 A data recording station was established on the vessel’s bridge. Here a fourth
researcher, the data recorder, entered data into customised forms in the Logger
program which ran continuously on a laptop computer. Logger also automatically
recorded data on the vessel’s position from the ship’s Hemisphere Vector GPS unit. In
addition to providing data on the vessel’s location, speed and heading over ground, the
Hemisphere GPS system gave a continuous accurate measure of the vessel’s heading
(in such high currents this was often quite different to the direction of movement
provided by a standard GPS). The data recorder used headphones to listen to voice
channels from all three observers and could communicate with them using handheld
radios.
3.2.14 When primary observers made a sighting they pressed their “sighting” button. This
triggered Logger to open a time-stamped sighting form and to initiate an audio recording.
These recordings were time buffered so that several seconds of sound before the button
press were also captured. They were intended to be used during data validation to
check the details of any sighting. The data recorder filled in as many details as possible
on the forms opened by sighting button key presses. Subsequent sightings believed to
be resightings of the same animal were marked by pressing a different “resighting”
button. The bearing to animals and their headings were assessed with the help of angle
boards mounted on the platform. Ranges were estimated by eye or measured using the
reticules in the binoculars or with a sighting stick held at arm's length1.
3.2.15 The “tracker” had a third set of sighting and resighting buttons. In addition to opening the
appropriate time-stamped forms and initiating audio recording, pressing the tracker
buttons caused Logger to start recording video from a camcorder mounted on a frame
so that it was coaligned with the tracker’s binoculars with the same field of view. These
recordings were made using a Focus Enhancements FS4 Firestore hard disk recorder, a
device that incorporates a six second video buffer, so that the six seconds of video
before the key press (which would thus include the cues that initiated the sighting) were
also recorded. This feature has proven extremely useful when attempting to record
range video from animals such as harbour porpoises which are only fleetingly visible at
the surface. Frames from video sequences that showed both the horizon and the object
1 Several bespoke sighting sticks were made to match individual observer’s eye height on the platform and their arm
length.

Studies of Marine Mammals in Welsh High Tidal Waters
of interest were captured and analysed during validation to provide an accurate measure
of range.
3.2.16 The video/binocular frame also held a downward facing webcam. The angle in which the
binoculars were pointing at any time could be determined by measuring the angle of
lines marked on the floor of the observation tower running across ship on captured
webcam frames. Pressing the tracker buttons triggered Logger to capture ten frames
from the webcam. Angles relative to the vessel were measured during validation to
determine the bearing to the sightings.
3.2.17 In addition to information on marine mammal sightings, data were also collected for all
feeding seabird groups observed within 100 m and for all vessels within 1 km. Tidal
features passing within 50 m of the vessel’s track were also noted. Tidal feature types
included:
Tidal race: main body of fast moving water;
Tidal boil: a circular area of smooth water where a small upwelling is occurring;
Standing wave: waves induced by current. Often confused they may appear to be
stationary;
Front: the boundary between two different water masses; and
Whirlpool: a swirling body of water, usually with a central downwelling.
Towed passive acoustic monitoring
3.2.18 Porpoises can be detected acoustically using hydrophones to pick up their underwater
vocalisations and specialist software to detect them. Harbour porpoise use narrow band
ultrasonic (115-135 kHz) pulses for echolocation (Verfuss et al., 2009). Because these
vocalisations are well above the human auditory range, special equipment and digital
signal processing is required to detect them. Effective detection range is typically in the
order of 200 m (Chappell et al., 1996; Gillespie and Chappell, 2002). Acoustic detection
is generally less affected by weather conditions than visual detection and can continue
in poor sighting conditions and at night, which are both highly significant practical
advantages.
3.2.19 Towed hydrophone survey equipment, similar to the system developed for the SCANSII
surveys (Gillespie et al. In review) was deployed and operated whenever the vessel was
at sea. The towed hydrophones consisted of pairs of Magrec HP03 hydrophone units
separated by 25 cm mounted in a 5 m long 35 mm diameter oil-filled polyurethane tube
JER3688 Welsh Assembly Government Planning & Development 28th March 2011
18

Studies of Marine Mammals in Welsh High Tidal Waters
JER3688 Welsh Assembly Government Planning & Development 28th March 2011
19
towed on 100 m of strengthened cable. Each HP03 is made up of a 12.7 mm
piezoelectric ceramic sphere connected to a 35 dB preamplifier which incorporates a 2
kHz low cut filter to reduce lower frequency background noise. The nominal bandwidth
of the element and preamplifier is 2 – 150 kHz. Signals from the hydrophone pairs were
conditioned and further amplified using a Magrec HP27ST amplifier filter box. Signals to
be used for porpoise detection passed through a 20 kHz high-pass filter before being
sampled by a National Instruments USB-6251 high speed digital acquisition card
controlled by an Asus Boxer 12v computer. The maximum sampling rate of the NI 6251
is 1.2 mHz. For survey, two channels were each digitised at 500 kHz, providing a
sampled acoustic bandwidth of 250 kHz. The accuracy of depth measures with the
vertical array were confirmed using an artificial ‘porpoise’ sound source.
3.2.20 Data were processed onboard in real time using the IFAW “Rainbow Click” click
detection and classification program with detectors optimised for harbour porpoise to
provide real time information on acoustic detections (Gillespie et al. In review). Although
porpoise detections were often seen on the program’s display in real time, this
information was never relayed to visual observers. Rainbow Click files were analysed
every few days to provide preliminary quick look information on porpoise detections.
3.2.21 In addition, full bandwidth digitised data were recorded continuously. These data were
reanalysed carefully after the survey by a single researcher (SC) to provide a consistent
high quality dataset of detections and estimated ranges from the track line. The
recordings were also processed to provide a measure of the acoustic energy every
second in the frequency band processed by the click detector in Rainbow Click. The
filter exactly matched that used by Rainbow Click with a passband of 110-150 kHz and a
decaying average time constant of 0.2 seconds. This provided a measure of background
noise that was most likely to directly affect the program’s ability to detect porpoise clicks.
3.2.22 These full bandwidth recordings also provide information on spatial and temporal
patterns of high frequency (>20 kHz) noise fields in the area. Medium frequency acoustic
signals (2-22 kHz) were also recorded continuously through an Edirol sound card with a
48 kHz sampling rate2.
2 Analysis of these recordings could be very useful in predicting how the background noise could affect the ability of
animals to detect tidal turbines either passively, by detecting the noise the turbines themselves or actively, using
echolocation.

Studies of Marine Mammals in Welsh High Tidal Waters
Modelling of spatial and temporal distribution patterns of harbour porpoise
3.2.23 An investigation of the factors that affect porpoise abundance within an area requires an
absolute or relative index of density across a representative range of values for potential
spatial and temporal covariates. The simplest models utilise data from directly
comparable designed surveys, but more complex models could integrate from different
survey types alongside other information from static sources such as TPODs. For the
initial modelling, the acoustic survey data provided the largest and most consistent data
set. Acoustic data provided locations of porpoise groups that were detected but
interpreting group size was problematic. Therefore, for this analysis the group size was
taken from the visual data.
3.2.24 Acoustic data within the two designed survey blocks (Carmel Head/Skerries and
Bishops and Clerks) were divided into 250 m segments of track line and an average
value for each covariate was derived for each segment. Porpoise presence was
modelled as binary data with either porpoises detected or not.
3.2.25 For each segment i, the probability that a group of porpoises will be present was
modelled as a Logit link function:
ii i
i
eep αϕ
ϕ
++
=1
3.2.26 Where αi is an error term and φi is a linear function of environmental covariates:
...)()( 2211 ++= iii xfxfϕ
3.2.27 With each fj a smooth function of environmental covariate xj. Terms involving more than
one environmental covariate may also be included e.g. the smooth function may be
expressed in terms of an interaction between covariates xn and xm as fk (xn;xm).
3.2.28 Models were fitted using the mgcv library within R (Wood, 2006). Model selection was
based on minimising the Un-biased Risk Estimator (UBRE) value for the model. This is
equivalent to the Akaike Information Criteria re-scaled to the known scale parameter of 1
used in a binary model (Wood, 2006). We were not able to conduct an exhaustive set of
all possible models as done by Isojunno (2008). Instead we used combinations of
covariates where there was some prior reason to expect an effect. However, inevitably
some slightly arbitrary choices were made and there would be further scope for
additional model development. Thin plate smoothing splines were used in all cases
JER3688 Welsh Assembly Government Planning & Development 28th March 2011
20

Studies of Marine Mammals in Welsh High Tidal Waters
based on the properties described in Wood (2006) with the smoothing parameter λ fixed
at 1.4. Noise level measurements which are known to affect acoustic detection rates
were included in all models.
3.2.29 A specific interest for this study was the relationship between porpoise distribution and
covariates related to state of the tide and tidal flow. Thus these covariates were included
in exploratory models.
3.2.30 A variety of data from a range of sources (see Table 3-1) were collated using Manifold
GIS and Microsoft Access for potential use as covariates. The models that seemed most
informative in terms of being able to explain spatial and temporal variation in density
were used to make predictions of densities for the two study areas for particular times in
the tidal cycle and these were plotted as surfaces using Manifold.
Table 3-1 Summary of covariates used in the modelling process
Value Units Source
Location Latitude Longitude GPS
Noise Relative Sound Pressure Level dB Analysis of recordings
Tidal time Relative position in daily tidal cycle Calculations based on
Belfield Tide Plotter
Tidal Range Tidal range in m of current tide Calculations based on
Belfield Tide Plotter
Tidal Cycle Relative position in the lunar tidal
cycle
Calculations based on
Belfield Tide Plotter
Predicted Tidal Current
Speed and direction
Speed m.s-1
Direction N/S and E/W vectors
Polpred software. Proudman
Laboratory
Predicted Maximum Spring Flood
and Spring Ebb Currents
(Skerries Only)
Fine scale prediction of current
speed m.s-1 for Skerries region only
GIS processing of image provided
by Marine Current Turbines ltd
Bathymetry Depth m Gridded data on (1/10th minute)
resolution. SeaZone Hydrosptial
dataset
Bathymetry Aspect degrees Derived from bathymetry using GIS
Bathymetry Slope degrees Derived from bathymetry using GIS
JER3688 Welsh Assembly Government Planning & Development 28th March 2011
21
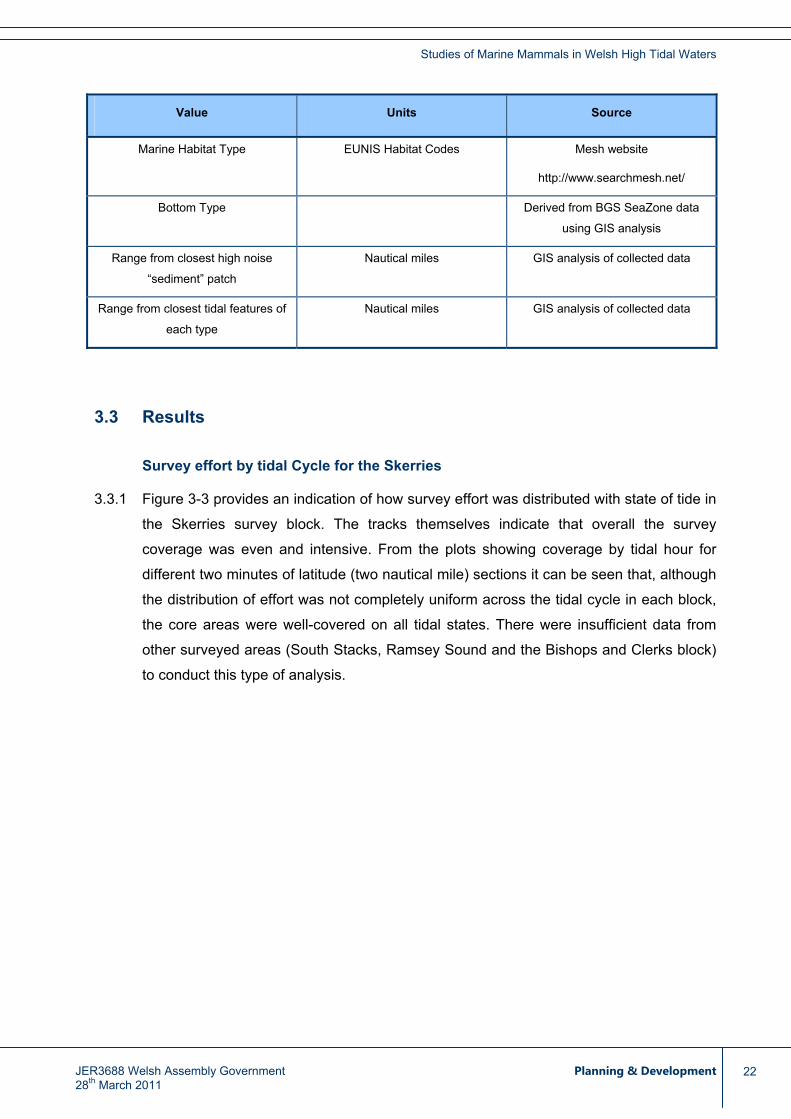
Studies of Marine Mammals in Welsh High Tidal Waters
JER3688 Welsh Assembly Government Planning & Development 28th March 2011
22
Value Units Source
Marine Habitat Type EUNIS Habitat Codes Mesh website
http://www.searchmesh.net/
Bottom Type Derived from BGS SeaZone data
using GIS analysis
Range from closest high noise
“sediment” patch
Nautical miles GIS analysis of collected data
Range from closest tidal features of
each type
Nautical miles GIS analysis of collected data
3.3 Results
Survey effort by tidal Cycle for the Skerries
3.3.1 Figure 3-3 provides an indication of how survey effort was distributed with state of tide in
the Skerries survey block. The tracks themselves indicate that overall the survey
coverage was even and intensive. From the plots showing coverage by tidal hour for
different two minutes of latitude (two nautical mile) sections it can be seen that, although
the distribution of effort was not completely uniform across the tidal cycle in each block,
the core areas were well-covered on all tidal states. There were insufficient data from
other surveyed areas (South Stacks, Ramsey Sound and the Bishops and Clerks block)
to conduct this type of analysis.
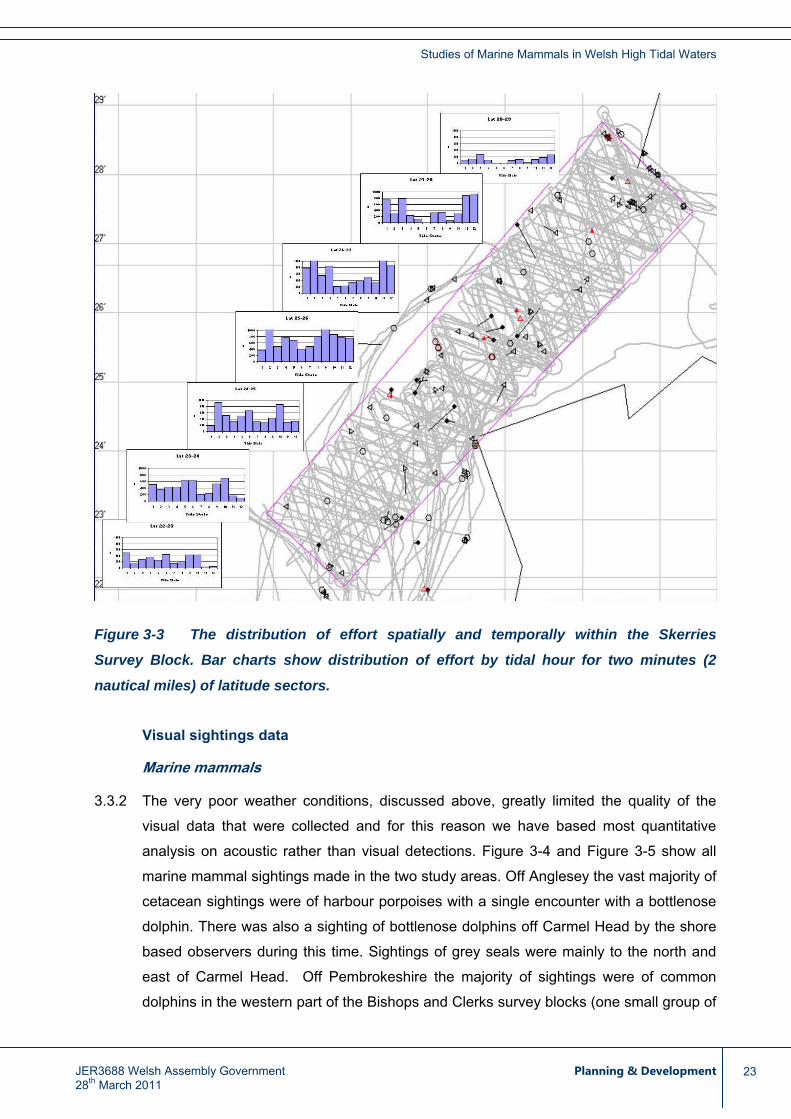
Studies of Marine Mammals in Welsh High Tidal Waters
Figure 3-3 The distribution of effort spatially and temporally within the Skerries
Survey Block. Bar charts show distribution of effort by tidal hour for two minutes (2
nautical miles) of latitude sectors.
Visual sightings data
Marine mammals
3.3.2 The very poor weather conditions, discussed above, greatly limited the quality of the
visual data that were collected and for this reason we have based most quantitative
analysis on acoustic rather than visual detections. Figure 3-4 and Figure 3-5 show all
marine mammal sightings made in the two study areas. Off Anglesey the vast majority of
cetacean sightings were of harbour porpoises with a single encounter with a bottlenose
dolphin. There was also a sighting of bottlenose dolphins off Carmel Head by the shore
based observers during this time. Sightings of grey seals were mainly to the north and
east of Carmel Head. Off Pembrokeshire the majority of sightings were of common
dolphins in the western part of the Bishops and Clerks survey blocks (one small group of
JER3688 Welsh Assembly Government Planning & Development 28th March 2011
23

Studies of Marine Mammals in Welsh High Tidal Waters
common dolphins was also observed passing through Ramsey Sound while the survey
vessel was at anchor). Grey seals were sighted in the eastern part of the Bishops and
Clerks study area.
Figure 3-4 Distribution of all marine mammal species made off Anglesey during the
summer of 2009. All survey tracks are shown- Green designed effort, pink non designed
effort.
JER3688 Welsh Assembly Government Planning & Development 28th March 2011
24
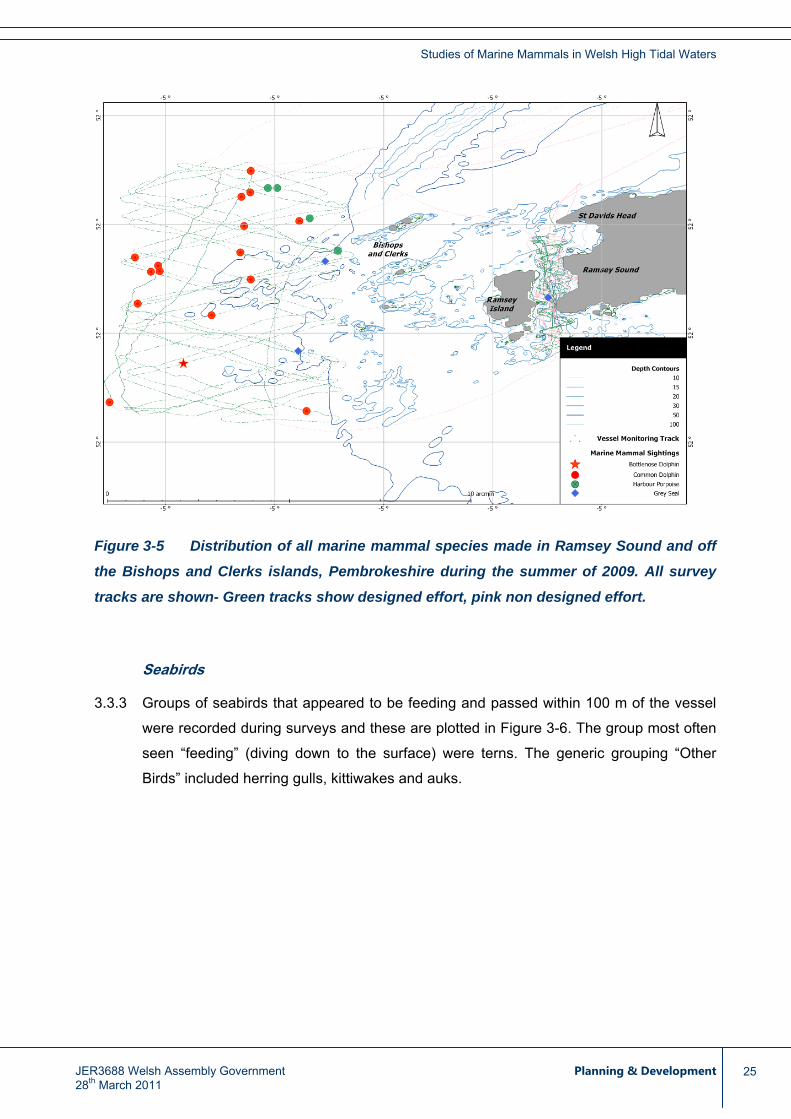
Studies of Marine Mammals in Welsh High Tidal Waters
Figure 3-5 Distribution of all marine mammal species made in Ramsey Sound and off
the Bishops and Clerks islands, Pembrokeshire during the summer of 2009. All survey
tracks are shown- Green tracks show designed effort, pink non designed effort.
Seabirds
3.3.3 Groups of seabirds that appeared to be feeding and passed within 100 m of the vessel
were recorded during surveys and these are plotted in Figure 3-6. The group most often
seen “feeding” (diving down to the surface) were terns. The generic grouping “Other
Birds” included herring gulls, kittiwakes and auks.
JER3688 Welsh Assembly Government Planning & Development 28th March 2011
25

Studies of Marine Mammals in Welsh High Tidal Waters
Figure 3-6 Locations at which groups of feeding seabirds were noted within 100 m of
the track line off Anglesey in summer 2009.
Porpoise group size from visual observations
3.3.4 Porpoise group size is difficult to determine acoustically. We have used visual data to
estimate this and these data are summarised in Table 3-2.
3.3.5 Although the mean group size for the Ramsey area was higher, this was largely as a
result of a single observation of six individuals. The differences were not significant
between areas of between Primary and Tracker observations (ANOVA, df=88, f=2.8,
p=0.07). Therefore all data were combined to give a mean group size of 1.51 (SD 0.85).
JER3688 Welsh Assembly Government Planning & Development 28th March 2011
26

Studies of Marine Mammals in Welsh High Tidal Waters
JER3688 Welsh Assembly Government Planning & Development 28th March 2011
27
Table 3-2 Porpoise group sizes estimated by Primary and Tracker observers from the
Skerries/Carmel Head and Bishops and Clerks surveys sites (number of groups, mean
group size and SD – standard deviation)3.
Primary Tracker
Number
of groups
Mean
Group
Size
SD Max Number
of groups
Mean
Group
Size
SD Max
Carmel Head
Skerries, off
Anglesey
48 1.38 0.61 3 33 1.55 0.83 4
Bishops and
Clerks, off
Pembrokeshire
8 2.13 1.73 6 0 n/a n/a n/a
Acoustic monitoring
3.3.6 Acoustic survey effort completed in the two study sites is summaries in Table 3-3.
3 See Section 3.2.12 for definition of primary and tracker observers.

Studies of Marine Mammals in Welsh High Tidal Waters
JER3688 Welsh Assembly Government Planning & Development 28th March 2011
28
Table 3-3 Summary of acoustic monitoring effort and marine mammal detections in
the Skerries/Carmel Head and Bishops and Clerks surveys sites4.
Designed
survey
completed
(nm)
Single
Tracks
Porpoise
Encounter
Multiple
Tracks
Porpoise
Encounter
Events
Porpoise
Encounter
On Axis
Porpoise
Encounter
Click
Porpoise
Encounter
Dolphin
Acoustic
Encounter
Carmel Head
Skerries, off
Anglesey
607 30 27 1 14
Bishops and
Clerks, off
Pembrokeshire
232 37 1 36 13 6
Background noise
3.3.7 Distinct areas with very high levels of background noise were noted during the acoustic
surveys. These were apparent as dense concentrations of ""unidentified clicks" in the
Rainbow Click analysis program and usually these could be seen to be localised and
discreet. Typically they were shown with clear acoustic bearings which could be tracked
from bearings ahead of the vessel to bearings astern as the vessel moved by them. Our
assumption was that these noise events were due to sediment moving in the tidal flow,
possibly from gravel beds. The location of all such “sediment noise” events identified
during offline acoustic analysis for harbour porpoise (see Acoustic Detections) are
shown in Figure 3-7. Often the locations of these events were consistent between
different surveys and in some case they seem to be grouped into bands running along
the axis of the current (as might be expected if they were indeed associated with
particular sediment beds). Sedimentologists have used passive acoustic monitoring to
measure movement of marine sediments in currents. Levels of noise correlate with
sediment transport weights, while spectral analysis of signals can provide information on
the size of particles in the moving sediment (Mason et al., 2007; Thorne, 1985; Thorne,
1986; Voulgaris et al., 1995).
4 See Section 3.3.9 for explanation of different porpoise acoustic encounter types.

Studies of Marine Mammals in Welsh High Tidal Waters
3.3.8 Figure 3-8 is a plot of noise against predicted tidal current. A sharp increase in noise
levels is evident as current increases from 1 to 2 m.s-1 this could be indicative of the
current speeds at which substantial amount of sediment starts to move. Its likely that
sediments of different sizes will become mobile at different current speeds. The fall in
noise at current speeds over 2.5 m s-1 is surprising. This may be a sampling effect in
that there are relatively few records at these high current speeds, note too the very high
confidence internals. It will also be the case that these high currents are only
experienced in a subset of spatial locations, and these may be less likely to have
sediment beds, perhaps because they have been "swept clean".
Figure 3-7 Location of areas of high noise when currents were running – thought to be
due to moving sediment.
JER3688 Welsh Assembly Government Planning & Development 28th March 2011
29

Studies of Marine Mammals in Welsh High Tidal Waters
0.0 0.5 1.0 1.5 2.0 2.5 3.0
-20
24
Predicted current speed
Rel
ativ
e no
ise
leve
l
Figure 3-8 Plot of noise against current speed. The drop in noise level at higher
current speeds may be sampling artefacts due to lower number of samples for these
faster currents and/or the fact that such high currents were only encountered in a subset
of areas, which may have been "swept clean" of sediments.
Acoustic detections
3.3.9 Analysis of the full bandwidth recordings that were made continuously during surveys
resulted in the porpoise detections summarised in Table 3-3. Several different types of
acoustic encounter were identified, following the methods outlined in Gillespie et al., (in
review, b).
3.3.10 "Single tracks" were encounters consisting of a single distinct track of clicks on
bearings altering regularly from ahead to astern. "Multiple Tracks" were similar but
involved more than one distinct track. “Events” were instances which involved many
click detections which were not on distinct tracks. "On axis porpoise acoustic events"
were similar to “Events” but the bearings were all at 90 degrees. "Clicks" were single
strong clicks that had the spectral and temporal characteristics of porpoise clicks but
occurred on their own. Locations of porpoise acoustic encounters in the two study sites
are shown in Figure 3-9 and Figure 3-10.
JER3688 Welsh Assembly Government Planning & Development 28th March 2011
30

Studies of Marine Mammals in Welsh High Tidal Waters
Figure 3-9 Locations of all porpoise acoustic encounters in the study area; Carmel
Head and South Stacks, off Anglesey. See text for description of event types. Survey
tracks are shown- green is designed survey, pink is non-designed survey.
Figure 3-10 Locations of all porpoise acoustic encounters in the study area; Bishops
and Clerks, off Pembrokeshire. See text for description of event types. Survey tracks are
shown- green is designed survey, pink is non-designed survey.
JER3688 Welsh Assembly Government Planning & Development 28th March 2011
31

Studies of Marine Mammals in Welsh High Tidal Waters
Acoustic detection function
3.3.11 In the case of single and multiple track encounters it is possible to fit a function to the
pattern of click bearings as the vessel passes the vocalising animals to come up with the
animal’s most likely location in respect to the track line and to calculate a perpendicular
distance (Gillespie et al,. In Review). A complication in this case was that, because of
the strong currents, the vessel’s track over ground was not necessarily a good indicator
of the orientation of the hydrophone. In this case we used the vessel’s true heading, as
provided by a vector GPS module on the vessel, one hydrophone length earlier, to
provide the hydrophone’s actual orientation at the time of each detection. We used the
Distance program (Version 6.0) (Thomas et al., 2010) to calculate an acoustic detection
function using perpendicular distances from 88 good quality single track encounters.
These data and the best fitting model are shown in Figure 3-11. A half normal model
with 2 cosine parameters gave the best fit (Akaike information criterion = 1035). This
indicated an effective strip half-width of 186 m with 95% CI between 157-222 m. (The
effective strip half-width is the distance either side of the trackline at which as many
animals are detected further away than are estimated to be missed closer to the
trackline).
0.0
0.1
0.2
0.3
0.4
0.5
0.6
0.7
0.8
0.9
1.0
0 100 200 300 400 500 600 700 800 900 1000
Perpendicular distance in meters
Figure 3-11 Plot of perpendicular distance from the trackline for 88 good quality
tracked acoustic detections. The best fitting model, shown in red, was a half normal
model with 2 cosine parameters. Akaike information criterion = 1035. Effective strip width
186 m 95% CI 157-22 2m.
JER3688 Welsh Assembly Government Planning & Development 28th March 2011
32

Studies of Marine Mammals in Welsh High Tidal Waters
3.3.12 To investigate the percentage of animals that were detected acoustically we calculated
the time at which all porpoise sighted during surveys would be expected to come abeam
of the hydrophone, based on the tow length of the hydrophone, the distance ahead of
the vessel that the animals were seen and the vessel speed. On 33 occasions,
porpoises were seen during surveys at a perpendicular distance from the trackline of
less than the effective strip width (186 m). There was an acoustic detection within 200
seconds of the calculated passing time on 34.4% of these occasions. The expectation
from the acoustic detection function (Figure 3-11) is that 50% of all potential detections
within the effective strip width would be made. The difference between this value and the
34.4% of visual detections linked to an acoustic detection could be taken as a measure
of the proportion of available animals that were detected acoustically. Thus, based on
this rather ad hoc calculation, our expectation for g(0), the proportion of animals on the
trackline that were detected acoustically is 0.68.
Models of temporal and spatial covariates
3.3.13 Within the two survey boxes (Carmel Head and South Stack, the Skerries, off Anglesey
and Bishops and Clerks, off Pembrokeshire) surveys were carried out along pre-
determined transects designed to achieve even coverage probability. Only data
collected on these zig-zag tracks were used for the models. However, some examination
of the full dataset including passages through the study areas was thought to be
informative, particularly with respect to the relationship between detection rates and
noise levels on the hydrophone. Figure 3-12 shows the overall relationship between
detection rates and noise. As is expected, detection rate decreases with increasing
noise levels. The slight dip at low noise levels can be explained by very few data (and no
detections) at these values.
JER3688 Welsh Assembly Government Planning & Development 28th March 2011
33

Studies of Marine Mammals in Welsh High Tidal Waters
-90 -80 -70 -60 -50 -40 -30 -20
-5-4
-3-2
-10
Noise level dB
Por
pois
e de
tect
ion
rate
Figure 3-12 Relative detection rate with received noise level at the hydrophone in
porpoise click frequency band for all data combined.
Measured noise levels
3.3.14 Noise levels will affect the performance of the porpoise detection programs used here
(PAMGUARD and Rainbow Click). By making noise measurements using spectral and
temporal filters that exactly matched those used in the triggering routines in the program
we have endeavoured to make acoustic measurements of noise which should most
closely correlate with detection probability (in this case this is of course all the noise on
the recordings, this will include background environmental noise, vessel noise, flow
noise and any electrical noise).
3.3.15 Much of the noise received at the hydrophone will be due to flow noise and engine noise
from the survey vessel. However, other noise sources were noted, particularly what
sounded like movement of gravel on the seabed (see Section 3.3.7). Exploratory
models to investigate the relationship between received noise and environmental factors
showed that depth, current speed, slope and distance from places where high gravel
noise had been observed were all significant factors. The best model fit was obtained
with an interaction between distance to sediment noise patches (for which geographical
locations are shown in Figure 3-7) and current flow and between depth and slope
(Figure 3-13 and Figure 3-14). Overall, noise increased sharply when current flow
JER3688 Welsh Assembly Government Planning & Development 28th March 2011
34

Studies of Marine Mammals in Welsh High Tidal Waters
JER3688 Welsh Assembly Government Planning & Development 28th March 2011
35
reached about 1m.s-1 (Figure 2-15), but particularly when close to assumed gravel
patches. The depth and slope effect shows noise increasing with steeper slopes. This
may be related to more biological activity with complex bottom types, the reflection of
noise from the research vessel or the prevalence of moving sediments at different
locations.
-5
0
0
0
5 5 10 15
20 25
40
te( AvgOfT ide Cu rrent PP,AvgOfGravelRan ge,20 .84)
0.0 0.5 1.0 1 .5 2 .0 2.5 3.0
0.0
0.1
0.2
0.3
0.4
-5
0
0
0
5 5 10
15
20 25
30
-1se
- 10 -5
0
0
5 5
10 15
20 30
+ 1se
P red icted current speed
Dis
tanc
e to
clo
sest
obs
erve
d gr
avel
are
a
Figure 3-13 Contour plot of noise levels as a function of predicted current speed and
distance to the closest observed gravel patches. Black lines show average levels, green
and red are plus and minus one standard error respectively.

Studies of Marine Mammals in Welsh High Tidal Waters
JER3688 Welsh Assembly Government Planning & Development 28th March 2011
36
0
2
4
6
8
10
te(A vgOfDepth,Av gOfSlop e,10.19 )
-80 -60 -40 -20 0
02
46
8
0
2
4
4
6
8
8
10
10
12
14
-1s e
-2 0
2
4
6
8
+1s e
Depth (m)
Slo
pe (d
egre
es)
Figure 3-14 Contour plot of relative noise levels as a function of depth and slope.
Blacks lines show average levels, green and red are plus and minus one standard error
respectively.
0.0 0.5 1.0 1.5 2.0 2.5 3.0
-20
24
Predicted current speed
Rel
ativ
e no
ise
leve
l
Figure 3-15 Relative noise levels as a function of predicted current speed and distance
to closest observed gravel patch.

Studies of Marine Mammals in Welsh High Tidal Waters
Depth
3.3.16 Previous studies off west Wales (Isojunno, 2008) have found a relationship between
porpoise density and bathymetry with a linear decline from 50 m to 10 m. In our data, the
overall relationship with depth is consistent with this but suggests a peak in density at
water depth of around 70 m (Figure 3-16). Goodwin and Speedie (2008) found a peak in
porpoise distribution in waters of around 100 m depth for areas along the west coast of
the UK from the southwest to Scotland including some data from the coast of Wales.
However, their survey effort generally extended further offshore than in this study.
-80 -6 0 -40 -20 0
-4-3
-2-1
01
2
Depth (m)
Por
poi
se d
etec
tion
rate
Figure 3-16 Relative detection rate with depth. All data combined.
Bishops and Clerks offshore survey block, off Pembrokshire
3.3.17 The best fit GAM (generalised additive model) involved noise, time of day, depth,
distance from all tidal features and an interaction between latitude and tidal height.
However, the best fit model only explained 12.7% of the deviance and so none of the
observed effects would be considered to have high explanatory power. No significant
relationships were found between porpoise distribution and covariates related to current
velocity.
3.3.18 In this model, noise affected detection rates as would be expected from the analysis of
all data combined over the range of noise values recorded. Time of day was a significant
JER3688 Welsh Assembly Government Planning & Development 28th March 2011
37

Studies of Marine Mammals in Welsh High Tidal Waters
JER3688 Welsh Assembly Government Planning & Development 28th March 2011
38
effect with detection rates dropping through the day; localised diurnal patterns in
movements would not be surprising. The relationship with depth shows lower detection
rates in deeper water (greater than 70 m) but otherwise little effect.
3.3.19 Tidal height was a significant term when interacting with latitude (Figure 3-17).
-0.5
0
0
0 0
0.5 1
t e( Av gO f Tid alH e igh t, Av gO f La t itu de ,3 .5 3)
1 2 3 4 5
51
.80
51
.85
51
.90
51
.95
-0.5
0
0
0.5
0.5
1
1
1.5
-1 se
-1
-0.5
0
0.5
0.5 1
+1 se
Tidal Height (m)
Latit
ude
Figure 3-17 Interaction between Latitude and Tidal Height for best fit model for Bishops
and Clerks. Highest detection rates were in the north of the block with high tidal heights.
Detection rates decreased towards the south with the lowest in the south at half tide.
Black lines show average levels, green and red are plus and minus one standard error
respectively.
3.3.20 Longitude was not a significant factor but some spatial information is also captured in
the distance from observed tidal features (Figure 3-18). Detection rates decreased with
distance from tidal features with areas of tidal features towards the northeast of the
survey block.

Studies of Marine Mammals in Welsh High Tidal Waters
JER3688 Welsh Assembly Government Planning & Development 28th March 2011
39
-01 0.
-0.01
-00. 1
-0.01
-0.005
-0.005
-0.005
-0.005
0
0
0
0.005
0.005
0.01
0.015
0. 015
0.02
0.02
0.025
0.025 0.03 0.035
0.04 0.045
s(AvgOf Long itude, Av gOf Latit ude ,28.86)
-5. 52 -5. 50 -5 .48 -5. 46 -5.44 -5.42 -5. 40
51.80
51.85
51.90
51.95
-0.01
-00. 1
-0.01
-0.005
-0.005
-0.005
-0.005
0
0
0.005
0.005
0.01
0.015
0.015
0.02
0.02
0.025
0.025 0.03 0 03. 5
0.04
-1se
-0.01
-0.01
-0.01
-0.01
-0.005
-0.005
-0.005
-0.005
0
0 0
0.005
0.005
0.01
0.015
0.015
0.02
0.02
0.025
0.025 0.03 0.035
0.04 0.045
+1se
Longitude
Latitu
de
Figure 3-18 Contour plot of distances to all tidal features as used in the best fit model
in Bishops and Clerks study area. Black lines show average levels, green and red are
plus and minus one standard error respectively.
3.3.21 Predicted surfaces based on the best fit model for three tidal heights, means high water
springs (HMWS), mean sea level (MSL) and mean low water springs (MLWS), are
shown in Figure 3-19, Figure 3-20 and Figure 3-21 respectively. There is a slight
tendency for densities to be further north at MHWS and to the south at MLWS. However,
we would caution against over interpretation of these data.
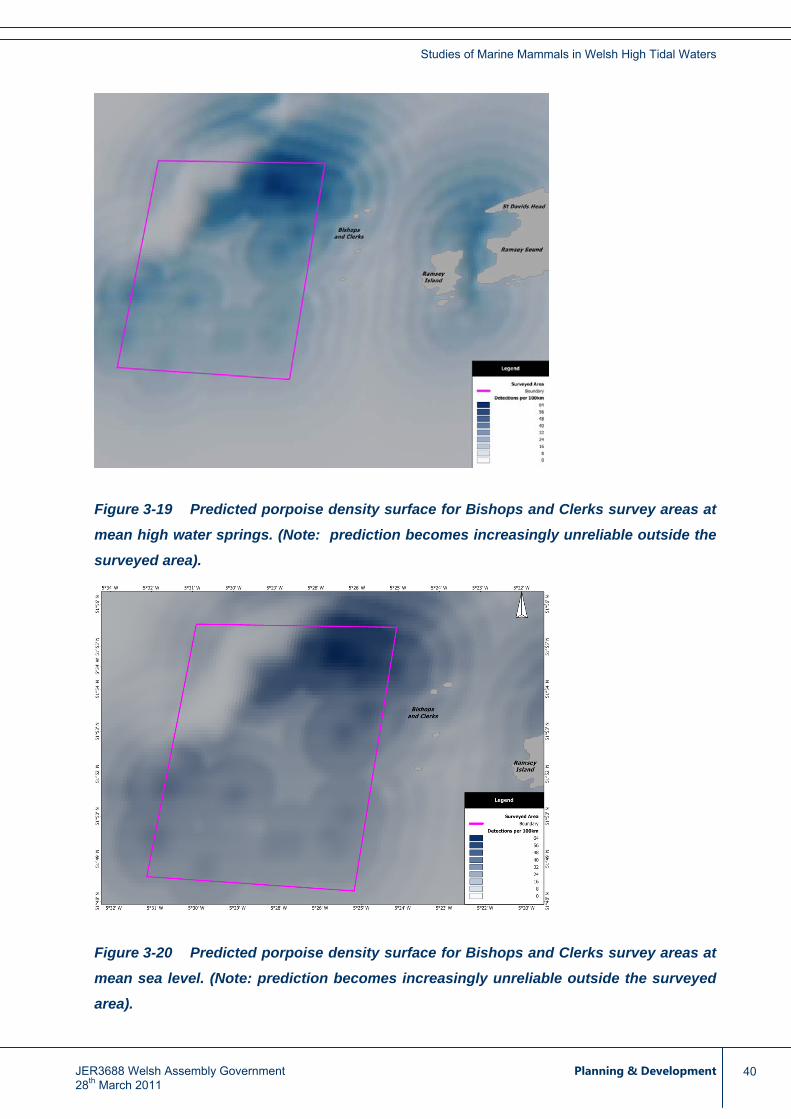
Studies of Marine Mammals in Welsh High Tidal Waters
Figure 3-19 Predicted porpoise density surface for Bishops and Clerks survey areas at
mean high water springs. (Note: prediction becomes increasingly unreliable outside the
surveyed area).
Figure 3-20 Predicted porpoise density surface for Bishops and Clerks survey areas at
mean sea level. (Note: prediction becomes increasingly unreliable outside the surveyed
area).
JER3688 Welsh Assembly Government Planning & Development 28th March 2011
40
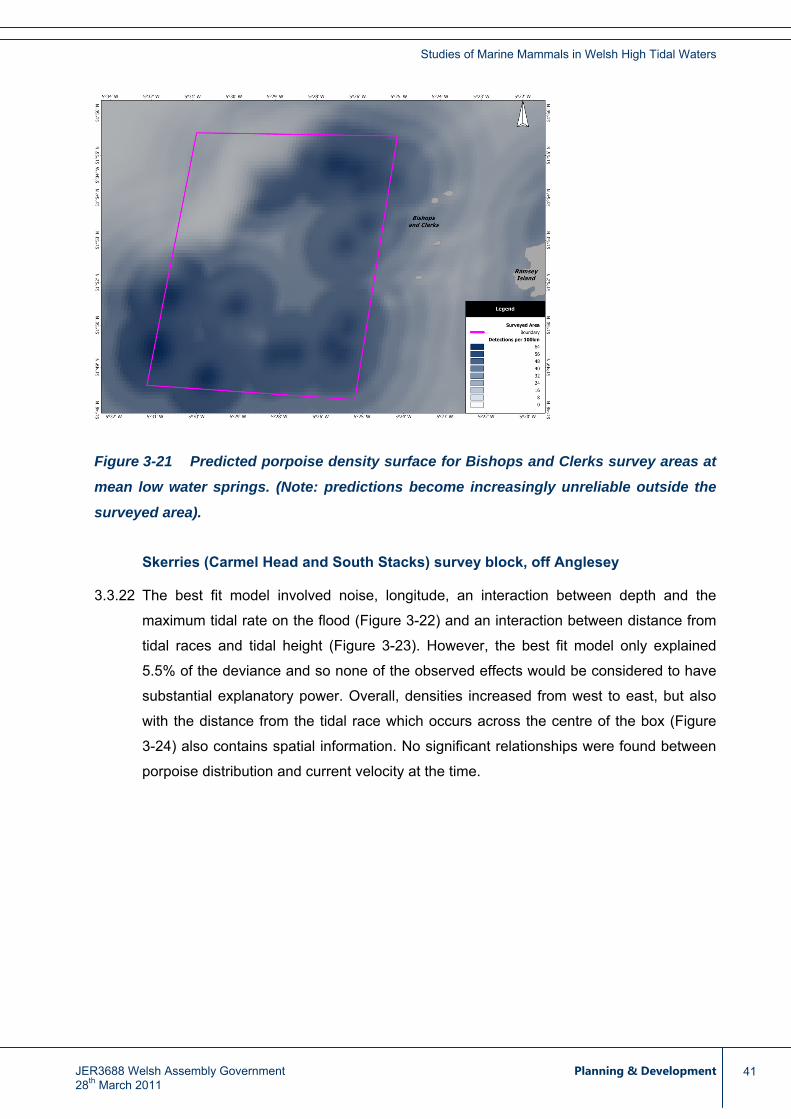
Studies of Marine Mammals in Welsh High Tidal Waters
Figure 3-21 Predicted porpoise density surface for Bishops and Clerks survey areas at
mean low water springs. (Note: predictions become increasingly unreliable outside the
surveyed area).
Skerries (Carmel Head and South Stacks) survey block, off Anglesey
3.3.22 The best fit model involved noise, longitude, an interaction between depth and the
maximum tidal rate on the flood (Figure 3-22) and an interaction between distance from
tidal races and tidal height (Figure 3-23). However, the best fit model only explained
5.5% of the deviance and so none of the observed effects would be considered to have
substantial explanatory power. Overall, densities increased from west to east, but also
with the distance from the tidal race which occurs across the centre of the box (Figure
3-24) also contains spatial information. No significant relationships were found between
porpoise distribution and current velocity at the time.
JER3688 Welsh Assembly Government Planning & Development 28th March 2011
41

Studies of Marine Mammals in Welsh High Tidal Waters
JER3688 Welsh Assembly Government Planning & Development 28th March 2011
42
-3 -2.5
-2
-2
-1.5
-1
-0.5 0
0.5
te( Avg O fDep th,MaxO fM axSp rin g Fl ood,1 .78)
-5 0 - 40 -3 0 -2 0 -1 0
0.5
1.0
1.5
2.0
2.5
-2
-1.5 -1.5
-1
-0.5
0
0.5
-1 se
-3.5
-3
-2.5
-2.5
-2
-1.5
-1
-0.5
0
0.5
+1 se
Depth (m)
Pre
dict
ed m
axim
um fl
ood
curr
ent f
low
Figure 3-22 Contour plot of detection rates in relation to depth and maximum predicted
current flow on the flood tide in the Skerries (off Anglesey) survey area. Detection rates
were lowest in shallow, low energy areas and increased with depth and maximum current
flow.
0
0
te (Av gO f TFRA,Av g Of Tida lHeig ht ,2. 22 )
0.0 0 0 .01 0.0 2 0.0 3 0. 04 0. 05 0.0 6
12
34
5
0
0
0.5
0.5
- 1se
-0.5
0
0
0
+ 1se
D ista nce from ob se rve d tidal race
Tida
l hei
ght (
m)
Figure 3-23 Contour plot of detection rates in relation to distance from observed tidal
races and tidal height. Although a significant term in the best fit model, the plot is fairly
flat but with higher detection rates at low tidal heights close to tidal races or at high tidal
heights furthest away.

Studies of Marine Mammals in Welsh High Tidal Waters
JER3688 Welsh Assembly Government Planning & Development 28th March 2011
43
-0.005
-0.005
-0.005
0
0
0 0
.005
0.005
0 005 .
0.0
1
0.01
0.01
0.0
15
0.0
15
. 0 015 0.02
0.025 0.03 0.035
0.05
s(Av gOf Longitude,Av gOf Latitude,28.84)
-4.65 -4.60 -4.55 -4.50
53.3
653
.38
53.4
053
.42
53.4
453
.46
53.4
8
-0.005
-0. 05 0
-0.005
0
0 0
0.0
5
0.005
0 05.0
0.0
1
0.01
0.01
0.015
0150. 0.02
0
.025 0.03 .035
0 0.04
0.05
-1se
-0.005
-0.005
0
0
0 0
.005
0.005
0 005 .
0.0
1
0.01
0.01
0.0
15
0.015
. 0 015 0.02
0.025 0.03 0.035 0.04 0.05
+1se
Figure 3-24 Distance from observed tidal race as a function of Latitude and Longitude.
The tidal race occurs across the centre of the box running approximately NW-SE,
perpendicular to the main current flow.
3.3.23 Predicted surfaces based on the best fit for three tidal heights, means high water springs
(HMWS), mean sea level (MSL) and mean low water springs (MLWS), are shown in
Figure 3-25, Figure 3-26 and Figure 3-27 respectively. Generally, densities appear
higher in the region of the strongest currents, between Carmel Head and the Skerries.
Very little variability in spatial distribution is evident with tidal height. Again, we would
caution against over interpretation of these data.

Studies of Marine Mammals in Welsh High Tidal Waters
Figure 3-25 Predicted porpoise density surface for Carmel Head/Skerries (off Anglesey)
survey areas at mean high water springs. (Note: prediction becomes increasingly
unreliable outside the surveyed area).
Figure 3-26 Predicted porpoise density surface for Carmel Head/Skerries (off Anglesey)
survey areas at mean sea level. (Note: prediction becomes increasingly unreliable
outside the surveyed area).
JER3688 Welsh Assembly Government Planning & Development 28th March 2011
44

Studies of Marine Mammals in Welsh High Tidal Waters
Figure 3-27 Predicted porpoise density surface for Carmel Head/Skerries (off Anglesey)
survey areas at mean low water springs. (Note: prediction becomes increasingly
unreliable outside the surveyed area).
3.4 Discussion
3.4.1 The very poor weather conditions that prevailed throughout the survey period greatly
reduced the quality of the visual data collected. However, sightings have provided some
useful information on marine mammal species other than harbour porpoises, in
particular showing substantial numbers of common dolphins in the western section of
the Bishops and Clerks study area and also on the distributions of grey seals in the
Skerries region. In addition, data were collected showing the distribution of feeding
seabirds in the Skerries region. For porpoises, visual data have provided valuable
information on group size and an indication of the approximate proportion of available
animals detected acoustically.
3.4.2 Quantitative analysis of porpoise distributions and densities has relied on the passive
acoustic data collected using towed hydrophone systems.
3.4.3 It has been widely suggested that high tidal current areas are preferred habitat for
harbour porpoises. However, as far as we are aware, no quantitative assessments of
densities have been made within these areas to allow comparison with other areas. In
no small part this is because these are very difficult environments in which to conduct
surveys, especially during periods when tidal streams are running at their highest rates.
In Table 3-4 we compare detection rates and densities measured in this study with those
JER3688 Welsh Assembly Government Planning & Development 28th March 2011
45

Studies of Marine Mammals in Welsh High Tidal Waters
JER3688 Welsh Assembly Government Planning & Development 28th March 2011
46
reported in other areas by other authors. We make two comparisons, between raw
acoustic detection rates per 100 km from different areas, and for an assessment of
density (uncorrected for g(0)5) based on acoustic detection rates, the observed group
size of 1.5 and an effective strip width (eshw) of 186 m and densities derived using
visual methods in other areas.
Table 3-4 comparison between detection rates and estimated densities measured
from the two study areas during this study and those reported from other areas.
Detection rate and density comparison
Site/Area N
(number of
detections)
Effort
(km
trackline)
n/100 km
(detections
per km)
Density
(assuming group
size =1.5,
esw=186 m)
Survey
type
Source
Bishops and Clerks, off
Pembrokeshire
82 232 35.3 1.43 Acoustic This study
The Skerries (Carmel
Head and South Stacks),
off Anglesey
57 607 9.4 0.38 Acoustic This study
Kiel Bight 52 494 10.5 Acoustic Gillespie et al., 2005
Little Belt 49 291 16.8 Acoustic Gillespie et al., 2005
Southern North Sea
2001
81 1267 6.4 Acoustic Gillespie et al., 2003
Southern North Sea
2002
9 598 1.5 Acoustic Gillespie et al., 2003
English Channel 2001 9 433 2.1 Acoustic Gillespie et al., 2003
SCANSII - Irish Sea 0.34 Aerial Hammond and
Macleod, 2006.
5 g(0) is the probability of detecting an animal on track line during the survey. If all animals were detected then g(0)
would be 1. If half the animals were missing then g(0) would be 0.5
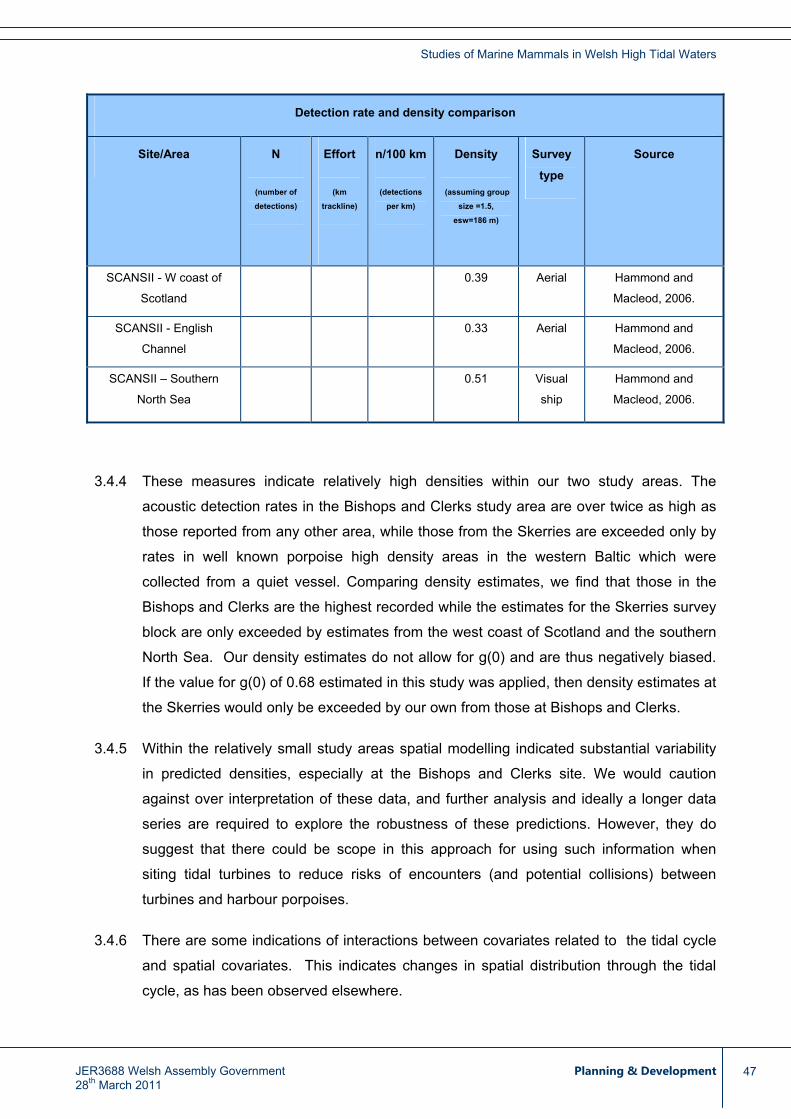
Studies of Marine Mammals in Welsh High Tidal Waters
JER3688 Welsh Assembly Government Planning & Development 28th March 2011
47
Detection rate and density comparison
Site/Area N
(number of
detections)
Effort
(km
trackline)
n/100 km
(detections
per km)
Density
(assuming group
size =1.5,
esw=186 m)
Survey
type
Source
SCANSII - W coast of
Scotland
0.39 Aerial Hammond and
Macleod, 2006.
SCANSII - English
Channel
0.33 Aerial Hammond and
Macleod, 2006.
SCANSII – Southern
North Sea
0.51 Visual
ship
Hammond and
Macleod, 2006.
3.4.4 These measures indicate relatively high densities within our two study areas. The
acoustic detection rates in the Bishops and Clerks study area are over twice as high as
those reported from any other area, while those from the Skerries are exceeded only by
rates in well known porpoise high density areas in the western Baltic which were
collected from a quiet vessel. Comparing density estimates, we find that those in the
Bishops and Clerks are the highest recorded while the estimates for the Skerries survey
block are only exceeded by estimates from the west coast of Scotland and the southern
North Sea. Our density estimates do not allow for g(0) and are thus negatively biased.
If the value for g(0) of 0.68 estimated in this study was applied, then density estimates at
the Skerries would only be exceeded by our own from those at Bishops and Clerks.
3.4.5 Within the relatively small study areas spatial modelling indicated substantial variability
in predicted densities, especially at the Bishops and Clerks site. We would caution
against over interpretation of these data, and further analysis and ideally a longer data
series are required to explore the robustness of these predictions. However, they do
suggest that there could be scope in this approach for using such information when
siting tidal turbines to reduce risks of encounters (and potential collisions) between
turbines and harbour porpoises.
3.4.6 There are some indications of interactions between covariates related to the tidal cycle
and spatial covariates. This indicates changes in spatial distribution through the tidal
cycle, as has been observed elsewhere.

Studies of Marine Mammals in Welsh High Tidal Waters
4 The Use of TPOD, Static Acoustic Loggers, to Describe Aspects of Harbour Porpoise Ecology in High Tidal Areas
4.1 Introduction
4.1.1 This section of the report describes the use of autonomous, acoustic data-loggers,
TPODs, to make a continuous record of harbour porpoise acoustic activity at the two
sites described in the previous section. TPODs are passive devices, which identify and
log the echolocation click trains produced by porpoise when foraging, during social
interaction, and to otherwise ‘illuminate’ their immediate underwater environment
(Tregenza et al., 2001). Harbour porpoises make characteristic narrow band, ultrasonic
clicks that are distinct in frequency from the sounds of other European marine mammal
species.
4.1.2 TPODs are able to detect harbour porpoise echolocation clicks within a radius of
approximately 300 m; a preliminary analysis of data collected using earlier versions of
the TPOD, suggests that the likelihood of detecting harbour porpoises within 100 m
radius is 80-90% (Tougaard et al., 2006). The data collected provides limited spatial
coverage unless very large numbers are deployed. However, because they log
continuously and can be deployed for periods of months at time they can provide
excellent temporal coverage. These characteristics make TPODs a suitable method by
which to investigate porpoise activity at specific sites of interest. TPODs have been used
extensively for harbour porpoise baseline assessments and environmental impact
studies (e.g. Tougaard et al., 2005; Pierpoint, 2008; Todd et al., 2009). The present
study used TPODs to describe habitat use by harbour porpoises at potential locations
for tidal energy device development.
4.1.3 TPODs were deployed first within The Skerries/Carmel Head study site off Anglesey
and then at Ramsey Sound near St. David’s (Pembrokeshire). The study objectives were
to document and compare day-to-day levels of porpoise activity between the study sites,
and between mooring locations at each site. TPOD data was also used to investigate
whether porpoises followed patterns of behaviour that are related to the semi-diurnal
(flood-ebb) tidal cycle. In addition, data were examined to assess whether porpoise
occurrence varied between the day and night, as this behaviour would affect site
assessments carried out by visual observation.
JER3688 Welsh Assembly Government Planning & Development 28th March 2011
48

Studies of Marine Mammals in Welsh High Tidal Waters
4.2 Methods
TPOD
4.2.1 TPODs are self-contained acoustic monitoring devices designed and manufactured by
Chelonia Ltd., UK. Each TPOD consists of a hydrophone, two battery packs and
analogue circuitry housed in a robust, tubular housing. When deployed with twelve
alkaline batteries and set to log click trains every minute, TPODs are able to operate
unattended for up to 60-80 days. Data are stored on a 128 Mb memory chip. TPODs
record the precise times at which ultrasonic pulses (clicks) are detected and pulse
duration, both to 10 µs resolution. Click types attributable to different species or sources
are identified using user-defined filter and threshold settings. Offline, TPOD software
scans the data searching for regular sequences of clicks – click trains. A full description
of the TPOD is available at http://www.chelonia.co.uk/index.html.
TPOD settings
4.2.2 The TPOD settings used are shown in Table 4-1
Table 4-1 TPOD deployment & logging effort.
. TPODs carry out a series of six
successive scans in each 1 minute logging period. Detection parameters may be set
independently for each scan. Five of the six scans were dedicated for harbour porpoise
detection. The sixth scan was set to detect the broadband vocalisations of dolphin
species reported from these study sites. Bottlenose dolphin for example, may
occasionally produce similar sounds to harbour porpoise clicks, alongside their more
typical broadband click trains. This scan was used as a control to identify and reject
porpoise-type click trains that occurred within encounters with other species.
TPOD The Skerries Ramsey Sound
T438 21st Jul – 7th Aug (18 days) 17th Aug – 25th Sep (40 days)
T439 21st Jul – 12th Aug (23 days) lost
T440 no data 16th Aug – 25th Sep (41 days)
T462 21st Jul – 6th Aug (17 days) 16th Aug – 25th Sep (41 days)
T465 21st Jul – 5th Aug (16 days) lost
T468 21st Jul – 7th Aug (18 days) 17th Aug – 25th Sep (40 days)
JER3688 Welsh Assembly Government Planning & Development 28th March 2011
49
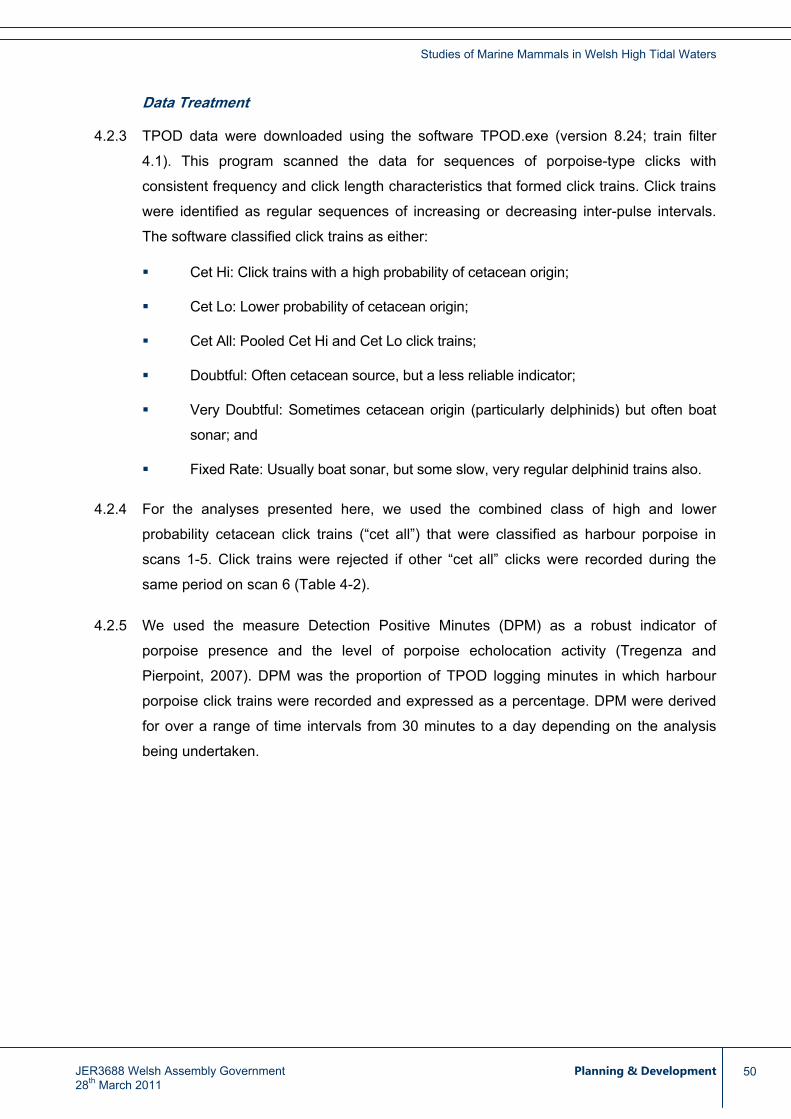
Studies of Marine Mammals in Welsh High Tidal Waters
Data Treatment
4.2.3 TPOD data were downloaded using the software TPOD.exe (version 8.24; train filter
4.1). This program scanned the data for sequences of porpoise-type clicks with
consistent frequency and click length characteristics that formed click trains. Click trains
were identified as regular sequences of increasing or decreasing inter-pulse intervals.
The software classified click trains as either:
Cet Hi: Click trains with a high probability of cetacean origin;
Cet Lo: Lower probability of cetacean origin;
Cet All: Pooled Cet Hi and Cet Lo click trains;
Doubtful: Often cetacean source, but a less reliable indicator;
Very Doubtful: Sometimes cetacean origin (particularly delphinids) but often boat
sonar; and
Fixed Rate: Usually boat sonar, but some slow, very regular delphinid trains also.
4.2.4 For the analyses presented here, we used the combined class of high and lower
probability cetacean click trains (“cet all”) that were classified as harbour porpoise in
scans 1-5. Click trains were rejected if other “cet all” clicks were recorded during the
same period on scan 6 (Table 4-2).
4.2.5 We used the measure Detection Positive Minutes (DPM) as a robust indicator of
porpoise presence and the level of porpoise echolocation activity (Tregenza and
Pierpoint, 2007). DPM was the proportion of TPOD logging minutes in which harbour
porpoise click trains were recorded and expressed as a percentage. DPM were derived
for over a range of time intervals from 30 minutes to a day depending on the analysis
being undertaken.
JER3688 Welsh Assembly Government Planning & Development 28th March 2011
50

Studies of Marine Mammals in Welsh High Tidal Waters
Table 4-2 Version 4 TPOD scan settings.
Settings Scans 1-5 Scan 6
Target Filter A (centre) 130 kHz 50 kHz
Reference Filter B (centre) 92 kHz 70 kHz
Click Bandwidth 4 5
Noise Adaptation ++ ++
Sensitivity 10 6
Scan Limit (max clicks logged) None 240
Deployment
4.2.6 Six TPODs (v4) were deployed at Carmel Head, Anglesey in July and August 2009.
After a period of approximately three weeks, these TPODs were retrieved and re-
deployed at Ramsey Sound. The seabed moorings consisted of a primary chain clump
weight (~100 kg), which was buoyed, with a TPOD secured to the riser. The TPODs
were set to float 5 m above the seabed. Two sub-sea buoys were attached to the riser
above each TPOD to help keep it near vertical in the water column. The locations of the
TPOD moorings are shown in Figure 4-1.
JER3688 Welsh Assembly Government Planning & Development 28th March 2011
51

Studies of Marine Mammals in Welsh High Tidal Waters
Figure 4-1 The location of TPOD moorings at Skerries/Carmel Head (Anglesey) (left)
and the Ramsey Sound (Pembrokeshire) (right) in 2009
4.2.7 The deployment sites were chosen with some care. As far as possible deployment sites
with similar water depths were selected. Based on observations made by Pierpoint
(2008) and others at Ramsey Sound the authors had some reason to expect that sites at
either end of restricted channels might be important and might be used differently at
different states of the tide. At the Skerries, TPODs T465, T468 and T439 were placed in
areas of strongest flow, which are likely and/or are sites of interest for tidal turbine
development. These areas could also be easily monitored from the shore lookout station
at Carmel Head, enabling a comparison of the datasets collected by each method. T440,
T438 and T462 were deployed to provide data from areas immediately outside the areas
of highest tidal flow.
4.2.8 In Ramsey Sound, T440 was placed on the site of the planned deployment of the Delta
stream experimental turbine. T462 provided additional coverage to the north of the areas
of fastest flow at a spot which could be independently monitored from one of the shore
stations. T468 and T465 were sited close to the tidal rapid area to the south of the
Sound which Pierpoint (2008) had identified as being a favoured foraging site during ebb
tides. These two sites could also be readily observed from an established shore station.
T438 and T439 provided coverage well to the north and to the south of the Sound
respectively.
JER3688 Welsh Assembly Government Planning & Development 28th March 2011
52

Studies of Marine Mammals in Welsh High Tidal Waters
4.2.9 Two TPODs (v3) were also attached to two of the moorings. These units failed to record
data consistently however, and their results are not discussed further in this report.
TPOD calibration
4.2.10 The TPODs used during this project had previously been deployed together during an
in-sea calibration test. The calibration test was carried out in Newport Bay
(Pembrokeshire) in August and September 2006. The test was 63 days in duration
during which all TPODs were attached vertically, side by side, on a 1 m2 seabed frame.
The aim of the test was to check that the units functioned correctly and that they
displayed similar sensitivity, i.e. rates of harbour porpoise detection. The results of the
calibration test showed that although all TPODs tracked very similar day-to-day variation
in DPM, some statistical differences were found in their detection rates (Pierpoint, 2006).
To address this, scale factors were developed that adjusted daily DPM values towards
the common mean of all six TPODs. The scale factor (SF) was calculated as the
proportional difference (PD) between total DPM recorded by each TPOD (∑DPM) and
the summed daily average DMP of all six TPODs ((∑ DPM ):
PD = abs (∑DPM – ∑ DPM) / ∑DPM)
SF = 1-PD
4.2.11 A scale factor was calculated for each TPOD and was applied as a multiplier to daily
DPM values. Scale factors were applied to DPM values whenever detection rates were
compared between different TPOD locations, to remove effects of differences in
sensitivity between different TPOD units.
Data analysis
4.2.12 Each minute of logged time was scored as being either detection positive or detection
negative depending on whether or not at least one porpoise click train had been
detected during that interval. Daily DPM (the proportion of total, daily logging minutes
with porpoise click train detections, adjusted with a TPOD-specific scale factor) was
used to compare levels of harbour porpoise activity recorded at TPOD locations within
each study site and between the Ramsey Sound and Skerries sites.
4.2.13 At individual TPOD locations, non-parametric statistical methods were used to test null
hypotheses that no differences existed between time-of-day and tidal phase classes.
JER3688 Welsh Assembly Government Planning & Development 28th March 2011
53

Studies of Marine Mammals in Welsh High Tidal Waters
Wilcoxon’s signed ranks test (Conover, 1999) was used to compare daytime and night-
time detection rate. TPOD data were assigned to “day” or “night” categories each day
based on published local times (standard transit) of sunrise and sunset (UKHO, 2009).
4.2.14 To examine porpoise activity patterns relative to the tidal cycle, detection minutes were
also grouped into ½ hour tidal intervals and assigned to ebb and flood categories based
on the time at which the tidal stream was predicted to slacken and reverse direction
(UKHO, 2006); Figure 4-2
Figure 4-2
and Table 4-3
Table 4-3
). Detection rates were compared statistically in
four classes: day-ebb, day-flood, night-ebb and night-flood. In reality, the precise timing
of slack tide is likely to have varied due to lunar phase, weather conditions and to some
degree between different locations at each study site. For this study, day-night, and ebb-
flood classes were assessed using Friedman tests, which is a non-parametric equivalent
of 2-way ANOVA (Iman and Davenport, 1980). In cases where the test gave a significant
result (at alpha = 0.05), pairwise comparisons were made (Conover, 1999).
4.3 Results
TPOD calibration
4.3.1 The raw and scaled data from the calibration test are shown in . All six TPODs
tracked similar daily DPM values during the 63-day co-deployment. Two or more TPODs
tended to yield statistically different detection rates (Friedman test: T2 = 10.34, 5 df, P <
0.001). Scale factors (SF) were applied to adjust individual daily DPM values toward the
common mean of all six TPODs ( ). Once these were applied, no significant
differences in DPM between TPODs remained (Friedman test: T2 = 1.41, 5 df, P =
0.222).
4.3.2 As SF incorporated differences due to random sampling error as well as TPOD
sensitivity, they were likely to overcompensate to some degree, i.e. the DPM values of
the most sensitive and least sensitive TPODs would be reduced and increased by a
greater amount respectively, than was warranted by the difference in sensitivity alone.
JER3688 Welsh Assembly Government Planning & Development 28th March 2011
54
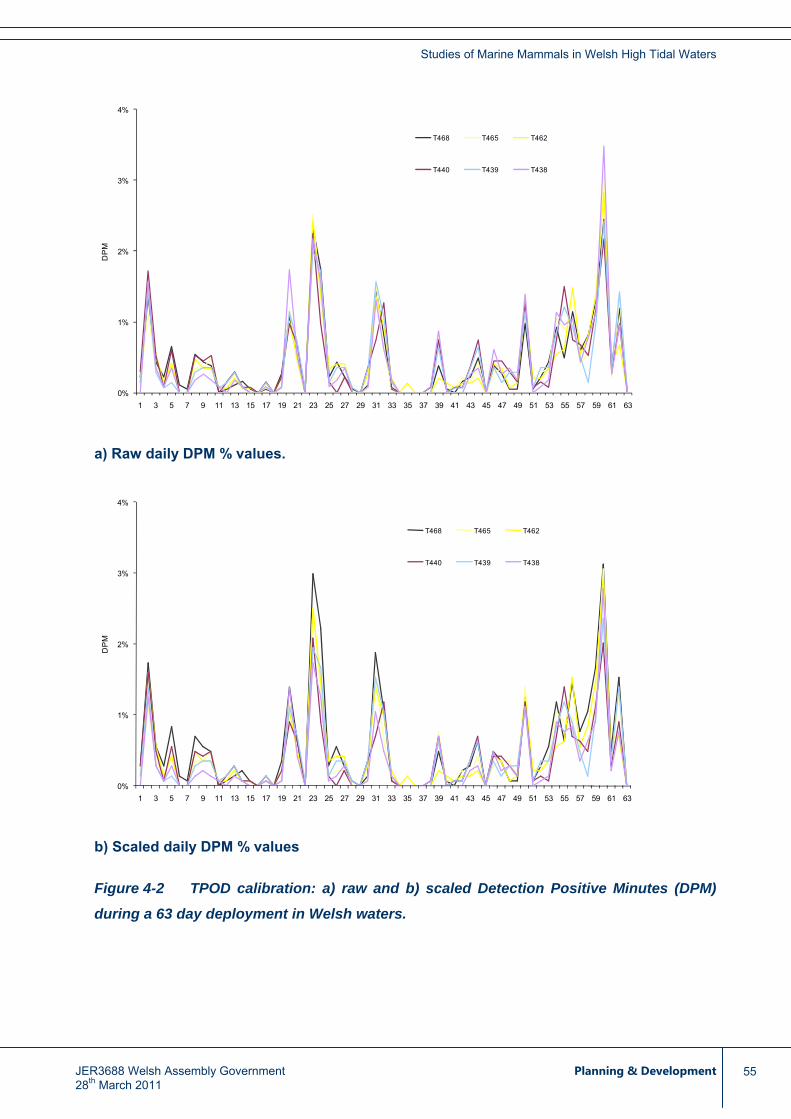
Studies of Marine Mammals in Welsh High Tidal Waters
0%
1%
2%
3%
4%
1 3 5 7 9 11 13 15 17 19 21 23 25 27 29 31 33 35 37 39 41 43 45 47 49 51 53 55 57 59 61 63
DP
M
T468 T465 T462
T440 T439 T438
a) Raw daily DPM % values.
0%
1%
2%
3%
4%
1 3 5 7 9 11 13 15 17 19 21 23 25 27 29 31 33 35 37 39 41 43 45 47 49 51 53 55 57 59 61 63
DP
M
T468 T465 T462
T440 T439 T438
b) Scaled daily DPM % values
Figure 4-2 TPOD calibration: a) raw and b) scaled Detection Positive Minutes (DPM)
during a 63 day deployment in Welsh waters.
JER3688 Welsh Assembly Government Planning & Development 28th March 2011
55

Studies of Marine Mammals in Welsh High Tidal Waters
Table 4-3 DPM from the 63-day in-sea calibration test, mean ranks and scale factors
applied when comparing daily DPM values of two or more TPODs.
Raw Scaled TPOD
DPM % Mean Rank
Scale Factor
DPM Mean Rank
T438 0.35 2.49 1.254 0.44 3.10
T439 0.43 3.50 1.026 0.44 3.53
T440 0.40 3.48 1.077 0.44 3.83
T462 0.45 3.71 0.970 0.44 3.51
T465 0.43 3.41 1.008 0.44 3.37
T468 0.56 4.40 0.783 0.44 3.67
Duration of TPOD deployment
4.3.3 In total, 254 TPOD-days of data were gathered from the two study sites (4873 h) (Table
4-1). At the Skerries, all six TPODs deployed were recovered, but only five provided
data; T440 failed to operate correctly. A total of 1691 TPOD-hours of data were collected
at this site, the TPODs operating for between 16 and 23 days. At Ramsey Sound, four
out of six TPODs were recovered. Two moorings and TPODs (T439 and T465) were
lost. The remaining TPODs operated successfully for 40-41 days and recorded a total of
3182 TPOD-hours of data.
Daily levels of harbour porpoise activity
4.3.4 Harbour porpoise occurrence was high at both study sites. Porpoises were recorded by
a minimum of one TPOD, and usually all TPODs, every day at the Skerries and in
Ramsey Sound. At the majority of locations for both sites, porpoises were recorded at
least once on 85-100% of days. The lowest rate of daily occurrence at any TPOD
location was 56% (TPOD T440 at a site in the north of Ramsey Sound). At the Skerries,
harbour porpoise click trains were recorded in 1334 of 101,455 logging minutes, and at
Ramsey Sound in 2525 of 190,898 logging minutes: this yielded an identical % DPM
value of 1.3% overall, for the duration of TPOD deployment at each site.
JER3688 Welsh Assembly Government Planning & Development 28th March 2011
56

Studies of Marine Mammals in Welsh High Tidal Waters
4.3.5 Within each site, certain TPOD locations recorded higher levels of porpoise activity than
others. The total DPM for the duration of deployment, varied from 0.2% to 4.1% at the
five Skerries TPOD locations, and from 0.2% to 3.4% at the four Ramsey Sound
locations. Maximum daily DPM recorded at a Skerries location was 7.9% (T468), and
10% at Ramsey Sound (T468) (Table 4-4).
4.3.6 The sites with the highest rates of harbour porpoise detection were T468 and T438 at
the Skerries and T468 and T462 at Ramsey Sound (Table 4-4). At the Skerries T468
was located mid-way between Carmel Head and the Skerries; T438 was located
approximately 3 km southwest of T468 while at Ramsey Sound, T468 and T462 were
located just 1.5 km apart, on the south and north sides of the Pen Dal-Aderyn Headland
respectively (Figure 4-1).
Table 4-4 Summary of % DPM values, an index of harbour porpoise activity levels.
Detection Positive Days (% DPD) is given as a measure of daily occurrence: the
percentage of days on which porpoises were recorded at each location. Locations have
been ranked within each study site by median daily % DPM.
Site TPOD % DPD Total
% DPM
Median
Daily % DPM
Daily DPM%
Range
Rank
T438 100 1.4 1.25 0.35 – 4.43 2
T439 100 0.3 0.28 0.07 – 1.11 4
T462 71 0.2 0.07 0.00 – 0.56 5
T465 94 0.6 0.60 0.00 – 1.32 3
The Skerries
T468 100 4.1 4.24 1.11 – 7.92 1
T438 95 0.4 0.21 0.00 – 2.08 3
T440 56 0.2 0.07 0.00 – 2.36 4
T462 85 1.3 0.49 0.00 – 4.65 2
Ramsey
Sound
T468 85 3.4 2.81 0.00 – 10.00 1
JER3688 Welsh Assembly Government Planning & Development 28th March 2011
57
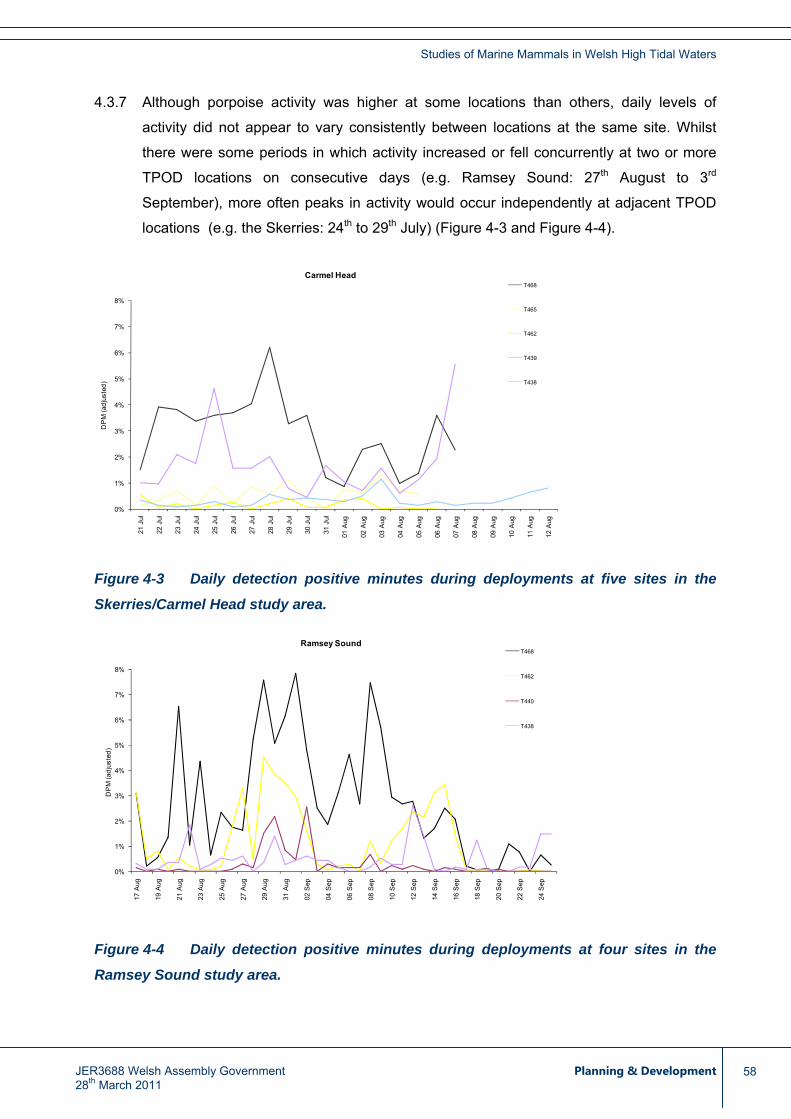
Studies of Marine Mammals in Welsh High Tidal Waters
JER3688 Welsh Assembly Government Planning & Development 28th March 2011
58
4.3.7 Although porpoise activity was higher at some locations than others, daily levels of
activity did not appear to vary consistently between locations at the same site. Whilst
there were some periods in which activity increased or fell concurrently at two or more
TPOD locations on consecutive days (e.g. Ramsey Sound: 27th August to 3rd
September), more often peaks in activity would occur independently at adjacent TPOD
locations (e.g. the Skerries: 24th to 29th July) (Figure 4-3 and Figure 4-4).
0%
1%
2%
3%
4%
5%
6%
7%
8%
21 J
ul
22 J
ul
23 J
ul
24 J
ul
25 J
ul
26 J
ul
27 J
ul
28 J
ul
29 J
ul
30 J
ul
31 J
ul
01 A
ug
02 A
ug
03 A
ug
04 A
ug
05 A
ug
06 A
ug
07 A
ug
08 A
ug
09 A
ug
10 A
ug
11 A
ug
12 A
ug
DP
M (a
djus
ted)
Carmel HeadT468
T465
T462
T439
T438
Figure 4-3 Daily detection positive minutes during deployments at five sites in the
Skerries/Carmel Head study area.
0%
1%
2%
3%
4%
5%
6%
7%
8%
17 A
ug
19 A
ug
21 A
ug
23 A
ug
25 A
ug
27 A
ug
29 A
ug
31 A
ug
02 S
ep
04 S
ep
06 S
ep
08 S
ep
10 S
ep
12 S
ep
14 S
ep
16 S
ep
18 S
ep
20 S
ep
22 S
ep
24 S
ep
DP
M (a
djus
ted)
Ramsey SoundT468
T462
T440
T438
Figure 4-4 Daily detection positive minutes during deployments at four sites in the
Ramsey Sound study area.

Studies of Marine Mammals in Welsh High Tidal Waters
Daytime / night-time variation in porpoise activity
4.3.8 DPM during the day and night at each TPOD location were also compared. Average
DPM values are shown in Table 4-5
Table 4-5 Comparison of median daily DPM values recorded during the day and
night. The P-values are the results of Wilcoxon’s signed ranks test (two-sided).
. These data were used to test two hypotheses:
H0: there was no significant difference in the level of porpoise activity recorded
during daylight hours and during the hours of darkness each day; and
H1: higher levels of porpoise activity tended to be recorded either during the day or
during the night.
Site TPOD Median Day
% DPM
Median Night
% DPM
n Days P-value Significance
Level
α = 0.05
T438 0.74 1.82 18 0.0010 **
T439 0.21 0.38 23 0.2226 ns
T462 0.10 0.00 17 0.7910 ns
T465 0.26 0.94 16 0.0020 **
The Skerries
T468 4.95 1.68 18 0.0077 **
T438 0.00 0.47 40 <0.0001 ***
T440 0.00 0.00 41 0.0002 ***
T462 0.00 0.98 41 <0.0001 ***
Ramsey
Sound
T468 0.64 4.02 40 0.0001 ***
4.3.9 At the Skerries, detection rates were relatively low at one TPOD location, T462, and at
this site there was no clear day-night pattern. Three of the other four sites however,
showed higher levels of echolocation activity at night than during the day (Figure 4.5:
T438, T439, T465). The diel variation was statistically significant at two of these sites: at
T438 and T465 significantly more porpoise activity was recorded at night; and in 16 of
18 and 14 of 16 twenty-four hour periods respectively. One site however, T468, showed
a reverse pattern with significantly higher detection rates recorded during the day than
during the night (P = 0.008). Daytime levels were higher than night-time levels on 15 of
JER3688 Welsh Assembly Government Planning & Development 28th March 2011
59

Studies of Marine Mammals in Welsh High Tidal Waters
18 days. This was the only location in this study where significantly more diurnal than
nocturnal harbour porpoise activity was recorded.
0%
2%
4%
6%
8%
10%
12%
01 J
an
02 J
an
03 J
an
04 J
an
05 J
an
06 J
an
07 J
an
08 J
an
09 J
an
10 J
an
11 J
an
12 J
an
13 J
an
14 J
an
15 J
an
16 J
an
17 J
an
18 J
an
% D
PM
T468NIGHT
DAY
0%
2%
4%
6%
8%
10%
12%
21 J
ul
22 J
ul
23 J
ul
24 J
ul
25 J
ul
26 J
ul
27 J
ul
28 J
ul
29 J
ul
30 J
ul
31 J
ul
01 A
ug
02 A
ug
03 A
ug
04 A
ug
05 A
ug
% D
PM
T465NIGHT
DAY
0%
2%
4%
6%
8%
10%
12%
21 J
ul
22 J
ul
23 J
ul
24 J
ul
25 J
ul
26 J
ul
27 J
ul
28 J
ul
29 J
ul
30 J
ul
31 J
ul
01 A
ug
02 A
ug
03 A
ug
04 A
ug
05 A
ug
06 A
ug
07 A
ug
% D
PM
T438NIGHT
DAY
0%
2%
4%
6%
8%
10%
12%
21 J
ul
22 J
ul
23 J
ul
24 J
ul
25 J
ul
26 J
ul
27 J
ul
28 J
ul
29 J
ul
30 J
ul
31 J
ul
01 A
ug
02 A
ug
03 A
ug
04 A
ug
05 A
ug
06 A
ug
% D
PM
T462NIGHT
DAY
0%
2%
4%
6%
8%
10%
12%
21 J
ul
22 J
ul
23 J
ul
24 J
ul
25 J
ul
26 J
ul
27 J
ul
28 J
ul
29 J
ul
30 J
ul
31 J
ul
01 A
ug
02 A
ug
03 A
ug
04 A
ug
05 A
ug
06 A
ug
07 A
ug
08 A
ug
09 A
ug
10 A
ug
11 A
ug
12 A
ug
% D
PM
T439NIGHT
DAY
Figure 4-5 The Skerries / Carmel Head: day – night variation in porpoise acoustic
detection rates at each POD location
4.3.10 At Ramsey Sound there was significantly more night-time than daytime porpoise activity
at all four locations (T438, T440, T462, T468; P < 0.001 in each case). Relatively high
levels of activity were recorded during daylight at one location only (T468). Here, DPM
exceeded 1% on 18 of 40 daytime periods compared to 28 of 40 night-time periods
(Figure 4-6).
JER3688 Welsh Assembly Government Planning & Development 28th March 2011
60

Studies of Marine Mammals in Welsh High Tidal Waters
JER3688 Welsh Assembly Government Planning & Development 28th March 2011
61
0%
2%
4%
6%
8%
10%
12%
17 A
ug
19 A
ug
21 A
ug
23 A
ug
25 A
ug
27 A
ug
29 A
ug
31 A
ug
02 S
ep
04 S
ep
06 S
ep
08 S
ep
10 S
ep
12 S
ep
14 S
ep
16 S
ep
18 S
ep
20 S
ep
22 S
ep
24 S
ep
% D
PM
T438NIGHT
DAY
0%
2%
4%
6%
8%
10%
12%
14%
16%
18%
20%
17 A
ug
19 A
ug
21 A
ug
23 A
ug
25 A
ug
27 A
ug
29 A
ug
31 A
ug
02 S
ep
04 S
ep
06 S
ep
08 S
ep
10 S
ep
12 S
ep
14 S
ep
16 S
ep
18 S
ep
20 S
ep
22 S
ep
24 S
ep
% D
PM
T468NIGHT
DAY
0%
2%
4%
6%
8%
10%
12%
16 A
ug
18 A
ug
20 A
ug
22 A
ug
24 A
ug
26 A
ug
28 A
ug
30 A
ug
01 S
ep
03 S
ep
05 S
ep
07 S
ep
09 S
ep
11 S
ep
13 S
ep
15 S
ep
17 S
ep
19 S
ep
21 S
ep
23 S
ep
25 S
ep
% D
PM
T462NIGHT
DAY
0%
2%
4%
6%
8%
10%
12%
16 A
ug
18 A
ug
20 A
ug
22 A
ug
24 A
ug
26 A
ug
28 A
ug
30 A
ug
01 S
ep
03 S
ep
05 S
ep
07 S
ep
09 S
ep
11 S
ep
13 S
ep
15 S
ep
17 S
ep
19 S
ep
21 S
ep
23 S
ep
25 S
ep
% D
PM
T440NIGHT
DAY
Figure 4-6 Ramsey Sound: day – night variation in porpoise acoustic detection rates
at each POD location.
4.3.11 In general therefore, there was a tendency for more harbour porpoise echolocation
activity to be recorded at night than during the day. There was comparatively little
daytime activity at most locations. Daylight detections were most frequent, both at the
Skerries and in Ramsey Sound, at the locations with the highest rates of usage by
porpoises overall. The TPOD data recorded harbour porpoise occurrence at all
locations in Ramsey Sound and at the Skerries both in the day and at night. If however,
we assume that sustained rates of echolocation activity reflect the relative importance of
different locations for foraging, then those locations at which porpoises spent most time
foraging at night were the only locations at which foraging also appeared profitable
during the day.
Variation in porpoise activity over the ebb-flood tidal cycle
4.3.12 Porpoise detection rates at the Skerries and Ramsey Sound are plotted in Figure 4-7
and Figure 4-8 for ½ hour intervals within each tidal cycle and the data are summarised
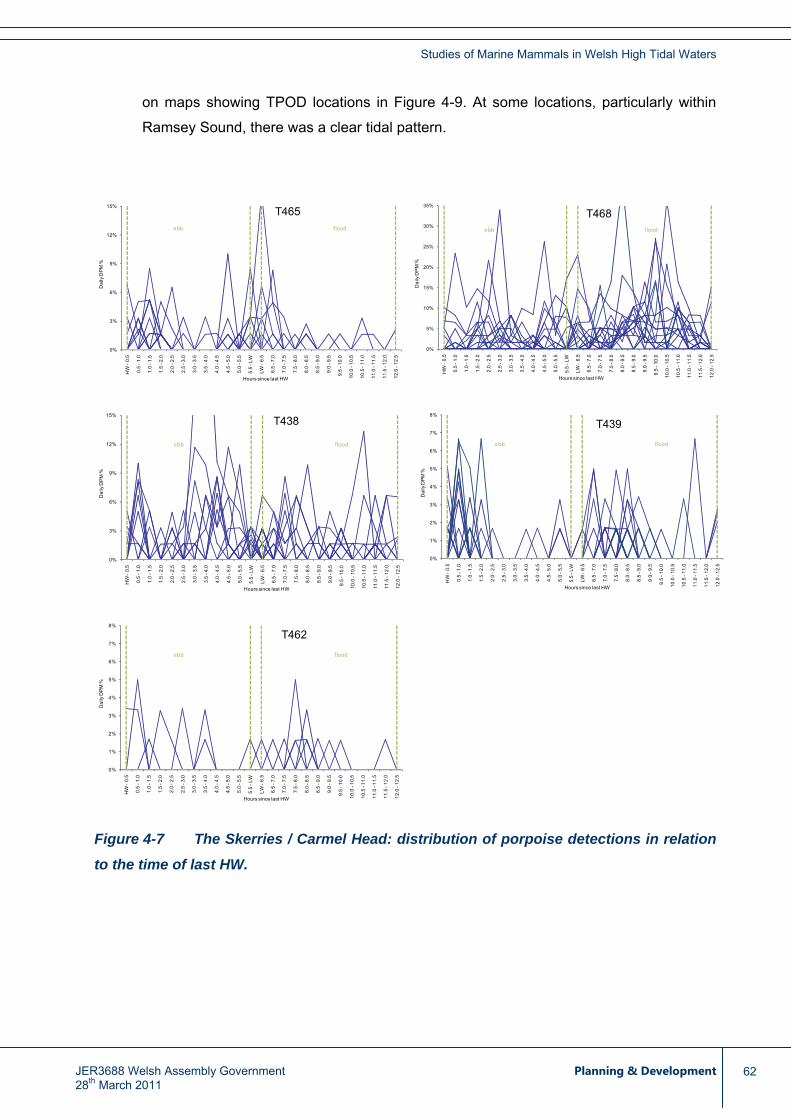
Studies of Marine Mammals in Welsh High Tidal Waters
on maps showing TPOD locations in Figure 4-9. At some locations, particularly within
Ramsey Sound, there was a clear tidal pattern.
0%
5%
10%
15%
20%
25%
30%
35%
HW
-0.
5
0.5
-1.0
1.0
-1.5
1.5
-2.0
2.0
-2.5
2.5
-3.0
3.0
-3.5
3.5
-4.0
4.0
-4.5
4.5
-5.0
5.0
-5.5
5.5
-LW
LW -
6.5
6.5
-7.0
7.0
-7.5
7.5
-8.0
8.0
-8.5
8.5
-9.0
9.0
-9.5
9.5
-10.
0
10.0
-10
.5
10.5
-11
.0
11.0
-11
.5
11.5
-12
.0
12.0
-12
.5
Dai
ly D
PM
%
Hours since last HW
T468floodebb
0%
3%
6%
9%
12%
15%
HW
-0.
5
0.5
-1.0
1.0
-1.5
1.5
-2.0
2.0
-2.5
2.5
-3.0
3.0
-3.5
3.5
-4.0
4.0
-4.5
4.5
-5.0
5.0
-5.5
5.5
-LW
LW -
6.5
6.5
-7.0
7.0
-7.5
7.5
-8.0
8.0
-8.5
8.5
-9.0
9.0
-9.5
9.5
-10.
0
10.0
-10
.5
10.5
-11
.0
11.0
-11
.5
11.5
-12
.0
12.0
-12
.5
Dai
ly D
PM
%
Hours since last HW
T465floodebb
0%
1%
2%
3%
4%
5%
6%
7%
8%
HW
-0.
5
0.5
-1.0
1.0
-1.5
1.5
-2.0
2.0
-2.5
2.5
-3.0
3.0
-3.5
3.5
-4.0
4.0
-4.5
4.5
-5.0
5.0
-5.5
5.5
-LW
LW -
6.5
6.5
-7.0
7.0
-7.5
7.5
-8.0
8.0
-8.5
8.5
-9.0
9.0
-9.5
9.5
-10.
0
10.0
-10
.5
10.5
-11
.0
11.0
-11
.5
11.5
-12
.0
12.0
-12
.5
Dai
ly D
PM %
Hours since last HW
T439floodebb
0%
3%
6%
9%
12%
15%
HW
-0.
5
0.5
-1.0
1.0
-1.5
1.5
-2.0
2.0
-2.5
2.5
-3.0
3.0
-3.5
3.5
-4.0
4.0
-4.5
4.5
-5.0
5.0
-5.5
5.5
-LW
LW -
6.5
6.5
-7.0
7.0
-7.5
7.5
-8.0
8.0
-8.5
8.5
-9.0
9.0
-9.5
9.5
-10.
0
10.0
-10
.5
10.5
-11
.0
11.0
-11
.5
11.5
-12
.0
12.0
-12
.5
Dai
ly D
PM
%
Hours since last HW
T438
floodebb
0%
1%
2%
3%
4%
5%
6%
7%
8%
HW
-0.
5
0.5
-1.0
1.0
-1.5
1.5
-2.0
2.0
-2.5
2.5
-3.0
3.0
-3.5
3.5
-4.0
4.0
-4.5
4.5
-5.0
5.0
-5.5
5.5
-LW
LW -
6.5
6.5
-7.0
7.0
-7.5
7.5
-8.0
8.0
-8.5
8.5
-9.0
9.0
-9.5
9.5
-10.
0
10.0
-10
.5
10.5
-11
.0
11.0
-11
.5
11.5
-12
.0
12.0
-12
.5
Dai
ly D
PM
%
Hours since last HW
T462floodebb
Figure 4-7 The Skerries / Carmel Head: distribution of porpoise detections in relation
to the time of last HW.
JER3688 Welsh Assembly Government Planning & Development 28th March 2011
62

Studies of Marine Mammals in Welsh High Tidal Waters
0%
5%
10%
15%
20%
25%
30%
HW
-0.
5
0.5
-1.0
1.0
-1.5
1.5
-2.0
2.0
-2.5
2.5
-3.0
3.0
-3.5
3.5
-4.0
4.0
-4.5
4.5
-5.0
5.0
-5.5
5.5
-LW
LW -
6.5
6.5
-7.0
7.0
-7.5
7.5
-8.0
8.0
-8.5
8.5
-9.0
9.0
-9.5
9.5
-10.
0
10.0
-10
.5
10.5
-11
.0
11.0
-11
.5
11.5
-12
.0
12.0
-12
.5
Dai
ly D
PM
%
Hours since last HW
T440flood floodebb
0%
2%
4%
6%
8%
10%
12%
14%
16%
HW
-0.
5
0.5
-1.0
1.0
-1.5
1.5
-2.0
2.0
-2.5
2.5
-3.0
3.0
-3.5
3.5
-4.0
4.0
-4.5
4.5
-5.0
5.0
-5.5
5.5
-LW
LW -
6.5
6.5
-7.0
7.0
-7.5
7.5
-8.0
8.0
-8.5
8.5
-9.0
9.0
-9.5
9.5
-10.
0
10.0
-10
.5
10.5
-11
.0
11.0
-11
.5
11.5
-12
.0
12.0
-12
.5
Dai
ly D
PM
%
Hours since last HW
T438flood floodebb
0%
5%
10%
15%
20%
25%
30%
35%
40%
45%
50%
HW
-0.
5
0.5
-1.0
1.0
-1.5
1.5
-2.0
2.0
-2.5
2.5
-3.0
3.0
-3.5
3.5
-4.0
4.0
-4.5
4.5
-5.0
5.0
-5.5
5.5
-LW
LW -
6.5
6.5
-7.0
7.0
-7.5
7.5
-8.0
8.0
-8.5
8.5
-9.0
9.0
-9.5
9.5
-10.
0
10.0
-10
.5
10.5
-11
.0
11.0
-11
.5
11.5
-12
.0
12.0
-12
.5
Dai
ly D
PM
%
Hours since last HW
T468flood floodebb
0%
5%
10%
15%
20%
25%
HW
-0.
5
0.5
-1.0
1.0
-1.5
1.5
-2.0
2.0
-2.5
2.5
-3.0
3.0
-3.5
3.5
-4.0
4.0
-4.5
4.5
-5.0
5.0
-5.5
5.5
-LW
LW -
6.5
6.5
-7.0
7.0
-7.5
7.5
-8.0
8.0
-8.5
8.5
-9.0
9.0
-9.5
9.5
-10.
0
10.0
-10
.5
10.5
-11
.0
11.0
-11
.5
11.5
-12
.0
12.0
-12
.5
Dai
ly D
PM
%
Hours since last HW
T462flood floodebb
Figure 4-8 Ramsey Sound: distribution of porpoise detections in relation to the time of
last HW.
JER3688 Welsh Assembly Government Planning & Development 28th March 2011
63

Studies of Marine Mammals in Welsh High Tidal Waters
Figure 4-9 An illustration of relative levels and dominant tidal phase of harbour
porpoise activity recorded at each POD location for (a) the Skerries (left) and (b) Ramsey
Sound sites (right). Symbol size is proportional to total DPM %. Arrows indicate the
direction of the tidal stream when peak detections were recorded. At both sites the flood
tide has a north going current and the ebb a south going current.
4.3.13 At the Skerries activity in at least three locations appeared to occur at a similar level
throughout the ebb-flood cycle. At the two locations with high usage however, there was
evidence of contrasting patterns of activity. At T468, although porpoises were recorded
at all stages of tide, there was a higher rate of detection during the northwest-setting
flood phase than during the ebb. At T465 however, there was more porpoise activity
during the south-westerly ebb phase and around the time of low water. The authors
therefore speculate that individual animals may move between foraging locations at
different stages of tide.
4.3.14 Clearer patterns of porpoise behaviour emerged at Ramsey Sound, perhaps because
tide race habitat at Ramsey Sound was more constricted by coastal and seabed
topography than at the more open headland locations at the Skerries/Carmel Head.
Consistently at T468 in Ramsey Sound, to the south of the narrows and strongest tidal
rapids, porpoise activity was concentrated during the ebb tide. An increase in activity
was recorded from shortly after the onset of the ebb, until shortly after the tide reversed
direction after LW slack. There were then relatively few porpoise detections during the
JER3688 Welsh Assembly Government Planning & Development 28th March 2011
64
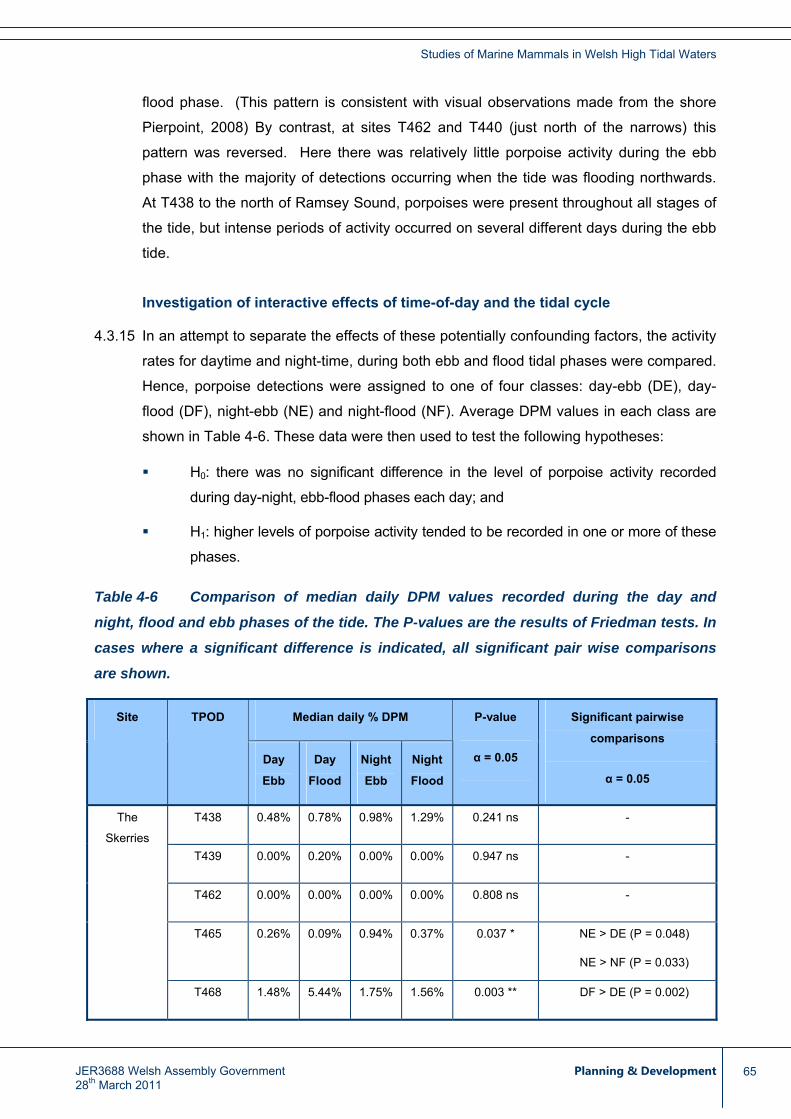
Studies of Marine Mammals in Welsh High Tidal Waters
flood phase. (This pattern is consistent with visual observations made from the shore
Pierpoint, 2008) By contrast, at sites T462 and T440 (just north of the narrows) this
pattern was reversed. Here there was relatively little porpoise activity during the ebb
phase with the majority of detections occurring when the tide was flooding northwards.
At T438 to the north of Ramsey Sound, porpoises were present throughout all stages of
the tide, but intense periods of activity occurred on several different days during the ebb
tide.
Investigation of interactive effects of time-of-day and the tidal cycle
4.3.15 In an attempt to separate the effects of these potentially confounding factors, the activity
rates for daytime and night-time, during both ebb and flood tidal phases were compared.
Hence, porpoise detections were assigned to one of four classes: day-ebb (DE), day-
flood (DF), night-ebb (NE) and night-flood (NF). Average DPM values in each class are
shown in Table 4-6
Table 4-6 Comparison of median daily DPM values recorded during the day and
night, flood and ebb phases of the tide. The P-values are the results of Friedman tests. In
cases where a significant difference is indicated, all significant pair wise comparisons
are shown.
. These data were then used to test the following hypotheses:
H0: there was no significant difference in the level of porpoise activity recorded
during day-night, ebb-flood phases each day; and
H1: higher levels of porpoise activity tended to be recorded in one or more of these
phases.
Median daily % DPM Site TPOD
Day
Ebb
Day
Flood
Night
Ebb
Night
Flood
P-value
α = 0.05
Significant pairwise
comparisons
α = 0.05
T438 0.48% 0.78% 0.98% 1.29% 0.241 ns -
T439 0.00% 0.20% 0.00% 0.00% 0.947 ns -
T462 0.00% 0.00% 0.00% 0.00% 0.808 ns -
T465 0.26% 0.09% 0.94% 0.37% 0.037 * NE > DE (P = 0.048)
NE > NF (P = 0.033)
The
Skerries
T468 1.48% 5.44% 1.75% 1.56% 0.003 ** DF > DE (P = 0.002)
JER3688 Welsh Assembly Government Planning & Development 28th March 2011
65
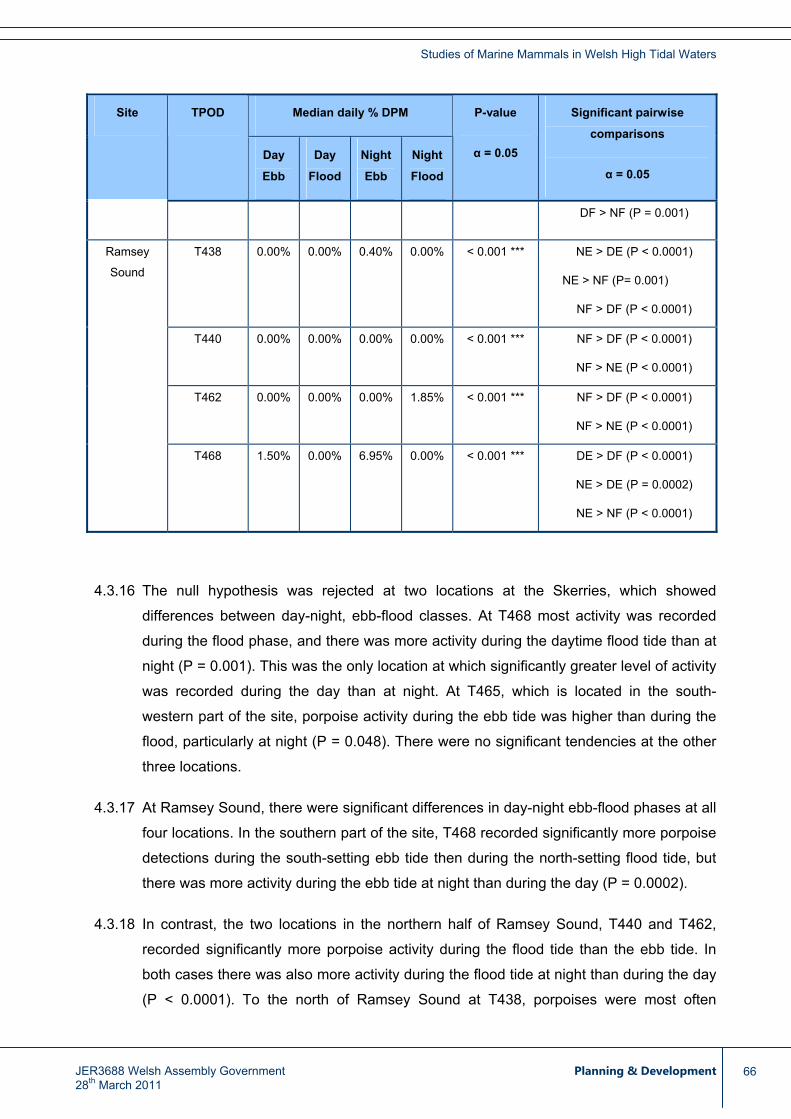
Studies of Marine Mammals in Welsh High Tidal Waters
JER3688 Welsh Assembly Government Planning & Development 28th March 2011
66
Median daily % DPM Site TPOD
Day
Ebb
Day
Flood
Night
Ebb
Night
Flood
P-value
α = 0.05
Significant pairwise
comparisons
α = 0.05
DF > NF (P = 0.001)
T438 0.00% 0.00% 0.40% 0.00% < 0.001 *** NE > DE (P < 0.0001)
NE > NF (P= 0.001)
NF > DF (P < 0.0001)
T440 0.00% 0.00% 0.00% 0.00% < 0.001 *** NF > DF (P < 0.0001)
NF > NE (P < 0.0001)
T462 0.00% 0.00% 0.00% 1.85% < 0.001 *** NF > DF (P < 0.0001)
NF > NE (P < 0.0001)
Ramsey
Sound
T468 1.50% 0.00% 6.95% 0.00% < 0.001 *** DE > DF (P < 0.0001)
NE > DE (P = 0.0002)
NE > NF (P < 0.0001)
4.3.16 The null hypothesis was rejected at two locations at the Skerries, which showed
differences between day-night, ebb-flood classes. At T468 most activity was recorded
during the flood phase, and there was more activity during the daytime flood tide than at
night (P = 0.001). This was the only location at which significantly greater level of activity
was recorded during the day than at night. At T465, which is located in the south-
western part of the site, porpoise activity during the ebb tide was higher than during the
flood, particularly at night (P = 0.048). There were no significant tendencies at the other
three locations.
4.3.17 At Ramsey Sound, there were significant differences in day-night ebb-flood phases at all
four locations. In the southern part of the site, T468 recorded significantly more porpoise
detections during the south-setting ebb tide then during the north-setting flood tide, but
there was more activity during the ebb tide at night than during the day (P = 0.0002).
4.3.18 In contrast, the two locations in the northern half of Ramsey Sound, T440 and T462,
recorded significantly more porpoise activity during the flood tide than the ebb tide. In
both cases there was also more activity during the flood tide at night than during the day
(P < 0.0001). To the north of Ramsey Sound at T438, porpoises were most often

Studies of Marine Mammals in Welsh High Tidal Waters
detected at night and during the ebb tide (P < 0.0001). There was also however,
significantly more activity during the flood tide at night, than on the flood tide during the
day (P < 0.0001).
4.4 Discussion
4.4.1 TPODs have been used to establish baseline information for harbour porpoise activity
patterns at two high tidal energy sites on the Welsh coast. Over a two-month period,
these autonomous devices logged 4900 h of monitoring effort and measured porpoise
occurrence and levels of echolocation activity at nine locations.
4.4.2 TPODs have a number of advantages over visual assessment methods, including that
the detection process is automated and not susceptible to bias due to variation in
observer skill and weather conditions. A further advantage of an automated detection
system is that it is possible to log the presence of porpoises continuously, throughout 24
h. Comparisons between data collected by different TPODs do however, assume that
each TPOD is equally sensitive and likely to record porpoises under the same
circumstances, at the same rate. In previous calibration tests the authors found that this
assumption was not necessarily true. To address this calibration test results were used
to develop scale factors, which compensated for sensitivity differences between TPODs.
The scale factors were subsequently applied to daily DPM values to mitigate for
potential sensitivity bias when comparing detection rates at different locations. For a full
baseline assessment of these sites the authors recommend that TPODs be randomly
assigned to mooring locations, and that they are systematically rotated through all
locations through the course of an assessment. This would enable a TPOD identification
code to be incorporated as a covariant when modelling variation in detection rate.
4.4.3 Daily occurrence of harbour porpoise at the two Welsh study sites was high; porpoises
were recorded at the Skerries and Ramsey Sound on every day (and night) of the study.
Overall, porpoises were present at each site least 1-2% of the time, but occurrence
varied markedly between adjacent TPOD locations. Daily DPM values of up to 10% were
recorded at the most highly used locations. From the levels of porpoise activity that were
recorded, it was concluded that both study sites included important habitat for harbour
porpoise as well as locations that were consistently used less often by this species.
4.4.4 At both sites TPODs were placed in the exact locations suggested for possible tidal
turbine deployments. At the Skerries, the TPODs closest to the proposed turbine sites,
T468 and T465, showed some of the highest detection rates. In contrast, at Ramsey
JER3688 Welsh Assembly Government Planning & Development 28th March 2011
67
Studies of Marine Mammals in Welsh High Tidal Waters
Sound T440, located directly in the vicinity of a site proposed for a tidal turbine, the
lowest frequency of detection for harbour porpoises was recorded on 56% of the days
over a 41-day deployment, and porpoises were recorded on average, in less than 0.1%
of effort minutes per day. The present data therefore indicate that the likelihood of direct
encounter risk for harbour porpoises would probably be less here, than at the four other
locations monitored in Ramsey Sound.
4.4.5 The levels of nocturnal activity at most locations were substantially higher than they
were during daylight hours. Visual assessment would therefore have considerably
underestimated the relative importance of some locations. It was unclear why porpoise
echolocation activity was generally higher at night. This may have reflected a greater
abundance of animals, elevated click rates associated with intense periods of feeding, or
both these factors. DPM is however, relatively insensitive to changes in echolocation
click rate; a single animal or click train is sufficient to trigger a DPM. This indicator more
closely reflects porpoise occurrence therefore, than the total number of echolocation
clicks produced; higher DPM values indicating that porpoises were present in the vicinity
of the TPOD for a greater proportion of the monitoring period. Harbour porpoise
echolocate habitually and almost continuously (Verfuβ et al., 2005). Prolonged periods
of silence by porpoises at these locations during daylight would therefore have been an
unlikely cause of the observed difference in diel detection rates.
4.4.6 In conclusion, it was apparent from these studies that harbour porpoises tended to visit
and occupy certain locations far more frequently at night than during the day, although
the cause of this is unclear. A possible explanation may be that foraging intensified at
these locations at night, either because a higher density of prey were present or
because there was more opportunity for prey capture (e.g. if prey emerged from refuges
to feed at night). This pattern was not seen universally however. The location at which
the highest levels of porpoise detection were recorded at the Skerries, T468 showed the
opposite pattern. It was the only location where DPM was significantly higher during the
day than at night. This inconsistency between locations may illustrate that harbour
porpoise exploit diverse locations throughout 24 h, in response to changing
concentrations of prey.
4.4.7 Little is known about prey species or prey density at either of our study sites, but the
availability of some known prey species (e.g. herring or sandeel; Santos and Pierce,
2003; Santos et al., 2004) may increase at night, either because they shelter from
predators during the day or because they respond to their own planktonic or nektonic
prey, which rise in the water column at night (Blaxter and Holliday, 1969; Blaxter and
JER3688 Welsh Assembly Government Planning & Development 28th March 2011
68
Studies of Marine Mammals in Welsh High Tidal Waters
Batty, 1987; Cardinale et al., 2003). Pierpoint et al. (2000) speculated that the onset of
high levels of porpoise activity in Newport Bay (Pembrokeshire) at night late in the year
coincided with the arrival of a local spawning stock of herring. Similarly, Todd et al.
(2009) reported that most porpoise encounters within a complex of North Sea gas
exploration and production platforms occurred at night, when an increase in the rate at
which feeding “buzzes” were recorded, suggested that porpoises approached the
platforms to feed.
4.4.8 Alternatively, porpoises may have avoided the study sites during the day, having been
displaced for example, by high levels of boat disturbance. Levels of tourist boat traffic in
Ramsey Sound are relatively high during the summer and a code of conduct for boat
users has been established specifically to reduce the risk of colliding with or disturbing
harbour porpoises (http://www.pembrokeshiremarinecode.org.uk/code%20conduct.htm).
Raised levels of nocturnal activity have been noted elsewhere however, at sites that
experience relatively little boat traffic during the day (Pierpoint et al., 2000). In the
present study, two open water and relatively quiet sites at the Skerries also attracted
higher levels of porpoise activity during the night than during the day. Clearly, further
study is required to determine whether prey availability is greater at these locations at
night, and/or whether boat traffic is a contributory factor that explains the difference in
levels of porpoise activity at some locations during the night and day.
4.4.9 Regular patterns of activity that correlated with the state of tide or the direction of tidal
currents were also noted. Tidally-related behavioural patterns at Ramsey Sound were in
accordance with previous studies that monitored porpoises by visual observation
(Pierpoint, 2009; Barradell, 2009). The use of automated data-loggers enabled us to
determine that these tidal patterns extended into and throughout the night also, and
were superimposed upon tendencies for day-night differences in activity at some sites.
Again, the study results showed marked variation between different locations within
each study site however, at some locations porpoise activity was evenly distributed
throughout all states of tide. Elsewhere, some locations only appeared to represent
important habitat for harbour porpoise at certain stages of tide. It was evident that the
most distinct diel and tidal patterns of activity were recorded at the locations used most
by porpoises overall, arguably their most important locations. This may lend support to
the concept that coastal tidal race habitat is often important for harbour porpoises
because of physical factors that cause a consistent and periodic concentration of
resources. Pierpoint (2009) hypothesised that the striking periodicity of harbour porpoise
occurrence in the southern part of Ramsey Sound was due to the exploitation of prey
JER3688 Welsh Assembly Government Planning & Development 28th March 2011
69
Studies of Marine Mammals in Welsh High Tidal Waters
that was concentrated by the south-setting ebb tide on steep, seabed and coastal
topography.
4.4.10 These data facilitate our interpretation of land-based or ship-based counts of harbour
porpoise. Specific locations may provide important habitat for harbour porpoise and
support numbers of foraging animals only at certain stages of tide. At locations with
strong tidally-related patterns of activity, harbour porpoise activity is likely to be higher at
peak periods during the night than is recorded by sighting surveys during the day. It is
clear that for site assessment purposes, harbour porpoises should be monitored
throughout the day and night, and throughout the ebb-flood tidal cycle. Longer-term
TPOD deployments would be a suitable method of addressing spring-neap, seasonal
and inter-annual variation. Currently, static acoustic data-loggers including the TPOD,
that provide the ability to monitor harbour porpoise activity automatically and
continuously for extended periods, are fundamental to the thorough assessment of
specific sites. The data they yield however invariably raise a host of additional questions
regarding the ecology of the UK’s most common species of marine mammal.
JER3688 Welsh Assembly Government Planning & Development 28th March 2011
70

Studies of Marine Mammals in Welsh High Tidal Waters
5 Using a Vertical Array to Investigate use of the Water Column by Harbour Porpoise in High Tidal Areas
5.1 Introduction
5.1.1 Knowledge of the distribution of marine mammals in three dimensions is crucial to
assessing and minimising collision risk. In recent years, understanding of the underwater
behaviour of cetaceans has increased, mainly as a result of studies using telemetry.
Telemetry studies of harbour porpoises have typically involved animals that were
released after becoming entrapped in fishing structures such as herring weirs (Otani et
al., 2000; Read and Westgate, 1997; Westgate et al., 1995; Sveegaard and Teilmann,
2007). Consequently, these studies have been limited to areas where these types of
fishing devices are employed, chiefly the Bay of Fundy in Canada and Danish Baltic
waters. Telemetry studies have provided some information on the diving behaviour of
porpoises. On occasion they can make very deep dives, for example, Westgate et al.
(2007) reported dives of over 200 m. However, few if any of these data have come from
high tidal energy areas. Because these areas are such a small part of the available
habitat for marine mammals it is unlikely that any tagged animal will spend a substantial
proportion of its time in them. In addition, because these habitats are so extreme and
unusual, there is no basis for inferring behaviour in tidal rapids by extrapolation using
data recorded elsewhere.
5.1.2 What is therefore required is a method that has the potential for providing data on the
underwater behaviour of harbour porpoises that can be taken to and operated in areas
of high tidal energy at times of peak current. The relative time of arrival of sounds, such
as porpoise clicks, at an array of hydrophones can provide information on the location of
the sound source. A linear array of hydrophones suspended vertically in the water is
both relatively easy to deploy in the field and able to provide information on the range
and depth of vocalising animals (Cato, 1998). This technique has been used before to
investigate the diving behaviour of cetaceans. For example, Hastie et al. (2006)
measured the dive behaviour of bottlenose dolphins using a vertical array. The particular
challenge that needed to be overcome in this study was to apply the techniques in
extreme tidal currents; maintaining the vertical alignment of the array and making
multichannel recordings and measurements at the high ultrasonic frequencies produced
by harbour porpoises.
JER3688 Welsh Assembly Government Planning & Development 28th March 2011
71
Studies of Marine Mammals in Welsh High Tidal Waters
5.1.3 Note: We were able to conduct additional work carrying out a calibration trial to show
accuracy of depth and range measurement and developing an improved analysis
approach after the main report was completed. This work is presented as Appendix 2.
5.2 Methods
Equipment
5.2.1 The vertical array used in this project comprised two stereo pairs of hydrophones (sub
array) that could be deployed at different depths along a heavily weighted steel crane
cable (Figure 5-1). Hydrophones in each sub array were separated by 25 cm and each
pair was mounted in a weighted rigid plastic tube suspended within a larger (200 mm
diameter) free-flooding polythene pipe. These polythene pipes were attached to the
crane cable at the desired depths. This arrangement allowed each sub array to hang like
a pendulum within the polythene tube. As the larger tube isolated the hydrophones from
water movement each sub array hung perfectly vertically. Inclinometers at the top and
the bottom of the steel cable were used to measure the cable’s deflection. The
inclinometers’ output (x and y angles relative to vertical) were transmitted as RS232
sentences which were read continuously and stored using a Labview program written by
one of the team (JM).
JER3688 Welsh Assembly Government Planning & Development 28th March 2011
72

Studies of Marine Mammals in Welsh High Tidal Waters
JER3688 Welsh Assembly Government Planning & Development 28th March 2011
73
Hydrophone element
Hydrophone element
Lead Weight
Oil-filled rigid plastic tube
Free-flooding polythene tube
Steel Cable Ship’s Crane and Winch
Upper Polythene Tube Pod containing hydrophone pair (5m)
Lower Polythene Tube Pod containing hydrophone pair (20m)
200kg clump weight
Hydrophone Cable
Inclinometer
Inclinometer
Figure 5-1 Diagram of a four element vertical array for determining the depth of
porpoise vocalisations.
5.2.2 Signals from each sub array were amplified and processed by a Magrec HP27 ST
amplifier/conditioner unit and filtered with a 20 kHz high pass filter before being digitised.
Capturing porpoise signals from this array required digitisation of four channels at 500
kHz each. This was achieved by using two synchronised National Instruments 6251
USB DAQ devices. Software to achieve this synchronisation was written specifically for
this project by Douglas Gillespie and implemented in the PAMGUARD acoustic
monitoring program6 where it is now universally available.
6 PAMGUART is an open source software suite freely available at http://www.pamguard.org/home.shtml

Studies of Marine Mammals in Welsh High Tidal Waters
Data analysis
5.2.3 These recordings were then analysed with PAMGUARD with each “pendulum” pair in
the hydrophone array being treated as a pair of channels. The click detection algorithm
in PAMGUARD is identical to that in the RainbowClick software used to detect porpoise
clicks during towed hydrophone surveys. Short sections of the wav files (around each
candidate porpoise click detection) were extracted and used for further analysis using
Matlab.
5.2.4 Sections where porpoise clicks were detected on all four channels within the travel time
for sound between the two most distant hydrophones (~19 m at 1500 m/sec) were
selected for further locational analysis. (Clicks detected on channels with a greater time
separation than this could not have arrived directly from the same source).
5.2.5 Time delays were calculated between the clicks detected on all channels (six possible
time delays in total) using cross correlation of the click waveforms which had been band
pass filtered between 100 to 150 kHz to reduce noise.
5.2.6 The array was assumed to be vertical in the water column and the location of the
hydrophones was taken from field notes.
5.2.7 A two dimensional (range and depth) fit of the location of the source for each click was
determined using a maximum likelihood estimator where )|,(ˆmaxarg idDRλ
2
,
,,5.0)|,(ˆ ∏≠
⎟⎟⎠
⎞⎜⎜⎝
⎛ −=
ji ji
jijii t
tddDR
δλ
5.2.8 Where R and D are the range and depth of the animal clicking, di are the measured time
delays, ti are the calculated time delays for the given array geometry and the position
(R,D) and δt are the estimates of the errors on the calculated time delays based on
estimates of the accuracy of the hydrophone elements’ positions within the array and the
accuracy of the speed of sound measurement.
Array position errors
5.2.9 The most significant source of acoustic positioning error is likely to be from errors in the
position of the individual hydrophones within the array. The boat was drifting freely with
the current while recordings were being made but movement of the vessel relative to the
water, due to the effects of wind for example, would have occurred and the cable may
also have been deflected by the influence of differential current speeds at different
JER3688 Welsh Assembly Government Planning & Development 28th March 2011
74
Studies of Marine Mammals in Welsh High Tidal Waters
depths in the water column. Such errors are currently estimated based on likely
construction tolerances, observations of how much the array seemed to be off vertical in
the field and a preliminary examination of inclinometer data (e.g. see Figure 5-3).
5.2.10 Clearly, errors between elements within each sub array are likely to be a lot smaller than
the errors between elements in different sub arrays. Two sets of errors are therefore
used (each in x,y,z coordinates). Firstly an error on element coordinates within each sub
array, and secondly errors on the overall alignment of each sub array. When estimating
time delay for elements in the same sub array, only the first errors are used. For errors
between elements in different sub arrays the two types of error are added in quadrature.
5.2.11 For this analysis, standard errors within each sub array were assumed to be ±1 cm in
each coordinate. Based on inclinometer data and an estimate of depth accuracy,
between sub arrays, errors were assumed to be ±2 m in the x and y (horizontal)
coordinates and ±0.5 m in depth. The error in the speed of sound was taken as ±2 m.s1.
Timing error estimation
5.2.12 If the position of each hydrophone element is represented by vectors ai and a,j between
two hydrophone elements i and j, and b is the position of the vocalising animal, then the
expected time delay jit ,δ is simply c
ababt
ijji
−−−=,δ where c is the speed of sound
in seawater.
5.2.13 To estimate the error on the time delay measurement, it is first assessed whether or not
the elements i and j are in the same sub array. If they are not, then the three error
components for the element are added in quadrature to the three error components for
the sub array containing each element. The magnitude of these three error components
along the unit vector b-a, is then taken and the three error components added in
quadrature and divided by the speed of sound to generate an overall error for the
propagation time from the animal to each element. The total error due to inaccuracies in
element position is then the sum in quadrature of the time errors to each element.
5.2.14 An additional timing error due to uncertainties in the speed of sound is then taken as
cct jiδδ , and this is in turn added in quadrature to the timing error due to array alignment.
JER3688 Welsh Assembly Government Planning & Development 28th March 2011
75

Studies of Marine Mammals in Welsh High Tidal Waters
Position estimation
5.2.15 Positions were estimated using the Matlab function lsqnonlin to obtain the position (R,D)
from the maximum of equation 1. Position errors were then estimated from the curvature
of the likelihood function to either side of the maximum value. A typical likelihood surface
is shown in Figure 5-2, showing detections with a depth estimate of 9 m and a range of
150 m.
0200
400600
0102030-10
-9
-8
-7
-6
-5
-4
-3
-2
-1
0
x (m)depth (m)
log
likel
ihoo
d
Figure 5-2 Example plot of likelihood against depth and range (x) for a porpoise click
recorded on the vertical array.
5.3 Results
5.3.1 After some preliminary experimentation and trouble-shooting an effective system for
deploying the vertical array from the vessel while drifting in strong tidal currents was
devised. Drifts often had to be terminated to reposition the vessel into deep water or to
avoid obstacles but some long drifts were also achieved. During drifts, a full complement
JER3688 Welsh Assembly Government Planning & Development 28th March 2011
76

Studies of Marine Mammals in Welsh High Tidal Waters
of visual observers was maintained and the location of any porpoises observed
recorded. Inclinometer data indicated that the weighted cable was usually within 5° of
the vertical during drift recordings (Figure 5-3).
Figure 5-3 Plot of typical inclinometer data showing angle from vertical in degrees of
the crane wire at the location of the bottom hydrophone pair (red dots) and the top of
the cable above water (blue dots). Samples are 0.2 seconds apart.
5.3.2 Figure 5-4 shows vessel tracks during drift recordings with the vertical array at both
Skerries and Ramsey Sound. Some 213 GB of recordings (approximately 15 h) were
collected.
JER3688 Welsh Assembly Government Planning & Development 28th March 2011
77

Studies of Marine Mammals in Welsh High Tidal Waters
Figure 5-4 Tracks of vessel while making drift recordings with vertical line array. Inset
shows tracks in Ramsey Sound.
5.3.3 A total of 1048 click pairs, identified as harbour porpoise close enough in time on the two
channel pairs to constitute a possible match (e.g. Figure 5-5) were identified. Of these, a
solution was found and a location calculated in 635 cases.
JER3688 Welsh Assembly Government Planning & Development 28th March 2011
78

Studies of Marine Mammals in Welsh High Tidal Waters
Figure 5-5 Porpoise click waveforms recorded on four channels from the vertical
array.
5.3.4 Positional accuracy varied greatly and as would be expected, accuracy decreased
rapidly further from the array (Figure 5-6). As a general rule, it is unrealistic to track
animals which at a distance of more than about 5 times the array dimension. The array
dimension in this study was about 15 m. We have therefore restricted depth data to that
from animals localised to within 100 m of the array.
JER3688 Welsh Assembly Government Planning & Development 28th March 2011
79

Studies of Marine Mammals in Welsh High Tidal Waters
Figure 5-6 Errors on range and depth measurements as a function of range. It can be
seen that the error on the range estimation is considerably greater than the error on the
depth estimation. This is a direct result of the vertical array geometry employed.
5.3.5 Figure 5.7 shows the depth and range to clicks that were localised within 100 m of the
array. Blue vertical lines are drawn between clicks separated by > 60 seconds
(indicating that clicks between blue lines may be from the same animal). In many cases,
sequences of depths and ranges are roughly aligned forming gradually changing
“tracks”, as one would expect to see from a vocalising animal moving through the water
column. It is noteworthy, and encouraging, that no locations placed porpoises above the
water’s surface.
JER3688 Welsh Assembly Government Planning & Development 28th March 2011
80

Studies of Marine Mammals in Welsh High Tidal Waters
0 10 20 30 40 50 60 70 80 90 100-100
-80
-60
-40
-20
0
20
08/05 08/11 08/12 08/22
Click Number
Clic
k D
epth
(m
)
0 10 20 30 40 50 60 70 80 90 1000
20
40
60
80
100
120
08/05 08/11 08/12 08/22
Click Number
Clic
k R
ange
(m
)
Figure 5-7 Depth(top panel) and range (bottom panel) for clicks localised within 100m
of the array. Vertical blue lines show breaks between clicks separated by>60 seconds.
Clicks between lines are likely to be from the same individual or group.
5.3.6 Figure 5-8 shows the distribution of clicks with depth shown as histograms for all clicks
closer than 100 m and for clicks closer than 50 m (the closer clicks being more
accurately tracked). It can be seen that click locations are distributed between 0 and 45
m depth in the water column. The higher number of clicks at depths between 20 and 35
m may be indicative of porpoises spending time foraging at the bottom, as has been
reported by other studies. The small number of clicks between 50 and 100 m from the
array which were tracked to small negative depths is consistent with the estimated error
on these locations.
JER3688 Welsh Assembly Government Planning & Development 28th March 2011
81

Studies of Marine Mammals in Welsh High Tidal Waters
Figure 5-8 Distribution of depths at which porpoise clicks were located.
5.4 Discussion
5.4.1 This is a new and somewhat novel technique and consequently a substantial amount of
development and new programming has been required. At the instigation of this project
this method seemed to be one of the few capable of delivering information on use of the
water column, which is very important in assessing and minimising collision.
Consequently, although it was technically risky, the authors believed it was worth
developing and exploring, but, as there could have no confidence that the method would
be successful and yield useful data, it was not appropriate to budget large amounts of
time for analysis or to collect a very extensive field dataset. Thus, at this stage an
assessment of the technique’s potential and accuracy is provided, together with some
preliminary results.
5.4.2 This method can provide information on the distribution of depths at which porpoises
vocalise in areas of high tidal current. The location of single clicks can be measured with
a useful accuracy even when array configuration errors towards the upper end of those
JER3688 Welsh Assembly Government Planning & Development 28th March 2011
82
Studies of Marine Mammals in Welsh High Tidal Waters
measured are assumed. It is likely that location accuracy can be improved if inclinometer
data are used to provide better information on the location of hydrophones. It is also
possible that precision can be improved by fitting tracks to sequences of clicks likely to
come from the same individual animal. Animals can only be located with this method
when they produce sound, thus these data really show the depths at which they vocalise
rather than the probability that that they are at a particular depth. Porpoises seem to
vocalise frequently during normal swimming behaviour (Akamatsu et al., 2005).
However, some biases could result. More representative and complete data on dives
might be derived by fitting a movement model to patterns of acoustically derived
locations to reconstruct likely dive behaviour. The characteristics of echolocation
vocalisations can provide information on other aspects of an animal’s behaviour
underwater. For example, rapid “buzz” locations are often made when animals are
foraging (Kyhn et al., 2009). Putting these insights together with an ability to track the
location of animals underwater should provide more detailed information on the use
porpoises are making of these areas.
5.5 Further research
5.5.1 Given the available time during this study for this experimental technique, it is
considered that some useful progress has been made, on what was in effect a feasibility
study. Additional analysis could be undertaken with the existing recordings, mainly to
explore methodological issues, including making better use of the inclinometer data.
Initial further data analysis has been undertaken since this report was initially drafted,
and this information is included in Appendix 2 of this report.
5.5.2 Given the encouraging results reported here, we feel confident that using this approach
to collect additional field data would yield a more complete and useful dataset showing
the depth distributions of porpoises in areas with high tidal currents.
JER3688 Welsh Assembly Government Planning & Development 28th March 2011
83

Studies of Marine Mammals in Welsh High Tidal Waters
6 Shore Based Observations to Investigate Aspects of Harbour Porpoise Ecology in High Tidal Areas
6.1 Introduction
6.1.1 Areas of water close to shore can be observed by land based observers. Because no
dedicated platform is involved this can be a cost effective data collection method and
there should be no concerns about responsive movements and disturbance. The
technique has often been used to monitor high tidal current areas but it is not without its
issues. Clearly, only areas close to shore can be monitored in this way. There are also
severe methodological difficulties in determining effective ranges, sightings functions
and detection probabilities and as in many visual methods, fixing the location of
sightings accurately and efficiently is a challenge. Our intention in this part of the project
was to both collect useful field data and to explore some methodological improvements.
6.2 Methods
Estimating detection probability in relation to distance from observer
6.2.1 Line transect surveys from vessels usually estimate the change in detection probability
with perpendicular distance from the vessel track. In the absence of any response to the
vessel it can be assumed that the density of animals will be independent of distance
from the trackline. Thus the frequency distribution of detections as a function of
perpendicular distance also indicates the relative detection probability. Estimating the
absolute detection probability usually involves calculating this relative detection function
from the distribution of observed distances and scaling this according to the estimated
detection probability for an animal directly on the trackline (often called g(0)).
6.2.2 Shore based observations from a fixed point are more similar to point transects but the
assumption that animal density is independent of distance from the observation point is
unlikely to be met. Thus, it is generally not possible to derive a detection function based
on observed radial distances. However, knowing the way in which detection probability
varies with distance is critical for interpreting observed distribution patterns. The
probability that an animal will be detected is also a function of the length of time that it
spends within the area.
JER3688 Welsh Assembly Government Planning & Development 28th March 2011
84

Studies of Marine Mammals in Welsh High Tidal Waters
6.2.3 An alternative method for estimating detection probability from shore based observations
is to use two independent observers in a similar way to independent observer
experiments on vessel surveys to estimate g(0). This method on vessels uses the
proportion of detections that are made by one or both observers to estimate detection
probability directly on the track line. For this project we adapted the method to try and
estimate detection probability from a fixed observation point. For vessel based surveys
the aim is usually to estimate the detection probability for an animal that may make
multiple surfacings as it passes the vessel at a certain perpendicular distance. For shore
based observations of harbour porpoise it is often difficult to know whether successive
surfacings are from the same individual. Hence estimating a detection probability for an
animal is problematic. In addition this will depend on how long the animal spends in the
area. A more straightforward approach is to use cue counting type methods where the
number of porpoise surfacings in a given area in a given time is used as the index of
density and the probability of detecting an individual surfacing is estimated.
6.2.4 The visual boat based methods used in this study were based on those developed for
the SCANSII survey used independent ‘Primary’ and ‘Tracker’ observers to conduct
Mark-Recapture Distance Sampling. For shore based observations this study used a
modification of this approach to try and estimate detection probability for porpoise
surfacings as a function of radial distance.
Methods for two independent shore-based observers
6.2.5 Accurate time and location information for porpoise surfacings from both observers is
critical for assigning whether these are duplicates sightings of the same individual. When
several animals are in the area, surfacings will occur at a rate that is not practicable to
write down or enter directly into a computer. Data entry would also require an additional
observer or for the observers to stop watching in order to enter data. Video systems can
overcome these problems by recording a full audio commentary alongside video images
that can be used to measure location.
6.2.6 For this study, both observers were equipped with the same video system and a
downward facing still digital camera was used to measure bearings. Instead of using
reference marks on the deck of the vessel, a reference stick was placed by each
observer’s feet and fixed to the ground. The observer’s location was recorded using a
GPS and remained the same each day within the study area. The video camera was
then pointed at a landmark at a known location and bearing images of the reference
mark taken in order to provide a correction relative to True North. An additional
JER3688 Welsh Assembly Government Planning & Development 28th March 2011
85

Studies of Marine Mammals in Welsh High Tidal Waters
reference mark was selected as a calibration target. This was chosen such that it filled
the frame with the lens on full zoom. The video camera had previously been calibrated
to measure the angle per pixel on the image with the lens at full zoom. Whenever the
zoom settings were changed in order to track animals closer to the observer the lens
was recalibrated against the target by recording images that could then be measured
using the analysis software.
6.2.7 For each observation session one observer was designated as the ‘Tracker’ and the
other as a ‘Scanner’. The role of the Tracker was to search for individuals or groups and
then track these for as long as possible recording each surfacing. This would create a
set of trials of surfacing events that either would or would not be detected by the
Scanner. The Scanner was instructed to scan steadily using binoculars across the whole
area of interest. A complete scan was designed to take 15 minutes and a beeper was
set to go off every two minutes to give the Scanner a reference to try and maintain an
even scan rate. When the Scanner detected an animal they remained looking at it for
long enough to capture the location of the surfacing, species identification and assess
group size but resumed the systematic scanning as soon as possible.
6.2.8 In addition to examining distribution patterns, one of the objectives of the study was to
examine movement patterns of porpoises as potential input to risk models in the vicinity
of turbines. The Tracker data was designed to also fulfil this role by obtaining tracks for
as long as possible of movements of individuals and groups.
Field work
Carmel Head, Anglesey
6.2.9 Land-based surveys were conducted from a fixed-point on the cliffs at Carmel Head,
Anglesey, opposite the Skerries (Figure 6-1) during the period 25th July 2009 to 11th
August 2009. In total, eight surveying sessions were completed here, some of which
had to be curtailed due to adverse weather conditions. These are summarised in Table
6-1.
JER3688 Welsh Assembly Government Planning & Development 28th March 2011
86
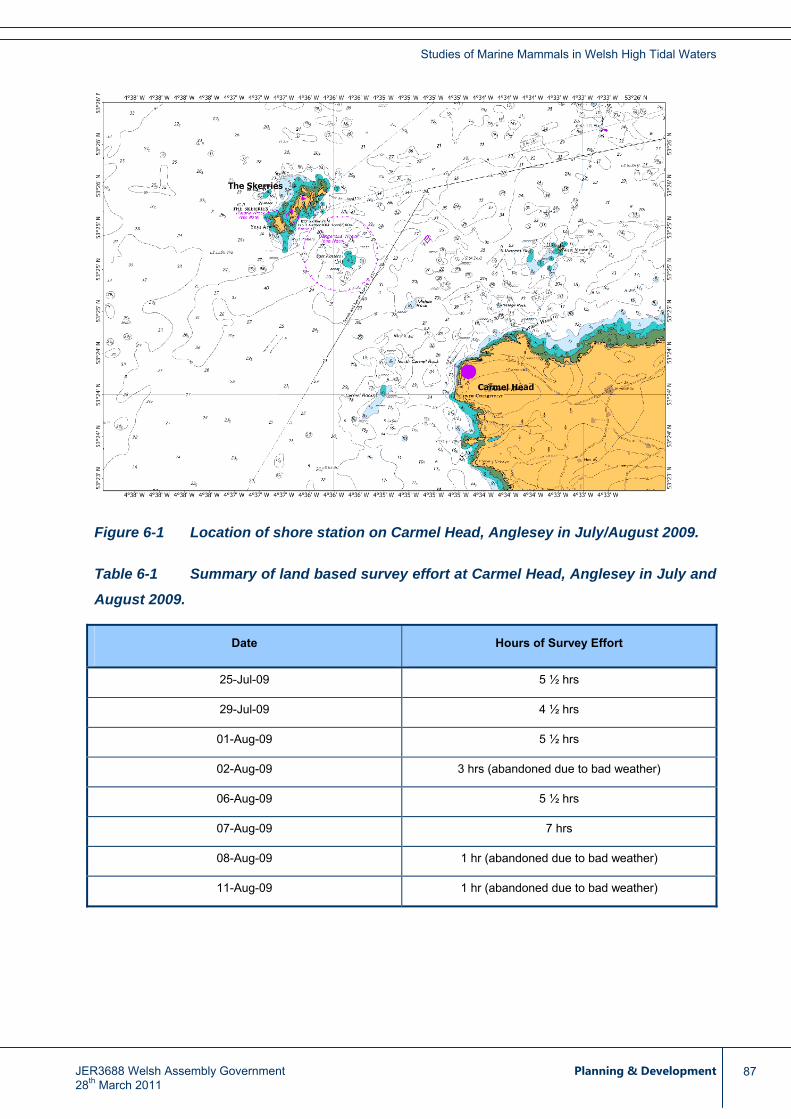
Studies of Marine Mammals in Welsh High Tidal Waters
Figure 6-1 Location of shore station on Carmel Head, Anglesey in July/August 2009.
Table 6-1 Summary of land based survey effort at Carmel Head, Anglesey in July and
August 2009.
Date Hours of Survey Effort
25-Jul-09 5 ½ hrs
29-Jul-09 4 ½ hrs
01-Aug-09 5 ½ hrs
02-Aug-09 3 hrs (abandoned due to bad weather)
06-Aug-09 5 ½ hrs
07-Aug-09 7 hrs
08-Aug-09 1 hr (abandoned due to bad weather)
11-Aug-09 1 hr (abandoned due to bad weather)
JER3688 Welsh Assembly Government Planning & Development 28th March 2011
87

Studies of Marine Mammals in Welsh High Tidal Waters
Ramsey Sound, Pembrokeshire
6.2.10 Dedicated shore-based visual surveys were conducted in Ramsey Sound between 3rd
September 2009 and 18th September 2009 by the same observers that had completed
most of the effort in Anglesey. Two shore stations overlooking the Sound were utilised
and these are shown in Figure 6-2. Survey effort is summarised in Table 6-2.
Figure 6-2 Locations of two shore stations overlooking Ramsey Sound used in
September 2009.
JER3688 Welsh Assembly Government Planning & Development 28th March 2011
88
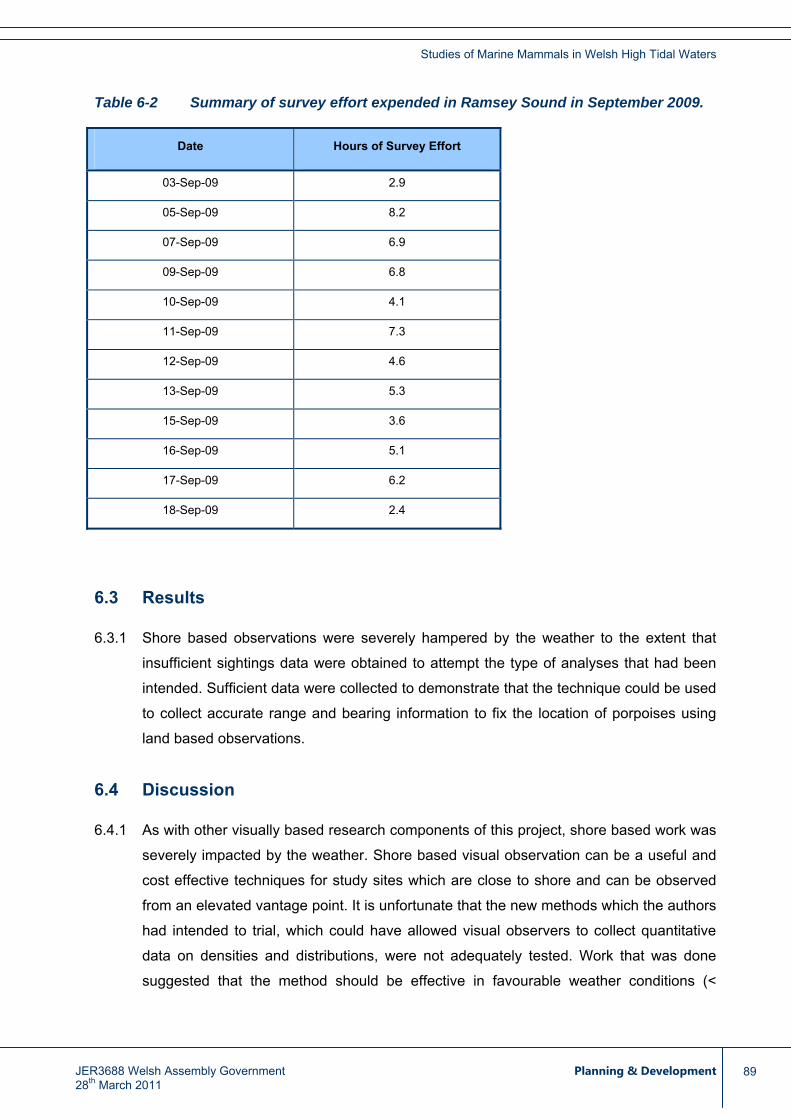
Studies of Marine Mammals in Welsh High Tidal Waters
Table 6-2 Summary of survey effort expended in Ramsey Sound in September 2009.
Date Hours of Survey Effort
03-Sep-09 2.9
05-Sep-09 8.2
07-Sep-09 6.9
09-Sep-09 6.8
10-Sep-09 4.1
11-Sep-09 7.3
12-Sep-09 4.6
13-Sep-09 5.3
15-Sep-09 3.6
16-Sep-09 5.1
17-Sep-09 6.2
18-Sep-09 2.4
6.3 Results
6.3.1 Shore based observations were severely hampered by the weather to the extent that
insufficient sightings data were obtained to attempt the type of analyses that had been
intended. Sufficient data were collected to demonstrate that the technique could be used
to collect accurate range and bearing information to fix the location of porpoises using
land based observations.
6.4 Discussion
6.4.1 As with other visually based research components of this project, shore based work was
severely impacted by the weather. Shore based visual observation can be a useful and
cost effective techniques for study sites which are close to shore and can be observed
from an elevated vantage point. It is unfortunate that the new methods which the authors
had intended to trial, which could have allowed visual observers to collect quantitative
data on densities and distributions, were not adequately tested. Work that was done
suggested that the method should be effective in favourable weather conditions (<
JER3688 Welsh Assembly Government Planning & Development 28th March 2011
89

Studies of Marine Mammals in Welsh High Tidal Waters
Beaufort 2). Some methodological issues were raised and these were addressed by a
short development project which is presented in following section.
6.5 Further research
Experimental shore based movement tracking using a digital SLR camera
Methods
6.5.1 The video tracking systems was originally developed for use on ships where the
observation height is relatively low (typically 10-12 m) resulting in a small angle of dip
between the animal and the horizon. This allowed the use of long focal length lenses to
improve image quality while still capturing both the animal and the horizon in the image.
This becomes more difficult from higher observation positions where a wider field of view
is required, resulting in animals being very difficult to detect on video images. Alternative
trials were conducted with a digital SLR camera (Canon EOS 400D equipped with a 55-
250 mm lens). The advantage of this camera is the much higher resolution of the images
(3888x2592 pixels) resulting in approximately 5 times more information in each image
than high resolution video. Another advantage of the stills camera is that the focal length
of the lens was recorded for each image within the image file details. The main
disadvantage is that there is no image buffer so the photographer has to capture the
porpoise surfacing event. The system is unlikely to work for surveys where capturing the
initial sighting is crucial but was tested for shore based tracking during periods of
weather which were too poor for the vessel to leave harbour. Provided that it is possible
to capture images containing the surfacing animal, the horizon and some fixed feature
such as distant land, rocks or buoys at the surface, then the only equipment required for
tracking is a digital SLR and hand-held GPS. Measurements are taken from still images
using the angle of dip to the horizon and horizontal angle to a known reference point
(Figure 6-3). A calibration test was performed on a fixed target to check that the focal
lengths recorded in the images Exif data were accurate. These results are shown Figure
6-4 and would appear adequate for the type of measurements being made.
JER3688 Welsh Assembly Government Planning & Development 28th March 2011
90

Studies of Marine Mammals in Welsh High Tidal Waters
Figure 6-3 Measurements taken from a still image to locate a surfacing harbour
porpoise.
Figure 6-4 Recorded focal length of Canon EF-S 55-250 mm zoom lens against
measured size of a fixed object in pixels on image.
JER3688 Welsh Assembly Government Planning & Development 28th March 2011
91

Studies of Marine Mammals in Welsh High Tidal Waters
6.5.2 Porpoises were sighted regularly off Pen Anglas which is close to Fishguard Harbour
(where the vessel sheltered in poor weather) and is also well sheltered from south-south
westerly winds. It is an area of strong tidal currents producing a substantial tidal race at
certain times of the tide. An observation point was chosen at a height of 27 m above sea
level at looking north towards distant land marks which could also be captured on the
images. Where the land was closer than the horizon a correction was made based on
the distance to the land and the observation height. The observation height was
measured as the median height over a two hour period from a hand-held GPS (Garmin
76) above mean sea level with a correction for predicted tidal height.
Results
6.5.3 Porpoises were observed in suitable locations for tracking for around one and a half
hours on 20th August 2009. During this period 32 images were captured with adequate
information to determine surfacing locations. In general, it proved possible to photograph
most surfacings once a porpoise had been observed for a few minutes. However, it was
never possible to capture the initial sighting. The distribution of radial distances is shown
in Figure 6-5 and all surfacing locations are plotted in Figure 6-6.
Figure 6-5 Frequency of observed distances to surfacing porpoises from Pen Anglas
(Fishguard) observation height 27 m.
JER3688 Welsh Assembly Government Planning & Development 28th March 2011
92

Studies of Marine Mammals in Welsh High Tidal Waters
Figure 6-6 Locations of all surfacings of porpoises captured on still images, (x,y) co-
ordinates are relative to observation position.
6.5.4 The longest track for which the observer was confident of following a single individual
involved 8 surfacings over a period of 187 seconds. The average of the travel speeds
between successive locations was 0.92m.s1 (SD 0.42). A total of 18 successive
locations were suitable for calculating travel speeds with an overall mean travel speed of
0.97m.s1 (SD 0.43).
Discussion
6.5.5 The use of a digital SLR camera proved to be a simple way of obtaining tracks of
porpoises with minimal equipment. The system is only useable under certain situations
where porpoises can be photographed against a suitable background. Where relative
locations are obtained these are potentially very accurate (to within a fraction of one
degree) because bearing information is measured directly from fixed points on the same
image as the animal. By contrast the narrower field of view of the video system generally
relies on measuring bearings using a separate still camera and reference marks, with
more scope for bearing error.
JER3688 Welsh Assembly Government Planning & Development 28th March 2011
93

Studies of Marine Mammals in Welsh High Tidal Waters
6.5.6 While an SLR camera cannot replace the full video and bearing camera set-up for
survey work there are situations where useful data can be obtained and the authors
would recommend shore teams being equipped with a suitable still camera to use as
opportunities arise.
JER3688 Welsh Assembly Government Planning & Development 28th March 2011
94

Studies of Marine Mammals in Welsh High Tidal Waters
7 Grey Seal Telemetry Study
7.1 Introduction
7.1.1 The Sea Mammal Research Unit (SMRU) was contracted to carry out a telemetry-based
study of the behaviour of grey seals at sea. The basic aims of the study were to track the
movements and record the diving and swimming behaviour of individual grey seals,
tagged at sites in Wales, and relate the observed behaviours to the potential for
interaction with future tidal turbine installations in Welsh coastal waters. Data collection
is ongoing, and only a brief summary is presented here. A further seven transmitters
were made available in 2010 and combined with five tags remaining from the 10
commissioned in 2009 and three refurbished tags retrieved during 2010. This allowed
10 tags to be deployed at Ramsey Sound and 5 tags at the Skerries in
October/November 2010. A complete analysis of the results from the combined 2009-
2011 data together with a re-analysis of the results from an earlier deployment of 19
ARGOS satellite transmitters on adult grey seals in 2004 will be presented in a final
report in summer 2011.
7.2 Methods
Telemetry system
7.2.1 An investigation of the scale of possible interactions with tidal turbine devices requires
information on the 3D movements of marine mammals. Seals are extremely hard to see
in open water, spend the majority of their time (>85%) submerged. They are effectively
silent for most of the time and therefore cannot be accurately tracked using either visual
or acoustic monitoring techniques (as used for harbour porpoise discussed in the
previous chapters). In addition, grey seals are known to make wide ranging movements
between distant foraging and haul-out areas making it impossible to study individuals
using any boat or land based monitoring method. In order to study the movement and
dive patterns of seals at an appropriately fine scale, we used recently developed GPS
Phone Tags, which combine GPS quality locations with efficient data transfer using the
international GSM mobile phone network (see Figure 7-1).
JER3688 Welsh Assembly Government Planning & Development 28th March 2011
95

Studies of Marine Mammals in Welsh High Tidal Waters
Figure 7-1 GPS Phone Tag
7.2.2 These tags provide GPS quality (usually better than 10 m accuracy) locations at a user-
controlled rate, together with complete and detailed individual dive and haul-out records.
They are small, weighing 370 g which is <1% of an average seal pup mass. Data are
relayed via a quad-band GSM mobile phone module when the animal is within GSM
coverage. This results in relatively low cost, high energy efficiency, high data bandwidth
and International roaming capability (including Ireland and France).
7.2.3 They incorporate a Fastloc GPS sensor that offers either the possibility of attempting a
location at every surfacing or as frequently as required. Less than a second is needed to
acquire the information required for a location. The tag also uses precision wet/dry,
pressure and temperature sensors to form detailed individual dive (max depth, shape,
time at depth, etc) and haul-out records along with temperature profiles and more
synoptic summary records. Both location and behavioural data are then stored in
memory for transmission when within GSM coverage.
7.2.4 For species such as grey seals that periodically come near shore – within GSM
coverage – the entire set of data records stored in the memory can be relayed via the
GSM mobile phone system. Visits ashore may be infrequent, so up to six months of data
can be stored on-board the tag and these data can also be downloaded directly if the tag
is retrieved.
7.2.5 A detailed description of the parameter settings in the data handling software is attached
as Appendix 3.
JER3688 Welsh Assembly Government Planning & Development 28th March 2011
96

Studies of Marine Mammals in Welsh High Tidal Waters
Timing of tagging and choice of study animals
7.2.6 Two age classes of seal had been initially identified as being of prime interest, newly
weaned pups and adult females. However, the project start date meant that there was
no opportunity to catch adult females before September. At this time females are
generally returning to their breeding sites and do not range widely. In addition, the period
of haul-out for breeding would mean that tags would not provide useful information for
around a month, during which time they would be subject to additional problems of
abrasion before being moulted off approximately one month later.
7.2.7 Grey seal pups are abandoned on land and therefore enter the water as completely
naïve animals with no experience of foraging and no established movement patterns.
Breeding sites in North Wales are either in caves or on small islands which are often
associated with strong tidal currents. Grey seal pups are therefore likely to be in areas of
potential interaction with tidal generators during what is likely to be a vulnerable phase of
their lives. After consultation with CCW, it was decided that the best strategy would be to
concentrate the tagging effort on pups during their initial time at sea, with no tags fitted
to adult females. For practical and logistical reasons, it was further decided that the
tagging effort in 2009 should be concentrated in the vicinity of the Skerries, off Anglesey.
In 2010 tags were also applied in Ramsey Sound.
7.2.8 For comparison, there is an existing dataset of tracking data from older grey seals
collected in 2004-2005, which is described in Section 1.3.
Analysis of movement data
7.2.9 In 2009, only five out of the eventual total of twenty seals were tagged. One seal died
after 13 days at sea and one was ‘rescued’ after coming ashore in Cornwall after 62
days at sea. The three remaining devices continued to send location and dive data until
the time at which their batteries should have been exhausted in late spring. An additional
10 more tags have been deployed at Ramsey Sound and 5 tags at the Skerries in
October/November 2010. A comprehensive analysis of the movements, habitat use and
dive behaviour patterns with respect to location and tidal energy will be carried out
following the retrieval of data from these more recently deployed tags and data from
them is not discussed here (although initial outputs are from some of the tags).
7.2.10 Here we describe the analysis methods that will be applied to the complete datasets. We
then provide a brief, preliminary description of the movements of the first five pups in the
initial deployment and describe the initial results from the deployments in 2010.
JER3688 Welsh Assembly Government Planning & Development 28th March 2011
97

Studies of Marine Mammals in Welsh High Tidal Waters
7.2.11 Two levels of analysis will be applied to the movement and dive behaviour data. The
tracks of all seals will be examined in relation to locations of potential tidal turbine sites
to estimate the length of time spent within specified distances of sites and in areas of
strongest tidal energy. Dive behaviour data will provide a 3D picture of space use
throughout the tracking periods. At a wider population scale, we will generate space use
maps for juvenile grey seals for comparison with earlier adult seal space use analysis.
To date there are not sufficient data to allow us to estimate space use by juvenile grey
seals in Welsh waters. This analysis will be completed in 2011 when data from the
deployment of an additional fifteen devices in October/November 2010 will have
provided enough coverage to generate a space use map for juvenile seals in Welsh
waters. The methods used will be similar to those employed in producing space use
maps for older grey seals in 2004-05 described below.
7.2.12 Briefly, the space usage analysis will comprise two stages, described in Matthiopoulos
(2003a, b) and Matthiopoulos et al. (2004). The method uses telemetry data (in this
study from high resolution SMRU GPS transmitters; in 2004-05 using ARGOS system
locations from SMRU Satellite Relay Data Loggers), and estimates of the relative
numbers of animals using haul-out sites in the areas of interest. For previous
deployments the population data relate to counts at haul-out sites (as briefly described in
Section 1.3).
7.3 Results
Tagging
7.3.1 Based on observations of pup age classes during CCW field trips in early October, and
previous experience of the duration of lactation and post weaning fasting periods, a joint
SMRU and CCW team mobilised into the field in late October 2009. Far fewer seal pups
were present than had been expected, possibly as a consequence of the severe
weather throughout mid and late October. Known breeding sites between Anglesey and
Hells Mouth Bay were searched, including cave sites. In the event, just five pups of the
correct developmental stage and condition were located, i.e. pups that were fully
moulted (at least over the front half of the body), assumed to be weaned, greater than
37kg in mass and with no significant injuries. Of these five, three were found on the
Skerries off Holyhead. The search area was extended and the two additional pups of
suitable age and condition were found on Bardsey Island. All five pups were tagged on
22nd and 23rd October 2009.
JER3688 Welsh Assembly Government Planning & Development 28th March 2011
98

Studies of Marine Mammals in Welsh High Tidal Waters
JER3688 Welsh Assembly Government Planning & Development 28th March 2011
99
7.3.2 All animal handling and tagging methods are approved under SMRU’s Home Office
Licence. Standard transmitter attachment techniques were used. Briefly, seals were
caught on land and physically restrained. No anaesthesia was required and tags were
glued to cleaned, dried fur on the back of the neck using quickset Epoxy resin. Seals
were released and left at their capture site. One animal went briefly into the shallows
next to the beach, but hauled out again within a few minutes.
Preliminary tag data
7.3.3 Highly detailed movement and dive behaviour records have been received from all five
tagged seals. Almost complete records of location, diving depths and durations were
received from all five seals. Tracking periods lasted 234, 216, 183, 63 and 14 days.
The two shorter deployments were terminated when one of the seals died and one was
rescued. Continuous dive data were received for all five seals.
7.3.4 In order to receive data the tagged animals must spend some time in the vicinity of a
mobile phone receiver. As a result the data delivery is sporadic. However, when data
transmissions occur, a large amount of stored information may be sent. Figure 7-2 and
Figure 7-3 show the track data from all five tagged animals.
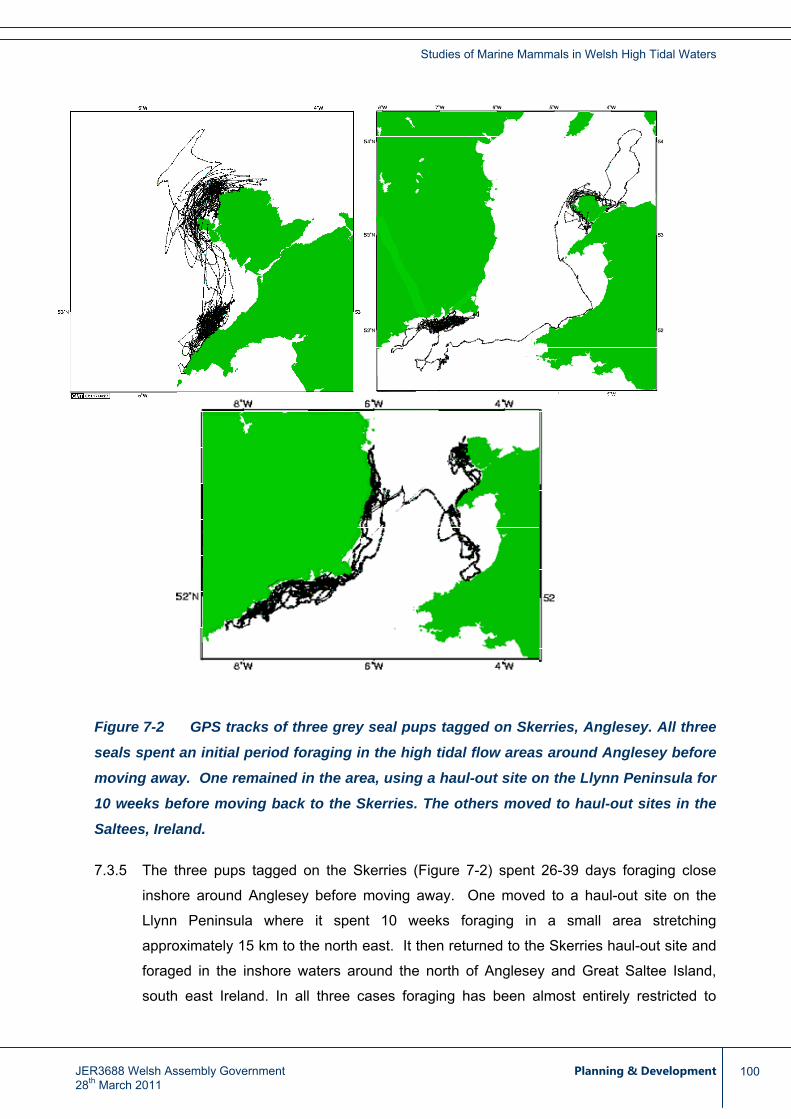
Studies of Marine Mammals in Welsh High Tidal Waters
Figure 7-2 GPS tracks of three grey seal pups tagged on Skerries, Anglesey. All three
seals spent an initial period foraging in the high tidal flow areas around Anglesey before
moving away. One remained in the area, using a haul-out site on the Llynn Peninsula for
10 weeks before moving back to the Skerries. The others moved to haul-out sites in the
Saltees, Ireland.
Figure 7-27.3.5 The three pups tagged on the Skerries ( ) spent 26-39 days foraging close
inshore around Anglesey before moving away. One moved to a haul-out site on the
Llynn Peninsula where it spent 10 weeks foraging in a small area stretching
approximately 15 km to the north east. It then returned to the Skerries haul-out site and
foraged in the inshore waters around the north of Anglesey and Great Saltee Island,
south east Ireland. In all three cases foraging has been almost entirely restricted to
JER3688 Welsh Assembly Government Planning & Development 28th March 2011
100

Studies of Marine Mammals in Welsh High Tidal Waters
waters within 10 km of the shore within 30 km of their haul-out sites. All three pups were
apparently foraging successfully into May.
7.3.6 Both Bardsey pups spent the first two to three weeks foraging close to their pupping site,
again apparently in high tidal energy areas (Figure 7-3
Figure 7-3 GPS tracks of grey seal pups tagged on Bardsey Island. Both spent an
initial period of two weeks foraging in the vicinity of Bardsey Island. One was
subsequently found dead on the Llynn Peninsula. The other spent short periods
foraging near Rosslaire in Ireland, Scilly Isles and Lands End and made one extended but
apparently unsuccessful foraging trip to the west of Brittany. The seal was re-captured
on 26/12/09 and taken to a rehabilitation centre in Cornwall.
). One seal pup was subsequently
found dead on shore, 13 days after leaving the pupping site. Initial inspection indicated
that the seal was apparently in good condition and showed no signs of injury associated
with the transmitter. Results of a formal post mortem will be available for the final report.
The other Bardsey Island pup initially spent 28 days foraging within 30 km of its tagging
site. It then began a period of continuous movement, to Anglesey, then to the coast near
Rosslaire in Ireland, west Cornwall and the Scilly Isles. It did not appear to develop a
fixed foraging pattern at any site and after a final swim from the Scilly Isles to an area 40
km west of Brittany it returned to Cornwall and was caught onshore and taken to a seal
sanctuary. This seal had lost approximately 30% of its weaning mass by the time of
capture. Had it not been caught, it would probably not have survived the winter.
JER3688 Welsh Assembly Government Planning & Development 28th March 2011
101

Studies of Marine Mammals in Welsh High Tidal Waters
Preliminary dive behaviour data
Figure 7-4 shows an example of the summary data from the dive depth and haul-out
sensors. The data presented are simple two hour summaries of maximum depth and
time spent dry at the surface or on land. Similar data are available for all five pups for
which records have been received so far. The raw dive data, i.e. detailed depth time
profiles and accurate surface times are available for all animals.
7.3.7
Figure 7-4 Example of the summary data transmitted by one of the grey seal pups
tagged on the Skerries. Blue bar graph at the top represents the summary dive
behaviour, showing maximum dive depth in two hr bins. Yellow dots indicate where full
depth temperature profiles were recorded. Depth profiles of all individual dives are
transmitted and will be used in analysis of 3D space usage.
7.3.8 Figure 7-5
Figure 7-5
shows dive profiles of a seal swimming in the high tidal current area around
the Skerries. Depth records indicated typical patterns of diving behaviour for grey seals
in both datasets. While at sea, the pups spent the majority of their time diving, spending
76% of their time submerged similar to the adults 75% (Section 1.3). (a and
b) show typical flat bottomed foraging dives (Thompson et al., 1991; 1993) in areas with
relatively flat sea bed, where the maximum depth is close to the estimated water depth.
JER3688 Welsh Assembly Government Planning & Development 28th March 2011
102

Studies of Marine Mammals in Welsh High Tidal Waters
Figure 7-5 (c) shows examples of typical travelling dives with more variable profiles.
The complexity of the bottom topography in this area and the error inherent in the
interpolating between GPS fixes makes it impossible to accurately assign an estimate of
the depth of the water column to each dive. However, in previous studies dive patterns
suggest that the seals swam down to or close to the seabed on the majority of dives
during travel phases (McConnell et al., 1997; Thompson et al., 1991; 1993).
0
10
20
30
40
50
11:00:00 11:15:00 11:30:00 11:45:00 12:00:00 12:15:00 12:30:00 12:45:00 13:00:00 13:15:00
dept
h (m
)
0
10
20
30
40
50
12:00:00 12:15:00 12:30:00 12:45:00 13:00:00 13:15:00 13:30:00 13:45:00 14:00:00 14:15:00
dept
h (m
)
0
10
20
30
40
50
06:00:00 06:15:00 06:30:00 06:45:00 07:00:00 07:15:00 07:30:00 07:45:00 08:00:00 08:15:00
time (GMT)
dept
h (m
)
Figure 7-5 Dive profiles of a juvenile grey seal swimming in high tidal current areas
around the Skerries off Anglesey, North Wales. of distances from shore at which seals
crossed an arbitrarily defined line stretching 8km from Carmel head passing through the
Skerries. Periods of typical flat bottomed foraging dives to the sea bed (a and b) were
interspersed with typical travelling dives (c).
7.3.9 As with all previous grey seal studies, the dives comprised a rapid descent phase
followed by either a rapid ascent or a protracted bottom phase followed by a rapid
ascent. While at the surface grey seals typically do not swim actively (Thompson et al.,
1993), simply resting at the surface for short periods to load oxygen and dump carbon
JER3688 Welsh Assembly Government Planning & Development 28th March 2011
103

Studies of Marine Mammals in Welsh High Tidal Waters
dioxide before diving again. The seals therefore spent a limited amount of time in mid
water depths.
7.3.10 Figure 7-6 shows the proportion of time spent at different depths, expressed as a
proportion of the maximum depth, within individual dives. This clearly demonstrates that
the majority of time is spent at the bottom of the dive or at the surface. However, the
complexity of the topography and the interpolation errors in location of each dive makes
it impossible to determine what proportion of these dives reached the seabed and it is
therefore not possible to say where exactly in the water column the dive activity
occurred.
0
0.1
0.2
0.3
0.4
0.5
0.6
0.7
0.8
0.9
10 0.05 0.1 0.15 0.2 0.25 0.3
prop
ortio
n of
max
dep
th
proportion of time at depth
Figure 7-6 Proportion of time spent at different depths, expressed as a proportion of
the maximum depth, within individual dives (n=17000) by seal 07 while swimming within
15km of the Skerries.
7.3.11 The rate at which seals pass through the area swept by the blades of a tidal turbine is an
important parameter which sets the upper limit on the potential for direct physical
interactions with the device. The GPS position fixes accurately indicate the seals’ XY
positions at approximately 15 minute intervals. The pressure sensor data provide a 10
point depth profile for each dive. Although these data do not provide sufficient spatial
resolution to identify direct passage through a small window equivalent to a turbine, they
can be used to estimate the general pattern of transits through a specified area.
JER3688 Welsh Assembly Government Planning & Development 28th March 2011
104

Studies of Marine Mammals in Welsh High Tidal Waters
7.3.12 As an example of the type of data available we estimated the number of times and the
depths at which the tagged seals crossed an arbitrary 8 km long line drawn from Carmel
Head to the Skerries and extending approximately 4 km further offshore. Pairs of
consecutive locations were used to estimate the seal’s swimming track assuming that it
swam in a straight line between the location fixes. The time at which the seal crossed
the line was estimated assuming constant swimming speed between locations.
Swimming depth at that point was estimated by linearly interpolating between the pair of
depth estimates immediately before and after the crossing point.
7.3.13 As previously stated, this is a preliminary analysis of a small sample of seals. Only two
of the tagged seals crossed this line. It appears that the crossing points are
approximately uniformly distributed across the area both in terms of distance from shore
(Figure 7-7) and swimming depth (Figure 7-8
Figure 7-8
). The difference between the proportion of
time spent in the mid water depth shown in Figure 7-6 and the more even spread of
depth usage implied by is problematical. It appears to be a result of the
increased horizontal movement between locations due to tidal currents and the fact that
a higher proportion of dives crossing the arbitrary line were V shaped transit dives
(Figure 7-5c).
JER3688 Welsh Assembly Government Planning & Development 28th March 2011
105
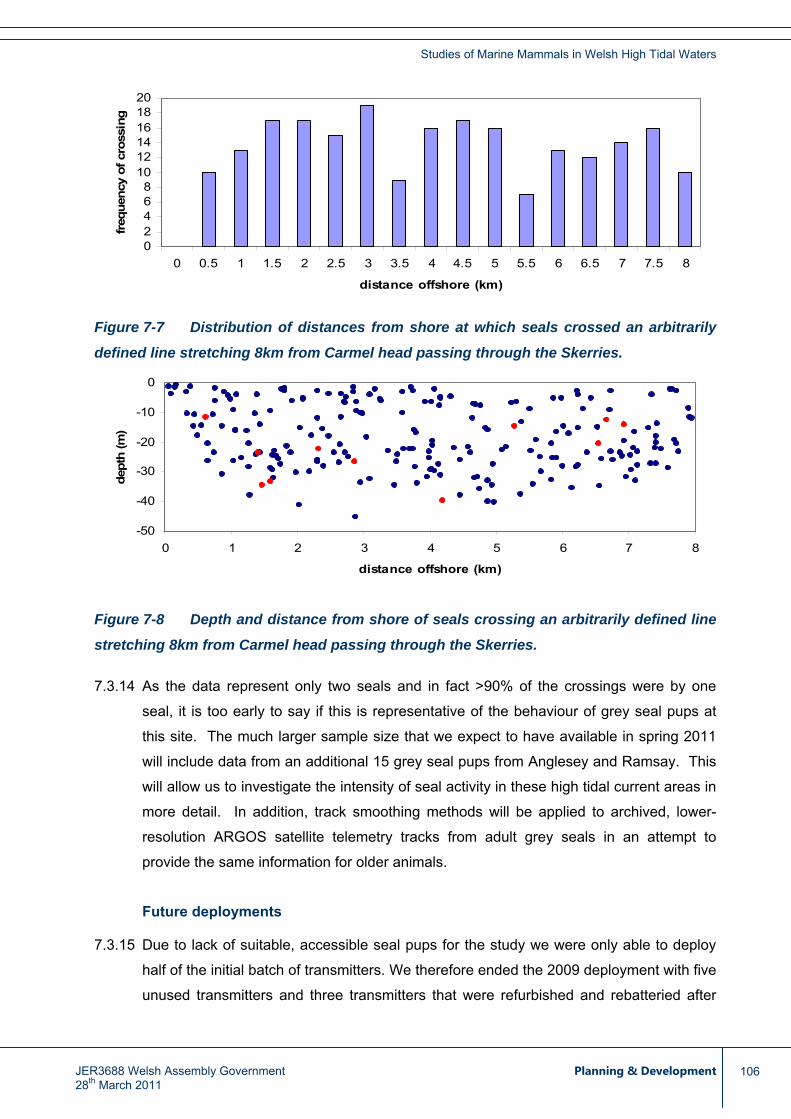
Studies of Marine Mammals in Welsh High Tidal Waters
02468
101214161820
0 0.5 1 1.5 2 2.5 3 3.5 4 4.5 5 5.5 6 6.5 7 7.5 8
distance offshore (km)
frequ
ency
of c
ross
ing
Figure 7-7 Distribution of distances from shore at which seals crossed an arbitrarily
defined line stretching 8km from Carmel head passing through the Skerries.
-50
-40
-30
-20
-10
0
0 1 2 3 4 5 6 7 8
distance offshore (km)
dept
h (m
)
Figure 7-8 Depth and distance from shore of seals crossing an arbitrarily defined line
stretching 8km from Carmel head passing through the Skerries.
7.3.14 As the data represent only two seals and in fact >90% of the crossings were by one
seal, it is too early to say if this is representative of the behaviour of grey seal pups at
this site. The much larger sample size that we expect to have available in spring 2011
will include data from an additional 15 grey seal pups from Anglesey and Ramsay. This
will allow us to investigate the intensity of seal activity in these high tidal current areas in
more detail. In addition, track smoothing methods will be applied to archived, lower-
resolution ARGOS satellite telemetry tracks from adult grey seals in an attempt to
provide the same information for older animals.
Future deployments
7.3.15 Due to lack of suitable, accessible seal pups for the study we were only able to deploy
half of the initial batch of transmitters. We therefore ended the 2009 deployment with five
unused transmitters and three transmitters that were refurbished and rebatteried after
JER3688 Welsh Assembly Government Planning & Development 28th March 2011
106

Studies of Marine Mammals in Welsh High Tidal Waters
being retrieved from dead and rescued pups. In addition, funds were provided by Welsh
Assembly Government for seven additional tags.
7.3.16 These have now been deployed in two batches; ten on grey seal pups at Ramsey Island
and five on pups at the Skerries off Anglesey. At the time of writing preliminary location
and dive data have been received from two Anglesey seals and six Ramsey seals.
Maps of these initial swimming tracks are presented in Figure 7-10.
7.3.17 Results from these deployments will be combined with the initial deployment results
reported here. The data should be sufficient to allow a full habitat usage map to be
generated for the Welsh grey seal population (adults based on information provided in
Section 1.3 and for seal pups from this study).
JER3688 Welsh Assembly Government Planning & Development 28th March 2011
107
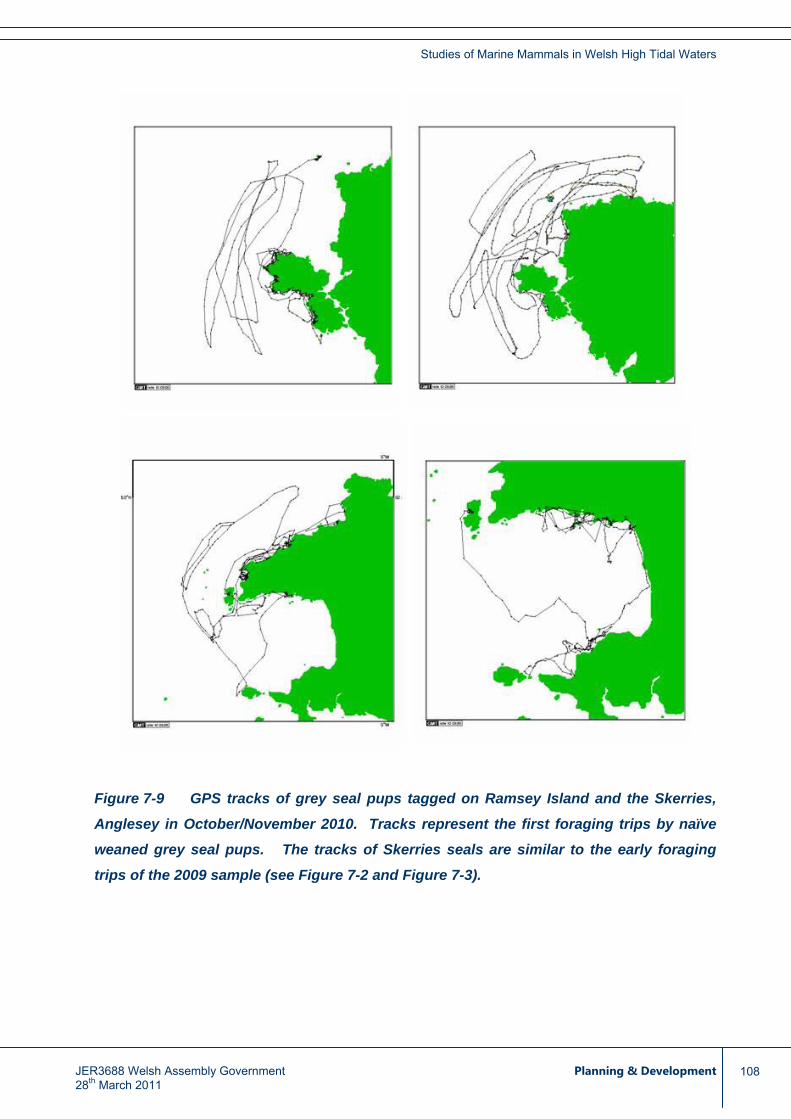
Studies of Marine Mammals in Welsh High Tidal Waters
Figure 7-9 GPS tracks of grey seal pups tagged on Ramsey Island and the Skerries,
Anglesey in October/November 2010. Tracks represent the first foraging trips by naïve
weaned grey seal pups. The tracks of Skerries seals are similar to the early foraging
trips of the 2009 sample (see Figure 7-2 and Figure 7-3).
JER3688 Welsh Assembly Government Planning & Development 28th March 2011
108

Studies of Marine Mammals in Welsh High Tidal Waters
Figure 7-10 (continued) GPS tracks of grey seal pups tagged on Ramsey Island and
the Skerries, Anglesey in October/November 2010. Tracks represent the first foraging
trips by naïve weaned grey seal pups. The tracks of Skerries seals are similar to the
early foraging trips of the 2009 sample (see Figure 7-2 and Figure 7-3).
JER3688 Welsh Assembly Government Planning & Development 28th March 2011
109
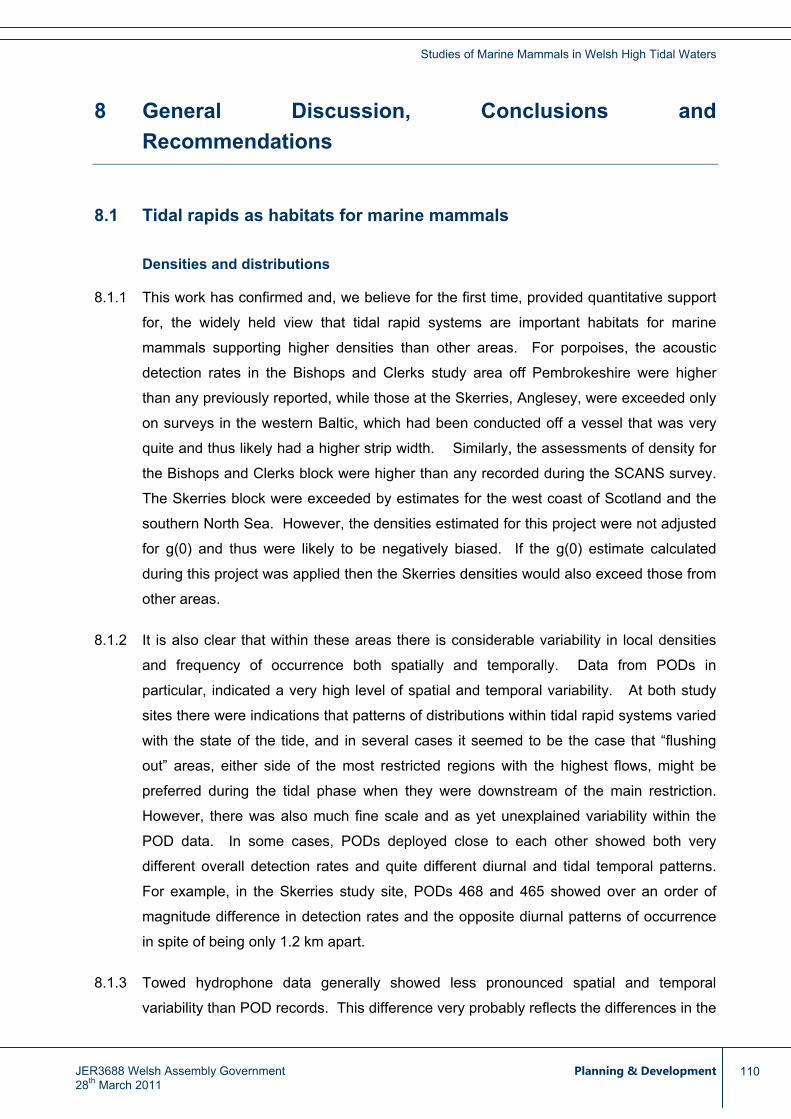
Studies of Marine Mammals in Welsh High Tidal Waters
8 General Discussion, Conclusions and Recommendations
8.1 Tidal rapids as habitats for marine mammals
Densities and distributions
8.1.1 This work has confirmed and, we believe for the first time, provided quantitative support
for, the widely held view that tidal rapid systems are important habitats for marine
mammals supporting higher densities than other areas. For porpoises, the acoustic
detection rates in the Bishops and Clerks study area off Pembrokeshire were higher
than any previously reported, while those at the Skerries, Anglesey, were exceeded only
on surveys in the western Baltic, which had been conducted off a vessel that was very
quite and thus likely had a higher strip width. Similarly, the assessments of density for
the Bishops and Clerks block were higher than any recorded during the SCANS survey.
The Skerries block were exceeded by estimates for the west coast of Scotland and the
southern North Sea. However, the densities estimated for this project were not adjusted
for g(0) and thus were likely to be negatively biased. If the g(0) estimate calculated
during this project was applied then the Skerries densities would also exceed those from
other areas.
8.1.2 It is also clear that within these areas there is considerable variability in local densities
and frequency of occurrence both spatially and temporally. Data from PODs in
particular, indicated a very high level of spatial and temporal variability. At both study
sites there were indications that patterns of distributions within tidal rapid systems varied
with the state of the tide, and in several cases it seemed to be the case that “flushing
out” areas, either side of the most restricted regions with the highest flows, might be
preferred during the tidal phase when they were downstream of the main restriction.
However, there was also much fine scale and as yet unexplained variability within the
POD data. In some cases, PODs deployed close to each other showed both very
different overall detection rates and quite different diurnal and tidal temporal patterns.
For example, in the Skerries study site, PODs 468 and 465 showed over an order of
magnitude difference in detection rates and the opposite diurnal patterns of occurrence
in spite of being only 1.2 km apart.
8.1.3 Towed hydrophone data generally showed less pronounced spatial and temporal
variability than POD records. This difference very probably reflects the differences in the
JER3688 Welsh Assembly Government Planning & Development 28th March 2011
110

Studies of Marine Mammals in Welsh High Tidal Waters
amount and distribution of sampling effort provided by these two methods. PODs
sample intensively over restrictive spatial scales and individually provide a very
restricted coverage. Towed hydrophones provide a good coverage of area, but the
overall amount of effort in terms of monitoring hours was much lower than achieved by
the aggregate of all the PODs. Thus, one method, the PODs, can detect fine scale
differences between point locations but provides a poor coverage of the area. While the
second method, the towed hydrophone surveys, provides a good and near-even
coverage, but because the amount of data collected in any restricted location is small, it
has less power showing these small scale spatial and temporal differences. An
interpretation of the two somewhat different pictures from the POD and towed
hydrophone datasets is that there are fine scale differences, perhaps on scales of a
hundred metres or less, in the way that animals use the habitat.
8.1.4 The POD data also showed that more animals were detected at night than during the
day. This could reflect a real diurnal change in distribution but it is equally plausible that
it reflects a change in behaviour, with animals echolocating more at night, perhaps
because visual cues are more restricted in the dark.
8.1.5 Locations of vocalising porpoises from the vertical hydrophone has provided the first
data on the dive depths of harbour porpoises in high tidal energy areas at times when
tidal currents are greatest and collision risks most severe. Because this is a newly
developed method, data collected and analysed thus far are few, but they indicate
animals may be making full use of the water column and may be spending more time on
the bottom (possibly benthic foraging).
8.1.6 Fine scale telemetry data has been collected from newly weaned grey seals during the
critical period after they leave their natal beaches; establish themselves independently
and into their first year. These animals made extensive (in some cases almost
exclusive) use of tidal race areas, seeming to move forwards and backwards with the
tide and repeatedly diving to the bottom. These dive patterns suggest that they were
foraging. It is interesting that in some cases, after animals left the tidal rapid area next
to their natal breaches, that they subsequently seemed to preferentially use other high
tidal current areas. The extent to which these animals continue to use these areas in
later life is not yet clear but additional information will be collected as the current tag
deployments continues and new ones are added. Preliminary analysis of dive data
suggests that seals generally dive directly to the seabed and are therefore spending little
time in midwater.
JER3688 Welsh Assembly Government Planning & Development 28th March 2011
111
Studies of Marine Mammals in Welsh High Tidal Waters
8.1.7 It is important to note that the seal telemetry data presented represents only a small
sample of five seal pups and is a small subset of the data that will be available by spring
2011. The descriptions of dive and movement patterns must be regarded as preliminary
and any interpretation must be treated with caution.
Significance for marine mammals
8.1.8 Most authors have assumed that tidal rapid areas are favoured foraging sites for marine
mammals, though there is no clear evidence as to why this should be the case. It could
be that encounter rates with prey are high, this may be because marine mammals’ prey
species are aggregated in the area by water movements and topography or they may
actively move there, perhaps to utilise plankton that might have been aggregated there.
Encounter rates may also be increased if prey are carried to marine mammal predators
by strong currents. To benefit from this, marine mammals would have to be able to
sense prey within the main current while keeping out of it themselves. In this way they
could increase encounter rate without having to swim at high speed. Alternatively, fast
currents might make prey more accessible perhaps because they are disoriented or
disadvantaged by turbulence associated with strong currents. There is little in the
literature that explores these ideas in detail and we have been able to shed little new
light on the topic, in large part due to the effects that poor weather had on planned
detailed visual tracking work.
Implications for encounter and other risks from tidal turbines
8.1.9 The high densities of porpoise in these areas means that encounter risks are likely to be
higher than those predicated using density estimates derived from larger scale surveys
such as SCANS. Similarly, there is potentially a higher risk of collision for naive newly
weaned pups that appear to make extensive use of these areas after they leave the
breeding beaches.
8.1.10 In the course of towed hydrophone acoustic surveys we noted both areas of very high
background noise and a pronounced tidal variation in noise with levels being higher
when current exceeded rates of around 1.5 m.s1. This could affect an animal’s ability to
detect turbines both because it could mask the turbine’s self noise and the signals of any
active acoustic warning devices deployed and because it could interfere with the
echolocation signals of small odontocetes. If active acoustic devices were to be used
then they may avoid some of these masking effects by operating at a frequency outside
the bands of strongest noise. (If the high noise patches are indeed caused by moving
JER3688 Welsh Assembly Government Planning & Development 28th March 2011
112

Studies of Marine Mammals in Welsh High Tidal Waters
sediments, as we hypothesised, their locations might be of significance for engineers as
well).
8.1.11 High tidal energy areas seem to represent important habitats for porpoises, and it may
be the case that sub sets of local populations specialise in foraging within these small
areas. Thus, if turbine installations cause animals to be excluded from these areas,
either directly, or perhaps though the use of aversive acoustic signals as a mitigation
procedure, this could have a potential impact on local sub populations, especially if there
are groups that specialise in utilising these special habitats. In addition, there is a high
level of public awareness of marine mammals in these areas, particularly in the Ramsey
Sound area where they are important attractions for thriving wildlife tourism enterprises.
8.1.12 Understanding the high level of spatial and temporal variability that was evident in both
study sites is particularly relevant in the context of a tidal turbine development for
several reasons. In the first case because it will affect the likelihood of encounters
between porpoises and turbines. Secondly, this information could be used to determine
the fine scale location of turbines to reduce encounter probability. In addition, the way
that marine mammals use this habitat will have implications for the significance of
disturbance, habitat exclusion and any barrier effects. While the data indicates that
heterogeneity exists, further work would need to be done to quantify it and determine if
this is predictable in the longer term.
8.1.13 A preliminary examination of the fine scale movements of two seals in the vicinity of the
proposed turbine array in Anglesey suggests that when passing through such an area
seals are roughly evenly distributed with respect to both depth and distance. However,
again this must be treated with caution as it is based on preliminary results from only two
seals. A similar analysis will be presented in 2011 based on a much larger sample set.
8.2 Additional analysis of data collected on this project
8.2.1 The project was successful in collecting a wide range of data and an exhaustive analysis
of these has not been possible with the resources available. One area in which
additional work might be done is in spatial and temporal modelling of the towed
hydrophone data, especially if improved predictor datasets (for example, from detailed
tidal flow models, detailed bottom type or satellite telemetry) were available. Only
limited work has been done to test the reliability of the predictions. In the Skerries block,
towed hydrophone data and POD data overlap in space and time. An analysis to
compare the two datasets and develop a methodology that could combine their
JER3688 Welsh Assembly Government Planning & Development 28th March 2011
113

Studies of Marine Mammals in Welsh High Tidal Waters
complementary strengths would be useful generally, as well as in this specific context.
The vertical array has provided encouraging results. Most effort has so far been
expended on development and programming and on analysing the most straightforward
datasets. Promising results from some additional work undertaken after the main body
of this report was completed are presented in Appendix 2. As this method seems able
to provide data that is very relevant for studies related to tidal turbines consideration
should be given to making the software more accessible by rewriting the Matlab routines
in a user friendly and freely available software package such as PAMGUARD.
8.2.2 Audio recordings in two frequency bands between 100 Hz and 250 kHz were made
continuously during acoustic surveys and so far these have only been used in models of
porpoise acoustic detection. These would be available to any researchers wanting to
map noise levels in these areas.
8.3 Lessons for future work
8.3.1 This has been one of the first substantial and dedicated efforts to conduct surveys for
marine mammals in areas with high tidal currents. It would be unwise to be proscriptive
in recommending methodologies for survey in these areas at this stage and its important
that further innovation should be encouraged. It will also be the case that the most
appropriate methodologies for any particular survey should be assessed in the light of
the survey objectives, target species, expected weather conditions and the physical
characteristics of the site (Berggren et al., 2008; SMRU Ltd, 2010). However, there are
certainly lessons to be learnt from the techniques that were more and less successful in
this case.
Surveys
8.3.2 These are exceptionally challenging areas in which to conduct marine mammal surveys.
It is particularly important therefore that surveys should be carefully targeted at
answering the questions of highest value for management. We developed a survey
design which addresses some of the problems inherent in work in these areas and
seems to be practical in the field. We hope that this will be used as a starting point for
others to review and work towards an accepted methodology. The efficacy of visual
surveys will always be highly affected by the rough sea conditions that pertain in these
areas when currents are running. Thus, it is extremely useful to conduct towed
hydrophone surveys in addition to visual monitoring. In some cases and with some
JER3688 Welsh Assembly Government Planning & Development 28th March 2011
114

Studies of Marine Mammals in Welsh High Tidal Waters
species it might make sense to rely on passive acoustics as the primary survey
methodology.
8.3.3 Static acoustic monitoring can provide indices of presence over extended periods of
time. There are some problems with using them in these locations however. In the first
place there are practical issues related to providing adequate moorings in such
energetic environments. More fundamentally, the very high levels of spatial
heterogeneity in these areas, means that very large numbers of devices will need to be
deployed. PODS do not provide a measure of detection range or of background noise,
and this is a particular problem in areas like these where background noise has been
shown to vary substantially both spatially and temporally. Some major technical
developments will be required to overcome these issues.
8.3.4 Shore based monitoring can be a cost effective way of monitoring areas close to shore.
However, the technique suffers from some fundamental problems which make it difficult
to derive robust indices of abundance from the data it provides. In addition, as typically
implemented, it may not provide sufficient spatial precision to capture fine scale
variability in densities that may occur in these areas. As part of this project we worked
on some technical solutions for these problems but poor weather conditions prevented
us from fully applying or testing these methodologies.
8.3.5 Marine mammals operate in a three dimensional world and for surveys, such as this,
where a goal is to provide data that can inform assessments of collision risk, it is
important to provide information on animals’ probability of occurrence with depth. The
approach pioneered here, of using drifting vertical arrays is one of the few ways that
these data could be obtained for porpoises. It seems to have been successful and
practical, but the requirement to use a drifting boat to deploy the array increases field
costs. When turbines are installed it may be possible to use their structures to support a
static vertical array which would provide long term three dimensional location data within
the vicinity of turbines.
8.3.6 For seals, which are difficult to spot at sea or to detect acoustically, and to which
telemetry devices can be readily applied, tagging represents a promising method for
measuring the movements and distribution of individuals.
8.3.7 Pros and cons of different survey approaches in high tidal current area are summarised
in Table 8.1
JER3688 Welsh Assembly Government Planning & Development 28th March 2011
115
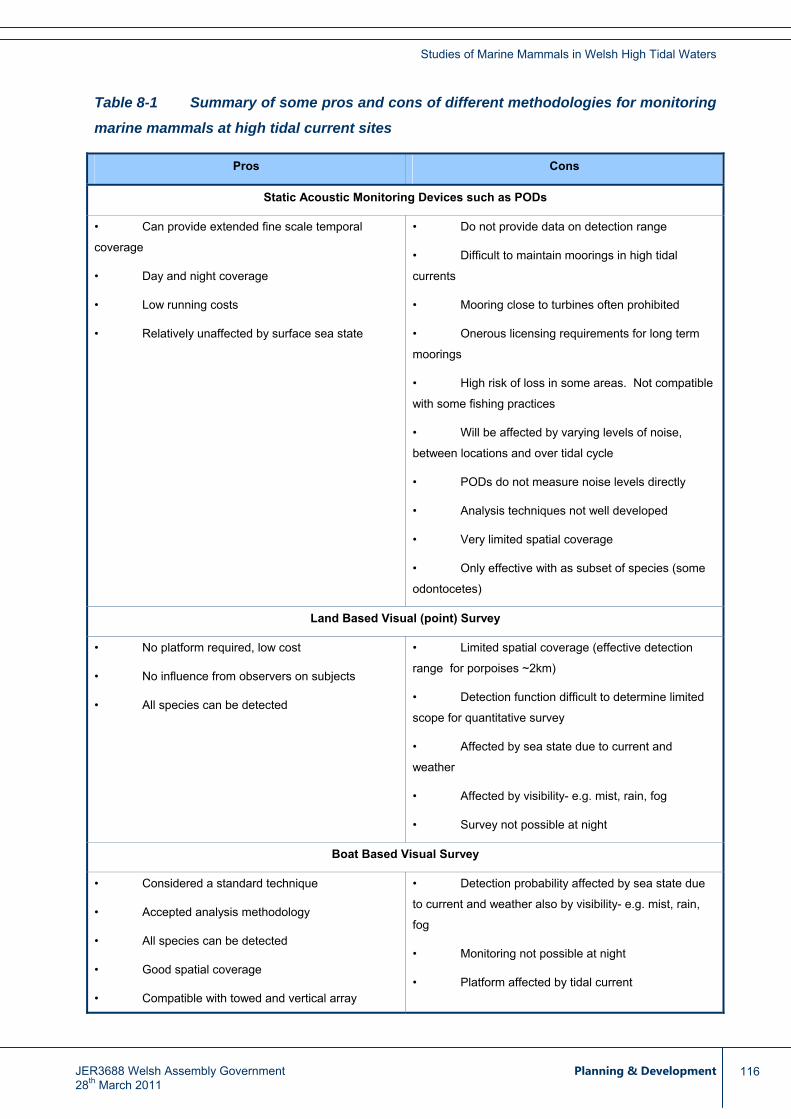
Studies of Marine Mammals in Welsh High Tidal Waters
Table 8-1 Summary of some pros and cons of different methodologies for monitoring
marine mammals at high tidal current sites
Pros Cons
Static Acoustic Monitoring Devices such as PODs
• Can provide extended fine scale temporal
coverage
• Day and night coverage
• Low running costs
• Relatively unaffected by surface sea state
• Do not provide data on detection range
• Difficult to maintain moorings in high tidal
currents
• Mooring close to turbines often prohibited
• Onerous licensing requirements for long term
moorings
• High risk of loss in some areas. Not compatible
with some fishing practices
• Will be affected by varying levels of noise,
between locations and over tidal cycle
• PODs do not measure noise levels directly
• Analysis techniques not well developed
• Very limited spatial coverage
• Only effective with as subset of species (some
odontocetes)
Land Based Visual (point) Survey
• No platform required, low cost
• No influence from observers on subjects
• All species can be detected
• Limited spatial coverage (effective detection
range for porpoises ~2km)
• Detection function difficult to determine limited
scope for quantitative survey
• Affected by sea state due to current and
weather
• Affected by visibility- e.g. mist, rain, fog
• Survey not possible at night
Boat Based Visual Survey
• Considered a standard technique
• Accepted analysis methodology
• All species can be detected
• Good spatial coverage
• Compatible with towed and vertical array
• Detection probability affected by sea state due
to current and weather also by visibility- e.g. mist, rain,
fog
• Monitoring not possible at night
• Platform affected by tidal current
JER3688 Welsh Assembly Government Planning & Development 28th March 2011
116

Studies of Marine Mammals in Welsh High Tidal Waters
JER3688 Welsh Assembly Government Planning & Development 28th March 2011
117
Pros Cons
surveys • Temporal coverage limited by platform cost
• Requires a substantial experienced field team
• Typically requires larger (more expensive)
stable vessel
Visual Aerial Survey
• Large areas can be covered quickly, potential
for good spatial coverage
• Standard technique with established
methodology
• All species can be detected
• Platform and survey tracks not affected by
current
• Practical in areas of complex topography
• Temporal coverage limited by platform cost
• Detection probability highly affected by sea state
due to current and weather and by visibility- e.g. mist,
rain, fog
• Survey not possible at night
• Practicality dependent on distance from airports
• Topography, e.g. high hills, may affect safe
operation
• Not compatible with vertical array deployments
Towed Hydrophone Surveys
• Less affected by weather, sea conditions a and
current than visual methods
• Monitoring at night possible
• Provides good spatial coverage
• High level of automation allowing for minimal
field teams and high levels of consistency
• Compatible with other boat based surveys
• Smaller (cheaper) vessels preferable and
platform of opportunity possible
• Not effective with all species
• Equipment required
• Analysis methodologies less well established
than for visual
• Temporal coverage limited by platform costs
Vertical Hydrophone Array
• Provides data on depth of vocalisation from the
relevant and required location
• Analysis methodologies being developed
• Requires dedicated vessel
• Only suitable for odontocetes
Telemetry
• Provides long term, information rich datasets
• Good data on movements and dive depths
• No human influence on behaviour once subjects
have recovered from tagging
• Not a practical prospect for small cetaceans in
UK waters
• Spatial coverage of data depends on the
movements of individuals - which may rarely enter area

Studies of Marine Mammals in Welsh High Tidal Waters
JER3688 Welsh Assembly Government Planning & Development 28th March 2011
118
Pros Cons
of interest
• Tagging of large number of individuals may be
required to provide representative data
• Determining densities from telemetry data is not
straight forward
• An invasive technique with some risk to animals
Behavioural studies
8.3.8 Potentially, studies of the behaviour of individual animals within high tidal energy areas
could provide several types of useful data. Fine scale tracking of the movements of
individuals would provide very detailed information on habitat use complimenting the
broader scale data provided by survey. Detailed information on animals’ behaviour
within these areas would also provide improved insights into the use they make of these
areas for foraging and other important activities. Finally, behavioural studies will be
important for studies of the effects and impacts of tidal turbines themselves, and in
particular whether and how animals are able to reduce collision risk by avoiding them.
8.3.9 For seals, as has been shown in this study, fine scale telemetry provides detailed data
on many relevant aspects of behaviour. Telemetry is not a viable option for harbour
porpoises. A practical methodology might be detailed tracking from a small
manoeuvrable boat (and in some locations from land), potentially combined with passive
and active acoustic monitoring. The poor weather conditions prevented us attempting
any of this type of work on this project. However, the shore based tracking methods
described in Section 6 should make shore based tracking more useful for this
application.
8.3.10 For animals like harbour porpoises, which are highly vocal, passive acoustic tracking
using arrays of hydrophones could be an effective option for providing detailed location
and movement data in areas close to the arrays. Such arrays would probably need to
be bottom mounted with cables bringing signals from multiple hydrophones back to a
single point for storage and analysis. Software development would certainly be required
to allow streamlined processing of the large datasets that would ensue, however, our
experience with the vertical array data from this project would suggest that this could be
undertaken with little technical risk. Installing such an array from scratch in such a
challenging environment would be a substantial and costly engineering task unless it

Studies of Marine Mammals in Welsh High Tidal Waters
was possible to make use of structures and cable runs installed as part of the turbine
installation process.
8.3.11 For seals in addition to completing the original planned deployment of 10 transmitters
(only 5 were eventually deployed), an additional 10 transmitters have been deployed,
plus the 5 previously not deployed, allowing for an evenly matched sample of 10 pups at
both the Anglesey and Ramsey sites. Data from these sites will be combined with
results from earlier satellite telemetry studies of adult grey seals from the same areas, In
addition, the data will be combined with results from a similar scale deployment on grey
seal pups in Orkney in 2010 and compared to earlier deployments on tags on seal pups
in the central North Sea (based on older satellite telemetry devices).
8.4 Impact and mitigation studies
8.4.1 Tidal turbines are a new technology and we still have limited understanding of the risks
that different models might pose to marine mammals, the extent to which animals will
adapt to reduce these risks and the type of mitigation that might be required to reduce
impacts to an acceptable level. It is clear, however, that this process will involve a
combination of population assessment and behavioural studies of marine mammals
within the challenging environment of high tidal current area using the methods outlined
above (and others).
8.4.2 One important observation, which can only be made once tidal turbines are in place and
operational, is the extent to which different species can detect and avoid them.
Detailed active sonar observations as well as passive acoustic tracking in combination
with visual tracking, are methods likely to be applied to this for research purposes. It
has been suggested that acoustic devices might be attached to turbines to alert animals
to their presence. Such an approach would need to consider aspects such as habitat
exclusion and potential for habitation and learning. In addition, information on levels of
background noise in these areas and how this varies in time and space, similar to the
data we collected on this project, would also be relevant in assessing the detectability of
different device types.
8.4.3 Installation of turbines is likely to go ahead in conjunction with long term monitoring
schemes. As with any research, it is important that the objectives and goals for this are
very clearly defined so that an effective program to address them can be carefully
designed. For porpoises, and other highly vocal cetaceans, passive acoustic monitoring
promises to provide the most cost effective methods for monitoring. A mixture of mobile
JER3688 Welsh Assembly Government Planning & Development 28th March 2011
119

Studies of Marine Mammals in Welsh High Tidal Waters
towed hydrophone survey and the use of static monitoring devices would probably be
required. Technological development in both of these areas would be helpful. For
towed hydrophones multi element arrays that would allow immediate range
measurement would be an important advance. For static monitoring, devices that
measure noise levels and (ideally) range, are necessary, especially for monitoring in the
highly variable habitat of high tidal current areas.
8.5 Further works at these sites
8.5.1 This project has provided a substantial amount of new data from two tidal current areas
that are likely candidates as sites for tidal turbine installations. However, these should
be seen as generic proof of concept studies that were conducted within these sites
rather than comprehensive studies of the sites themselves and were not designed for
assessments of specific planned developments. A particular limitation of the cetacean
surveys is that each study took place over periods limited to several weeks in the
summer at each site. We strongly recommend that, based on an assessment of the
methods employed here, a long term program of monitoring, capable of revealing
seasonal and inter-annual variation at these sites should be initiated.
JER3688 Welsh Assembly Government Planning & Development 28th March 2011
120
Studies of Marine Mammals in Welsh High Tidal Waters
References
Akamatsu, T., D. Wang, K. X. Wang, and Y. Naito. 2005. Biosonar behaviour of free-ranging
porpoises. Proceedings of the Royal Society B-Biological Sciences 272:797-801.
Baines, M. E. and P. G. H. Evans. 2009. Atlas of the Marine Mammals of Wales. . Countryside
Council for Wales.
Barlow, J. and D. Hanan. 1995. An assessment of the status of the harbour porpoise in central
California. Reports Of The International Whaling Commission Special Issue 16:123-140.
Barradell, M. G. 2009. Fine scale use of Ramsey Sound, Pembrokeshire, West Wales, by
harbour porpoise (Phocoena phocoena ). Pembrokeshire College, Haverfordwest.
Berggren, P., J. Teilmann, D.L. Borchers, L.M. Burt, D. Gillespie, G. J., K. Macleod, R. Leaper,
M. Scheidat, R. Swift, M.L. Tasker, W.J. Arliss, and P.J. Hammond. 2008. Quantitative
comparison of monitoring methods and recommendations for best practice. Appendix D 2.4 of
Scans II report to European Commission. 33.
Blaxter, J. H. S. and R. S. Batty. 1987. Comparisons of herring behaviour in the light and dark -
changes in activity and responses to sound. Journal of the Marine Biological Association of the
United Kingdom 67:849-859.
Blaxter, J. H. S. and F. G. Holliday. 1969. The behaviour and physiology of herring and other
clupeids. Advances in Marine Biology,:261-393.
Calderan, S. V. 2003. Fine-scale temporal distribution by harbour porpoise (Phocoena
phocoena) in North Wales: acoustic and visual survey techniques. University of Wales, Bangor.
Cardinale, M., M. Casini, F. Arrhenius, and N. Hakansson. 2003. Diel spatial distribution and
feeding activity of herring (Clupea harengus) and sprat (Sprattus sprattus) in the Baltic Sea.
Aquatic Living Resources 16:283-292.
Cato, D. H. 1998. Simple methods of estimating source levels and locations of marine animal
sounds. Journal of the Acoustical Society of America 104:1667-1678.
Chappell, O., R. Leaper, and J. Gordon. 1996. Development and performance of an automated
harbour porpoise click detector. Reports of the International Whaling Commission 46:587-594.
JER3688 Welsh Assembly Government Planning & Development 28th March 2011
121

Studies of Marine Mammals in Welsh High Tidal Waters
Evans, P. G. H., P. Anderwald, and M. E. Baines. 2003. UK Cetacean Status Review. Report to
English Nature & Countryside Council for Wales. Sea Watch Foundation, Oxford.
Evans, P. G. H. and J. Wang. 2002. Re-examination of Distribution Data for the Harbour
Porpoise around Wales and the UK with a view to site selection for this species. Report to the
Countryside Council for Wales. Sea Watch Foundation, Oxford.
Gillespie, D., P. Berggren, S. Brown, I. Kuklik, C. Lacey, T. Lewis, J. Matthews, R.
McLanaghan, A. Moscrop, and N. Tregenza. 2005. Relative abundance of harbour porpoises
(Phocoena phocoena) from acoustic and visual surveys of the Baltic Sea and adjacent waters
during 2001 and 2002.
Journal of Cetacean Research and Management 7:51-57.
Gillespie, D. and O. Chappell. 2002. An automatic system for detecting and classifying the
vocalisations of harbour porpoises. Bioacoustics 13:37-61.
Gillespie, D., R. Leaper, J. Gordon, and K. Macleod. in press. An Integrated Data Collection
System for Line Transect Surveys Journal of Cetacean Research and Management.
Gillespie, D., R. Swift, M. Caillat, J. Gordon, and K. Macleod. In review. Acoustic detection and
tracking of harbor porpoise on line transect surveys. Journal of the Acoustical Society of
America.
Hammond, P. and K. Macleod. 2003. SCANS II - estimating cetacean abundance in European
Atlantic waters. Paper SC/55/SM22 presented to the Scientific Committee of International
Whaling Commission.:5pp.
Hammond, P. S., H. Benke, P. Berggren, D. L. Borchers, S. T. Buckalnd, A. Collet, M. P. Heide-
Jorgensen, S. Heimlich-Boran, A. R. Hiby, M. F. Leopold, and N. Oien. 1995. Distribution and
abundance of the harbour porpoise and other small cetaceans in the North Sea and adjacent
waters.240pp.
Hastie, G. D., B. Wilson, and P. M. Thompson. 2006. Diving deep in a foraging hotspot:
acoustic insights into bottlenose dolphin dive depths and feeding behaviour. Marine Biology
148:1181-1188.
Isojunno, S. 2008. Non-linear interactions predict harbour porpoise (Phocoena phocoena)
occurrence in strongly tidal habitat. MRes Thesis. University of St Andrews, St Andrews. 40pp.
JER3688 Welsh Assembly Government Planning & Development 28th March 2011
122

Studies of Marine Mammals in Welsh High Tidal Waters
Johnston, D. W., L. H. Thorne, and A. J. Read. 2005a. Fin whales Balaenoptera physalus and
minke whales Balaenoptera acutorostrata exploit a tidally driven island wake ecosystem in the
Bay of Fundy. Marine Ecology Progress Series 305:287-295.
Johnston, D. W., A. J. Westgate, and A. J. Read. 2005b. Effects of fine-scale oceanographic
features on the distribution and movements of harbour porpoises Phocoena phocoena in the
Bay of Fundy. Marine Ecology-Progress Series 295:279-293.
Kyhn, L. A., J. Tougaard, F. Jensen, M. Wahlberg, G. Stone, A. Yoshinaga, K. Beedholm, and
P. T. Madsen. 2009. Feeding at a high pitch: Source parameters of narrow band, high-
frequency clicks from echolocating off-shore hourglass dolphins and coastal Hector's dolphins.
Journal of the Acoustical Society of America 125:1783-1791.
Mason, T., D. Priestley, and D.E. Reeve. 2007. Monitoring near-shore shingle transport under
waves using a passive acoustic technique. Journal of the Acoustical Society of America.
122:737-746.
Otani, S., Y. Naito, and A. Kato. 2000. Diving behavior and swimming speed of a free-ranging
harbor porpoise, Phocoena phocoena. Marine Mammal Science 16:811-814.
Palka, D. 1996. Effects of Beaufort Sea State on the sightability of harbour porpoises in the Gulf
of Maine. Report of the International Whaling Commission:575-582.
Palka, D. 2000. Abundance of the Gulf of Maine/Bay of Fundy Harbor Porpoise Based on
Shipboard and Aerial Surveys during 1999. Northeast Fisheries Science Center Reference
Document 00-07.
Penrose, R. and C. Pierpoint. 1999. The use of Welsh coastal habitats as calving and nursery
grounds for the harbour porpoise (Phocoena phocoena). Contract Report No. 378. Countryside
Council for Wales, Bangor.
Pierpoint, C. 2001. Harbor Porpoise distribution in the coastal waters of SW Wales. International
Fund for Animal Welfare.
Pierpoint, C. 2006. A two-year pre-construction baseline of harbour porpoise activity at
Scarweather Sands offshore wind farm. . Report to Scarweather Sands Offshore Wind Farm
Limited.
Pierpoint, C. 2008. Harbour porpoise (Phocoena phocoena) foraging strategy at a high energy,
near-shore site in south-west Wales, UK. Journal of the Marine Biological Association of the
United Kingdom 88:1167-1173.
JER3688 Welsh Assembly Government Planning & Development 28th March 2011
123

Studies of Marine Mammals in Welsh High Tidal Waters
Pierpoint, C. J. L. 1993. Observations of harbour porpoise in Ramsey Sound, Dyfed. European
Research On Cetaceans 7:39-42.
Pierpoint, C. J. L., M. E. Baines, S. J. Earl, R. Harris, and N. J. C. Tregenza. 2000. Night-life of
the harbour porpoise. . European Research on Cetaceans - 13. Proc. 13th Ann. Conf. Valencia,
Spain , 1999.
Pierpoint, C. J. L., S. J. Earl, and M. E. Baines. 1994. Observations of harbour porpoise in West
Wales, 1993. European Research on Cetaceans - 8. Proc. 8th Ann. Conf. European Cetacean
Society. 8th Ann. Conf. European Cetacean Society, Montpellier, France.
Read, A. J. and A. J. Westgate. 1997. Monitoring the movements of harbour porpoises
(Phocoena phocoena) with satellite telemetry. Marine Biology 130:315-322.
Reid, J., P. G. H. Evans, and S. P. Northridge. 2003a. Atlas of cetacean distribution in north-
west European waters. Joint Nature Conservation Committee, Peterborough.
Reid, J., P. G. H. Evans, and S. P. Northridge. 2003b. Cetacean Distribution Atlas. Joint Nature
Conservation Committee, Peterborough.:68pp.
Santos, M. B. and G. J. Pierce. 2003. The diet of harbour porpoise (Phocoena phocoena) in the
northeast Atlantic. Oceanography and Marine Biology, Vol 41 41:355-390.
Santos, M. B., G. J. Pierce, J. A. Learmonth, R. J. Reid, H. M. Ross, I. A. P. Patterson, D. G.
Reid, and D. Beare. 2004. Variability in the diet of harbour porpoises (Phocoena phocoena) in
Scottish waters 1992-2003. Marine Mammal Science 20:1-27.
Shucksmith, R., N. H. Jones, G. W. Stoyle, A. Davies, and E. F. Dicks. 2009. Abundance and
distribution of the harbour porpoise (Phocoena phocoena) on the northcoast of Anglesey,
Wales, UK. Journal of the Marine Biological Association of the United Kingdom 89 1051-1058
SMRU Ltd. 2010. Approaches to marine mammal monitoring at marine renewable energy
developments. Report for Crown Estates (MERA 0309 TC) 110pp.
Sveegaard, S. and J. Teilmann. 2007. Identifying areas of high porpoise density using satellite
telemetry. In: ICES: Report of the Workshop on Fisheries Management in Marine Protected
Areas (WKFMMPA), 10-12 April 2007. International Council for the Exploration of the Sea.
ICES. - ICES CM 2007/MHC 06: 33-34.
JER3688 Welsh Assembly Government Planning & Development 28th March 2011
124
Studies of Marine Mammals in Welsh High Tidal Waters
Thomas, L., S. T. Buckland, E. A. Rexstad, J. L. Laake, S. Strindberg, S. L. Hedley, J. R. B.
Bishop, T. A. Marques, and K. P. Burnham. 2010. Distance software: design and analysis of
distance sampling surveys for estimating population size. Journal of Applied Ecology 47:5-14.
Thorne, P.D. 1985. The measurement of acoustic noise generated by moving artificial
sediments. Journal of the Acoustical Society of America. 78:1013-1023.
Thorne, P.D. 1986. Laboratory and marine measurements on the acoustic detection of sediment
transport. Journal of the Acoustical Society of America. 80:899-910.
Todd, V. L. G., W. D. Pearse, N. C. Tregenza, P. A. Lepper, and I. B. Todd. 2009. Diel
echolocation activity of harbour porpoises (Phocoena phocoena) around North Sea offshore gas
installations. Ices Journal of Marine Science 66:734-745.
Tougaard, J., J. Cartensen, M. S. Wisch, J. Teilmann, N. Bech, H. Skov, and O. D. Henriksen.
2005. Harbour porpoises on Horns Reef - Effects of the Horns Reef Wind Farm. Annual Status
Report 2004 to Elsam. National Environmental Research Institute, Denmark
Tougaard, J., L. R. Poulsen, M. Amundin, F. Larsen, J. Rye, and J. Teilman. 2006. Detection
function of T-PODs and estimation of porpoise densities. . Static Acoustic Monitoring of
Cetaceans. European Cetacean Society, Gdnyia, Poland. Special Issue 46:7-14.
Tregenza, N., Northridge, S.P., Rogan, E. & Hammond, P. 2001. Monitoring echo-location
activity of porpoise around set gillnets.62pp.
Tregenza, N. J. C. and C. Pierpoint. 2007. Choice of Habitat Use Statistic in Static Acoustic
Monitoring. . Proc. 21st Ann. Conf. European Cetacean Society. European Research on
Cetaceans - 21. Proc. 21st Ann. Conf. European Cetacean Society. European Cetacean
Society, San Sebastian, Spain.
UKHO. 2006. NP259 - Admiralty Tidal Stream Atlas: Irish Sea Eastern Part. United Kingdom
Hydrographic Office.
UKHO. 2009. NP201 - Admiralty Tide Tables, Volume 1, United Kingdom and Ireland (including
European Channel Ports). United Kingdom Hydrographic Office., Taunton, UK.
Verfuss, U. K., L. A. Miller, P. K. D. Pilz, and H. U. Schnitzler. 2009. Echolocation by two
foraging harbour porpoises (Phocoena phocoena). Journal of Experimental Biology 212:823-
834.
JER3688 Welsh Assembly Government Planning & Development 28th March 2011
125

Studies of Marine Mammals in Welsh High Tidal Waters
JER3688 Welsh Assembly Government Planning & Development 28th March 2011
126
Verfuss, U. K., L. A. Miller, and H. U. Schnitzler. 2005. Spatial orientation in echolocating
harbour porpoises (Phocoena phocoena). Journal of Experimental Biology 208:3385-3394.
Voulgaris, G., M.P. Wilkin, and M.B. Collins. 1995. The in-situ passive acoustic measurement of
shingle movement under waves and currents - instrument (TOSCA) development and
preliminary-results. Continental Shelf Research. 15:1195-1211.
Westgate, A. J., A. J. Read, P. Berggren, H. N. Koopman, and D. E. Gaskin. 1995. Diving
behaviour of harbour porpoises, Phocoena phocoena. Canadian Journal of Fisheries and
Aquatic Sciences 52:1064-1073.
Wilson, B., R. S. Batty, F. Daunt, and C. Carter. 2007. Collision risks between marine
renewable energy devices and mammals, fish and diving birds. Report to the Scottish
Executive. . Scottish Association for Marine Science, Oban, Scotland.
Wood, S. N. 2006. Generalized Additive Models. An Introduction with R., Chapman and
Hall/CRC, Boca Raton, Florida, USA.

Studies of Marine Mammals in Welsh High Tidal Waters
Glossary
ARGOS A worldwide tracking and environmental monitoring service utilising orbiting satellites
that pick up signals from tags. Location is determined by measuring Doppler shifts in the tag's
signals. Tags can send short data messages.
Clicks Single strong clicks that have the spectral and temporal characteristics of porpoise
clicks but occur on their own.
CPOD The latest variant of the POD porpoise detection device- see POD
Detection Function A function describing how detection rate decreases with distance. For
example, how relative probability of visual detection falls with distance from the trackline.
Detection functions are normally determined empirically by fitting a function to data collected
during surveys. The DISTANCE software includes routines for fitting several different families
of function.
Detection Positive Days (DPD) The number days within a time period when at least one
porpoise detection was made.
Detection Positive Minutes (DPM) The number of minute intervals in a time period in which
at least one porpoise detection was made. This is a measure often used to summarise
detections of porpoises by PODs- see PODS. This is a measure often used to summarise
detections of porpoises by PODs- see PODS.
DISTANCE The standard software for analysis of distance based survey data, for example line
transect data. DISTANCE is freeware maintained by the Centre for Research into Ecological &
Environmental Modelling (CREEM) at the University of St Andrews.
Effective Strip Width (ESW) The strip width centred on the trackline in a line transect survey
within which as many animals are missed as are detected outside the ESW. Thus, a line
transect survey can be considered to be equivalent to a strip transect survey with a strip width
equal to the ESW.
European Protected Species (EPS) A species, listed on Annex IV of the European Habitats
Directive, that is accorded strict protection by member states from various human activities,
including protection from disturbance. All cetacean species are EPS.
Events Instances which involve many click detections which are not on distinct tracks.
JER3688 Welsh Assembly Government Planning & Development 28th March 2011
127
Studies of Marine Mammals in Welsh High Tidal Waters
g(0) The proportion of animals on the trackline that are not detected during a line transect
survey.
GPS (Global Positioning System) An accurate real time worldwide positioning system which
utilises signals from a constellation of satellites maintained by the US military.
GSM (Global System for Mobile Communication) A widely used international standard for
mobile phones.
GSM/GPS Tag A telemetry device in which location is determined using the GPS system and
data (on location and other parameters) are transmitted using the GSM mobile phone network.
Typically, with marine mammals, data are archived and only downloaded when animals come
within range of mobile phone networks.
Logger A software program for collecting marine mammal survey and research data in the
field. Logger was written by Douglas Gillespie with support from the International Fund for
Animal Welfare (IFAW) and is freely available for projects generally aligned with IFAW's goals.
Multiple Tracks Similar to “Single Tracks” but involve more than one distinct track.
Odontocete The toothed whales, including all species of dolphin and porpoises.
On axis porpoise acoustic events Similar to “Events” but the bearings are all at 90 degrees.
PAMGUARD A suite of programs for detecting, characterising and localising cetacean
vocalisations in real time. PAMGUARD, which is currently funded by the Joint Industry Project
E&P Sound and Marine Life program, is maintained by the Sea Mammal Research Unit at the
University of St Andrews and is freely available for non commercial use.
Passive Acoustic Monitoring (PAM) A term applied to the process of detecting marine
mammals by detecting, classifying and localising (DCL) their vocalisations using a combination
of hydrophone equipment and software and human monitoring.
POD A commercially available automated, static acoustic monitoring device produced by
Chelonia Ltd. PODs are the most widely used autonomous acoustic monitoring device for
marine mammals in Europe. Although optimised for detecting and classifying porpoises, the
clicks of most other odontocetes can be detected on PODs.
Primary Observers The principal observers on a survey responsible for collecting the primary
sighing data from which population density estimates will be calculated.
JER3688 Welsh Assembly Government Planning & Development 28th March 2011
128

Studies of Marine Mammals in Welsh High Tidal Waters
Rainbow Click A program for detecting, classifying and localising transient sounds optimised
for odontocete clicks. Initially developed for detecting sperm whales, advances in digitisation
hardware and computer processing power mean that Rainbow click can now be used for
porpoises. Rainbow Click was written by Douglas Gillespie with support from the International
Fund for Animal Welfare. Rainbow click is freely available for research aligned with the
objectives of IFAW.
Satellite Relay Data Logger A type of telemetry device which archives data and relays it
through satellites. The SMRU SRDL tag, widely used with seals, sends short data messages
using the ARGOS system.
SCANS, SCANSII SCANS stands for Small Cetacean Abundance in the North Sea and
Adjacent waters. These were two large scale surveys conducted on the Northern European
Continental Shelf in July 1994 and July 2005. Harbour porpoise were a particular target for
these surveys and an important aim was to determine whether levels of by catch in the area
could be sustained by the population. The SCANS surveys provided opportunities for improving
methods for visual and towed hydrophone survey.
Special Area of Conservation (SAC) These are protected areas established under the EU
Habitats Directive to provide protection for species on Annex I. Bottlenose dolphins, harbour
porpoises and both grey and common seals are Annex I species.
Single Tracks Are encounters consisting of a single distinct track of clicks on bearings altering
regularly from ahead to astern.
Tidal Rapid An area where tidal currents flow at a particularly high rate. Often these coincide
with restrictions between two pieces of land or are found at headlands.
Towed Hydrophone A hydrophone that is towed behind a vessel. Elements are mounted
within a streamlined housing to reduce flow noise. A long tow cable distances the hydrophones
from vessel noise
TPOD The TPOD was the second generation of POD design. see POD.
Trackline The course of the survey platform during a line transect survey
Tracker Observer A visual observer whose task is to locate and track animals observed during
a survey. Often the intention is to measure the probability of detection of the primary observers
by recording the proportion of tracked animals detected.
JER3688 Welsh Assembly Government Planning & Development 28th March 2011
129

Studies of Marine Mammals in Welsh High Tidal Waters
JER3688 Welsh Assembly Government Planning & Development 28th March 2011
130
Vertical Hydrophone Array An array of hydrophones deployed in a straight line near vertically.
A vertical array is the simplest configuration for calculation of the depth of a sound source.

Studies of Marine Mammals in Welsh High Tidal Waters
Appendices
JER3688 Welsh Assembly Government Planning & Development 28th March 2011

Studies of Marine Mammals in Welsh High Tidal Waters
JER3688 Welsh Assembly Government Planning & Development 28th March 2011
Appendix 1
Table summarising vessel based survey activities using Boy Brendan during the Welsh Tidal
Turbine Project in July/August 2009. Lowest and highest recorded sea states and survey effort
(in terms of both hours and track-line covered) are shown for several types of survey activity-
Acoustic only, towed acoustic data collected but no visual effort,
Single platform- two visual observers on the sighting tower but no tracker.
Dual platform, two visual observers and tracker on sighting platform.
Passage, boat transiting off track-lines, acoustic and visual data may be collected but
will not contribute to primary survey effort.
See main body of report for additional details.
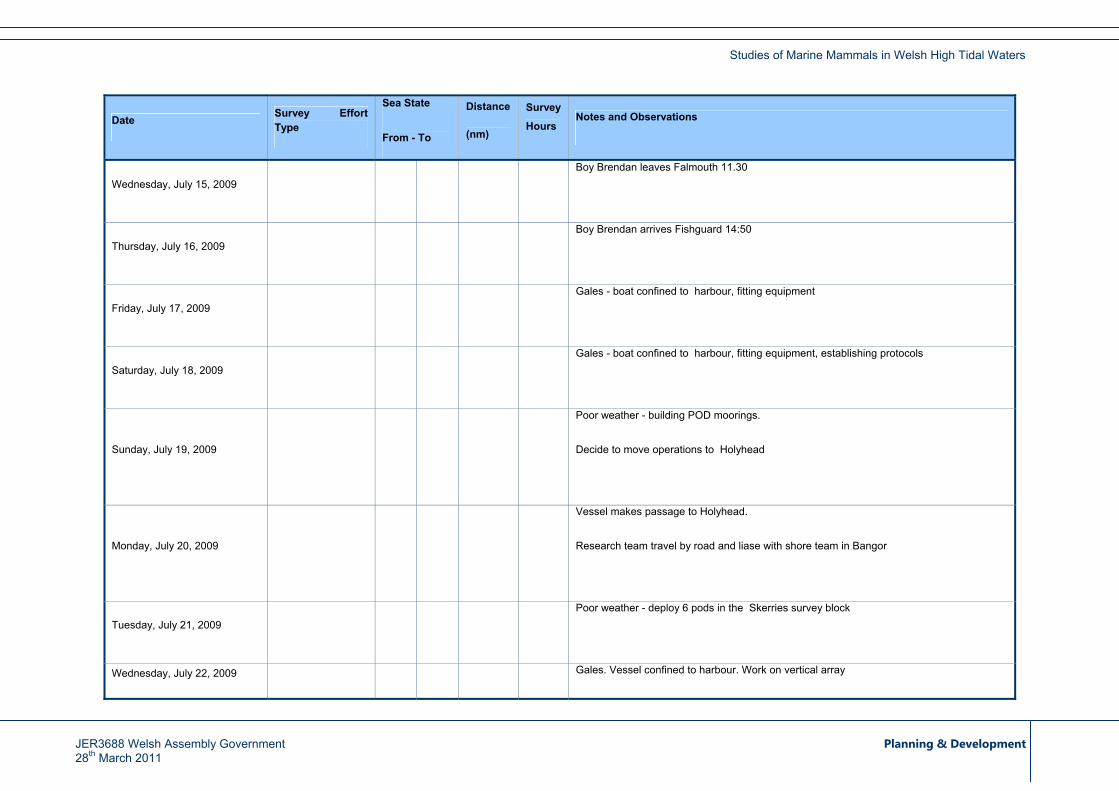
Studies of Marine Mammals in Welsh High Tidal Waters
Date Survey Effort Type
Sea State
From - To
Distance
(nm)
Survey
Hours Notes and Observations
Wednesday, July 15, 2009 Boy Brendan leaves Falmouth 11.30
Thursday, July 16, 2009 Boy Brendan arrives Fishguard 14:50
Friday, July 17, 2009 Gales - boat confined to harbour, fitting equipment
Saturday, July 18, 2009 Gales - boat confined to harbour, fitting equipment, establishing protocols
Sunday, July 19, 2009
Poor weather - building POD moorings.
Decide to move operations to Holyhead
Monday, July 20, 2009
Vessel makes passage to Holyhead.
Research team travel by road and liase with shore team in Bangor
Tuesday, July 21, 2009 Poor weather - deploy 6 pods in the Skerries survey block
Wednesday, July 22, 2009 Gales. Vessel confined to harbour. Work on vertical array
JER3688 Welsh Assembly Government Planning & Development 28th March 2011

Studies of Marine Mammals in Welsh High Tidal Waters
JER3688 Welsh Assembly Government Planning & Development 28th March 2011
Date Survey Effort Type
Sea State
From - To
Distance
(nm)
Survey
Hours Notes and Observations
Thursday, July 23, 2009 Single Plat Effort 4 4 23.2 6.8 Surveys in Skerries block attempted in poor weather. Tracking (dual platform) impossible.
Dual Plat Effort 2.5 4 15.0 2.6 Friday, July 24, 2009
Single Plat Effort 3 5 23.1 5.0
Surveys in Skerries block. Dual platform visual surveys attempted for short period
Dual Plat Effort 2 4 50.0 8.9 Saturday, July 25, 2009
Passage 2 4 15.0 2.5
Surveys in the Skerries block. Worsening sea conditions force early abandonment of survey
Sunday, July 26, 2009 Gales - boat in harbour, work on vertical array
Acoustic effort only 2.5 5 58.0 8.2 Monday, July 27, 2009
Passage 2.5 5 23.5 3.4 Weather too poor for visual survey. Towed acoustic monitoring only
Acoustic effort only 3 5 4.0 0.6 Tuesday, July 28, 2009
Passage 3 4 5.0 0.7 Poor weather forces surveys to be abandoned in rough seas
Acoustic effort only 4 5 4.6 0.7
Dual Plat Effort 1 5 45.0 5.8
Off Effort 4 4 1.7 0.2
Passage 2 5 17.1 2.8
Wednesday, July 29, 2009
Single Plat Effort 2 2.5 7.1 1.0
Mixed weather conditions. Level of effort and type of survey adapted to make the most of changing conditions

Studies of Marine Mammals in Welsh High Tidal Waters
JER3688 Welsh Assembly Government Planning & Development 28th March 2011
Date Survey Effort Type
Sea State
From - To
Distance
(nm)
Survey
Hours Notes and Observations
Thursday, July 30, 2009 Poor weather forces early abandonment of surveys
Tuesday, July 31, 2007 Gales boat in harbour, fixing equipment etc
Acoustic effort only 3 5 40.0 4.5
Dual Plat Effort 2 4 16.6 2.2
Saturday, August 01, 2009
Single Plat Effort 2.5 5 9.2 1.9
Weather poor but improving through the day allowing some visual effort
Acoustic effort only 2 2 3.5 0.6
Dual Plat Effort 2 4 11.2 1.6
Off Effort 2 5 4.7 2.2
Sunday, August 02, 2009
Single Plat Effort 2 4 8.5 1.5
Mandy McMath of CCW on board. Poor weather and developing mechanical problems on the vessel precipitate shortened survey.
Monday, August 03, 2009 Poor weather and engine problems keep boat in harbour
Tuesday, August 04, 2009 Poor weather and engine problems keep boat in harbour
Acoustic effort only 2.5 3 11.4 2.9
Dual Plat Effort 2 5 22.2 3.8
Drifting 2 4 4.1 2.9
Off Effort 2 3 7.9 2.3
Wednesday, August 05, 2009
Single Plat Effort 2.5 4 3.7 0.9
Survey in Skerries block and first trials of vertical array
Thursday, August 06, 2009 Acoustic effort only 2 3 3.5 0.8 Improving weather conditions. Completed survey work and drifting surveys with vertical
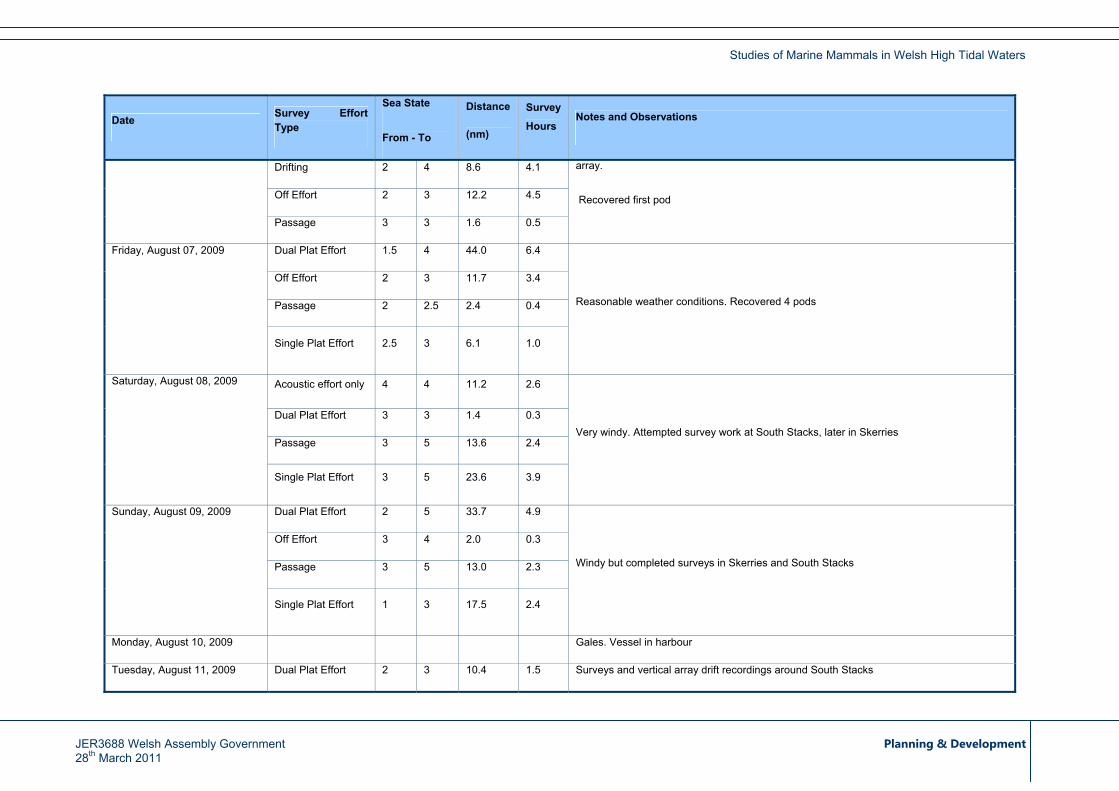
Studies of Marine Mammals in Welsh High Tidal Waters
JER3688 Welsh Assembly Government Planning & Development 28th March 2011
Date Survey Effort Type
Sea State
From - To
Distance
(nm)
Survey
Hours Notes and Observations
Drifting 2 4 8.6 4.1
Off Effort 2 3 12.2 4.5
Passage 3 3 1.6 0.5
array.
Recovered first pod
Dual Plat Effort 1.5 4 44.0 6.4
Off Effort 2 3 11.7 3.4
Passage 2 2.5 2.4 0.4
Friday, August 07, 2009
Single Plat Effort 2.5 3 6.1 1.0
Reasonable weather conditions. Recovered 4 pods
Acoustic effort only 4 4 11.2 2.6
Dual Plat Effort 3 3 1.4 0.3
Passage 3 5 13.6 2.4
Saturday, August 08, 2009
Single Plat Effort 3 5 23.6 3.9
Very windy. Attempted survey work at South Stacks, later in Skerries
Dual Plat Effort 2 5 33.7 4.9
Off Effort 3 4 2.0 0.3
Passage 3 5 13.0 2.3
Sunday, August 09, 2009
Single Plat Effort 1 3 17.5 2.4
Windy but completed surveys in Skerries and South Stacks
Monday, August 10, 2009 Gales. Vessel in harbour
Tuesday, August 11, 2009 Dual Plat Effort 2 3 10.4 1.5 Surveys and vertical array drift recordings around South Stacks

Studies of Marine Mammals in Welsh High Tidal Waters
JER3688 Welsh Assembly Government Planning & Development 28th March 2011
Date Survey Effort Type
Sea State
From - To
Distance
(nm)
Survey
Hours Notes and Observations
Drifting 2 5 12.3 4.3
Off Effort 2.5 5 13.6 3.2
Passage 2 4 9.0 2.0
Dual Plat Effort 1 2 9.8 1.2
Drifting 1 2.5 7.8 4.2
End of Day 2.5 2.5 1.8 0.3
Off Effort 2 2 0.7 0.2
Wednesday, August 12, 2009
Passage 0.5 3 18.6 3.2
Weather improving after a rainy start. Survey work and vertical array drift recordings in Skerries and Middle mouse (Ynys Badrig). Last day working in Anglesey
Thursday, August 13, 2009 Vessel refuelled and leaves harbour en route to Fishguard. Team tidy up and drive down
Friday, August 14, 2009 Gales. Vessel confined to harbour in Fishguard
Saturday, August 15, 2009 Gales. Vessel confined to harbour in Fishguard
Off Effort 2 2 1.3 0.2 Sunday, August 16, 2009
Passage 2 5 48.3 8.2 Vessel moved down to Ramsey in heavy weather. Laid first two PODs
Acoustic effort only 3 3 1.6 0.2
Dual Plat Effort 1 3 29.4 3.8
Off Effort 2 3 10.2 3.0
Passage 2 2.5 6.4 1.1
Monday, August 17, 2009
Single Plat Effort 2 4 3.6 0.6
Deployed remaining PODs and surveyed in Ramsey Sound.

Studies of Marine Mammals in Welsh High Tidal Waters
JER3688 Welsh Assembly Government Planning & Development 28th March 2011
Date Survey Effort Type
Sea State
From - To
Distance
(nm)
Survey
Hours Notes and Observations
Drifting 2 3 3.2 1.2
Off Effort 2 3 2.1 1.3
Passage 2 4 9.8 2.0
Tuesday, August 18, 2009
Single Plat Effort 2 5 14.6 2.1
Continued survey in Ramey sound in worsening weather. Some VA drift surveys. Vessel ran for shelter in Fishguard overnight
Wednesday, August 19, 2009 Storm bound Fishguard
Thursday, August 20, 2009 Storm bound Fishguard
Acoustic effort only 3 5 72.5 10.4 Friday, August 21, 2009
Off Effort 3 3 9.2 2.3 Attempted survey Clerks and Bishops box off Ramsay
Drifting 2 2 1.4 0.6
Off Effort 2 3 11.0 4.6
Saturday, August 22, 2009
Passage 2 2.5 5.5 1.9
Strong winds. Attempted vertical array drift surveys and shore tracking in shelter under cliffs at Fishguard
Sunday, August 23, 2009 Storm bound Fishguard
Acoustic effort only 2 4 8.6 1.1
Drifting 2 2.5 1.0 0.2
Off Effort 2 4 8.1 2.0
Monday, August 24, 2009
Passage 2 4 38.8 5.7
Weather improving. Survey effort in Bishops and Clerks box. Short drift survey in Ramsay sound. Anchored Ramsay Sound
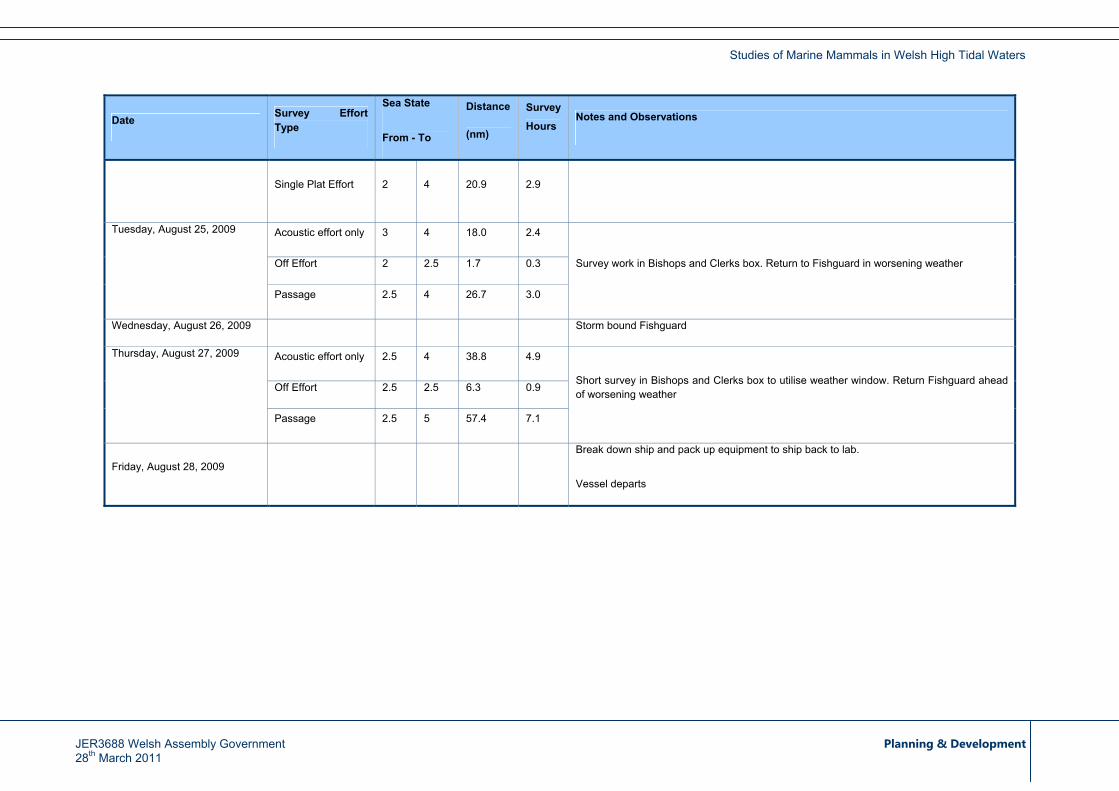
Studies of Marine Mammals in Welsh High Tidal Waters
JER3688 Welsh Assembly Government Planning & Development 28th March 2011
Date Survey Effort Type
Sea State
From - To
Distance
(nm)
Survey
Hours Notes and Observations
Single Plat Effort 2 4 20.9 2.9
Acoustic effort only 3 4 18.0 2.4
Off Effort 2 2.5 1.7 0.3
Tuesday, August 25, 2009
Passage 2.5 4 26.7 3.0
Survey work in Bishops and Clerks box. Return to Fishguard in worsening weather
Wednesday, August 26, 2009 Storm bound Fishguard
Acoustic effort only 2.5 4 38.8 4.9
Off Effort 2.5 2.5 6.3 0.9
Thursday, August 27, 2009
Passage 2.5 5 57.4 7.1
Short survey in Bishops and Clerks box to utilise weather window. Return Fishguard ahead of worsening weather
Friday, August 28, 2009 Break down ship and pack up equipment to ship back to lab.
Vessel departs

Studies of Marine Mammals in Welsh High Tidal Waters
Appendix 2
JER3688 Welsh Assembly Government Planning & Development 28th March 2011

Appendix 2 to the Phase 2 - Studies of Marine Mammals in Welsh High Tidal Energy Waters
On Behalf of
Welsh Assembly Government
Date: 28th March 2011 Our Ref: JER3688 RPS Conrad House Beaufort Square Chepstow Monmouthshire NP16 5EP Tel: (0)1291 621 821 Fax: (0)1291 627 827 Email: [email protected]
This document is Printed on FSC certified, 100% post-consumer recycled paper, bleached using an elemental chlorine- free process.
JER3688 Welsh Assembly Government Planning & Development 28th March 2011 IMS J 0014v0

Appendix 2 to the the Phase 2 - Studies of Marine Mammals in Welsh High Tidal Energy Waters
Quality Management
Prepared by: Jonathan Gordon
Authorised by: Nicola Simpson
Date: 28th March 2011
Revision: 2
Project Number: JER3688
Document Reference: JER3688R101126JG Appendix 2 to Phase 2 - Studies of Marine Mammals in Welsh High Tidal Waters.doc
Document File Path: O:\JER3688 - Marine renewable Strategy for Wales\STAGE 2\Project File\Task 1&2 Marine Mammals Collision Risk\JER3688R101126JG Appendix 2 to Phase 2 - Studies of Marine Mammals in Welsh High Tidal Waters.doc
DISCLAIMER
The opinions and interpretations presented in this report represent our best technical interpretation of the data made available to us.
However, due to the uncertainty inherent in the estimation of all parameters, we cannot, and do not guarantee the accuracy or
correctness of any interpretation and we shall not, except in the case of gross or wilful negligence on our part, be liable or
responsible for any loss, cost damages or expenses incurred or sustained by anyone resulting from any interpretation made by any
of our officers, agents or employees.
Except for the provision of professional services on a fee basis, RPS/Ecologic does not have a commercial arrangement with any
other person or company involved in the interests that are the subject of this report.
RPS/Ecologic cannot accept any liability for the correctness, applicability or validity for the information they have provided, or indeed
for any consequential costs or losses in this regard. Our efforts have been made on a "best endeavours" basis and no responsibility
or liability is warranted or accepted by RPS/Ecologic.
COPYRIGHT © RPS
The material presented in this report is confidential. This report has been prepared for the exclusive use of Welsh Assembly
Government and shall not be distributed or made available to any other company or person without the knowledge and written
consent of Welsh Assembly Government or RPS/Ecologic.
JER3688 Welsh Assembly Government Planning & Development 28th March 2011
i

Appendix 2 to the the Phase 2 - Studies of Marine Mammals in Welsh High Tidal Energy Waters
Contents
Quality Management ..................................................................................................i
Contents .....................................................................................................................ii
1 Introduction.........................................................................................................1
2 Software Development .......................................................................................2
2.1 Markov Chain Monte Carlo localisation .............................................................2
Background ...............................................................................................................2
Compensating for cable angle...................................................................................5
Implementation ..........................................................................................................3
Improved interpretation and measurement of time of arrival delays between
hydrophones..............................................................................................................4
3 Calibration Trials ................................................................................................6
3.2 Calibration results................................................................................................7
4 Dive Profiles ......................................................................................................10
5 Conclusion ........................................................................................................13
JER3688 Welsh Assembly Government Planning & Development 28th March 2011
ii

Appendix 2 to the the Phase 2 - Studies of Marine Mammals in Welsh High Tidal Energy Waters
Tables and Figures
Tables
Table 3-1 Range and depth of the sound source at different times during calibration trials to
measure the accuracy of localisation calculations. ............................................................... 6
Figures
Figure 2-1 A vertical array of four hydrophones shows the far field approximation of 3D cones
symmetric around the vertical axis. Each rectangle represents a hydrophone pair. The
yellow circle represents the points at which the cones cross................................................ 3
Figure 2-2 Vector diagram showing distance from source to hydrophone 2 in 3D space........ 4
Figure 2-3 Diagram of the vertical array. The shaded rectangles each represent a
hydrophone pair. The red lines indicate the inclination angles Θ1, Θ2 ,Θ3 and circles
represent the resultant possible azimuthal components due to unknown direction and
inclination of the cable. The co-ordinate axis represented the Cartesian co-ordinate system
used throughout the project. ................................................................................................. 2
Figure 2-4 Inclination angles of the array over time May18 2010. Red represents to top
inclinometer and blue represents the bottom inclinometer. Time is in matlab datum format
which converts date/time in a single number starting at 0 on Jan 0000 00:00:00................. 3
Figure 3-1 Depth of successful localisations. Red triangles represent the mean depth value of
all MCMC chains and error bars represent the standard deviation of the MCMC probability
density cloud. ........................................................................................................................ 8
Figure 3-2 Mean depth values of localisations. Red triangles represent the mean depth value
of all localisations for each ping. The blue diamonds represent the actual depth of the
hydrophone upon output of each simulated porpoise click train. The positions of the
hydrophone for pings which were not successfully localised have been discarded. A
systemic error of -2 m has been compensated for. ............................................................... 8
Figure 3-3 Range of successful localisations. Red triangles represent the mean range value
of all MCMC chains and error bars represent the standard deviation of the MCMC
probability density cloud........................................................................................................ 9
JER3688 Welsh Assembly Government Planning & Development 28th March 2011
iii

Appendix 2 to the the Phase 2 - Studies of Marine Mammals in Welsh High Tidal Energy Waters
JER3688 Welsh Assembly Government Planning & Development 28th March 2011
iv
Figure 3-4 Mean range values of localisations. Red triangles represent the mean range value
of all localisations for each ping. The blue diamonds represent the actual range of the
hydrophone upon output of each simulated porpoise click train. The positions of the
hydrophone for pings which were not successfully localised have been discarded. ............ 9
Figure 4-1 Fine scale plots of porpoise depth (calculated from vertical array recordings)
against time showing depth profiles for diving harbour porpoises. ..................................... 12

Appendix 2 to the the Phase 2 - Studies of Marine Mammals in Welsh High Tidal Energy Waters
1 Introduction
1.1.1 The subproject to measure the dive depth and underwater behaviour of harbour
porpoise in tidal rapids using a vertical array (Chapter 5) involved the development of
completely new methodology and hardware and involved some technical risk. It was
therefore appropriate that we treated this as a proof of concept study and invested rather
limited field and analysis resource to the work while we were still unsure of its
performance. However, the encouraging results from our initial analysis of vertical array
data (Chapter 5) encouraged us to undertake additional work to explore an alternative
analysis method using Markov Chain Monte Carlo methods, and to use these to conduct
more detailed analysis of acoustic encounters to provide information on dive profiles. We
also carried out and analysed some additional field trials using a synthetic porpoise
sound generation device to provide ground truth data in realistic field conditions.
JER3688 Welsh Assembly Government Planning & Development 28th March 2011
1

Appendix 2 to the the Phase 2 - Studies of Marine Mammals in Welsh High Tidal Energy Waters
2 Software Development
2.1 Markov Chain Monte Carlo localisation
Background
2.1.1 An array of four or more hydrophones can localise in three-dimensional space. In this
case practical considerations related to maintaining an array configuration in strong tidal
currents led us to use a vertical array consisting of two hydrophone pairs. Although the
required number of hydrophones for three-dimensional localisation was met, the linearity
of the array results in degeneracy of position after localisation so that only range and
depth information were provided. Consider a click incident on a single pair of
hydrophones; the only information that can be extracted is the bearing to the sound
source (porpoise). Because of the broadly omni-directional nature of hydrophones this
bearing is resolved in three-dimensional space as a cone of possible locations. The
porpoise can be located anywhere on the surface of this cone; however, the length of
the cone is unknown. When a second pair of hydrophones is introduced a second cone
results. Where the surfaces of these two cones cross indicates the position of the
porpoise. For a three-dimensional array of four hydrophones there are six possible
cones and there will generally be only one crossing point, providing three-dimensional
point localisation. However, because of the symmetry of the vertical array the cones
always cross each other in perfect alignment, resulting in a ring of possible locations
centred on the array (Figure 2-1). Therefore both depth and range can be accurately
determined.
JER3688 Welsh Assembly Government Planning & Development 28th March 2011
2

Appendix 2 to the the Phase 2 - Studies of Marine Mammals in Welsh High Tidal Energy Waters
Figure 2-1 A vertical array of four hydrophones shows the far field approximation of
3D cones symmetric around the vertical axis. Each rectangle represents a hydrophone
pair. The yellow circle represents the points at which the cones cross.
2.1.2 Time of arrival delays were calculated for each hydrophone using a combination of
PAMGUARD and custom Java script (see later) and a Markov Chain Monte Carlo
Algorithm was then utilised to localise each click.
2.1.3 Markov Chain Monte Carlo is a common statistical method widely used in physics and
astronomy. Figure 2-2 shows multiple hydrophones represented by black dots in three-
dimensional space. r(i) and s represent the vectors from the origin to hydrophone i and
the source respectively. Considering distance=speed x time this leads to the equation
(rx (i) − sx)2 + (ry(i) − sy)2 + (rz(i) − sz)
2 = c2 *T(i)2
where c is the speed of sound, T(i) is the total time from the source to hydrophone i with
rx/y/z and sx/y/z the Cartesian components of r and s. Rearranging this yields.
T(i) =((rx (i) − sx )2 + (ry (i) − sy )2 + (rz (i) − sz)
2)c 2
JER3688 Welsh Assembly Government Planning & Development 28th March 2011
3

Appendix 2 to the the Phase 2 - Studies of Marine Mammals in Welsh High Tidal Energy Waters
JER3688 Welsh Assembly Government Planning & Development 28th March 2011
4
2.1.4 The significance of this equation is that it allows the calculation of time delays between
elements in a hydrophone array for a source located at any point in three-dimensional
space.
2.1.5 Although trivial, this forms the basis of Markov Chain Monte Carlo localisation, from now
on referred to as MCMC. MCMC localisation works by taking a random point in space
and calculating the χ2 for that location using.
Figure 2-2 Vector diagram showing distance from source to hydrophone 2 in 3D
space.
2.1.6 The significance of this equation is that it allows the calculation of time delays between
elements in a hydrophone array for a source located at any point in three-dimensional
space.
2.1.7 Although trivial this forms the basis of Markov Chain Monte Carlo Localisation- from now
on referred to as MCMC. MCMC localisation works by taking a random point in space
and calculating the χ2 for that location using.
2.1.8 Where τobs (ij) is the actual observed time delay between hydrophones i and j and τcalc
(ij) is the calculated time delay between hydrophones i and j from an acoustic source if it
was at the assumed location. ε represents the expected error in observed data. For a
four hydrophone array i=1,1,1,2,2,3 and j=2,3,4,3,4,4.
z
y
x
s
r(2)
Source
χ 2 =τ obs(ij) − τ calc (ij)( )2
ε2∑

Appendix 2 to the the Phase 2 - Studies of Marine Mammals in Welsh High Tidal Energy Waters
JER3688 Welsh Assembly Government Planning & Development 28th March 2011
2.1.9 The algorithm then executes a small random "jump" in space using a cylindrical co-
ordinate system and the χ2 for this new location is calculated using the same formula.
2.1.10 If χ2 is lower at the new location the jump is deemed successful, the new location is
adopted. If χ2 is not lower then the jump is only accepted with a probability of
p = e−
Δχ 2
2
⎛
⎝ ⎜
⎞
⎠ ⎟
2.1.11 Where ∆χ2 represents the difference in χ2 values between the previous and new jump
point. If still unsuccessful the new location is discarded and another random jump
calculated from the previous location. If successful then the jump is instigated from the
new location. In this way a chain of successful jumps results, converging quickly to the
likely porpoise location. Once close to this location the chain then jumps around it
creating a cloud of points, the density of which represents a probability distribution of the
porpoise’s position.
2.1.12 The power of this technique is that it provides a reliable measure of the probability
distribution of location and it can also easily incorporate other unknown parameters, in
addition to the location of the porpoise. In the case of the vertical array for example it is
possible to allow the chain to search for unknowns in the position of the array.
Compensating for cable angle
2.1.13 Inclinometers were included in the array but they provided incomplete information on the
array position. The inclinometer located on the top of the array was kept in line with the
bow of the survey vessel and thus provides exact information on the orientation of the
top of the cable. However, due to the twist in the cable the orientation of the bottom
inclinometer was not known and therefore only provided limited information. The
orientation of the cable connecting both hydrophones is completely unknown. If one
assumes inclination angles of Θ and azithumal angles of Φ (Figure 2-3) then there are
three unknowns, Θ2,Φ2 and Φ3.
5

Appendix 2 to the the Phase 2 - Studies of Marine Mammals in Welsh High Tidal Energy Waters
Figure 2-3 Diagram of the vertical array. The shaded rectangles each represent a
hydrophone pair. The red lines indicate the inclination angles Θ1, Θ2 ,Θ3 and circles
represent the resultant possible azimuthal components due to unknown direction and
inclination of the cable. The co-ordinate axis represented the Cartesian co-ordinate
system used throughout the project.
JER3688 Welsh Assembly Government Planning & Development 28th March 2011
2
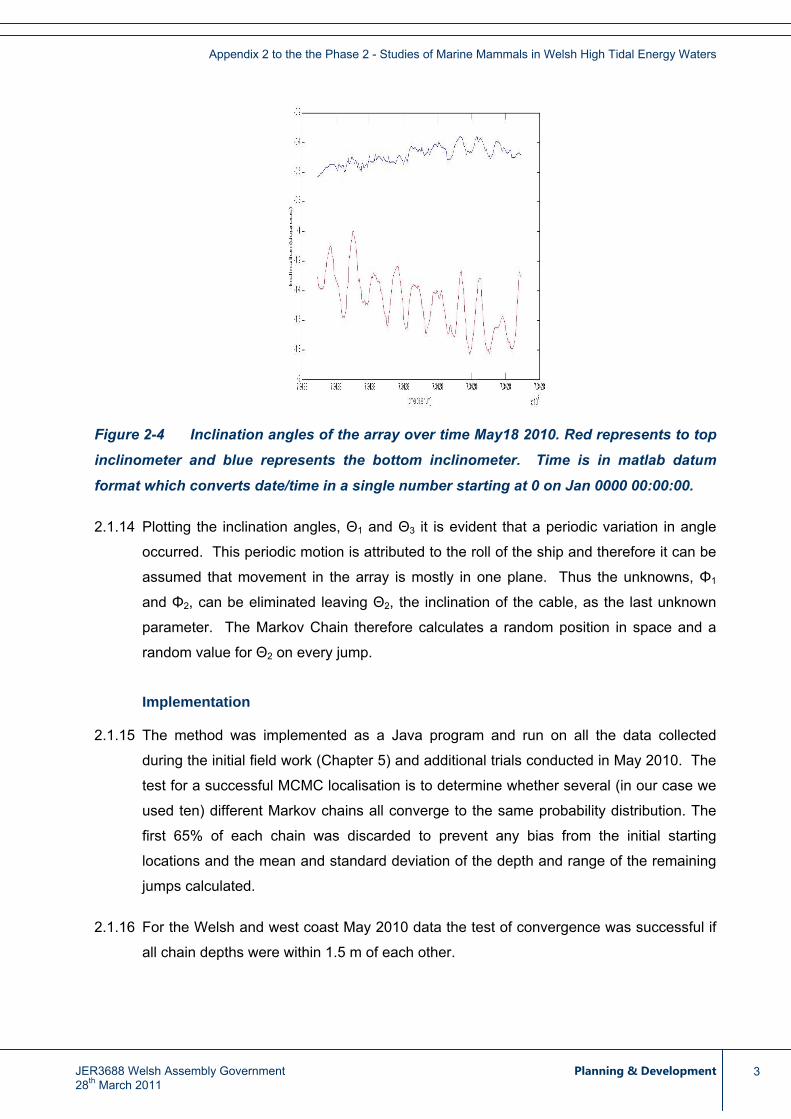
Appendix 2 to the the Phase 2 - Studies of Marine Mammals in Welsh High Tidal Energy Waters
Figure 2-4 Inclination angles of the array over time May18 2010. Red represents to top
inclinometer and blue represents the bottom inclinometer. Time is in matlab datum
format which converts date/time in a single number starting at 0 on Jan 0000 00:00:00.
2.1.14 Plotting the inclination angles, Θ1 and Θ3 it is evident that a periodic variation in angle
occurred. This periodic motion is attributed to the roll of the ship and therefore it can be
assumed that movement in the array is mostly in one plane. Thus the unknowns, Φ1
and Φ2, can be eliminated leaving Θ2, the inclination of the cable, as the last unknown
parameter. The Markov Chain therefore calculates a random position in space and a
random value for Θ2 on every jump.
Implementation
2.1.15 The method was implemented as a Java program and run on all the data collected
during the initial field work (Chapter 5) and additional trials conducted in May 2010. The
test for a successful MCMC localisation is to determine whether several (in our case we
used ten) different Markov chains all converge to the same probability distribution. The
first 65% of each chain was discarded to prevent any bias from the initial starting
locations and the mean and standard deviation of the depth and range of the remaining
jumps calculated.
2.1.16 For the Welsh and west coast May 2010 data the test of convergence was successful if
all chain depths were within 1.5 m of each other.
JER3688 Welsh Assembly Government Planning & Development 28th March 2011
3

Appendix 2 to the the Phase 2 - Studies of Marine Mammals in Welsh High Tidal Energy Waters
2.1.17 Final data was output to a spreadsheet showing time, depth and range along with errors
for each localised click.
Improved interpretation and measurement of time of arrival delays between
hydrophones
2.1.18 The recorded wav files from each hydrophone were run through PAMGUARD to detect
likely porpoise clicks and a specially written Java program was then used to identify
probable corresponding clicks on different hydrophones and localise using the MCMC
techniques discussed above.
2.1.19 First attempts at analysis (Chapter 5) simply selected a “primary hydrophone” and then
detected all clicks on that hydrophone. For each of these "primary" clicks a time window
was determined on the acoustic data channel from every other hydrophone based on
the acoustic travel time to that hydrophone from the primary hydrophone. Clicks outside
these time windows could not possibly match the primary click. If only one click was
detected within each of the time windows a localisation attempt occurred. If more than
one click was detected within any of the time windows the data was considered
"ambiguous" and discarded. This is a wasteful procedure because echoes and other
clicks in rapid click trains often occur within the same time windows on the other
channels and, as a consequence, many localisation attempts being abandoned.
Routines were therefore developed for recognising and appropriately processing echoes
and other "supernumerary" clicks would allow a greater number of localisations to be
perfumed, especially in recordings made in reverberant conditions.
2.1.20 The first procedure developed involved retaining the clicks within any time window with
more than one click that resulted in the shortest time delay. This was based on a simple
assumption that a click echo will have a greater travel time than the click itself.
Application of this procedure more than doubled the number of successful localisations
from the records demonstrating the value of this relatively simple method.
2.1.21 A more developed algorithm was then created to further reduce the amount of data
discarded. Again a primary hydrophone was designated and time windows created on
the other hydrophone channels. However, in this case time delays between all possible
combinations of clicks within the windows were calculated and localised. The Markov
Chain Monte Carlo method will generally discard inconsistent time delays and those that
are successfully localised can be easily rated in terms of their quality by determining the
average chi value of each chain. In this way localisations based on echoes or aliased
JER3688 Welsh Assembly Government Planning & Development 28th March 2011
4

Appendix 2 to the the Phase 2 - Studies of Marine Mammals in Welsh High Tidal Energy Waters
clicks can be discarded and the ‘true’ localisations retained. When this procedure was
implemented the number of successful localisations was increased 3.5 times.
2.1.22 Although this second more complex approach produced a further improvement i it
comes with some overheads because localising every possible combination of clicks is
computationally time consuming.
2.1.23 A choice of which method to apply for a particular analysis can be made based on the
amount of data that needs to be analysed and the importance of being able to locate as
many clicks as possible.
2.1.24 One related problems remains. Given the highly directional nature of porpoise clicks, in
large arrays of hydrophones, it could often be the case that a click would not occur on
the primary hydrophone but would occur on sufficient of the others to allow a
localisation. For example, if a six hydrophone array has incident clicks on every
hydrophone bar the primary hydrophone the five clicks on the other channels would be
discarded even though five hydrophones are perfectly capable of producing a
localisation in three dimensions.
2.1.25 Future development will explore refining the criteria for interpreting click combinations
using waveform analysis (echoes tend to have a less well-defined wave envelope than
directly received clicks) and working on a method to ensure click combinations on
hydrophones other than the primary hydrophone are not discarded.
JER3688 Welsh Assembly Government Planning & Development 28th March 2011
5

Appendix 2 to the the Phase 2 - Studies of Marine Mammals in Welsh High Tidal Energy Waters
3 Calibration Trials
3.1.1 A porpoise click generator comprising of a hydrophone connected to the output of a
large Sony XPLOD CM-2200GTX 12v amplifier receiving signals from an NI 6251 DAQ
card was assembled and used as a source to measure the performance of the vertical
array. (We are grateful to Jay Barlow, NOAA SWFC for suggesting this configuration of
equipment). A wav file comprising of a wave train of twenty simulated porpoise clicks
over two one second was created in MATLAB and output to the National Instruments
card using the LabView Program. The equipment was deployed from a floating inflatable
dinghy at a series of ranges between 50 m and 250 m from the research vessel which
was also drifting. At each "station" the transmission hydrophone was deployed at four
different depths. (Table 3-1
Table 3-1 Range and depth of the sound source at different times during calibration
trials to measure the accuracy of localisation calculations.
). Range was measured using laser range finding binoculars
accurate to 0.5 m and depth of the transmitting hydrophone was recorded using a
UWATEC Aladin prime dive computer accurate to 0.1 m.
3.1.2 The vertical array was configured with hydrophones at water depths of 4.77, 5.13, 18.13
and 18.38 m and kept taut with a 100 kg weight.
Time Distance from Boat (m) Depth of Hydrophone (m)
18:57:32 82 10
18:58:43 92 10
18:59:28 98 7.5
19:00:24 113 5
19:01:01 127 2.5
19:08:03 241 10
19:09:24 245 7.5
19:10:32 248 5
19:11:24 247 2.5
19:17:12 350 10
19:18:20 350 7.5
19:19:04 351 5
JER3688 Welsh Assembly Government Planning & Development 28th March 2011
6

Appendix 2 to the the Phase 2 - Studies of Marine Mammals in Welsh High Tidal Energy Waters
JER3688 Welsh Assembly Government Planning & Development 28th March 2011
7
Time Distance from Boat (m) Depth of Hydrophone (m)
19:20:16 349 2.5
19:25:51 62 10
19:25:52 62 10
19:26:54 61 7.5
19:27:23 59 5
19:27:45 58 5
19:28:20 58 2.5
3.2 Calibration results
3.2.1 Calibration trials were conducted in very calm conditions with a smooth sea surface.
The transmission hydrophone broadcasts sound omni-directionally and in these
reverberant conditions surface echoes were a prominent feature on recordings
complicating analysis. Generally however, the results of the calibration are encouraging.
Figure 3-1 to Figure 4-1
Figure 4-1
show all the successful depth and range localisations obtained
over the course of the calibration trial as red triangles. The majority of successful
localisations occurred between ranges of 58 and 127 m; there were five localisations at
241 m. Only transmissions at depth of 10 m, 7.5 m and 5 m were correctly determined
by the localisation algorithm. Those at 2 m could not be successfully localised. At a
range of 241 m only the 10 m ping was localised. This was probably due to surface
reflections which were more pronounced with smaller surface reflection angles that
occur with shallower sound sources and greater ranges.
3.2.2 A systematic error of -2 m was present in all the depth localisations. This is thought to
be due to a measurement error of the array location. Because the error is consistent
throughout all localisations it has been compensated for in Figure 3-2.
3.2.3 Figure 3-3 shows the calculated range and shows the mean calculated range
for each station. At ranges of ~60 and ~125 m there is a good agreement between
mean acoustically measured ranges and actual ranges. However, there seem to be a
distinct class of erroneous localizations with very short measured ranges. Why these
occur is currently not understood but it is likely that in a sequence of localisations such
anomalies could be recognised and discarded. At 241 m the acoustically measured and

Appendix 2 to the the Phase 2 - Studies of Marine Mammals in Welsh High Tidal Energy Waters
actual ranges are not in good agreement. However, all five acoustic localisations are
quite consistent. This surprising result requires more attention.
Figure 3-1 Depth of successful localisations. Red triangles represent the mean depth
value of all MCMC chains and error bars represent the standard deviation of the MCMC
probability density cloud.
Figure 3-2 Mean depth values of localisations. Red triangles represent the mean depth
value of all localisations for each ping. The blue diamonds represent the actual depth of
the hydrophone upon output of each simulated porpoise click train. The positions of the
hydrophone for pings which were not successfully localised have been discarded. A
systemic error of -2 m has been compensated for.
JER3688 Welsh Assembly Government Planning & Development 28th March 2011
8

Appendix 2 to the the Phase 2 - Studies of Marine Mammals in Welsh High Tidal Energy Waters
Figure 3-3 Range of successful localisations. Red triangles represent the mean range
value of all MCMC chains and error bars represent the standard deviation of the MCMC
probability density cloud.
Figure 3-4 Mean range values of localisations. Red triangles represent the mean range
value of all localisations for each ping. The blue diamonds represent the actual range of
the hydrophone upon output of each simulated porpoise click train. The positions of the
hydrophone for pings which were not successfully localised have been discarded.
JER3688 Welsh Assembly Government Planning & Development 28th March 2011
9

Appendix 2 to the the Phase 2 - Studies of Marine Mammals in Welsh High Tidal Energy Waters
4 Dive Profiles
4.1.1 Fine scale plots of depth and time were produced using the improved analysis
techniques described above to provide depictions of dive profiles. Clearly, depths can
only be calculated when an animal vocalises so these profiles will inevitably be patchy
and incomplete. A small number of stray localisations were often present. These have
been removed by passing the data through a standard deviation filter- this simply
discards points which stray from the moving average by more than a standard deviation
of the 5 previous and 5 following points. In general this removed <10% of localisations.
JER3688 Welsh Assembly Government Planning & Development 28th March 2011
10

Appendix 2 to the the Phase 2 - Studies of Marine Mammals in Welsh High Tidal Energy Waters
JER3688 Welsh Assembly Government Planning & Development 28th March 2011
11

Appendix 2 to the the Phase 2 - Studies of Marine Mammals in Welsh High Tidal Energy Waters
Figure 4-1 Fine scale plots of porpoise depth (calculated from vertical array
recordings) against time showing depth profiles for diving harbour porpoises.
JER3688 Welsh Assembly Government Planning & Development 28th March 2011
12

Appendix 2 to the the Phase 2 - Studies of Marine Mammals in Welsh High Tidal Energy Waters
JER3688 Welsh Assembly Government Planning & Development 28th March 2011
13
5 Conclusion
5.1.1 Further development of analysis algorithms implemented as Java programs has allowed
a greater number of good locations to be calculated from vertical array data and also
yield more complete information about these locations.
5.1.2 The calibration results show that the vertical array can accurately localise the depth and
range of a porpoise-like sound source. A high click repetition rate, omni directional
transmit hydrophone and very low sea state resulted in multiple echoes and interference
effects providing difficult data for localisation during the trial and this may have
contributed to inconsistent results at 2 m depth and 240 m ranges. Given this, our
success in determining the position of the hydrophone at ranges out to 125 m and at
depths of 5 m and greater is particularly encouraging. The directional nature of real
porpoise clicks should result in fewer surface echoes than the omni directional
hydrophone used in the trials. We are therefore hopeful that some aspects of
performance of the system will be improved when detecting real animals. The method
can be employed to determine dive profiles of porpoise and very probably other high
frequency echo locating cetaceans.
5.1.3 These new developments make us confident that this vertical array methodology can
provide essential data on the use of the water column in tidal rapids by harbour
porpoises and other odontocetes which will lead to a better assessment of exposure risk
and might also facilitate mitigation measures to minimise this hazard.

Studies of Marine Mammals in Welsh High Tidal Waters
JER3688 Welsh Assembly Government Planning & Development 28th March 2011
Appendix 3

Studies of Marine Mammals in Welsh High Tidal Waters
The following pages give a detailed description of the parameter settings for data logging and data summarizing sections of the transmitters on board software. Stored Pages are sent only when a transmitter makes a good contact with a cell phone transmitter mast. In lower quality contacts, only a single (most recent) GPS location point is sent, together with some diagnostic data. Software specification for GSM_08A deployment (Generic GPS/GSM) Valid for dates in years 2008 to 2011 Transmitting via GSM Page transmission sequences: Until day 1464: 0 1 2 3 0 1 using 1 PTT numbers Airtest for first 12 hours: Attempt a call every 1 hour GSM call settings: Transfer messages to postbox every 1 hour 30 mins Call every 6 hours Abort call if submerged for 8 secs or connected for 10 mins Service provider is 'auto' Check sensors every 4 secs When near surface (shallower than 4m), check wet/dry every 2/4 secs Consider wet/dry sensor failed if wet for 2 days or dry for 99 days Dives start when wet and below 1.5m for 8 secs and end when above 1.5m for 0, or dry at any time No separation of 'Deep' dives No cruises A haulout begins when dry for 10 mins and ends when wet for 40 secs Dive shape (normal dives): 9 equally-spaced points (no characterisation) per dive Dive shape (deep dives): none CTD profiles: max 500 dbar up to 4 dbar in 1 dbar bins. Temperature: Collected, Stored. Conductivity: Not collected. Salinity: Not collected. Fluorescence: Not collected. Send the deepest 1 upcasts in each 2-hour period. Minimum depth to trigger collection of cast: 20m in hour 1 20m in hour 2 or 20% greater than current maximum. Sample CTD sensor every 4 seconds. Each profile contains 12 cut points consisting of 0 fixed points, minimum depth, maximum depth, 10 broken-stick points GPS fix: attempt a fix every 30 mins Discard results with fewer than 5 satellites Make a single attempt each time Processing timeout: 32 secs Inhibit GPS after first success in haulout TRANSMISSION BUFFERS (in RAM): Dive in groups of 8 (77.7778 days @ 10mins/dive): 1400 = 5600 bytes No 'deep' dives Haulout: 50 = 200 bytes 2-hour summaries in groups of 12 (60 days): 60 = 240 bytes No berniegrams No timelines No cruises No diving periods No spot depths No emergence records No Duration histograms No Max depth histograms CTD casts (25 days): 300 = 1200 bytes GPS fixes (62.5 days): 3000 = 12000 bytes No spot CTD's TOTAL 19240 bytes (of about 21000 available)
JER3688 Welsh Assembly Government Planning & Development 28th March 2011

Studies of Marine Mammals in Welsh High Tidal Waters
MAIN BUFFERS (in 8 Mb Flash): Dive in groups of 8 (500 days @ 10mins/dive): 9000 x 408 bytes = 3672000 bytes No 'deep' dives Haulout: 2000 x 16 bytes = 32000 bytes 2-hour summaries in groups of 12 (360 days): 360 x 248 bytes = 89280 bytes No berniegrams No timelines No cruises No diving periods No spot depths No emergence records No Duration histograms No Max depth histograms CTD casts (166.667 days): 2000 x 68 bytes = 136000 bytes GPS fixes (416.667 days): 20000 x 120 bytes = 2400000 bytes No spot CTD's TOTAL 6180 kb (from 8445 kb available) PAGE CONTENTS (1024 bits - 40 overhead): PAGE 0: PTT NUMBER OVERHEAD (32-bit code) -----------[32 bits: 0 - 31] PAGE NUMBER -----------[3 bits: 32 - 34] GPS in format 0: Record could be in buffer for 62 days 12 hours Timestamp: max 90 days 12 hours @ 1 sec= 7819200 tx as raw 23 bits in units of 1 (range: 0 to 8.38861e+06 ) (recommended sell-by 90 days 11 hours) Sell-by range: 90 days n_sats: raw 3 bits in units of 1 (range: 5 to 12 ) GPS mode: -- not transmitted -- Best 8 satellites: Sat ID's: raw 5 bits in units of 1 (range: 0 to 31 ) Pseudorange: raw 15 bits in units of 1 (range: 0 to 32767 ) Signal strength: -- not transmitted -- Doppler: -- not transmitted -- Max signal strength: -- not transmitted -- Noisefloor: -- not transmitted -- Max CSN (x10): raw 3 bits in units of 20 (range: 350 to 490 ) -----------[189 bits: 35 - 223] GPS in format 0: Record could be in buffer for 62 days 12 hours Timestamp: max 90 days 12 hours @ 1 sec= 7819200 tx as raw 23 bits in units of 1 (range: 0 to 8.38861e+06 ) (recommended sell-by 90 days 11 hours) Sell-by range: 90 days n_sats: raw 3 bits in units of 1 (range: 5 to 12 ) GPS mode: -- not transmitted -- Best 8 satellites: Sat ID's: raw 5 bits in units of 1 (range: 0 to 31 ) Pseudorange: raw 15 bits in units of 1 (range: 0 to 32767 ) Signal strength: -- not transmitted -- Doppler: -- not transmitted -- Max signal strength: -- not transmitted -- Noisefloor: -- not transmitted -- Max CSN (x10): raw 3 bits in units of 20 (range: 350 to 490 ) -----------[189 bits: 224 - 412] GPS in format 0: Record could be in buffer for 62 days 12 hours Timestamp: max 90 days 12 hours @ 1 sec= 7819200 tx as raw 23 bits in units of 1 (range: 0 to 8.38861e+06 ) (recommended sell-by 90 days 11 hours) Sell-by range: 90 days n_sats: raw 3 bits in units of 1 (range: 5 to 12 ) GPS mode: -- not transmitted -- Best 8 satellites: Sat ID's: raw 5 bits in units of 1 (range: 0 to 31 ) Pseudorange: raw 15 bits in units of 1 (range: 0 to 32767 ) Signal strength: -- not transmitted -- Doppler: -- not transmitted -- Max signal strength: -- not transmitted -- Noisefloor: -- not transmitted -- Max CSN (x10): raw 3 bits in units of 20 (range: 350 to 490 ) -----------[189 bits: 413 - 601] GPS in format 0: Record could be in buffer for 62 days 12 hours Timestamp: max 90 days 12 hours @ 1 sec= 7819200
JER3688 Welsh Assembly Government Planning & Development 28th March 2011

Studies of Marine Mammals in Welsh High Tidal Waters
tx as raw 23 bits in units of 1 (range: 0 to 8.38861e+06 ) (recommended sell-by 90 days 11 hours) Sell-by range: 90 days n_sats: raw 3 bits in units of 1 (range: 5 to 12 ) GPS mode: -- not transmitted -- Best 8 satellites: Sat ID's: raw 5 bits in units of 1 (range: 0 to 31 ) Pseudorange: raw 15 bits in units of 1 (range: 0 to 32767 ) Signal strength: -- not transmitted -- Doppler: -- not transmitted -- Max signal strength: -- not transmitted -- Noisefloor: -- not transmitted -- Max CSN (x10): raw 3 bits in units of 20 (range: 350 to 490 ) -----------[189 bits: 602 - 790] GPS in format 0: Record could be in buffer for 62 days 12 hours Timestamp: max 90 days 12 hours @ 1 sec= 7819200 tx as raw 23 bits in units of 1 (range: 0 to 8.38861e+06 ) (recommended sell-by 90 days 11 hours) Sell-by range: 90 days n_sats: raw 3 bits in units of 1 (range: 5 to 12 ) GPS mode: -- not transmitted -- Best 8 satellites: Sat ID's: raw 5 bits in units of 1 (range: 0 to 31 ) Pseudorange: raw 15 bits in units of 1 (range: 0 to 32767 ) Signal strength: -- not transmitted -- Doppler: -- not transmitted -- Max signal strength: -- not transmitted -- Noisefloor: -- not transmitted -- Max CSN (x10): raw 3 bits in units of 20 (range: 350 to 490 ) -----------[189 bits: 791 - 979] DIAGNOSTICS in format 0: Wet/dry status: raw 2 bits in units of 1 (range: 0 to 3 ) Number of resets: wraparound 2 bits in units of 1 (range: 0 to 3 ) -----------[4 bits: 980 - 983] Available bits used exactly === End of page 0 === PAGE 1: PTT NUMBER OVERHEAD (32-bit code) -----------[32 bits: 0 - 31] PAGE NUMBER -----------[3 bits: 32 - 34] DIVE group in format 0: Normal dives transmitted in groups of 8 Time of start of last dive: max 91 days @ 4 secs= 1965600 tx as raw 21 bits in units of 1 (range: 0 to 2.09715e+06 ) (recommended sell-by 90 days 23 hours) Sell-by range: 90 days Number of records: raw 4 bits in units of 1 (range: 0 to 15 ) Reason for end: -- not transmitted -- Group number: wraparound 7 bits in units of 1 (range: 0 to 127 ) Max depth: odlog 2/7 in units of 4 dm (range: 0 to 7662 dm) Dive duration: odlog 1/7 in units of 4 s (range: 0 to 1530 s) Mean speed: -- not transmitted -- Profile data (9 depths/times, 0 speeds): Depth profile: odlog 2/7 in units of 4 dm (range: 0 to 7662 dm) Profile times: -- not transmitted -- Speed profile: -- not transmitted -- Residual: -- not transmitted -- Calculation time: -- not transmitted -- Surface duration: odlog 2/7 in units of 4 s (range: 0 to 7662 s) Dive area: raw 7 bits in units of 7.87402 permille (range: 0 to 1000 permille) -----------[944 bits: 35 - 978] DIAGNOSTICS in format 1: Wet/dry status: raw 2 bits in units of 1 (range: 0 to 3 ) Wet/dry fail count: wraparound 3 bits in units of 1 (range: 0 to 7 ) -----------[5 bits: 979 - 983] Available bits used exactly === End of page 1 === PAGE 2: PTT NUMBER OVERHEAD (32-bit code) -----------[32 bits: 0 - 31] PAGE NUMBER -----------[3 bits: 32 - 34]
JER3688 Welsh Assembly Government Planning & Development 28th March 2011

Studies of Marine Mammals in Welsh High Tidal Waters
SUMMARY group in format 0: Transmitted in groups of 12 Record could be in buffer for 60 days End time: max 60 days 8 hours @ 2 hours= 724 tx as raw 10 bits in units of 1 (range: 0 to 1023 ) (recommended sell-by 60 days 5 hours) Sell-by range: 60 days Number of records: raw 1 bits in units of 1 (range: 0 to 1 ) Cruising time: -- not transmitted -- Haulout time: raw 6 bits in units of 15.873 permille (range: 0 to 1000 permille) Dive time: raw 6 bits in units of 15.873 permille (range: 0 to 1000 permille) Deep Dive time: -- not transmitted -- Normal dives: Avg max dive depth: odlog 2/7 in units of 4 dm (range: 0 to 7662 dm) SD max dive depth: odlog 2/7 in units of 4 dm (range: 0 to 7662 dm) Max max dive depth: odlog 2/7 in units of 4 dm (range: 0 to 7662 dm) Avg dive duration: raw 5 bits in units of 30 s (range: 0 to 930 s) SD dive duration: raw 5 bits in units of 10 s (range: 0 to 310 s) Max dive duration: raw 5 bits in units of 30 s (range: 0 to 930 s) Avg speed in dive: -- not transmitted -- Number of dives: raw 7 bits in units of 1 (range: 0 to 127 ) Deep dives: Avg max dive depth: -- not transmitted -- SD max dive depth: -- not transmitted -- Max max dive depth: -- not transmitted -- Avg dive duration: -- not transmitted -- SD dive duration: -- not transmitted -- Max dive duration: -- not transmitted -- Avg speed in dive: -- not transmitted -- Number of dives: -- not transmitted -- Avg SST: -- not transmitted -- -----------[743 bits: 35 - 777] HAULOUT in format 0: Number of records: raw 1 bits in units of 1 (range: 0 to 1 ) Haulout number: wraparound 8 bits in units of 1 (range: 0 to 255 ) Start time: -- not transmitted -- End time: max 91 days @ 1 min= 131040 tx as raw 17 bits in units of 1 (range: 0 to 131071 ) (recommended sell-by 90 days 23 hours) Sell-by range: 90 days Duration: odlog 2/6 in units of 90 s (range: 0 to 85995 s) cf. Max duration is 1 day Reason for end: -- not transmitted -- Contiguous: -- not transmitted -- -----------[34 bits: 778 - 811] HAULOUT in format 0: Number of records: raw 1 bits in units of 1 (range: 0 to 1 ) Haulout number: wraparound 8 bits in units of 1 (range: 0 to 255 ) Start time: -- not transmitted -- End time: max 91 days @ 1 min= 131040 tx as raw 17 bits in units of 1 (range: 0 to 131071 ) (recommended sell-by 90 days 23 hours) Sell-by range: 90 days Duration: odlog 2/6 in units of 90 s (range: 0 to 85995 s) cf. Max duration is 1 day Reason for end: -- not transmitted -- Contiguous: -- not transmitted -- -----------[34 bits: 812 - 845] HAULOUT in format 0: Number of records: raw 1 bits in units of 1 (range: 0 to 1 ) Haulout number: wraparound 8 bits in units of 1 (range: 0 to 255 ) Start time: -- not transmitted -- End time: max 91 days @ 1 min= 131040 tx as raw 17 bits in units of 1 (range: 0 to 131071 ) (recommended sell-by 90 days 23 hours) Sell-by range: 90 days Duration: odlog 2/6 in units of 90 s (range: 0 to 85995 s) cf. Max duration is 1 day Reason for end: -- not transmitted -- Contiguous: -- not transmitted -- -----------[34 bits: 846 - 879] HAULOUT in format 0: Number of records: raw 1 bits in units of 1 (range: 0 to 1 ) Haulout number: wraparound 8 bits in units of 1 (range: 0 to 255 ) Start time: -- not transmitted -- End time: max 91 days @ 1 min= 131040 tx as raw 17 bits in units of 1 (range: 0 to 131071 ) (recommended sell-by 90 days 23 hours)
JER3688 Welsh Assembly Government Planning & Development 28th March 2011
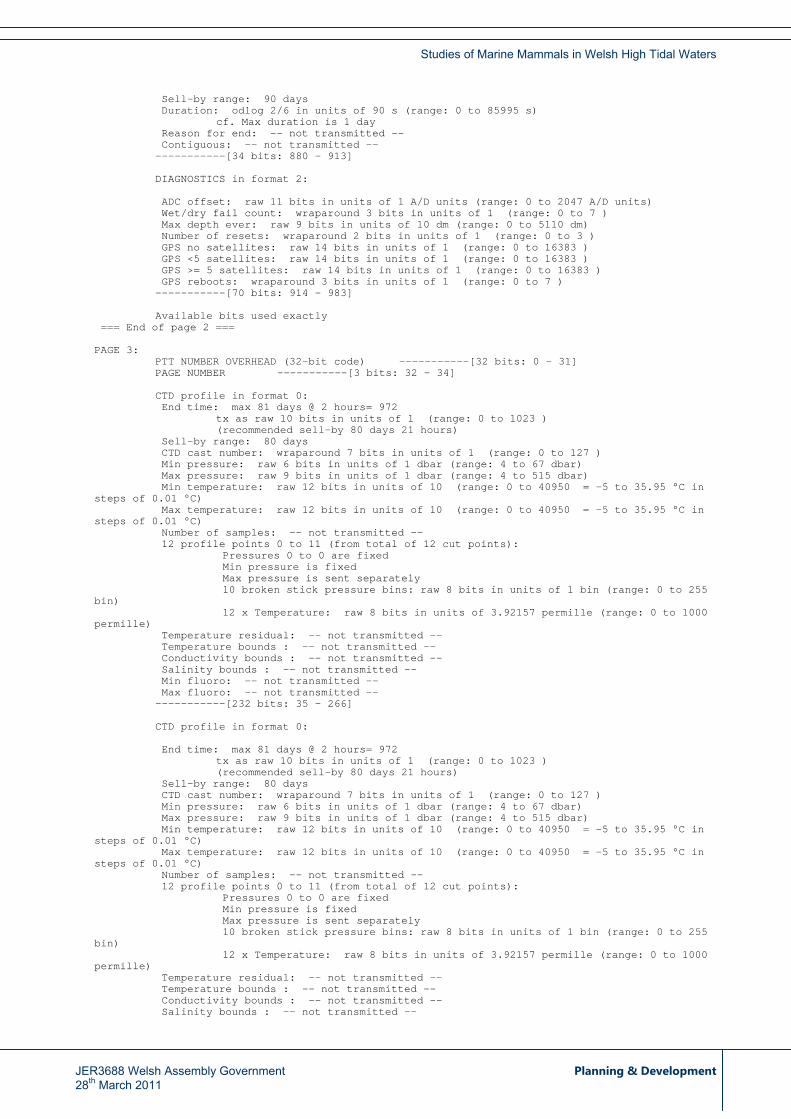
Studies of Marine Mammals in Welsh High Tidal Waters
Sell-by range: 90 days Duration: odlog 2/6 in units of 90 s (range: 0 to 85995 s) cf. Max duration is 1 day Reason for end: -- not transmitted -- Contiguous: -- not transmitted -- -----------[34 bits: 880 - 913] DIAGNOSTICS in format 2: ADC offset: raw 11 bits in units of 1 A/D units (range: 0 to 2047 A/D units) Wet/dry fail count: wraparound 3 bits in units of 1 (range: 0 to 7 ) Max depth ever: raw 9 bits in units of 10 dm (range: 0 to 5110 dm) Number of resets: wraparound 2 bits in units of 1 (range: 0 to 3 ) GPS no satellites: raw 14 bits in units of 1 (range: 0 to 16383 ) GPS <5 satellites: raw 14 bits in units of 1 (range: 0 to 16383 ) GPS >= 5 satellites: raw 14 bits in units of 1 (range: 0 to 16383 ) GPS reboots: wraparound 3 bits in units of 1 (range: 0 to 7 ) -----------[70 bits: 914 - 983] Available bits used exactly === End of page 2 === PAGE 3: PTT NUMBER OVERHEAD (32-bit code) -----------[32 bits: 0 - 31] PAGE NUMBER -----------[3 bits: 32 - 34] CTD profile in format 0: End time: max 81 days @ 2 hours= 972 tx as raw 10 bits in units of 1 (range: 0 to 1023 ) (recommended sell-by 80 days 21 hours) Sell-by range: 80 days CTD cast number: wraparound 7 bits in units of 1 (range: 0 to 127 ) Min pressure: raw 6 bits in units of 1 dbar (range: 4 to 67 dbar) Max pressure: raw 9 bits in units of 1 dbar (range: 4 to 515 dbar) Min temperature: raw 12 bits in units of 10 (range: 0 to 40950 = -5 to 35.95 °C in steps of 0.01 °C) Max temperature: raw 12 bits in units of 10 (range: 0 to 40950 = -5 to 35.95 °C in steps of 0.01 °C) Number of samples: -- not transmitted -- 12 profile points 0 to 11 (from total of 12 cut points): Pressures 0 to 0 are fixed Min pressure is fixed Max pressure is sent separately 10 broken stick pressure bins: raw 8 bits in units of 1 bin (range: 0 to 255 bin) 12 x Temperature: raw 8 bits in units of 3.92157 permille (range: 0 to 1000 permille) Temperature residual: -- not transmitted -- Temperature bounds : -- not transmitted -- Conductivity bounds : -- not transmitted -- Salinity bounds : -- not transmitted -- Min fluoro: -- not transmitted -- Max fluoro: -- not transmitted -- -----------[232 bits: 35 - 266] CTD profile in format 0: End time: max 81 days @ 2 hours= 972 tx as raw 10 bits in units of 1 (range: 0 to 1023 ) (recommended sell-by 80 days 21 hours) Sell-by range: 80 days CTD cast number: wraparound 7 bits in units of 1 (range: 0 to 127 ) Min pressure: raw 6 bits in units of 1 dbar (range: 4 to 67 dbar) Max pressure: raw 9 bits in units of 1 dbar (range: 4 to 515 dbar) Min temperature: raw 12 bits in units of 10 (range: 0 to 40950 = -5 to 35.95 °C in steps of 0.01 °C) Max temperature: raw 12 bits in units of 10 (range: 0 to 40950 = -5 to 35.95 °C in steps of 0.01 °C) Number of samples: -- not transmitted -- 12 profile points 0 to 11 (from total of 12 cut points): Pressures 0 to 0 are fixed Min pressure is fixed Max pressure is sent separately 10 broken stick pressure bins: raw 8 bits in units of 1 bin (range: 0 to 255 bin) 12 x Temperature: raw 8 bits in units of 3.92157 permille (range: 0 to 1000 permille) Temperature residual: -- not transmitted -- Temperature bounds : -- not transmitted -- Conductivity bounds : -- not transmitted -- Salinity bounds : -- not transmitted --
JER3688 Welsh Assembly Government Planning & Development 28th March 2011

Studies of Marine Mammals in Welsh High Tidal Waters
JER3688 Welsh Assembly Government Planning & Development 28th March 2011
Min fluoro: -- not transmitted -- Max fluoro: -- not transmitted -- -----------[232 bits: 267 - 498] CTD profile in format 0: End time: max 81 days @ 2 hours= 972 tx as raw 10 bits in units of 1 (range: 0 to 1023 ) (recommended sell-by 80 days 21 hours) Sell-by range: 80 days CTD cast number: wraparound 7 bits in units of 1 (range: 0 to 127 ) Min pressure: raw 6 bits in units of 1 dbar (range: 4 to 67 dbar) Max pressure: raw 9 bits in units of 1 dbar (range: 4 to 515 dbar) Min temperature: raw 12 bits in units of 10 (range: 0 to 40950 = -5 to 35.95 °C in steps of 0.01 °C) Max temperature: raw 12 bits in units of 10 (range: 0 to 40950 = -5 to 35.95 °C in steps of 0.01 °C) Number of samples: -- not transmitted -- 12 profile points 0 to 11 (from total of 12 cut points): Pressures 0 to 0 are fixed Min pressure is fixed Max pressure is sent separately 10 broken stick pressure bins: raw 8 bits in units of 1 bin (range: 0 to 255 bin) 12 x Temperature: raw 8 bits in units of 3.92157 permille (range: 0 to 1000 permille) Temperature residual: -- not transmitted -- Temperature bounds : -- not transmitted -- Conductivity bounds : -- not transmitted -- Salinity bounds : -- not transmitted -- Min fluoro: -- not transmitted -- Max fluoro: -- not transmitted -- -----------[232 bits: 499 - 730] CTD profile in format 0: End time: max 81 days @ 2 hours= 972 tx as raw 10 bits in units of 1 (range: 0 to 1023 ) (recommended sell-by 80 days 21 hours) Sell-by range: 80 days CTD cast number: wraparound 7 bits in units of 1 (range: 0 to 127 ) Min pressure: raw 6 bits in units of 1 dbar (range: 4 to 67 dbar) Max pressure: raw 9 bits in units of 1 dbar (range: 4 to 515 dbar) Min temperature: raw 12 bits in units of 10 (range: 0 to 40950 = -5 to 35.95 °C in steps of 0.01 °C) Max temperature: raw 12 bits in units of 10 (range: 0 to 40950 = -5 to 35.95 °C in steps of 0.01 °C) Number of samples: -- not transmitted -- 12 profile points 0 to 11 (from total of 12 cut points): Pressures 0 to 0 are fixed Min pressure is fixed Max pressure is sent separately 10 broken stick pressure bins: raw 8 bits in units of 1 bin (range: 0 to 255 bin) 12 x Temperature: raw 8 bits in units of 3.92157 permille (range: 0 to 1000 permille) Temperature residual: -- not transmitted -- Temperature bounds : -- not transmitted -- Conductivity bounds : -- not transmitted -- Salinity bounds : -- not transmitted -- Min fluoro: -- not transmitted -- Max fluoro: -- not transmitted -- -----------[232 bits: 731 - 962] DIAGNOSTICS in format 3: Number of resets: wraparound 2 bits in units of 1 (range: 0 to 3 ) Wet conductivity: raw 8 bits in units of 1 (range: 0 to 255 ) Dry conductivity: raw 8 bits in units of 1 (range: 0 to 255 ) GPS reboots: wraparound 3 bits in units of 1 (range: 0 to 7 ) -----------[21 bits: 963 - 983] Available bits used exactly === End of page 3 ===