phase 1 study of cb-839, a first-in-class, orally
TRANSCRIPT
C1D15 PK Parameter: Mean (±SD)
Daily dose (mg) Dosing interval (hr) Cmin (ng/mL) Cmax (ng/mL) AUC0-8h (ng*hr/mL)^
600 mg BID fed (N=23) 1200 ~12 457 (±335) 1476 (±676) 7416 (±3757)
600 mg TID (N=5) 1800 ~8 495 (±390) 1565 (±922) 7344 (±4058)
All AEs in ≥7 subjects on BID schedule BID (N=66) TID (N=32)
MedDRA Preferred Term Total N (%)
Drug Related N (%)
Total N (%)
Drug Related N (%)
Patients with any AE 63 (96) 44 (67) 30 (94) 23 (72)
Fatigue 19 (29) 16 (24) 15 (47) 8 (25)
Nausea 17 (26) 12 (18) 7 (22) 2 (6.3)
Constipation 10 (15) 1 (1.5) 2 (6.3) 2 (6.3)
Alanine aminotransferase increased 9 (14) 8 (12) 7 (22) 6 (19)
Anemia 9 (14) 1 (1.5) 2 (6.3) 0
Insomnia 9 (14) 1 (1.5) 1 (3.1) 0
Vomiting 9 (14) 3 (4.5) 9 (28) 4 (13)
Blood creatinine increased 8 (12) 3 (4.5) 2 (6.3) 1 (3.1)
Photophobia 8 (12) 7 (11) 1 (3.1) 1 (3.1)
Aspartate aminotransferase increased 7 (11) 7 (11) 7 (22) 6 (19)
Blood alkaline phosphatase increased 7 (11) 3 (4.5) 4 (13) 2 (6.3)
Decreased appetite 7 (11) 5 (7.6) 3 (9.4) 0
Gamma-glutamyltransferase increased 7 (11) 6 (9.1) 2 (6.3) 1 (3.1)
T im e o n S tu d y (M o n th s )
0 2 4 6 8 1 0 1 2 1 4 1 6
1 5 0
1 0 0
2 5 0
1 5 0
2 5 0
1 0 0
2 5 0
8 0 0
4 0 0
2 5 0
1 0 0
6 0 0
2 5 0
6 0 0
4 0 0
ID H _ 2 5 0
S D H _ 6 0 0
4 0 0
2 5 0
6 0 0
1 5 0
6 0 0
1 5 0
4 0 0
2 5 0
8 0 0
8 0 0
2 5 0
6 0 0
2 5 0
2 5 0
6 0 0 S D (-6 % )
S D (-2 3 % )
S D (6 % )
S D (1 % )
S D (1 1 % )
*
*
**
**
**
*
*
*
****
**
*
*
*
S D (1 8 % )
D o s e (m g )
T ID
s c h e d u le
Patients: Metastatic or locally advanced solid tumors
Doses: 100-1000 mg po Regimens
• TID • BID fed
Monotherapy Expansion cohorts (N > 11 pts/cohort)
Triple negative breast cancer (TNBC)
KRAS-mutant non-small cell lung cancer (NSCLC)
Renal cell carcinoma (RCC)
Mesothelioma
Fumarate hydratase (FH) -deficient solid tumors
Succinate dehydrogenase (SDH) -deficient GIST
Succinate dehydrogenase (SDH) -deficient non-GIST
Isocitrate dehydrogenase (IDH) -mutant solid tumors
Combination Expansion cohorts (Simon two-stage design)
Paclitaxel + CB-839
Erlotinib + CB-839
Everolimus + CB-839
Docetaxel + CB-839
Mo
no
the
rap
y C
om
bin
atio
ns
Monotherapy dose escalation
Combination dose escalations
Phase 1 study of CB-839, a first-in-class, orally administered small molecule inhibitor of glutaminase in patients with refractory solid tumors Meric-Bernstam F𝟏, DeMichele A2, Telli ML3, Munster P4, Orford KW5, Demetri GD6, Schwartz GK7, Iliopoulos O8, Mier JW9, Owonikoko TK10, McKay RR6, Mittra ES3, Bennett MK5, Patel MR11,12, Infante JR12, and Harding JJ13
1MD Anderson Cancer Center, Houston, TX; 2Univ. of Pennsylvania, Philadelphia, PA; 3Stanford Univ. Med. Center, Palo Alto, CA; 4Univ. California, San Francisco, CA; 5Calithera Biosciences, South San Francisco, CA; 6Dana Farber Cancer Inst., Boston, MA; 7Columbia Univ. Med. Center, New York, NY; 8Massachusetts General Hospital, Boston, MA; 9Beth Israel Deaconess Med. Center, Boston, MA; 10Emory Univ. School of Medicine, Atlanta, GA; 11Florida Cancer Specialists, Sarasota, FL; 12Sarah Cannon Research Inst., Nashville, TN; 13Memorial Sloan Kettering Cancer Center, New York, NY
STUDY STATUS SAFETY AND TOLERABILITY BACKGROUND AND RATIONALE
STUDY OBJECTIVES
PHARMACOKINETICS
EFFICACY IN RENAL CELL CARCINOMA
SUMMARY AND CONCLUSIONS
• Glutamine is required for the growth and survival of many tumor types1,2
• Glutaminase (GLS) controls the first step in glutamine utilization in cancer cells (Figure 1), leading to the formation of glutamate, which is used to:
– generate TCA cycle intermediates
– synthesize glutathione
– generate NADPH and maintain redox balance
– synthesize anabolic building blocks, including nucleotides and fatty acids
• CB-839 is a highly selective, reversible, allosteric inhibitor of GLS3
• CB-839 has broad preclinical in vitro and in vivo anti-tumor activity in solid and hematologic malignancies3,4
• Herein we describe the initial results from CX-839-001, a first-in-man Phase 1 study of CB-839 in advanced solid tumors (ClinicalTrials.gov Identifier: NCT02071862)
Primary
• To evaluate the safety and tolerability and determine the single-agent Recommended Phase 2 Dose (RP2D) of CB-839 for locally-advanced, metastatic and/or refractory solid tumors
Secondary
• To determine the pharmacokinetics (PK) of CB-839 as a single agent
• To evaluate anti-tumor activity of the single-agent in patients with solid tumors
METHODS Study Design
• Phase 1 study of CB-839 as a single-agent and in combination* with standard therapies in advanced solid tumors
– Standard 3+3 dose escalation design with 3 week cycle length
– Disease assessments are performed every three (3) cycles
• Expansion Cohorts for monotherapy in defined patient populations (see Figure 2)
– Objectives include confirmation of safety profile and evaluation of clinical efficacy in defined patient populations
– Simon two-stage design utilized for each expansion cohort
• Planned enrollment of 11 patients per cohort
• Further expansion with one response * Only single-agent data presented in this poster
Figure 2: CX-839-001 Study Design
• As of October 1, 2015, 98 patients had been treated with single agent CB-839 and had data in the clinical database
• 600 mg po BID fed was selected for expansion cohorts based on:
– PK consistently above target threshold
– Clear PK/pharmacodynamic relationship in platelets
– Evidence of pharmacodynamic activity in tumors
• An MTD has not been established
– 800mg po BID fed also considered safe and tolerable
• Summaries of patient enrollment and baseline characteristics are provided in Tables 1 and 2, respectively
• Most Adverse Events (AE) have been Gr1/2 and reversible (Table 4)
– Most frequent events were fatigue, GI events and mild LFT elevations
• Among patients receiving BID fed regimen 4.5% (3/66) experienced a Gr3/4 AE suspected to be related to CB-839 (Table 5)
Table 4: Adverse Events Occurring in >10% of Patients on the BID schedule Table 5: Grade 3 or Higher Adverse Events Occurring in ≥2 Patients
2015 AACR-NCI-EORTC International Conference on Molecular Targets and Cancer Therapeutics, November 5-9, 2015, Boston, Massachusetts
• CB-839 has good PK properties in cancer patients
– Half-life approximately 4 hr
– Exposure generally increases with dose
– Moderate accumulation ratio observed at steady state (median of 2.4 on TID schedule)
• Dosing with food enabled switch to BID dosing regimen
– Positive food effect increases exposure with fed regimen (Figures 3 and 4)
– Delayed absorption resulted in a “flatter” PK profile
– Similar Cmax and Cmin with BID fed vs. TID regimen (Table 3) despite:
• Longer dosing interval (12 hr vs. 8 hr)
• 50% less daily dose
Table 1: Enrollment Summary Figure 1: Altered Glucose and Glutamine Metabolism of Cancer Cells
GLUCOSE
Pyruvate
α-KG
Glutamate
GLUTAMINE
Lactate
TCA Cycle
Mitochondrion
Normal Cell
Cancer Cell
Biosynthetic intermediates
Glutathione
Glutaminase
GLUCOSE
Pyruvate
α-KG
Glutamate
GLUTAMINE
Lactate
TCA Cycle
Glutaminase
Mitochondrion
CB-839
Key Inclusion Criteria • Eastern Cooperative Oncology Group (ECOG)
Performance Status of 0-1 • Life expectancy of at least 3 months • Adequate hepatic, renal and hematological function • Measurable Disease per RECISTv1.1
Key Exclusion Criteria • Prior therapies within the specified time frames
(14-21 days, depending on the agent) • Any conditions that may preclude adequate
absorption of study drug • Untreated or unstable brain metastases
References
• CB-839 is well tolerated in advanced cancer patients
• Dosing with meals allows convenient BID dosing and improved safety profile
• Primary efficacy signal to date has been in renal cell carcinoma
• Expanded development in RCC planned
– RCC enrollment expanded on monotherapy
– Everolimus combination ongoing in RCC
• Development continues in other indications
– Non-small cell lung cancer: erlotinib combo
– Triple negative breast cancer: paclitaxel combo
– AML: azacitidine combination
– Myeloma: pomalidomide/dexamethasone combination
1. Wise and Thompson (2010) Trends Biochem Sci 35:427-433 2. DeBerardinis and Cheng (2010) Oncogene 29:313-324 3. Gross et al. (2014) Mol Cancer Ther 13:890-901 4. Parlati et al. (2013) Blood 122:4226
5. Motzer et al. (2015) N Engl J Med (in press) 6. Choueiri et al. (201) N Engl J Med (in press) 7. Motzer et al. (2010) Cancer 116:4256
CLINICAL OUTCOMES • This Phase 1 study has enrolled patients with a variety of tumor types across a range of
doses on two different dosing regimens [BID fed (n=66) and TID (n=32)]
• 44% of patients on BID fed regimen have achieved a PR or SD as best response (Table 6)
• 60% of RCC patients on the BID schedule achieved a PR or SD (Table 7)
• Five patients remained on CB-839 for >8 months without progression (Figures 4)
– 2 TNBC, 1 RCC, 1 mesothelioma, 1 IDH1 mutant chondrosarcoma
Partner Cancer Status Paclitaxel TNBC OPEN
Everolimus RCC OPEN Erlotinib EGFRm NSCLC PLANNED
Docetaxel KRASm NSCLC PLANNED
^Note: AUC0-8h does not fully cover dosing interval on BID schedule
TID Dose Escalation:
BID fed Dose Escalation and Expansion:
100 – 800 mg 600 – 1000 mg^
Total subjects: 32* Total subjects: 66
Dose level # Tumor type #
100 mg 3 RCC 16
150 mg 4 TNBC 16
250 mg 11 TCA cycle mutations 23
400 mg 4 – IDH-mutant (non-glioma) – SDH-deficient – FH-deficient
14 5 4 600 mg 7
800 mg 3 NSCLC 8
*Tumor types: TNBC (11), RCC (4), NSCLC (4),
Mesothelioma (3), TCA cycle mutations (2), Other (8)
Mesothelioma 3
^Dose levels: 600 mg (50), 800 mg (11), 1000 mg (5)
Select BID Expansion cohorts
All subjects (N=98)
RCC (N=16)
TNBC (N=16)
NSCLC (N=8)
Age: median (range) 60 (19–93 62.5 (46–93) 54.5 (36–70) 68.5 (51–76)
Female/Male: N (%) 62 (63%)/ 36 (37%)
5 (31%)/ 11 (69%)
16 (100%)/ 0 (0%)
6 (75%)/ 2 (25%)
Prior therapies (locally advanced
or metastatic disease)
Median (range)
3 (0–14) 4.5 (1–9) 4.5 (1–9) 4 (1–9)
0-1: N (%) 22 (22%) 3 (19%) 3 (19%) 2 (25%)
2-4: N (%) 44 (45%) 5 (31%) 5 (31%) 3 (28%)
≥5:N (%) 32 (33%) 8 (50%) 8 (50%) 3 (28%)
ECOG Score: N (%)
0 25 (27%) 4 (25%) 7 (44%) 1 (13%)
1 69 (70%) 11 (69%) 9 (56%) 7 (88%)
≥Gr3 AEs in ≥2 subjects on BID schedule BID (N=66) TID (N=32)
MedDRA Preferred Term Total N (%)
Drug Related N (%)
Total N (%)
Drug Related N (%)
Patients with any ≥Gr3 AE 22 (33) 3 (4.5) 11 (34) 7 (22)
Fall 3 (4.5) 0 0 0
Anemia 2 (3.0) 0 1 (3.1) 0
Gamma-glutamyltransferase increased 2 (3.0) 2 (3.0) 2 (6.3) 1 (3.1)
Pneumonia 2 (3.0) 0 1 (3.1) 0
Syncope 2 (3.0) 0 0 0
All ≥Gr3 LFT AEs
Alanine aminotransferase increased 1 (1.5) 1 (1.5) 5 (16) 5 (16)
Aspartate aminotransferase increased 0 0 6 (19) 5 (16)
Blood alkaline phosphatase increased 1 (1.5) 0 3 (9.4) 1 (3.1)
Blood bilirubin increased 1 (1.5) 0 1 (3.1) 0
AU
C0
-8
h (
ng
*h
r/m
L)
0
5 0 0 0
1 0 0 0 0
1 5 0 0 0
Faste
d (
N=5)
Fed
(N
=28)
BID (N=66) TID (N=32)
RECIST Response Evaluable (N) 50 27
PR 1 (2%)
SD 21 (42%) 6 (22%)
PD 26 19
Disease-related death prior to scan 1 2
Withdrew for drug-related AE prior to scan 1
Not evaluable (N) 16 5
On study, prior to first tumor assessment 1
Discontinued before tumor assessment 15 5
BID Schedule TID Schedule
Disease Type Response Evaluable
SD PR % SD or better
Response Evaluable
SD PR % SD or better
RCC 15 8 1 60 4 2 50
TNBC 9 1 11 10 2 20
TCA cycle mutant 18 8 44 1
– IDH-mutant – SDH deficient – FH-deficient
11 3 4
4 2 2
36 67 50
1
NSCLC 6 2 33 3 1 33
Mesothelioma 2 2 100 2 1 50
Other 7
Total 50 21 1 44 27 6 22
S D (1 1 % )
S D (5 % )
S D (1 1 )
S D (-1 0 % )
S D (1 6 % )
T im e o n S tu d y (M o n th s )
0 1 2 3 4 5 6 7 8 9
6 0 0
6 0 0
6 0 0
6 0 0
6 0 0
8 0 0
6 0 0
6 0 0
6 0 0
6 0 0
6 0 0
ID H _ 6 0 0
S D H _ 6 0 0
ID H _ 8 0 0
ID H _ 6 0 0
ID H _ 6 0 0
S D H _ 6 0 0
ID H _ 6 0 0
S D H _ 6 0 0
ID H _ 6 0 0
FH _ 6 0 0
ID H _ 6 0 0
ID H _ 8 0 0
FH _ 6 0 0
ID H _ 6 0 0
ID H _ 6 0 0
FH _ 6 0 0
ID H _ 6 0 0
S D H _ 8 0 0
ID H _ 6 0 0
FH _ 6 0 0
ID H _ 6 0 0
S D H _ 6 0 0
ID H _ 6 0 0
1 0 0 0
6 0 0
1 0 0 0
8 0 0
8 0 0
6 0 0
6 0 0
1 0 0 0
6 0 0
6 0 0
6 0 0
8 0 0
6 0 0
6 0 0
8 0 0
6 0 0
1 0 0 0
8 0 0
6 0 0
8 0 0
6 0 0
6 0 0
6 0 0
6 0 0
8 0 0
6 0 0
1 0 0 0
6 0 0
6 0 0
6 0 0
6 0 0
6 0 0
S D (7 % )
S D (1 4 % )
S D (2 .9 )
S D (-3 % )
S D (-5 % )
*
**
*
*
**
*
*
*
**
*
**
*
S D (8 % )
S D (9 % )
P R (-3 2 % )
*
*
**
**
*
S D (1 2 % )
*****
*
*
S D (7 % )
*
*
S D (-4 % )
S D (1 3 % )S D (5 % )
S D (-4 % )
S D (1 0 % )
S D (1 9 % )
S D (0 % )*
B ID fe d
s c h e d u le
D o s e (m g )
• Sixteen RCC patients enrolled on BID fed regimen
– 9 clear cell, 4 papillary, 3 with other histologies
• Nine of 15 evaluable patients had stable disease (SD) or better as best response
– Eight stable disease and one PR for a Clinical Benefit Rate (CBR) of 60%
• Median time on study for 16 RCC patients on BID fed schedule ~4 months
– Compares favorably with historical everolimus data in earlier stage Ph3 RCC studies (Table 7)
* IDH 1 or 2 mutant, FH-deficient, or SDH-deficient solid tumors
Table 6: Best Overall Response
Table 2: Baseline Characteristics
Study Treatment
• Oral CB-839 administered in 21-day cycles using one of two regimens:
– TID: Three times daily (upon waking, at ~3 pm and at bedtime)
– BID fed: Two times daily with meals
Safety, PK, Pharmacodynamic and Efficacy Assessments
• Laboratory assessments performed weekly for first 1-3 cycles
• Samples for pharmacokinetic and pharmacodynamic analyses were collected on C1D1, C1D15 and C2D1 (C1D1 and C1D15 fasted on TID regimen)
– A subset of TID patients received the C2D1 dose with food to compare fed vs fasting PK at steady state
• Computed tomography (CT) scans performed at baseline and on D1 of every third cycle (starting on C4D1)
Table 7: Response by Tumor Type
Table 3: PK Parameters on Fed vs Fasted Schedules
Figure 3: Increase in Exposure with Food
Figure 4: Treatment Duration
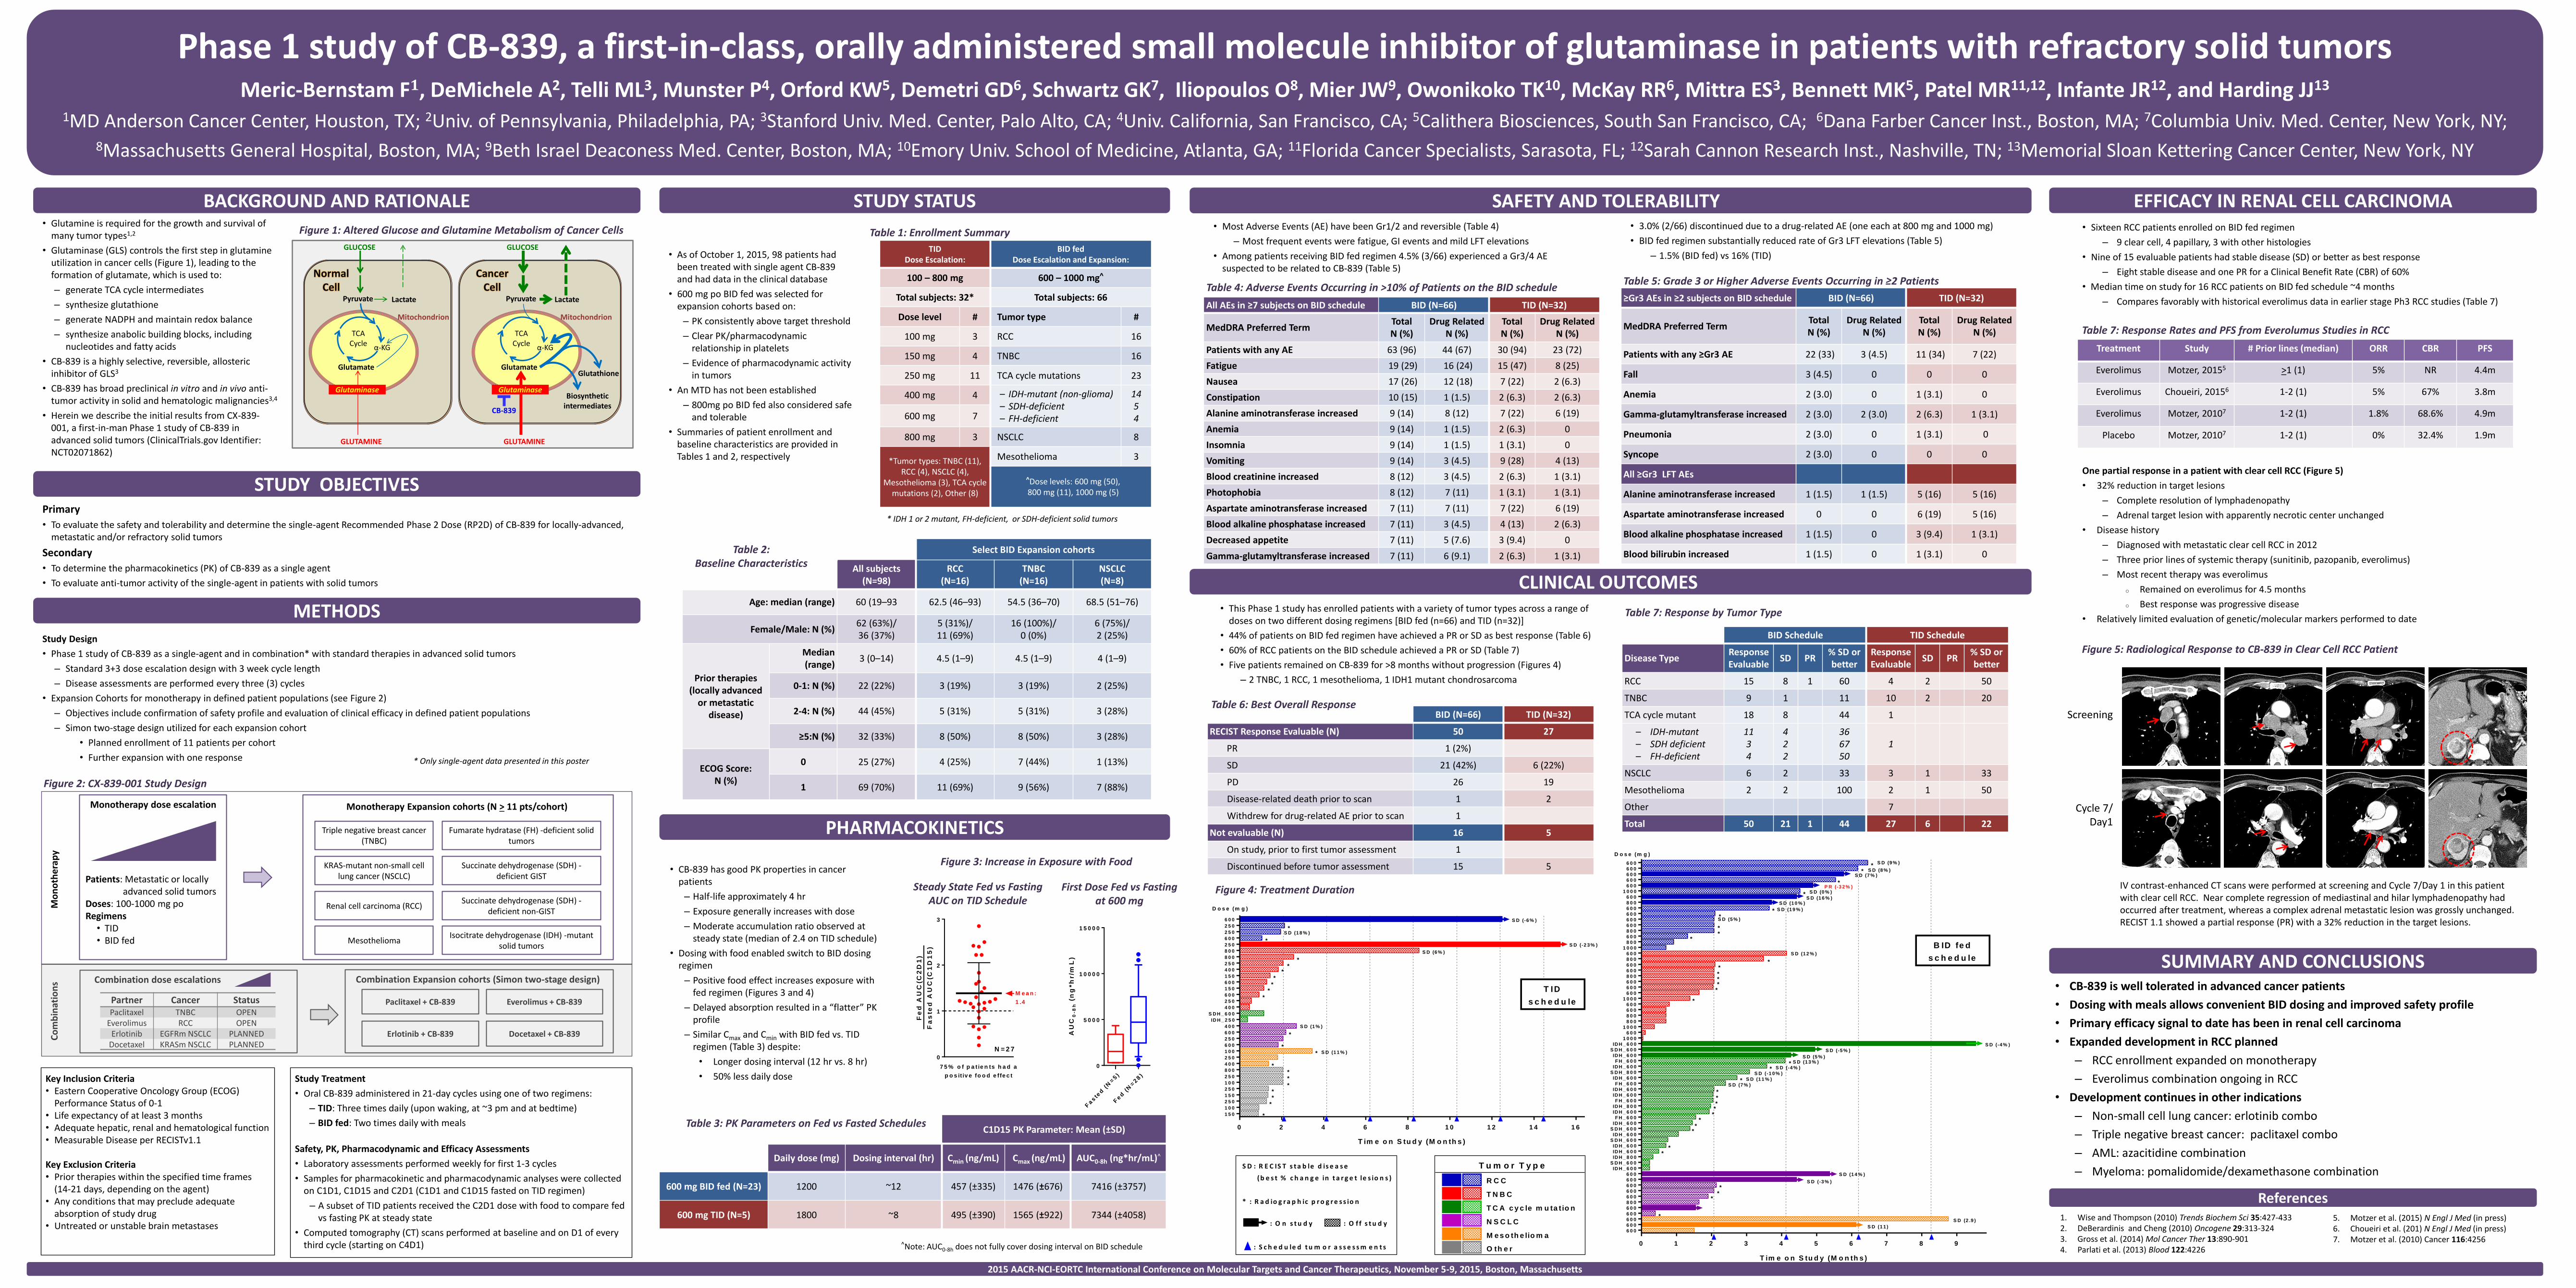
Figure 5: Radiological Response to CB-839 in Clear Cell RCC Patient
First Dose Fed vs Fasting at 600 mg
S D : R E C IS T s t a b le d is e a s e
( b e s t % c h a n g e in t a r g e t le s io n s )
* : R a d io g r a p h ic p r o g r e s s io n
: O n s t u d y : O f f s t u d y
: S c h e d u le d t u m o r a s s e s s m e n t s
R C C
T N B C
T C A c y c le m u ta t io n
N S C L C
M e s o th e lio m a
O th e r
T u m o r T y p e
Steady State Fed vs Fasting AUC on TID Schedule
Fe
d A
UC
(C2
D1
)
Fa
ste
d A
UC
(C1
D1
5)
0
1
2
3
7 5 % o f p a t ie n ts h a d a
p o s it iv e fo o d e ffe c t
M e a n :
1 .4
N = 2 7
• 3.0% (2/66) discontinued due to a drug-related AE (one each at 800 mg and 1000 mg)
• BID fed regimen substantially reduced rate of Gr3 LFT elevations (Table 5)
– 1.5% (BID fed) vs 16% (TID)
Screening
Cycle 7/ Day1
One partial response in a patient with clear cell RCC (Figure 5)
• 32% reduction in target lesions
– Complete resolution of lymphadenopathy
– Adrenal target lesion with apparently necrotic center unchanged
• Disease history
– Diagnosed with metastatic clear cell RCC in 2012
– Three prior lines of systemic therapy (sunitinib, pazopanib, everolimus)
– Most recent therapy was everolimus
o Remained on everolimus for 4.5 months
o Best response was progressive disease
• Relatively limited evaluation of genetic/molecular markers performed to date
Treatment Study # Prior lines (median) ORR CBR PFS
Everolimus Motzer, 20155 >1 (1) 5% NR 4.4m
Everolimus Choueiri, 20156 1-2 (1) 5% 67% 3.8m
Everolimus Motzer, 20107 1-2 (1) 1.8% 68.6% 4.9m
Placebo Motzer, 20107 1-2 (1) 0% 32.4% 1.9m
IV contrast-enhanced CT scans were performed at screening and Cycle 7/Day 1 in this patient with clear cell RCC. Near complete regression of mediastinal and hilar lymphadenopathy had occurred after treatment, whereas a complex adrenal metastatic lesion was grossly unchanged. RECIST 1.1 showed a partial response (PR) with a 32% reduction in the target lesions.
Table 7: Response Rates and PFS from Everolumus Studies in RCC