phase 1 air quality report - s3.eu-west-2.amazonaws.com
TRANSCRIPT

Registered office Bridge House, 1 Walnut Tree Close, Guildford GU1 4LZ
Highways England Company Limited registered in England and Wales number 09346363
Phase 2 Air Quality Report Commission No. 1
Date: 19th April 2021 Version: 2.0

Phase 2 Air Quality Report
Phase 2 Air Quality Report v2.docx Page 2 of 104
Document Control
Revision History
Version Date Description Author
1 29th March 2019 Final Draft Andrew Bean
2 19th April 2021 Final review for publication Andrew Bean / Sarah Naylor
Reviewer List
Name Role
Stephen Pyatt Air Quality Advisor
Ivan Le Fevre Environment Group Manager
Approvals
Name Signature Title Date of Issue
Version
Ivan Le Fevre Environment Group Manager 30/03/19 1.0
Ivan Le Fevre Environment Group Manager 19/04/21 2.0
The original format of this document is copyright to the Highways England.
Document Title Phase 2 Air Quality Report (Commission No. 1)
Author Andrew Bean
Owner Andrew Bean
Distribution DfT; JAQU
Document Status Final

Phase 2 Air Quality Report
Phase 2 Air Quality Report v2.docx Page 3 of 104
Table of Contents
Executive Summary
1. Introduction 7 1.1. Purpose 7 1.2. Structure of this Report 7
2. Baseline 8 2.1. Introduction 8 2.2. Air Quality Monitoring 8 2.3. Annualisation 8 2.4. New Monitoring Sites 9 2.5. Background Maps 9 2.6. Air Quality Management Areas 9 2.7. Qualifying Features 10 2.8. Highways England Land Boundary 10 2.9. Junctions 10
3. Traffic 12 3.1. Regional Transport Models 12 3.2. Comparison with Observed Traffic Data 12 3.3. Traffic Data Processing 14 3.4. Assessment of Speed Management in the Regional Transport Models 14 3.5. Observed Speed Profiles 15 3.6. Automatic Number Plate Recognition (ANPR) Data Collection 16 3.7. Buses 19 3.8. Traffic Management 19
4. Air Quality Modelling 21 4.1. Air Quality Models 21 4.2. Model 1 – Verification 21 4.3. Model 2 – SRN PCM Links 22 4.4. Vehicle Emissions 22 4.5. DMRB Air Quality Model 23 4.6. NOx:NO2 Conversion 23 4.7. Verification 23 4.8. Applying the Verifying Factors to the Air Quality Models 28 4.9. Modelling Between 2015 and 2026 28
5. Results 29 6. Mitigation 32
6.1. Electric Vans 32 6.2. Traffic Management 33 6.3. Speed Management 33 6.4. Identification of Qualifying SRN PCM Links 34 6.5. Building and Running Speed Limits in the RTMs 37 6.6. Evaluate the Changes in Traffic due to the Speed Limits 37 6.7. Air Quality Modelling of 60mph and 50mph Speed Limits 37

Phase 2 Air Quality Report
Phase 2 Air Quality Report v2.docx Page 4 of 104
6.8. Potential Impacts of a 70mph Speed Limit 39 6.9. Bus Retrofit 40 6.10. HGV Retrofit 42 6.11. 9.5m High Barriers 44 6.12. Barrier Feasibility Studies 45 6.13. Other Local Measures 45 6.14. Property Purchase 45 6.15. Footpaths (including moving, diversion, closure, and signing alternative routes) 46 6.16. Low Friction Road Surface 46 6.17. Mechanical Filtration 46
7. Air Quality Audit Report 47 7.1. Introduction 47 7.2. Summary of Baseline Maps 47 7.3. Evaluation of Mitigation Measures 47 7.4. Summary and Recommendation 48 7.5. Supporting Activities 48 7.6. JAQU Comments 48
8. Findings 49 Appendix A: Regional Traffic Model Technical Note 56 Appendix B: Percentage Euro Split Profile by Vehicle Class for EFT and Highways England’s ANPR Camera Survey for 2018 57 Appendix C: Summary of Local Authority Bus Feedback 59 Appendix D: Traffic Management 62
D1: Summary of Traffic Management Workshop 62 D2: Example of Traffic Management Option for HGVs 70 D3: Traffic Management Proforma 71
Appendix E: Annualised Annual Mean Nitrogen Dioxide Concentrations (µg/m³) for 2017 73 Appendix F: MIDAS Speed Profiles 103

Phase 2 Air Quality Report
Phase 2 Air Quality Report v2.docx Page 5 of 104
Executive Summary This report sets out Highways England’s approach and completion of the Phase 2 assessment (Commission No.1) for the remaining 86 SRN PCM links identified at the end of Phase 1 assessment (Commission No.1) as requiring further analysis. This was to determine whether they had concentrations exceeding the limit value for annual mean nitrogen dioxide concentration at relevant qualifying features beyond 2018. The report also then identifies likely mitigation measures for each SRN PCM link (if any). This Phase 2 assessment builds on the work completed for the Phase 1 assessment (Commission No.1), and includes:
• The annualised annual mean NO2 monitoring data for 2017 for 1,400 monitoring locations
• The indicative monitored NO2 concentrations for newly deployed air quality monitoring sites in 2018.
• The deployment of 9 ANPR cameras at representative locations across the strategic road network and analysis of the vehicle fleet make up.
• The use of traffic data from Highways England’s Regional Transport Model to support the air quality modelling for the 86 SRN PCM links and 1,400 monitoring sites as part of the air quality model verification process.
• The latest research findings on vehicle emissions for different driving behaviours and speed limits.
• Air quality modelling of the nearest qualifying features for the 86 SRN PCM links.
• Updates to the air quality mitigation: o Including the work on the air quality barrier feasibility studies alongside 5 SRN
PCM links; o The use of emerging vehicle emission rates for possible 60mph and 50mph
speed limits for a number of SRN PCM links identified at the Phase 1 of possible locations; and
o A review of possible Traffic Management interventions by a panel of Highway England’s specialists for all 86 SRN PCM links.
• Updates to ‘Any other local measures’ section of the mitigation including public access and consideration of alternative complimentary measures such as mechanical filtration.
The baseline maps and audit reports for each one of the 86 SRN PCM links have been updated with the new air quality monitoring data, traffic data from the Regional Transport Models, outputs from the air quality modelling and latest analysis of potential mitigation measures. The Audit Reports provide a view on whether mitigation measures have the potential to deliver compliance with the limit values in shortest timescales possible.

Phase 2 Air Quality Report
Phase 2 Air Quality Report v2.docx Page 6 of 104
The findings for the Phase 2 assessment (Commission No.1) are summarised in the table below.
Outcome Numbers of SRN PCM Links
Stopped at Phase 1 15
Recommend to stop at Phase 2 3
Recommend to progress to Phase 3 83
Total 101
The following table provides a breakdown on possible mitigation measures and the corresponding number of SRN PCM links that the measure may be applied. It may be that for some of the SRN PCM links there could be multiple possible mitigation measures put forward and they would be refined during Phase 3 assessment (Commission No.1). Whilst Heavy Goods Vehicles (HGVs) retrofit has been identified as possible measure for the remaining 83 SRN PCM links, there is no accredited retrofit system available for HGVs and such a measure would require a Government led scheme to implement.
Possible Mitigation Measure Numbers of SRN PCM Links
Electric Vans 0
Traffic Management 32
60mph Speed limit 17
50mph speed limit 25
Bus Retrofit 2
HGV Retrofit 83
9.5m High Barrier 3
Tunnels / Canopies/ Bypass 0
Public Access 76
Low Friction Road Surfacing 0
Mechanical Filtration 43
Of the 83 SRN PCM links recommended by Highways England to progress through to Phase 3 assessment (Detailed Design) (Commission No. 1), 38 SRN PCM links have modelled concentrations below the annual mean NO2 limit value. However, further work and additional air quality monitoring data is required to confirm this outcome and in the interim, we have adopted a precautionary approach and recommend they are considered as part of the Phase 3 assessment (Commission No. 1).

Phase 2 Air Quality Report
Phase 2 Air Quality Report v2.docx Page 7 of 104
1. Introduction
1.1. Purpose 1.1.1. This Phase 2 assessment (Commission No. 1) report builds on the Phase 1
assessment (Commission No. 1) and focuses on the traffic and air quality modelling for the 86 Strategic Road Network (SRN) PCM (Pollution Climatic Mapping) model links that were taken forward.
1.1.2. The purpose of this report is to set out the methodology and approach adopted for completion of the assessment including the traffic and air quality modelling. It also sets out approach to the verification of the Design Manual for Roads and Bridges (DMRB) air quality model, indicative annual mean NO2 concentrations for each of the 86 SRN PCM links and further refinement of the proposed mitigation measures. This reported is supported by updated baseline maps and audit reports for the 86 SRN PCM links.
1.1.3. The audit reports provide the summary information for each SRN PCM link and an initial high-level review of possible mitigation measures. The audit report provides a recommendation on whether the SRN PCM link should stop at Phase 2 or progress through Phase 3 (Commission No. 1). The outcome of Joint Air Quality Unit (JAQU) review for each of the 86 SRN PCM links is also captured in the audit report.
1.2. Structure of this Report 1.2.1. The report initially covers updates to the baseline information and maps, traffic
modelling and processing, air quality monitoring and modelling, encompassing the model verification and further work undertaken on the development of mitigation measures. The indicative modelled annual mean NO2 concentrations and the effects of the proposed mitigation are documented.
1.2.2. The report concludes with the completion of the audit, bringing all this information together and the development of the advice of whether to stop at Phase 2 or progress to Phase 3 assessment (Commission No. 1).

Phase 2 Air Quality Report
Phase 2 Air Quality Report v2.docx Page 8 of 104
2. Baseline
2.1. Introduction 2.1.1. The baseline maps summarise the key features around each of the 86 SRN PCM
links, and have been updated including a map of the local areas, the indicative modelled annual mean nitrogen dioxide (NO2) concentrations, local air quality monitoring data annualised to 2017, the presence or absence of Air Quality Management Areas (AQMA), the location of qualifying features (public access, e.g. footpaths, or sensitive receptors e.g. residential properties) and traffic data from the Regional Transport Models (RTM).
2.2. Air Quality Monitoring 2.2.1. Highways England undertakes air quality monitoring using a combination of diffusion
tubes and automatic monitoring stations. The monitoring is undertaken for a variety of purposes including scheme assessments, as part of the National Air Quality Monitoring Network (NAQMN) and monitoring that has been installed to inform this assessment.
2.2.2. The location of any monitoring alongside or close to the 86 SRN PCM links has been updated in the respective baseline maps. Around 1,400 monitoring sites have been identified for use in the model verification process (see Section 4.7). Given the large numbers of monitoring sites a shapefile or google earth kmz file can be provided on request which shows their locations.
2.2.3. Highways England maintains a database of historical monitoring as part of the work undertaken for scheme delivery. The monitoring used in this assessment has been collected between 2015 and 2017. This monitoring data has primarily been used to verify the air quality model and determine whether any PCM link is still likely to exceed the limit value. As requested by JAQU only monitoring meeting the reporting criteria for comparison with the limit values are used to discount the possibility of limit value exceedance.
2.2.4. All monitoring data was annualised to the year of the base year traffic model, 2017 following the approach outlined in Section 2.3.
2.3. Annualisation 2.3.1. To annualise the diffusion tube data to 2017 the monthly diffusion tube results for
2015 to 2017 were initially checked and any anomalous measurements were removed. Sites with less than 25% annual data capture rate (i.e. less than three months of data) were also removed from the annualisation process.
2.3.2. Where monitoring data was available for 2017 this was used in preference to monitoring data collected in 2016 or 2015. Likewise, where data for 2016 was available this was used in preference to data collected in 2015 for the annualisation process.

Phase 2 Air Quality Report
Phase 2 Air Quality Report v2.docx Page 9 of 104
2.3.3. The annualisation process converted both the short term 2017 monitoring concentration and monitoring concentrations in 2016 and 2015 into an equivalent 2017 concentration. This followed the methodology outlined in Department for the Environment Food and Rural Affairs (Defra) Local Air Quality Management Technical Guidance 2016 (LAQM.TG(16)), Box 7.10.
2.3.4. For each diffusion tube site, the three most representative Automatic Urban and Rural Network (AURN) monitoring stations were selected within 50 miles (80km) of the monitoring site. AURN sites were only used if they had a data capture rate of greater than 85% to the year of interest i.e. 2015 to 2017.
2.4. New Monitoring Sites 2.4.1. In addition to the air quality monitoring undertaken for scheme assessments,
additional air quality monitoring has been undertaken on a number of SRN PCM Links to gather more evidence as to whether there are exceedances of the limit values, this information will be used in the Phase 3 assessment (Commission No. 1).
2.5. Background Maps 2.5.1. The background pollutant concentrations (2015 reference year), used in the air
quality modelling were obtained from the Defra background pollutant maps1, the most up to date maps published at the time this report was produced.
2.5.2. To avoid double counting of pollutant concentrations in the Design Manual for Roads and Bridges (DMRB) air quality modelling, the in component of the background maps for the roads specifically being modelled were removed from the maps using the latest version of the nitrogen dioxide (NO2) Adjustment for oxides of nitrogen (NOx) sector removal tool (version 6.0). The roads removed included the in-grid motorway and trunk road sectors.
2.6. Air Quality Management Areas 2.6.1. For each SRN PCM link the latest published air quality reports for the adjoining local
authorities have been reviewed to establish the presence of any AQMAs in the near locality. Where there are one or more AQMAs; either covering specifically the SRN PCM link, the adjoining local roads or borough wide; they have been depicted on the maps. Each AQMA has been annotated and the details of the AQMA, the relevant local authority and the basis for the declaration, e.g. annual mean NO2, recorded in the corresponding table in the baseline map. The presence or absence of AQMAs helps inform the overall risks of annual mean NO2 concentrations being higher than 40µg/m³ alongside the SRN.
1 https://laqm.defra.gov.uk/review-and-assessment/tools/background-maps.html

Phase 2 Air Quality Report
Phase 2 Air Quality Report v2.docx Page 10 of 104
2.7. Qualifying Features 2.7.1. The satellite mapping in Google Maps and ‘Street view’ feature has been used to
identify qualifying features within 15m of each SRN PCM link, which include:
• Sensitive receptors: houses, schools, hospitals, care homes, libraries, etc
• Public access: footpaths, cycle ways, bridle ways
2.7.2. Qualifying features exclude;
• Places of work;
• Access perpendicular to the road e.g. pedestrian footbridge;
• Locations within 25m of Junctions.
2.8. Highways England Land Boundary 2.8.1. For each of the 86 SRN PCM link the extents of the Highways England land boundary
have been depicted on the baseline maps.
2.8.2. Annex III of the Air Quality Directive (2008/50/EC) sets out the locations of sampling points for assessing compliance with the Directive. Included in Annex III are three exceptions where the Directive does not apply, “2. Compliance with the limit values directed at the protection of human health shall not be assessed at the following locations: (a) any locations situated within areas where members of the public do not have access and there is no fixed habitation; (b) in accordance with Article 2(1), on factory premises or at industrial installations to which all relevant provisions concerning health and safety at work apply; (c) on the carriageway of roads; and on the central reservations of roads except where there is normally pedestrian access to the central reservation.”
2.8.3. Each of the SRN PCM links have been reviewed to identify the nearest qualifying feature within 15m of the road network. This may not coincide with Defra model compliance at a point 4m from the edge of a road / kerbside.
2.9. Junctions 2.9.1. JAQU has issued guidance to local authorities for local roads that measurements
should not be undertaken within 25m of a junction, including the entirety of the junction, as it is not representative of the wider road network. For motorways and trunk roads JAQU’s guidance defines a “major junction” as a junction which interrupts the traffic flow on the road, or changes the speed / driver behaviours. This includes, for example, traffic light controlled junctions and access / egress points that disrupts the flow and speed on the main line.
2.9.2. Where JAQU have identified PCM links that appear within junctions and recommended they should be considered, Highways England have progressed the assessment for these based on JAQU advice.

Phase 2 Air Quality Report
Phase 2 Air Quality Report v2.docx Page 11 of 104
2.9.3. Annual Average Daily Traffic (AADT) data provided for this Phase 2 assessment. This is a representation of average flows, average percentage Heavy Duty Vehicles (HDVs) and average speed for an average day. It is not possible using this data to robustly identify if the presence of either an on-slip or off slip for a motorway or trunk road would affect driver behaviour in and around the junction. As part of the Phase 3 assessment (Commission No. 1) a greater temporal resolution for the traffic data will be provided which will for a better analysis of the effects of junctions on driving behaviours.

Phase 2 Air Quality Report
Phase 2 Air Quality Report v2.docx Page 12 of 104
3. Traffic
3.1. Regional Transport Models 3.1.1. Highways England’s Regional Traffic Models (RTMs) have been developed to assist in
the delivery of the Road Investment Strategy (RIS), and for use on associated Highways England projects. There are five RTMs which together cover all of England, with focus on the Strategic Road Network (SRN).
3.1.2. The model has a 2015 base and a series of forecast years between 2026 and 2051. Modelled peaks cover the weekday AM (7-10), interpeak (10-4) and PM peak (4-7pm).
3.1.3. The RTMs were chosen as a starting point for the Phase 2 assessment due to their broad coverage of the SRN. A review by Highways England indicated that there were no alternative models with the same coverage of the SRN (for example local traffic models developed to support schemes assessment) as the RTM.
3.1.4. This section of the report describes how data has been extracted from the model for
use in air quality modelling.
3.1.5. For the Phase 2 assessment the 2015 ‘base’ and 2026 RIS2 Do Minimum forecast models (Run 2) were used. This forecast model includes all committed schemes (RIS1) but does not include proposed RIS2 schemes. The RTMs model traffic over the AM, Interpeak (IP) and PM peak models were used for data extraction and to generate the AADTs used in the air quality modelling.
3.1.6. Whilst the RTM are broadly consistent with WebTAG (DfT’s internet based Transport
Appraisal Guidance), the use of the RTMs imposes some limitations on the analysis. In particular, the regional nature of the modelling, with each covering a very large geographic area means that the accuracy of traffic data (such as flows or speeds) on any given link is variable. This is common for traffic models on any scale, but especially when the number of links and zones is so large. This means that, as the PCM links are progressed through further phases, additional modelling work will be necessary to inform a more detailed analysis. The exact nature of such modelling will need to be assessed for each individual PCM link depending on the location and the scale of impact, but could be (for example) simple spreadsheet modelling, manually assigning traffic demand, where route choice is limited or a locally revalidated version of an RTM, focused on the particular study area, in a more complex and/or congested network.
3.1.7. A summary of the traffic data processing is provided below, with full details provided in Appendix A.
3.2. Comparison with Observed Traffic Data 3.2.1. The RTMs are validated on a regional level given the large scale and strategic nature
of this type of traffic model. To verify that base year modelled and observed flows

Phase 2 Air Quality Report
Phase 2 Air Quality Report v2.docx Page 13 of 104
are a reasonable match near the SRN PCM links a comparison exercise has been undertaken against actual traffic counts.
3.2.2. Observed speed and flow data was collated from WebTRIS for a 5km buffers around each PCM link. This necessitated identification of relevant Highways England traffic count sites and mapping them to the corresponding modelled traffic link in the RTM for each carriageway. A comparison was then undertaken of modelled traffic flows and speed in 2015 and observed traffic flows and speed in the same year to determine the extent to which the RTMs can be considered to be a good representation of base year traffic conditions.
3.2.3. The GEH2 statistic, commonly used in traffic modelling, was used to assess this
correlation, defined as
𝐺𝐸𝐻 = √2(𝑀𝑜𝑑𝑒𝑙𝑙𝑒𝑑 𝑓𝑙𝑜𝑤 − 𝑂𝑏𝑠𝑒𝑟𝑣𝑒𝑑 𝑓𝑙𝑜𝑤)2
𝑀𝑜𝑑𝑒𝑙𝑙𝑒𝑑 𝑓𝑙𝑜𝑤 + 𝑂𝑏𝑠𝑒𝑟𝑣𝑒𝑑 𝐹𝑙𝑜𝑤
3.2.4. Ideally for traffic model validation purposes for the assessment of a scheme, the
majority of flows should below / less than a GEH of 5.0. However, in this case such good correlation cannot be expected because of the size and diverse nature of the road network used in the assessment across England. Applying a test in which flows fall within a GEH of 7.5, over half of links passed, and it is considered that this is sufficient for an initial assessment (subject to later review of each site). Full results are provided in Table 3 of Appendix A.
3.2.5. Correlation for speed is much weaker than that for flows. Traffic model journey time
validation is undertaken over extended lengths of the network rather than at individual road links in the traffic model. Given the size of the RTMs it is not expected that speed representation would be ideal, and therefore for the Phase 2 assessment (Commission No. 1) the speeds have been set to free flow which is consistent with average speeds over an AADT period.
3.2.6. In most cases, the overall average daily speeds are reduced due to small periods of
congestion which occur each day. Because they are limited in duration, for the purposes of air quality modelling for Phase 2 assessments (Commission No. 1), where daily average speeds are required, it has been assumed that free-flow speeds are a reasonable representation of the average speeds. This assumption will be refined as part of the Phase 3 assessment (Commission No. 1).
3.2.7. In summary, given this review, it is considered that the RTMs provide reasonable
flow data for the purposes of air quality modelling. For speeds, free-flow will be assumed as a reasonable approximation to a daily average speed.
2 Named for Geoffrey E Havers

Phase 2 Air Quality Report
Phase 2 Air Quality Report v2.docx Page 14 of 104
3.3. Traffic Data Processing 3.3.1. A 100m buffer around each of the SRN PCM link and air quality monitoring site was
created in GIS and used to identify the links across the five regional transport models required for use.
3.3.2. Data was extracted as follows for 2015 and 2026:
• Flow (veh/hr, converted from passenger car units)
• %HGV
• Speed
• Speed band (based on IAN 185/15)
The modelled AM, interpeak and PM hours cover 12 hours of the day (7am-7pm). Using standard factors (shown in Table 3.1) provided by the Highways England’s Performance, Analysis and Modelling Group the following were then calculated:
• Annual Average Daily Traffic (AADT)
• Annual Average Weekday Traffic (AAWT)
• Average daily speeds (assumed to be 12 hour speeds) Table 3.1: Factors for Conversion from 12 Hour Weekday to AAWT/AADT
12 Hour to AAWT Light Duty Vehicles Heavy Duty Vehicles
Motorway 1.277 1.299
Other 1.215 1.230
AAWT to AADT All Vehicles
Motorway 0.981
Other 0.959
3.3.3. Linear interpolation was applied to the RTM outputs for 2015 and 2026 to calculate the equivalent AADT flows, %HDVs and speed for interim years 2016-2025. The resultant data was then made available for the air quality modelling as described in Appendix A, Section 2.4Error! Reference source not found..
3.4. Assessment of Speed Management in the Regional Transport Models 3.4.1. One of the mitigation measures being considered is the use of speed limits to reduce
the amount of NOx emissions emitted per vehicle when compared to the national speed limit. To ascertain whether the RTMs were able to represent impact of speed limits on traffic behaviours (flow and speed) a small section of the M1 between junctions 33-35 was modelled with a 60mph and 50mph for the AM, IP and PM peak periods.

Phase 2 Air Quality Report
Phase 2 Air Quality Report v2.docx Page 15 of 104
3.4.2. Coding of a 60mph speed limit in the RTM showed only a small reduction in speed and flow over the whole day. With a 50mph limit the reduction was more marked, with AADT reducing by over 10,000 vehicles per day (two-way) and average speed reducing by 9 mph. This change corresponded with increased flows on surrounding roads.
3.4.3. Based on the outcome of the 60 and 50mph RTM evaluation it was concluded that the RTMs were a suitable model for an initial assessment of the effects of speed limits on traffic flows and movements using the RTMs, subject to the caveats discussed in Section 3.1.
3.5. Observed Speed Profiles 3.5.1. Lane-by-lane traffic data was extracted from Highways England’s MIDAS traffic data
collection system for neutral traffic months (representative of the traffic model outputs, April and October 2018) at 3 representative locations across the SRN to provide an indication of flow and speed distribution by lane and hour of the day:
• M1 Jn 26-27 north and south bound
• M60 Jn 24-25 clockwise and anti-clockwise
• M4 Jn 3-4 east and west bound
3.5.2. Figure 3.1 illustrates the average speed for April and October by lane over 24 hour period for the M1 Jn27-26 southbound. Additional graphs are presented in Appendix E for the other representative sections of the SRN. Figure 3.1 MIDAS Speed Profile for M1 Jn27-26 Southbound
3.5.3. As depicted in Figure 3.1, lanes 1 and 2 are at or below the national speed limit (70mph) with lanes 3 and 4 travelling above 70mph, with lane 4 tending to speeds nearer 80mph. The speed plot also shows a decrease in speeds in the morning peak between 6AM and 8AM.
0
10
20
30
40
50
60
70
80
90
0 1 2 3 4 5 6 7 8 9 10 11 12 13 14 15 16 17 18 19 20 21 22 23
Spee
d (
mp
h)
Hour Beginning
Lane 1 Lane 2 Lane 3 Lane 4

Phase 2 Air Quality Report
Phase 2 Air Quality Report v2.docx Page 16 of 104
3.5.4. Examples of MIDAS speed plots for other locations on the SRN are provided in Appendix E.
3.5.5. Whilst there are times of the day when observed speeds are above the national speed limit it has not been possible to incorporate this information into air quality modelling of possible speed limit mitigation for Phase 2 (see Section 6.3). As part of the Phase 3 assessment (Commission No. 1) further work will be undertaken to incorporate the speed and flow distribution by lane at the relevant SRN PCM location. This will provide a more robust assessment of the impacts that speed limits may have on changes in annual mean NO2 concentrations.
3.6. Automatic Number Plate Recognition (ANPR) Data Collection 3.6.1. Highways England has undertaken an ANPR camera surveys at 9 locations across the
SRN. The sites are listed in Table 3.2 and were selected to be representative of the network, as opposed to focusing on specific individual SRN PCM links. The ANPR camera surveys were undertaken in November 2018 and included both weekday and weekend traffic data. Table 3.2 List of ANPR Camera Survey Locations
Road Location OS Grid Reference (x, y)
A1 Newcastle upon Tyne 421045, 567524
A19 Seaham 441245, 545313
M60 Manchester 387897, 403534
M53 Ellesmere Port 339660, 377724
M6 Birmingham 418151, 288246
M4 Isleworth 514040, 178471
M27 Southampton 438557, 117505
A27 Havant 470898, 105990
A38 Plymouth 250330, 057134
3.6.2. The purpose of the ANPR survey was to examine how well the distribution of
different vehicle types and their euro classification on the SRN was represented in the EFT. Figure 3.2 depicts the percentage difference between the ANPR camera surveys and EFT for 2018 averaged across all 9 sites. As illustrated in Figure 3.2 the ANPR camera show a higher proportion for older cars and vans, of the order of 5 to 10%, on the SRN than the national fleet projections in EFT for 2018. For rigid and articulated HGVs and buses, the ANPR camera surveys indicates that there is around 15% more Euro V’s on the SRN than the national fleet distribution in EFT. Consequently, there are lower numbers of Euro 6 / VI vehicles on the SRN than EFT This is depicted by the green line in Figure 3.2.
3.6.3. This means that current vehicle emissions and by extension roadside NO2
concentrations would be higher than EFT, as the vehicle fleet on the SRN has higher proportions of older vehicles (higher NOx emissions) and lower proportions of Euro 6 /VI (lower NOx emissions) than the national fleet compositions in EFT.

Phase 2 Air Quality Report
Phase 2 Air Quality Report v2.docx Page 17 of 104
3.6.4. To illustrate the difference between applying the average fleet composition from the ANPR survey compared to EFT, the Road NOx emissions have been calculated for a motorway and urban road with average traffic characteristics in 2018 (see Table 3.3). EFT has been run using the standard euro standard profile and then a user defined euro profile based on the ANPR camera survey (Appendix B) to produce road NOx emissions.
3.6.5. The road NOx emissions were then converted to a road NOx concentration for a
point 4m from the edge of the road using the DMRB air quality model. A proxy road NO2 concentration assuming half of NOx is NO2 has been calculated. The results are presented in Table 3.3.
Table 3.3 NOx Emissions and NOx, NO2 Concentrations based on Fleet Profile in EFT and Highways England’s ANPR Camera Survey
Road Type
Traffic Characteristics NOx Emissions (g/km/s)
Road NOx Concn (µg/m³)
Road NO2 Concn (µg/m³)
Based on
AADT %HDV Speed (kph)
EFT ANPR EFT ANPR EFT ANPR
Motorway 140,000 10 96 0.75 0.85 75.2 85.2 37.6 42.6
Urban 30,000 3 48 0.13 0.14 42.8 46 21.4 23
3.6.6. A comparison of the road NO2 concentrations between the ANPR camera survey and
EFT results in approximately 5µg/m³ and 2µg/m³ higher NO2 concentrations for an average motorway and urban road respectively. This is for a point 4m from the edge of the road.
3.6.7. The outcomes of the ANPR camera survey and consequent difference in NOx emissions and the NOx / NO2 concentrations have not been specifically incorporated in this Phase 2 air quality modelling (although it will be captured as part of the model verification process). Further work is required to incorporate the different emissions profile and calculated the revised fleet projections into future years. This will be incorporated into the air quality modelling as part of Phase 3 (Commission No. 1).

Registered office Bridge House, 1 Walnut Tree Close, Guildford GU1 4LZ
Highways England Company Limited registered in England and Wales number 09346363
Figure 3.2 Percentage Difference Between Vehicle Types Observed in the ANPR Surveys and EFT for 2018

Registered office Bridge House, 1 Walnut Tree Close, Guildford GU1 4LZ
Highways England Company Limited registered in England and Wales number 09346363
3.7. Buses 3.7.1. Following completion of the Phase 1 assessment (Commission No. 1), for those links
where number of buses journeys were identified based on the presence or absence of bus stops on SRN PCM links, the corresponding local authorities were contacted. This was to ascertain any further local information they may have on the number of bus journeys and the euro composition of the bus fleet. The responses from the local authorities are set out in Appendix C.
3.7.2. Based on the information provided by the local authorities it was not possible to
update the number of bus journeys used in the Phase 1 assessment (Commission No. 1), nor develop a more specific euro classification distribution. The same numbers of bus movements and euro classification used in Phase 1 has been re-applied to Phase 2 assessment. However, the emissions calculations have been updated using the bus retrofit emission values from EFT in preference to assuming all non-Euro VI would become a Euro VI bus.
3.7.3. Using this information does not change the conclusions of the Phase 1 assessment
(Commission No. 1), i.e. retro fitting buses would have no impact on roadside NO2 concentration for the SRN.
3.8. Traffic Management 3.8.1. Highways England convened a panel of specialists, including representatives from
traffic, operations and air quality, to review each SRN PCM link to see whether there were any potential traffic management interventions that could be introduced to help support improvements in air quality. Interventions were considered for each PCM link and traffic management options include re-routing, changes considered including signal timings, junction alteration, and road re-alignment.
3.8.2. To assist with the review process, a traffic management proforma (see Appendix D3) was produced for each proposed measure to qualitatively record the anticipated changes for the following categories:
• Description of the proposed measure
• Anticipated change in air quality on the PCM link
• Anticipated change in air quality on the non-PCM link (adjoining roads)
• Overall balance of air quality benefit
• Ease of delivery
• Road safety concerns
• Delivery time (years)
3.8.3. Based on the panels professional opinion each category was rated as either having an improvement (moderate or small), little to no change or worsening (moderate or small). Delivery time was considered either as being achievable within 1 year, 1 to 3 years or more than 3 years.

Phase 2 Air Quality Report
Phase 2 Air Quality Report v2.docx Page 20 of 104
3.8.4. A summary of the findings of the traffic management review are presented in Appendix D1 and individual measures recorded in the audit report for corresponding SRN PCM link. In some instances, the panel concluded that there were no traffic management options that could be introduced, or the same measure might provide benefits to a number of SRN PCM links along the same stretch of road e.g. A500 in Stoke-on-Trent.
3.8.5. The links which were identified by the panel as having the potential for traffic
management will be considered as part of the Phase 3 assessment (Commission No. 1).

Phase 2 Air Quality Report
Phase 2 Air Quality Report v2.docx Page 21 of 104
4. Air Quality Modelling
4.1. Air Quality Models 4.1.1. Two air quality models have been created to support the Phase 2 assessment
(Commission No. 1), these include:
• Model 1: This model includes all the annualised air quality monitoring points for 2017 and is used to verify the modelled annual mean NO2 concentrations.
• Model 2: This model includes the 86 SRN PCM links. 4.2. Model 1 – Verification 4.2.1. The DMRB air quality model requires the input of the distance from the road centre
to the modelled point and road widths.
4.2.2. The ordnance survey grid references for approximately 1,400 diffusion tubes and 21 automatic air quality monitoring stations were entered in to GIS software along with the road network from the RTM, and overlain on Ordnance Survey mapping. This enabled the distances to be measured from each monitoring point to the road centre lines of the road network and corresponding road widths.
4.2.3. The 1,400 monitoring sites were reviewed prior to building Model 1 to ensure their suitability for inclusion in the model verification process. Monitoring sites were removed for the following reasons:
• A monitoring location was a 100m or more from the SRN;
• Triplicate diffusion tubes were averaged to produce a single concentration for the monitoring location;
• Part of the road network was not included in the RTM and it was considered that traffic on the road would have made a notable contribution to the measured concentration;
• Low data capture rates;
• Very localised sources not represented in the model e.g. large car parks, bus stops, that could potentially affect the monitored concentration.
4.2.4. Following completion of the review, 1,075 diffusion tubes and 21 automatic air
quality monitoring stations were taken forward for use in the model verification process.
4.2.5. A model input file was created for each one of the 1,075 monitoring sites including the relevant road ID. This enabled the traffic data from the RTM in 2017 to be linked to the road network for each monitoring point. All of this information was then entered into the DMRB air quality model and the model year set to 2017 to correspond to the annualised monitored NO2 concentrations.

Phase 2 Air Quality Report
Phase 2 Air Quality Report v2.docx Page 22 of 104
4.3. Model 2 – SRN PCM Links 4.3.1. The 86 SRN PCM links have been entered in to GIS software along with the road
network from the RTM, and overlain on OS mapping. The OS mapping and aerial photographs for each SRN PCM link have been reviewed to identify the closest qualifying feature i.e. sensitive receptor or public access to the road. This has become the model receptor point for this link to enable a comparison against the annual mean NO2 limit value of 40µg/m³. The updated baseline maps include a map of each PCM link, and road network from the RTM.
4.3.2. Once the model receptor was defined, the distances from the model receptor to the road centre lines for the adjoining road network were measured along with the corresponding road widths.
4.3.3. A model input file was created for each SRN PCM link, including the model receptor ID and relevant road IDs. This enabled the traffic data from the RTM to be linked to the road network for each monitoring point. This information was then entered in to the DMRB air quality model initially for 2017 to correspond to the annualised monitoring concentrations.
4.3.4. A further 3 years were modelled for 2020, 2023 and 2026 this was to enable initial
calculations to determine the extents of any exceedances of the limit values.
4.4. Vehicle Emissions 4.4.1. Highways England has commissioned a research project exploring the effects of
driving behaviours on vehicle emissions with a view to updating the speed bands published in Interim Advice Note 185/15.
4.4.2. The research had the following aims:
• To determine the effects that different driving styles i.e. congested conditions, free flow has on emissions;
• To determine whether the current speed bands for motorways and trunk roads were still valid or need to be updated based on the outcomes of the research;
• To determine whether emissions published in Defra’s Emissions Factor Toolkit to current speed bands for motorways and trunk roads were consistent with the findings of the research;
• To determine whether reduce levels of congestion and / or introduce speed limits could be a successful air quality mitigation measure.
4.4.3. The report concluded that there was a need to:
• Create a new speed band to represent high speed driving i.e. to account for 50% of cars and vans travelling faster than 70mph on motorways;
• Have a lower emission rate representing traffic in light congested conditions (30-50mph) than currently published in IAN 185/15;
• Create emission values to describe the effects of 70mph, 60mph and 50mph speed interventions;
• There was no change to the speed bands for urban roads.

Phase 2 Air Quality Report
Phase 2 Air Quality Report v2.docx Page 23 of 104
4.4.4. The updated speed band emissions values have been used in the Phase 2
assessment (Commission No. 1) for Models 1 and 2.
4.5. DMRB Air Quality Model 4.5.1. The DMRB air quality spreadsheet model (v6) has been used for the Phase 2
assessment (Commission No. 1). The DMRB air quality model was developed and validated against air quality monitoring alongside both motorways and urban roads deployed specifically for the development of this model. This has enabled the development of bespoke drop off curves for the different road types, which takes account of the effect that local features have on pollution dispersion.
4.5.2. The DMRB air quality model is capable of modelling average traffic flows and period traffic flows along with the option to model individual roads or a single road source representing both carriageways on a motorway for example.
4.5.3. The input files for models 1 and 2, where entered into version 6 of the DMRB air
quality model, including traffic data (flows, %HDVs, road type and speed band), distances to both the centre of the road and the road width of each road for each air quality receptor modelled. The corresponding emissions are then selected from the relevant speed band for Light Duty Vehicles (LDVs) and Heavy Duty Vehicles (HDVs) for the selected year.
4.5.4. The DMRB air quality model calculates the road NOx concentration for each receptor, aggregating multiple road sources together for each receptor where applicable to derive a total roadside NOx concentration.
4.6. NOx:NO2 Conversion 4.6.1. In accordance with LAQM.TG(16) all modelled road-based concentrations of oxides
of nitrogen (NOx) have been converted to annual mean NO2 using the ‘NOx to NO2’ calculator (Version 6.1, released October 2017). The traffic mix and local authority used for the conversion from NOx to NO2 were selected depending on the location of the modelled receptor and diffusion tube locations.
4.7. Verification 4.7.1. The comparison of modelled concentrations with local monitored concentrations is
a process termed ‘verification’. Model verification identifies any discrepancies between modelled and measured concentrations, which can arise for a range of reasons. The following are examples of potential causes of such discrepancies:
• estimates of background pollutant concentrations;
• traffic data uncertainties;
• emission factor uncertainties;
• model input parameters; and
• local conditions not represented in the model e.g. hill climbs or street canyons.
Phase 2 Air Quality Report
Phase 2 Air Quality Report v2.docx Page 24 of 104
4.7.2. The verification process involves a review of the modelled pollutant concentrations against corresponding monitoring data to determine how well the air quality model has performed. Depending on the outcome it may be considered that the model has performed adequately and that there is no need to adjust any of the modelled results.
4.7.3. Residual uncertainty may remain after systematic error or ‘overall model accuracy’ has been accounted for in the final predictions. Residual uncertainty may be considered synonymous with the ‘residual inaccuracies’ of the model predictions, i.e. how wide the scatter or residual variability of the predicted values compare with the monitored ‘true value’, once systematic error has been allowed for. The quantification of final model accuracy provides an estimate of how the final predictions may deviate from the ‘true’ (monitored) values at the same location over the same period. It must though be recognised that some of the residual uncertainty will be down to uncertainties in the monitored values.
4.7.4. The monitoring data for the 1,400 diffusion tubes and 21 automatic monitoring stations used for the model verification can be provided as a kmz or shapefile on request. This monitoring data has been used to validate the DMRB Air Quality model prediction and obtain adjustment factors which can be applied to predictions of pollutant concentrations in the base and future years.
4.7.5. An evaluation of model performance has been undertaken to establish confidence in model results. LAQM.TG(16) identifies a number of statistical procedures that are appropriate to evaluate model performance and assess the uncertainty. The statistical parameters used in this assessment are:
• root mean square error (RMSE);
• fractional bias (FB); and
• correlation coefficient (CC).
4.7.6. A brief for explanation of each statistic is provided in Table 4.1, and further details can be found in Defra’s LAQM.TG(16) Box 1.17.
4.7.7. These parameters estimate how the model results agree or diverge from the observations. The calculations of annual mean NO2 have been carried out prior to, and after adjustment, and provide information on the changes in the model predictions as a result of the application of the verification adjustment factors.
4.7.8. Road NOx measured at the diffusion tubes was calculated using the latest version of Defra’s NOx to NO2 calculator (v6.1.1), because diffusion tubes only measure NO2 and do not directly measure NOx. The initial verification was undertaken by comparing the modelled Road NOx against the monitored Road NOx.

Phase 2 Air Quality Report
Phase 2 Air Quality Report v2.docx Page 25 of 104
Table 4.1 Model Verification Statistical Parameters
Statistical Parameter
Comments Ideal value
Root Mean Square Error (RMSE)
RMSE is used to define the average error or uncertainty of the model. The units of RMSE are the same as the quantities compared. If the RMSE values are higher than 25% of the objective being assessed, it is recommended that the model inputs and verification should be revisited in order to make improvements. For example, if the model predictions are for the annual mean NO2 objective of 40 μg/m3, if an RMSE of 10 μg/m3 or above is determined for a model it is advised to revisit the model parameters and model verification. Ideally an RMSE within 10% of the air quality objective would be derived, which equates to ±4 μg/m3 for the annual mean NO2 objective.
0.01
Fractional Bias
It is used to identify if the model shows a systematic tendency to over or under predict. FB values vary between +2 and -2 and have an ideal value of zero. Negative values suggest a model over-prediction and positive values suggest a model under-prediction.
0.00
Correlation Coefficient
It is used to measure the linear relationship between predicted and observed data. A value of zero means no relationship and a value of 1 means absolute relationship. This statistic can be particularly useful when comparing a large number of model and observed data points.
1.00
4.7.9. Concentrations of road NOx recorded at automatic monitors were calculated by
subtracting background concentrations of NOx (acquired from Defra’s background maps) from the total NOx recorded at the automatic site.
4.7.10. The initial comparison between the modelled concentrations and monitoring data showed poor levels of alignment for both the diffusion tubes and automatic monitoring stations (Table 4.2). This is to be expected given the very large number of monitoring and the varied nature of the SRN across England. Applying a single verification adjustment factor of 1.33 based on the diffusion tube monitoring for an initial comparison for all 1075 diffusion tubes or 1.77 for the automatic stations does not vastly alter the performance statistics as shown by the small changes to the correlation, RMSE and fractional bias statistics (Table 4.2).

Phase 2 Air Quality Report
Phase 2 Air Quality Report v2.docx Page 26 of 104
4.7.11. Following this initial comparison between modelled and monitored road NOx concentrations, a number of verification scenarios were evaluated to see if there was an improvement in the verification statistics.
4.7.12. The scenarios investigated were for the diffusion tubes: 1. All roads with flows > 10,000 AADT: Given the strategic nature of the Regional
Traffic Models, this allows for minimising some of the uncertainties by removing flows less than 10,000 AADT which may be not be represented in the traffic model with a high degree of precision.
2. All diffusion tube sites within 50m of the SRN: represents the known extents of any measured exceedances around the SRN.
3. All diffusion tube sites within 20m of the SRN: represents the bounds of assessing and reporting for PCM model compliance.
4. All diffusion tube sites within 20m of the SRN and annual mean monitored NO2 concentrations >40µg/m³: A refinement on verification scenario 3 to only include those monitored sites with measured exceedances.
4.7.13. For the automatic monitoring stations two scenarios were also evaluated to
determine whether just using automatic stations would be more appropriate: 1. All Automatic Sites 2. Automatic sites within 20m of the road 3. Automatic Sites only next to Motorway and Dual Carriageways
4.7.14. The verification statistics, including the number of monitoring stations, for each of the scenarios considered are shown in Table 4.2.
4.7.15. Overall for the four scenarios assessed there are limited differences in the correlation, RMSE and fractional bias, with the exception of verification scenario 4, where the RMSE increases notably to 17.9 compared to the RMSE range of 9.6 to 12.9 for verification scenarios 1 to 3. Consequently, due to the worsening performance and smaller number of monitoring sites verification scenario 4 has been discounted.
4.7.16. As verification scenarios 1 to 3 have similar levels of statistical performance,
verification scenario 3 has been selected as it most closely matches the PCM reporting criteria (and guidance issued by JAQU to local authorities) i.e. consideration of modelled and monitored concentrations within close proximity to the road. It also has the highest verification adjustment factor (1.83) of the remaining 3 verification scenarios and therefore incorporates a degree of risk management.
4.7.17. The performance statistics for verification scenario 3 have been evaluated in greater
detail. Of the 140 diffusion tubes following the application of the verification adjustment factor, the modelled NO2 concentrations were within +/-25% at 62 of the monitoring sites and greater than +/-25% at 78 of the diffusion tubes. Ideally all sites should be within +/-25%.

Phase 2 Air Quality Report
Phase 2 Air Quality Report v2.docx Page 27 of 104
Table 4.2 Model Verification Scenarios Statistics Verification Approach Number of
monitoring sites
Verification Factor
Correlation RMSE Fractional Bias
Diffusion Tubes
Model vs Monitoring (No adjustment)
1075 N/A 0.65 10.1 0.4
Model vs Monitoring (Adjusted)
1075 1.33 0.63 9.3 0.1
Scenarios
1. All roads with flows > 10,000 AADT
778 1.30 0.57 9.6 0.1
2. All diffusion tube sites within 50m of the SRN
417 1.56 0.53 10.0 0.1
3. All diffusion tube sites within 20m of the SRN
140 1.83 0.49 12.9 0.1
4. All diffusion tube sites within 20m of the SRN and annual mean monitored NO2 concn >40µg/m³
43 2.06 0.14 17.9 0.1
Automatic Stations
Model vs Monitoring (no adjustment)
27 N/A 0.5 10.4 0.2
Model vs Monitoring (Adjusted)
27 1.71 0.51 11.8 -0.1
Scenarios
Motorway & Dual Carriageway Sites only within 20m.
17 1.51 0.49 10.7 0.0
Motorway & Urban Sites within 20m
21 1.50 0.52 10.7 -0.1
4.7.18. To develop an understanding of risk and impacts on modelled NO2 concentrations,
the performance of the 78 diffusion tubes that were above the +/-25% threshold was investigated. Re-running the verification process of just these 78 sites resulted in a verification adjustment factor 2.22. When applied to all 140 diffusion tube locations included in verification scenario 3 resulted in the following statistics, correlation 0.5; RMSE 13.7; and fractional bias 0.0. This resulted in only another 3 monitoring locations coming within +/-25%. threshold.
4.7.19. However, when the verified modelled results using adjustment factor of 2.22 were
examined in more detail at each location, the model was found have a greater propensity to over predict nearby monitoring locations. The verified modelled results based on the adjustment factor of 1.83 provided a better representation of observed annual mean NO2 concentrations in 2017.

Phase 2 Air Quality Report
Phase 2 Air Quality Report v2.docx Page 28 of 104
4.7.20. During Phase 3 assessment (Commission No. 1) the approach to model verification will be refined to look at individual verification factors for the various PCM links. Additional air quality monitoring currently undertaken by Highways England will feed into this process to provide greater resolution in relation to the verification at the individual PCM links.
4.8. Applying the Verifying Factors to the Air Quality Models 4.8.1. Whilst further work is required to improve the model verification factors across the
all SRN PCM links as part of the work for Phase 3 assessment (Commission No. 1), the verification adjustment factor of 1.83 has been applied to the modelled road NOx concentrations for all years, prior to calculating the indicative total annual mean NO2 concentrations.
4.8.2. This has produced an indicative annual mean modelled NO2 concentrations alongside 83 of the 86 SRN PCM links. 3 of the 86 SRN PCM links, which are all located in Nottingham have not been modelled. The modelled annual mean NO2 concentration taken from Nottingham’s approved air quality assessment for these 3 SRN PCM links.
4.9. Modelling Between 2015 and 2026 4.9.1. Whilst 3 yearly intervals were selected at it represent a proportionate level of
assessment for Phase 2, indicative annual mean NO2 concentrations have been interpolated for each receptor for the intervening year i.e. 2018, 2019, 2021, 2022, 2024 and 2025. To calculate the indicative concentration for the modelled concentrations in the intervening year, a simple linear regression equation has been calculated for each receptor along the SRN PCM links between the years modelled (2017, 2020, 2023 and 2026).
4.9.2. Based on the modelling undertaken as part of Phase 2 (Commission No. 1) there are 5 SRN PCM links (Table 5.2) where the air quality modelling has identified an indicative annual mean NO2 limit value in exceedance in 2026. Traffic data was not available beyond 2026 for this Phase 2 assessment. To provide an estimate of when compliance with the limit values might be achieved (without any interventions) the same linear regression used to calculate the intervening years, has been applied to each of the 83 SRN PCM links to estimate annual mean NO2 concentrations between 2026 and 2028.
4.9.3. As part of the Phase 3 assessment (Commission No. 1), the 2031 traffic model will be
used to provide additional traffic data for those SRN PCM links with indicative exceedances beyond 2026.

Phase 2 Air Quality Report
Phase 2 Air Quality Report v2.docx Page 29 of 104
5. Results
5.1.1. Table 5.1 shows the indicated modelled annual mean NO2 concentrations for the 86 SRN PCM links and dates when compliance is anticipated to be achieved. Table 5.1 Indicative Annual Mean NO2 Concentrations (µg/m³) Census ID
Indicative Annual Mean NO2 Concentrations (µg/m³)
2018 2019 2020 2021 2022 2023 2024 2025 2026 2027 2028
47892 63 60 58 54 50 46 43 40 38 35 32
28772 46 44 41 39 36 33 32 30 28 26 24
38230 31 30 28 27 25 23 22 21 20 19 18
80427 49 47 45 42 40 38 36 35 33 31 29
99631 48 45 43 41 38 36 34 32 30 28 27
47243 35 33 31 29 27 25 24 22 21 20 18
99333 31 29 27 25 24 22 21 20 18 17 16
28776 62 59 56 53 50 47 44 42 39 37 34
75259 33 31 28 26 24 22 21 19 18 16 15
57783 38 36 34 32 30 28 27 25 24 23 21
28018 40 38 36 33 31 29 27 25 24 22 21
27711 50 46 42 39 37 34 32 30 29 27 25
99614 47 44 42 40 37 35 33 31 30 28 26
77436 80 75 70 65 60 55 52 48 45 42 38
8340 44 42 40 38 35 33 31 30 28 26 25
6046 43 41 38 35 33 31 29 28 26 25 23
99335 39 37 34 32 30 28 26 25 23 22 20
73773 42 40 37 35 33 30 29 27 26 24 23
28361 62 58 55 51 47 44 41 39 37 34 32
80428 37 35 34 32 30 28 27 26 25 23 22
48331 68 63 59 56 52 48 45 43 40 38 35
75422 36 34 32 30 28 26 24 23 22 20 19
17304 35 34 32 See table note 2
77419 26 24 23 22 21 19 19 18 17 16 15
56009 36 34 33 31 29 27 26 25 24 22 21
26012 46 44 41 39 36 34 32 31 29 27 25
17736 61 58 54 51 47 44 41 38 36 33 31
27932 66 62 58 57 55 54 51 48 45 42 39
74590 40 38 35 33 31 29 27 26 24 23 22
81388 38 36 34 33 31 29 28 27 25 24 23
46015 67 63 60 56 53 50 47 45 43 41 38
73920 47 44 41 39 37 34 32 31 29 27 26
73424 45 42 40 38 36 33 32 31 29 28 26
99329 42 39 37 35 33 31 29 27 26 24 23
74768 44 42 39 37 35 33 31 29 27 26 24
56063 40 38 37 35 33 31 30 28 27 26 24
73998 27 25 24 22 21 20 19 18 17 16 15
8147 36 34 32 30 28 26 25 24 22 21 20
26051 33 31 29 27 26 24 23 21 20 19 18
77007 43 41 38 36 34 32 30 29 27 26 24
36045 42 40 37 35 32 30 28 27 25 23 22
48707 31 29 28 26 24 23 22 21 19 18 17
56033 46 44 41 39 36 34 32 31 29 27 25
77006 41 39 36 34 32 30 29 27 26 24 23
57832 42 40 37 35 33 31 30 28 27 25 24

Phase 2 Air Quality Report
Phase 2 Air Quality Report v2.docx Page 30 of 104
Census ID
Indicative Annual Mean NO2 Concentrations (µg/m³)
2018 2019 2020 2021 2022 2023 2024 2025 2026 2027 2028
75290 31 28 26 23 20 18 16 15 14 13 12
81178 40 38 37 34 32 30 29 27 26 24 23
28015 41 39 37 35 33 31 29 28 27 25 24
81008 45 42 40 38 36 34 32 31 29 28 26
37416 34 32 30 See table note 2
18061 28 26 25 24 22 21 20 19 18 17 16
70271 49 47 44 42 39 37 35 33 31 29 27
26017 48 46 43 41 38 36 34 32 31 29 27
36296 25 24 23 22 20 19 18 17 17 16 15
70206 50 48 45 43 40 37 35 34 32 30 28
17961 33 32 30 28 26 25 23 22 21 19 18
99332 31 30 28 26 25 23 22 21 19 18 17
81374 36 34 32 31 29 27 26 24 23 22 20
99331 28 27 25 24 22 21 20 19 18 17 16
36007 48 46 45 43 41 39 37 36 35 33 32
73318 42 40 37 35 33 31 29 28 27 25 24
16050 48 45 43 40 37 35 33 31 29 27 25
36063 43 41 39 37 35 33 31 30 28 27 26
77484 21 19 18 17 16 15 14 13 12 12 11
56007 54 51 49 46 43 41 39 37 35 33 31
99337 43 40 37 35 32 30 28 26 25 23 21
56058 24 23 22 20 19 18 17 17 16 15 14
70007 30 29 27 26 24 23 22 20 19 18 17
6013 48 45 43 41 38 36 35 33 32 30 29
57767 74 69 65 61 57 53 50 47 44 41 38
47964 21 20 19 18 17 16 16 15 14 14 13
16237 27 26 25 23 22 21 20 19 18 17 16
81007 41 39 37 34 32 30 28 27 25 23 22
46062 26 25 23 22 21 19 18 17 16 16 15
56557 34 32 29 See table note 2
28445 30 28 26 25 24 22 21 20 19 18 17
75235 35 33 31 30 28 26 24 23 21 20 18
8348 39 37 35 33 31 30 28 27 26 24 23
75258 33 31 28 26 24 22 21 19 18 16 15
74456 32 30 28 27 25 23 22 21 20 19 18
81006 37 34 32 30 28 26 25 23 22 20 19
56062 28 27 25 24 23 22 21 20 19 18 18
70230 50 48 45 42 39 37 35 33 31 30 28
26064 33 32 30 28 27 25 24 23 22 20 19
80846 62 59 55 51 48 45 42 40 38 36 33
28076 43 41 39 36 34 32 30 28 27 25 24
Notes: 1. Concentrations in bold are greater than the annual mean NO2 limit value 2. Concentrations taken from JAQU approved Nottingham’s air quality reports. Concentrations for 2019 interpolated by Highways England based on the reported annual mean NO2 concentrations for 2018 and 2020.
5.1.2. Table 5.1 has then been summarised in Table 5.2 to present the number of SRN PCM
links with indicative modelled limit values exceedances for each year.

Phase 2 Air Quality Report
Phase 2 Air Quality Report v2.docx Page 31 of 104
Table 5.2 Number of PCM Links with Indicative Modelled Annual Mean NO2 Limit Value Exceedances
Year 2018 2019 2020 2021 2022 2023 2024 2025 2026 2027 2028
Number of PCM links 45 35 27 19 13 11 10 8 5 4 0
5.1.3. As shown in Table 5.2 just over half of the 86 SRN PCM Links have been modelled as
having an exceedance of the annual mean NO2 limit value at the nearest qualifying feature to a PCM link in 2018. The number of links in exceedance continues to decrease over time. This is brought about by the yearly increase in the number of Euro 6/VI vehicles in the national vehicle fleet contained with EFT.
5.1.4. There are 41 of the 86 SRN PCM links that have been modelled to be below the limit values in 2018 and these have been considered in further detail. This is to confirm whether there is clear evidence to support the indicative modelled NO2 concentrations (including the local monitoring data) and support their recommendation not to be progressed through to Phase 3 (Commission No. 1). Table 5.3 summarises the outcome of this review. Table 5.3 Evaluation of 41 SRN PCM Links Modelled to be below the Annual Mean NO2 Limit Value
No of SRN PCM Links
Explanation
3 The approved final air quality report by Nottingham City Council has modelled annual mean NO2 concentrations below 40µg/m³ at 3 of the 86 SRN PCM links.
38 The indicative air quality modelling suggests that there is no exceedance of the annual mean NO2 limit value for 38 of the SRN PCM links. Local air quality monitoring was available to support these findings at 7 of the 38 SRN PCM links. However, the results of this modelling can only be considered indicative, as they are based on indicative traffic data. It is therefore recommended that these 38 links, along with the 45 links modelled to exceed, are taken through to Phase 3 (Commission No. 1) when a more detailed assessment will be carried out. Further work will include acquiring more detailed traffic data as well as further development of model validation.
5.1.5. Based on this review, 3 of the 86 SRN PCM links are recommended to stop at Phase
2 (Commission No. 1), with the remaining 38 requiring additional investigation as part of the Phase 3 assessment (Commission No. 1) to confirm the outcomes of the indicative air quality modelling and to determine whether mitigation is required or not. Mitigation measures have been considered for these 38 SRN PCM links on an interim basis until further information is available to confirm whether they remain below the annual mean NO2 limit value.

Phase 2 Air Quality Report
Phase 2 Air Quality Report v2.docx Page 32 of 104
6. Mitigation
6.1. Electric Vans 6.1.1. Highways England has undertaken research exploring the challenges and
opportunities to using electric vans on the SRN. The project worked with a small number of companies to trial a number of vans over a 9 month period, to determine whether this would be a viable proposition. In parallel, work was undertaken to understand the number of electric vans that could be available in the UK to support such a scheme over the next 2 to 5 years and the mechanism for promoting their uptake.
6.1.2. The conclusion of this work is that it would be possible to promote around 250 electric vans in any one location through the creation of a specialist van centre, operating a try-before-you-buy policy. The research identified that the maximum number of vans that could be brought forward in any one year in the UK would be approximately a 1,000 electric vans, which limits the number of specialist van centres that could be created.
6.1.3. The latest version of the emissions factor toolkit v8 (EFT) (see Section 5.1.3) was set up using ‘Detailed Option 3’, with 250 vehicles entered for motorway category and LGV [vans] set to 100%. All other vehicle categories were set to 0%. Three speeds of 50mph (80kph), 60mph (96kph) and 70mph (112kph), corresponding to speed limits on single, dual and motorways respectively were calculated using EFT. EFT was set to 2020 which represented the earliest year that the maximum of 250 electric vans could be achieved. The age of the van fleet and distribution of Euro 1 to 6 vans in 2020 is based on the underpinning distribution in EFT.
6.1.4. The emissions for the 3 speeds in g/km/s were entered converted to a road NOx concentration at a distance 4m from the kerbside / edge of the running lane using the Design Manual for Roads & Bridges (DMRB) air quality spreadsheet model. A proxy road NO2 concentration was calculated assuming half of NOx is NO2. Table 6.1 presents the calculated NOx emissions, NOx and NO2 concentration for the 3 speeds. Table 6.1 NOx Emissions and NOx and NO2 Concentrations for 250 Vans
Speed (mph) NOx emissions (g/km/s)
Road NOx Concentration
(µg/m³)
Road NO2 Concentration
(µg/m³)
50 0.00222 0.2 0.1
60 0.00278 0.3 0.2
70 0.00390 0.4 0.2

Phase 2 Air Quality Report
Phase 2 Air Quality Report v2.docx Page 33 of 104
6.1.5. It is assumed that the maximum change in NO2 would correspond to the removal of the equivalent 250 van presented in Table 6.1 corresponding to the speed of the road. For example, for a motorway with a speed of 70mph, the maximum reduction in NO2 would be 0.2µg/m³. This would assume that all the vans use the same road which in reality is likely to be the case as their usage would be spread over a large area. The reductions therefore represent a very optimistic view of improvements.
6.2. Traffic Management 6.2.1. Table 6.2 lists the traffic management options evaluated by the review panel and
the number of SRN PCM links captured by each option. The use of speed limits was not considered in this suite of measures as it is being considered as its own specific range of measures (see Section 6.3). Table 6.2 Summary of Traffic Measures
Proposed Traffic Management Measure Number of SRN PCM Links
Diversions e.g. for HGVs 9
Changing signal timings / moving traffic lights 19
Junction alterations / changes to road alignments 18
Speak to local area teams at Phase 3 23
No viable option identified 40
6.2.2. Where a proposed traffic management measure was identified this has been
recorded in the corresponding Audit Report for the SRN PCM link. At this time the work for the Phase 2 assessment (Commission No. 1) has been qualitative and it is not possible to determine whether any proposed measure is deliverable or would achieve limit value compliance in a shorter timescale than currently reported. It is also not known whether any of the proposed traffic management measures would affect traffic flows on adjoining roads and consequent air quality impacts.
6.2.3. Further work would be required to enable a quantitative assessment including traffic and air quality modelling and this would be undertaken as part of the Phase 3 assessment (Commission No. 1) on a link-by-link basis.
6.2.4. Appendix D2 provides an example of a possible traffic management measure and completed proforma for information.
6.3. Speed Management 6.3.1. As part of the research looking at the effects the driving behaviours on vehicle
emissions, it also investigated vehicle emissions with the introduction of a 70mph, 60mph and 50mph speed limits. The 70mph speed limit was considered as reported Department for Transport (DfT) statistics indicate that around 50% of cars and vans drive faster than 70mph on the motorway with 10% of drivers travelling faster than 80mph.

Phase 2 Air Quality Report
Phase 2 Air Quality Report v2.docx Page 34 of 104
6.3.2. In summary the research concluded that for a speed limit of:
• 70mph: There would be a 6% reduction in NOx emissions when compared to the normal unconstrained motorway driving where 50% of cars and vans travel faster than 70mph.
• 60mph: Only diesel cars showed a marked reduction in emissions of around 20%, diesel vans had no appreciable reductions in NOx emissions. No change in HDV emissions.
• 50mph: Only diesel vans showed a marked reduction in emissions of around 20%, diesel cars had no appreciable reductions in NOx emissions. No change in HDV emissions.
6.3.3. To support this Phase 2 assessment a specific set of NOx emission factors were
created to represent an average speed most commonly attributable to an AADT flow profile. Informed by the speed emissions research, the NOx emission factor for LDVs and HDVs was calculated based on the average of the NOx emissions for speeds between 50mph (80kph) and 85mph (136kph) from EFT.
6.3.4. The Phase 2 assessment (Commission No. 1) was based on AADT traffic data, and to support this work interim NOx emissions LDVs for 60mph and 50mph speeds were calculated based on a difference between the AADT NOx emission rate and two speed limits. The calculations showed that at 60mph speed limits car emissions were approximately 20% lower than the AADT NOx emissions, but no change in van emissions. For a 50mph speed limit, the calculations showed no change in car emissions, but an approximate 20% reduction in van emissions compared to the AADT NOx emission rate.
6.3.5. The use of AADT traffic data for this Phase 2 assessment meant that it was not possible to identify those SRN PCM links nor time of the day when observed speeds were higher than the national speed limit. Consequently, the use of 70mph speed limit has not been evaluated as a possible mitigation measure in Phase 2 (Commission No. 1). Section 6.8 presents an example of possible changes in road NO2 concentrations and further work as part of Phase 3 assessment (Commission No. 1) will look in greater detail at the speeds for different lanes and times of the day along relevant sections of the SRN.
6.3.6. As part of the Phase 3 assessment (Commission No. 1) the use of more detailed
traffic data split by period of the day would allow for an improved analysis of changes in speed compared to speed limit, allowing for different driving characteristics e.g. congestion or high speed.
6.4. Identification of Qualifying SRN PCM Links 6.4.1. Existing average speeds were identified for all 101 SRN PCM links as part of the
development of the baseline information for the Phase 1 assessment (Commission No. 1). The mitigation section of the Audit Reports identified the speed limit along each section of the SRN PCM link. For those SRN PCM links with speed limits of 50mph or lower, it was concluded that introducing of a speed limit would not be possible.

Phase 2 Air Quality Report
Phase 2 Air Quality Report v2.docx Page 35 of 104
6.4.2. 43 of the 86 SRN PCM links (Table 6.3) were identified at the completion of the
Phase 1 assessment (Commission No. 1) as having the potential for either a 60mph and / or 50mph speed limit as they currently have a speed limit greater than 50mph and the observed traffic speeds are greater than 50mph. These were reviewed during this Phase 2 assessment prior to air quality modelling. The subsequent review confirmed that 41 SRN PCM links had a potential for either a 60 or 50mph speed limit.

Phase 2 Air Quality Report
Phase 2 Air Quality Report v2.docx Page 36 of 104
Table 6.3 PCM Link and Potential 60mph and 50mph Speed Limits
Census ID 60mph Speed Limit 50mph Speed Limit 28772 99631 47243 75259 28018 99614 6046
77419 26012 74590 46015 73920 73424 73998 26051 77007 36045 48707 56033 77006 28015 81008 18061 26017 36296 81374 36007 16050 36063 56007 56058 6013
47964 16237 81007 46062 28445 75258 74456 56062 70230

Phase 2 Air Quality Report
Phase 2 Air Quality Report v2.docx Page 37 of 104
6.5. Building and Running Speed Limits in the RTMs 6.5.1. 60mph and 50mph speed limits were coded into the RTM for 2026 covering the
relevant sections of network for the 41 SRN PCM links. The following rules were applied to build the traffic models:
• Where the SRN PCM link was wholly along a section of the network between two junctions, then the speed limit was applied to the whole length of the network between those junctions in both directions.
• Where the SRN PCM link cross a junction then the speed limit was applied to the sections of the motorway up to the next junctions either side in both directions. For example, if the PCM link crossed M4 junction 32 then the speed limit was applied between M4 junction 31 to 33.
6.5.2. 41 SRN PCM links (Table 6.3) are identified as having the potential for either a
60mph and / or 50mph speed limit as they currently have a speed limit greater than 50mph and the observed traffic speeds are greater than 50mph.
6.5.3. Data was extracted from the RTMs for the PCM links and the surrounding network for use in the Air Quality modelling. As the RTMs are only available for 2026, equivalent traffic data has been calculated for the intervening years between 2019 and 2025 for the 41 SRN PCM links based on outputs from the RTM for 60mph and 50mph speed limits.
6.6. Evaluate the Changes in Traffic due to the Speed Limits 6.6.1. Analysis of the traffic outputs from the RTMs concluded that for the:
• 60mph Speed Limit: There was no discernible changes in the modelled traffic flow or numbers of HDVs on the SRN. Therefore, the outputs of the traffic modelling from the RTMs for the Phase 2 assessment (Commission No. 1) can be used in the air quality modelling with no changes in traffic flows or number of HDVs.
• 50mph Speed Limit: Although the details of the results varied between sites, depending on the local network and existing congestion levels, in many cases the 50mph limit did reduce speeds and flows on the PCM link. Flows on surrounding roads also altered as traffic was modelled to divert.
6.7. Air Quality Modelling of 60mph and 50mph Speed Limits 6.7.1. Table 6.4 presents the outcomes of the air quality modelling for 60mph and 50mph
speed limits. 2020 was selected as the earliest whole year that a speed limit could be introduced onto the SRN.

Phase 2 Air Quality Report
Phase 2 Air Quality Report v2.docx Page 38 of 104
Table 6.4 Modelled NO2 Concentrations for Speed Limit Intervention in 2020
Indicative Annual Mean NO2 Concentrations (µg/m³)
Census ID RTM Outputs with No Speed Limit
60mph Speed Limit 50mph Speed Limit
28772 41 39
99631 43 41
47243 31 30
75259 28 26 27
28018 36 35
99614 42 40
6046 38 37
77419 23 22
26012 41 40
74590 35 33 34
46015 60 57 58
73920 41 39 40
73424 40 38
73998 24 22 23
26051 29 28 28
77007 38 36 37
36045 37 36
48707 28 27
56033 41 40
77006 36 35
28015 37 36
81008 40 38
18061 25 24
26017 43 42
36296 23 22
81374 32 30 31
36007 45 43
16050 43 41
36063 39 37
56007 49 47
56058 22 21
6013 43 42
47964 19 18 18
16237 25 23 24
81007 37 34
46062 23 22 22
28445 26 25
75258 28 26 27
74456 28 27
56062 25 24
70230 45 43

Phase 2 Air Quality Report
Phase 2 Air Quality Report v2.docx Page 39 of 104
6.7.2. As shown Table 6.4 the introduction of either a 60mph or 50mph speed limits results on average about a 1µg/m³ reduction when compared to current operating conditions on the SRN. There are a few instances where there are larger reductions in NO2 concentrations (2 to 3µg/m³) and this is more often associated with the introduction of the a 60mph speed limits compared to a 50mph speed limit which has a smaller reduction. The reason for this is, for a 60mph speed limit there are more cars on the road than vans, and therefore there is a greater number of vehicles that could be affected with the net effect of overall lower emissions.
6.7.3. In those instances where a 60mph or 50mph speed limit is potentially available the 60mph speed limit has been recommended in the Audit Report in preference to the 50mph speed limit.
6.8. Potential Impacts of a 70mph Speed Limit 6.8.1. Whilst a 70mph speed limit has not been evaluated as AADT traffic data has been
used an example of the potential levels of change in road NOx and NO2 concentrations at 4m from the edge of the road for an average motorway have been calculated. Based on the outcomes of the research car and van are estimated to 6% lower NOx emissions with a 70mph speed limit compared to NOx emissions for the normal unconstrained motorway driving conditions.
6.8.2. Two scenarios are presented in Table 6.5 both of which assume no changes in traffic
flows or number of HDVs. The scenario assessed are: 1. The speed on the motorway is set to High Speed i.e. 50% of cars and vans
travelling faster than 70mph, 24 hours a day. 2. The speed on the motorway has been split to represent High Speed for 18
hours a day and light congestion for 6 hours coinciding with the morning and evening peak periods.
Table 6.5 Example of Enforced National Speed Limit Modelled Pollutant Concentrations versus Current Driving Conditions
Scenario
Traffic Characteristics Road NOx Concn (µg/m³)
Road NO2 Concn (µg/m³)
No speed limit
70mph speed limit
No speed limit
70mph speed limit Change
AADT %HDV Speed (kph)
1 140,000 10 High Speed (24hrs)
71.2 67.3 35.6 33.7 1.9
2 140,000 10 High speed (18hrs) & light
Congestion (6hrs)
63.3 60.9 31.7 30.5 1.2
Note: A proxy road NO2 concentration assuming half of NOx is NO2.
6.8.3. As shown in Table 6.5 enforcing the 70mph speed limit has the potential to lower
road side NO2 concentration by approximately 2µg/m³. However, this assumes that motorway has high speed driving conditions all day.

Phase 2 Air Quality Report
Phase 2 Air Quality Report v2.docx Page 40 of 104
6.8.4. Making allowance for different driving conditions over the course of the day
(Scenario 2 in Table 6.5) leads to nearer a 1µg/m³ change. This is because on average 40% of traffic movements occur in the morning and evening peaks and during these times of day are less likely to exhibit high speed driving characteristics i.e. speeds greater than 70mph. This means that only 60% of the total traffic flows would have the potential to be affected by enforcement of a 70mph speed limit.
6.9. Bus Retrofit 6.9.1. The number of buses and coaches using the motorway network is very small
compared to the total number of vehicles travelling on the motorway on a daily basis. As agreed with JAQU only trunk roads have been considered for potential bus retrofit.
6.9.2. A retrofit scheme assumes taking a non-Euro VI bus and adding an additional unit into the exhaust system, which in turn leads to a reduction in NOx emissions.
6.9.3. The latest version of EFT was set up using ‘Detailed Option 1’, with 1000 vehicles
entered for urban road category and buses and coaches set to 100%. All other vehicle categories were set to 0%. Three speeds of 40mph (64kph) 50mph (80kph), and 60mph (96kph), corresponding to speeds observed on urban trunks and reflecting the maximum speed limit for buses were calculated using EFT. EFT was set to 2020 which represented a notional year that a bus retrofit scheme could be introduced for the Phase 2 assessment (Commission No. 1). The age of the bus and coach fleet and distribution of Euro I to IV buses and coaches in 2020 is based upon the underpinning distribution in EFT.
6.9.4. 1,000 vehicles were entered in to EFT to overcome rounding errors associated with the number of decimal places for just one vehicle and not because it is representative of a 1,000 bus journeys on individual SRN PCM links.
6.9.5. To calculate the equivalent retrofit emissions, the ‘User Euro’ feature of EFT was
selected, and the euro split for the bus fleet in EFT for 2020, set to the equivalent distribution for retrofit in EFT (Table 6.6).
6.9.6. The difference in NOx emissions between the default bus composition in EFT and
retrofit profile was calculated for the three speeds.

Phase 2 Air Quality Report
Phase 2 Air Quality Report v2.docx Page 41 of 104
Table 6.6 Bus and Coach Euro Standard Proportions from EFT and Equivalent Retrofit Proportions in 2020
Buses / Coaches Default Euro Proportions
2020 - England (not London)
Retrofit Profile (2020)
1Pre-Euro I -
2Euro I -
3Euro II 0.01
4Euro III 0.06
5Euro IV 0.05
6Euro V_EGR 0.05
7Euro V_SCR 0.16 0.16
8Euro VI 0.66 0.66
9Euro II SCRRF - 0.01
10Euro III SCRRF - 0.06
11Euro IV SCRRF - 0.05
12Euro V EGR + SCRRF - 0.05
6.9.7. The emissions for the 3 speeds in g/km/s were converted to a road NOx
concentration at a distance 4m from the kerbside / edge of the running lane using the Design Manual for Roads and Bridges (DMRB) air quality spreadsheet model (v6). A proxy road NO2 concentration was calculated assuming half of NOx is NO2. Table 6.7 presents the calculated NOx emissions, and NOx and NO2 concentration for the 3 speeds in 2020, for the default EFT fleet profiles and ‘With retrofit option’. Table 6.7 NOx Emissions and NOx and NO2 Concentrations for 1,000 buses
Speed (mph)
NOx emissions (g/km/s)
Road NOx Concentration
(µg/m³)
Road NO2 Concentration
(µg/m³)
Road NO2 Concentration
(µg/m³) per bus
EFT Fleet Profile
40 0.014382 3.7 1.9 0.0019
50 0.012213 3.2 1.6 0.0016
60 0.011448 3.0 1.5 0.0015
With Retrofit Profile
40 0.010220 3.4 1.6 0.0017
50 0.00849 2.8 1.4 0.0014
60 0.00789 2.6 1.3 0.0013
6.9.8. The road NO2 concentrations per bus presented for the ‘EFT fleet profile’ and ‘With
retrofit’ in Table 6.7 are used to calculate the potential changes in NO2 concentrations improvement for individual SRN PCM links with identified bus flows. In 2020 the fleet composition data in EFT indicates that 65% of buses would already be Euro VI. This means that only 35% of the bus fleet on an individual link would be eligible for retrofit.

Phase 2 Air Quality Report
Phase 2 Air Quality Report v2.docx Page 42 of 104
6.9.9. For example, if a SRN PCM link with a speed of 40mph has a total daily bus flow of 200 buses, then 130 of them (65% of 200) would already be Euro VI. 70 would be non-Euro 6 and eligible for a retrofit option. To calculate the changes in bus NO2 concentrations brought about with the retrofit option the 200 buses are multiplied by both the EFT Fleet Profile (200 x 0.0019µg/m³ = 0.38µg/m³) and With Retrofit value (200 x 0.0017µg/m³ = 0.34µg/m³).
6.9.10. The change in NO2 concentrations associated with the bus retrofit option =
0.38µg/m³ - 0.34µg/m³, which equates to a reduction in NO2 concentrations of 0.04µg/m³.
6.9.11. The approach exemplified in 6.9.9 has been applied to each of the trunk road SRN
PCM links with identified bus movements.
6.10. HGV Retrofit 6.10.1. Heavy Goods Vehicles (HGVs), which encompasses rigid and articulated lorries, make
up around 5% to 20% of the total flow on the SRN, depending on the type of road and location on the SRN.
6.10.2. JAQU have asked Highways England to consider the potential changes in NO2 concentration associated with the introduction of a retrofit scheme for HGVs. A retrofit scheme assumes taking a non-Euro VI HGV and adding a unit into the exhaust system, leading to a reduction in NOx emissions. It is assumed that for the purposes of the Phase 1 assessment (Commission No. 1) that the introduction of a retrofit system would result in the equivalent of a Euro VI HGV emission.
6.10.3. Currently there is no accredited retrofit system for HGVs nor is there an approved
Government scheme for their roll out in the UK. Consequently, this section of the methodology and the outcomes that inform the audit reports are hypothetical.
6.10.4. The latest version of the Emissions Factor Toolkit v8 (EFT) was set up using ‘Detailed
Option 1’, with 10,000 vehicles entered for motorway road category and HGVs set to 100%. All other vehicle categories were set to 0%. 10,000 represents the approximate number of HGVs on an average motorway.
6.10.5. Three speeds of 40mph (64kph), 50mph (80kph), and 60mph (96kph), corresponding
to speeds observed on trunk roads and motorways and reflecting the maximum speed limit for HGVs were calculated using EFT. EFT was set to 2020 which represented a notional year that a theoretical HGV retrofit scheme could be introduced for the purposes of the Phase 1 assessment (Commission No. 1). The age of the HGV fleet and distribution of Euro 1 to 6 HGVs in 2020 is based on the underpinning distribution in EFT.
6.10.6. To calculate the equivalent Euro VI emissions, the ‘User Euro’ feature of EFT was selected, and the euro split set to 1 for rigid and articulated Euro VI HGVs i.e. all vehicles to have Euro VI emissions.

Phase 2 Air Quality Report
Phase 2 Air Quality Report v2.docx Page 43 of 104
6.10.7. The difference in NOx emissions between the default HGV composition in EFT and all HGVs assumed to have Euro VI emissions brought about by the theoretical retrofit scheme was calculated for the three speeds.
6.10.8. The emissions for the 3 speeds in g/km/s were converted to a road NOx concentration at a distance 4m from the kerbside / edge of the running lane using the Design Manual for Roads & Bridges (DMRB) air quality spreadsheet model (v6). A proxy road NO2 concentration was calculated assuming half of NOx is NO2. Table 6.8 presents the calculated NOx emissions, NOx and NO2 concentration for the 3 speeds in 2020 based on the default EFT fleet profiles and ‘With theoretical retrofit system’. Table 6.8 NOx Emissions and NOx and NO2 Concentrations for 10,000 HGVs
Speed (mph)
NOx emissions (g/km/s)
Road NOx Concentration
(µg/m³)
Road NO2 Concentration
(µg/m³)
Road NO2 Concentration
(µg/m³) per HGV
EFT Fleet Profile
40 0.062622 6.1 3.0 0.00030
50 0.047729 4.6 2.3 0.00023
60 0.044204 4.3 2.1 0.00021
With Theoretical Retrofit System
40 0.020148 2.0 1.0 0.00010
50 0.013992 1.4 0.7 0.00007
60 0.012531 1.2 0.6 0.00006
6.10.9. The road NO2 concentrations per HGV presented for the 'EFT fleet profile' and 'With
theoretical retrofit system' in Table 6.8 are used to calculate the potential changes in NO2 concentrations improvement for all SRN PCM links.
6.10.10. In 2020 the default fleet composition data in EFT indicates that 30% of HGVs are classed as rigid and 70% are classified as articulated HGVs. These are further split into Euro VI and non-Euro VI, with 77% of rigid HGVs already Euro VI in 2020 and 90% of articulated HGVs. This means that only 23% of rigid HGVs and 10% of articulated HGVs on an individual link would be eligible for retrofit.
6.10.11. For example, if a SRN PCM link, with an average speed of 50mph has a total daily
flow of 10,000 HGVs, then 3,000 would be rigid and 7,000 articulated. Of the rigid HGVs, 2310 of them (3,000 x 0.77) would already be Euro VI and for the articulated HGVs 6,300 of them (7,000 x 0.90) would be Euro VI. This leaves 1,390 HGVs (690 rigid + 700 articulated) would be non-Euro 6 and eligible for a theoretical retrofit system option.

Phase 2 Air Quality Report
Phase 2 Air Quality Report v2.docx Page 44 of 104
6.10.12. To calculate the changes in HGV NO2 concentrations brought about the retrofit option the 10,000 HGVs are multiplied by both the EFT Fleet Profile (10,0000 x 0.00023µg/m³ = 2.3µg/m³) and ‘With Theoretical Retrofit system’ value (10,000 x 0.00007µg/m³ = 0.7µg/m³). The change in NO2 concentrations associated with the retrofit option = 2.3µg/m³ - 0.7µg/m³, which would equate to a reduction in NO2 concentrations of 1.6µg/m³.
6.10.13. The approach exemplified in 6.10.11- 6.10.12 has been applied to the 83 SRN
PCM links.
6.11. 9.5m High Barriers 6.11.1. Highways England has undertaken NO2 monitoring behind a 9.5m high barrier with
an 11m cantilever, alongside the A16 in Dordrecht, the Netherlands.
6.11.2. A number of monitoring transects using NO2 diffusion tubes were installed alongside the A16. Two control transects which were located in areas not affected by the barrier and three transects were installed directly behind the barrier. The purpose of the monitoring was to determine whether there was any measurable difference in NO2 concentrations behind the barrier when compared to the control transects for the same traffic flow and speed along the A16.
6.11.3. Based on the monitored evidence, Highways England has developed the following emerging advice on mitigation for NO2 concentrations behind this type of barrier:
• A maximum of 5µg/m³ reduction in annual mean NO2 concentrations within the first 50m back from the barrier
• A maximum of 2µg/m³ reduction in annual mean NO2 concentrations between 50m and 200m back from the barrier
6.11.4. Where a site has been identified along a SRN PCM link with the potential to build a
9.5m high cantilever barrier than a maximum of 5µg/m³ has been subtracted from the annual mean NO2 concentration from the PCM model.
6.11.5. A review of all 86 SRN PCM links has identified the following five locations where it may be possible to build a barrier to deliver compliance in a shorter timescale. The locations are:
• A3 Guildford (PCM Link 17736)
• M4 Heston (PCM Link 26012)
• M4 Harlington (PCM Link 18487)
• M602 Eccles (PCM Link 16050)
• A1 Gateshead (PCM Link 80427)
6.11.6. Highways England has commissioned barrier feasibility studies for these locations. The purpose of the feasibility studies is to establish whether it is possible to build a barrier in these locations, taking into account such factors as ground conditions, location of any services, the visual impacts of such a structure and the local context.

Phase 2 Air Quality Report
Phase 2 Air Quality Report v2.docx Page 45 of 104
6.12. Barrier Feasibility Studies 6.12.1. The emerging findings from the feasibility study indicates that a barrier may be
feasible alongside the A3 and M4 (Harlington). Although in the case of the A3 there would need to be extensive diversions of services (fibre optic cables) and may require extensive disruption to traffic on the A3 during construction.
6.12.2. We are still awaiting the feasibility study report for the M4 Heston, but emerging evidence is that a barrier may be feasible in this location, although this will be confirmed on receipt of the final report.
6.12.3. The feasibility study for the A1 in Gateshead (PCM Link 80427) has identified that it
is not possible to build an air quality barrier alongside this PCM link. For the M602 further work is being undertaken to explore whether it would be possible to construct a 9m high barrier on top of the existing 7m retaining wall. Alternatively, whether measures to close the existing public access closest to the M602 could be delivered instead to achieve the same outcome of supporting compliance in the shortest timescales possible.
6.13. Other Local Measures 6.13.1. Each of the remaining 83 SRN PCM links has been reviewed to see if there are
additional location specific measures that could be delivered to help support compliance in the shortest timescales possible. Options explored are:
• Purchase property
• Footpaths – move / divert / close & alternative route available
• Low friction road surfaces
• Mechanical filtration / ventilation
6.13.2. Depending on the type of local measures identified, there may be a need to undertake additional assessments, e.g. landscape and visual impacts, prior to determining whether the measures could be progressed.
6.14. Property Purchase 6.14.1. Current legal advice obtain by Highways England, suggests that based on current
legislation Highways England does not have any powers to purchase properties either through Compulsory Purchase Agreement or Voluntary Purchase Agreement for the purposes of seeking limit value compliance. This is different to obtaining properties to support the delivery of schemes where Highways England would seek the ultimate approval from the Sectary of State (SoS) transport following a planning inquiry and recommendation from a planning inspector.
6.14.2. Highways England understands that we would need to be directed by the SoS Transport to consider this option further and consequently have not considered the removal of properties as a mitigation measure at this time.

Phase 2 Air Quality Report
Phase 2 Air Quality Report v2.docx Page 46 of 104
6.15. Footpaths (including moving, diversion, closure, and signing alternative routes) 6.15.1. Legally Highways England can temporarily close or divert public access within our
land holding and where there are alternative routes or can be moved to be more than 15m away from the SRN.
6.15.2. Where the public access is in the ownership of others e.g. the local authority, they would be the determining authority. Highways England would need to engage with the determining authority as part of the Phase 3 assessment (Commission No. 1) to understand whether they would be amenable to closing / diverting the public access, subject to their own legal considerations.
6.16. Low Friction Road Surface 6.16.1. The Danish roads authority have been exploring the use of low friction road
surfaces. Highways England are looking to set up trials of this type of surface on the SRN and evaluate the impact on the change in vehicle emissions compared to standard hit rolled ash felt.
6.16.2. At this time there is no empirical evidence on the effects on NOx emissions and is not being assessed as a measure at this time.
6.17. Mechanical Filtration 6.17.1. Recent studies in London have shown the potential benefits of mechanical filtration
at lowering levels of indoor NO2.
6.17.2. Highways England are exploring the potential for portable units to be installed in properties to help support reductions in indoor air quality. Whilst it is recognised that this option may not help attain legal compliance in shorter timescale, if there are no alternative mitigation measures that can be brought forward, we will look at whether the use of portable mechanical filtration could be a means to improve indoor air quality.
6.17.3. Further work is being progressed to determine types of units available and to draft up a possible delivery mechanism for such a measure if it was to be progressed. The Phase 3 assessment (Commission No. 1) will be informed by the on the outcome of this study.

Phase 2 Air Quality Report
Phase 2 Air Quality Report v2.docx Page 47 of 104
7. Air Quality Audit Report
7.1. Introduction 7.1.1. The audit reports for the 86 SRN PCM links have been updated for the Phase 2
assessment (Commission No. 1).
7.1.2. The Audit Report summarises the information from the baseline maps, providing the local context, availability of traffic and air quality monitoring data etc. Then, based on the JAQU criteria (i.e. qualifying features within 15m of the PCM Link, which includes public access or sensitive receptor e.g. residential property), recommends whether further consideration of the PCM link is necessary.
7.1.3. The Phase 1 audit reports (Commission No. 1) have been updated for this Phase 2
assessment with the outcomes of the indicative modelled annual mean NO2 concentrations, annualised 2017 monitoring data and / or indicative monitoring data for 2018. This has been used to update the recommendations as to whether the SRN PCM link should stop at Phase 2 i.e. no exceedance of the limit value for NO2, or needs to evaluate whether mitigation measures would help support achieving compliance in the shortest timescales possible.
7.2. Summary of Baseline Maps 7.2.1. The Phase 1 baseline maps (Commission No. 1) have been updated with the
following information for Phase 2:
• Indicative modelled annual mean NO2 concentrations
• 2017 annualised monitoring data
• 2018 indicative monitoring data
• Road traffic flows and %HDVs from the Regional Transport Models
• The extents of Highways England’s land boundaries
7.3. Evaluation of Mitigation Measures 7.3.1. Where a review of the baseline mapping data, monitoring data and / or indicative air
quality modelling has identified the need for mitigation measures to be considered then the various measures described in Section 6 have been applied on a link-by-link basis, taking into account local conditions.
7.3.2. Where, following a review of potential mitigation measures, they have been identified as not suitable for the SRN PCM link or would not deliver compliance in a shorter timescale possible, then they are marked with an “x” in the audit report and an explanation provided to support the decision.
7.3.3. Where mitigation measures have been identified as possible, then for each
mitigation measure considered they are marked with a “?” in the audit report along with the calculated potential change in road NO2 concentrations. The reason for the change from “✓” in the Phase 1 audit reports (Commission No. 1) to “?” reflects that additional work is now required as part of the Phase 3 assessment (Commission No. 1) to determine whether the measure could be delivered and the time scales for

Phase 2 Air Quality Report
Phase 2 Air Quality Report v2.docx Page 48 of 104
implementing such a measure. Until this work has been completed it is not possible to state that such a measure could be brought forward to achieve compliance quicker.
7.3.4. To determine whether an individual mitigation measure could deliver compliance in
a shorter timescale than reported in the PCM model, the potential change in road NO2 concentrations for each measure has been taken off the reported annual mean NO2 concentration from the PCM model. Where the modelled PCM concentration moves from above the limit value to below the limit value in one or more years, then the measure has the potential to deliver compliance in shorter timescale. Where there is a reduction in NO2 concentration, but ultimately does not result in the concentration moving below the limit value, then a given measure is considered not to deliver compliance in a shorter timescale, but we may still seek to promote the measure as it contributes to delivering cleaner air quality.
7.4. Summary and Recommendation 7.4.1. A summary of the findings of the audit report are presented along with a
recommendation that either:
• The SRN PCM link is taken forward to Phase 3 (Commission No. 1) for a detailed modelling and mitigation evaluation.
• The SRN PCM link is not taken forward to Phase 3.
7.5. Supporting Activities 7.5.1. Following the production of the baseline maps and audit reports and consideration
of potential mitigation, additional data requirements may have been identified to support the work for Phase 2 and 3 assessments (Commission No. 1). Additional data could include air quality monitoring data, traffic surveys or ground surveys and where required is set out in this section of the audit reports.
7.6. JAQU Comments 7.6.1. This part of the audit report provides JAQU’s comments for each individual SRN PCM
link, and whether they support or disagree with the decision to progress or not progress beyond Phase 2 (Commission No. 1) and the reasons why.
7.6.2. The JAQU comments section outlines the final decision as to whether each PCM link will be progressed to Phase 3 (Commission No. 1) or stopped at Phase 2.

Phase 2 Air Quality Report
Phase 2 Air Quality Report v2.docx Page 49 of 104
8. Findings
8.1.1. Table 8.1 summarises the outcomes of the Phase 2 assessment (Commission No. 1) for all 101 SRN PCM links. The table documents whether for each individual SRN PCM link:
• Recommend to stop at Phase 2;
• Recommend to progress to Phase 3 assessment (Commission No. 1) in order to confirm that no mitigation is required as indicative modelling suggests no exceedances; or
• Recommend to progress to a Phase 3 assessment as indicative modelling suggests exceedances.
Table 8.1 Summary of the Phase 2 Assessment
Outcome Numbers of SRN PCM Links
Stopped at Phase 1 15
Recommend to stop at Phase 2 3
Recommend to progress to Phase 3 83
Total 101
Table 8.3 provides the complete list of all 101 SRN PCM links and the outcome against each one.
8.1.2. Table 8.2 provides a summary breakdown on possible mitigation measures and the corresponding number of SRN PCM links that the measure may be applied and a breakdown of all mitigation measures per SRN PCM link is shown in Table 8.4.
8.1.3. It may be that for some of the SRN PCM links there could be multiple possible mitigation measures put forward and they would be refined during Phase 3. Whilst HGV retrofit has been identified as possible measure for the remaining 83 SRN PCM links, there is no accredited retrofit system available for HGVs and such a measure would require a Government led scheme to implement. Table 8.2 Summary of Possible Mitigation Measures
Possible Mitigation Measure Numbers of SRN PCM Links
Electric Vans 0
Traffic Management 32
60mph Speed limit 17
50mph speed limit 25
Bus Retrofit 2
HGV Retrofit 83
9.5m High Barrier 3
Tunnels / Canopies/ Bypass 0
Public Access 76
Low Friction Road Surfacing 0
Mechanical Filtration 43

Phase 2 Air Quality Report
Phase 2 Air Quality Report v2.docx Page 50 of 104
Table 8.3 Outcome of the Phase 2 Assessment (Commission No. 1) for each of the 101 SRN PCM Link
Stopped at Phase 1
Census ID SRN Road Name Annual Mean NO2 Conc (µg/m³)
38107 M27 51.1
75421 A500 49.7
36656 A1 48.7
76076 M60 48.6
75418 A500 47.7
84041 M6 47.1
73526 A1 46.5
18626 A1 45.8
84040 M6 42.8
99833 A5103 42.4
18487 M4 42.4
73208 M62 41.8
73197 M66 41.8
6480 A14 41.6
17793 M27 41.5
Recommend to Stop at Phase 2
Census ID
SRN Road Name
Annual Mean NO2 Conc (µg/m³) in 2018
Justification PCM
Model HE Indicative
Modelling
17304 A52 46.2 35.0 Nottingham's approved Local Air Quality Plan has
reported no exceedances. 37416 A52 43 34.0
56557 A52 41.2 34.0

Phase 2 Air Quality Report
Phase 2 Air Quality Report v2.docx Page 51 of 104
Recommend to Progress to Phase 3
Census ID SRN Road Name
Annual Mean NO2 Conc (µg/m³) in 2018
PCM Model HE Indicative Modelling
47892 M4 55.2 63.0
28772 A1 51.5 46.2
38230 A500 50 31.4
80427 A1 49.1 48.6
99631 A27 48.6 47.6
47243 A500 48.6 35.1
99333 A50 48.5 30.6
28776 A1 48.2 62.4
75259 M27 48.1 33.5
57783 A500 47.9 38.0
28018 M27 47.8 39.7
27711 A4123 47.6 49.6
99614 M60 47.4 47.0
77436 A34 47.1 80.1
8340 A500 47.1 44.2
6046 M56 47 43.2
99335 A50 46.9 39.3
73773 M56 46.9 42.4
28361 A63 CS 46.8 62.2
80428 A1 46.8 36.7
48331 A63 CS 46.4 67.6
75422 A50 46.3 35.8
77419 A45 46.1 25.6
56009 M621 46.1 36.3
26012 M4 45.8 46.2
17736 A3 45.8 60.9
27932 A63 CS 45.6 65.8
74590 M60 45.5 39.7
81388 M621 45.4 37.6
46015 M5 45.3 67.2
73920 M5 45.3 47.0
73424 M5 45.1 44.7
99329 A50 45.1 41.6
74768 M32 45.1 43.9
56063 M621 45 40.2
8147 A500 44.9 35.6
73998 M4 44.9 26.5
26051 M61 44.7 33.2
77007 M60 44.5 42.9
36045 M56 44.4 42.3
48707 A1 44.2 30.6
56033 M32 44.1 45.8
77006 M60 44 40.9
57832 A63 CS 43.6 41.6
75290 A59 43.5 30.7
81178 A66 43.3 40.2

Phase 2 Air Quality Report
Phase 2 Air Quality Report v2.docx Page 52 of 104
Recommend to Progress to Phase 3
Census ID SRN Road Name
Annual Mean NO2 Conc (µg/m³) in 2018
PCM Model HE Indicative Modelling
28015 M602 43.3 40.9
81008 A19 43.2 44.7
18061 A38 43 27.6
70271 A5103 42.9 49.3
26017 M5 42.8 48.2
36296 A27 42.8 25.4
70206 M11 42.8 50.5
17961 A19 42.5 33.4
99332 A50 42.5 31.3
81374 A38 42.5 35.6
99331 A50 42.4 28.5
36007 M1 42.3 48.2
73318 M6 42.2 42.4
16050 M602 42.1 48.0
36063 M53 42 43.0
77484 A50 41.9 20.8
56007 M621 41.9 54.0
99337 A50 41.8 42.9
56058 M271 41.7 24.0
70007 A66 41.6 30.0
6013 M4 41.6 47.6
57767 A38 41.6 73.5
47964 A56 41.6 20.9
16237 A3(M) 41.5 27.5
81007 A19 41.4 41.4
46062 A1(M) 41.4 26.0
28445 A56 41.1 29.8
75235 A5103 41.1 35.3
8348 M621 41 38.7
75258 M27 40.9 33.5
74456 A38 40.8 31.5
81006 A19 40.8 36.6
56062 M53 40.7 27.9
70230 M6 40.5 50.5
26064 M606 40.1 33.4
80846 A282 40 62.3
28076 A316 40 42.8

Registered office Bridge House, 1 Walnut Tree Close, Guildford GU1 4LZ
Highways England Company Limited registered in England and Wales number 09346363
Table 8.4 All Possible Mitigation Measures Assessed by SRN PCM Link and the Possible Need for Additional Air Quality Monitoring
Census ID SRN Road
Name
Above or Below NO2 Limit Value based on indicative Air
Quality Modelling?
Possible Mitigation Measures
Additional Air Quality
Monitoring? Electric
Vans Traffic
Management 60mph
Speed limit 50mph
speed limit Bus Retrofit HGV
Retrofit 9.5m High
Barrier
Tunnels / Canopies/
Bypass Public Access
Low Friction Road
Surfacing Mechanical
Filtration
47892 M4 Above ? ? ?
28772 A1 Above ? ? ? ?
80427 A1 Above ? ? ? ?
99631 A27 Above ? ? ? TBC
47243 A500 Below ? ? ? ? TBC
99333 A50 Below ? ? ?
28776 A1 Above ? ? TBC
75259 M27 Below ? ? ? ? ?
57783 A500 Below ? ? ? TBC
28018 M27 Below ? ? ?
27711 A4123 Above ? ? ? ? ?
99614 M60 Above ? ? ?
77436 A34 Above ? ? ? TBC
8340 A500 Above ? ? ?
6046 M56 Above ? ? ? ? TBC
99335 A50 Below ? ? ? ?
73773 M56 Above ? ?
28361 A63 CS Above ? ?
80428 A1 Below ? ? ? TBC
48331 A63 CS Above ? ? ?
75422 A50 Below ? ? ? TBC
77419 A45 Below ? ? ? ? ?
56009 M621 Below ? ? TBC
26012 M4 Above ? ? ? ?
17736 A3 Above ? ? ? ?
27932 A63 CS Above ? ? ? TBC
74590 M60 Below ? ? ? ? ?
81388 M621 Below ? ?
46015 M5 Above ? ? ? ? ? ?
73920 M5 Above ? ? ? ? TBC
73424 M5 Above ? ? ? ? ?
99329 A50 Above ? ? ? TBC
74768 M32 Above ? ? ? ? TBC
56063 M621 Above ? ? TBC
73998 M4 Below ? ? ? ?
77007 M60 Above ? ? ? ? ?
36045 M56 Above ? ? ?
56033 M32 Above ? ? ? ? ?
77006 M60 Above ? ? ? ?
57832 A63 CS Above ? ?
75290 A59 Below ? ? ? ?
81178 A66 Above ? ? ?

Phase 2 Air Quality Report
Phase 2 Air Quality Report v2.docx Page 54 of 104
Census ID SRN Road
Name
Above or Below NO2 Limit Value based on indicative Air
Quality Modelling?
Possible Mitigation Measures
Additional Air Quality
Monitoring? Electric
Vans Traffic
Management 60mph
Speed limit 50mph
speed limit Bus Retrofit HGV
Retrofit 9.5m High
Barrier
Tunnels / Canopies/
Bypass Public Access
Low Friction Road
Surfacing Mechanical
Filtration
28015 M602 Above ? ? ?
81008 A19 Above ? ? ? ?
18061 A38 Below ? ? ? ?
70271 A5103 Above ? ?
26017 M5 Above ? ? ? ? ?
36296 A27 Below ? ? ? ?
70206 M11 Above ? ? ? TBC
99332 A50 Below ? ? ? TBC
81374 A38 Below ? ? ? ? TBC
99331 A50 Below ? ? ? TBC
36007 M1 Above ? ? ? ? TBC
73318 M6 Above ? ? ? ?
16050 M602 Above ? ? ? ? ?
36063 M53 Above ? ? ? ?
77484 A50 Below ? ? ? ? TBC
56007 M621 Above ? ? ? ? TBC
99337 A50 Above ? ? ? TBC
56058 M271 Below ? ? ? ? TBC
70007 A66 Below ? ? ? TBC
6013 M4 Above ? ? ?
57767 A38 Above ? ? ?
47964 A56 Below ? ? ? ? ? TBC
16237 A3(M) Below ? ? ? ? ?
81007 A19 Above ? ? ? ?
28445 A56 Below ? ? ? ?
75235 A5103 Below ? ? TBC
8348 M621 Below ? ? ? TBC
75258 M27 Below ? ? ? ? ?
74456 A38 Below ? ? ? ? TBC
81006 A19 Below ? ? ? ?
70230 M6 Above ? ? ? ?
26064 M606 Below ? ? ? TBC
80846 A282 Above ? ? TBC
28076 A316 Above ? ?
8147 A500 Below ? ? TBC
17961 A19 Below ? ? ? ? TBC
26051 M61 Below ? ? ? ? ? TBC
38230 A500 Below ? ? ? TBC
46062 A1(M) Below ? ? ? TBC
48707 A1 Below ? ? TBC
56062 M53 Below ? ? ? TBC

Registered office Bridge House, 1 Walnut Tree Close, Guildford GU1 4LZ
Highways England Company Limited registered in England and Wales number 09346363

Phase 2 Air Quality Report
Phase 2 Air Quality Report v2.docx Page 56 of 104
Appendix A: Regional Traffic Model Technical Note
See report entitled, “108124 TN01 NAQAP - RTM Data Extraction v1.3.pdf”

Phase 2 Air Quality Report
Phase 2 Air Quality Report v2.docx Page 57 of 104
Appendix B: Percentage Euro Split Profile by Vehicle Class for EFT and Highways England’s ANPR Camera Survey for 2018
Euro Class Assumed EFT Euro Proportions
Euro Proportions from ANPR Survey
Percentage Difference
Petrol Car
Pre-Euro 1 0.0 0.0 0.0
Euro 1 0.0 0.1 0.1
Euro 2 0.6 0.9 0.3
Euro 3 7.1 9.9 2.8
Euro 4 19.4 26.0 6.6
Euro 5 30.7 27.9 -2.9
Euro 6 42.2 35.3 -6.9
Diesel Car
Pre-Euro 1 0.0 0.0 0.0
Euro 1 0.0 0.0 0.0
Euro 2 0.1 0.1 0.0
Euro 3 3.7 3.7 0.0
Euro 4 15.8 19.2 3.4
Euro 5 35.4 38.2 2.8
Euro 6 45.0 38.7 -6.3
Petrol LGV
Pre-Euro 1 0.0 0.2 0.2
Euro 1 0.0 1.3 1.3
Euro 2 1.9 3.8 1.8
Euro 3 8.3 17.3 8.9
Euro 4 17.7 25.1 7.4
Euro 5 31.4 21.3 -10.1
Euro 6 40.6 31.1 -9.6
Diesel LGV
Pre-Euro 1 0.0 0.0 0.0
Euro 1 0.0 0.1 0.1
Euro 2 0.6 0.4 -0.3
Euro 3 3.6 4.9 1.3
Euro 4 15.8 16.9 1.0
Euro 5 34.5 45.9 11.4
Euro 6 45.4 31.9 -13.5
Rigid HGV
Pre-Euro I 0.0 0.0 0.0
Euro I 0.0 0.0 0.0
Euro II 0.9 0.3 -0.6
Euro III 6.3 3.6 -2.7
Euro IV 6.5 9.0 2.6
Euro V_EGR 5.7 24.1 18.3

Phase 2 Air Quality Report
Phase 2 Air Quality Report v2.docx Page 58 of 104
Euro Class Assumed EFT Euro Proportions
Euro Proportions from ANPR Survey
Percentage Difference
Euro V_SCR 17.2 24.1 6.9
Euro VI 63.4 38.8 -24.6
Artic HGV
Pre-Euro I 0.0 0.0 0.0
Euro I 0.0 0.0 0.0
Euro II 0.1 0.1 0.0
Euro III 1.0 1.0 0.0
Euro IV 1.8 2.7 0.9
Euro V_EGR 4.4 17.0 12.6
Euro V_SCR 13.1 17.0 3.9
Euro VI 79.6 62.2 -17.4
Buses / Coaches (Not London Buses)
1Pre-Euro I 0.0 0.0 0.0
2Euro I 0.0 0.0 0.0
3Euro II 2.4 0.0 -2.4
4Euro III 9.8 3.1 -6.7
5Euro IV 8.9 8.6 -0.3
6Euro V_EGR 7.4 23.3 15.9
7Euro V_SCR 22.3 23.8 1.5
8Euro VI 49.2 41.2 -8.0

Registered office Bridge House, 1 Walnut Tree Close, Guildford GU1 4LZ
Highways England Company Limited registered in England and Wales number 09346363
Appendix C: Summary of Local Authority Bus Feedback
Local Authority PCM Link Road Bus Details
Bury St Edmonds
6480 A14
Total journeys per week = 68 Galloway - 384 2 per day Monday - Friday J43 to J45 (E bound) 1 per day Saturday J43 to J45 (E bound) 2 per day Monday - Friday J43 to J44 (E bound) 1 per day Saturday J43 to J44 (E bound) Galloway - 385 4 per day Monday - Saturday J44 to J43 (W bound) Galloway - 377 1 per day Monday - Saturday J45 to J44 (W bound) Galloway - 386 1 per day Monday - Saturday J43 to J45 (E bound) 1 per day Monday - Saturday J45 to J43 (W bound) Suffolk Norse - 929 1 per day Monday - Friday J43 to J45 (E bound) College days only* 1 per day Monday - Friday J45 to J43 (W bound) College days only* Suffolk Norse - A14 1 per day J43 to J45 (E bound) Wednesday only 1 per day J45 to J43 (W bound) Wednesday only Fareline - 320 1 per day J43 to J45 (E bound) Wednesday only 1 per day J45 to J43 (W bound) Wednesday only High Suffolk CC - 6 1 per day J44 to J45 (E bound) 3rd Saturday each month* 1 per day J45 to J44 (W bound) 3rd Saturday each month*
Derby 57767 A38 2 buses per hour southbound
74456 A38 3 buses per hour each way
Durham
81008 A19
7 buses per hour A19 Peterlee adj Burnhope Way interchange North of Burnhope Way: GNE X6 1 p hr Euro V (?) GNE x10 1 p hr Euro VI South of Burnhope Way: GNE x10 1 p hr Euro VI GNE x9 1 p hr Euro VI GNE 202 1 p Hr Euro V Arriva x21 1 p hr Euro V Arriva x22 1 p hr Euro V (?)
81007 A19
2 buses per hour A19 north of Murton/ Cold Hesleden interchange GNE x10 1 p hr Euro VI GNE x9 1 p hr Euro VI

Phase 2 Air Quality Report
Phase 2 Air Quality Report v2.docx Page 60 of 104
Local Authority PCM Link Road Bus Details
81006 A19
7.5 buses per hour A19 adj to Wellfield interchange South of interchange: GNE X9 1 p hr Euro VI GNE x10 1 p hr Euro VI GNE 206 approx. every 2 hrs northbound only, Euro V North of interchange: GNE x10 1 p hr Euro VI GNE x9 1 p hr Euro VI GNE 202 1 p Hr Euro V Arriva x21 1 p hr Euro V Arriva x22 1 p hr Euro V (?)
Gateshead
80427 A1 No information available
36656 A1 No information available
28776 A1 No information available
Guildford 17736 A3 No scheduled bus journeys
Haslingden 47964 A56 Emailed Crossbus but no response received
28445 A56 Emailed Crossbus but no response received
Havant
36296 A27 25 services operates 1 journey from Portsmouth to Chichester in the morning and a return journey in the evening, seven days a week. ADL E400 Double Deck Buses - Euro V engines using bio-diesel
Kingston upon Hull
28361 A63 Park and ride occasionally operates along this stretch of the A63 - 9 times per day. (Stagecoach)
48331 A63 No bus services along this route
27932 A63 No bus services along this route
57832 A63 Park and ride occasionally operates along this stretch of the A63 - 9 times per day. (Stagecoach)
Manchester
99833 A5103 No bus services along this route
75235 A5103
A number of services run around the M60 junction. 101,102,103,108,179 262 trips in total
Newcastle under Lyme 47243 A500 No bus services along this route
Newcastle upon Tyne
28772 A1 No information available
73526 A1 No information available
18626 A1 No information available
48707 A1 No information available
Northampton 77419 A45 Emailed ‘kier WSP’ but no response received
Nottingham
17304 A52
Nottingham already proposing to retrofit buses along these links and expect these links to be below the objective by 2020 with their preferred plan in place
37416 A52
56557 A52
Oxford 77436 A34
35A - once a day in each direction on school days Buses are Euro V Hybrid (due to be upgraded to Euro VI by March 2019)
Plymouth
18061 A38 No scheduled bus journeys - although used by buses running empty between Milehouse Depot and Plympton and between Saltash and The Ride Depot

Phase 2 Air Quality Report
Phase 2 Air Quality Report v2.docx Page 61 of 104
Local Authority PCM Link Road Bus Details
81374 A38
Eastbound section (from Forder Vallye to Marsh Mills) is used by 3 Plymouth Citybus vehicles per hour on Service 50. 3 buses per hour Monday to Saturday daytime 2 buses per hour Monday to Saturday evenings 2 buses per hour Sunday and Bank Hol daytime Buses are Dennis Trident 2 with Alexander 400 Enviro bodywork to Euro VI emission standards Eastbound section is used by Stagecoach Service 52 every 75 minutes Monday to Friday daytime. Buses are ADL Enviro 200 to Euro IV emission standards. As with the previous link it is also used by empty buses.
Portsmouth 99631 A27
1 journey per day - 2 trips in total (1 in the morning and a return journey in the evening) Bus type: ADL E400 double Deck Euro V using bio diesel
Sandwell 73424 M5 No buses on actual link
73920 M5 No buses on actual link
Sefton 75290 A59
Spelthorne 28076 A316
One public bus (290 Staines - Twickenham) operated by Transport for London. Recommend getting in touch with TfL for further information. Appear to be 3 buses per hour on average and 50 per day.
Stafford 77484 A50 No scheduled bus journeys
Stockton on Tees
81178 A66 No scheduled bus journeys
17961 A19 No scheduled bus journeys
70007 A66 Arriva bus services - 7 per hour during daytime and 2 per hour in the evening until 21.15 in each direction (Mon - Sat), 2 per hour in each direction on Sundays
Stoke on Trent
38230 A500 No local buses
75421 A500 No local buses
99333 A50 Every 20 minutes, westbound only, entering via slip from Upper Normacot Road - 5 vehicles, 8 - 10 years old.
57783 A500 No local buses
75418 A500 No local buses
8340 A500 No local buses
99335 A50 Every 20 minutes eastbound - 8 vehicles, 4 - 15 years old 6 buses per house westbound - 13 vehicles, 4-15 years old
75422 A50 No local buses
99329 A50 Every hour in each direction - 4 vehicles, 10 years old
8147 A500 Every hour in each direction - 4 vehicles, 8-10 years old
99332 A50 No local buses
99331 A50 No local buses
99337 A50 No local buses
Thurrock 80846 A282 No bus stops - 1 bus per hour (X80) 15 per day

Phase 2 Air Quality Report
Phase 2 Air Quality Report v2.docx Page 62 of 104
Appendix D: Traffic Management
D1: Summary of Traffic Management Workshop Road / PCM Link Traffic Management Measure Anticipated
Change on PCM Link
Anticipated Change on Non-PCM Links
Overall Balance of Benefit
Ease of Delivery Road Safety Concerns
Further Consideration of Measure?
Text for Audit Report
A34 Oxford - 77436
No re-routing option or obvious solution. Local team may have more knowledge.
N/A N/A N/A N/A N/A Yes A panel of specialists including traffic, operations and air quality have reviewed regional traffic management options for the 86 PCM links and for this link it was determined there were no obvious solutions. However, the local team should be contacted at Phase 3.
A500 / A50 – 38230, 8147, 8340, 57783, 77484, 99332, 99333, 99335, 99337, 99331, 99329, 75422
Junction reconfiguration, consider removing signals, reducing lanes but increasing capacity. A50 review and potentially reduce local access along the 8km stretch to reduce merging traffic.
+ Improve flow - Local traffic re-routing onto non PCM links
+ Improve congestion on non-PCM links
- Would need to look into blocking access to local roads, liaison with LAs. Reducing lanes may have issues
+ Increasing distance for merging traffic – improve road safety.
Yes A panel of specialists including traffic, operations and air quality have reviewed regional traffic management options for the 86 PCM links. The panel concluded that on the A500 / A50, junction reconfiguration, the removal of signals, reducing the number of lanes and increasing capacity should improve flow, improve congestion on non-PCM links and improve road safety by increasing distance for merging traffic.
The panel also concluded that local traffic may re-reroute on to non PCM links. There may be issues with reducing lanes and blocking access to local roads would need to be investigated. Liaison with local authorities would be required.
M6 Rugby - 73318 Look at signals on the junction fully signalised or non-signalised
+ If works could make traffic more free flow and ease congestion on the PCM link
0 No re-routing / change to other roads
+ improve PCM link congestion
+ Relatively simple to try out signalling option
0 No obvious concerns
Yes A panel of specialists including traffic, operations and air quality have reviewed regional traffic management options for the 86 PCM links. The panel concluded that making junctions fully signalised or unsignalized could improve traffic flow and ease congestion on the PCM link.
M5, A4123 – 27711, 26017, 73424, 46015
Look into signalising between M5 roundabout (Birchley Island) and A412 – timing? Free flow turn M5. No off-slip potential.
+ Anticipated to make traffic more free flow and ease congestion
0 No change/ rerouting on other roads
+ Improve congestion on PCM links
0 Just changing signals on existing roundabout
0 No obvious concerns
Yes A panel of specialists including traffic, operations and air quality have reviewed regional traffic management options for the 86 PCM links. The panel concluded that reviewing signal timing between M5 roundabout and A412 and considering a free flow turn on to the M5 with no off-slip potential could improve the flow of traffic and ease congestion on PCM links. However, there would be no change on non-PCM links.
A52 Nottingham – 56557, 37416, 17304
No obvious solution – look at ongoing junction projects in the area. Looks to be a high volume of traffic due to a distribution centre, university, hospital and a number of warehouses
N/A N/A N/A N/A N/A Yes A panel of specialists including traffic, operations and air quality have reviewed regional traffic management options for the 86 PCM links and for these links it was determined there were no obvious solutions. However, the local team should be contacted at Phase 3.
A38 Plymouth – 18061, 81374
Long distance re-routing from M5 to Cornwall using A30 instead of A38
+ Depends on how many do the journey suggested as a diversion
- - Increased traffic on A30
+ A30 very rural 0 Easy to put up signage – difficult to enforce. Matrix sign depending on day / time of year (Summer)
0 Unknown Yes A panel of specialists including traffic, operations and air quality have reviewed regional traffic management options for the 86 PCM links. The panel concluded that long distance re-routing from M5 to Cornwall using A30 instead of A38 could provide a small improvement but is dependent on the how many customers drive the journey suggested as a diversion. It could also cause increased traffic on the rural A30. Delivery is simple as signage is easy to install but enforcing it could prove difficult.
A38 Derby - 74456
Remove merge issue onto the A38 from the A516 (although this may or may not be the cause of the problem). Closure or discourage.
+ If issue is caused from weaving traffic
+ +Non PCM link closure
+ Diluted merge - - Non-PCM road needing to be closed
0 No obvious concerns
Yes A panel of specialists including traffic, operations and air quality have reviewed regional traffic management options for the 86 PCM links. The panel concluded that removing the merge issue on to the A38 Derby from the A516 would be positive if the issue is caused from weaving traffic and as the merge would be diluted.
A38 Derby – 57767, 74456
No obvious solution. Potentially look at junction configuration.
N/A N/A N/A N/A N/A Yes A panel of specialists including traffic, operations and air quality have reviewed regional traffic management options for the 86 PCM links and for these links it was determined there were no obvious solutions. However, the local team

Phase 2 Air Quality Report
Phase 2 Air Quality Report v2.docx Page 63 of 104
Road / PCM Link Traffic Management Measure Anticipated Change on PCM Link
Anticipated Change on Non-PCM Links
Overall Balance of Benefit
Ease of Delivery Road Safety Concerns
Further Consideration of Measure?
Text for Audit Report
should be contacted at Phase 3.
M5 Sandwell, 73920
No obvious solution. Maybe the midlands team have studies to solve merging problems.
N/A N/A N/A N/A N/A Yes A panel of specialists including traffic, operations and air quality have reviewed regional traffic management options for the 86 PCM links and for this link it was determined there were no obvious solutions. However, the local team should be contacted at Phase 3.
M6 Birmingham, 70230
No obvious solution. N/A N/A N/A N/A N/A No A panel of specialists including traffic, operations and air quality have reviewed regional traffic management options for the 86 PCM links. The panel concluded there are no obvious traffic management solutions
A56 Haslingdon, 28445, 47964
No obvious solution. Current study ongoing here? No re-routing due to local built up area / roads.
N/A N/A N/A N/A N/A Yes A panel of specialists including traffic, operations and air quality have reviewed regional traffic management options for the 86 PCM links and for these links it was determined there were no obvious solutions. However, the local team should be contacted at Phase 3.
M61 Bolton, 26051
Ongoing study into merge problem at A666.
N/A N/A N/A N/A N/A Yes A panel of specialists including traffic, operations and air quality have reviewed regional traffic management options for the 86 PCM links and for this link it was determined there were no obvious solutions. However, the local team should be contacted at Phase 3.
M60 Oldham, 74590, 99614, 77006, 77007
No obvious solution. N/A N/A N/A N/A N/A No A panel of specialists including traffic, operations and air quality have reviewed regional traffic management options for the 86 PCM links. The panel concluded there are no obvious traffic management solutions
M602, 28015, 16050
No obvious solution. Increase capacity for M602 slip onto M60 anticlockwise – needs looking into.
N/A N/A N/A N/A N/A Yes A panel of specialists including traffic, operations and air quality have reviewed regional traffic management options for the 86 PCM links and for these links it was determined there were no obvious solutions. However, the local team should be contacted at Phase 3.
A59 Sefton, 75290
Wait to see the effect of the new Switch Island Improvements (and Port of Liverpool Scheme)
N/A N/A N/A N/A N/A No A panel of specialists including traffic, operations and air quality have reviewed regional traffic management options for the 86 PCM links. The panel concluded that possible traffic management solutions are dependent on the effect of improvements to Switch Island (Port of Liverpool scheme).
M56 Manchester, 6046, 36045, 73773, 70271
No obvious time effective solution. Smart motorway?
N/A N/A N/A N/A N/A No A panel of specialists including traffic, operations and air quality have reviewed regional traffic management options for the 86 PCM links. The panel concluded there are no obvious traffic management solutions.
A5103, 75235 No obvious solution. Potentially a major scheme would address.
N/A N/A N/A N/A N/A No A panel of specialists including traffic, operations and air quality have reviewed regional traffic management options for the 86 PCM links. The panel concluded there are no obvious traffic management solutions.
M53, 56062, 36063
No obvious solution. Issue is there are three lanes reducing to two. Look at why smart motorway dropped. Local study?
N/A N/A N/A N/A N/A Yes A panel of specialists including traffic, operations and air quality have reviewed regional traffic management options for the 86 PCM links and for these links it was determined there were no obvious solutions. However, the local team should be contacted at Phase 3.
A1 Gateshead, 28776, 80428, 80427
Issue from merging traffic southbound, short merge distance. Remove merge (SB) A184 onto A1 forcing to B1428 roundabout to merge there.
+ Diluted merge 0 Only PCM changes
+ Simple solution
+ Signal changes and signing
- Could increase congestion
Yes A panel of specialists including traffic, operations and air quality have reviewed regional traffic management options for the 86 PCM links. The panel concluded that removing the merge (SB) A184 onto A1 forcing merging on the B1428 roundabout would be simple solution with easy delivery but would not change non-PCM links and has the potential to increase congestion.
A1(M), 46062 No obvious traffic management solution. No obvious cause of issue.
N/A N/A N/A N/A N/A No A panel of specialists including traffic, operations and air quality have reviewed regional traffic management options for the 86 PCM links. The panel concluded there are no obvious traffic management solutions.
A19 Durham, 81008, 81007, 81006
No obvious traffic management solution. No obvious cause of issue.
N/A N/A N/A N/A N/A No A panel of specialists including traffic, operations and air quality have reviewed regional traffic management options for the 86 PCM links. The panel concluded there are no obvious traffic management solutions.
A19 Stockton on Tees, 17961
Re-route commuter southbound to A1027 – remove slip road onto A19
+ Look at bypass road
- - Bypass road near residential
+ Reduce congestion A19
- - Needs looking into – may be
- Capacity of mini
Yes A panel of specialists including traffic, operations and air quality have reviewed regional traffic management options for the 86 PCM links. The panel concluded

Phase 2 Air Quality Report
Phase 2 Air Quality Report v2.docx Page 64 of 104
Road / PCM Link Traffic Management Measure Anticipated Change on PCM Link
Anticipated Change on Non-PCM Links
Overall Balance of Benefit
Ease of Delivery Road Safety Concerns
Further Consideration of Measure?
Text for Audit Report
from roundabout. properties difficult roundabout that there is a potential to re-route commuters southbound on the A1027 possibly through the existing bypass road and removing the slip road onto A19 from the roundabout. This could reduce congestion on A19. Delivery may be difficult, and bypass road is located close to residential properties. The capacity of the mini roundabout could also cause road safety concerns.
A66, 70007, 81178
Problem caused potentially by short distances between on / off slip roads and weaving traffic. No obvious solution. Further detail required.
N/A N/A N/A N/A N/A Yes A panel of specialists including traffic, operations and air quality have reviewed regional traffic management options for the 86 PCM links and for these links it was determined there were no obvious solutions. However, the local team should be contacted at Phase 3.
A50 Stoke, 77484, 99337, 99335, 99333, 99332, 99329, 99331, 75422
Ease queuing on the A50 westbound by making free flow left turn at A500 roundabout or signal timings (in AM peak).
+ Improving AM congestion
0 No other links affected (no re-routing)
+Reducing congestion
- Reconfiguration of traffic signals
+ Benefit from reducing congestion
Yes A panel of specialists including traffic, operations and air quality have reviewed regional traffic management options for the 86 PCM links. The panel concluded that by making a free flow left turn at A500 roundabout or signal timings in AM peak times could improve AM congestion which would improve road safety. Delivery would be simple as would only require the reconfiguration of traffic signals.
A500 Stoke, 38230, 8147, 47243, 8340, 57783
Divert some HGVs down the M6 rather than the A500 / A50
+ 50% of HGVs using M6
0 No sensitive receptors
+ + Pulling vehicles from where there isn’t an issue
- - Delivery mechanism unknown
0 HGVs are diverted to the M6 (SRN)
Yes A panel of specialists including traffic, operations and air quality have reviewed regional traffic management options for the 86 PCM links. The panel concluded that diverting some HGV’s down the M6 rather than the A500 / A50 would create a moderate improvement to the PCM link and would not affect any non-PCM links. The delivery mechanism for this option may be difficult to deliver / enforce.
M621 to south of J4, 8348
The M621 major project will be deploying soon, so that is expected to make a contribution to reducing congestion on the M621 generally. However, this location is close to a key turnoff onto the A61, and the geometry of the M621 in general is difficult in terms of bringing forward improvement schemes. The M621 major project will not be directly affecting this junction, but may be providing some benefit here (their environmental modelling should be able to provide more information here) as it is upstream of this point. The speed limit has already been reduced to 50mph in this vicinity. Any intervention close to or at this junction would be substantial, so it is difficult to conceive of anything that might meet potential AQ expectations in terms of cost and delivery timescale. A significant scale feasibility exercise would be needed to model potential interventions. However, it is likely that additional flow coming from suppressed demand would neutralise any relief in emissions coming from reduced congestion.
N/A N/A N/A N/A N/A No A panel of specialists including operations and air quality have reviewed regional traffic management options for the 86 PCM links and for this link it was determined that there are no obvious traffic management solutions. This PCM link should be re-visited following the implementation of the M621 major project.
M606, 26064 There was a planned major project N/A N/A N/A N/A N/A No A panel of specialists including operations and air quality have reviewed

Phase 2 Air Quality Report
Phase 2 Air Quality Report v2.docx Page 65 of 104
Road / PCM Link Traffic Management Measure Anticipated Change on PCM Link
Anticipated Change on Non-PCM Links
Overall Balance of Benefit
Ease of Delivery Road Safety Concerns
Further Consideration of Measure?
Text for Audit Report
(Chain Bar) at the M62/M606 intervention, which would have treated some of the southbound am traffic congestion at this point. However the northbound is generally free flowing, and it is the northbound that is closer to the properties. It is also notable that the local road that runs parallel to the M606 is congested, so will be contributing to the air pollution. The only sensible short term intervention would appear to be to drop the speed limit on the M606, however this would be not a traffic management measure. There are also plans to fully remove the current HGV lane painted out close to the M62/M606 junction, that might reduce some effect from southbound vehicles at this point. Timescales would be dominated by the consultation exercise, and by programming, as next year’s programme is planned.
regional traffic management options for the 86 PCM links and for this link it was determined that there are no obvious traffic management solutions. However, it should be re-visited following the implementation of the major project and the plans to remove the current HGV lane on the M62 / M606.
A1, 28772 Contained in the Scotswood to North Brunton scheme, expected to start Mar 20. It is not feasible to consider other asset interventions with the major project just a year away.
N/A N/A N/A N/A N/A No A panel of specialists including operations and air quality have reviewed regional traffic management options for the 86 PCM links. The panel concluded there are no obvious traffic management solutions. The Scotswood to North Brunton scheme may contribute to lowering any exceedances once constructed.
M1, 36007 The smart motorway was implemented here just over 18 months ago. The variable speed limits have already been used to bring down peak speeds until 3 Dec 2018, and we are now in an extended trial for messaging interventions. No further proposed measure. Note that in the longer term the most likely measure is support of the Sheffield Innovation Corridor scheme which will put in a parallel local distributor road on this section just to the South of the M1.
N/A N/A N/A N/A N/A No A panel of specialists including operations and air quality have reviewed regional traffic management options for the 86 PCM links. The panel concluded there are no obvious traffic management solutions. The parallel local distributor road on this section just to the South of the M1 may contribute to lowering any NO2 once constructed.
A1,48707 Contained in the Scotswood to North Brunton scheme, expected to start Mar 2020. It is not feasible to consider other asset interventions with the major project just a year away.
N/A N/A N/A N/A N/A No A panel of specialists including operations and air quality have reviewed regional traffic management options for the 86 PCM links. The panel concluded there are no obvious traffic management solutions. The Scotswood to North Brunton scheme may contribute to lowering any exceedances once constructed.
M621, 56007 Intervention already in progress. There is a park and ride in development at Stourton off J7, with improvements at this junction associated with the M621 major project. This may give some small traffic reduction in the 7-6 area
N/A N/A N/A N/A N/A No A panel of specialists including operations and air quality have reviewed regional traffic management options for the 86 PCM links and for this link it was determined there are no obvious traffic management solutions. This PCM link should be re-visited following the implementation of the M621 major project.

Phase 2 Air Quality Report
Phase 2 Air Quality Report v2.docx Page 66 of 104
Road / PCM Link Traffic Management Measure Anticipated Change on PCM Link
Anticipated Change on Non-PCM Links
Overall Balance of Benefit
Ease of Delivery Road Safety Concerns
Further Consideration of Measure?
Text for Audit Report
which may help with the air quality issues. The M621 major project environmental assessments should be consulted.
M621, 56009 The M621 project will be intervening shortly slightly upstream of this location. The M621 environmental assessment should be consulted to see the anticipated effects. No asset intervention would be feasible in advance of the major project.
N/A N/A N/A N/A N/A No A panel of specialists including operations and air quality have reviewed regional traffic management options for the 86 PCM links. The panel concluded there are no obvious traffic management solutions. This PCM link should be re-visited following the implementation of the M621 major project.
M621, 56063 The M621 project will be intervening shortly close to this location. The M621 environmental assessment should be consulted to see the anticipated effects. No asset intervention would be feasible in advance of the major project.
N/A N/A N/A N/A N/A No A panel of specialists including operations and air quality have reviewed regional traffic management options for the 86 PCM links. The panel concluded there are no obvious traffic management solutions. This PCM link should be re-visited following the implementation of the M621 major project.
M621, Near J2, 81388
The area is directly affected by the M621 major project, deploying shortly. No asset intervention would be feasible in this short timescale.
N/A N/A N/A N/A N/A No A panel of specialists including operations and air quality have reviewed regional traffic management options for the 86 PCM links. The panel concluded there are no obvious traffic management solutions. This PCM link should be re-visited following the implementation of the M621 major project.
A63, 57832 Speed limit reduction is possible, as the speed limit is set to the national speed limit. Off network investment on priory way / Saxon way might be possible, the local authority has schemes they are looking to fund.
N/A N/A N/A N/A N/A No A panel of specialists including traffic and air quality have reviewed regional traffic management options for the 86 PCM links. The panel concluded that there are no obvious traffic management solutions. However, local Schemes being undertaken by the local authority may help.
A63, 27932 The castle street major scheme is deploying shortly, no asset measure is feasible in the interim. The speed limit is already set fairly low.
N/A N/A N/A N/A N/A No A panel of specialists including operations and air quality have reviewed regional traffic management options for the 86 PCM links. The panel concluded there are no obvious traffic management solutions. However, the Castle Street major project may contribute to lowering any exceedances once constructed.
A63, 28361 There is evidence of queueing traffic from the Castle street area upstream, so some improvement in congestion would be expected after the scheme. The major project (Castle Street) environmental assessments should be reviewed. The speed limit in the area is already set to 50. The main junction in this area appears to be working OK at peak times, so no congestion-based intervention there looks feasible.
N/A N/A N/A N/A N/A No A panel of specialists including operations and air quality have reviewed regional traffic management options for the 86 PCM links. The panel concluded there are no obvious traffic management solutions. However, the Castle Street major project may contribute to lowering any exceedances once constructed.
A63, 48331 No proposed measure, directly in the footprint of the Castle Street major Scheme.
N/A N/A N/A N/A N/A No A panel of specialists including operations and air quality have reviewed regional traffic management options for the 86 PCM links. The panel concluded there are no obvious traffic management solutions. However, the Castle Street major project may contribute to lowering any exceedances once constructed.
M4 near junction 16, 73998
More businesses than residential properties situated alongside the M4 in the PCM link location. A few located within 50m at Dianmer Close. Speed reduction the only doable option as
N/A N/A N/A N/A N/A No A panel of specialists including operations and air quality have reviewed regional traffic management options for the 86 PCM links. The panel concluded there are no obvious traffic management solutions.

Phase 2 Air Quality Report
Phase 2 Air Quality Report v2.docx Page 67 of 104
Road / PCM Link Traffic Management Measure Anticipated Change on PCM Link
Anticipated Change on Non-PCM Links
Overall Balance of Benefit
Ease of Delivery Road Safety Concerns
Further Consideration of Measure?
Text for Audit Report
diverting traffic would mean a 63mile diversion from Junction 17 to Junction 15 and some of the diversion route is not ideal for HGV’s. Smart motorway coming as already at J19 but not likely to be very soon.
A52 Nottingham, 56557
This road connects into a series of PCM links around the hospital and industrial estate. There are no obvious interventions here, but changes to the operation of other PCM links may have an impact.
N/A N/A N/A N/A N/A No A panel of specialists including traffic and air quality have reviewed regional traffic management options for the 86 PCM links. The panel concluded there are no obvious traffic management solutions.
M32 Bristol, 56033 and 74768
Removal of tolls on the Severn Crossings is likely to have led to an increase in flows here.
Traffic flows here, especially inbound, are likely to already be constrained by M4 Junction 19, where queuing already occurs on slips and mainline M4 during peaks. Theoretically limiting throughput onto the M32 could improve downstream AQ, but this would have economic and safety implications.
The main cause is likely to be congestion at the bottom end of the M32 as it reaches the A4032. Consideration could be given to reviewing signal timings at the Cabot Circus lights. However, this would most likely simply shift the problem elsewhere. It is also quite likely that improving capacity here would induce additional demand so limiting AQ benefits.
A future CAZ in Bristol may reduce demand on the M32 (no modelling yet available though).
+ Limiting throughput onto the M32 could improve downstream AQ and reviewing signal timings may benefit PCM link.
- Unknown what the reviewing signal timings may do elsewhere on non-PCM links.
0 May improve congestion but may cause issues elsewhere
+ Could be quite simple to implement
- Unknown what the reviewing signal timings may do elsewhere
Yes A panel of specialists including traffic and air quality have reviewed regional traffic management options for the 86 PCM links. The panel concluded that there is a potential to limit the throughput onto the M32 which could improve downstream air quality together with reviewing signal timings at the Cabot Circus lights. It is unclear what reviewing signal timings may do elsewhere on non-PCM links. This option would be simple to implement, however, may cause safety concerns elsewhere on the network regarding signal timings.
Redbridge, 70206 Possible that part of the problem is congestion on the south bound offslip onto the Redbridge roundabout. Conceivable that changes to signal timings here might reduce congestion and hence improve AQ, but suspect this would be marginal. Noted that SB HGV% is high (11%), but it’s difficult to see how these could be re-routed effectively.
+ Changes to signal timings may reduce congestion.
+ No changes to non-PCM links.
+ Overall positive benefit.
+ Simple to implement.
0 No safety concerns.
Yes A panel of specialists including traffic and air quality have reviewed regional traffic management options for the 86 PCM links. The panel concluded that changes to signal timings here might reduce congestion and hence improve air quality. It is unlikely this would affect any non-PCM links and would be fairly simple to implement. There are no obvious safety concerns.
A282 Thurrock Problem appears to be caused by the north bound offslip onto the A13 Mar
+ Changes to signal timings
+ No changes to non-PCM links.
+ Overall positive benefit.
+ Simple to implement.
0 No safety concerns.
Yes A panel of specialists including traffic and air quality have reviewed regional traffic management options for the 86 PCM links. The panel concluded that the

Phase 2 Air Quality Report
Phase 2 Air Quality Report v2.docx Page 68 of 104
Road / PCM Link Traffic Management Measure Anticipated Change on PCM Link
Anticipated Change on Non-PCM Links
Overall Balance of Benefit
Ease of Delivery Road Safety Concerns
Further Consideration of Measure?
Text for Audit Report
Dyke interchange to the north of the link itself. This is a signalised roundabout, so a review could be undertaken; however, given the scale and location it is likely that these are already fairly well optimised.
may reduce congestion.
signalised roundabout at the A13 Mar Dyke interchange could be reviewed to see if it could bring about air quality benefits. It is unlikely this would affect any non-PCM links and would be fairly simple to implement. There are no obvious safety concerns.
36296 Havant Bypass
No evidence that congestion is a cause here – likely simply volume of traffic immediately adjacent to an urban area. It is conceivable that there is some junction hopping depending on origins/destinations within Havant, in which case some changes to the local road network could be beneficial to reduce this. Data collection would be required to determine if this is the case. No obvious traffic management solution.
N/A N/A N/A N/A N/A No A panel of specialists including traffic and air quality have reviewed regional traffic management options for the 86 PCM links. The panel concluded there are no obvious traffic management solutions.
M27 Southampton, 28018, 75259 and 75258
Caused by extensive congestion on a long stretch of the M27. Refer to any studies which have been undertaken in this area, but any ‘quick wins’ are likely to have already been applied.
N/A N/A N/A N/A N/A Yes A panel of specialists including traffic and air quality have reviewed regional traffic management options for the 86 PCM links and for this link and it was determined there were no obvious solutions. However, the local team should be contacted at Phase 3.
A3, East Hampshire, Horndean, 16237
For most of the day there is little congestion, and AQ issues likely result from volume of traffic combined with the embankments either side of the road. Some AM congestion north bound may be caused by a merge from London Road immediately to the north of the PCM link. Traffic is likely to merge with the mainline at a relatively low speed. Consideration could be given to whether this effect is the root cause, and if so whether closure of this merge is realistic.
+ Closing the merge may bring about AQ benefits.
- May more traffic onto local roads.
+ Both potentially positive and negative effects.
+ Could be simple to implement.
0 Safety concerns are unknown.
Yes A panel of specialists including traffic and air quality have reviewed regional traffic management options for the 86 PCM links. The panel concluded that closing the merge from London Road immediately to the north of the PCM link may bring about air quality benefits. This would need to be looked at further at Phase 3. Closing the merge may affect non-PCM links by keeping traffic on local roads, however, would be fairly simple to implement. Safety concerns are unknown.
A316 Spelthorne, 28076
No obvious traffic management solution. PCM link in 2019 is predicted to be below 40µg/m3.
N/A N/A N/A N/A N/A No A panel of specialists from the air quality team have reviewed regional traffic management options for the 86 PCM links. The panel concluded there are no possible traffic management solutions for this PCM link.
A282, Thurrock, 80846
PCM link located directly north of the Queen Elizabeth II Bridge. No obvious traffic management solution. PCM link in 2019 is predicted to be below 40µg/m3. LTC major project may deliver further benefits once constructed.
N/A N/A N/A N/A N/A No A panel of specialists from the air quality team have reviewed regional traffic management options for the 86 PCM links. The panel concluded there are no possible traffic management solutions for this PCM link.
M271 Test Valley, 56058
PCM link located on the M217 junction with the M27 which is signalised. Potential to look at changing the signalising timings or removing the signals.
+ Potential to improve flow
0 No change + + Potential to be very beneficial
+ Fairly quick to look at signal timings / remove signals.
0 No immediate concerns
Yes A panel of specialists including traffic and air quality have reviewed regional traffic management options for the 86 PCM links. The panel concluded that there is a potential to look at changing the signalising timings or removing the signals on the junction .which may improve traffic flow and being AQ benefits. It is unlikely this would affect any non-PCM links and would be fairly simple to implement. There are no obvious safety concerns.
A3, Guilford 17736
No obvious traffic management solution. No obvious cause of issue. May be worth speaking to local area team at
N/A N/A N/A N/A N/A No A panel of specialists including air quality have reviewed regional traffic management options for the 86 PCM links. The panel concluded there are no possible traffic management solutions for this PCM link. However, it would be

Phase 2 Air Quality Report
Phase 2 Air Quality Report v2.docx Page 69 of 104
Road / PCM Link Traffic Management Measure Anticipated Change on PCM Link
Anticipated Change on Non-PCM Links
Overall Balance of Benefit
Ease of Delivery Road Safety Concerns
Further Consideration of Measure?
Text for Audit Report
Phase 3. worth speaking to the local area team at Phase 3.
M4 Hounslow, 26012, 47892 and 6013
Traffic could potentially be re-routed. However, it would be moving traffic from the M4 to A roads closer to residential areas.
+ Traffic would be taken away from the PCM link with exceedances.
- Would take traffic closer to residential properties.
- May address the PCM link but would likely cause many problems for the A roads traffic was routed onto.
- - Local Authority would need to be consulted and buy in to any diversions – which would be very difficult.
- - Would increase congestion on the non PCM links.
No A panel of specialists from the air quality team have reviewed regional traffic management options for the 86 PCM links. The panel concluded there are no possible reasonable traffic management solutions for this PCM link.
A45 Northampton, 77419
Traffic could potentially be re-routed along routes to the west and east. However, these roads are not A roads and would take traffic though residential areas.
+ Traffic would be taken away from the PCM link with exceedances.
- Would take traffic closer to residential properties.
- May address the PCM link but would likely cause many problems for the residential areas traffic was routed though.
- - Local Authority would need to be consulted and buy in to diversion – which would be very difficult.
- - Would increase congestion on the non PCM link.
No A panel of specialists from the air quality team have reviewed regional traffic management options for the 86 PCM links. The panel concluded there are no possible reasonable traffic management solutions for this PCM link.
A27 Portsmouth, 99631
AQ issues potentially caused by weaving traffic as there are two large junctions located close to each other and at peak this would be exacerbated. Traffic could potentially be re-routed along Solent Road and Harts Farm Way. However, these roads are not A roads and would take traffic though industrial estates.
+ Traffic would be taken away from the PCM link with exceedances.
- Would take traffic closer to residential properties.
- May address the PCM link but would likely cause many problems for the industrial estate traffic was routed though.
- - Local Authority would need to be consulted and buy in to diversion – which would be very difficult.
- - Would increase congestion on the non PCM link.
No A panel of specialists from the air quality team have reviewed regional traffic management options for the 86 PCM links. The panel concluded there are no possible reasonable traffic management solutions for this PCM link.
M5 Sandwell, 73920
No obvious traffic management solution. No obvious cause of issue. May be worth speaking to local area team at Phase 3.
N/A N/A N/A N/A N/A No A panel of specialists including air quality have reviewed regional traffic management options for the 86 PCM links. The panel concluded there are no possible traffic management solutions for this PCM link. However, it would be worth speaking to the local area team at Phase 3.
M6 Birmingham, 70230
No obvious traffic management solution. No obvious cause of issue. May be worth speaking to local area team at Phase 3.
N/A N/A N/A N/A N/A No A panel of specialists including air quality have reviewed regional traffic management options for the 86 PCM links. The panel concluded there are no possible traffic management solutions for this PCM link. However, it would be worth speaking to the local area team at Phase 3.
Note: All measures identified as possible interventions as part of the Traffic Management workshop are subject to further review and detailed assessment as part of the Phase 3 assessment (Commission No. 1) and should not be considered as an agreed as viable and deliverable until the completion of Phase 3 on a link-by-link basis.

Registered office Bridge House, 1 Walnut Tree Close, Guildford GU1 4LZ
Highways England Company Limited registered in England and Wales number 09346363
D2: Example of Traffic Management Option for HGVs
Note: This is an indicative example only a possible measure
Example of a link on the M6 Jn15-16 of a traffic
management measure
Jn16
Jn15
The inclusion of text to the motorway sign to divert HGVs looking to travel to the A50 and onwards, off the A500 and away from the PCM links. Example illustrative text:
For A50: HGVs use Jn15
M6
M6
A500
A50A500
M6
Key Route length 10 miles
Alternative route length 12 miles
PCM links
Progression of such a measure would need to be supported by traffic surveys and detailed understanding of HGV destinations to determine the number of HGVs that may be influenced.

Registered office Bridge House, 1 Walnut Tree Close, Guildford GU1 4LZ
Highways England Company Limited registered in England and Wales number 09346363
D3: Traffic Management Proforma
Road:
PCM Link: NO2 Concentration:
Proposed Measure:
Anticipated Change on PCM Link
+ + + O - - -
Comment:
Anticipated Change on Non-PCM Links
+ + + O - - -
Comment:
Overall Balance of Benefit
+ + + O - - -
Comment:
Ease of Delivery
+ + + O - - -
Comment:
Road Safety Concerns
+ + + O - - -
Comment:
Changes No of Properties
+ + Moderate Improvement Imperceptible 1 – 10
+ Small improvements Small 10 – 30
O Little to no change Moderate > 30
- Small worsening
- - Moderate worsening

Phase 2 Air Quality Report
Phase 2 Air Quality Report v2.docx Page 72 of 104
Delivery Time (Years)
0-1 1-3 3+
General Comments

Phase 2 Air Quality Report
Phase 2 Air Quality Report v2.docx Page 73 of 104
Appendix E: Annualised Annual Mean Nitrogen Dioxide Concentrations (µg/m³) for 2017
Monitoring Site ID Ordnance Survey Grid Refs
Site Type Measurement Year
Annualisation Factor
2017 Equivalent
Annual Mean NO2 Concn
(µg/m³)
x y
A63CS_002_0313 509209 428343 Roadside 2015 1.035 45.0
A63CS_005_0313 509798 428463 Roadside 2015 0.937 76.8
A63CS_006_0313 509843 428459 Roadside 2015 0.937 57.4
A63CS_007_0313 509892 428452 Roadside 2015 0.929 49.4
A63CS_010_0313 509982 429198 Roadside 2015 0.937 43.6
A63CS_011_0313 509379 429295 Roadside 2015 0.858 47.9
M60J24J27_001_0813 390839 402399 Roadside 2015 0.848 44.4
M60J24J27_002_0813 390989 402188 Roadside 2015 0.848 46.7
M60J24J27_003_0813 391182 401718 Roadside 2015 0.891 35.7
M60J24J27_004_0813 391053 401701 Roadside 2015 0.848 34.9
M60J24J27_005_0813 391305 400977 Roadside 2015 0.848 33.4
M60J24J27_006_0813 391883 400125 Roadside 2015 0.848 43.3
M60J24J27_007_0813 391987 399762 Roadside 2015 0.84 29.9
M60J24J27_008_0813 391993 399967 Roadside 2015 0.848 48.3
M60J24J27_009_0813 392530 398377 Roadside 2015 0.84 48.4
M60J24J27_010_0813 392526 398421 Roadside 2015 0.848 45.5
M60J24J27_011_0813 392409 398119 Roadside 2015 0.848 40.1
M60J24J27_013_0813 392313 397620 Roadside 2015 0.848 41.3
M60J24J27_014_0813 391302 397344 Roadside 2015 0.848 41.4
M60J24J27_016_0813 391583 395506 Roadside 2015 0.848 53.9
M60J24J27_018_0813 390822 395597 Roadside 2015 0.848 42.6
M60J24J27_019_0813 391007 395062 Roadside 2015 0.85 29.5
M60J24J27_020_0813 391617 392427 Roadside 2015 0.848 38.5
M60J24J27_021_0813 392010 391737 Roadside 2015 0.848 64.0
M60J24J27_023_0813 391978 391594 Roadside 2015 0.891 40.6
M60J24J27_024_0813 390644 391353 Roadside 2015 0.848 44.7
M60J24J27_025_0813 390444 391153 Roadside 2015 0.848 45.9
M60J24J27_026_0813 390708 391029 Roadside 2015 0.848 40.2
M60J24J27_027_0813 390352 390524 Roadside 2015 0.848 34.1
M60J24J27_028_0813 389426 390833 Roadside 2015 0.816 35.1
M60J24J27_029_0813 388302 390350 Roadside 2015 0.85 45.6
M60J24J27_030_0813 387227 389722 Roadside 2015 0.848 39.9
M60J24J27_031_0813 386908 389504 Roadside 2015 0.848 42.0
M60J24J27_032_0813 391481 387639 Collocation 2015 0.848 34.1
M60J24J27_033_0813 391481 387639 Collocation 2015 0.848 34.1
M60J24J27_034_0813 391481 387639 Collocation 2015 0.848 31.1
M60J24J27_035_0813 384573 388998 Roadside 2015 0.848 34.6
M60J24J27_036_0813 384399 389006 Roadside 2015 0.848 31.2
M60J24J27_037_0813 384994 388831 Roadside 2015 0.84 36.4
M60J24J27_038_0813 384999 388714 Roadside 2015 0.848 39.6
M60J24J27_039_0813 385015 388432 Roadside 2015 0.848 66.5
M60J24J27_040_0813 385042 388431 Roadside 2015 0.848 62.0
M60J24J27_041_0813 385192 388748 Roadside 2015 0.848 35.3
M60J24J27_042_0813 385111 388723 Roadside 2015 0.848 36.3
M60J24J27_043_0813 385153 389548 Roadside 2015 0.848 34.4
M60J24J27_046_0813 389739 390863 Roadside 2015 0.848 48.7
M60J24J27_047_0813 388897 390914 Roadside 2015 0.848 50.3

Phase 2 Air Quality Report
Phase 2 Air Quality Report v2.docx Page 74 of 104
Monitoring Site ID Ordnance Survey Grid Refs
Site Type Measurement Year
Annualisation Factor
2017 Equivalent
Annual Mean NO2 Concn
(µg/m³)
x y
MMM_007_0709 375498 401520 Roadside 2015 0.85 51.3
MMM_008_0709 375428 401417 Roadside 2015 0.848 38.3
MMM_009_0709 375340 401259 Roadside 2015 0.891 34.6
MMM_018_0709 374773 400609 Roadside 2015 0.848 43.6
MMM_028_0709 375082 398458 Roadside 2015 0.848 62.8
MMM_035_0709 377759 403242 Roadside 2015 0.848 37.5
MMM_045_0709 373668 403241 Roadside 2015 0.848 31.0
MMM_059_0709 375226 400382 Roadside 2015 0.848 41.2
MMM_070_0709 377638 395423 Roadside 2015 0.848 51.1
MMM_073_0709 377612 395055 Roadside 2015 0.79 47.5
MMM_115_0709 383039 405755 Roadside 2015 0.848 42.1
MMM_126_0709 390635 410551 Roadside 2015 0.848 46.2
MMM_133_0709 373553 404789 Roadside 2015 0.848 47.7
MMM_174_0310 377485 394288 Roadside 2015 0.848 31.3
MMM_181_0513 374808 400359 Roadside 2015 0.848 55.7
MMM_182_0513 374853 400211 Roadside 2015 0.848 45.1
MMM_185_0513 374787 400288 Roadside 2015 0.848 40.9
MMM_186_0513 374682 400196 Roadside 2015 0.848 43.8
MMM_187_0513 374682 400124 Roadside 2015 0.848 50.5
MMM_190_0513 374743 399873 Roadside 2015 0.848 45.6
MMM_191_0513 374756 399892 Roadside 2015 0.848 44.4
MMM_198_0513 374986 400166 Roadside 2015 0.848 37.0
MMM_199_0513 375062 400159 Roadside 2015 0.848 40.7
MMM_200_0513 375187 399753 Roadside 2015 0.848 44.2
MMM_202_0513 375129 399664 Roadside 2015 0.848 35.8
MMM_205_0513 374967 399523 Roadside 2015 0.848 52.7
MMM_207_0513 375304 399567 Roadside 2015 0.848 44.9
MMM_208_1013 380772 391717 Roadside 2015 0.848 33.1
MMM_209_1013 377181 396105 Roadside 2015 0.848 37.7
MMM_211_1013 376612 396325 Roadside 2015 0.848 51.7
MMM_212_1013 376514 396354 Roadside 2015 0.848 39.2
MMM_213_1013 375319 397599 Roadside 2015 0.848 36.5
MMM_217_1013 377013 399016 Roadside 2015 0.848 50.5
MMM_219_1013 373910 402155 Roadside 2015 0.848 26.3
MMM_220_1013 376038 401615 Roadside 2015 0.891 30.3
MMM_221_1013 375862 402623 Roadside 2015 0.848 45.0
MMM_222_1013 382153 407684 Roadside 2015 0.848 32.5
MMM_224_1013 381353 405143 Roadside 2015 0.848 45.7
MMM_225_1013 381232 404921 Roadside 2015 0.848 44.4
MMM_227_1013 384633 405073 Roadside 2015 0.848 42.8
MMM_228_1013 385329 405305 Roadside 2015 0.848 35.6
MMM_230_1013 386409 405603 Roadside 2015 0.85 33.5
MMM_231_1013 386870 405408 Roadside 2015 0.848 40.2
MMM_232_1013 386689 404744 Roadside 2015 0.848 36.2
MMM_234_1013 386817 405104 Roadside 2015 0.848 49.5
MMM_235_1013 387060 406194 Roadside 2015 0.848 57.2
MMM_237_1013 387065 406577 Roadside 2015 0.816 49.6
MMM_238_1013 387091 406600 Roadside 2015 0.816 44.9
MMM_240_1013 387357 406975 Roadside 2015 0.848 36.6

Phase 2 Air Quality Report
Phase 2 Air Quality Report v2.docx Page 75 of 104
Monitoring Site ID Ordnance Survey Grid Refs
Site Type Measurement Year
Annualisation Factor
2017 Equivalent
Annual Mean NO2 Concn
(µg/m³)
x y
MMM_245_1013 388157 407916 Roadside 2015 0.848 35.4
MMM_246_1013 387591 405930 Roadside 2015 0.84 47.9
MMM_247_1013 388605 406067 Roadside 2015 0.816 47.4
MMM_249_1013 390338 410484 Roadside 2015 0.848 44.8
MMM_250_1013 386534 409104 Roadside 2015 0.848 39.8
MMM_252_1013 385416 408320 Roadside 2015 0.84 57.1
A63CS_013_0614 509035 428235 Roadside 2015 0.989 40.8
A63CS_014_0614 508534 428023 Roadside 2015 1.01 45.8
A63CS_015_0614 508574 428042 Roadside 2015 0.989 42.6
A63CS_016_0614 508663 428069 Roadside 2015 1.133 53.8
A63CS_017_0614 508822 428137 Roadside 2015 0.937 39.6
A63CS_018_0614 508738 428094 Roadside 2015 1.133 60.8
A63CS_019_0614 508911 428177 Roadside 2015 0.989 40.9
A63CS_020_0614 508917 428130 Roadside 2015 0.989 55.7
A63CS_021_0614 508739 428062 Roadside 2015 0.858 56.9
A63CS_022_0614 508793 428086 Roadside 2015 0.989 63.7
A63CS_023_0614 508947 428231 Roadside 2015 0.989 33.9
A63CS_024_0614 508529 428033 Roadside 2015 0.989 41.1
A63CS_025_0614 508657 428114 Roadside 2015 0.989 37.3
A63CS_026_0614 508755 428137 Roadside 2015 0.989 37.2
A63CS_027_0614 508825 428156 Roadside 2015 0.989 38.2
A63CS_028_1014 505099 427803 Roadside 2015 1.158 41.2
A63CS_029_1014 506854 428708 Roadside 2015 1.086 34.9
A63CS_033_1014 508414 428654 Roadside 2015 1.086 51.9
A63CS_034_1014 511271 429373 Roadside 2015 1.158 53.9
A63CS_035_1014 511259 429300 Roadside 2015 1.086 52.8
A63CS_036_1014 511917 430655 Roadside 2015 1.086 51.3
A63CS_037_1014 509005 429334 Roadside 2015 1.086 46.7
A63CS_038_1014 505819 428796 Roadside 2015 1.086 34.7
A63CS_044_1014 509860 428457 Roadside 2015 1.086 44.6
A63CS_045_1014 509716 428472 Roadside 2015 1.086 43.9
A63CS_046_1014 509927 428454 Roadside 2015 1.086 53.6
MMM_265_0214 375309 401397 Roadside 2015 0.816 65.9
MMM_266_0214 387074 406176 Roadside 2015 0.816 53.4
MMM_256_0114 387123 406688 Roadside 2015 0.816 50.2
MMM_257_0114 387535 407175 Roadside 2015 0.816 39.5
MMM_263_0314 376820 396232 Roadside 2015 0.816 34.4
MMM_264_0314 374418 401239 Roadside 2015 0.816 33.4
MMM_010_0709 375340 401259 Roadside 2015 0.816 39.7
MMM_258_0214 387711 407357 Roadside 2015 0.816 41.4
MMM_259_0114 387838 407493 Roadside 2015 0.816 45.5
MMM_260_0114 388076 407818 Roadside 2015 0.816 33.1
MMM_267_0214 389380 406190 Roadside 2015 0.816 43.8
MMM_022_0709 374634 400265 Roadside 2015 0.816 50.9
MMM_023_0709 374624 400049 Roadside 2015 0.816 60.6
MMM_021_0709 374673 399911 Roadside 2015 0.816 61.3
MMM_261_0314 382320 405738 Roadside 2015 0.791 34.1
MMM_262_0414 374681 400052 Roadside 2015 0.816 45.8
MMM_268_0714 372275 401153 Roadside 2015 0.816 20.4

Phase 2 Air Quality Report
Phase 2 Air Quality Report v2.docx Page 76 of 104
Monitoring Site ID Ordnance Survey Grid Refs
Site Type Measurement Year
Annualisation Factor
2017 Equivalent
Annual Mean NO2 Concn
(µg/m³)
x y
MMM_269_0714 373330 401442 Roadside 2015 0.816 23.4
MMM_272_0714 374674 401861 Roadside 2015 0.811 27.4
MMM_275_0714 375976 399233 Roadside 2015 0.816 37.9
MMM_057_0709 375603 397870 Roadside 2015 0.816 55.9
MMM_168_0310 377552 394397 Roadside 2015 0.816 43.7
MMM_017_0709 375422 401646 Roadside 2015 0.816 30.8
MMM_176_0310 377437 394337 Roadside 2015 0.816 26.1
MMM_024_0709 375479 399320 Roadside 2015 0.816 41.9
MMM_025_0709 375409 399286 Roadside 2015 0.816 44.2
MMM_026_0709 375675 399217 Roadside 2015 0.816 46.7
MMM_027_0709 375118 398500 Roadside 2015 0.857 38.0
MMM_047_0709 373994 401953 Roadside 2015 0.816 37.1
MMM_050_0709 374230 401677 Roadside 2015 0.816 40.8
MMM_051_0709 376272 401507 Roadside 2015 0.816 34.9
MMM_053_0709 375145 401909 Roadside 2015 0.816 30.8
MMM_054_0709 375046 401919 Roadside 2015 0.816 33.0
MMM_055_0709 375220 397636 Roadside 2015 0.816 65.2
MMM_061_0709 373684 400780 Roadside 2015 0.816 50.9
MMM_064_0709 376388 396310 Roadside 2015 0.816 45.4
MMM_068_0709 377571 395436 Roadside 2015 0.816 35.3
MMM_072_0709 377498 395044 Roadside 2015 0.816 35.3
MMM_077_0709 377593 394377 Roadside 2015 0.816 38.1
A556_11_0215 382128 389294 Roadside 2015 0.945 31.6
A556_9_0215 382485 389146 Roadside 2015 1.001 40.0
A556_26A_0215 382432 389034 Roadside 2015 1.136 46.6
A556_26B_0215 382432 389034 Roadside 2015 1.034 50.6
A556_26C_0215 382432 389034 Roadside 2015 1.066 50.7
A556_8_0215 383359 388737 Roadside 2015 1.001 30.1
A556_19_0215 382860 388865 Roadside 2015 1.001 56.0
A556_20_0215 382753 388905 Roadside 2015 1.005 34.3
A556_6_0215 382110 388471 Roadside 2015 1.016 47.3
A556_22A_0215 381894 388217 Roadside 2015 1.001 57.6
A556_22B_0215 381894 388217 Roadside 2015 1.001 57.7
A556_22C_0215 381894 388217 Roadside 2015 0.963 59.2
A556_25A_0215 381929 388171 Roadside 2015 1.001 62.2
A556_25B_0215 381929 388171 Roadside 2015 1.001 64.3
A556_25C_0215 381929 388171 Roadside 2015 0.973 64.8
A556_13_0215 381826 388249 Roadside 2015 1.001 32.1
A556_12_0215 382073 388728 Roadside 2015 1.001 28.7
A556_14_0215 381759 387869 Roadside 2015 0.963 33.1
A556_15_0215 381699 387625 Roadside 2015 1.001 30.5
A556_24A_0215 381708 387622 Roadside 2015 1.001 29.4
A556_24B_0215 381708 387622 Roadside 2015 0.972 30.9
A556_24C_0215 381708 387622 Roadside 2015 0.945 30.2
A556_16_0215 381497 387152 Roadside 2015 1.001 31.3
A556_17_0215 381188 386762 Roadside 2015 1.001 41.0
A556_5_0215 381826 387671 Roadside 2015 1.001 38.4
A556_4_0215 381713 387323 Roadside 2015 1.001 36.1
A556_3_0215 381603 387115 Roadside 2015 1.001 43.0
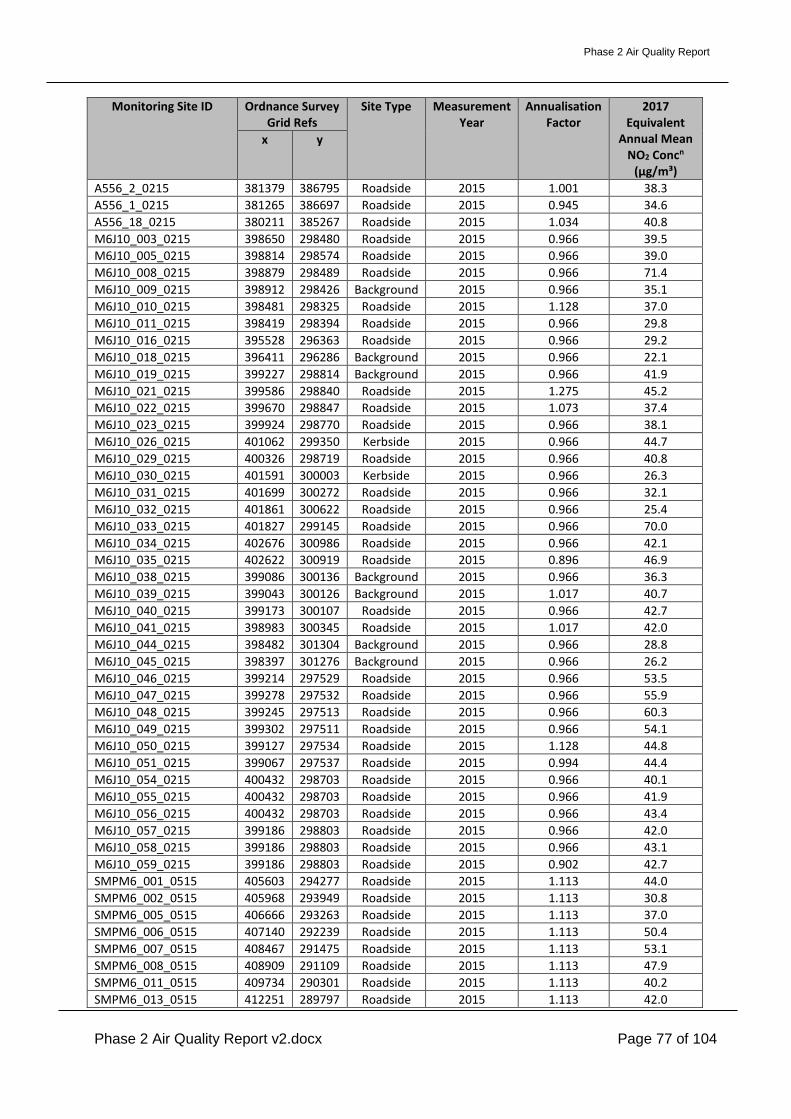
Phase 2 Air Quality Report
Phase 2 Air Quality Report v2.docx Page 77 of 104
Monitoring Site ID Ordnance Survey Grid Refs
Site Type Measurement Year
Annualisation Factor
2017 Equivalent
Annual Mean NO2 Concn
(µg/m³)
x y
A556_2_0215 381379 386795 Roadside 2015 1.001 38.3
A556_1_0215 381265 386697 Roadside 2015 0.945 34.6
A556_18_0215 380211 385267 Roadside 2015 1.034 40.8
M6J10_003_0215 398650 298480 Roadside 2015 0.966 39.5
M6J10_005_0215 398814 298574 Roadside 2015 0.966 39.0
M6J10_008_0215 398879 298489 Roadside 2015 0.966 71.4
M6J10_009_0215 398912 298426 Background 2015 0.966 35.1
M6J10_010_0215 398481 298325 Roadside 2015 1.128 37.0
M6J10_011_0215 398419 298394 Roadside 2015 0.966 29.8
M6J10_016_0215 395528 296363 Roadside 2015 0.966 29.2
M6J10_018_0215 396411 296286 Background 2015 0.966 22.1
M6J10_019_0215 399227 298814 Background 2015 0.966 41.9
M6J10_021_0215 399586 298840 Roadside 2015 1.275 45.2
M6J10_022_0215 399670 298847 Roadside 2015 1.073 37.4
M6J10_023_0215 399924 298770 Roadside 2015 0.966 38.1
M6J10_026_0215 401062 299350 Kerbside 2015 0.966 44.7
M6J10_029_0215 400326 298719 Roadside 2015 0.966 40.8
M6J10_030_0215 401591 300003 Kerbside 2015 0.966 26.3
M6J10_031_0215 401699 300272 Roadside 2015 0.966 32.1
M6J10_032_0215 401861 300622 Roadside 2015 0.966 25.4
M6J10_033_0215 401827 299145 Roadside 2015 0.966 70.0
M6J10_034_0215 402676 300986 Roadside 2015 0.966 42.1
M6J10_035_0215 402622 300919 Roadside 2015 0.896 46.9
M6J10_038_0215 399086 300136 Background 2015 0.966 36.3
M6J10_039_0215 399043 300126 Background 2015 1.017 40.7
M6J10_040_0215 399173 300107 Roadside 2015 0.966 42.7
M6J10_041_0215 398983 300345 Roadside 2015 1.017 42.0
M6J10_044_0215 398482 301304 Background 2015 0.966 28.8
M6J10_045_0215 398397 301276 Background 2015 0.966 26.2
M6J10_046_0215 399214 297529 Roadside 2015 0.966 53.5
M6J10_047_0215 399278 297532 Roadside 2015 0.966 55.9
M6J10_048_0215 399245 297513 Roadside 2015 0.966 60.3
M6J10_049_0215 399302 297511 Roadside 2015 0.966 54.1
M6J10_050_0215 399127 297534 Roadside 2015 1.128 44.8
M6J10_051_0215 399067 297537 Roadside 2015 0.994 44.4
M6J10_054_0215 400432 298703 Roadside 2015 0.966 40.1
M6J10_055_0215 400432 298703 Roadside 2015 0.966 41.9
M6J10_056_0215 400432 298703 Roadside 2015 0.966 43.4
M6J10_057_0215 399186 298803 Roadside 2015 0.966 42.0
M6J10_058_0215 399186 298803 Roadside 2015 0.966 43.1
M6J10_059_0215 399186 298803 Roadside 2015 0.902 42.7
SMPM6_001_0515 405603 294277 Roadside 2015 1.113 44.0
SMPM6_002_0515 405968 293949 Roadside 2015 1.113 30.8
SMPM6_005_0515 406666 293263 Roadside 2015 1.113 37.0
SMPM6_006_0515 407140 292239 Roadside 2015 1.113 50.4
SMPM6_007_0515 408467 291475 Roadside 2015 1.113 53.1
SMPM6_008_0515 408909 291109 Roadside 2015 1.113 47.9
SMPM6_011_0515 409734 290301 Roadside 2015 1.113 40.2
SMPM6_013_0515 412251 289797 Roadside 2015 1.113 42.0

Phase 2 Air Quality Report
Phase 2 Air Quality Report v2.docx Page 78 of 104
Monitoring Site ID Ordnance Survey Grid Refs
Site Type Measurement Year
Annualisation Factor
2017 Equivalent
Annual Mean NO2 Concn
(µg/m³)
x y
SMPM6_014_0515 413302 290060 Roadside 2015 1.113 35.2
SMPM6_015_0515 414585 290038 Roadside 2015 1.113 32.2
SMPM6_017_0515 419714 288532 Roadside 2015 1.054 42.6
SMPM6_018_0515 422809 290805 Rural
Background 2015 1.112 16.4
SMPM6_019_0515 435114 287771 Roadside 2015 1.235 27.8
SMPM6_020_0515 447882 336189 Roadside 2015 1.059 24.7
SMPM6_021_0515 433991 283523 Roadside 2015 1.408 45.4
SMPM6_023_0515 432229 282055 Roadside 2015 1.177 31.8
SMPM6_024_0515 434323 285309 Roadside 2015 1.22 44.1
SMPM6_025_0515 434326 282938 Roadside 2015 1.235 31.6
A19NortWin_004_0115 445558 522450 Roadside 2015 0.823 30.0
A19NortWin_005_0115 445290 523485 Roadside 2015 0.823 36.3
A19NortWin_006_0115 444106 524422 Roadside 2015 0.823 27.3
A19NortWin_007_0115 444132 524588 Roadside 2015 0.823 25.9
A19NortWin_009_0115 444175 521335 Background 2015 0.775 18.0
A19NortWin_010_0115 445529 521102 Roadside 2015 0.823 29.8
A19NortWin_012_0115 445138 522048 Roadside 2015 0.812 22.4
A19NortWin_013_0115 445151 521650 Roadside 2015 0.823 18.5
A19NortWin_014A_0115 441625 513674
Triplicate Colocation
/ Background 2015 0.823 16.7
A19NortWin_014B_0115 441625 513674
Triplicate Colocation
/ Background 2015 0.823 16.4
A19NortWin_014C_0115 441625 513674
Triplicate Colocation
/ Background 2015 0.823 16.4
A1SNB_001_0315 423633 572826 Roadside 2015 0.944 27.5
A1SNB_002_0315 422631 569785 Roadside 2015 1.094 17.4
A1SNB_004_0315 422320 569274 Roadside 2015 1.094 19.4
A1SNB_005_0315 422060 568938 Roadside 2015 1.273 16.3
A1SNB_006_0315 422193 569371 Roadside 2015 1.094 17.6
A1SNB_108_0315 421694 568375 Roadside 2015 0.938 29.6
A1SNB_208_0315 421694 568375 Roadside 2015 0.909 30.7
A1SNB_308_0315 421694 568375 Roadside 2015 0.898 29.2
A1SNB_010_0315 421138 567620 Roadside 2015 0.962 25.6
A1SNB_112_0315 420799 567275 Roadside 2015 0.962 26.9
A1SNB_212_0315 420799 567275 Roadside 2015 0.962 25.7
A1SNB_312_0315 420799 567275 Roadside 2015 0.962 26.4
A1SNB_013_0315 421110 567751 Roadside 2015 1.094 21.2
A1SNB_014_0315 421151 568321 Roadside 2015 1.067 19.2
A1SNB_015_0315 420346 566962 Roadside 2015 0.973 26.9
A1SNB_018_0315 419936 565888 Roadside 2015 0.962 27.1
A1SNB_019_0315 419831 565565 Roadside 2015 1.018 24.1
A1SNB_020_0315 419602 565356 Roadside 2015 0.916 33.2

Phase 2 Air Quality Report
Phase 2 Air Quality Report v2.docx Page 79 of 104
Monitoring Site ID Ordnance Survey Grid Refs
Site Type Measurement Year
Annualisation Factor
2017 Equivalent
Annual Mean NO2 Concn
(µg/m³)
x y
A1SNB_021_0315 419567 565288 Roadside 2015 0.978 40.0
A1SNB_022_0315 419534 565349 Roadside 2015 0.974 28.2
A1SNB_023_0315 419444 565152 Roadside 2015 0.93 38.5
A1SNB_024_0315 419390 564847 Roadside 2015 0.951 31.4
A1SNB_127_0315 419732 565787 Roadside 2015 1.018 29.1
A1SNB_227_0315 419732 565787 Roadside 2015 0.962 29.7
A1SNB_327_0315 419732 565787 Roadside 2015 0.962 29.8
A1SNB_028_0315 419799 562488 Roadside 2015 0.962 23.3
A1SNB_029_0315 420750 562177 Roadside 2015 1.094 20.6
A1SNB_035_0315 419649 565469 Roadside 2015 0.817 34.5
A1SNB_036_0315 419502 565130 Roadside 2015 0.836 32.5
A1SNB_038_0315 419556 565407 Roadside 2015 0.824 37.8
A1SNB_039_0315 419491 565268 Roadside 2015 0.836 36.4
S3_003_0315 422918 561682 Roadside 2015 1.018 24.4
S4_004_0315 423102 561534 Roadside 2015 1.023 24.5
S5_005_0315 422982 561719 Roadside 2015 0.962 29.6
S6A_106_0315 423242 561530 Roadside 2015 0.962 31.3
S6B_206_0315 423242 561530 Roadside 2015 0.962 30.5
S6C_306_0315 423242 561530 Roadside 2015 0.962 31.1
S9_009_0315 423772 560474 Roadside 2015 0.973 23.7
S10_010_0315 424726 558532 Roadside 2015 0.954 25.7
S12_012_0315 427083 557303 Roadside 2015 1.018 23.1
S13_013_0315 427529 557070 Roadside 2015 0.961 27.0
S14_014_0315 428056 556442 Roadside 2015 0.974 22.6
S15_015_0315 427883 556866 Roadside 2015 1.039 25.4
S16A_116_0315 428273 553875 Roadside 2015 0.962 26.7
S16B_216_0315 428273 553875 Roadside 2015 0.962 26.4
S16C_316_0315 428273 553875 Roadside 2015 0.962 25.6
S19_019_0315 430301 543920 Roadside 2015 0.98 28.2
S20A_120_0315 430164 543025 Roadside 2015 0.962 30.0
S20B_220_0315 430164 543025 Roadside 2015 0.962 30.1
S20C_320_0315 430164 543025 Roadside 2015 0.962 30.0
S21_021_0315 431229 538568 Roadside 2015 1.094 15.0
A1BC_123_0315 425436 563568 Roadside 2015 0.941 35.0
A1BC_223_0315 425436 563568 Roadside 2015 0.952 34.2
A1BC_323_0315 425436 563568 Roadside 2015 0.966 34.3
A1BC_026_0815 423178 561586 Roadside 2015 0.836 32.6
M3J2J4a_013_0715 486858 158322 Urban 2015 1.091 49.1
01_M1_J34-35SB_N 438328 393100 Roadside 2016 0.967 52.7
03_M1_J33-34SB_N 441485 389417 Roadside 2016 0.808 45.3
04_M1_J30-31NB_N 447923 380190 Roadside 2016 0.965 52.1
05_M1_J30-31SB_N 447933 380002 Roadside 2016 0.965 84.9
06_M1_J28-29SB_N 445236 356527 Roadside 2016 0.931 44.9
07_M1_J28-29NB_N 444855 360135 Roadside 2016 0.931 46.0
08_M1_J28-29SB_N 444918 361116 Roadside 2016 0.931 49.1
10_M1_J27-28SB_N 446501 355249 Roadside 2016 0.916 32.2
A12A120_001_0116 595785 225176 Roadside 2016 1.054 26.9
A12A120_002_0116 595399 225136 Roadside 2016 1.088 26.1
A12A120_003_0116 594807 224971 Roadside 2016 1.054 29.4

Phase 2 Air Quality Report
Phase 2 Air Quality Report v2.docx Page 80 of 104
Monitoring Site ID Ordnance Survey Grid Refs
Site Type Measurement Year
Annualisation Factor
2017 Equivalent
Annual Mean NO2 Concn
(µg/m³)
x y
A12A120_004_0116 595694 225298 Roadside 2016 1.057 31.1
A12A120_005_0116 595000 225177 Roadside 2016 1.054 34.0
A12A120_006_0116 594565 225413 Roadside 2016 1.028 41.1
A12A120_007_0116 593258 224712 Roadside 2016 1.054 19.4
A12A120_010_0116 591506 223584 Roadside 2016 1.054 44.7
A12A120_012_0116 591401 223653 Roadside 2016 1.104 31.9
A12A120_013_0116 591324 223437 Roadside 2016 1.054 34.1
A12A120_014_0116 591110 223222 Roadside 2016 1.041 34.5
A12A120_016_0116 590810 223530 Roadside 2016 1.146 24.2
A12A120_019_0116 587419 219895 Roadside 2016 1.054 30.7
A12A120_020_0116 587620 218941 Roadside 2016 1.054 36.3
A12A120_021_0116 587815 218737 Roadside 2016 1.054 24.8
A12A120_024_0116 585474 217833 Roadside 2016 1.054 30.2
A12A120_026_0116 582404 213383 Roadside 2016 1.054 33.1
A12A120_027_0116 582423 213231 Roadside 2016 1.054 26.5
A12A120_028_0116 582454 214930 Roadside 2016 1.054 39.9
A12A120_029_0116 579528 212004 Roadside 2016 1.054 28.7
A12A120_030_0116 578789 211688 Roadside 2016 1.088 36.9
A12A120_031_0116 578727 211747 Roadside 2016 1.054 35.9
A12A120_032_0116 579121 211971 Roadside 2016 1.054 26.1
A12A120_033_0116 581693 213080 Roadside 2016 1.1 23.0
A12Chel_001_0116 576445 210687 Roadside 2016 1.054 32.4
A12Chel_002_0116 576114 210732 Roadside 2016 1.054 32.6
A12Chel_003_0116 575201 210108 Roadside 2016 1.054 34.1
A12Chel_004_0116 573995 207957 Roadside 2016 1.022 30.0
A12Chel_007_0116 574956 205512 Roadside 2016 1.054 22.9
A12Chel_008_0116 574615 204669 Roadside 2016 1.028 23.9
A12Chel_010_0116 573232 202621 Roadside 2016 1.054 24.7
A12Chel_012_0116 570480 201746 Roadside 2016 1.054 31.4
A12Chel_014_0116 570708 201232 Roadside 2016 1.054 21.0
A12Chel_016_0116 566809 202152 Roadside 2016 1.054 31.3
A12Chel_017_0116 566776 201944 Roadside 2016 1.054 24.1
A12Chel_018_0116 564529 199891 Roadside 2016 1.054 23.7
A12Chel_019_0116 565191 200077 Roadside 2016 1.054 37.2
A12Chel_020_0116 563758 198337 Roadside 2016 1.057 39.0
A12Chel_021_0116 563260 197561 Roadside 2016 1.054 34.7
A12Chel_022_0116 562596 196918 Roadside 2016 0.998 27.7
A12Chel_023_0116 561300 195910 Roadside 2016 1.054 43.7
A12Chel_024_0116 558695 194891 Roadside 2016 0.998 48.5
A12Chel_026_0116 571644 207184 Roadside 2016 1.091 34.0
A12Chel_027_0116 571644 207184 Roadside 2016 1.054 33.5
A12Chel_028_0116 571644 207184 Roadside 2016 1.091 33.1
A14J10a_003_0116 490634 276569 Roadside 2016 1.033 23.7
A14J10a_004_0116 489402 276005 Roadside 2016 0.995 27.9
A14J10a_005_0116 489532 276053 Roadside 2016 0.963 25.7
A14J10a_006_0116 490608 275709 Roadside 2016 0.999 27.7
A14J10a_008_0116 492638 276908 Roadside 2016 0.999 22.0
A14J10a_009_0116 492460 276901 Roadside 2016 0.999 19.5
A14J10a_010_0116 489632 276316 Roadside 2016 0.999 37.3

Phase 2 Air Quality Report
Phase 2 Air Quality Report v2.docx Page 81 of 104
Monitoring Site ID Ordnance Survey Grid Refs
Site Type Measurement Year
Annualisation Factor
2017 Equivalent
Annual Mean NO2 Concn
(µg/m³)
x y
A14J10a_011_0116 489631 276285 Roadside 2016 1.033 37.9
A14J10a_012_0116 488887 275842 Roadside 2016 0.999 31.2
A14J10a_013_0116 495994 278090 Roadside 2016 0.962 35.0
A14J10a_014_0116 485564 277923 Roadside 2016 0.999 44.0
A14J10a_015_0116 485699 277399 Roadside 2016 1.02 27.0
A14J10a_016_0116 486499 276840 Roadside 2016 0.999 31.3
A14J10a_018_0116 489814 275321 Roadside 2016 0.999 31.0
A14J10a_020_0116 487309 276366 Roadside 2016 0.926 23.5
A14J10a_022_0116 492175 276591 Roadside 2016 0.999 23.1
A1MDB_1_1215 460143 393263 Roadside 2016 0.889 38.4
A1MDB_11_1215 455196 400245 Suburban 2016 0.889 33.8
A1MDB_13_1215 455533 400904 Roadside 2016 0.889 43.9
A1MDB_17_1215 454520 400673 Kerbside 2016 0.889 56.7
A1MDB_18_1215 452893 399350 Roadside 2016 0.889 32.9
A1MDB_19_1215 454748 401101 Suburban 2016 0.889 38.0
A1MDB_2_1215 460027 393471 Suburban 2016 0.889 29.5
A1MDB_20_1215 454645 401057 Suburban 2016 0.889 32.5
A1MDB_22_1215 454764 402218 Suburban 2016 0.889 29.1
A1MDB_24_1215 454907 402511 Suburban 2016 0.889 36.7
A1MDB_3_1215 459738 393915 Suburban 2016 0.889 24.7
A1MDB_4_1215 457555 397063 Rural 2016 0.916 26.7
A1MDB_5_1215 457285 398808 Suburban 2016 0.889 31.8
A1MDB_8_1215 456101 399172 Suburban 2016 0.916 29.9
A1MDB_9_1215 456119 399239 Suburban 2016 0.889 36.8
A1Red_1_1215 451943 407384 Roadside 2016 0.859 29.7
A1Red_12_1215 449129 416927 Roadside 2016 0.812 25.3
A1Red_15_1215 448944 419875 Roadside 2016 0.812 35.7
A1Red_16_1215 448836 419818 Roadside 2016 0.812 30.8
A1Red_18_1215 448994 420244 Roadside 2016 0.812 32.0
A1Red_20_1215 448480 423458 Roadside 2016 0.812 40.4
A1Red_21_1215 448277 423545 Suburban 2016 0.772 30.0
A1Red_22_1215 448359 424038 Suburban 2016 0.812 27.3
A1Red_23_1215 447379 423741 Suburban 2016 0.812 36.9
A1Red_27_1215 448657 425619 Roadside 2016 0.812 31.7
A1Red_28_1215 448543 426087 Roadside 2016 0.853 24.0
A1Red_29_1215 447451 427466 Suburban 2016 0.812 23.6
A1Red_4_1215 452897 408775 Suburban 2016 0.859 24.7
A1Red_5_1215 452534 409355 Roadside 2016 0.859 34.9
A1Red_6a_1215 452177 410379 Roadside 2016 0.81 41.8
A1Red_6b_1215 452177 410379 Roadside 2016 0.81 41.7
A1Red_6c_1215 452177 410379 Roadside 2016 0.81 44.1
A1Red_7_1215 451762 412035 Roadside 2016 0.859 35.6
A1Red_8_1215 451546 412605 Roadside 2016 0.859 58.6
A1Red_9_1215 449115 413125 Roadside 2016 0.859 27.4
A27Ar_001_0116 506634 105686 Roadside 2016 1.011 30.4
A27Ar_002_0116 506597 105740 Roadside 2016 1.011 27.6
A27Ar_003_0116 506241 105766 Roadside 2016 1.011 33.8
A27Ar_004_0116 506041 105688 Roadside 2016 1.011 28.1
A27Ar_005_0116 505361 105703 Roadside 2016 1.011 20.8

Phase 2 Air Quality Report
Phase 2 Air Quality Report v2.docx Page 82 of 104
Monitoring Site ID Ordnance Survey Grid Refs
Site Type Measurement Year
Annualisation Factor
2017 Equivalent
Annual Mean NO2 Concn
(µg/m³)
x y
A27Ar_006_0116 504713 105832 Roadside 2016 1.011 36.8
A27Ar_007_0116 504319 105888 Roadside 2016 1.011 19.0
A27Ar_009_0116 502343 106545 Roadside 2016 1.011 31.5
A27Ar_016_0116 501651 106644 Roadside 2016 1.011 30.6
A27Ar_018_0116 501479 106709 Roadside 2016 1.011 19.3
A27Ar_019_0116 501538 106749 Roadside 2016 1.011 23.2
A27Ar_022_0116 501333 106998 Roadside 2016 1.054 37.5
A27Ar_023_0116 501026 107057 Roadside 2016 1.011 56.0
A27Ar_024_0116 500603 107067 Roadside 2016 1.011 29.0
A27Ar_025_0116 500177 107215 Roadside 2016 1.011 35.8
A27Ar_028_0116 495329 107185 Roadside 2016 1.065 36.4
A27Ar_029_0116 498840 107368 Roadside 2016 1.011 25.0
A27Ar_033_0116 500041 107347 Roadside 2016 1.011 22.3
A27Wort_001_0116 510408 105674 Roadside 2016 1.011 38.3
A27Wort_002_0116 511408 105839 Roadside 2016 1.011 32.9
A27Wort_003_0116 511845 105781 Roadside 2016 1.011 21.8
A27Wort_005_0116 513735 105344 Roadside 2016 1.011 47.0
A27Wort_008_0116 514409 105000 Roadside 2016 1.011 29.4
A27Wort_009_0116 515205 105114 Roadside 2016 1.011 35.5
A27Wort_010_0116 515389 105168 Roadside 2016 1.011 33.4
A27Wort_012_0116 515610 105349 Roadside 2016 1.011 18.9
A27Wort_013_0116 517290 105551 Roadside 2016 1.011 42.2
A27Wort_015_0116 516170 105467 Roadside 2016 1.011 23.9
A27Wort_016_0116 517037 105510 Roadside 2016 1.029 24.9
A27Wort_017_0116 518448 105458 Roadside 2016 1.01 42.4
A27Wort_018_0116 518454 105441 Roadside 2016 1.01 60.7
A27Wort_021_0116 517329 105522 Roadside 2016 1.011 30.4
A27Wort_022_0116 517996 105435 Roadside 2016 0.957 24.5
A27Wort_023_0116 520075 106077 Roadside 2016 1.011 41.1
A27Wort_024_0116 521852 106550 Roadside 2016 1.011 24.9
A27Wort_025_0116 522605 106492 Roadside 2016 1.011 20.9
A27Wort_026_0116 514184 104965 Roadside 2016 1.011 50.5
A27Wort_027_0116 514184 104965 Roadside 2016 1.065 52.6
A27Wort_028_0116 514184 104965 Roadside 2016 1.011 49.9
A27Wort_030_0116 512514 105770 Roadside 2016 1.011 27.5
A303AMES_002_1215 416665 143663 Roadside 2016 0.852 21.2
A303AMES_003_1215 417800 143035 Roadside 2016 0.818 10.9
A303AMES_004_1215 418596 143452 Roadside 2016 0.852 19.4
A303AMES_005_1215 418217 142290 Roadside 2016 0.852 24.0
A303AMES_007_1215 415976 142114 Kerbside 2016 0.852 15.0
A303AMES_009_1215 415285 141308 Kerbside 2016 0.852 10.7
A303AMES_010_1215 411797 141854 Roadside 2016 0.852 24.2
A303AMES_013_1215 407625 141021 Kerbside 2016 0.852 12.1
A303AMES_015_1215 407126 139279 Roadside 2016 0.852 8.2
A303AMES_016_1215 407188 139548 Roadside 2016 0.852 9.3
A303AMES_017_1215 406876 140830 Roadside 2016 0.852 26.1
A303AMES_021_1215 400775 137712 Kerbside 2016 0.852 10.8
A303AMES_022_1215 400916 137307 Roadside 2016 0.852 7.9
A303AMES_023_1215 400410 137617 Kerbside 2016 0.852 10.4

Phase 2 Air Quality Report
Phase 2 Air Quality Report v2.docx Page 83 of 104
Monitoring Site ID Ordnance Survey Grid Refs
Site Type Measurement Year
Annualisation Factor
2017 Equivalent
Annual Mean NO2 Concn
(µg/m³)
x y
A303AMES_026_1215 394898 134845 Roadside 2016 0.852 19.1
A303AMES_027_1215 393362 134312 Roadside 2016 0.821 16.6
A303AMES_028_1215 391251 134488 Roadside 2016 0.852 37.8
A303AMES_029_1215 390996 134505 Kerbside 2016 0.852 25.6
A303AMES_030_1215 391137 132973 Roadside 2016 0.852 19.3
A303AMES_031_1215 389941 134289 Roadside 2016 0.872 19.7
A303AMES_032_1215 388633 133237 Roadside 2016 0.879 13.2
A303SPAR_001_1215 363096 126330 Roadside 2016 0.912718 13.1
A303SPAR_002_1215 360781 126516 Roadside 2016 0.912718 11.5
A303SPAR_003_1215 360913 126904 Roadside 2016 0.912718 13.1
A303SPAR_004_1215 360471 126423 Roadside 2016 0.912718 18.4
A303SPAR_005_1215 358967 125551 Roadside 2016 0.912718 19.4
A303SPAR_006_1215 357851 125391 Roadside 2016 0.912718 19.5
A303SPAR_008_1215 357724 125321 Roadside 2016 0.912718 25.2
A303SPAR_010_1215 356760 124922 Roadside 2016 0.912718 29.2
A303SPAR_011_1215 354621 125071 Roadside 2016 0.912718 14.2
A303SPAR_012_1215 354653 125228 Roadside 2016 0.912718 16.1
A303SPAR_013_1215 354326 123937 Roadside 2016 0.912718 13.5
A303SPAR_015_1215 349768 120271 Roadside 2016 0.912718 13.5
A30Chi_001_1215 189590 56688 Roadside 2016 0.908 15.7
A30Chi_002_1215 188503 56284 Roadside 2016 0.937 37.3
A30Chi_004_1215 188689 56107 Roadside 2016 0.937 16.5
A30Chi_006_1215 186207 54629 Roadside 2016 0.937 14.8
A30Chi_007_1215 184842 54016 Roadside 2016 0.937 15.3
A30Chi_010_1215 179859 50297 Roadside 2016 0.937 25.0
A30Chi_011_1215 178501 48683 Roadside 2016 0.937 11.3
A30Chi_012_1215 175245 47516 Roadside 2016 0.937 24.8
A30Chi_013_1215 174838 46808 Roadside 2016 0.937 17.8
A30Chi_015_1215 174384 46279 Roadside 2016 0.937 13.6
A30Chi_018_1215 172815 45145 Roadside 2016 0.937 17.9
A30Chi_021_1215 171750 44117 Roadside 2016 0.937 12.9
A30Chi_022_1215 171207 43522 Roadside 2016 0.937 28.3
A30Chi_023_1215 170982 43549 Roadside 2016 0.937 20.1
A30Chi_025_1215 188174 55769 Roadside 2016 0.937 13.2
A30Chi_026a_1215 207190 67100 Roadside 2016 0.908 35.1
A30Chi_026b_1215 207190 67100 Roadside 2016 0.908 33.6
A30Chi_026c_1215 207190 67100 Roadside 2016 0.908 32.7
A31RING_001_1215 413084 104258 Roadside 2016 0.88936 31.2
A31RING_003_1215 413033 104373 Roadside 2016 0.88936 16.3
A31RING_004_1215 413317 104531 Roadside 2016 0.88936 26.9
A31RING_005_1215 413815 104790 Roadside 2016 0.88936 33.2
A31RING_006_1215 414458 105328 Roadside 2016 0.88936 40.1
A31RING_007_1215 415142 104825 Kerbside 2016 0.88936 16.7
A31RING_008_1215 415117 105136 Roadside 2016 0.841152 16.9
A31RING_009_1215 415315 105615 Roadside 2016 0.88936 32.2
A31RING_010_1215 414964 105816 Kerbside 2016 0.88936 22.1
A31RING_012_1215 416295 105580 Kerbside 2016 0.88936 20.1
A31RING_013_1215 415752 105504 Roadside 2016 0.950099 27.8
A31RING_014_1215 416599 105627 Roadside 2016 0.88936 20.3

Phase 2 Air Quality Report
Phase 2 Air Quality Report v2.docx Page 84 of 104
Monitoring Site ID Ordnance Survey Grid Refs
Site Type Measurement Year
Annualisation Factor
2017 Equivalent
Annual Mean NO2 Concn
(µg/m³)
x y
A31RING_015_1215 418050 105840 Roadside 2016 0.88936 23.5
A31RING_016_1215 419071 106140 Roadside 2016 0.88936 29.0
A31RING_017_1215 419179 105943 Roadside 2016 0.88936 20.8
A31RING_018_1215 418483 105732 Roadside 2016 0.88936 22.4
A31RING_020_1215 420916 103205 Roadside 2016 0.88936 18.9
A34OJ_001_0116 449829 212461 Roadside 2016 1.094117 25.8
A34OJ_002_0116 449682 212934 Roadside 2016 1.082686 20.8
A34OJ_003_0116 448046 212432 Roadside 2016 1.180128 17.3
A34OJ_010_0116 448774 205928 Roadside 2016 1.094117 30.7
A34OJ_011_0116 448871 206206 Roadside 2016 1.094117 25.6
A34OJ_013_0116 450783 204101 Roadside 2016 1.110501 34.3
A358TAUN_002_1215 326875 124092 Roadside 2016 0.955037 57.2
A358TAUN_003_1215 328216 123062 Roadside 2016 0.878463 33.7
A358TAUN_004_1215 328686 122820 Rural 2016 0.878463 15.8
A358TAUN_006_1215 329261 122833 Roadside 2016 0.878463 13.7
A358TAUN_007_1215 331292 118003 Roadside 2016 0.878463 15.9
A358TAUN_008_1215 334015 115297 Roadside 2016 0.837817 31.8
A358TAUN_009_1215 334462 115283 Roadside 2016 0.878463 20.0
A358TAUN_010_1215 333589 115131 Roadside 2016 0.878463 30.0
A358TAUN_011_1215 333567 114205 Roadside 2016 0.878463 13.2
A358TAUN_012_1215 333884 114022 Roadside 2016 0.878463 18.3
A358TAUN_013_1215 333922 112433 Roadside 2016 0.900668 18.2
A358TAUN_015_1215 325260 125359 Suburban 2016 0.844589 21.9
A358TAUN_019_1215 329456 121206 Roadside 2016 0.905842 19.2
A358TAUN_020_1215 331254 118075 Roadside 2016 0.878463 32.2
A358TAUN_021_1215 331207 118087 Roadside 2016 0.878463 52.0
A358TAUN_022_1215 331235 118095 Roadside 2016 0.878463 52.5
A358TAUN_023_1215 332909 117267 Roadside 2016 0.878463 14.4
A358TAUN_024_1215 327711 127591 Roadside 2016 0.900668 33.6
A358TAUN_025_1215 332716 114493 Rural 2016 0.878463 8.6
A3Gui_001_1215 494691 147234 Roadside 2016 1.140335 42.2
A3Gui_004_1215 496675 148632 Roadside 2016 1.140335 35.9
A3Gui_005_1215 496950 148788 Roadside 2016 1.140335 32.8
A3Gui_006_1215 497191 148945 Roadside 2016 1.140335 34.1
A3Gui_007_1215 497731 149399 Roadside 2016 1.140335 31.9
A3Gui_008_1215 497738 149591 Roadside 2016 1.140335 112.3
A3Gui_009_1215 497884 150009 Roadside 2016 1.140335 69.4
A3Gui_010_1215 497933 150108 Roadside 2016 1.140335 70.2
A3Gui_011_1215 498058 150497 Roadside 2016 1.140335 34.6
A3Gui_012_1215 498213 150665 Roadside 2016 1.140335 37.1
A3Gui_013_1215 498113 150582 Roadside 2016 1.140335 56.3
A3Gui_017_1215 499421 150831 Roadside 2016 1.140335 42.0
A3Gui_018_1215 499794 151184 Roadside 2016 1.140335 40.0
A3Gui_019_1215 500805 151637 Roadside 2016 1.140335 26.7
A3Gui_020_1215 501570 152712 Roadside 2016 1.140335 34.0
A3Gui_021_1215 502002 152763 Roadside 2016 1.140335 30.2
A3Gui_022_1215 504001 154442 Roadside 2016 1.140335 38.0
A3Gui_023_1215 504053 154326 Roadside 2016 1.140335 41.4
A3Gui_024_1215 502159 152868 Roadside 2016 1.140335 37.1

Phase 2 Air Quality Report
Phase 2 Air Quality Report v2.docx Page 85 of 104
Monitoring Site ID Ordnance Survey Grid Refs
Site Type Measurement Year
Annualisation Factor
2017 Equivalent
Annual Mean NO2 Concn
(µg/m³)
x y
A3Gui_025_1215 499785 150684 Roadside 2016 1.140335 47.2
A3Gui_026_1215 498374 151355 Roadside 2016 1.140335 35.1
A3Gui_027_1215 498196 149889 Roadside 2016 1.140335 32.1
A3Gui_028_1215 501244 152538 Roadside 2016 1.140335 30.5
A417AB_003_1215 393030 215876 Roadside 2016 0.860067 39.9
A417AB_005_1215 394269 216375 Roadside 2016 0.860067 27.4
A417AB_007_1215 392618 214415 Roadside 2016 0.860067 24.9
A417AB_009_1215 390397 216488 Roadside 2016 0.84126 17.4
A417AB_012_1215 387925 217384 Roadside 2016 0.860067 29.7
A417AB_013_1215 388356 216802 Roadside 2016 0.860067 27.0
A417AB_015_1215 387454 217908 Roadside 2016 0.870216 31.9
A417AB_016_1215 388124 216931 Roadside 2016 0.860067 24.8
A417AB_020_1215 390190 216546 Roadside 2016 0.860067 19.2
A417AB_021a_1215 393431 216092 Roadside 2016 0.860067 49.0
A417AB_021b_1215 393431 216092 Roadside 2016 0.860067 49.7
A417AB_021c_1215 393431 216092 Roadside 2016 0.860067 50.9
A428BC_001_0116 516435 249598 Roadside 2016 0.980246 35.4
A428BC_002_0116 516435 249598 Roadside 2016 0.980246 35.0
A428BC_003_0116 516435 249598 Roadside 2016 0.980246 35.0
A428BC_004_0116 516384 256539 Roadside 2016 0.980246 49.1
A428BC_005_0116 516345 256280 Roadside 2016 0.980246 29.8
A428BC_006_0116 516367 256566 Roadside 2016 0.946708 29.6
A428BC_007_0116 516378 256571 Roadside 2016 0.980246 37.5
A428BC_008_0116 516408 256541 Roadside 2016 0.980246 46.3
A428BC_009_0116 516447 257038 Roadside 2016 0.980246 53.0
A428BC_010_0116 516350 259149 Roadside 2016 0.980246 22.4
A428BC_011_0116 516335 259338 Roadside 2016 0.980246 24.8
A428BC_012_0116 517128 260917 Roadside 2016 0.980246 29.4
A428BC_013_0116 518661 258270 Roadside 2016 0.980246 24.9
A428BC_014_0116 532339 260099 Roadside 2016 0.980246 16.6
A428BC_015_0116 518404 258463 Roadside 2016 0.980246 26.4
A428BC_016_0116 518965 258659 Roadside 2016 0.980246 24.0
A428BC_017_0116 518532 260312 Roadside 2016 0.980246 29.9
A428BC_019_0116 519568 260283 Roadside 2016 0.976694 28.8
A428BC_021_0116 521909 259908 Roadside 2016 0.980246 40.5
A428BC_022_0116 523238 259976 Roadside 2016 0.980246 29.7
A428BC_025_0116 518285 260779 Roadside 2016 0.947694 19.2
A428BC_026_0116 518435 261205 Roadside 2016 0.946708 19.3
A428BC_027_0116 516920 258380 Roadside 2016 0.980246 32.1
A45Stan_001_0116 499109 273529 Roadside 2016 0.999 21.9
A45Stan_002_0116 499021 272905 Background 2016 1.02 17.9
A45Stan_005_0116 494327 267946 Roadside 2016 0.999 23.8
A45Stan_006_0116 496188 269666 Roadside 2016 0.999 20.7
A45Stan_007_0116 496425 269050 Roadside 2016 0.999 19.0
A45Stan_008_0116 496691 267522 Roadside 2016 0.999 18.0
A45Stan_009_0116 496801 266971 Roadside 2016 0.999 16.0
A45Stan_011_0116 495684 269706 Roadside 2016 1.083 21.5
A45Stan_012_0116 495536 269566 Roadside 2016 0.999 21.3
A45Stan_013_0116 495340 269268 Roadside 2016 0.999 21.8

Phase 2 Air Quality Report
Phase 2 Air Quality Report v2.docx Page 86 of 104
Monitoring Site ID Ordnance Survey Grid Refs
Site Type Measurement Year
Annualisation Factor
2017 Equivalent
Annual Mean NO2 Concn
(µg/m³)
x y
A45Stan_014_0116 495866 268213 Roadside 2016 0.963 40.2
A45Stan_015_0116 495876 268204 Roadside 2016 0.999 30.8
A45Stan_016_0116 490273 266416 Roadside 2016 0.948 31.3
A45Stan_017_0116 489041 266014 Roadside 2016 0.995 20.5
A45Stan_018_0116 496397 270523 Roadside 2016 0.999 20.8
A46Cov_005_0116 438410 278903 Roadside 2016 1.005753 27.3
A46Cov_006_0116 438758 278123 Roadside 2016 0.963121 24.4
A46Cov_009_0116 438963 277640 Roadside 2016 1.0057 32.1
A46Cov_014_0116 436078 275873 Roadside 2016 0.963121 28.6
A46Cov_016_0116 433747 275429 Roadside 2016 0.963121 26.1
A46Cov_017_0116 433833 275283 Roadside 2016 0.963121 26.7
A46Cov_019_0116 431271 266404 Roadside 2016 0.963121 20.5
A46Cov_020_0116 437673 282807 Roadside 2016 0.963121 36.8
A46Cov_021_0116 431271 266404 Roadside 2016 0.963121 20.7
A46Cov_023_0116 431271 266404 Roadside 2016 1.0057 24.1
A46NNB_001_1215 481086 355814 Roadside 2016 0.912921 32.0
A46NNB_002_1215 481091 356285 Kerbside 2016 0.905924 30.1
A46NNB_005_1215 482404 356780 Roadside 2016 0.921456 28.4
A46NNB_007_1215 483280 357915 Roadside 2016 0.902193 19.7
A46NNB_008_1215 481111 355551 Roadside 2016 0.905924 39.4
A46NNB_009_1215 480620 355992 Roadside 2016 0.905924 24.3
A46NNB_012_1215 480896 355321 Roadside 2016 0.905924 31.1
A46NNB_015_1215 480350 354727 Kerbside 2016 0.905924 31.2
A46NNB_020_1215 480070 354229 Roadside 2016 0.905924 29.3
A46NNB_021_1215 479551 353829 Roadside 2016 0.905924 30.6
A46NNB_022_1215 479212 353376 Roadside 2016 0.894377 22.1
A46NNB_024_1215 478211 352569 Roadside 2016 0.921456 29.2
A46NNB_025_1215 477807 352217 Roadside 2016 0.905924 21.9
A46NNB_026_1215 477295 351780 Roadside 2016 0.905924 16.6
A46NNB_031_1215 497964 370373 Roadside 2016 0.905924 43.8
A46NNB_032_1215 497964 370373 Roadside 2016 0.905924 47.9
A46NNB_033_1215 497964 370373 Roadside 2016 0.905924 44.8
A47Wan_001_0116 524043 271528 Roadside 2016 0.963 59.8
A47Wan_002_0116 524043 271528 Roadside 2016 0.963 62.0
A47Wan_003_0116 524043 271528 Roadside 2016 0.963 64.5
A47Wan_006_0116 508327 298679 Roadside 2016 1.004 33.3
A47Wan_007_0116 515987 298899 Roadside 2016 1.004 21.1
A47Wan_008_0116 516056 298785 Roadside 2016 1.004 27.1
A47Wan_009_0116 509019 299776 Roadside 2016 1.004 18.8
A47Wan_011_0116 516163 299072 Roadside 2016 0.965 20.0
A47Wan_012_0116 516412 299220 Roadside 2016 1.004 25.7
A47Wan_013_0116 516435 299524 Roadside 2016 1.049 25.4
A47Wan_015_0116 518388 301754 Roadside 2016 1.004 30.2
A47Wan_017_0116 520338 301887 Roadside 2016 1.004 27.8
A47Wan_018_0116 516681 300485 Roadside 2016 1.004 24.6
A47Wan_019_0116 517516 299953 Roadside 2016 0.966 17.5
A47Wan_022_0116 509174 300070 Roadside 2016 1.004 13.1
A500EW_001_1215 388296 345830 Roadside 2016 0.887081 42.3
A500EW_004_1215 387681 345851 Suburban 2016 0.887081 36.7

Phase 2 Air Quality Report
Phase 2 Air Quality Report v2.docx Page 87 of 104
Monitoring Site ID Ordnance Survey Grid Refs
Site Type Measurement Year
Annualisation Factor
2017 Equivalent
Annual Mean NO2 Concn
(µg/m³)
x y
A500EW_005_1215 387581 345668 Roadside 2016 0.887081 37.6
A500EW_006_1215 387014 345724 Roadside 2016 0.887081 34.2
A500EW_007_1215 387001 345987 Suburban 2016 0.887081 36.8
A500EW_008_1215 386669 346276 Suburban 2016 0.887081 33.1
A500EW_009_1215 386587 346426 Suburban 2016 0.887081 39.3
A500EW_010_1215 386741 347074 Roadside 2016 0.887081 36.2
A500EW_011_1215 386154 347337 Suburban 2016 0.887081 26.1
A500EW_012_1215 385951 348410 Suburban 2016 0.887081 28.3
A500EW_014_1215 385719 349114 Roadside 2016 0.887081 34.4
A500EW_016_1215 385861 348935 Suburban 2016 0.887081 34.6
A500EW_017_1215 385740 349396 Roadside 2016 0.887081 48.0
A500EW_019a_1215 385780 349673 Roadside 2016 0.887081 38.7
A500EW_019b_1215 385780 349673 Roadside 2016 0.887081 38.0
A500EW_019c_1215 385780 349673 Roadside 2016 0.887081 38.4
A500EW_022_1215 383907 349657 Suburban 2016 0.887081 24.6
A500EW_023_1215 383880 349396 Suburban 2016 0.887081 25.2
A52NottJ_001_1215 465838 339544 Roadside 2016 0.894377 40.9
A52NottJ_002_1215 461940 337866 Roadside 2016 0.894377 45.1
A52NottJ_003_1215 460264 337476 Suburban 2016 0.894377 24.0
A52NottJ_004_1215 459658 337537 Roadside 2016 0.865167 33.2
A52NottJ_005_1215 460546 337271 Suburban 2016 0.909674 22.9
A52NottJ_006a_1215 458174 337772 Roadside 2016 0.894377 32.5
A52NottJ_006b_1215 458174 337772 Roadside 2016 0.894377 31.6
A52NottJ_006c_1215 458174 337772 Roadside 2016 0.894377 31.7
A52NottJ_007_1215 459039 336216 Roadside 2016 0.894377 29.2
A52NottJ_009_1215 460568 335966 Suburban 2016 0.894377 20.5
A52NottJ_011_1215 459301 334791 Suburban 2016 0.894377 21.9
A52NottJ_012_1215 460356 334076 Roadside 2016 0.894377 29.2
A52NottJ_014_1215 458316 334490 Suburban 2016 0.894377 28.9
A52NottJ_015_1215 458028 334535 Suburban 2016 0.894377 27.4
A52NottJ_016_1215 457847 333654 Roadside 2016 0.894377 25.5
A52NottJ_017_1215 457564 335026 Roadside 2016 0.894377 40.2
A52NottJ_018_1215 458174 336126 Roadside 2016 0.894377 28.7
A52NottJ_019_1215 456944 335314 Suburban 2016 0.894377 24.2
A52NottJ_020_1215 456625 335535 Suburban 2016 0.894377 26.7
A52NottJ_021_1215 456592 335865 Roadside 2016 0.894377 27.7
A52NottJ_022_1215 456563 335452 Suburban 2016 0.894377 24.1
A52NottJ_023_1215 456356 336197 Suburban 2016 0.894377 27.6
A52NottJ_025_1215 455544 335724 Roadside 2016 0.894377 33.5
A52NottJ_026_1215 455232 338292 Suburban 2016 0.894377 28.5
A52NottJ_027a_1215 454939 338310 Roadside 2016 0.894377 38.2
A52NottJ_027b_0216 454939 338310 Roadside 2016 0.913761 36.0
A52NottJ_027c_0216 454939 338310 Roadside 2016 0.913761 35.9
A52NottJ_028_1215 455162 338548 Kerbside 2016 0.894377 44.0
A52NottJ_029_1215 454776 339134 Suburban 2016 0.894377 28.8
A52NottJ_030_1215 454430 339002 Roadside 2016 0.894377 31.9
A52NottJ_031_1215 454475 339441 Roadside 2016 0.894377 37.3
A52NottJ_032_1215 454377 339824 Roadside 2016 0.894377 31.4
A52NottJ_033_1215 454077 340015 Roadside 2016 0.899469 37.6

Phase 2 Air Quality Report
Phase 2 Air Quality Report v2.docx Page 88 of 104
Monitoring Site ID Ordnance Survey Grid Refs
Site Type Measurement Year
Annualisation Factor
2017 Equivalent
Annual Mean NO2 Concn
(µg/m³)
x y
A52NottJ_034_1215 454185 338943 Suburban 2016 0.894377 29.5
A5DUAL_001_1215 422176 302592 Kerbside 2016 0.949 27.5
A5DUAL_003_1215 422441 302584 Urban
Background 2016 0.918 27.3
A5DUAL_005_1215 423439 301278 Roadside 2016 0.918 25.5
A5DUAL_006_1215 423845 301079 Roadside 2016 0.918 29.3
A5DUAL_008_1215 426067 300152 Roadside 2016 0.918 37.7
A5DUAL_010_1215 427663 299354 Roadside 2016 0.918 47.5
A5DUAL_011_1215 428456 298972 Roadside 2016 0.902 46.8
A5DUAL_013_1215 430305 298061 Roadside 2016 0.925 22.2
A5DUAL_014_1215 430609 298132 Roadside 2016 0.925 26.2
A5DUAL_015_1215 430886 298239 Roadside 2016 0.859 29.1
A5DUAL_016_1215 432087 297284 Roadside 2016 0.925 23.5
A5DUAL_017_1215 432486 297036 Roadside 2016 0.925 32.9
A5DUAL_019_1215 436766 294976 Roadside 2016 0.925 25.7
A5DUAL_020_1215 437902 294301 Roadside 2016 0.923 32.6
A5DUAL_021_1215 441714 300409 Roadside 2016 0.923 20.4
A5DUAL_022_1215 439388 293361 Roadside 2016 0.923 36.7
A5DUAL_023_1215 439289 293485 Kerbside 2016 0.953 33.4
A5DUAL_024_1215 440107 293103 Roadside 2016 0.923 31.2
A5DUAL_025_1215 440539 292808 Kerbside 2016 0.923 25.7
A5DUAL_027_1215 442920 291335 Roadside 2016 0.923 40.9
A5DUAL_031_1215 411595 290438 Urban
Background 2016 0.877 34.6
A5DUAL_032_1215 411595 290438 Urban
Background 2016 0.877 33.4
A5DUAL_033_1215 411595 290438 Urban
Background 2016 0.877 35.3
A5Tow_005_0116 469436 249841 Roadside 2016 1.086 22.5
A5Tow_006_0116 468349 248621 Roadside 2016 1.038 22.1
A5Tow_008_0116 468337 248035 Roadside 2016 1.038 27.9
A5Tow_009_0116 469830 248109 Roadside 2016 1.038 22.7
A5Tow_010_0116 469156 248808 Roadside 2016 1.038 27.3
A5Tow_012_0116 469144 244035 Roadside 2016 1.038 18.0
A5Tow_013_0116 467191 244569 Roadside 2016 1.038 17.0
A5Tow_014_0116 471846 246441 Roadside 2016 0.963 16.9
A5Tow_015_0116 472633 245714 Roadside 2016 1.038 18.0
A5Tow_017_0116 475758 243043 Roadside 2016 0.985 19.5
A5Tow_020_0116 477782 241418 Roadside 2016 0.963 26.8
A61Dual_T1_1215 436124 395664 Suburban 2016 0.859 26.3
A61Dual_T10_1215 433518 398019 Suburban 2016 0.859 16.5
A61Dual_T2_1215 436002 395736 Suburban 2016 0.912 48.1
A61Dual_T3_1215 434537 396237 Suburban 2016 0.859 31.6
A61Dual_T5_1215 433674 395540 Roadside 2016 0.859 56.7
A61Dual_T6_1215 432676 397008 Roadside 2016 0.859 24.6
A61Dual_T7_1215 432985 397332 Suburban 2016 0.859 23.6
A61Dual_T8_1215 433257 397697 Suburban 2016 0.859 22.8
BBP4_001_0116 420024 284970 Roadside 2016 0.907 34.9
BBP4_002_0116 420281 283176 Roadside 2016 0.941 31.2

Phase 2 Air Quality Report
Phase 2 Air Quality Report v2.docx Page 89 of 104
Monitoring Site ID Ordnance Survey Grid Refs
Site Type Measurement Year
Annualisation Factor
2017 Equivalent
Annual Mean NO2 Concn
(µg/m³)
x y
BBP4_003_0116 419283 282932 Roadside 2016 0.907 29.1
BBP4_007_0116 416857 278508 Roadside 2016 0.81 32.8
BBP4_008_0116 416812 278547 Roadside 2016 0.907 25.7
BBP4_009_0116 413578 274358 Roadside 2016 0.907 24.7
BBP4_010_0116 413309 273547 Roadside 2016 0.941 38.6
BBP4_012_0116 408343 273035 Roadside 2016 0.907 33.2
BBP4_013_0116 402528 273349 Roadside 2016 0.907 28.2
BBP4_015_0116 397205 272959 Roadside 2016 0.907 28.2
BBP4_018_0116 395828 272851 Roadside 2016 0.907 45.4
BBP4_019_0116 395429 273296 Roadside 2016 0.907 25.1
BBP4_021_0116 396129 274607 Roadside 2016 0.907 31.6
BBP4_022_0116 396489 277914 Roadside 2016 0.941 39.9
BBP4_023_0116 398975 282902 Roadside 2016 0.907 28.8
BBP4_025_0116 398800 286216 Roadside 2016 0.907 29.8
BBP4_026_0116 398576 286935 Roadside 2016 0.941 41.1
BBP4_029_0116 394979 272367 Roadside 2016 0.941 26.2
CC_001_1215 497031 164841 Background 2016 0.978 36.5
CC_002_1215 497027 164855 Background 2016 0.978 29.6
CC_003_1215 497022 164864 Background 2016 0.927 31.5
CC_004_1215 497018 164869 Background 2016 0.932 28.8
CC_005_1215 497017 164883 Background 2016 0.932 26.6
CC_006_1215 497013 164914 Background 2016 0.995 21.4
CC_007_1215 496958 165011 Background 2016 1.009 15.2
CC_010_1215 496917 163552 Background 2016 0.995 25.0
CC_011_1215 488649 159805 Background 2016 0.995 33.5
CC_012_1215 488649 159805 Background 2016 0.995 31.7
CC_013_1215 488649 159805 Background 2016 0.995 33.0
CG_001_1215 285414 120997 Rural 2016 0.939 14.7
CG_002_1215 285418 121006 Rural 2016 0.939 13.0
CG_003_1215 285422 121016 Rural 2016 0.913 11.1
CG_004_1215 285426 121025 Rural 2016 0.939 9.9
CG_005_1215 285430 121034 Rural 2016 0.967 5.9
M1J28J31_004_0112 445140 356461 Roadside 2016 0.931 40.2
M1J28J31_013_0112 447174 377159 Roadside 2016 0.922 41.5
M1J28J31_014_0112 447288 382901 Roadside 2016 0.965 41.1
M1J28J31_015_0112 447320 382903 Roadside 2016 0.931 59.7
M1J28J31_016_0112 447409 382895 Roadside 2016 0.931 43.7
M1J28J31_065_0415 447199 377209 Roadside 2016 0.901 39.3
M1J28J31_066_0415 444941 358793 Roadside 2016 0.931 40.0
M1J28J31_067_0415 446493 355265 Roadside 2016 0.931 36.1
M1J32J35A_030_0112 438524 392952 Roadside 2016 0.846 51.6
M1J32J35A_031_0112 438891 392613 Roadside 2016 0.917 43.4
M1J32J35A_032_0112 438877 392540 Roadside 2016 0.917 38.2
M1J32J35A_033_0112 438955 392430 Roadside 2016 0.917 39.0
M1J32J35A_034_0112 441758 389253 Roadside 2016 0.931 49.5
M1J32J35A_036_0112 442692 389160 Roadside 2016 0.931 39.3
M1J32J35A_037_0112 442802 389159 Roadside 2016 0.931 37.0
M1J32J35A_062_0913 438283 393147 Roadside 2016 0.917 41.5
M1J32J35A_063_0913 438419 393013 Roadside 2016 0.905 57.2

Phase 2 Air Quality Report
Phase 2 Air Quality Report v2.docx Page 90 of 104
Monitoring Site ID Ordnance Survey Grid Refs
Site Type Measurement Year
Annualisation Factor
2017 Equivalent
Annual Mean NO2 Concn
(µg/m³)
x y
M1J32J35A_064_0913 438569 392890 Roadside 2016 0.941 36.8
M1J32J35A_065_0913 438632 392850 Roadside 2016 0.893 39.5
M1J32J35A_072_0415 437180 394615 Roadside 2016 0.917 30.2
M1J32J35A_073_0415 439901 390734 Roadside 2016 0.913 46.0
M1J32J35A_074_0415 440127 390792 Roadside 2016 0.952 52.8
M1J35AJ39_001_0516 447206 336361 Roadside 2016 0.927 39.0
M1J35AJ39_002_0516 447190 336354 Roadside 2016 0.927 42.6
M1J35AJ39_003_0516 447198 336265 Roadside 2016 0.927 41.2
M1J35AJ39_004_0516 447296 335965 Roadside 2016 0.927 32.7
M1J35AJ39_005_0516 447293 335896 Roadside 2016 0.927 27.8
M1J35AJ39_007_0516 447315 335202 Roadside 2016 0.927 33.7
M1J35AJ39_008_0516 447377 334807 Roadside 2016 0.94 39.7
M1J35AJ39_009_0516 447214 334541 Roadside 2016 0.927 41.8
M1J35AJ39_010_0516 447210 334505 Roadside 2016 0.927 40.9
M1J35AJ39_011_0516 447214 334465 Roadside 2016 0.927 40.7
M1J35AJ39_012_0516 447258 334462 Roadside 2016 0.94 36.5
M1J35AJ39_014_0516 447279 334325 Roadside 2016 0.927 39.8
M1J35AJ39_015_0516 447317 334273 Roadside 2016 0.927 36.5
M1J35AJ39_021_0516 447337 333974 Roadside 2016 0.927 38.4
M1J35AJ39_023_0516 447352 333801 Roadside 2016 0.927 40.6
M1J35AJ39_024_0516 447388 333798 Roadside 2016 0.927 35.2
M1J35AJ39_025_0516 447471 333832 Roadside 2016 0.927 30.8
M1J35AJ39_026_0516 447357 333606 Roadside 2016 0.927 39.0
M1J35AJ39_027_0516 447350 333508 Roadside 2016 0.927 36.9
M1J35AJ39_1_1215 436293 397692 Suburban 2016 0.912 35.0
M1J35AJ39_10_1215 430787 409325 Suburban 2016 0.851 29.4
M1J35AJ39_11_1215 430763 409685 Roadside 2016 0.851 23.9
M1J35AJ39_12_1215 429801 411444 Roadside 2016 0.803 21.2
M1J35AJ39_13_1215 429578 412017 Kerbside 2016 0.851 18.3
M1J35AJ39_16_1215 430476 415227 Suburban 2016 0.851 27.6
M1J35AJ39_17_1215 430659 416002 Kerbside 2016 0.851 35.6
M1J35AJ39_18_1215 430962 416595 Suburban 2016 0.851 28.9
M1J35AJ39_19_1215 431116 417010 Suburban 2016 0.866 27.3
M1J35AJ39_2_1215 435442 397966 Roadside 2016 0.859 33.0
M1J35AJ39_20_1215 431254 416864 Suburban 2016 0.851 32.6
M1J35AJ39_21A_1215 430601 418932 Kerbside 2016 0.875 41.6
M1J35AJ39_21B_1215 430601 418932 Kerbside 2016 0.875 42.1
M1J35AJ39_21C_1215 430601 418932 Kerbside 2016 0.875 42.8
M1J35AJ39_25_1215 429192 420999 Roadside 2016 0.803 36.5
M1J35AJ39_3_1215 435382 400318 Roadside 2016 0.814 33.3
M1J35AJ39_6_1215 432586 404802 Roadside 2016 0.859 25.6
M1M62Loft_14_1215 428799 426358 Suburban 2016 0.842 39.0
M1M62Loft_15_1215 430142 426387 Roadside 2016 0.842 47.3
M1M62Loft_16_1215 430183 426320 Suburban 2016 0.842 35.8
M1M62Loft_17_1215 431330 426442 Roadside 2016 0.816 39.5
M1M62Loft_18_1215 431574 426490 Suburban 2016 0.842 36.3
M1M62Loft_19_1215 431662 426477 Roadside 2016 0.842 42.8
M1M62Loft_2_1215 432635 426231 Roadside 2016 0.842 35.0
M1M62Loft_21_1215 435475 425660 Roadside 2016 0.842 29.4

Phase 2 Air Quality Report
Phase 2 Air Quality Report v2.docx Page 91 of 104
Monitoring Site ID Ordnance Survey Grid Refs
Site Type Measurement Year
Annualisation Factor
2017 Equivalent
Annual Mean NO2 Concn
(µg/m³)
x y
M1M62Loft_22_1215 432337 427091 Suburban 2016 0.842 35.3
M1M62Loft_23_1215 425591 434223 Roadside 2016 0.842 38.0
M1M62Loft_3_1215 430670 424617 Roadside 2016 0.842 43.5
M1M62Loft_4_1215 428250 426149 Roadside 2016 0.842 37.3
M1M62Loft_5_1215 427323 426310 Suburban 2016 0.842 34.2
M1M62Loft_6_1215 427767 425892 Suburban 2016 0.842 31.4
M25J10A3_002_1215 507841 158598 Kerbside 2016 0.995 37.9
M25J10A3_008_1215 505552 161219 Roadside 2016 1.005 24.1
M25J10J16_001_1215 504370 164047 Roadside 2016 0.995 34.9
M25J10J16_002_1215 503688 165230 Kerbside 2016 0.993 35.0
M25J10J16_004_1215 501797 168336 Roadside 2016 0.995 35.7
M25J10J16_005_1215 501432 170876 Roadside 2016 0.995 25.6
M25J10J16_006_1215 501615 171664 Kerbside 2016 0.995 39.9
M25J10J16_008_1215 502333 172307 Roadside 2016 0.995 33.5
M25J10J16_009_1215 502103 172473 Roadside 2016 0.995 41.8
M25J10J16_010_1215 501819 172708 Kerbside 2016 0.995 37.9
M25J10J16_011_1215 502475 173124 Kerbside 2016 0.986 31.1
M25J10J16_012_1215 503424 175571 Roadside 2016 0.932 40.9
M25J10J16_014_1215 503734 179230 Roadside 2016 0.995 30.8
M25J10J16_020_1215 502228 186986 Roadside 2016 0.995 26.8
M25J10J16_024_1215 503934 195095 Kerbside 2016 0.995 41.4
M25J10J16_025_1215 503997 196038 Roadside 2016 0.995 24.6
M25J25Im_004_0116 535289 199963 Roadside 2016 1.118 40.5
M25J25Im_005_0116 535361 199968 Roadside 2016 1.023 38.6
M25J25Im_007_0116 536049 199941 Roadside 2016 1.023 42.2
M25J25Im_008_0116 537758 199606 Roadside 2016 1.057 30.8
M25J25Im_009_0116 535488 199863 Roadside 2016 1.023 49.2
M25J25Im_010_0116 535977 199488 Roadside 2016 1.023 48.9
M25J25Im_012_0116 536962 200307 Roadside 2016 1.023 29.2
M25J25Im_013_0116 536204 200037 Roadside 2016 1.023 51.1
M25J25Im_016_0116 535804 200761 Roadside 2016 1.023 32.5
M25J25Im_018_0116 534830 199586 Roadside 2016 1.023 76.9
M25J28I_001_0116 557030 192496 Roadside 2016 1.087 65.2
M25J28I_002_0116 557531 192749 Roadside 2016 1.046 43.5
M25J28I_003_0116 557043 191854 Roadside 2016 1.087 31.4
M25J28I_014_0116 555631 191678 Roadside 2016 1.087 40.6
M25J28I_015_0116 555801 191784 Roadside 2016 1.087 43.1
M25J28I_016_0116 557925 192992 Roadside 2016 1.087 32.1
M25J28I_017_0116 557313 190348 Roadside 2016 1.121 40.1
M25J28I_021_0116 557693 193181 Roadside 2016 1.087 33.4
M25J28I_023_0116 557416 192880 Roadside 2016 1.042 34.4
M271A35Rb_001_0116 437501 113685 Roadside 2016 0.889 38.5
M271A35Rb_003_0116 437917 113481 Roadside 2016 0.955 69.2
M271A35Rb_006_0116 438437 113331 Roadside 2016 0.889 37.3
M271A35Rb_007_0116 438466 113330 Roadside 2016 0.829 41.8
M271A35Rb_008_0116 438436 113291 Roadside 2016 0.889 42.6
M271A35Rb_009_0116 438626 113000 Roadside 2016 0.821 47.8
M271A35Rb_010_0116 438273 113505 Roadside 2016 0.95 40.3
M271A35Rb_017_0116 437966 113408 Roadside 2016 0.95 65.6

Phase 2 Air Quality Report
Phase 2 Air Quality Report v2.docx Page 92 of 104
Monitoring Site ID Ordnance Survey Grid Refs
Site Type Measurement Year
Annualisation Factor
2017 Equivalent
Annual Mean NO2 Concn
(µg/m³)
x y
M271A35Rb_019_0116 438889 112879 Roadside 2016 0.889 47.6
M271A35Rb_021_0116 439309 112820 Roadside 2016 0.889 74.6
M271A35Rb_022_0116 439741 112748 Roadside 2016 0.885 66.4
M271A35Rb_024_0116 437817 113549 Roadside 2016 0.913 49.4
M271A35Rb_025_0116 437817 113549 Roadside 2016 0.913 50.7
M271A35Rb_026_0116 437817 113549 Roadside 2016 0.913 48.9
M271A35Rb_027_0116 437027 113732 Roadside 2016 0.889 31.4
M271A35Rb_028_0116 437022 113762 Roadside 2016 0.889 30.0
M2J5_001_1215 585206 161727 Roadside 2016 0.998 63.8
M2J5_004_1215 586086 162142 Roadside 2016 0.998 32.2
M2J5_005_1215 587469 161377 Roadside 2016 1.027 21.5
M2J5_009_1215 587266 163738 Roadside 2016 0.998 29.5
M2J5_012_1215 588313 160896 Roadside 2016 0.998 25.2
M2J5_013_1215 583119 163599 Roadside 2016 0.998 26.9
M2J5_014_1215 579733 163371 Roadside 2016 0.998 33.4
M2J5_015_1215 580522 163095 Roadside 2016 0.998 34.2
M2J5_016_1215 580022 163054 Roadside 2016 0.998 41.0
M2J5_017a_1215 585861 164816 Roadside 2016 0.927 31.9
M2J5_017b_1215 585861 164816 Roadside 2016 0.984 32.1
M2J5_017c_1215 585861 164816 Roadside 2016 0.984 34.7
M3J10J11Im_008_0116 448110 125810 Roadside 2016 0.889 33.3
M3J10J11Im_010_0116 448213 129503 Roadside 2016 0.907 39.8
M3J10J11Im_011_0116 448213 129503 Roadside 2016 0.889 39.7
M3J10J11Im_012_0116 448213 129503 Roadside 2016 0.889 40.4
M3J10J11Im_013_0116 448450 128052 Roadside 2016 0.915 27.3
M3J10J11Im_014_0116 447675 126567 Roadside 2016 0.889 37.1
M3J10J11Im_015_0116 448972 127684 Roadside 2016 0.889 46.2
M3J10J11Im_016_0116 447959 126567 Roadside 2016 0.889 38.0
M3J10J11Im_017_0116 448882 127641 Roadside 2016 0.889 35.0
M3J12J14Im_001_0116 443960 119674 Roadside 2016 1.024 27.1
M3J12J14Im_002_0116 443960 119674 Roadside 2016 1.024 26.6
M3J12J14Im_003_0116 443960 119674 Roadside 2016 0.907 28.2
M3J12J14Im_004_0116 442643 116670 Roadside 2016 0.889 44.7
M3J12J14Im_005_0116 442274 117655 Roadside 2016 0.889 32.0
M3J12J14Im_010_0116 443774 119298 Roadside 2016 0.889 29.4
M3J12J14Im_012_0116 444071 119779 Roadside 2016 0.889 42.7
M3J12J14Im_013_0116 444188 119944 Roadside 2016 0.889 40.0
M3J12J14Im_014_0116 444389 120300 Roadside 2016 0.889 30.9
M3J12J14Im_015_0116 444654 120800 Roadside 2016 0.889 29.5
M3J12J14Im_016_0116 444938 121522 Roadside 2016 0.889 34.6
M3J12J14Im_017_0116 445082 121594 Roadside 2016 0.748 38.4
M3J12J14Im_020_0116 444953 120370 Roadside 2016 0.915 34.0
M3J12J14Im_021_0116 444446 120407 Roadside 2016 0.913 35.5
M3J12J14Im_022_0116 444816 121190 Roadside 2016 0.889 31.2
M3J12J14Im_023_0116 445264 122283 Roadside 2016 0.889 41.7
M3J12J14Im_026_0116 444488 120162 Roadside 2016 0.889 26.9
M3J12J14Im_027_0116 443420 118549 Roadside 2016 0.889 38.6
M3J9Im_001_0116 448959 132478 Roadside 2016 0.889 23.6
M3J9Im_002_0116 449008 132219 Roadside 2016 0.889 38.1

Phase 2 Air Quality Report
Phase 2 Air Quality Report v2.docx Page 93 of 104
Monitoring Site ID Ordnance Survey Grid Refs
Site Type Measurement Year
Annualisation Factor
2017 Equivalent
Annual Mean NO2 Concn
(µg/m³)
x y
M3J9Im_003_0116 449534 129887 Roadside 2016 0.858 29.2
M3J9Im_004_0116 449554 129574 Roadside 2016 0.889 25.4
M3J9Im_005_0116 449557 129437 Roadside 2016 0.889 40.9
M3J9Im_006_0116 449563 129243 Roadside 2016 0.889 32.1
M3J9Im_008_0116 449867 129436 Roadside 2016 0.889 24.5
M3J9Im_009_0116 449498 130699 Roadside 2016 0.889 34.1
M3J9Im_010_0116 449014 129959 Roadside 2016 0.889 23.7
M49AVON_001_1215 352631 177628 Roadside 2016 0.899 35.4
M49AVON_002_1215 352693 177734 Roadside 2016 0.899 30.6
M49AVON_003_1215 352787 177859 Kerbside 2016 0.899 38.1
M49AVON_004_1215 352910 177593 Roadside 2016 0.899 22.9
M49AVON_010_1215 354663 181014 Kerbside 2016 0.899 25.3
M49AVON_013_1215 357047 182142 Rural 2016 0.874 17.5
M49AVON_014_1215 357224 182443 Roadside 2016 0.899 20.3
M49AVON_016_1215 354948 185031 Kerbside 2016 0.935 24.2
M49AVON_017_1215 355517 183748 Roadside 2016 0.899 28.6
M49AVON_019_1215 354484 184216 Roadside 2016 0.899 21.1
M49AVON_021_1215 354605 184925 Kerbside 2016 0.899 20.3
M49AVON_022_1215 354337 185377 Roadside 2016 0.899 19.4
M49AVON_023_1215 353990 185732 Urban
Background 2016 0.899 19.8
M53J5J11_001_0116 341865 366447 Roadside 2016 0.962 34.4
M53J5J11_002_0116 341865 366447 Roadside 2016 0.928 38.9
M53J5J11_003_0116 341865 366447 Roadside 2016 0.853 39.6
M53J5J11_004_0116 343303 368694 Roadside 2016 1.007 34.6
M53J5J11_005_0116 342862 368889 Roadside 2016 1.007 21.6
M53J5J11_006_0116 342190 373107 Roadside 2016 1.007 23.5
M53J5J11_007_0116 341290 374088 Roadside 2016 1.007 36.4
M53J5J11_009_0116 341091 375987 Roadside 2016 1.007 27.5
M53J5J11_011_0116 340121 377291 Roadside 2016 1.16 34.5
M53J5J11_015_0116 338701 377788 Roadside 2016 1.007 19.3
M53J5J11_016_0116 336226 378638 Roadside 2016 1.007 20.3
M53J5J11_017_0116 336070 379239 Roadside 2016 1.007 34.8
M53J5J11_018_0116 335189 379042 Roadside 2016 1.007 22.1
M53J5J11_019_0116 334644 379195 Roadside 2016 1.007 28.4
M53J5J11_021_0116 328950 386394 Roadside 2016 1.007 30.3
M53J5J11_022_0116 328695 386424 Roadside 2016 1.007 22.2
M53J5J11_023_0116 340131 377358 Roadside 2016 1.007 30.1
M53J5J11_024_0116 340083 377301 Roadside 2016 0.896 25.3
M53J5J11_025_0116 332767 381334 Roadside 2016 1.007 34.1
M53J5J11_027_0116 332714 381338 Roadside 2016 1.007 26.5
M56J11A_001_1215 353023 380680 Roadside 2016 0.975 22.7
M56J11A_003_1215 351459 377728 Roadside 2016 0.975 32.9
M56J11A_004_1215 351918 378400 Roadside 2016 0.975 27.6
M56J11A_005_1215 353539 379675 Roadside 2016 0.975 28.9
M56J11A_007_1215 354008 379873 Roadside 2016 0.975 42.8
M56J11A_008_1215 354529 379568 Roadside 2016 0.975 34.3
M56J11A_009_1215 354381 379368 Roadside 2016 0.975 29.8
M56J11A_011_1215 356542 380486 Roadside 2016 0.975 34.4

Phase 2 Air Quality Report
Phase 2 Air Quality Report v2.docx Page 94 of 104
Monitoring Site ID Ordnance Survey Grid Refs
Site Type Measurement Year
Annualisation Factor
2017 Equivalent
Annual Mean NO2 Concn
(µg/m³)
x y
M56J11A_012_1215 356517 380662 Roadside 2016 0.975 36.6
M56J11A_014_1215 361860 382162 Roadside 2016 0.975 26.3
M56J11A_015_1215 362191 381900 Roadside 2016 0.975 40.0
M56J11A_017_1215 355773 379819 Roadside 2016 0.975 54.5
M56J11A_018_1215 354382 380242 Roadside 2016 0.975 26.1
M5J5J6J7_001_0116 391952 266419 Roadside 2016 0.963 22.8
M5J5J6J7_002_0116 391960 265820 Roadside 2016 0.963 26.9
M5J5J6J7_003_0116 391621 265183 Roadside 2016 0.963 56.9
M5J5J6J7_008_0116 388596 256315 Roadside 2016 0.963 19.8
M5J5J6J7_012_0116 387310 253365 Roadside 2016 0.963 23.6
M5J5J6J7_013_0116 387631 252516 Roadside 2016 0.963 27.7
M5J5J6J7_015_0116 387895 252125 Roadside 2016 0.905 30.8
M5J5J6J7_016_0116 387314 251685 Roadside 2016 0.963 25.0
M5J5J6J7_017_0116 387437 251583 Roadside 2016 0.963 29.7
M5J5J6J7_018_0116 387435 253388 Roadside 2016 0.963 23.5
M60J18_002_1215 383038 405754 Roadside 2016 0.925 43.0
M60J18_005_1215 382323 405714 Roadside 2016 0.925 36.3
M60J18_008_1215 381395 405163 Roadside 2016 0.925 52.1
M60J18_009_1215 385414 408313 Roadside 2016 0.925 51.6
M60J18_013_1215 382156 411058 Roadside 2016 0.925 43.1
M60J18_015_1215 385120 404867 Roadside 2016 0.925 28.8
M60J18_016_1215 381604 405229 Roadside 2016 0.922 47.7
M60J18_017_1215 386635 409183 Roadside 2016 0.925 32.6
M60J18_018_1215 380636 404676 Roadside 2016 0.925 34.4
M60J18_019_1215 384157 404867 Roadside 2016 0.925 29.7
M60J18_020a_1215 380637 406971 Roadside 2016 0.953 32.0
M60J18_020b_1215 380637 406971 Roadside 2016 0.953 31.8
M60J18_020c_1215 380637 406971 Roadside 2016 0.953 34.6
M621J1J7Im_1_1215 426174 429244 Suburban 2016 0.916 28.6
M621J1J7Im_10_1215 429507 432084 Roadside 2016 0.862 33.4
M621J1J7Im_11_1215 430300 431856 Roadside 2016 0.916 33.1
M621J1J7Im_12_1215 431018 430625 Suburban 2016 0.916 43.9
M621J1J7Im_13_1215 431101 430528 Suburban 2016 0.916 38.7
M621J1J7Im_15_1215 431713 430471 Roadside 2016 0.875 35.3
M621J1J7Im_16_1215 431771 430551 Roadside 2016 0.916 40.3
M621J1J7Im_20_1215 430426 431187 Roadside 2016 0.916 36.4
M621J1J7Im_21_1215 431044 430511 Roadside 2016 0.916 43.6
M621J1J7Im_23_1215 422348 427975 Suburban 2016 0.916 28.6
M621J1J7Im_24_1215 422329 427490 Roadside 2016 0.916 36.9
M621J1J7Im_25_1215 424705 427460 Roadside 2016 0.916 42.2
M621J1J7Im_26_1215 424800 427550 Roadside 2016 0.888 47.4
M621J1J7Im_27_1215 424483 428081 Roadside 2016 0.916 42.3
M621J1J7Im_28_1215 423635 428315 Roadside 2016 0.916 29.8
M621J1J7Im_3_1215 427880 430434 Roadside 2016 0.916 33.9
M621J1J7Im_32_1215 424883 427613 Roadside 2016 0.916 42.0
M621J1J7Im_34_1215 431771 430458 Roadside 2016 0.916 40.0
M621J1J7Im_35_1215 431851 430558 Suburban 2016 0.916 34.4
M621J1J7Im_36_1215 431607 430493 Suburban 2016 0.943 35.3
M621J1J7Im_37_1215 431708 430589 Suburban 2016 0.862 33.2

Phase 2 Air Quality Report
Phase 2 Air Quality Report v2.docx Page 95 of 104
Monitoring Site ID Ordnance Survey Grid Refs
Site Type Measurement Year
Annualisation Factor
2017 Equivalent
Annual Mean NO2 Concn
(µg/m³)
x y
M621J1J7Im_39_1215 431650 430440 Suburban 2016 0.916 28.4
M621J1J7Im_4_1215 428250 431194 Roadside 2016 0.916 29.6
M621J1J7Im_40_1215 431472 430593 Suburban 2016 0.916 35.3
M621J1J7Im_43_1215 425844 428981 Suburban 2016 0.916 28.0
M621J1J7Im_44_1215 426387 429417 Suburban 2016 0.916 27.8
M621J1J7Im_45_1215 425888 429023 Suburban 2016 0.916 26.9
M621J1J7Im_5_1215 428993 431678 Roadside 2016 0.916 44.4
M621J1J7Im_6_1215 429060 431797 Roadside 2016 0.916 36.9
M621J1J7Im_7_1215 429343 431894 Suburban 2016 0.862 39.6
M621J1J7Im_9_1215 429640 431968 Suburban 2016 0.916 34.9
M62J20J25_001_0116 416978 424415 Roadside 2016 0.934 37.6
M62J20J25_002_0116 416662 422508 Roadside 2016 0.934 22.5
M62J20J25_004_0116 414802 420519 Roadside 2016 0.934 40.2
M62J20J25_006_0116 411479 419584 Roadside 2016 0.934 43.0
M62J20J25_007_0116 410591 419114 Roadside 2016 0.934 31.5
M62J20J25_008_0116 409812 418406 Roadside 2016 0.934 37.3
M62J20J25_009_0116 409065 418103 Roadside 2016 0.934 32.5
M62J20J25_011_0116 407940 417263 Roadside 2016 0.934 53.7
M62J20J25_012_0116 407006 416356 Roadside 2016 0.899 34.0
M62J20J25_013_0116 406968 416300 Roadside 2016 0.966 25.7
M62J20J25_014_0116 404823 416869 Roadside 2016 0.953 20.6
M62J20J25_016_0116 393591 412358 Roadside 2016 0.934 32.2
M62J20J25_017_0116 393274 412079 Roadside 2016 0.934 44.5
M62J20J25_021_0116 391354 410819 Roadside 2016 0.934 42.6
M62J20J25_022_0116 390684 410610 Roadside 2016 0.934 45.0
M62J20J25_025_0116 408377 417505 Roadside 2016 0.934 34.7
M62J20J25_026_0116 410945 419185 Roadside 2016 0.934 37.0
M62J20J25_027_0116 407835 417299 Roadside 2016 0.934 39.5
M62J20J25_028_0116 413096 420448 Roadside 2016 0.966 39.3
M62J20J25_029_0116 413729 420468 Roadside 2016 0.934 47.2
M62J20J25_030_0116 411731 419659 Roadside 2016 0.934 36.6
M62J20J25_035a_0116 393882 409178 Roadside 2016 0.962 36.9
M62J20J25_035b_0116 393882 409178 Roadside 2016 0.962 37.8
M62J20J25_035c_0116 393882 409178 Roadside 2016 0.962 36.5
M62M606CB_1_1215 417802 425785 Roadside 2016 0.903 35.0
M62M606CB_10_1215 417584 427818 Roadside 2016 0.903 35.4
M62M606CB_11_1215 417426 427850 Roadside 2016 0.903 41.5
M62M606CB_13_1215 416323 430154 Kerbside 2016 0.903 31.9
M62M606CB_14_1215 416354 430340 Roadside 2016 0.903 33.0
M62M606CB_16_1215 416907 430276 Roadside 2016 0.903 50.7
M62M606CB_17_1215 417828 429967 Urban
Background 2016 0.856 23.4
M62M606CB_18_1215 418681 426055 Roadside 2016 0.824 43.4
M62M606CB_19_1215 407516 432408 Roadside 2016 0.978 26.5
M62M606CB_2_1215 417664 425873 Kerbside 2016 0.903 34.1
M62M606CB_20_1215 407117 429012 Roadside 2016 0.903 21.9
M62M606CB_22_1215 411850 430622 Roadside 2016 0.903 19.5
M62M606CB_23_1215 415787 429890 Roadside 2016 0.903 27.1
M62M606CB_25_1215 420009 429643 Roadside 2016 0.903 34.9

Phase 2 Air Quality Report
Phase 2 Air Quality Report v2.docx Page 96 of 104
Monitoring Site ID Ordnance Survey Grid Refs
Site Type Measurement Year
Annualisation Factor
2017 Equivalent
Annual Mean NO2 Concn
(µg/m³)
x y
M62M606CB_4_1215 418823 426661 Suburban 2016 0.903 27.5
M62M606CB_5_1215 416402 426147 Suburban 2016 0.903 19.2
M62M606CB_6_1215 418891 427576 Roadside 2016 0.903 42.8
M62M606CB_7_1215 419826 427560 Roadside 2016 0.903 46.2
M62M606CB_8_1215 420465 427247 Roadside 2016 0.903 48.3
M62M606CB_9_1215 420442 427353 Roadside 2016 0.918 40.2
M6J15Im_002_1215 385787 341760 Suburban 2016 0.922 30.3
M6J15Im_003_1215 385074 341914 Kerbside 2016 0.922 58.1
M6J15Im_005_1215 385731 342164 Kerbside 2016 0.922 31.3
M6J15Im_007_1215 386546 341897 Roadside 2016 0.922 38.9
M6J15Im_008_1215 385381 341815 Roadside 2016 0.922 27.9
M6J15Im_010_1215 385218 341801 Kerbside 2016 0.922 34.2
M6J15Im_011_1215 386655 341368 Roadside 2016 0.922 33.3
M6J15Im_012_1215 386056 341473 Suburban 2016 0.922 20.2
M6J15Im_014_1215 386528 342998 Suburban 2016 0.922 27.2
M6J15Im_015_1215 385247 341036 Roadside 2016 0.922 50.3
M6J19Im_001_1215 372208 378927 Roadside 2016 0.805 44.6
M6J19Im_007_1215 372720 381440 Roadside 2016 0.899 59.2
M6J19Im_008_1215 372784 381968 Roadside 2016 0.899 63.1
M6J19Im_009_1215 372732 381762 Roadside 2016 0.848 75.8
M6J19Im_012_1215 373682 380868 Roadside 2016 0.899 30.8
M6J19Im_014_1215 374763 379018 Roadside 2016 0.874 36.3
M6J19Im_016_1215 374603 378594 Roadside 2016 0.874 39.9
M6J19Im_018_1215 374215 378488 Roadside 2016 0.899 24.5
M6J19Im_019a_1215 373004 382626 Roadside 2016 0.899 42.3
M6J19Im_019b_1215 373004 382626 Roadside 2016 0.899 43.5
M6J19Im_019c_1215 373004 382626 Roadside 2016 0.899 44.0
M6M5SM_001_1215 401559 290079 Kerbside 2016 0.877 40.1
M6M5SM_002_1215 401785 290710 Roadside 2016 0.877 35.0
M6M5SM_003_1215 401914 291036 Roadside 2016 0.877 30.5
M6M5SM_004_1215 402152 293622 Kerbside 2016 0.877 34.6
M6M5SM_006_1215 403791 294689 Roadside 2016 0.877 28.2
M6M5SM_009_1215 405680 294338 Kerbside 2016 0.877 36.6
M6M5SM_010_1215 405972 293965 Kerbside 2016 0.877 32.0
M6M5SM_011_1215 406285 293460 Kerbside 2016 0.877 32.5
M6M5SM_012_1215 406569 293265 Kerbside 2016 0.776 31.0
M6M5SM_015_1215 402033 294781 Kerbside 2016 0.877 33.9
M6M5SM_016_1215 402189 294374 Kerbside 2016 0.836 30.3
M6M5SM_019_1215 401754 295562 Roadside 2016 0.877 38.6
M6M5SM_020_1215 401878 295441 Roadside 2016 0.877 37.5
M6M5SM_021_1215 401938 295260 Roadside 2016 0.877 32.8
M6M5SM_022_1215 402141 295091 Roadside 2016 0.877 32.2
M6M5SM_025_1215 405661 294218 Kerbside 2016 0.877 34.1
M6M5SM_026_1215 406092 293520 Kerbside 2016 0.877 35.4
M6M5SM_027_1215 406439 293245 Kerbside 2016 0.877 33.5
M6M5SM_031_1215 411595 290438 Urban
Background 2016 0.877 34.8
M6M5SM_032_1215 411595 290438 Urban
Background 2016 0.877 36.4

Phase 2 Air Quality Report
Phase 2 Air Quality Report v2.docx Page 97 of 104
Monitoring Site ID Ordnance Survey Grid Refs
Site Type Measurement Year
Annualisation Factor
2017 Equivalent
Annual Mean NO2 Concn
(µg/m³)
x y
M6M5SM_033_1215 411595 290438 Urban
Background 2016 0.877 34.2
MMLR_002_1215 395291 395256 Roadside 2016 0.925 26.8
MMLR_003_1215 395526 395405 Roadside 2016 0.9 27.4
MMLR_006_1215 395369 395062 Roadside 2016 0.9 31.9
MMLR_007_1215 395619 395230 Roadside 2016 0.904 30.8
MMLR_008_1215 395724 395310 Roadside 2016 0.9 28.7
MMLR_012_1215 398901 395501 Roadside 2016 0.925 51.2
MMLR_019_1215 399691 395821 Roadside 2016 0.925 43.7
MMLR_020_1215 398451 396636 Roadside 2016 0.925 43.8
MMLR_021_1215 398147 396837 Roadside 2016 0.925 41.7
MMLR_022_1215 397449 397210 Roadside 2016 1.025 35.0
MMLR_026_1215 400948 395800 Roadside 2016 0.925 50.5
MMLR_027_1215 401758 394526 Roadside 2016 0.925 63.1
MMLR_030_1215 401076 396674 Roadside 2016 0.967 34.9
MMLR_039_1215 418259 401190 Roadside 2016 0.86 28.4
MMLR_040_1215 419730 401540 Roadside 2016 0.86 23.4
MMLR_041_1215 402816 394069 Roadside 2016 0.925 45.0
MMLR_042_1215 403019 394071 Roadside 2016 0.846 43.5
MMLR_044_1215 400490 396118 Roadside 2016 0.925 50.6
MMLR_047_1215 401258 395132 Roadside 2016 0.925 23.4
MMLR_048_1215 401109 395390 Roadside 2016 0.925 28.8
MMLR_049_1215 401023 395672 Roadside 2016 0.939 43.7
MMLR_050_1215 400744 395786 Roadside 2016 0.925 41.3
MMLR_051_1215 400493 395915 Roadside 2016 0.925 52.5
MMLR_052_1215 400531 396056 Roadside 2016 0.88 25.2
MMLR_058_1215 395836 394959 Roadside 2016 0.925 33.2
MMLR_060_1215 402167 397316 Roadside 2016 0.925 29.8
MMLR_063_1215 396071 395454 Roadside 2016 0.925 23.2
MMLR_064_1215 399413 395738 Roadside 2016 0.925 79.0
MMLR_065_1215 398825 396336 Roadside 2016 0.925 32.5
MMLR_066_1215 419726 401525 Roadside 2016 0.925 17.5
MMLR_068_1215 401318 397017 Roadside 2016 0.925 23.3
MMLR_069A_1215 399718 395804 Roadside 2016 0.922 62.0
MMLR_069B_1215 399718 395804 Roadside 2016 0.922 60.5
MMLR_069C_1215 399718 395804 Roadside 2016 0.922 60.9
POL_001A_0415 344374 389680 Roadside 2016 0.934 30.4
POL_002_0415 345745 392484 Roadside 2016 0.934 44.8
POL_003_0415 343346 393304 Roadside 2016 0.934 24.1
POL_004_0415 340193 398040 Roadside 2016 0.934 30.6
POL_007_0415 336639 399874 Roadside 2016 0.934 26.5
POL_010_0415 343276 392964 Roadside 2016 0.934 26.5
POL_011_0415 342132 390567 Roadside 2016 0.916 30.5
TIN_015_1215 438777 392007 Kerbside 2016 0.802 57.2
TIN_017_1215 439133 391588 Roadside 2016 0.889 57.9
TIN_018_1215 439154 391229 Roadside 2016 0.889 45.6
TIN_019_1215 438904 390961 Roadside 2016 0.889 47.1
TIN_020_1215 438618 390617 Kerbside 2016 0.862 64.6
TIN_022_1215 438482 390533 Roadside 2016 0.889 45.2

Phase 2 Air Quality Report
Phase 2 Air Quality Report v2.docx Page 98 of 104
Monitoring Site ID Ordnance Survey Grid Refs
Site Type Measurement Year
Annualisation Factor
2017 Equivalent
Annual Mean NO2 Concn
(µg/m³)
x y
TIN_023_1215 439334 390374 Roadside 2016 0.889 38.6
TIN_024_1215 439376 390415 Roadside 2016 0.889 46.5
TIN_026_1215 439601 390674 Roadside 2016 0.889 48.0
TIN_028_1215 439789 390607 Roadside 2016 0.889 54.0
TIN_033_1215 439936 390686 Motorway 2016 0.889 36.2
TIN_043_1215 440058 390855 Roadside 2016 0.923 42.1
TIN_050_1215 440113 390802 Roadside 2016 0.889 46.3
TIN_054_1215 440055 390739 Motorway 2016 0.865 43.8
TIN_056_1215 440096 390744 Motorway 2016 0.889 41.8
TIN_058_1215 440129 390748 Motorway 2016 0.889 36.7
TIN_059_1215 440147 390750 Motorway 2016 0.889 38.5
TIN_060_1215 440186 390743 Roadside 2016 0.916 39.4
TIN_061_1215 440178 390770 Roadside 2016 0.889 40.4
TIN_062_1215 440166 390665 Suburban 2016 0.889 33.6
TIN_063A_1215 440215 390598 Urban
Background 2016 0.889 31.8
TIN_063B_1215 440215 390598 Urban
Background 2016 0.889 32.6
TIN_063C_1215 440215 390598 Urban
Background 2016 0.889 32.8
TIN_065_1215 440380 390436 Roadside 2016 0.889 42.7
TIN_066_1215 440491 390386 Roadside 2016 0.889 38.4
TIN_068_1215 440861 390298 Roadside 2016 0.889 29.6
TIN_069_1215 440864 390366 Suburban 2016 0.889 25.1
TIN_070_1215 440928 390361 Suburban 2016 0.889 25.2
TIN_071_1215 441283 390307 Roadside 2016 0.889 42.5
M62 J25J30_001 416976 424418 Near-Road 2017 0 38.3
M62 J25J30_002 417643 425886 Roadside 2017 0 31.0
M62 J25J30_003 417802 425783 Roadside 2017 0 39.6
M62 J25J30_004 418890 427572 Near-Road 2017 0 43.0
M62 J25J30_005 430437 434483 Roadside 2017 0 41.9
M62 J25J30_006b 430437 434483 Roadside 2017 0 48.4
M62 J25J30_006a 430437 434483 Roadside 2017 0 49.1
M62 J25J30_006c 430440 434456 Roadside 2017 0 48.7
M62 J25J30_007 424703 427460 Roadside 2017 0 39.1
M62 J25J30_008 425553 426519 Near-Road 2017 0 38.2
M62 J25J30_009 427190 426144 Roadside 2017 0 46.8
M62 J25J30_010 427160 426193 Roadside 2017 0 41.3
M62 J25J30_012 430145 426389 Near-Road 2017 1.063 37.9
M62 J25J30_013 430167 426343 Near-Road 2017 0 31.0
M62 J25J30_014 431329 426437 Roadside 2017 1.136 43.0
M62 J25J30_015 431575 426488 Near-Road 2017 0 37.8
M62 J25J30_016 433303 425813 Near-Road 2017 0 31.9
M62 J25J30_017 433418 425932 Near-Road 2017 0 34.3
M62 J25J30_019 420792 426583 Urban
Background 2017 0 21.8
M6 BB_001 405629 294277 Near-Road 2017 0 35.8
M6 BB_002 405844 294067 Near-Road 2017 0 41.4
M6 BB_003 405674 294330 Near-Road 2017 0 42.2

Phase 2 Air Quality Report
Phase 2 Air Quality Report v2.docx Page 99 of 104
Monitoring Site ID Ordnance Survey Grid Refs
Site Type Measurement Year
Annualisation Factor
2017 Equivalent
Annual Mean NO2 Concn
(µg/m³)
x y
M6 BB_004 408528 291435 Near-Road 2017 0 47.8
M6 BB_005 408711 291293 Near-Road 2017 0 47.2
M6 BB_006 408800 291202 Near-Road 2017 0 54.2
M6 BB_007 409064 290877 Near-Road 2017 0 54.1
M6 BB_011 413048 290074 Near-Road 2017 0 37.1
M6 J10J13_001 399011 299257 Roadside 2017 0 37.0
M6 J10J13_002 398983 299686 Near-Road 2017 0 24.9
M6 J10J13_003 399014 300238 Near-Road 2017 0 39.8
M6 J10J13_004 398969 300478 Near-Road 2017 0 39.6
M6 J10J13_005 398898 300743 Near-Road 2017 0.937 44.0
M6 J10J13_007 398293 301618 Near-Road 2017 0 27.3
M6 J10J13_008 398164 301808 Near-Road 2017 1.095 27.7
M6 J10J13_009 393182 314070 Near-Road 2017 0 24.1
M6 J10J13_010 393138 313872 Near-Road 2017 0 23.4
M6 J10J13_011 397897 302195 Near-Road 2017 0 30.4
M6 J10J13_013a 393193 313877 Near-Road 2017 0 29.4
M6 J10J13_013b 393193 313877 Near-Road 2017 0 29.7
M6 J10J13_013c 393193 313877 Near-Road 2017 0 30.4
M25J23-27_001_0117 526079 200026 Roadside 2017 0 45.9
M25J23-27_002_0117 535297 199994 Roadside 2017 0 45.9
M25J23-27_005_0117 536204 200038 Roadside 2017 0 57.7
M25J23-27_006_0117 538709 199859 Roadside 2017 0 40.6
M25J23-27_007_0117 538923 199797 Roadside 2017 0 40.3
M25J23-27_010_0117 545267 200963 Roadside 2017 0 45.6
M25J23-27_011_0117 545028 200951 Roadside 2017 0 45.5
Dartford_001_0117 555664 174865 Roadside 2017 0 46.5
Dartford_002_0117 555503 174707 Roadside 2017 0 46.6
Dartford_003_0117 555432 174454 Roadside 2017 0 46.1
Dartford_004_0117 555464 174128 Roadside 2017 0 41.5
Dartford_005_0117 555632 173523 Roadside 2017 0 44.1
Dartford_006_0117 555600 173234 Roadside 2017 0 37.9
Dartford_007_0117 556028 172636 Roadside 2017 0 64.8
Dartford_008_0117 555802 173131 Roadside 2017 0 43.1
Dartford_009_0117 555864 173365 Roadside 2017 0 53.7
Dartford_010_0117 555740 173678 Roadside 2017 0 58.4
Dartford_012_0117 555519 174208 Roadside 2017 0 57.2
Dartford_013_0117 555490 174439 Roadside 2017 0 64.4
Dartford_015_0117 555648 175239 Roadside 2017 0 35.2
A47A12_003_A 652198 308576 Kerbside 2017 0.791 42.5
A47A12_003_B 652198 308576 Kerbside 2017 0.791 41.2
A47A12_003_C 652198 308576 Kerbside 2017 0.791 41.1
A47A12_006_A 651503 307334 Roadside 2017 0.791 32.1
A47A12_006_B 651503 307334 Roadside 2017 0.791 31.2
A47A12_006_C 651503 307334 Roadside 2017 0.791 32.3
A47A12_007_A 651517 307176 Urban
Background 2017 0.791 39.4
A47A12_007_B 651517 307176 Urban
Background 2017 0.791 40.3
A47A12_007_C 651517 307176 Urban 2017 0.791 40.9

Phase 2 Air Quality Report
Phase 2 Air Quality Report v2.docx Page 100 of 104
Monitoring Site ID Ordnance Survey Grid Refs
Site Type Measurement Year
Annualisation Factor
2017 Equivalent
Annual Mean NO2 Concn
(µg/m³)
x y
Background
A47A12_008_A 651774 306944 Roadside 2017 0.791 31.0
A47A12_008_B 651774 306944 Roadside 2017 0.791 32.5
A47A12_008_C 651774 306944 Roadside 2017 0.791 30.7
A47A12_012_A 652351 302842 Kerbside 2017 0.791 56.5
A47A12_012_B 652351 302842 Kerbside 2017 0.791 59.0
A47A12_012_C 652351 302842 Kerbside 2017 0.791 58.0
A47A12_013_A 652347 302618 Kerbside 2017 0.791 55.5
A47A12_013_B 652347 302618 Kerbside 2017 0.791 55.6
A47A12_013_C 652347 302618 Kerbside 2017 0.791 55.4
A47A12_014_A 652251 302286 Roadside 2017 0.791 43.0
A47A12_014_B 652251 302286 Roadside 2017 0.791 41.4
A47A12_014_C 652251 302286 Roadside 2017 0.791 42.0
A47A12_015_A 652176 302232 Urban
Background 2017 0.791 27.3
A47A12_015_B 652176 302232 Urban
Background 2017 0.791 27.1
A47A12_015_C 652176 302232 Urban
Background 2017 0.791 25.7
A47A12_016_A 652180 301933 Urban
Background 2017 0.791 26.5
A47A12_016_B 652180 301933 Urban
Background 2017 0.791 27.3
A47A12_016_C 652180 301933 Urban
Background 2017 0.791 27.1
A47A12_020_A 652281 302739 Roadside 2017 0.791 41.5
A47A12_020_B 652281 302739 Roadside 2017 0.791 39.1
A47A12_020_C 652281 302739 Roadside 2017 0.791 39.8
A47A12_022_A 652393 302496 Roadside 2017 0.791 31.4
A47A12_022_B 652393 302496 Roadside 2017 0.791 31.3
A47A12_022_C 652393 302496 Roadside 2017 0.791 32.5
M3J2J4a_001a_0715 485072 156949 Roadside 2017 0 32.2
M3J2J4a_001b_0715 485072 156949 Roadside 2017 0 31.4
M3J2J4a_001c_0715 485072 156949 Roadside 2017 0 31.9
M3J2J4a_002_0715 485916 157749 Urban 2017 0.907 28.5
M3J2J4a_003_0715 486435 157963 Urban 2017 0 29.5
M3J2J4a_004_0715 487184 158428 Roadside 2017 0 43.9
M3J2J4a_005_0715 487982 159056 Urban 2017 0 29.2
M3J2J4a_006_0715 487945 159127 Urban 2017 0 23.5
M3J2J4a_007_0715 488423 159477 Urban 2017 0 29.4
M3J2J4a_008a_0715 488634 159799 Urban 2017 1.046 26.9
M3J2J4a_008b_0715 488634 159799 Urban 2017 1.046 26.4
M3J2J4a_009_0715 489078 160267 Urban 2017 0 28.8
M3J2J4a_010_0715 489370 160543 Urban 2017 0.991 28.5
M3J2J4a_011_0715 489351 160393 Urban 2017 1.062 25.2
M3J2J4a_012_0715 489189 160209 Urban 2017 0 23.7
M3J2J4a_014_0715 491251 162309 Urban 2017 0 24.6
M3J2J4a_017_0715 500563 167174 Suburban 2017 1.032 22.4
M3J2J4a_018_0715 501620 168231 Roadside 2017 1.062 37.0

Phase 2 Air Quality Report
Phase 2 Air Quality Report v2.docx Page 101 of 104
Monitoring Site ID Ordnance Survey Grid Refs
Site Type Measurement Year
Annualisation Factor
2017 Equivalent
Annual Mean NO2 Concn
(µg/m³)
x y
M3J2J4a_019_0715 502258 172333 Roadside 2017 0 48.5
LTC_ECO_05 567357 169801 Roadside 2017 0.975 31.2
LTC_ECO_07 570651 166134 Roadside 2017 0.876 68.9
LTC_ECO_08 574377 162148 Roadside 2017 0.975 22.8
LTC_ECO_09 574861 160601 Roadside 2017 0.975 33.2
LTC_ECO_10 543670 154643 Roadside 2017 1.006 32.6
LTC_ECO_11 568293 169699 Roadside 2017 0.975 43.1
LTC_ECO_14 561109 178885 Roadside 2017 0.962 46.8
LTC_ECO_15 562992 179383 Roadside 2017 0.996 45.0
LTC_ECO_1b 556414 172363 Urban
Background 2017 0.842 43.2
LTC05 557825 180612 Roadside 2017 0.962 44.1
LTC06 561035 180529 Roadside 2017 0.962 46.5
LTC07 563595 180196 Roadside 2017 0.905 39.4
LTC08 563928 179673 Roadside or Urban BG? 2017 0.962 35.9
LTC10 564000 178996 Roadside 2017 0.962 37.0
LTC11 564470 177410 Roadside 2017 0.962 41.6
LTC14 565363 182248
Roadside or Kerbsite (need to
verify location) 2017 0.962 45.3
LTC16 562408 189151 Roadside 2017 0.962 60.3
LTC17 559448 188467 Roadside 2017 0.962 45.4
LTC18 555245 189075 Roadside 2017 0.962 36.0
LTC19 557473 192956 Urban
Background 2017 0.962 41.0
LTC20 560391 188790 Roadside 2017 0.962 45.5
LTC22 572273 186967 Roadside? 2017 0.972 40.4
LTC23 574048 188044 Roadside 2017 0.972 48.5
LTC25 576773 189583 Roadside 2017 0.972 33.2
LTC26 578405 190585 Roadside 2017 1.07 37.6
LTC27 577173 190776 Roadside 2017 0.972 47.2
LTC28 555862 173363 Roadside 2017 0.962 55.1
LTC30 555660 174865 Roadside 2017 0.962 44.0
LTC31 555431 174453 Roadside 2017 0.962 44.1
LTC32 555507 174445 Roadside 2017 0.905 58.5
LTC33 555264 171394 Roadside 2017 0.913 41.3
LTC37 558665 172650 Roadside 2017 0.962 58.3
LTC39 562431 172158 Roadside 2017 0.962 49.7
LTC40 566108 170251 Roadside 2017 0.876 29.7
LTC43 566451 173158 Roadside 2017 0.975 41.9
LTC44 567081 172837 Roadside 2017 0.975 41.7
LTC47 568787 172044 Roadside 2017 0.975 34.0
LTC48 569392 171739 Roadside 2017 0.956 25.4
LTC49 570746 171119 Roadside 2017 0.975 36.5
LTC50 571202 170765 Roadside 2017 0.975 35.5
LTC52 570726 169412 Roadside 2017 0.975 47.0

Phase 2 Air Quality Report
Phase 2 Air Quality Report v2.docx Page 102 of 104
Monitoring Site ID Ordnance Survey Grid Refs
Site Type Measurement Year
Annualisation Factor
2017 Equivalent
Annual Mean NO2 Concn
(µg/m³)
x y
LTC53 571778 168082 Roadside 2017 0.975 42.4
LTC54 572672 166727 Roadside or
UB? 2017 0.956 29.9
LTC55 572798 166596 Roadside 2017 0.975 37.1
LTC56 574694 163008 Roadside 2017 0.975 46.7
LTC57 574549 162467 Roadside 2017 0.975 33.6
LTC58 574971 162355 Roadside 2017 0.975 31.7
LTC59 572052 158657 Roadside 2017 0.975 51.0
LTC60 571806 158643 Roadside 2017 0.975 31.3
LTC61 570373 159030 Roadside 2017 0.939 49.4
LTC62 569622 159142 Roadside 2017 0.975 29.1
LTC63 569967 159184 Urban
Background 2017 1.008 44.2
LTC64 570620 161881 Urban
Background 2017 0.975 32.3
LTC65 570490 165810 Roadside 2017 1.07 59.0
LTC66 560921 159598 Urban
Background 2017 0.971 26.2
LTC67 561061 158272 Roadside 2017 0.971 31.8

Phase 2 Air Quality Report
Phase 2 Air Quality Report v2.docx Page 103 of 104
Appendix F: MIDAS Speed Profiles All MIDAS data is sample from April and October 2018 M1 Junctions 26-27 North Bound
M4 Junctions 3-4 West Bound
0
10
20
30
40
50
60
70
80
90
0 1 2 3 4 5 6 7 8 9 10 11 12 13 14 15 16 17 18 19 20 21 22 23
Spee
d (
mp
h)
Hour Beginning
1 2 3 4
0
10
20
30
40
50
60
70
80
90
0 1 2 3 4 5 6 7 8 9 10 11 12 13 14 15 16 17 18 19 20 21 22 23
Spee
d (
mp
h)
Hour Beginning
1 2 3

Phase 2 Air Quality Report
Phase 2 Air Quality Report v2.docx Page 104 of 104
M60 Junctions 24-25 Anti-Clockwise
M60 Junction 25-24 Clockwise
0
10
20
30
40
50
60
70
80
90
0 1 2 3 4 5 6 7 8 9 10 11 12 13 14 15 16 17 18 19 20 21 22 23
Spee
d (
mp
h)
Hour Beginning
1 2 3
0
10
20
30
40
50
60
70
80
90
0 1 2 3 4 5 6 7 8 9 10 11 12 13 14 15 16 17 18 19 20 21 22 23
Spee
d (
mp
h)
Hour Beginning
1 2 3