ph potential diagram of aluminum for sea water*
DESCRIPTION
Experimental pH Potential Diagramof Aluminum for Sea Water*TRANSCRIPT

Experimental pH Potential Diagramof Aluminum for Sea Water*
Ph. G/MENEZ, * J. J. RAMEAU, * and M. C. REBOUL * *
Abstract
The theoretical Pourbaix diagram for the aluminum-water system does not take into accountpitting corrosion, the usual form of corrosion for aluminum in chloride containing environ-ments. To obtain a practical representation of aluminum corrosion usable in sea water, pittingpotentials, protection potentials, and uniform attack potentials have been measured with5086 AA specimens in 3% NaCI solutions buffered within the 4 to 9 pH range. These potentialslimit passivity, pitting corrosion, and uniform corrosion areas in the potential-pH diagram. Thepassivity area of 5086 AA in 3% NaCI solution is bordered by pitting areas both in the most no-ble direction (anodic polarization) where crystallographic pits are formed, and in the most ac-tive direction (cathodic polarization) where semi-spherical pits are formed. The results are in-terpreted on the basis of local pH evolutions during polarization of the specimens. This ex-perimental diagram has been extended both to more acidic and more alkaline environments.
IntroductionAluminum is an oxidizable metal, the standard potential of theAI3 +/AI system is –1.66 V/NHE. However, it is very resistant touniform corrosion. This fact can be explained by the presenceof an oxide layer which insulates the metal from its corrosiveenvironment. This resistance is limited, however, to an envi-ronment where this oxide is only slightly soluble between pH 4and 9 (Figure 1).
In this pH range, aluminum is passive and like all passivemetals, it is prone to pitting corrosion. This is generally ex-plained by the localized acidification of the solution within thepits formed at anodic sites in chloride containing solutions.
The corrosion resistance of metals can be anticipated onthermodynamic "potential-pH" diagrams on which the thermo-dynamic metal-water reactions are represented. This diagramshows: (1) The corrosion areas of the metal by the formation ofsoluble compounds; (2) the passivity areas by the formation ofsolid phases; and (3) the immunity areas where the metal isthermodynamically stable.
The cathodic protection of metals is a remarkable prac-tical application of the E-pH diagrams: these indicate thepotential limit that must be reached to prevent corrosion.
As far as aluminum is concerned, there exists a theoreti-cal E-pH diagram' (Figure 2) which unfortunately does not giveany useful information on pitting corrosion, the most commonform of corrosion for aluminum in chloride containing environ-ments. Pitting corrosion occurs within the theoretical passivi-ty area. It is also well known that aluminum corrodes in itstheoretical immunity area. Therefore, this theoretical diagramis practically useless.
*Submitted for publication September, 1980; revised June,1981.
*Laboratoire d'Energkique Electrochimique, L.A. au C. N. R.S. 265, E. N. S. d'Electrochimie et d'Electrometallurgie deGrenoble, Domaine Universitaire, 38401 — Saint-Martin-D'Heres, France.
* *Aluminum Pechiney, Centre de Recherches et de Developpe-ment, B.P. 24 — 38340 Voreppe, France.
As M. Pourbaix did for iron ,2 it is necessary to completethis theoretical diagram with an experimental E-pH diagramrelying on kinetic data. The aim of this study is to draw that ofaluminum, applicable in sea water. For these tests, the 5086aluminum alloy is used because this alloy is usually recom-mended for marine applications. The tests were carried out ina 3% NaCI solution between pH 7 and 9, which is the simplestelectrolyte for stimulating sea water.
Methods and Experimental Devices
Measuring MethodsThe areas of passivity, pitting corrosion, and uniform cor-
rosion are limited by the characteristic potentials of the metal,and by the particular type of environment and, for certainmetals, by the experimental conditions. We determine:
The Corrosion Potential Eo. This is a mixed metal-waterpotential measure in both aerated and deaerated NaCI solu-tions:
Firstly in an aerated solution: according to a standardASTM project (third draft September 27, 1971). The NaCI 1Melectrolyte also contains hydrogen peroxide. This allows us toobtain stable and reproducible potentials. The potential isnoted as soon as the sample is immersed and every fiveminutes after that for one hour. The corrosion potential is theaverage of the values noted during the last 30 minutes.
Secondly in a deaerated solution: the sample is placed incontact with the deaerated solution. The potential isregistered until it reaches a steady value. This condition usual-ly occurs after four days. 3
The Pitting Potential Ec (or critical pitting potential).Potential above which corrosion pits will initiate and propa-gate. Two different testing methods are used.
The samples used to measure the corrosion potential inthe deaerated solution are then polarized anodically by thequasistationary galvanokinetic method. For each value of im-pressed current, the corresponding potential is recorded twominutes after each step.
0010-9312/81 /000207/$3.00/0Vol. 37, No. 12, December, 1981 © 1981, National Association of Corrosion Engineers 673

0 1 2 3 4 5 6 7 8 9 19 11 12 1 14 IS 1
0
_1 -1
_2 -2
- A"DH)3 3
-4 AI203O -4
HMITE Al203 ,H20 _5
BAYERITE Al 203,3H20 -6c
i-IYDRARGIWTE -
-7 Aj3+
AIOz 8
-9
1 0 1 2 3 4 5 6 7 8 9 10 11 12 13 14 15 16 -10
pH
FIGURE 1 — pH influence on the solubility of Al 203 and its hydrates at 25 C (according toPourbaixt).
0Oa
Qrn0
-2 -1 0 1 2 3 4 5 6 7 8 9 10 11 12 13 14 15 1614 1A
=12°4- i -6 4 -2 0 1.2
W 11
0,8Al
;^^-- 0,8
0,6 ' , 0,6
0,4 0.4AI:01.3H:0
02 ;hydrargillite 0. 2
0 Jo; 0
-0,2 -0.2
-0,4 -- -0,4
-0,6 -
-0,8 ; -0,8
- 1 I -1
t.2 -1,2
-1.4 -14
is -t,6
-1,8 0 _s _a -s
-2 -2I
2,2 AI-2,2
I
2'62 -1 0 1 2 3 4 5 6 7 8 9 10 11 12 13 14 15 16 2,6pH
FIGURE 2 — Diagram of the voltage-pH balance ofaluminum-water system at 25 C (according toPourbaixl).
Current increments used for the anodic curves E = f(log
0.01 <i< 0.1AAcm -2 Ai =0.01AAcm -2
0.1 <i< 1µAcm -2 Di=0.1AA cm -2
1 <i<10µAcm -2 Ai=1AAcm-2
674
From these curves, Ec and Eo and possibly the io corro-sion current are determined.
The pitting potential is determined on the same sample bythe scraping method proposed by Pessal and Liu .4 The poten-tial of the sample is imposed in steps of 10 mV then of 5 mVbeginning at 70 mV below the pitting potential determined bythe galvanokinetic method. At each potential value, the sam-ple is scraped with the Pyrex Luggin Haber capillary probe.This provokes a violent increase in the current. If the currentgoes back to a very low value, then the metal is once againpassive and the imposed potential is more negative than theEc. If it remains at a high value, then the metal corrodes by pit-ting and so the potential is therefore higher than the Ec. In thisway, a framework can be obtained for the pitting potential.
The Protection Potential Ep. This is the potential belowwhich corrosion pits do not propagate. Although studies car-ried out over the last 10 years have shown that there is no dif-ference between the Ep and the Ec if the induction time ofpitting^t° is taken into account, more recent studies haveshown that an aluminum chloride saturated solution is formedwithin the pits, 11 and the Ep is the pitting potential in this solu-tion. In this paper, Ep is determined by the scraping method inaluminum chloride saturated solution.
The Anodic Uniform Attack Potential Eg. This is the poten-tial from which anodic pitting corrosion can become so exten-sive that it invades the whole surface and in this way creates amore or less uniform attack. Because it is impossible to use apotentiostatic method (metals are impolarizable above the pit-ting potential), tests are carried out by an intentiostaticmethod which gives fairly steady potentials. Polarization timeis one hour. Increasing anodic currents are impressed until auniform attack of the surface is obtained. Different samplesare used for each polarization step.
Ecc Cathodic Corrosion Potential. With cathodic polariza-tion, there is no reduction of the AI 3 + (or AIO2- or AI(OH)3) butrather a reduction of water with hydrogen evolved.
The following reactions are involved:
1 —in an acidic environment: H+ + e - — —H2
2
1 —in a basic environment: H 2O + e — —H2 + OH -
2
CORROSION-NACE
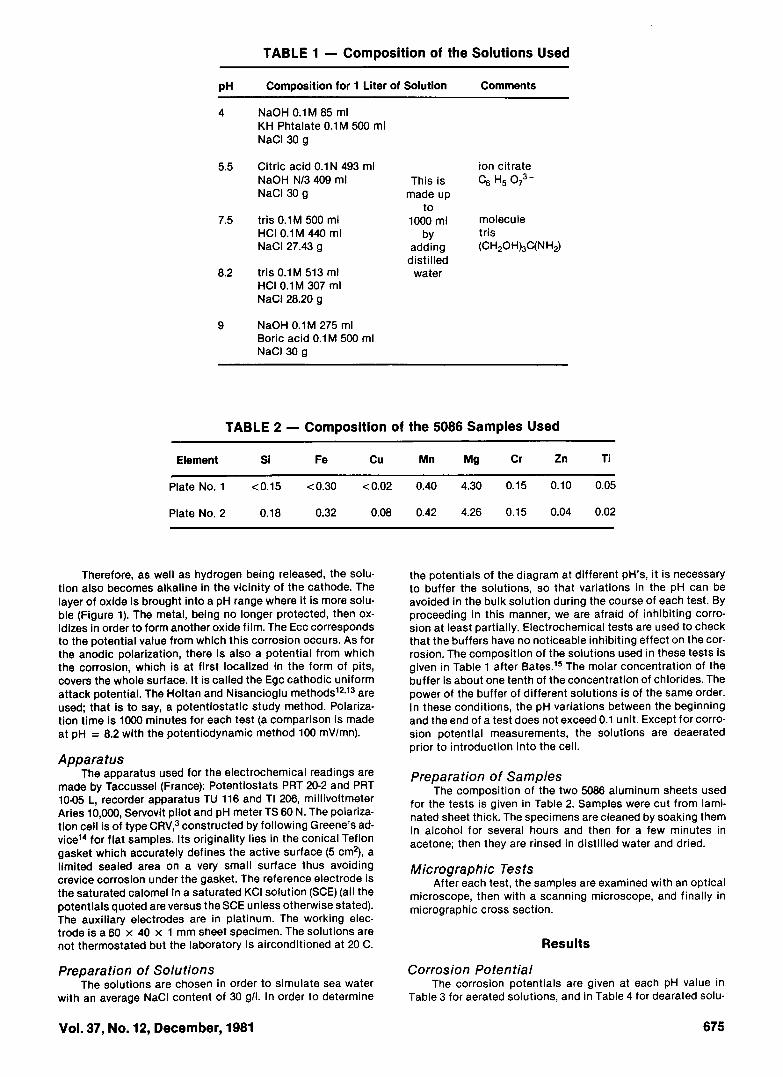
TABLE 1 - Composition of the Solutions Used
pH Composition for 1 Liter of Solution Comments
4 NaOH 0.1 M 85 mlKH Phtalate 0.1M 500 mlNaCI 30 g
5.5 Citric acid 0.1 N 493 mlNaOH N/3 409 mlNaCI 30 g
7.5 tris 0.1 M 500 mlHCI 0.1M 440 mlNaCI 27.43 g
8.2 tris 0.1M 513 mlHCI 0.1 M 307 mlNaCI 28.20 g
9 NaOH 0.1M 275 mlBoric acid 0.1M 500 mlNaCI 30 g
ion citrateThis is C6 H5 O7
madeupto
1000 ml moleculeby tris
adding (CH2OH)3C(NH2)distilled
water
TABLE 2 - Composition of the 5086 Samples Used
Element Si Fe Cu Mn Mg Cr Zn Ti
Plate No. 1 <0.15 <0.30 <0.02 0.40 4.30 0.15 0.10 0.05
Plate No. 2 0.18 0.32 0.08 0.42 4.26 0.15 0.04 0.02
Therefore, as well as hydrogen being released, the solu-tion also becomes alkaline in the vicinity of the cathode. Thelayer of oxide is brought into a pH range where it is more solu-ble (Figure 1). The metal, being no longer protected, then ox-idizes in order to form another oxide film. The Ecc correspondsto the potential value from which this corrosion occurs. As forthe anodic polarization, there is also a potential from whichthe corrosion, which is at first localized in the form of pits,covers the whole surface. It is called the Egc cathodic uniformattack potential. The Holtan and Nisancioglu methods 12 ' 13 areused; that is to say, a potentiostatic study method. Polariza-tion time is 1000 minutes for each test (a comparison is madeat pH = 8.2 with the potentiodynamic method 100 mV/mn).
ApparatusThe apparatus used for the electrochemical readings are
made by Taccussel (France): Potentiostats PRT 20-2 and PRT10-05 L, recorder apparatus TU 116 and TI 206, millivoltmeterAries 10,000, Servovit pilot and pH meter TS 60 N. The polariza-tion cell is of type CRV,3 constructed by following Greene's ad-vicet4 for flat samples. Its originality lies in the conical Teflongasket which accurately defines the active surface (5 cm 2), alimited sealed area on a very small surface thus avoidingcrevice corrosion under the gasket. The reference electrode isthe saturated calomel in a saturated KCI solution (SCE) (all thepotentials quoted are versus the SCE unless otherwise stated).The auxiliary electrodes are in platinum. The working elec-trode is a 60 x 40 x 1 mm sheet specimen. The solutions arenot thermostated but the laboratory is airconditioned at 20 C.
Preparation of SolutionsThe solutions are chosen in order to simulate sea water
with an average NaCI content of 30 g/l. In order to determine
the potentials of the diagram at different pH's, it is necessaryto buffer the solutions, so that variations in the pH can beavoided in the bulk solution during the course of each test. Byproceeding in this manner, we are afraid of inhibiting corro-sion at least partially. Electrochemical tests are used to checkthat the buffers have no noticeable inhibiting effect on the cor-rosion. The composition of the solutions used in these tests isgiven in Table 1 after Bates. 15 The molar concentration of thebuffer is about one tenth of the concentration of chlorides. Thepower of the buffer of different solutions is of the same order.In these conditions, the pH variations between the beginningand the end of a test does not exceed 0.1 unit. Except for corro-sion potential measurements, the solutions are deaeratedprior to introduction into the cell.
Preparation of SamplesThe composition of the two 5086 aluminum sheets used
for the tests is given in Table 2. Samples were cut from lami-nated sheet thick. The specimens are cleaned by soaking themin alcohol for several hours and then for a few minutes inacetone; then they are rinsed in distilled water and dried.
Micrographic TestsAfter each test, the samples are examined with an optical
microscope, then with a scanning microscope, and finally inmicrographic cross section.
Results
Corrosion PotentialThe corrosion potentials are given at each pH value in
Table 3 for aerated solutions, and in Table 4 for dearated solu-
Vol. 37, No. 12, December, 1981 675

tions. Also indicated are standard duration potentials, numberof tests carried out in the 5.5 to 8.2 pH range and the io corro-sion current.
Anodic CorrosionFigure 3 shows the curve E = f (log i) obtained by the
quasistationary galvanokinetic method at pH = 8.2. Table 5recapitulates the pitting potentials obtained.
The protection potential is the critical pitting potentialmeasured in a saturated AICI 3 solution. Commercial aluminumchloride contains an excess of acid. In order to eliminate thisacid, a high purity aluminum sheet is soaked at 20 C in thesolution. So two types of solution are prepared and three testsare carried out:
Test 1—the aluminum sheet is soaked for two days (pH =0.5); Test 2—idem; and Test 3—the aluminum sheet is soakedfor 5 days (pH = 1).
The 5086 alloy has no passivity range in an aluminumchloride saturated solution. This is why the pitting potential isat the same level as the corrosion potential.
Table 6 shows that there is no significant differencesbetween the two solutions prepared for these tests. The pro-tection potential can be taken at: Ep = 863 mV; Standarddeviation = 9 mV.
The anodic uniform attack potential Ega is given in Table7 at different pH's as well as the corresponding anodic cur-rent. These pits are of the crystallographic type (Figures 4 and
TABLE 3 — Corrosion Potentials in an Aerated Solution
pH 4 5.5 7.5 8.2 9
Eo (mV) -743 -741 -749 -751 -754
Standarddeviation (mV) 6 3 6 4 7
Number of tests 4 3 3 4 4
TABLE 4 — Corrosion Potentials in a Deaerated Solution
pH 4 5.5 7.5 8.2 9
irreprodu-Eo (mV) cible -890 irreproducible -1120
Number of tests 2 4 4 2 2
Standarddeviation (mV) — 10 — — 23
iO (AA/cm - z) — 0.25 0.07 0.16 —
E V ,v 3
, ,o'sce
^, ^ ^p0.7 -^$ —7S—^l.FU-1 0.7
oe os
PH: BR
0) ^n oQ i •test, os
't
—Q
/ ,o
n test 2
1. I TR
FIGURE 3 — Curve E = f (log I) obtained by the quasistationary galvanokinetic at pH = 8.2(NaCI 30 gll).
676 CORROSION-NACE

TABLE 5 — Pitting Potentials
Number ofStandard Tests
Method Used pH Ec (mV) Deviation Carried Out
Galvanokinetic 4 –714 27 2Scraping potential 4 –724 3 5
Galvanokinetic 5.5 –727 15 4Scraping potential 5.5 –745 8 5
Galvanokinetic 7.5 –762 11 4Scraping potential 7.5 –768 5 7
Galvanokinetic 8.2 –704 2 2Scraping potential 8.2 –764 8 5
Galvanokinetic 9 –707 50 2Scraping potential 9 –718 6 3
TABLE 6 — Corrosion Potentials andScraping Potentials in an
Environment of Saturated AIC1 3
Test 1 2 3
Eo (mV) – 868 –847 –868
E scraping (mV) –868 –853 –868
TABLE 7 — Anodic Uniform Attack Potential
pH 4 5.5 7.6 8.2 9
Ega (mV) –707 –693 –715 –720 –718
i mA/cm2 30 30 28 40 28
5). The depths of the pits are measured with the micrometricscrew of an optical microscope. They are between 20 and 30µm inclusive. They are spread in a uniform manner over thewhole surface of the sample. However, when the specimen isscratched, the scratch becomes a favorite point of attack. Wehave not noticed any pH influence. The pits density increaseswith the current density. There is no obvious morphologicaldifference between the pits obtained in a 30 g/I NaCI solutionand those obtained in an AICI3 saturated environment. By us-ing the scanning microscope, we observe some very geometricfacets (Figures 4 and 5). This can be explained by the fact thatthe attack occurs according to well defined crystallographicdirections. Previous studies have shown that it is the <100>direction.
Cathodic CorrosionFor each pH, the network of potentiostatic curves is
traced, an example of which is given at pH 8.2 (Figures 6 and7). The log i in function with log t curves shows that a return topassivity takes place "in a short time" (Figure 6). The log i infunction with t (Figure 7) shows that a stationary current isusually reached within 1000 minutes. On each curve, two par-ticular currents are tabulated: (1) The density of the current at1000 minutes (i at 1000 mn), and (2) the density of the maximumcurrent during the course of the 1000 mn of polarization (imax).
FIGURE 4 — Photograph with scanning electronmicroscope. Anodic pitting obtained by a potentio-dynamic test NaCI 30 g/l, pH = 7.5, 224X. FIGURE 5 — Same specimen as in Figure 4 but at 2240X.
Vol. 37, No. 12, December, 1981 677

I5 , '
7 x 1E—w ^ l^—.-ate n`y-n^n^n^\
S
r •`rte/
10
*-* i❑ fj-: pH: e,2
r E: -1,1 VSCE 102\ ° o— • E:-115
o- XE42V E:43
♦ E; -1,45
^^^ \^♦ ♦ ° / ❑ E:-♦ o E: -1,35 103
/
,o ,o t
FIGURE 6 — Cathodic potentiostatic curves log i = f (log t) - NaCI 30 gll pH = 8.2.
O qw ^ uu
, ,
70
V
•
* ❑
• E..1,1 VSC7 N n E:.11S
♦^--^♦^ *; ,4
^^- pHQ • E:.145 ..jE •--O ^^^ ❑ R:1,5
011,55♦ E1,6•(:1 ,65 .
O QOO mo Ann enn Innn
FIGURE 7 — Cathodic potentiostatic curves log I = f (t) - NaCI 30 g/l pH = 8.2.
On each pH, two polarization curves are drawn. Figure 8is an example for pH 8.2: (1) E as a function of log (i max), and(2) E as a function of log (i to 1000 mn). A comparison has beendone between this method and the potentiodynamic method100 mV/mn.
Microscopic observation of the samples enables todistinguish the two potentials Ecc and Egc. Table 8 gives theEcc and the Egc for each pH as well as the corresponding cur-rents icc max and icc at 1000 mn, igc max and igc at 1000 mn.
The cathodic pits are of the hemispherical type. From amacroscopic point of view, they follow the milling lines. For agiven potential, their size grows when the pH increases. Inorder to make this point clearer, if we consider a pH of 7.5, thedepth and diameters of the pits vary between 20 and 30 µm.For a given pH, the density of pitting increases when thepotential becomes more negative. Moreover, the transition
from localized corrosion to uniform attack is quite sudden. Anexamination through the scanning microscope shows (Figure9) that each pit is a crater, the bottom of which is carpetedcavities. Examinations in micrographic cross section show theexistence of small deep holes of 3 to 4µm in width opening upinto the main crater of a pit. On the other hand, the presence ofintermetallic compounds containing the elements Fe, Si, Mn,and Mg were observed inside the anodic pits. The matrix isworn away by corrosion and not the emerged precipitates.However, there are quite a large number of empty pits.
Extending the GraphTwo series of tests were carried out to obtain information
on the development of the graph for pH's of less than 4 andmore than 9. Acidic solution (250 ml KCI, 0.2M; 670 ml HCI,0.2M; and 19.23 g NaCI) diluted to 1000 ml with distilled water,
678 CORROSION-NACE

1 10 10' 10' 10' E`
11 ,n 11
n pIt 8,2
'12 n 12— —,I max
— n—i at 1000 min
—*—potentiokinetic0 V mm a
1,a *\ \
# n
*^ n le
10 10 10' 10i uAcm- '
FIGURE 8 — Drawing of cathodic potentlostatic tests E = f (log 1)1 indicates: either i after
1000 mn of polarization (i to 1000 mn) or i maximum during these 1000 mn of polarization, pH= 8.2 - NaCI 30 g/l.
TABLE 8 — Ecc Cathodic Corrosion Potentials(Appearance of Pitting) and Egc Uniform Cathodic Attack Potential
icc at igc atEcc 1000 mn icc max Egc 1000 mn igc max
pH mV µA cm -2 µA cm -2 mV µA cm -2 µA cm -2
4 -1375 4 7 -1475 9000 120005.5 -1325 30 30 -1450 1200 12007.5 -1300 2 4 -1600 1100 36008.2 -1175 1.3 16 -1650 1500 55009 -1075 0.5 0.7 -1625 1500 6000
It is possible to limit the Ecc of this pH at:
-1065 mV < Ecc < -945 mV
SCE
FIGURE 9 — Cathodic pitting which took place at E _-1550 mVISCE NaCI 30 gll pH = 7.5.
a pH of 0.9 is obtained. The solution is deaerated, two intentio-static tests which last one and a half hours each in cathodicpolarization: (1) i impressed = -1 mA cm -2. The potential in-creases from -945 to -900 mV. There is no pitting corrosiondiscernable. (2) i impressed = - 10 mA cm -2. The potential in-creases from - 1065 to -965 mV, cathodic pits appears.
Alkaline solution (3 g Ca(OH) 2, 30 g NaCI) diluted to 1000 mlwith distilled water.
A lime saturated solution pH = 11.6 is obtained; there-fore, a good buffer. A 5086 aluminum alloy sample is immersedin this solution exposed to the air for one week. Its corrosionpotential fluctuates from between -1200 to -1400 mV. Thecorrosion observed is identical to the type of uniform cathodicattack (Figure 10). We also observe that this type of corrosionincreases in the form of hemispherical shaped pits.
In the deaerated solution, a sample is cathodicallypolarized for 100 mn under a current of 1µA cm -2. The poten-tial increases from -1365 to -1250 mV. At the end of the test,a large number of localized pits appears.
From these two tests, one can limit Ecc and Egc: Ecc >-1250 my and Egc > -1400 mV. To take into account thelength of time for each test, it must be noted that these valuesare, without a doubt, much more negative than the real values.
Discussion of the ResultsIn this section, the validity and the choice of the poten-
tials measured to draw an experimental pH-potential diagramof the 5086 aluminum alloy usable in sea water (Figure 11)are discussed.
Vol. 37, No. 12, December, 1981 679

FIGURE 10 — Scanning electron microscope: cathodicpitting obtained by immersion in a lime saturated solu-tion. NaCl 30 gll - pH = 11.6.
Corrosion Potential inAerated Solution (Figure 11)
The values obtained are reproducible. They show a veryslight decrease in the corrosion potential when the pH in-creases. It is important to notice that the corrosion potential iswithin the pitting area of the diagram. This is an agreementwith practical observations: aluminum alloy is liable to pittingcorrosion in sea water. Groover, Lennox, and Peterson 16 founda more negative corrosion potential with different experimen-tal conditions.
Anodic Corrosion (Figure 11)Concerning the Ec pitting potential, the scraping method
gives the most negative results which are characteristic of themetal and not of the oxide layer.° As far as the pH influence isconcerned, it is very weak, and varies from between - 720 to- 750 mV/SCE and is minimum in the 7 to 8 pH range. Turcotteand Heidersbach 17 observed similar results after tests on the6351 aluminum alloy. Hung N'Guyen and Foley 18 explain theinfluence of the pH by the stoichiometry of the soluble com-pound formed (AICI4 - in an acidic environment; Al (OH)2Cl4 -
in a neutral environment). In any case, all the authors are inagreement over the fact that the pH does not determine the pit-ting potential and this point of view also matches the presentobservations.
Concerning the Ep protection potential (Figure 11), thehypothesis that Ep is the pitting potential in an AICI3 saturatedsolution is made and so Ep is independent of the pH. In thishypothesis, Ep = -863 mV/SCE. This value is exactly thesame as observed by de Michell'' when working in the sameelectrolyte conditions but with pure aluminum. Holtan andNisancioglu9 summarized the bibliography on this topic. Thisinformation meets the values obtained here. The Ep positioncreates an imperfect passivity area which reduces the passivi-ty one.
Results concerning the Ega uniform anodic attack poten-tial are given in Figure 11. When anodic currents of increasingintensity are applied, localized corrosion is observed whichbecomes worse and worse; then etching takes place and final-ly above a density of about 30 mA/cm 2, a general attack occursin the form of uniform corrosion and thus the sample appearsto be covered with fine granules. Ega is only different from Ecin the pH range where the oxide is highly insoluble.
Three areas are defined on the graph: (1) Above Ega, rangegeneral anodic attack; (2) between Ega and Ec, anodic pittingcorrosion ranges which only exist for the pH's where the oxideis insoluble; and (3) between Ep and Ec, the imperfect passivity
FIGURE 11 — Experimental E-pH diagram of the 5086aluminum alloy in a chloride environment (Ther-modynamic E-pH graph in mixed lines).
range in Pourbaix's terminology.2 In this range, the pittingwhich has already begun is able to increase.
It can be estimated that -863 mV/SCE is the maximumpotential that can be reached for protecting the 5086 alumi-num alloy. The position of the Ega potential varies accordingto the polarization time for the intentiostatic tests (one hour).Consequently, we can presume that the range of localized cor-rosion would doubtless be smaller, had the polarization timebeen longer.
Cathodic Corrosion (Figure 11)Ecc increases with the pH, especially from pH 7.5. The
development of the Egc is more difficult to understand. Thegeneral attack is expected to appear much more quickly withvery high pH's. This is also suggested by the rise of the curveabove pH 9 and by the tests carried out in lime (Figure 10).
General cathodic attack is a disastrous form of corrosionbecause it consumes 1/10 mm of the sample within 1000minutes of polarization. Moreover, the transition from generalattack to localized corrosion is very sudden (about 50 mV).
The theory of local alkalinization seems to have beenuniversally accepted. This can be confirmed by studying thetests carried out in an environment with a lime buffer. Thesetests seem to show that uniform corrosion at a high pH in-creases in the form of hemispherical pits. The works of Holtanand Nisancioglu 13 defined two types of patterns: (1) Localizedcorrosion in an environment with no buffer, and (2) no pitting inan environment with an acetate buffer (pH 4.8). According tothese results, there should exist a range of pitting corrosion atpH = 4.8. This difference can perhaps be explained quitesimply by the different patterns of the 5086 and pure alumi-num. Moreover, the range is smaller, relatively speaking, at pH= 4.8 (100 mV). Cerny19 carried out tests over a period ofseveral weeks, during his research on cathodic protection. Hefound a connection of the Am = Aiatb type. Where Om is theweight loss, A = a constant of proportionality, i = the density
680 CORROSION-NACE

ErvS^Q6 _- -_-_-_ general_ - - - - - - attack I-_ - *'t- --.
°B -_-^!s situp felt ^siri j s * ^A;^-_- -
ssivity—A—Ega -__ :: ----_—+ Ec
Ep • ttio9'--_
—*—Egc
----_-_- - -general -- -- -_-_- -- - - - - _attack -- - - _,6 ----------•--------- ------- -_
zO -- -- ------ ----------^_-_-_-_-_
Q4---------------------- -------
1 O 1 2 3 4 5 6 7 9 10 'N 12 1:
pH
FIGURE 12 — Experimental E•pH diagram of the 5086aluminum alloy in chloride environment with extrapola-tion of pH less than 4 and more than 9. Thermodynamicgraph In dotted lines.
of cathodic current, t = the polarization time, and a and b areconstants around one. The weight loss would be approximate-ly proportional to the polarization time and to the current den-sity. Moreover, the density would be a more significant factorthan the potential for expressing the cathodic corrosion.
The works of Lennox and Peterson, 20 carried out over aperiod of 50 days, show that current densities of 100 to 100014A/cm2 cause disastrous corrosion. Likewise, the presentpaper also shows that uniform attack begins to appear withdensities of around 1000,uAlcm 2. In order to interpret the infor-mation from the Ecc and the Egc curves, two criteria must betaken into account: (1) The tendency of the environment tobecome alkaline—this is as high as the pH in the bulk solutionis strong; and (2) the release of hydrogen which occurs atpotentials which are as high as the pH is low.
These two criteria vary and in so doing contradict oneanother. It would seem that the first criteria is connected withthe appearance of pitting and so with the Ecc position.Therefore, the second criteria would be the determining factorfor the Egc uniform attack.
The power and concentration of the electrolyte's bufferalso influence these potentials: the electrochemical reactionof the release of hydrogen is affected by the chemical reac-tions of the proton. 21 Finally, the different behavior patterns ofthe precipitates of intermetallic phases contained in thematrix were observed. This dissolves under the effect ofcathodic polarization whereas the intermediate compoundsare not affected. As far as localizing the spot where pittingbegins is concerned, a great number of these holes are "livedin" by these precipitates. This, however, does not definitivelyestablish a connection between the two. The matter could besolved by carrying out tests of the same kind, but for aprevious surface treatment.
It is possible to define two fields of cathodic corrosion: (1)A pitting corrosion range which extends towards high pH's,
and (2) a range of uniform attack. The Ecc and Egc positionsalso vary according to the polarization time (1000 mn) andprobably according to whether or not the solution is renewed.
Extending the Graph (Figure 12)Hypothesis can be made on the acidic and alkaline ph's
on the extension of the graph by using the results obtained atpH = 0.9 and 11.6, and taking the following considerations in-to account:
1. Aluminum is only passive in a neutral environmentwhere it is coated with a layer of protective oxide.
2. Pitting corrosion is connected with the solubility ofthis oxide and therefore with the passivity of the metal. So, itdisappears in very acidic and very alkaline environments butthe uniform attack which takes over, increases in the pitswhich rapidly extend over the whole surface.
3. The hypothesis concerning the formation of aluminumchloride, with acidification taking place at the bottom of thepit, becomes more difficult to reach in a very alkaline environ-ment: the Ec potential is very positive and it is probable thatbetween -860 mV and the Ec, there exists a general hemi-spherical attack connected to the alkaline content of the en-vironment.
4. Theoretical immunity (graph with mixed lines) cannotbe reached because with these very negative potentials, thedestruction of the water is such that it is impossible to talk ofneutral solutions.
Therefore, if the graph is extended in this way, it showsthe importance of the solubility of the oxide layer on the corro-sion of the 5086 aluminum alloy. In particular, it proves the im-portance of the acidification and alkalinization reactions atthe time of anodic and cathodic pitting.
ConclusionsAn experimental E-pH diagram has been drawn for the
5086 aluminum alloy in 30 g/I NaCI solutions. This diagramshows different corrosion areas, at the sea water pH (8.2); theyare:
1. A passivity area lies between -863 and -1175 mVSCE. It is limited by anodic and cathodic corrosion areas. Thepassivity area only exists within the pH zone where the oxideis slightly soluble. With the experimental conditions used inthis paper, the passivity takes place in the 1 to 9 pH range.
2. An imperfect passivity area lies between -863 and-764 mV SCE. The pits which already existed continue togrow but, on the other hand, new ones do not form.
3. An anodic pitting corrosion area lies between -764and - 720 mV SCE, and crystallographic pits are formed.
4. A uniform anodic attack range above -720 mV SCE.5. A cathodic corrosion area range below -1175 mV SCE.
First semi-spherical pits are formed, then a uniform attack isproduced with higher cathodic polarization.
These corrosion areas may be understood by pH evolu-tions produced by polarization near the specimens: (1)acidification generated by anodic polarization, and (2)alkalinization produced by cathodic polarization.
References1. M. Pourbaix. Atlas d'equilibres electrochimiques a 25 C.
Ed. Gauthier Villars, p. 171 (1963).2. M. Pourbaix. Rapports techniques du Cebelcor RT 179,
July, 1970.3. M. Reboul. Methodes de mesure de la corrosion general-
isee de ('aluminum et de ses alliages. Revue de I'alumi-nium, p. 339 (1973) June.
4. N. Pessal and C. Liu. Electrochimica Acta, Vol. 16, p. 1987(1971).
5. A. Broli and H. Holtan. Corrosion Science, Vol. 13, p. 237(1973).
6. A. Broli and H. Holtan. Corrosion Science, Vol. 17, p. 59(1977).
Vol. 37, No.12, December, 1981 681

7. H. Holtan and Nisancioglu. Corrosion Science, Vol. 18, p.235 (1978).
8. A. Broli, H. Holtan, and H. Sigurdson. Werkstoffe andKorrosion, Vol. 26, p. 629 (1975).
9. H. Holtan and K. Nisancioglu. Werkstoffe and Korrosion,Vol. 30, p. 105 (1979).
10. A. Broli, H. Holtan, and K. L. Prestrud. Corrosion, Vol. 30,No. 12, p. 427 (1974).
11. S. De Micheli. Corrosion Science, Vol. 18, p. 605 (1978).12. H. Holtan and K. Nisancioglu. Electrochimica Acta, Vol.
24, p. 1229 (1979) December.13. H. Holtan and K. Nisancioglu. Proceedings of the 8th
Scandinavian Congress. Theory and Praxis of CorrosionPrevention, Helsinki, Vol. 1, p. 90 (1978).
14. N. D. Greene. Experimental Electrode Kinetics. Rensse-laer Polytechnique Institute, Troy, New York 12181 (1965).
15. R. G. Bates. Determination of pH Theory and Practice.J. Wiley and Sons, Inc., N.Y., p. 156-162 (1964).
16. R. E. Groover, T. J. Lennox, and M. H. Peterson. MaterialsProtection, Vol. 8, No. 11, p. 25 (1969).
17. R. Turcotte and R. Heidersbach. Corrosion/78, Paper No.165, Houston, March 6-10, 1978.
18. T. H. Nguyen and R. T. Foley. Technical Report No. 9, Janu-ary, 1979.
19. M. Cerny. Zaschita Metallov., Vol. 11, No. 6, p. 687 (1975),Nov. Dec.
20. T. J. Lennox and M. H. Peterson. Naval Engineers Journal,p. 73 (1977) August.
21. K. J. Vetter. Electrochemical kinetics. Theoretical As-pects. Academic Press, New York—London, p. 433 (1967).
Effect of Steam Impurities on CorrosionFatigue Crack Growth Rates of a
Turbine Disc Steel*
R. RUNGTA, * J. A. BEGLEY, * * and R. W. STAEHLE* * *
Abstract
Corrosion fatigue crack growth studies have been conducted on a Ni-Cr-Mo-V turbine discsteel in saturated sodium chloride and sodium sulfate environments at 100C.Theresults showthat crack growth rate is accelerated in both the environments at open circuit potential, com-pared to the rate in air environment. Crack growth rate is further accelerated in both en-vironments with the application of a large cathodic potential. Anodic potential has no effecton crack growth rate relative to that at open circiut potential. Cracking occurred transgran-ularly around the open circuit potential and intergranularly under severe cathodic chargingconditions. The amount of intergranular cracking increased with decreasing frequency in theCI - environment and occurred predominantly at lowAK levels. It is suggested thatthematerialcracks by two mechanisms: hydrogen embrittlement at very cathodic potentials, and film rup-ture and anodic dissolution at relatively noble potentials around the open circuit potential.Finally, comparison of the results with those for concentrated sodium hydroxide (100 C) anddouble distilled water (97 C) shows that although sodium hydroxide (which is another impuritypresent in the steam) is the most aggressive specie, distilled water inhances cracking as well.It is recommended that further work be done in high purity water.
IntroductionAn investigation has been conducted on the effect of steamimpurities Cl - and SO4 = on the fatigue crack growth rate pro-perties of an ASTM A-471 trubine disc steel. These impuritieshave been found in the deposits on the turbines and occur invery large concentrations. 1 ' 2 The steam picks up impuritiesfrom a variety of sources, such as demineralizer breakdown,condenser leaks, and boiler water treatment chemicals. Drysteam carries these impurities to the turbines and depositionoccurs whenever the solubility of the impurity in the steam isexceeded. This condensation occurs anywhere on the low
*Presented during Corrosion/81 (Paper 8), April 1981,Toronto, Ontario, revised June, 1981.
*Structural Materials and Tribology, Battelle's ColumbusLaboratories, 505 King Ave, Columbus, Ohio.
**Westinghouse Electric Corporation, R&D Center, Pitts-burgh, Pennsylvania.
***Institute of Technology, University of Minnesota, Minnea-polis, Minnesota.
pressure (LP) turbines depending on whether the turbine isrunning at full load or part load.
According to Jonas, 3 the most critical region in a turbineset is in the LP turbine just before the moisture region. Con-centrated solutions form ahead of the Wilson line because oftheir thermodynamic stability in this region. Beyond theWilson line, the droplets are diluted and the deposits arewashed away.
Chloride and sulfate are both strong pitting agents. Notonly do these pits act as stress raisers (and possibly as crackinitiation sites), but the aggressive environment further con-tributes to increasing the crack growth rates under ap-propriate conditions of static as well as cyclic loading.Although pitting was found to be of no consequence in thistest program, it can exert influence on crack initiation life inservice.
Since cyclic stresses may, in general, produce muchfaster crack growth rates compared to static loads, it is impor-tant that cyclic stresses be given closer attention inestimating design life or inspection intervals for a turbine.
0010-9312/81/000209/$3.00/0682 © 1981, National Association of Corrosion Engineers CORROSION-NACE