petsec energy ltd
TRANSCRIPT
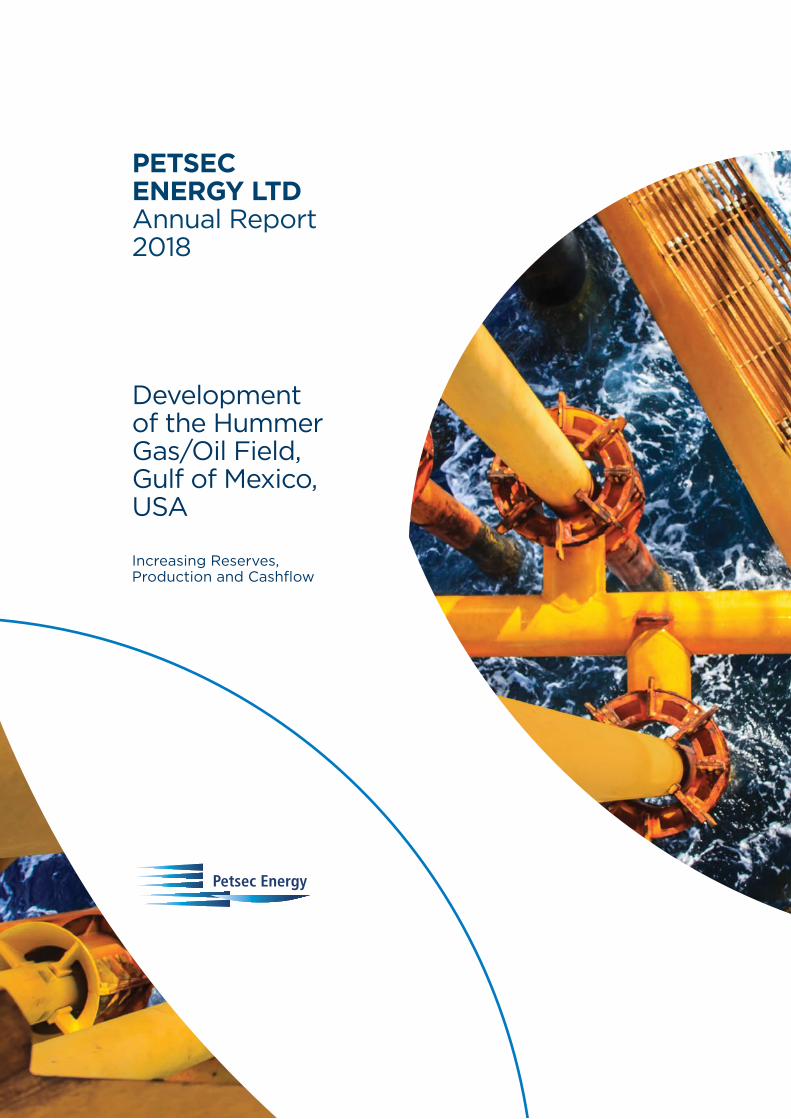
PETSEC ENERGY LTD Annual Report 2018
Increasing Reserves, Production and Cashflow
Development of the Hummer Gas/Oil Field, Gulf of Mexico, USA
18191_Petsec_AR_EDS_V4.indd 4-1 12/03/2019 9:30 AM
Corporate Objective and Strategy 02
Company Profile and History 03
2018 Year in Review 04
Chairman’s Report 06
Operations Review 10
Oil and Gas Reserves 15
Directors’ Report 17
Lead Auditor’s Independence Declaration 32
Financial Report for the Year Ended 31 December 2018 33
Directors’ Declaration 66
Auditor’s Report 67
Exploration and Production Interests 73
Shareholder Information 74
5 Year Comparative Data Summary 75
Glossary 77
Corporate Directory 78
Contents
Petsec Energy Ltd ABN 92 000 602 700
The Company is listed on the Australian Stock Exchange (symbol: PSA) and traded over the counter in the USA as American Depositary Receipts (ADRs) (symbol: PSJEY). Its corporate office is in Sydney, Australia, its USA operations offices are in Houston, Texas and Lafayette, Louisiana, and it’s Middle East and North Africa (MENA) operations office is in Dubai, United Arab Emirates (UAE) and Sana’a, Yemen.
Annual General MeetingTo be held at: 11 a.m. (AEST) on Thursday, 2 May 2019, at the Governor Macquarie Tower, Level 15 Bligh Room, 1 Farrer Place, Sydney, NSW Australia.
Capital Structure At 18 February 2019 AustraliaExchange ASXTicker PSAShares on issue 368.6 millionShare price A$0.11Market capitalisation A$40.5 million
USAExchange OTC Pink SheetsTicker PSJEY
18191_Petsec_AR_EDS_V4.indd 4-1 12/03/2019 9:30 AM
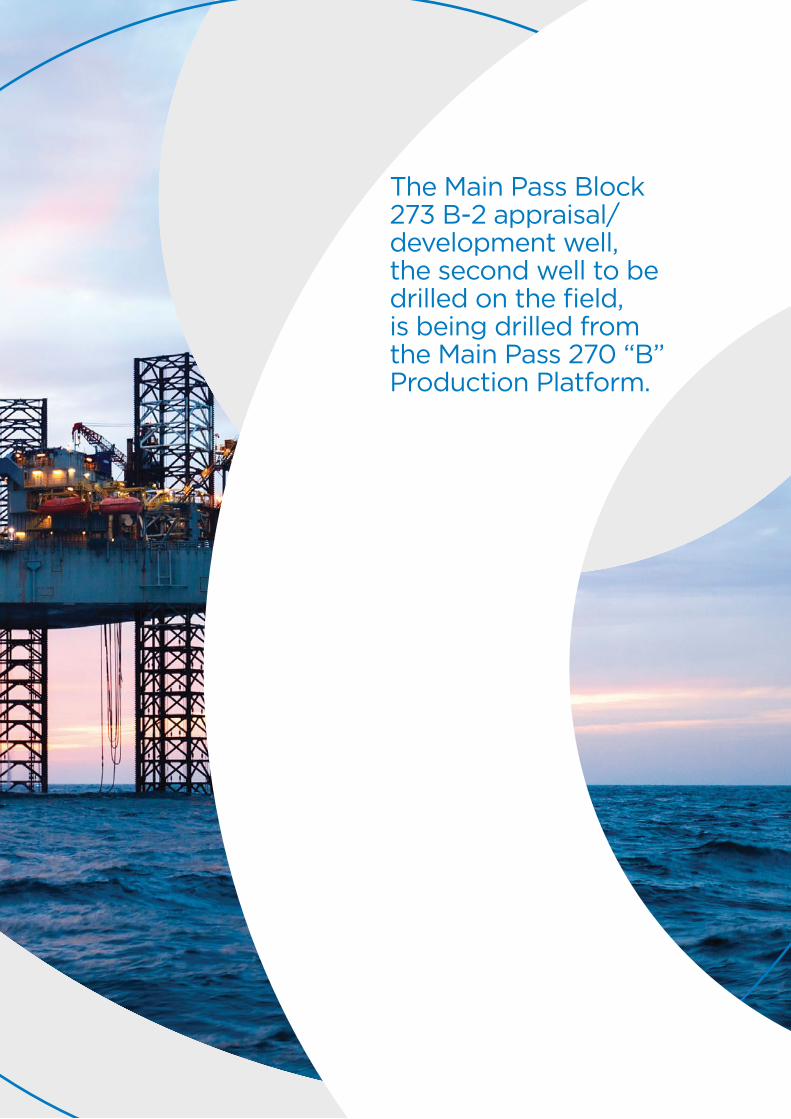
The Main Pass Block 273 B-2 appraisal/development well, the second well to be drilled on the field, is being drilled from the Main Pass 270 “B” Production Platform.
Image: Offshore Jack Up Rig
18191_Petsec_AR_EDS_V4.indd 2-3 11/03/2019 4:28 PM
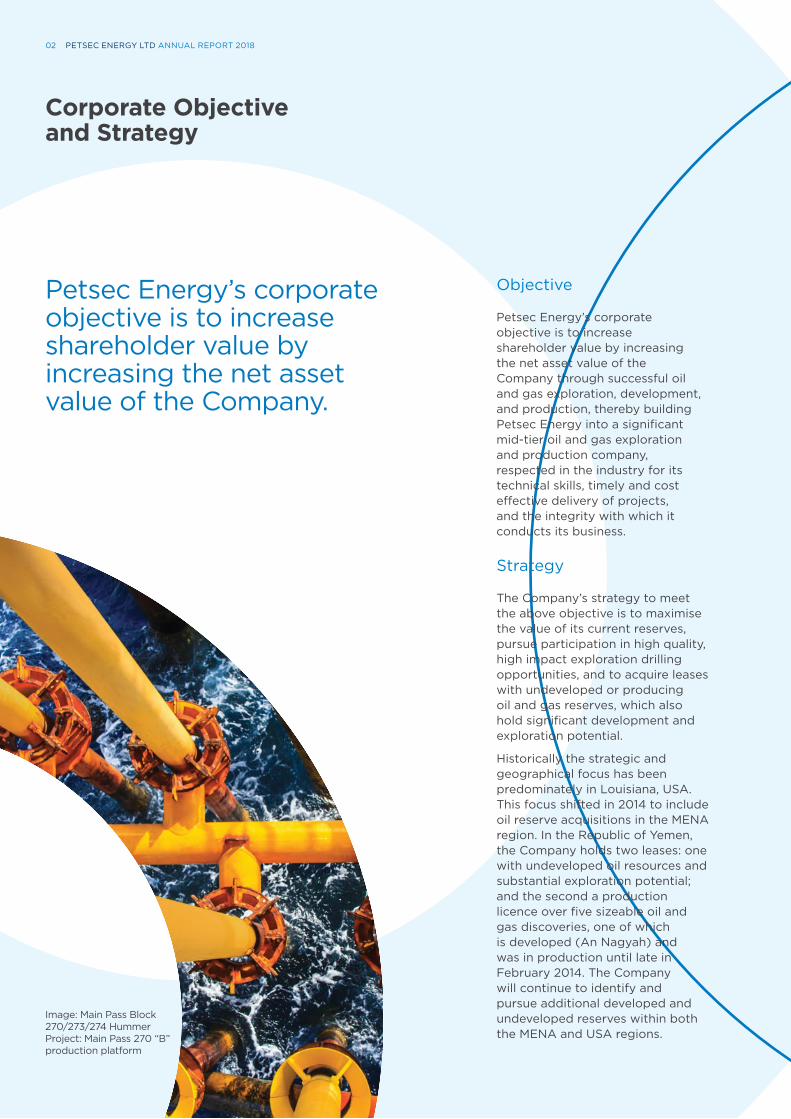
Petsec Energy’s corporate objective is to increase shareholder value by increasing the net asset value of the Company.
Corporate Objective and Strategy
Petsec Energy’s corporate objective is to increase shareholder value by increasing the net asset value of the Company through successful oil and gas exploration, development, and production, thereby building Petsec Energy into a significant mid-tier oil and gas exploration and production company, respected in the industry for its technical skills, timely and cost effective delivery of projects, and the integrity with which it conducts its business.
Objective
The Company’s strategy to meet the above objective is to maximise the value of its current reserves, pursue participation in high quality, high impact exploration drilling opportunities, and to acquire leases with undeveloped or producing oil and gas reserves, which also hold significant development and exploration potential.
Historically the strategic and geographical focus has been predominately in Louisiana, USA. This focus shifted in 2014 to include oil reserve acquisitions in the MENA region. In the Republic of Yemen, the Company holds two leases: one with undeveloped oil resources and substantial exploration potential; and the second a production licence over five sizeable oil and gas discoveries, one of which is developed (An Nagyah) and was in production until late in February 2014. The Company will continue to identify and pursue additional developed and undeveloped reserves within both the MENA and USA regions.
Strategy
Image: Main Pass Block 270/273/274 Hummer Project: Main Pass 270 “B” production platform
PETSEC ENERGY LTD ANNUAL REPORT 201802

18191_Petsec_AR_EDS_V4.indd 2-3 11/03/2019 4:28 PM
Company Profile and History
Petsec Energy Ltd is an independent oil and gas exploration and production company listed on the Australian Stock Exchange (symbol: PSA) and traded over the counter in the USA in the form of American Depositary Receipts (symbol: PSJEY).
The Company was established on 7th December 1967 and its registered Australian Company Number is: 000 602 700.
The Company through its wholly owned subsidiary companies Petsec Energy Inc. and Petsec Exploration and Production LLC has operations in the shallow waters of the Gulf of Mexico and onshore Louisiana, USA. The Company also owns interests onshore in the Republic of Yemen through its wholly owned subsidiary Petsec Energy (Middle Eastern) Limited.
The Company has been active in the USA since 1989 and has explored offshore in the Gulf of Mexico and onshore in Louisiana, and Texas. The Company has drilled over 100 wells in the USA and has enjoyed a success rate of 74%.
From 2002 to 2011, the Company was active in the Beibu Gulf, China, participating in the drilling of seven exploration wells resulting in three oil fields being discovered. The fields were sold in 2011.
In 2014, the Company determined that it wished to pursue both an exploration and an oil reserves acquisitions strategy. Following
a strategic review, the Company identified the Middle East & North African (MENA) region as a growth area for the Company where licences with producing oil reserves or near development reserves, with associated high exploration potential, can be acquired at lower prices than those in the USA.
In 2015, a non-operated interest in a large licence (Block 7) area was acquired in Yemen, which held a potentially large undeveloped oilfield discovery and a number of drill prospects which held potentially very large oil reserves ranging up to 900 million barrels of oil. In 2017 and 2018, the Company completed several transactions that resulted in securing Block 7 operatorship and will take the Company’s interest in Block 7 to 100% subject to customary approvals from the Yemen Government.
In early 2016, the Company acquired a 100% working interest in Damis (Block S-1) in Yemen, which holds five oil and gas fields of which one field, the An Nagyah Oilfield, had been developed and was producing until political unrest in 2014 caused it to be shut-in.
The Company’s corporate office is in Sydney, Australia and the Company’s operational offices are located in Houston, Texas, Lafayette, Louisiana in the USA, and in Dubai, UAE, and Sana’a, Yemen in the MENA region.
The Company has been active in the USA since 1989 and has explored offshore in the Gulf of Mexico and onshore in Louisiana, and Texas. The Company has drilled over 100 wells in the USA and has enjoyed a success rate of 74%.
74%success rate
03CORPORATE PROFILE / CORPORATE OBJECTIVE & STRATEGY
to participate and upon approval acquire their 25% working interest in Block 7. The KUFPEC transaction brings the Company’s potential interest in the block to 100% pending customary approvals from the Government.
• The block of 5,000 square kilometres (1,235,527 acres) contains the undeveloped Al Meashar oil discovery made in 2010 which holds target resources of 11 MMbbl to 50 MMbbl of oil. The two discovery wells, on limited production test flowed at 200 to 1,000 bopd. The block also contains an inventory of eight leads and prospects, holding mapped target sizes ranging from 2 MMbbl to 900 MMbbl, which are defined by 2D and 3D seismic surveys. The top four prospects hold potential in excess of 1 billion barrels of recoverable oil.
Damis (Block S-1) Production Licence, Yemen
Petsec: 100% working interest (82.5% participating interest)• The block of 1,152 square kilometres
(284,665 acres), located in the Marib Oil Basin, was acquired by the Company in early 2016.
• The block contains five sizeable oil and gas discoveries with target resources in excess of 54 million barrels of oil and 550 Bcf of natural gas including the developed/productive An Nagyah Oilfield (> 19.8 MMbbls remaining) complete with surface facilities to process and transport 20,000 bopd. The An Nagyah Oilfield commenced production in 2005 with an estimated 50 MMbbls of recoverable oil of which half remains. The field has been shut-in since 2014 due to the political situation in the country.
• The An Nagyah Oilfield was estimated by DeGolyer and MacNaughton, reserve engineers, to hold 19.8 million barrels of remaining recoverable oil. Using the proposed trucking production rate of 5,000 bopd over the minimum remaining period of the production licence of 10 years and 1 January 2016 forward oil prices, operations would deliver gross 2P reserves of 12.8 MMbbl, of which 5.6 MMbbl of oil was attributed to Petsec Energy. The NPV10 of that 5.6 MMbbl was
the second well to be drilled on the field, is being drilled from the Main Pass 270 Production Platform. The well was spud on 19 August 2018 and on the 19 February 2019 the well was at 15,037 feet and drilling ahead.
• The B-2 well is designed to test, in a structurally advantageous position, six potential oil and gas reservoirs, these being the five oil and gas reservoirs that were intersected in the B-1 well and a deeper horizon not tested by the B-1 well. The first primary objective is just below 15,000 feet.
• The B-2 well is planned to be drilled to a measured depth (MD) of 18,559 feet with a true vertical depth (TVD) of 16,624 feet. The well is being drilled by the Ensco 68 jack-up drilling rig.
• Completion of the B-2 Well and first production is expected in mid-May 2019. Anticipated production rate is of the order of 20 MMcfpd plus associated oil.
Production• The Company holds an interest
in three producing fields – the Jeanerette and Mystic Bayou Fields, onshore Louisiana, and the Hummer Gas/Oil Field offshore Louisiana, Gulf of Mexico, USA.
• Production for the year of 796 MMcfe was derived from the Mystic Bayou Field and the Hummer Gas/Oil Field, which commenced production in late November 2017.
• USA net 2P oil and gas reserves as of 1 January 2019 were 14.5 Bcf of gas and 1.055 MMbbl of oil (equivalent to 3.47 MMboe) with an NPV10 value of US$34.0 million (Cawley, Gillespie & Associates).
MENABlock 7, Al Barqa Permit, Yemen
Petsec: 100% working interest (85% participating interest)• The Company has operatorship
and holds a 75% working interest in Block 7 (63.75% participating interest) in the Al Barqa (Block 7) Joint Venture and has an agreement with KUFPEC
Corporate• Completion of the transaction
with Oil Search Limited (ASX: OSH) to acquire all of the shares of its subsidiary Oil Search (ROY) Limited which holds a 40% working interest (34% participating interest) in the Al Barqa (Block 7) licence and operatorship, in the Republic of Yemen.
• Extension of the redemption date for all three tranches of the US$15 million Convertible Note Facility (“Facility”) to 23 January 2021.
• Re-establishment and variation of the terms of access for Tranches 2 and 3 (US$10 million) of the Facility with the purpose of supporting Petsec Energy’s cost of drilling, completion for production and production facilities for the development of the Hummer Gas/Oil Field, and the Company’s general operations in the U.S. and Yemen.
OperationsUSA:DevelopmentHummer Gas/Oil Field, Gulf of Mexico, Main Pass Blocks 270/273/274, 50 miles South of the mouth of the Mississippi River
Petsec: 12.5% working interest (net revenue interest: 10.26354% + ORRI: 0441%)• The Hummer Gas/Oil Field was
discovered by the Main Pass Block 270 B-1 (previously Main Pass 270 #3) well in late 2015, and a production platform and gas and oil export pipelines were completed by November 2017. The B-1 well was brought into production on 21 November 2017.
• The Main Pass Block 273 B-2 appraisal/development well,
2018 Year in Review
PETSEC ENERGY LTD ANNUAL REPORT 201804
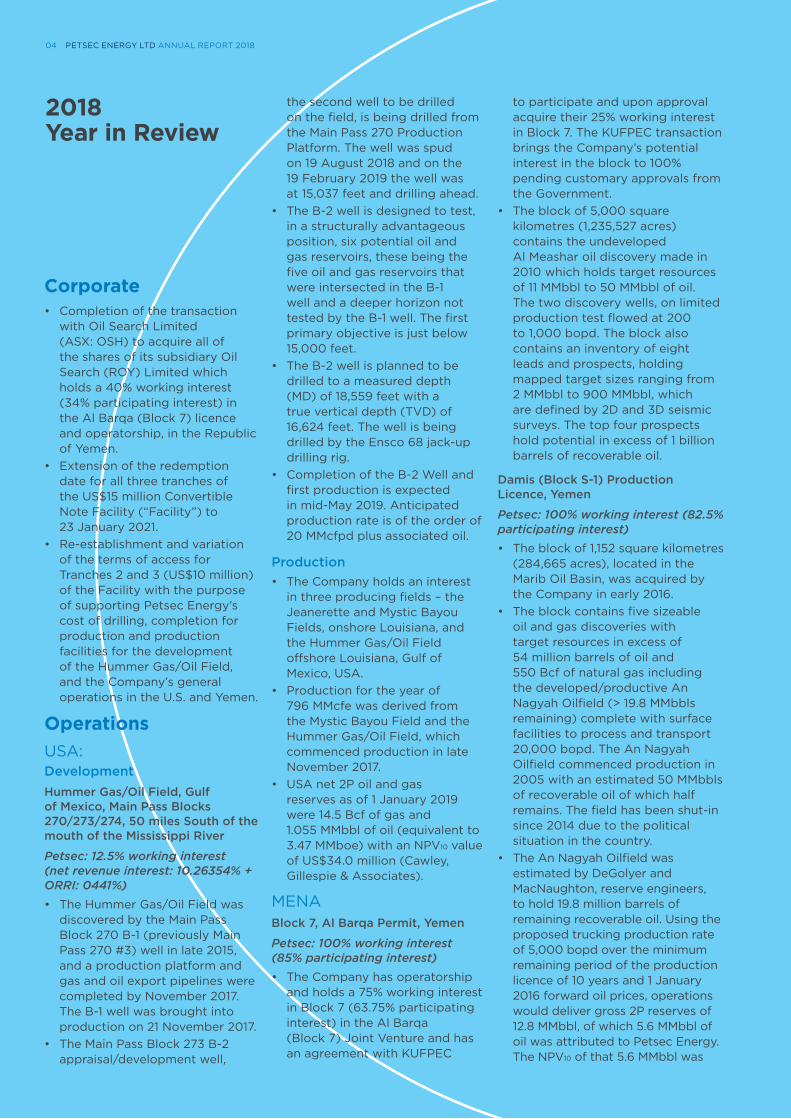
Financial
Cash (including restricted cash) at 31 December 2018: (US$)
$4.5M 28%
Convertible note facility: (US$)
$15M US$5.5 million available at 31 December 2018.$4.2M
Acquisition, exploration and development expenditures: (US$)
18%
$10.1M
Net loss after tax: (US$)
(previous corresponding period: US$12.0 million).
$7.66/Mcfe
Unit operating costs: (US$)
(previous corresponding period: US$23.39/Mcfe).
$1.8M
Depreciation, depletion and amortisation (DD&A) expense: (US$)
(US$2.27/Mcfe) 44%
$2.9M
EBITDAX: negative (US$)
(previous corresponding period: negative US$6.8 million).
$0.5M
Impairment, abandonment, exploration and work-over expense: (US$)
88%
$3.1M
Net oil and gas revenues (after royalties): (US$)
138%
$3.93/Mcfe
Gas equivalent average sales price realised: (US$)
4%
796MMcfe
Net production:
129%
US$155.4 million, at 1 January 2016 forward oil prices.
• The block also contains significant additional resource potential in the four undeveloped fields (Osaylan, An Naeem, Wadi Bayhan and Harmel fields) which have been defined by nine wells and 3D seismic and hold target resources of 34 MMbbl of oil and 550 Bcf of gas.
• The internationally recognised Yemen Government led by President Hadi had requested in late 2016, that oil producers in Southern Yemen restart production as soon as possible, using the Yemen Government’s facilities in the Shabwah and Masila areas until such times as the Marib Pipeline is permitted to be operational. To meet this request by the Hadi Government, the Company started making preparations and field operational changes to restart production from the An Nagyah Oilfield.
• The Company has been seeking, since early 2017, the necessary government support and formal approvals for a trucking operation to access government oil export facilities in order to restart oil production at the An Nagyah Oilfield until such times as the Ras Isa oil export terminal at the Port of Hodeidah resumes operations and the Marib pipeline is again operational. Delays have been due to limited and changing Yemen administration capabilities, political changes, security conditions, Petsec Energy as a new entrant
to operations in Yemen, and consideration of the Company’s technical and financial capacity.
• During 2018, operations at the Company’s An Nagyah Oilfield in Block S-1 remained shut-in while the Company continued its efforts to secure government approvals to truck oil and access Yemen Government owned pipeline, which is 70 kilometres by road from An Nagyah to oil storage and export shipping facilities in neighbouring Block 4, in order to allow the re-start of oil production and export of oil through these facilities.
• The operating environment in the Shabwah Governorate, within which Block S-1 is located, continued to improve during 2018 allowing publicly listed Austrian oil company OMV in neighbouring Block S-2 to recommence oil production in April 2018 and to maintain steady production from its Habban Oilfield (350 million barrels, 70 kilometres North East of An Nagyah Oilfield and 14 kilometres West of the Al Meashar Oilfield in Block 7). Since April 2018, production has moved to about 14,000 bopd. OMV states its objective is to raise production to 30,000 bopd in 2019. OMV truck oil South to the West Ayad Oilfield facilities at the head of the Block 4 export pipeline, and then pipe their crude 200 kilometres to the Bir Ali export facilities on
the Gulf of Aden coast. OMV is the first foreign oil company to restart production in Yemen since the industry wide shut-in of March 2015.
• In December 2018, the UN negotiated a ceasefire between the Yemen Government and the Houthi rebels in and around the Red Sea Port of Hodeidah, which is proximal to the Ras Isa Oil Export Terminal. The ceasefire had taken effect and appears to be holding. On 17 February 2019, the Yemen Government and the Houthi rebels agreed to a pullback of forces from Hodeidah. The UN and the international community are hopeful this first step may lead to a broader and lasting peace followed by a political solution for the Republic of Yemen.
• A resolution to the conflict is expected to allow the re-opening of the Marib Oil Export Pipeline which connects the Marib/Shabwah oil fields, including Petsec Energy’s An Nagyah Oilfield to the Ras Isa Export Terminal. An operating Marib Pipeline would facilitate the restart of production from the An Nagyah Oilfield and the transport of An Nagyah crude to Ras Isa for export as it conforms to the current development approval.
052018 YEAR IN REVIEW
Chairman’s Report
18191_Petsec_AR_EDS_V4.indd 6-7 12/03/2019 1:59 PM
Dear Shareholder,
The Company’s two key objectives for 2018 were, to progress the development of the Hummer Gas/Oil Field, offshore Gulf of Mexico, USA, and to restart oil production from the An Nagyah Oilfield in Block S-1, Yemen.
The Hummer Gas/Oil Field was discovered in late 2015, a production platform and export pipelines were set in late 2017, and first production from the B-1 discovery well commenced in November 2017.
In 2018, the Main Pass Block 270 B-2 appraisal/development well, the second well to be drilled on the Hummer Gas/Oil Field, was spud in August 2018 and designed to test six potential oil and gas reservoirs, these being the five reservoirs intersected by the B-1 well and a deeper horizon not tested by the B-1 well but productive in the area. It was anticipated the well would be completed and in production in December 2018, however, that date has slipped to probably May 2019 and on the 19 February 2019 the well was 500 feet above the first primary objective.
Having not completed the B-2 well by year end resulted in little change to our U.S. net 2P reserves which were at the first of January 2019, 14.5 billion cubic feet (“Bcf”) of gas and 1.055 million barrels of oil (“MMbo”) having
Chairman’s Report
a net present value (“NPV10”) of US$34.0 million, using a 10% discount rate. This NPV10 is the equivalent of 13 cents per Petsec Energy share.
The Company’s second objective, to restart production in the An Nagyah Oilfield in Yemen, was not accomplished in the year as we did not secure the necessary Yemen Government approvals, specifically approvals from the Minister for Oil and Minerals, to change the Block S-1 development plan from using the Marib Pipeline/Ras Isa oil export facilities, to a plan using the Block 4 (Shabwah) or Block 14 (Masila) pipeline and export sale facilities, accessed by trucking crude oil.
While the lack of government approvals was deeply disappointing and frustrating, the Company’s engagement with the Minister and his department, the restart of oil production 70 kilometres from An Nagyah by the Austrian company OMV, and the beginnings of a UN sponsored peace process with the rebels, gives senior MENA management good reason to be hopeful
that approvals for a changed development plan will be granted and restart of production at An Nagyah could be accomplished in 2019.
There are 19.8 million barrels of recoverable oil remaining at An Nagyah of which the Company holds a net 5.6 million barrels (27.5%). At current Brent Oil prices of US$66 per barrel and production of 5,000 barrels of oil per day transported to point of sale by trucking to Block 4, the An Nagyah Oilfield could generate US$120 million per annum in gross revenues, US$93 million in gross cash flow net of operating costs of which the Yemen Government takes 72.5% less past accrued costs to the operator. The restart of production would be of a major advantage to the Yemeni Government, particularly the people of the Bayhan area of the Shabwah Governorate which recognises the great potential economic benefit and are working diligently with the Ministry to effect the necessary approvals to restart the field.
PETSEC ENERGY LTD ANNUAL REPORT 201806

Chairman’s Report
18191_Petsec_AR_EDS_V4.indd 6-7 12/03/2019 1:59 PM
USA DevelopmentThe Company holds an interest in three producing fields in the USA – the Jeanerette and Mystic Bayou Fields, onshore Louisiana, and the Hummer Gas/Oil Field offshore Gulf of Mexico, USA. While Mystic has further development potential, it is the Hummer Project which holds the greatest upside for the Company. The Hummer Gas/Oil Field structure extends over a strike of five miles within the Main Pass Block 270, 273 and 274 leases which cover 15,000 acres, in some 200 feet of water.
The Hummer Project discovery well, Main Pass 270 B-1, was drilled, logged and temporarily suspended in late 2015. In early November 2017, the Main Pass 270 “B” Production Platform and pipelines were completed and the B-1 well was brought into production on 21 November 2017.
The Main Pass Block 273 B-2 appraisal/development well, the second well to be drilled on the field, was spud on 19 August 2018 and drilled from the Main Pass Block 270 “B” Production Platform, with a planned bottom hole location some 6,000 feet to the
East of the B-1 discovery well, into Main Pass Block 273. The B-2 well is designed to test six potential oil and gas reservoirs, these being the five reservoirs intersected by the B-1 well and a deeper horizon not tested by the B-1 well but productive in the area. The well is planned to drill to a measured depth (MD) of 18,559 feet with a true vertical depth (TVD) of 16,624 feet. The first of the primary objectives is mapped at just below 15,000 MD.
This is the first of potentially 3 to 8 appraisal/development wells required to develop the field.
The primary objectives of the B-2 well are the two sand reservoirs with proven oil and gas reserves determined from the B-1 well (Cawley, Gillespie & Associates, independent reserve engineers), one of which is classified as Proved Developed Producing (PDP) the other, Proved Undeveloped (PUD). These reservoirs are also productive in similar nearby fields – Main Pass 280/283 Field Complex.
MENA: YemenThe Company holds a 100% interest in two leases in Yemen, Damis Block S-1, and Al Barqa Block 7 in the Marib/Shabwah Basins, acquired largely from Occidental Petroleum and Oil Search Ltd, in the period 2014 to 2016. These two blocks hold six oil and gas fields with recoverable oil and gas in excess of 80 million barrels of oil and 550 Bcf of gas, of which the Company’s net is about 30%.
The An Nagyah Oilfield in Block S-1 holds 19.8 MMbbl of developed recoverable oil, 5.6 MMbo (27.5%) are net to Petsec Energy. The field is developed, has 15 productive wells currently shut-in, has produced up to 12,000 bopd, and has facilities that can process 20,000 bopd, which are connected by an 80,000 bopd pipeline to the Marib Export Pipeline (350,000 bopd) to the export terminus of Ras Isa on the Red Sea.
The An Nagyah Oilfield and all the other Marib/Shabwah oil fields have been shut-in since mid-2015 due to the Saudi led Coalition embargo on oil liftings from Ras Isa, the Red Sea terminus of the
07CHAIRMAN’S REPORT
18191_Petsec_AR_EDS_V4.indd 8-9 11/03/2019 4:22 PM
Marib Pipeline, near the Port of Hodeidah, through which all Marib oil flows, as it has been under the control of the Houthi rebels.
The internationally recognised Yemen Government led by President Hadi had requested in late 2016, that oil producers in Southern Yemen restart production as soon as possible, using the Yemen Government’s facilities in the Shabwah and Masila areas until such times as the Marib Pipeline is permitted to be operational. To meet this request by the Hadi Government, the Company started making preparations and field operational changes to restart production from the An Nagyah Oilfield by way of trucking crude oil.
The Company has been seeking, since early 2017, the necessary government support and formal approvals to change the current approved development plan to a trucking operation to access government oil export facilities at Block 4 (Shabwah) and Block 14 (Masila) in order to restart oil production at the An Nagyah Oilfield until such time as the Ras Isa Oil Export Terminal at the Port of Hodeidah resumes operations and the Marib Pipeline is again operational. Delays to receiving the necessary approvals have been due to limited and changing Yemen administration capabilities, political changes, security conditions, Petsec Energy as a new entrant to operations in Yemen, and consideration of the Company’s technical and financial capacity.
Chairman’s Report continued
The operating environment in the Shabwah Governorate, within which Block S-1 is located, continued to improve during 2018 allowing publicly listed Austrian oil company OMV in neighbouring Block S-2 to recommence oil production in April 2018 and to maintain steady production from its Habban Oilfield (350 million barrels, 70 kilometres North East of An Nagyah Oilfield and 14 kilometres West of the Al Meashar Oilfield in Block 7). Since April 2018, production has moved to about 14,000 bopd. OMV states its objective is to raise production to 30,000 bopd in 2019. OMV truck oil South to the West Ayad Oilfield facilities at the head of the Block 4 export pipeline, and then pipe their crude 200 kilometres to the Bir Ali export facilities on the Gulf of Aden. OMV is the first foreign oil company to restart production in Yemen since the industry wide shut-in of March 2015. In December 2018, the UN had negotiated a ceasefire agreement between both sides of the conflict specific to the city and Port of Hodeidah and the Ras Isa Oil Export Terminal on the Red Sea Coast. On 17 February 2019, an agreement was made for both sides of the conflict to withdraw from Hodeidah. A resolution to the conflict may allow the re-opening of the Marib Export Pipeline and the lifting of crude from the Ras Isa Export Terminal. This in turn would facilitate the restart of production from the An Nagyah Oilfield and the transport of An Nagyah crude via the Marib Export Pipeline to Ras Isa for export.
This is a very positive and welcome development for the Company and our efforts to restart production from the An Nagyah Oilfield. However, while these developments are encouraging, the Company will continue to seek Yemen Government and Ministerial approvals for the trucking of An Nagyah oil to the West Ayad Oilfield facilities located approximately 70 kilometres to the East at the head of the neighbouring Block 4 pipeline.
The Company’s engineers estimate the cost to restart oil production at An Nagyah at a rate of 5,000 bopd, ranges between US$5 to US$10 million and would take between 3 and 6 months to effect the restart from the time of receipt of Yemen Government approvals. Funding to meet that estimated cost was originally made available through the Company’s convertible note facility, established in August of 2016, in response to the Yemen Government’s appeal to operators to restart oil production in Yemen.
Government approvals and consequent restart of An Nagyah oil production will have a profound effect on the welfare of the people of the Shabwah Governorate by providing much needed work and government receipts from oil sales, demonstrating to the outside world that foreign investment is welcome in Yemen and that the Yemen Government is supportive. Restart and consequent cashflow will also be most welcome by our shareholders to reward the four years of expense and frustration suffered from lack of timely government approvals.
PETSEC ENERGY LTD ANNUAL REPORT 201808
18191_Petsec_AR_EDS_V4.indd 8-9 11/03/2019 4:22 PM
FundingDuring 2018, there has been significant demands on the Company’s working capital due to another year of waiting for Yemen Government approvals and no cashflow from An Nagyah, and the substantial overrun in time and costs in drilling the Hummer B-2 well, and consequent likely six month delay in cashflow from that well. As a consequence, the Company has had to further draw on its US$15 million convertible note facility and modify terms and extend the date of redemption.
Cashflow from the B-2 well, expected in June 2019, will be welcome as will approvals to restart An Nagyah which would indicate cashflow within six months.
Additional cashflow and availability of economic reserves in 2019 should permit access to other more flexible funding to allow repair of the Company’s balance sheet.
Outlook 2019The outlook for oil in the year ahead looks to be steady to rising, buoyed by demand in USA, China, and India.
Brent oil prices during 2018 traded between US$52.20 and US$84.16/bbl, and generally over US$70/bbl.
While the demand for natural gas in the U.S. is increasing through chemical, LNG and Mexico offtake, increasing gas supply from shale oil production moderates gas pricing, other than in abnormally hot or cold weather. Gas prices ranged
T.N. Fern Chairman and Managing Director
The Company holds a 100% interest in two leases in Yemen, Damis Block S-1, and Al Barqa Block 7 in the Marib/Shabwah Basins, acquired largely from Occidental Petroleum and Oil Search Ltd, in the period 2014 to 2016.These two blocks hold six oil and gas fields with recoverable oil and gas in excess of 80 million barrels of oil and 550 Bcf of gas, of which the Company’s net is about 30%.
between US$2.55/MMBtu and US$4.84/MMBtu in 2018, averaging US$3.27/MMBtu in the year.
In 2019, in the USA, we shall concentrate on the development of the Hummer Gas/Oil Field, optimising production and cashflow. We look forward to the results of the B-2 well which will test six reservoirs and has the potential to substantially increase the reserves and value of the Hummer Field.
In Yemen, we will continue to work with the Yemen Government and the Ministry of Oil and Minerals to secure the necessary approvals to restart the An Nagyah Oilfield as soon as possible via trucking with access to Yemen Government transport and export facilities, while hoping the Ras Isa Oil Export Terminal and Marib Pipeline will soon be re-opened.
In closing, the Board and I would like to thank you, our shareholders, for your ongoing support, throughout what has been a challenging and frustrating year.
We remain confident that our U.S. operations and our efforts in Yemen will soon be rewarded, generating a material increase in the value of the Company for our shareholders.
I look forward to providing further details on our progress at the AGM to be held in May 2019.
09CHAIRMAN’S REPORT
18191_Petsec_AR_EDS_V4.indd 10-11 12/03/2019 2:06 PM
USAProductionPetsec Energy holds an interest in three producing fields – the Jeanerette and Mystic Bayou Fields, onshore Louisiana, and the Hummer Gas/Oil Field offshore Gulf of Mexico, USA.
The Company produced 714 million cubic feet of gas and 13,628 barrels of oil/condensate (equivalent to 796 MMcfe) in the twelve months to 31 December 2018. Production was derived from the Mystic Bayou Field, onshore Louisiana USA and the Main Pass Block 270 B-1 well on the Hummer Field.
Adeline Sugar Factory No. 4 Well, Jeanerette Field
12.5% W.I. (NRI: 9.22%) The Adeline Sugar Factory (“ASF”) No. 4 well located in the Jeanerette Field, St Mary Parish, Louisiana, was discovered and brought into production in June 2014.
In mid-November 2015, the ASF No. 4 well was shut-in due to high water production and a restriction in the tubing due to salt build-up. The well has produced on an intermittent basis since that time, and it’s the operator’s intention to continue in that manner for the near-term.
Williams No. 2 Alt. Well, Mystic Bayou Field
25.0% W.I. (NRI: 18.5%)The Williams No. 2 Alt. well, a gas/oil discovery drilled in mid-2015, is located on the Mystic Bayou Field, St Martin Parish, Louisiana, was brought into production on 31 August 2015.
The well contributed 161 MMcfe of production for the year.
Main Pass Block 270 B-1 well – Hummer Gas/Oil Field (Main Pass 270/273/274)
12.5% W.I. (NRI: 10.26354% and ORRI: 0.441%)The Main Pass Block 270 B-1 well on the Hummer exploration prospect in 215 feet of water, offshore Louisiana (federal waters), was drilled during the second half of 2015 and brought into production on 21 November 2017.
The well contributed 635 MMcfe to production for the year.
DevelopmentHummer Gas/Oil Field (Main Pass 270/273/274)
12.5% W.I. (NRI: 10.26354% and ORRI: 0.441%)The Hummer Gas/Oil Field structure extends over a strike of five miles over Main Pass Blocks 270,273 and 274, which cover 15,000 acres, in some 200 feet of water, in the Gulf of Mexico, offshore Louisiana, USA.
The Hummer Gas/Oil Field was discovered in late 2015, and the Main Pass 270 “B” Production Platform was completed in late 2017, designed to be the main production platform in the field. The B-1 discovery well was brought into production on 21 November 2017.
The Main Pass 270 “B” Production Platform has sufficient deck space to expand production capacity required for additional production wells drilled from the “B” platform and proximal well head platforms.
On 10 May 2018, the Company announced that the Main Pass Block 273 B-2 appraisal/development well, the second well on the field, would be drilled
from the Main Pass Block 270 “B” Production Platform. The B-2 well was spud on 19 August 2018.
The B-2 well has a planned bottom hole location some 6,000 feet to the East of the B-1 discovery well. The B-2 well is planned to drill to a measured depth (MD) of 18,559 feet with a true vertical depth (TVD) of 16,624 feet. The two primary objectives are below 15,000 feet. The B-2 well is the first of potentially 3 to 8 appraisal/development wells required to develop the field.
The well was designed to test, at an optimum structural position, six oil and gas reservoirs, these being the five oil and gas reservoirs intersected in the B-1 well and a deeper horizon not tested by the B-1 well, but productive in the area.
The primary objectives of the B-2 well were the two sand reservoirs with proven oil and gas reserves determined from the B-1 well (Cawley, Gillespie & Associates, independent reserve engineers), one of which is classified as Proved Developed Producing (PDP) the other Proved Undeveloped (PUD). These reservoirs are also productive in similar nearby fields (Main Pass 280/283 Field Complex).
After setting 11⅞ inch casing in late November 2018, at 11,267 feet MD/11,110 true vertical depth (TVD), the well was drilled to 14,000 feet MD/13,193 feet TVD in mid-December. Under-reaming operations then commenced to open the well bore from 10⅝ inches to 12¼ inches, prior to running a 9⅝ inch drilling liner. While under-reaming, the tool became stuck at approximately 11,468 feet MD which required fishing operations to retrieve the tool.
Operations Review
PETSEC ENERGY LTD ANNUAL REPORT 201810

18191_Petsec_AR_EDS_V4.indd 10-11 12/03/2019 2:06 PM
Petsec Energy Gulf of Mexico and Louisiana Gulf Coast, USA exploration and production leases
TEXASUSA
MISSISSIPPIUSA
LOUISIANAUSA MYSTIC BAYOU
OUISKI BAYOU
MAIN PASS 270/273/274
ASF #4
Mystic Bayou
Main Pass 270/273/274 Hummer Project: Main Pass 270 “B”
production platform
Image: Main Pass Block 270/273/274
Hummer Project: Ensco 68 Jack Up Rig
After successfully retrieving the tool on 23 December, the hole opening operations continued to 14,000 feet MD.
On 5 January 2019, operations to run the 9⅝ inch liner commenced, but the liner became stuck at approximately 12,592 feet MD/12,130 feet TVD. Operations to fish the stuck liner were partially successful to the extent that the wellbore was cleared down to the top of the liner and the bottom of the 9⅝ inch liner set in place. A 7⅝ inch expandable liner was run and was set at 14,000 feet MD, the water-based mud was changed out for an oil-based mud system, and the well is drilling ahead to test the primary and secondary objectives as planned. The first primary objective is expected to be penetrated just below 15,000 feet MD, anticipated by late February 2019, with the second objective some two weeks of drilling later.
11OPERATIONS REVIEW
18191_Petsec_AR_EDS_V4.indd 12-13 12/03/2019 2:10 PM
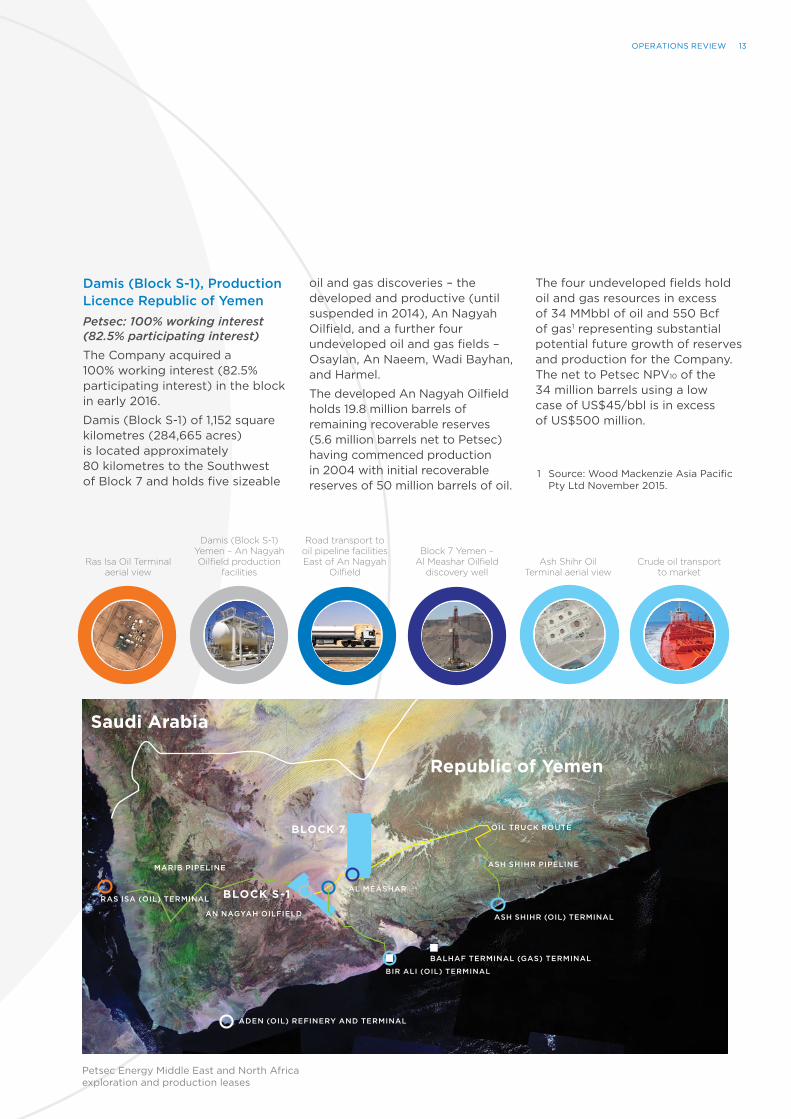
The Damis Block S-1 contains five oil and gas fields with target resources in excess of 54 million barrels of oil and 550 Bcf of natural gas. The An Nagyah Oilfield is developed with 32 wells, of which 15 are suspended ready for production, and has associated production facilities capable of producing 20,000 barrels of oil per day (bopd), connected by an 80,000 bopd pipeline to the Marib Pipeline which terminates to the West at the Ras Isa Oil Export Terminal, near the Port of Hodeidah, on the Red Sea to the West. The Marib Pipeline and Ras Isa Oil Export Terminal has been shut since March 2015 due to the Saudi Coalition embargo on oil liftings from the rebel controlled Port of Hodeidah because of the rebels’ control of Hodeidah.
Operations at the Company’s An Nagyah Oilfield in Block S-1 remains shut-in until the Marib Pipeline to Ras Isa Oil Export Terminal re-opens or until such time as the Company secures Yemen Government approvals to truck oil and access Yemen Government owned pipeline, storage and oil export shipping facilities in neighbouring Block 4, 70 kilometres to the East of An Nagyah.
The operating environment in the Shabwah Governorate, within which both Block S-1 and Block 7 are located, continues to improve, which has allowed the publicly listed Austrian oil company, OMV, to recommence oil production in April 2018. OMV was the first foreign oil company to restart production in Yemen since the industry wide shut-in of March 2015.
OMV has maintained oil production of the order of 14,000 bopd in Block S-2 since April 2018 from the Habban Oilfield (350 million barrels), 70 kilometres North East of An Nagyah Oilfield and 14 kilometres West of the Al Meashar Oilfield in Block 7. Habban oil is transported 70 kilometres by truck South to the West Ayad Oilfield facilities at the head of the Block 4 export pipeline, then piped some 200 kilometres South to the Bir Ali Oil Terminal on the coast of the Gulf of Aden. Shipments of some 500,000 barrels of oil are made each 1 to 2 months.
In December 2018, the UN conducted peace talks in Sweden between the Yemen Government and the Houthi rebels. A peace process was agreed between the conflicting parties including a ceasefire between the Yemen
Government and supporting Coalition of Saudi Arabia and the UAE, and the rebels in the Red Sea port area of Hodeidah, including the Ras Isa Oil Export terminal. This important port is to be placed under the control of the UN.
On 17 February 2019, an agreement was made for both sides of the conflict to withdraw from Hodeidah. The UN and the International Community are hopeful this first step may lead to a political solution for the Republic of Yemen and a consequent broader and lasting peace.
A resolution to the conflict may allow the re-opening of the Marib Export Pipeline and the lifting of crude from the Ras Isa Export Terminal. This in turn would facilitate the restart of production from the An Nagyah Oilfield and the transport of An Nagyah crude via the Marib Export Pipeline to Ras Isa for export.
Operations Reviewcontinued
MENAMENA (Middle East and North Africa) – YemenThe Company holds a 100% working interest in two blocks in Yemen, 80 kilometres apart in the Marib Basin – Damis Block S-1 Production Licence and Block 7 Exploration Licence. Block 7 holds the Al Meashar Oilfield with target resources of 11 to 50 million barrels of recoverable oil, plus eight prospects and leads with potential ranging from 2 to 900 million barrels of oil.
PETSEC ENERGY LTD ANNUAL REPORT 201812
18191_Petsec_AR_EDS_V4.indd 12-13 12/03/2019 2:10 PM
Damis (Block S-1), Production Licence Republic of YemenPetsec: 100% working interest (82.5% participating interest)The Company acquired a 100% working interest (82.5% participating interest) in the block in early 2016.
Damis (Block S-1) of 1,152 square kilometres (284,665 acres) is located approximately 80 kilometres to the Southwest of Block 7 and holds five sizeable
Damis (Block S-1) Yemen – An Nagyah Oilfield production
facilitiesCrude oil transport
to market
Road transport to oil pipeline facilities East of An Nagyah
Oilfield
Block 7 Yemen – Al Meashar Oilfield
discovery wellAsh Shihr Oil
Terminal aerial view
oil and gas discoveries – the developed and productive (until suspended in 2014), An Nagyah Oilfield, and a further four undeveloped oil and gas fields – Osaylan, An Naeem, Wadi Bayhan, and Harmel.
The developed An Nagyah Oilfield holds 19.8 million barrels of remaining recoverable reserves (5.6 million barrels net to Petsec) having commenced production in 2004 with initial recoverable reserves of 50 million barrels of oil.
The four undeveloped fields hold oil and gas resources in excess of 34 MMbbl of oil and 550 Bcf of gas1 representing substantial potential future growth of reserves and production for the Company. The net to Petsec NPV10 of the 34 million barrels using a low case of US$45/bbl is in excess of US$500 million.
Saudi Arabia
Republic of Yemen
BALHAF TERMINAL (GAS) TERMINAL
Ras Isa Oil Terminal aerial view
ASH SHIHR (OIL) TERMINAL
AL MEASHAR
AN NAGYAH OILFIELD
MARIB PIPELINE ASH SHIHR PIPELINE
BIR ALI (OIL) TERMINAL
RAS ISA (OIL) TERMINAL
ADEN (OIL) REFINERY AND TERMINAL
OIL TRUCK ROUTE
BLOCK S-1
BLOCK 7
1 Source: Wood Mackenzie Asia Pacific Pty Ltd November 2015.
Petsec Energy Middle East and North Africa exploration and production leases
13OPERATIONS REVIEW
Operations Reviewcontinued
OMV’s continuous operations to produce Habban oil since April 2018, and successful use of the Block 4 pipeline and oil export liftings from the Bir Ali Oil Export Terminal and confirm the viability of this export route. As a consequence, the Company’s plans for the restart of production at the An Nagyah Oilfield are focused on a trucking operation that transports oil 70 kilometres East to the head of the Block 4 pipeline which runs 204 kilometres South to storage and export shipping facilities at Bir Ali. Estimated OPEX for this route is US$15/bbl. Truck loading facilities for An Nagyah crude oil have been built and are in storage in Dubai ready for transport to Block S-1, as soon as we receive Yemen Government approvals.
The Company’s engineers estimate the cost to restart oil production at An Nagyah at a rate of 5,000 bopd, ranges between US$5 to US$10 million and would take between 3 and 6 months to effect the restart from the time of receipt of Yemen Government approvals. Funding to meet that estimated cost was originally made available through the Company’s Convertible Note Facility established in August of 2016, in response to the Yemen Government’s appeal to operators to restart oil production in Yemen.
The Company has been seeking, since early 2017, the necessary government support and formal approvals for a trucking operation to access government oil export facilities in order to restart oil
production at the An Nagyah Oilfield until such times as the Ras Isa oil export terminal at the Port of Hodeidah resumes operations and the Marib pipeline is again operational. Delays have been due to limited and changing Yemen administration capabilities, political changes, security conditions, Petsec Energy as a new entrant to operations in Yemen, and consideration of the Company’s technical and financial capacity.
We have engaged with the Oil Minister, His Excellency Aws Al-Oud, since his appointment in January 2018, seeking his support for the restart of production at the An Nagyah Oilfield by way of trucking to Yemen Government owned pipeline transport and export facilities. Access to these facilities are part of the Contractor’s rights contained within the Block S-1 Production Sharing Agreement.
Documentation supporting the Company’s technical and financial capabilities to restart production at the An Nagyah Oilfield was supplied to the Minister of Oil and Minerals during the September Quarter for his review and approval.
Block 7, Al Barqa Permit Republic of YemenPetsec: 100% working interest (85% participating interest)The Company acquired a 100% working interest (85% participating interest) in the block in the period from 2014 to 2017.
Block 7 is an onshore exploration permit covering an area of 5,000 square kilometres (1,235,527 acres) located approximately 340 kilometres east of Sana’a. The block contains the Al Meashar oil discovery as well as an inventory of leads and prospects defined by 2D and 3D seismic surveys with significant oil potential.
The Company has operatorship and holds a 75% working interest in Block 7 (63.75% participating interest) in the Al Barqa (Block 7) Joint Venture and has an agreement with KUFPEC to participate and upon approval acquire their 25% working interest in Block 7. The KUFPEC transaction brings the Company’s potential interest in the block to 100% pending customary approvals from the Government.
Block 7 contains two suspended discovery wells in the Al Meashar Oilfield (target resource of 11 MMbbl to 50 MMbbl) which is located 14 kilometres East of OMV’s Habban Oilfield which holds ultimate recoverable reserves of 350 million barrels of oil, in the same reservoir rocks as Al Meashar. In 2010-11, short-term testing of the two Al Meashar wells delivered flow rates ranging from 200 to 1,000 bopd. The block also contains eight potential prospect/lead targets ranging in size from 2 to 900 MMbbl oil gross. The top four prospects hold potential in excess of 1 billion barrels of recoverable oil.
PETSEC ENERGY LTD ANNUAL REPORT 201814
Oil and Gas Reserves
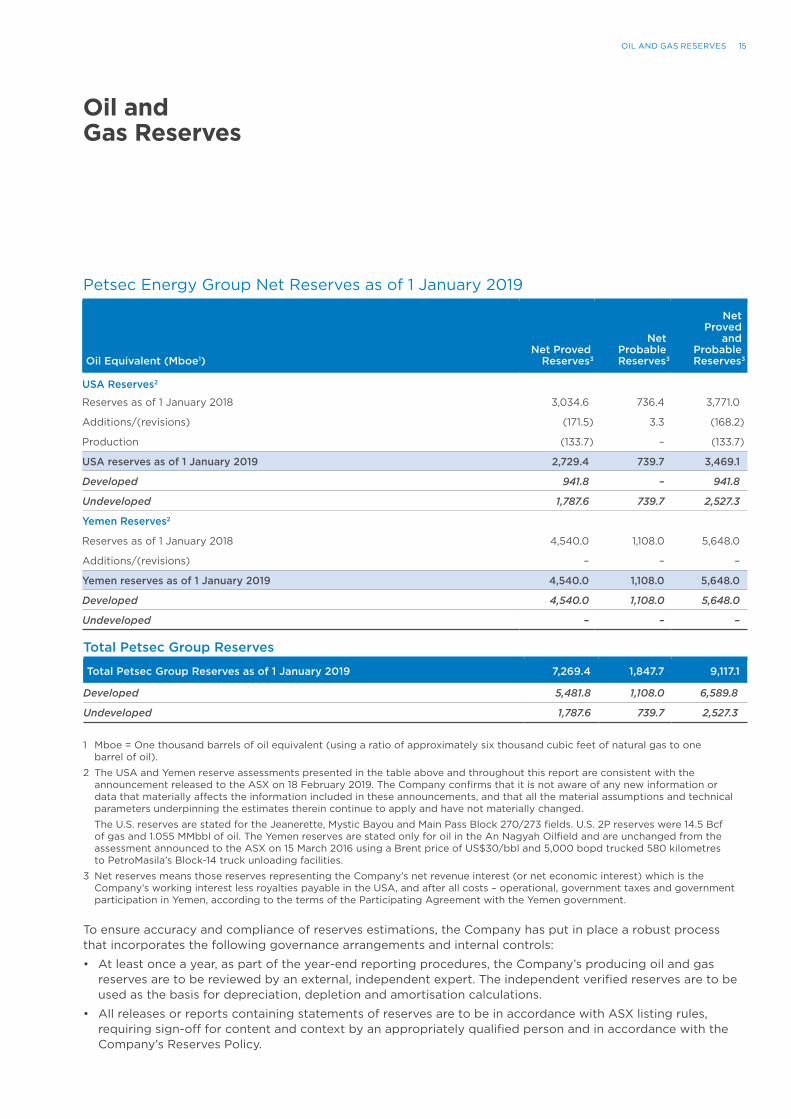
Petsec Energy Group Net Reserves as of 1 January 2019
Oil Equivalent (Mboe1) Net Proved
Reserves3
NetProbableReserves3
NetProved
andProbableReserves3
USA Reserves2
Reserves as of 1 January 2018 3,034.6 736.4 3,771.0
Additions/(revisions) (171.5) 3.3 (168.2)
Production (133.7) – (133.7)
USA reserves as of 1 January 2019 2,729.4 739.7 3,469.1
Developed 941.8 – 941.8
Undeveloped 1,787.6 739.7 2,527.3
Yemen Reserves2
Reserves as of 1 January 2018 4,540.0 1,108.0 5,648.0
Additions/(revisions) – – –
Yemen reserves as of 1 January 2019 4,540.0 1,108.0 5,648.0
Developed 4,540.0 1,108.0 5,648.0
Undeveloped – – –
Total Petsec Group Reserves
Total Petsec Group Reserves as of 1 January 2019 7,269.4 1,847.7 9,117.1
Developed 5,481.8 1,108.0 6,589.8
Undeveloped 1,787.6 739.7 2,527.3
1 Mboe = One thousand barrels of oil equivalent (using a ratio of approximately six thousand cubic feet of natural gas to one barrel of oil).
2 The USA and Yemen reserve assessments presented in the table above and throughout this report are consistent with the announcement released to the ASX on 18 February 2019. The Company confirms that it is not aware of any new information or data that materially affects the information included in these announcements, and that all the material assumptions and technical parameters underpinning the estimates therein continue to apply and have not materially changed.
The U.S. reserves are stated for the Jeanerette, Mystic Bayou and Main Pass Block 270/273 fields. U.S. 2P reserves were 14.5 Bcf of gas and 1.055 MMbbl of oil. The Yemen reserves are stated only for oil in the An Nagyah Oilfield and are unchanged from the assessment announced to the ASX on 15 March 2016 using a Brent price of US$30/bbl and 5,000 bopd trucked 580 kilometres to PetroMasila’s Block-14 truck unloading facilities.
3 Net reserves means those reserves representing the Company’s net revenue interest (or net economic interest) which is the Company’s working interest less royalties payable in the USA, and after all costs – operational, government taxes and government participation in Yemen, according to the terms of the Participating Agreement with the Yemen government.
To ensure accuracy and compliance of reserves estimations, the Company has put in place a robust process that incorporates the following governance arrangements and internal controls:
• At least once a year, as part of the year-end reporting procedures, the Company’s producing oil and gas reserves are to be reviewed by an external, independent expert. The independent verified reserves are to be used as the basis for depreciation, depletion and amortisation calculations.
• All releases or reports containing statements of reserves are to be in accordance with ASX listing rules, requiring sign-off for content and context by an appropriately qualified person and in accordance with the Company’s Reserves Policy.
15OIL AND GAS RESERVES
Directors’ Report 17
Financial Report for the Year Ended 31 December 2018 33
Exploration and Production Interests 73
Shareholder Information 74
5 Year Comparative Data Summary 75
Glossary 77
Corporate Directory 78
Contents
Directors’ and Financial ReportFor the Year Ended 31 December 2018
PETSEC ENERGY LTD ANNUAL REPORT 201816
Directors’ ReportFor the year ended 31 December 2018
The directors present their report together with the Financial Report of Petsec Energy Ltd (“the consolidated entity”), being Petsec Energy Ltd (the Company) and its subsidiaries, for the financial year ended 31 December 2018 and the independent auditor’s report thereon.
1. DirectorsThe names and particulars of the qualifications and experience of each director during or since the end of the financial year are:
Terrence N. FernChairman and Managing DirectorMr. Fern has been a director since 1987 and has over 45 years of extensive international experience in petroleum and minerals exploration, development and financing. He holds a Bachelor of Science degree from the University of Sydney and has followed careers in both exploration geophysics and natural resource investment. Mr. Fern was formerly a director of TSX and ASX listed company OceanaGold Corporation from 2006 until June 2011.
David A. Mortimer AO, FAICDNon-executive DirectorChairman of the Audit Committee and the Nomination and Remuneration Committee
Mr. Mortimer was appointed to the Board in 1985 and has over 40 years of corporate finance and management experience. He was a senior executive of TNT Limited Group from 1973, serving as Finance Director and then as Chief Executive Officer until his resignation in October 1997. He is presently Chairman of Opera Australia, Buildcorp Advisory Board and is Chairman of the Senate Investment Committee of The University of Sydney. Mr. Mortimer is a Director of MySale Group PLC and is on the CEDA’s Board of Governors.
Mr. Mortimer holds a Bachelor of Economics degree (First Class Honours) from the University of Sydney and was a Fellow of the University of Sydney Senate from 2010 to December 2017. He is a fellow of the Australian Institute of Company Directors. Mr. Mortimer’s other roles include Governor of the Australia Israel Chamber of Commerce, Chairman of the Sydney University Football Club Foundation and Chairman of the Australian Schoolboys Rugby Foundation.
Mr. Mortimer was formerly a director and Chairman of ASX listed company Leighton Holdings Limited from 1997 until August 2011 and Chairman of Australia Post from 2006 to 2012. He was a foundation shareholder and Chairman of Crescent Capital Partners until 31 December 2017 and was a member of the Grant Samuel Advisory Board until December 2017. He has held many directorships and has chaired listed and unlisted companies as well as written three major reports for Governments.
Alan P. Baden Non-executive DirectorMember of the Audit Committee and the Nomination and Remuneration CommitteeMr. Baden was appointed to the Board in May 2013 and is a U.S. citizen, resident in Houston, Texas. He is Of Counsel with the legal firm of Thompson & Knight and has over 40 years of experience in the U.S. oil and gas industry, with a focus on mergers and acquisitions, public and private financings, and U.S. capital market activities, representing U.S. and foreign E&P companies, master limited partnerships and other energy companies. He has been recognised by his peers to be a leading lawyer in oil and gas transactions and in securities and corporate finance.Mr. Baden holds a Juris Doctor Degree from Case Western Reserve University, and a Bachelor of Science (Economics) Degree from the Wharton School of the University of Pennsylvania.
2. Executive OfficersRoss A. Keogh President of PEI and Group Chief Financial OfficerMr. Keogh joined the Company in 1989 and has over 35 years of experience in the oil and gas industry. Between 1979 and 1989, Mr. Keogh worked in the financial accounting and budgeting divisions of Total Oil Company and as Joint Venture Administrator for Bridge Oil Limited in Australia. Mr. Keogh holds a Bachelor of Economics degree, with a major in Accounting, from Macquarie University in Sydney. Mr. Keogh was appointed Chief Financial Officer in November 1998 until April 2002, and appointed President of PEI in April 2002. Mr. Keogh took on the extended role of Group Chief Financial Officer in February 2012, in addition to his current role of President of PEI.
Maki PetkovskiChief Executive Officer of Petsec Energy (Middle Eastern) LimitedMr. Petkovski joined the Company in March 2015 as the Chief Executive Officer of Petsec Energy (Middle Eastern) Limited. Mr. Petkovski has over 25 years of experience in the international upstream oil and gas business sector and has held various managerial and senior technical roles with large E&P companies including BP, Ampolex Ltd and most recently with Oil Search Ltd where he was responsible for managing Oil Search’s MENA portfolio.Mr. Petkovski holds a Bachelor of Applied Science (Geology) degree from the University of Technology, Sydney.
Paul GahdmarCompany Secretary and Group Financial ControllerMr. Gahdmar joined the Company in 1999 as the Financial Accountant of the Petsec Energy Ltd group and has since held a number of management positions within the Company. Mr. Gahdmar was appointed as the Company Secretary of Petsec Energy Ltd in 2008 and has over 25 years of experience in corporate accounting and finance in listed companies within the mining and resources industry. Mr. Gahdmar holds a Master of Business and Technology degree from The University of New South Wales and a Diploma in Investor Relations from the Australasian Investor Relations Association. Mr. Gahdmar is a Fellow of the Institute of Public Accountants and a Member of the Australian Institute of Company Directors.
17DIRECTORS’ REPORT
Directors’ Report continuedFor the year ended 31 December 2018
3. Directors’ meetingsThe Board has a formally constituted Audit Committee and a Nomination and Remuneration Committee, of which Mr. Mortimer and Mr. Baden (non-executive directors) are members. Mr. Mortimer chairs both committees.
The number of directors’ meetings (including meetings of committees of directors) and number of meetings attended by each of the directors of the Company during the financial year are:
RegularBoard
Meetings
AdditionalBoard
Meetings
AuditCommitteeMeetings
Nomination & Remuneration Committee
Meetings
Total number held during the year 8 – 4 2T. N. Fern 1 8 – 4 2D. A. Mortimer 8 – 4 2A. P. Baden 8 – 4 2
1 Mr. Fern attended the Audit and Nomination & Remuneration Committee meetings as an invitee.
4. Remuneration reportThe Remuneration Report is set out on pages 25 to 31 and forms part of the Directors’ Report for the financial year ended 31 December 2018.
5. Principal activitiesThe principal activities of the consolidated entity during the course of the year were oil and gas development and production onshore and coastal waters of the Louisiana Gulf Coast region, and the shallow waters of the Gulf of Mexico, USA and in the MENA region.
There have been no significant changes in the nature of these activities during the year.
6. Financial reviewThe consolidated entity incurred a net loss after tax of US$10.1 million for the twelve months ended 31 December 2018 (previous corresponding period: net loss after tax of US$12.0 million) after the recognition of net financial expense of US$4.9 million, depreciation, depletion and amortisation (“DD&A”) expense of US$1.8 million, and an impairment provision against its Yemen oil and gas assets of US$0.5 million.
The financial expense of US$4.9 million comprised facility fees and interest charges in connection with the convertible note facility together with the fair value movement of the financial derivative portion of the convertible note liability.
Net oil and gas revenues of US$3.1 million were generated for the twelve months to 31 December 2018, from production of 796 million cubic feet of gas equivalent (“MMcfe”) at an average natural gas equivalent sales price of US$3.93/Mcfe. This was 138% higher than the net oil and gas revenues generated in the previous corresponding period of US$1.3 million due to higher production volumes coupled with the higher average natural gas equivalent sales price received.
Net production of 796 MMcfe in the current period was derived from the Main Pass Block 270 B-1 well on the Hummer Gas/Oil Field in the shallow waters in the Gulf of Mexico, USA, and the Williams No. 2 well on the Mystic Bayou Field, onshore Louisiana, USA. This was 129% higher than the previous corresponding period, reflecting the increased contribution to production from the Main Pass Block 270 B-1 well which commenced production on 21 November 2017.
The consolidated entity realised an average net gas equivalent sales price of US$3.93/Mcfe in the current period. This was 4% higher than the US$3.79/Mcfe realised for the previous corresponding period. The consolidated entity received an average sales of price of US$3.12/Mcf and US$65.89/bbl for its natural gas and oil/condensation production, respectively. This compares to US$3.22/Mcf and US$49.19/bbl received respectively, in the previous corresponding period.
Lease operating expense of US$0.7 million (previous corresponding period: US$0.8 million) and geological, geophysical and administrative (“GG&A”) expense of US$5.4 million (previous corresponding period: US$7.3 million) were lower in the current period, reflecting the reduced level of activities in the MENA region and the benefit of various cost cutting initiatives which were implemented throughout the consolidated entity during the second half of 2017.
The consolidated entity recorded negative earnings before interest, income tax, depreciation, depletion and amortisation, and exploration expense (“EBITDAX”) of US$2.9 million for the current period (previous corresponding period: negative EBITDAX of US$6.8 million).
Depreciation, depletion and amortisation (“DD&A”) expense was US$1.8 million in the current period (previous corresponding period: US$1.4 million).
PETSEC ENERGY LTD ANNUAL REPORT 201818
Financial positionAt 31 December 2018, the Company’s cash deposits were US$4.5 million (31 December 2017: US$3.5 million). The cash deposits at 31 December 2018 are predominantly held in U.S. dollars and include restricted cash amounts of US$1.9 million (US$0.2 million restricted cash at 30 December 2017).
As at 31 December 2018, the Company had drawn down US$9.5 million under its US$15 million Secured Unlisted Convertible Note Facility Agreement. A further US$1.5 million was drawn in January 2019 to meet drilling costs of the Main Pass Block 273 B-2 well.
7. Operations reviewPetsec Energy Ltd (the “Company”) is an independent oil and gas exploration and production company listed on the Australian Stock Exchange (ASX Ticker: PSA) and is traded over the counter in the USA in the form of American Depositary Receipts (symbol: PSJEY). The Company has operations in the shallow waters of the Gulf of Mexico and onshore Louisiana, USA and in the Republic of Yemen.
USAProductionPetsec Energy holds interests in three producing fields – the Jeanerette and Mystic Bayou Fields, onshore Louisiana, and the Hummer Gas/Oil Field offshore Gulf of Mexico, USA. The Company produced 796 MMcfe in the twelve months to 31 December 2018, primarily from the Main Pass Block 270 B-1 well on the Hummer Field and the Mystic Bayou Field, onshore Louisiana USA.
Adeline Sugar Factory No. 4 Well – Jeanerette FieldPetsec: 12.5% working interest (9.2% net revenue interest)
The Adeline Sugar Factory (“ASF”) No. 4 well located in St. Mary Parish, Louisiana was drilled and brought into production in June 2014. The well was shut-in in mid-November 2015 due to high water production and a restriction in the tubing due to salt build-up. The well has produced on an intermittent basis since that time, and it’s the operator’s intention to continue with intermittent production for the near-term.
Williams No. 2 well – Mystic Bayou FieldPetsec: 25% working interest (18.5% net revenue interest)
The Williams No. 2 gas/condensate discovery well on the Mystic Bayou Field in St. Martin Parish, Louisiana was drilled and brought into production on 31 August 2015.
The well contributed 161 MMcfe to production for the year.
Main Pass Block 270 B-1 well – Hummer Gas/Oil Field (Main Pass 270/273/274)Petsec: 12.5% working interest (10.7431% net revenue interest)
The Main Pass Block 270 B-1 well on the Hummer exploration prospect in 215 feet of water, offshore Louisiana (federal waters) was drilled during the second half of 2015 and brought into production on 21 November 2017.
The well contributed 635 MMcfe to production for the year.
Development
Hummer Gas/Oil Field (Main Pass 270/273/274)Petsec: 12.5% working interest (10.26354% net revenue interest and 0.441% overriding royalty interest)
The Hummer Gas/Oil Field extends over Main Pass Blocks 270, 273 and 274, which cover 15,000 acres, in some 200 feet of water, in the Gulf of Mexico, offshore Louisiana, USA. The Hummer Field structure extends over a strike of five miles within the Main Pass Block 270, 273 and 274 leases.
The Hummer Gas/Oil Field was discovered in late 2015 and the Main Pass 270 “B” Production Platform was completed in late 2017. This was designed to be the main production platform in the field. The B-1 discovery well was brought into production on 21 November 2017.
The Main Pass 270 “B” Production Platform has sufficient deck space to expand production capacity required for additional production wells drilled from the “B” platform and any proximal well head platforms.
On 10 May 2018, the Company announced that the Main Pass Block 273 B-2 appraisal/development well, the second well on the field, would be drilled from the Main Pass Block 270 “B” Production Platform. The B-2 well was spud on 19 August 2018.
The B-2 well has a planned bottom hole location some 6,000 feet to the East of the B-1 discovery well, and is planned to drill to a measured depth (MD) of 18,559 feet with a true vertical depth (TVD) of 16,624 feet. This is the first of potentially 3 to 8 appraisal/development wells required to develop the field.
The well was designed to test, at an optimum structural position, six oil and gas reservoirs, these being the five oil and gas reservoirs intersected in the B-1 well and a deeper horizon not tested by the B-1 well, but productive in the area.
The primary objectives of the B-2 well were the two sand reservoirs with proven oil and gas reserves determined from the B-1 well (Cawley, Gillespie & Associates, independent reserve engineers), one of which is classified as Proved Developed Producing (PDP) the other, Proved Undeveloped (PUD). These reservoirs are also productive in similar nearby fields (Main Pass 280/283 Field Complex).
19DIRECTORS’ REPORT
Directors’ Report continuedFor the year ended 31 December 2018
7. Operations review continuedUSA continued After setting 11⅞ inch casing in late November 2018, at 11,267 feet MD/11,110 true vertical depth (TVD), the well was drilled to 14,000 feet MD/13,193 feet TVD in mid-December. Under-reaming operations then commenced to open the well bore from 10⅝ inches to 12¼ inches, prior to running a 9⅝ inch drilling liner. While under-reaming, the tool became stuck at approximately 11,468 feet MD which required fishing operations to retrieve the tool. After successfully retrieving the tool on 23 December, the hole opening operations continued to 14,000 feet MD.
On 5 January 2019, operations to run the 9⅝ inch liner commenced, but the liner became stuck at approximately 12,592 feet MD/12,130 feet TVD. Operations to fish the stuck liner were partially successful to the extent that the wellbore was cleared down to the top of the liner and the bottom of the 9⅝ inch liner set in place. A 7⅝ inch expandable liner was set at 14,000 feet MD, the water-based mud was changed out for an oil-based mud system, and the well is drilling ahead to test the primary and secondary objectives as planned. The first primary objective is expected to be penetrated just below 15,000 feet MD, anticipated by late February 2019, with the second objective some two weeks of drilling later.
MENAYemenThe Company holds a 100% working interest in two blocks in Yemen, 80 kilometres apart in the Marib Basin – Damis Block S-1 Production Licence and Block 7 Exploration Licence.
The Damis Block S-1 contains five oil and gas fields with target resources in excess of 54 million barrels of oil and 550 Bcf of natural gas. The An Nagyah Oilfield is developed with 32 wells and has associated production facilities capable of producing 20,000 barrels of oil per day, connected by an 80,000 bopd pipeline to the Marib Pipeline which terminates to the West at the Ras Isa Oil Export Terminal, near the Port of Hodeidah, on the Red Sea. The Marib Pipeline and Ras Isa Oil Export Terminal has been shut since March 2015 due to the Saudi Coalition embargo on oil liftings from the rebel controlled Port of Hodeidah.
Block 7 holds the Al Meashar Oilfield with target resources of 11 to 50 million barrels of recoverable oil, plus eight prospects and leads with potential ranging from 2 to 900 million barrels of oil.
The Company’s An Nagyah Oilfield in Block S-1 remains shut-in until the Marib Pipeline to Ras Isa Oil Export Terminal re-opens or until such time as the Company secures government approvals to truck oil and access Yemen Government owned pipeline, storage and oil export shipping facilities in neighbouring Block 4, 70 kilometres to the East of An Nagyah.
The operating environment in the Shabwah Governorate, within which both Block S-1 and Block 7 are located, continues to improve, which has allowed the publicly listed Austrian oil company, OMV, to recommence oil production in April 2018. OMV was the first foreign oil company to restart production in Yemen since the industry wide shut-in of March 2015.
OMV has maintained oil production of the order of 14,000 bopd in Block S-2 since April 2018 from the Habban Oilfield (350 million barrels), 70 kilometres North East of An Nagyah Oilfield and 14 kilometres West of the Al Meashar Oilfield in Block 7. Habban oil is transported 70 kilometres by truck South to the West Ayad Oilfield facilities at the head of the Block 4 export pipeline, then piped some 200 kilometres South to the Bir Ali Oil Terminal on the coast of the Gulf of Aden. Shipments of some 500,000 barrels of oil are made each 1 to 2 months.
In December 2018, the UN conducted peace talks in Sweden between the Yemen Government and the Houthi Rebels. A peace process was agreed between the conflicting parties including a ceasefire between the Yemen Government and supporting Coalition of Saudi Arabia and the UAE, and the rebels in the Red Sea port area of Hodeidah, including the Ras Isa Oil Export Terminal. This important port is to be placed under the control of the UN.
On 17 February 2019, an agreement was made for both sides of the conflict to withdraw from Hodeidah. The UN and the International Community are hopeful this first step may lead to a political solution for the Republic of Yemen and a consequent broader and lasting peace.
A resolution to the conflict may allow the re-opening of the Marib Export Pipeline and the lifting of crude from the Ras Isa Export Terminal. This in turn would facilitate the restart of production from the An Nagyah Oilfield and the transport of An Nagyah crude via the Marib Export Pipeline to Ras Isa for export.
PETSEC ENERGY LTD ANNUAL REPORT 201820
Damis (Block S-1) Production Licence, Republic of Yemen Petsec: 100% working interest (82.5% participating interest)
The Company acquired a 100% working interest (82.5% participating interest) in the block in early 2016.
Damis (Block S-1) of 1,152 square kilometres (284,665 acres) is located approximately 80 kilometres to the Southwest of Block 7 and holds five sizeable oil and gas discoveries – the developed and productive (until suspended in 2014), An Nagyah Oilfield, and a further four undeveloped oil and gas fields – Osaylan, An Naeem, Wadi Bayhan, and Harmel.
The developed An Nagyah Oilfield holds 19.8 million barrels of remaining recoverable reserves (5.6 million barrels net to Petsec) having commenced production in 2004 with initial recoverable reserves of 50 million barrels of oil.
The four undeveloped fields hold oil and gas resources in excess of 34 MMbbl of oil and 550 Bcf of gas1 representing substantial potential future growth of reserves and production for the Company. The net to Petsec NPV10 of the 34 million barrels using a low case of US$45/bbl is in excess of US$500 million.
OMV’s continuous operations to produce Habban oil since April 2018, and successful use of the Block 4 pipeline and oil export liftings from the Bir Ali Oil Export Terminal and confirm the viability of this export route.
Consequently, the Company’s plans to restart production at the An Nagyah Oilfield by trucking oil 70 kilometres East to the head of the Block 4 pipeline which runs 204 kilometres South to storage and export shipping facilities at Bir Ali. Estimated OPEX for this route is US$15/bbl. Truck loading facilities for An Nagyah crude oil have been built and are in storage in Dubai, and are ready for transport to Block S-1 as soon as we receive Yemen Government approvals.
The Company’s engineers estimate the cost to restart oil production at An Nagyah at a rate of 5,000 bopd, ranges between US$5 to US$10 million and would take between 3 and 6 months to effect the restart from the time of receipt of Yemen Government approvals. Funding to meet that estimated cost was originally made available through the Company’s CN Facility established in August of 2016, in response to the Yemen Government’s appeal to operators to restart oil production in Yemen.
The Company has been seeking, since early 2017, the necessary government support and formal approvals for a trucking operation to access government oil export facilities in order to restart oil production at the An Nagyah Oilfield until such times as the Ras Isa oil export terminal at the port of Hodeidah resumes operations and the Marib pipeline is again operational. Delays have been due to limited and changing Yemen administration capabilities, political changes, security conditions, Petsec Energy as a new entrant to operations in Yemen, and consideration of the Company’s technical and financial capacity.
We have engaged with the Oil Minister, His Excellency Aws Al-Oud, since his appointment in January 2018, seeking his support for the restart of production at the An Nagyah Oilfield by way of trucking to Yemen Government owned pipeline transport and export facilities. Access to these facilities are part of the Contractor’s rights contained within the Block S-1 Production Sharing Agreement.
Documentation supporting the Company’s technical and financial capabilities to restart production at the An Nagyah Oilfield was supplied to the Minister of Oil and Minerals during the September Quarter for his review and approval.
Block 7, Al Barqa Permit, Republic of Yemen Petsec: 100% working interest (85% participating interest)
Petsec Energy acquired its interest in the period 2014–2017.
Block 7 is an onshore exploration permit covering an area of 5,000 square kilometres (1,235,527 acres) located approximately 340 kilometres east of Sana’a. The block contains the Al Meashar oil discovery as well as an inventory of leads and prospects defined by 2D and 3D seismic surveys with significant oil potential.
The Company has operatorship and holds a 75% working interest in Block 7 (63.75% participating interest) in the Al Barqa (Block 7) Joint Venture and has an agreement with KUFPEC to acquire their 25% working interest in Block 7. The KUFPEC transaction brings the Company’s potential interest in the block to 100% pending customary approvals from the Government.
Block 7 contains two suspended discovery wells in the Al Meashar Oilfield (target resource of 11 MMbbl to 50 MMbbl) which is located 14 kilometres East of OMV’s Habban Oilfield which holds ultimate recoverable reserves of 350 million barrels of oil, in the same reservoir rocks as Al Meashar.
In 2010-11, short-term testing of the two Al Meashar wells delivered flow rates ranging from 200 to 1,000 bopd.
The block also contains eight potential prospect/lead targets ranging in size from 2 to 900 MMbbl oil gross. The top four prospects hold potential in excess of 1 billion barrels of recoverable oil.
1 Source: Wood Mackenzie Asia Pacific Pty Ltd (November 2015)
DIRECTORS’ REPORT 21
Directors’ Report continuedFor the year ended 31 December 2018
8. Objectives, strategy and future performance
It is the consolidated entity’s objective to increase the value of the Company and thus shareholder value through successful oil and gas exploration, development, and production, and through acquisitions. The consolidated entity’s strategy to meet the above objective is to produce its current reserves, pursue participation in high quality, high impact exploration drilling opportunities in the Gulf Coast onshore Louisiana and offshore Gulf of Mexico, USA. The consolidated entity also intends to explore opportunities to acquire onshore producing oil and gas reserves in MENA which hold significant development, exploitation potential.
The consolidated entity’s strategy takes into account the expected operating and market conditions, together with general economic conditions, which are inherently uncertain. The consolidated entity has structured and proactive risk management and internal control systems in place to manage material risks. Certain of those risks are inherent to the consolidated entity’s business, such as drilling for, producing and marketing oil and gas. Although the consolidated entity is committed to minimising its risk exposure, many risks are largely beyond the control of the consolidated entity and its directors. Moreover, other more general risks associated with the vicissitudes of commercial life, political change, and cyclical economic conditions are risks that the consolidated entity cannot control. The following are those risks which management and the Board consider to be material business risks that could adversely affect the achievement of the financial prospects of the Company discussed above:
Drilling and Production RisksDrilling for oil and natural gas is subject to numerous risks. Paramount is the risk that drilling operations will not result in the discovery of commercially productive oil or natural gas reservoirs. Also, projects are subject to economic risks. Before beginning a drilling project, the Company can only estimate the cost of drilling and completing wells as many indeterminable factors can affect the total cost. For example, oil and natural gas drilling and production activities may be extended, shortened, delayed or cancelled as a result of a variety of factors, many of which are beyond the Company’s control. These risks may negatively impact the economics of drilling projects. In part, these factors include:
• Unexpected drilling conditions including abnormal geological pressure or irregularities in formations;
• Equipment failures or accidents;
• Weather conditions, including hurricanes and other tropical weather disturbances;
• Shortages in experienced labour;
• Shortages, delays in the delivery, or high cost of drilling rigs and equipment;
• Constraints on access to transportation systems (pipelines) delaying sale of oil and natural gas;
• Reduction or losses of resources or reserves;
• Acquiring and maintaining title to its interests;
• Unresolved landowner or regulatory issues; and
• Inability of third-party joint venture partners to participate in or fund their share of drilling and production activities.
Operating RisksThe exploration for and development and production of oil and natural gas involves a variety of industry operating risks. If any of these industry-operating risks occur, the Company could have substantial losses. Substantial losses could include injury or loss of life, severe damage to or destruction of property, natural resources and equipment, pollution or other environmental damage, clean-up responsibilities, regulatory investigation and penalties and suspension of operations. These risks include:
• Fire, explosions, blow-outs and surface cratering;
• Lost or damaged oilfield drilling pipe and service tools;
• Casing or cement failures;
• Environmental hazards caused by oil spills, natural gas leaks, pipeline ruptures or discharges of toxic gases; and
• Hazards of marine operations such as capsizing, collision and adverse weather and sea conditions.
Marketing and Sales Risks The marketing and sale of oil and natural gas is subject to the risk of adverse commodity price fluctuations that impact cash flow. Some factors that affect commodity prices include:
• Relatively minor changes in the supply of and demand for oil and natural gas;
• Market uncertainty;
• The level of consumer product demand;
• Weather conditions;
• Domestic and foreign governmental regulations;
• The price and availability of alternative fuels;
• Technological advances affecting oil and natural gas consumption;
• Political and economic conditions in oil producing countries, particularly those in the Middle East;
• Policies of the Australian, U.S. and Yemen governments;
• The foreign supply of oil and natural gas;
• The price of oil and natural gas imports; and
• General economic conditions.
To reduce the impact of price fluctuations, from time to time, the Company has used derivative financial instruments, such as natural gas swaps, puts and costless collars, on a portion of its future production. However, such hedging activities may not be sufficient to protect the Company against the risk of price declines and may limit income and liquidity if prices rise.
• Hedging activities that are intended to reduce the risk of downward price fluctuations on a portion of our future production may limit the Company’s potential income if oil and gas prices rise above a level established by its hedge instruments.
PETSEC ENERGY LTD ANNUAL REPORT 201822
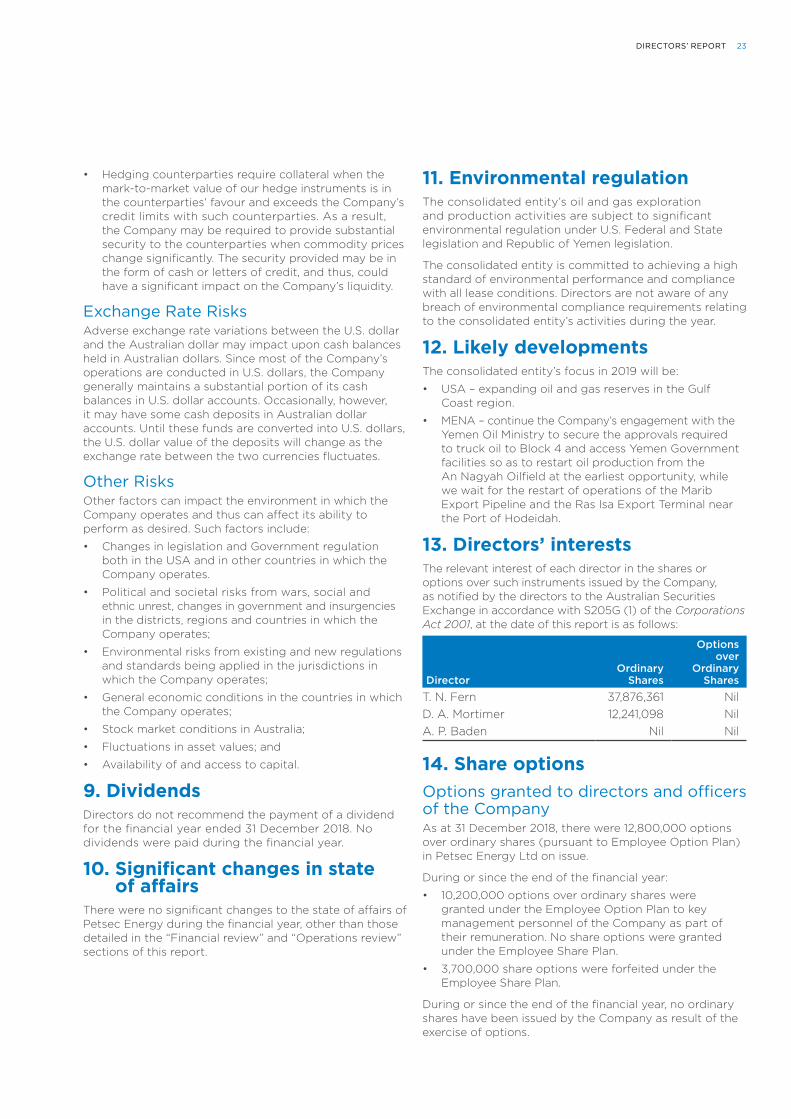
• Hedging counterparties require collateral when the mark-to-market value of our hedge instruments is in the counterparties’ favour and exceeds the Company’s credit limits with such counterparties. As a result, the Company may be required to provide substantial security to the counterparties when commodity prices change significantly. The security provided may be in the form of cash or letters of credit, and thus, could have a significant impact on the Company’s liquidity.
Exchange Rate Risks Adverse exchange rate variations between the U.S. dollar and the Australian dollar may impact upon cash balances held in Australian dollars. Since most of the Company’s operations are conducted in U.S. dollars, the Company generally maintains a substantial portion of its cash balances in U.S. dollar accounts. Occasionally, however, it may have some cash deposits in Australian dollar accounts. Until these funds are converted into U.S. dollars, the U.S. dollar value of the deposits will change as the exchange rate between the two currencies fluctuates.
Other Risks Other factors can impact the environment in which the Company operates and thus can affect its ability to perform as desired. Such factors include:
• Changes in legislation and Government regulation both in the USA and in other countries in which the Company operates.
• Political and societal risks from wars, social and ethnic unrest, changes in government and insurgencies in the districts, regions and countries in which the Company operates;
• Environmental risks from existing and new regulations and standards being applied in the jurisdictions in which the Company operates;
• General economic conditions in the countries in which the Company operates;
• Stock market conditions in Australia;
• Fluctuations in asset values; and
• Availability of and access to capital.
9. DividendsDirectors do not recommend the payment of a dividend for the financial year ended 31 December 2018. No dividends were paid during the financial year.
10. Significant changes in state of affairs
There were no significant changes to the state of affairs of Petsec Energy during the financial year, other than those detailed in the “Financial review” and “Operations review” sections of this report.
11. Environmental regulationThe consolidated entity’s oil and gas exploration and production activities are subject to significant environmental regulation under U.S. Federal and State legislation and Republic of Yemen legislation.
The consolidated entity is committed to achieving a high standard of environmental performance and compliance with all lease conditions. Directors are not aware of any breach of environmental compliance requirements relating to the consolidated entity’s activities during the year.
12. Likely developmentsThe consolidated entity’s focus in 2019 will be:
• USA – expanding oil and gas reserves in the Gulf Coast region.
• MENA – continue the Company’s engagement with the Yemen Oil Ministry to secure the approvals required to truck oil to Block 4 and access Yemen Government facilities so as to restart oil production from the An Nagyah Oilfield at the earliest opportunity, while we wait for the restart of operations of the Marib Export Pipeline and the Ras Isa Export Terminal near the Port of Hodeidah.
13. Directors’ interestsThe relevant interest of each director in the shares or options over such instruments issued by the Company, as notified by the directors to the Australian Securities Exchange in accordance with S205G (1) of the Corporations Act 2001, at the date of this report is as follows:
DirectorOrdinary
Shares
Optionsover
OrdinaryShares
T. N. Fern 37,876,361 NilD. A. Mortimer 12,241,098 NilA. P. Baden Nil Nil
14. Share optionsOptions granted to directors and officers of the CompanyAs at 31 December 2018, there were 12,800,000 options over ordinary shares (pursuant to Employee Option Plan) in Petsec Energy Ltd on issue.
During or since the end of the financial year:
• 10,200,000 options over ordinary shares were granted under the Employee Option Plan to key management personnel of the Company as part of their remuneration. No share options were granted under the Employee Share Plan.
• 3,700,000 share options were forfeited under the Employee Share Plan.
During or since the end of the financial year, no ordinary shares have been issued by the Company as result of the exercise of options.
DIRECTORS’ REPORT 23

Directors’ Report continuedFor the year ended 31 December 2018
15. Indemnification and insurance of officers
During the year ended 31 December 2018, the Company maintained policies of insurance in respect of directors and officers liability. The policies insure persons who are directors or officers of the Company and its controlled entities against certain costs and expenses which may be incurred by them in defending proceedings and against other liabilities which may arise from their positions. The insured directors and officers are the directors, executive officers and secretaries of the Company and the directors, executive officers and secretaries of controlled entities.
The insurance contracts prohibit the disclosure of particulars of the premiums and the nature of the liabilities insured.
The Company has entered into Deeds of Indemnity and Access with directors on the terms approved by shareholders. The agreements stipulate that the Company will meet the full amount of any liabilities to another person that might arise from their position (except where the liability arises out of conduct involving a lack of good faith).
The Company has made during or since the end of the financial year no payments in relation to indemnification. The Company provides the normal indemnities to directors and officers in relation to the work carried out on behalf of or at the request of the Company.
16. Non-audit servicesThe Company’s auditor, KPMG, may perform certain other services in addition to their statutory duties.
The Board considers the non-audit services provided during the year by the auditor and in accordance with advice provided by resolution of the audit committee, is satisfied that the provision of those non-audit services during the year by the auditor is compatible with, and did not compromise, the auditor independence requirements of the Corporation Act 2001 for the following reasons:
• All non-audit services were subject to the corporate governance procedures adopted by the Company and have been reviewed by the audit committee to ensure they do not impact the integrity and objectivity of the auditor; and
• The non-audit services provided do not undermine the general principles relating to auditor independence as set out in APES 110 Code of Ethics for Professional Accountants, as they did not involve reviewing or auditing the auditor’s own work, acting in a management or decision-making capacity for the Company, acting as an advocate for the Company or jointly sharing risks and rewards.
Details of the amounts paid to the auditor of the Company, KPMG, and its related practices for audit and non-audit services provided during the year are set out in note 7 of the accompanying Financial Statements.
17. Lead auditor’s independence declaration
The Lead Auditor’s Independence Declaration is set out on page 32 and forms part of the Directors’ Report for the financial year ended 31 December 2018.
18. Rounding offThe Company is of a kind referred to in ASIC Corporations (Rounding in Financial/Directors’ Reports) Instrument 2016/191 dated 24 March 2016 and in accordance with that Class Order, amounts in the Financial Report and Directors’ Report have been rounded off to the nearest one thousand dollars, unless otherwise stated.
19. Events subsequent to balance date
Other than the matter disclosed above, there has not arisen in the interval between the end of the financial year and the date of this report any item, transaction or event of a material and unusual nature likely, in the opinion of the directors of the Company, to affect significantly the operations of the consolidated entity, the results of those operations, or the state of affairs of the consolidated entity, in future years.
This report is made with a resolution of the directors:
T. N. Fern Director
Sydney, 25 February 2019
PETSEC ENERGY LTD ANNUAL REPORT 201824

20. Remuneration Report – Audited
20.1 IntroductionThis Remuneration Report forms part of the Directors’ Report. It outlines the overall remuneration strategy, framework and practices adopted by the Company and the consolidated entity (“Petsec Energy Group”) for the year ended 31 December 2018 and has been prepared in accordance with Section 300A of the Corporations Act 2001 and its regulations.
In accordance with the Corporations Act 2001, remuneration details are disclosed for the Petsec Energy Group’s Key Management Personnel.
Key management personnel are those persons having authority and responsibility for planning, directing and controlling the activities of the Petsec Energy Group. Key management personnel comprise the directors of the Company and senior executives of the Petsec Energy Group, whose names appear in the tables in section 20.5 of this report.
20.2 Executive summaryThe Board’s remuneration policy is to provide fair and market competitive levels of remuneration for all employees, including directors and key management personnel in order for the Company and the Petsec Energy Group to benefit by attracting and retaining a high quality team.
The Company has a Nomination and Remuneration Committee to assist the Board in the implementation and administration of the remuneration policy – refer to section 20.3, below.
The key developments during the year in the implementation and administration of the remuneration policy included:
• The annual review of key management personnel performance.
• Annual review of the Nomination & Remuneration Committee Charter.
20.3 Nomination and Remuneration Committee
The Nomination and Remuneration Committee oversees the appointment and induction process for directors and committee members, and the selection, appointment and succession planning process of the Company’s Chief Executive Officer. The Committee makes recommendations to the Board on the appropriate skill mix, personal qualities, expertise and diversity of each position. When a vacancy exists or there is a need for particular skills, the Committee in consultation with the Board determines the selection criteria based on the skills deemed necessary.
The Committee reviews and makes recommendations to the Board on compensation packages and policies applicable to the executive officers and directors of the Petsec Energy Group. It is also responsible for oversight of diversity, employee share and option schemes, incentive performance packages, superannuation entitlements, retirement and termination entitlements, fringe benefits policies, deeds of access and indemnity, and professional indemnity and liability insurance policies.
Executive compensation and other terms of employment are reviewed annually by the Nomination and Remuneration Committee having regard to performance against goals set at the start of the year, relevant corporate information and where appropriate independent expert advice.
The Nomination and Remuneration Committee comprised the following members during the year:
• D. A. Mortimer (Chairman) – Independent Non-executive Director
• A. P. Baden – Independent Non-executive Director
The Board policy is that the Nomination and Remuneration Committee will comprise a majority of non-executive directors and a non-executive chairman.
The Nomination and Remuneration Committee meets at least twice a year and as required. The Committee met four times during the year and the Committee members’ attendance record is disclosed in the table of directors’ meetings.
The Nomination and Remuneration Committee’s Charter is available on the Company’s website www.petsec.com.au.
20.4 Principles of compensationCompensation levels for key management personnel are competitively set to attract and retain appropriately qualified and experienced directors and senior executives. The Nomination and Remuneration Committee obtains peer comparisons and/or independent advice on the appropriateness of compensation packages of the Petsec Energy Group, given trends in comparative companies both locally and internationally and the objectives of the Company’s compensation strategy.
The compensation structures explained below are designed to attract suitably qualified candidates, reward the achievement of the Company’s objectives, and achieve the broader outcome of creation of value for shareholders.
The compensation structures take into account:
• The capability and experience of the key management personnel; and
• The ability of key management personnel to control the relevant performance of their segment of operation.
Compensation packages include a mix of fixed compensation and performance-based incentives, including equity-based incentives as set out below.
DIRECTORS’ REPORT 25
Directors’ Report continuedFor the year ended 31 December 2018
20. Remuneration Report – Audited continued
20.4 Principles of compensation continued
In addition to their salaries, the Petsec Energy Group also provides non-cash benefits to its key management personnel as set out below, and contributes to several post-employment defined contribution superannuation plans in Australia and also matches contributions made by U.S. based key management personnel to a voluntary savings plan under Section 401(k) of the U.S. tax code.
Fixed compensationFixed compensation consists of base compensation (which is calculated on a total cost basis and includes any FBT charges related to employee benefits), as well as employer contributions to superannuation funds in Australia and employer matching contributions to voluntary savings plans under Section 401(k) of the U.S. tax code. Non-cash benefits comprise employer payments towards U.S. health, dental and vision plans, as well as life and salary continuance insurance benefits.
The Nomination and Remuneration Committee reviews compensation levels and other terms of employment annually through a process that considers individual, segment and overall performance of the Company against goals set at the start of the year. In addition, where necessary, external consultants provide analysis and advice to ensure the directors’ and senior executives’ compensation is competitive in the market place.
Performance-linked compensationPerformance-linked compensation includes both short-term and long-term incentives and is designed to reward key management personnel for meeting or exceeding the Company’s financial objectives and agreed individual objectives. The short-term incentive (STI) is an “at risk” bonus provided in the form of cash or ordinary shares in the Company, while the long-term incentive (LTI) is provided as either shares or options over ordinary shares of the Company under the rules of the Employee Share and Option Plans approved by shareholders at the Annual General Meeting held on 17 May 2018 (see note 17(b) to financial statements). The maximum number of securities in aggregate that may be issued under the Employee Share and Option Plans is 21,033,215.
Short-term incentiveShort-term incentives are provided to key management personnel through discretionary bonuses as determined and granted by the Company’s Nomination and Remuneration Committee. Factors considered by the Committee when granting discretionary bonuses include personal performance, the achievement of strategic objectives, and the retention and motivation of employees.
No short-term incentives were awarded to key management personnel during the year.
Long-term incentiveCertain key management personnel are also provided with long-term incentives through participation in the Company’s Employee Share and Option Plans, subject to the approval of the Committee. Key management personnel are typically offered options on an annual basis with the exercise price of the shares or options based on the weighted average market price of the Company’s ordinary shares for the five trading days preceding the date of issue, subject to a minimum exercise price of 20 cents.
During the year, the Company issued 10,200,000 options over ordinary shares under its shareholder approved Employee Option Plan (“EOP”) to key management personnel as long-term incentive compensation (see note 20.7 of the Remuneration Report) on the following terms:
• 2,500,000 options are exercisable at 20 cents per share and have an expiry date of 16 February 2023.
• 7,700,000 options are exercisable at 20 cents per share and have an expiry date of 23 February 2023.
PETSEC ENERGY LTD ANNUAL REPORT 201826
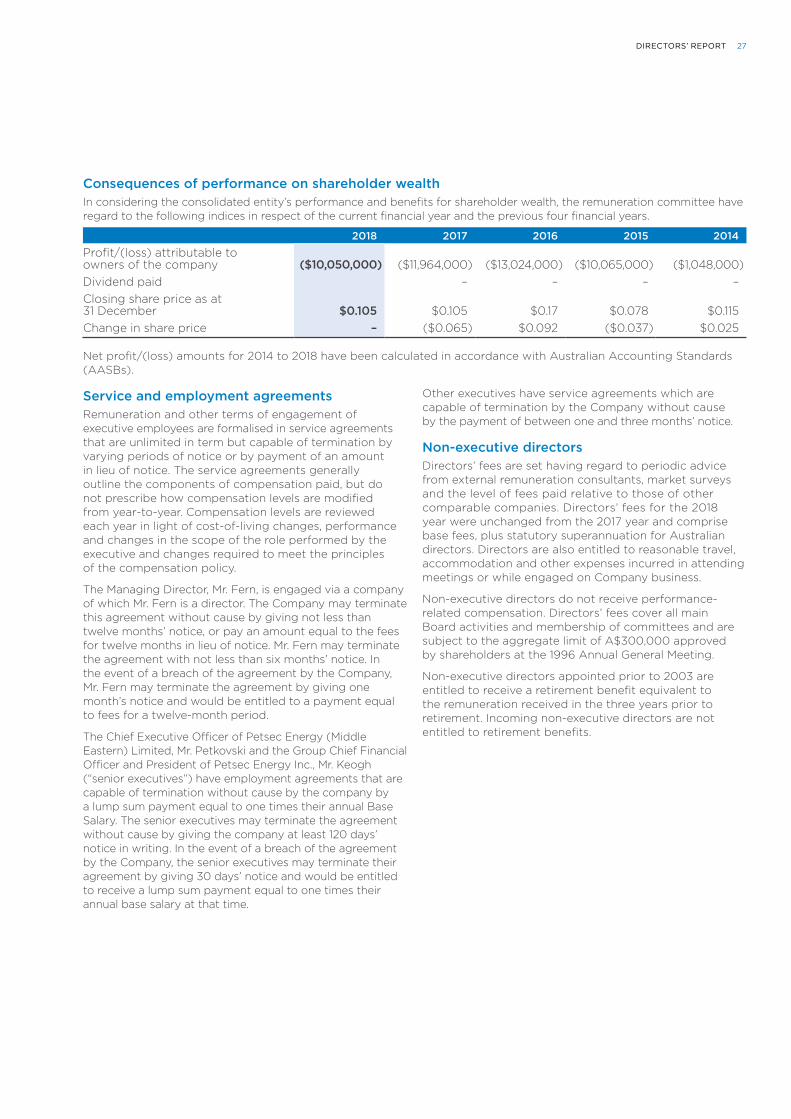
Consequences of performance on shareholder wealthIn considering the consolidated entity’s performance and benefits for shareholder wealth, the remuneration committee have regard to the following indices in respect of the current financial year and the previous four financial years.
2018 2017 2016 2015 2014
Profit/(loss) attributable to owners of the company ($10,050,000) ($11,964,000) ($13,024,000) ($10,065,000) ($1,048,000)Dividend paid – – – –Closing share price as at 31 December $0.105 $0.105 $0.17 $0.078 $0.115Change in share price – ($0.065) $0.092 ($0.037) $0.025
Net profit/(loss) amounts for 2014 to 2018 have been calculated in accordance with Australian Accounting Standards (AASBs).
Service and employment agreements Remuneration and other terms of engagement of executive employees are formalised in service agreements that are unlimited in term but capable of termination by varying periods of notice or by payment of an amount in lieu of notice. The service agreements generally outline the components of compensation paid, but do not prescribe how compensation levels are modified from year-to-year. Compensation levels are reviewed each year in light of cost-of-living changes, performance and changes in the scope of the role performed by the executive and changes required to meet the principles of the compensation policy.
The Managing Director, Mr. Fern, is engaged via a company of which Mr. Fern is a director. The Company may terminate this agreement without cause by giving not less than twelve months’ notice, or pay an amount equal to the fees for twelve months in lieu of notice. Mr. Fern may terminate the agreement with not less than six months’ notice. In the event of a breach of the agreement by the Company, Mr. Fern may terminate the agreement by giving one month’s notice and would be entitled to a payment equal to fees for a twelve-month period.
The Chief Executive Officer of Petsec Energy (Middle Eastern) Limited, Mr. Petkovski and the Group Chief Financial Officer and President of Petsec Energy Inc., Mr. Keogh (“senior executives”) have employment agreements that are capable of termination without cause by the company by a lump sum payment equal to one times their annual Base Salary. The senior executives may terminate the agreement without cause by giving the company at least 120 days’ notice in writing. In the event of a breach of the agreement by the Company, the senior executives may terminate their agreement by giving 30 days’ notice and would be entitled to receive a lump sum payment equal to one times their annual base salary at that time.
Other executives have service agreements which are capable of termination by the Company without cause by the payment of between one and three months’ notice.
Non-executive directorsDirectors’ fees are set having regard to periodic advice from external remuneration consultants, market surveys and the level of fees paid relative to those of other comparable companies. Directors’ fees for the 2018 year were unchanged from the 2017 year and comprise base fees, plus statutory superannuation for Australian directors. Directors are also entitled to reasonable travel, accommodation and other expenses incurred in attending meetings or while engaged on Company business.
Non-executive directors do not receive performance-related compensation. Directors’ fees cover all main Board activities and membership of committees and are subject to the aggregate limit of A$300,000 approved by shareholders at the 1996 Annual General Meeting.
Non-executive directors appointed prior to 2003 are entitled to receive a retirement benefit equivalent to the remuneration received in the three years prior to retirement. Incoming non-executive directors are not entitled to retirement benefits.
DIRECTORS’ REPORT 27
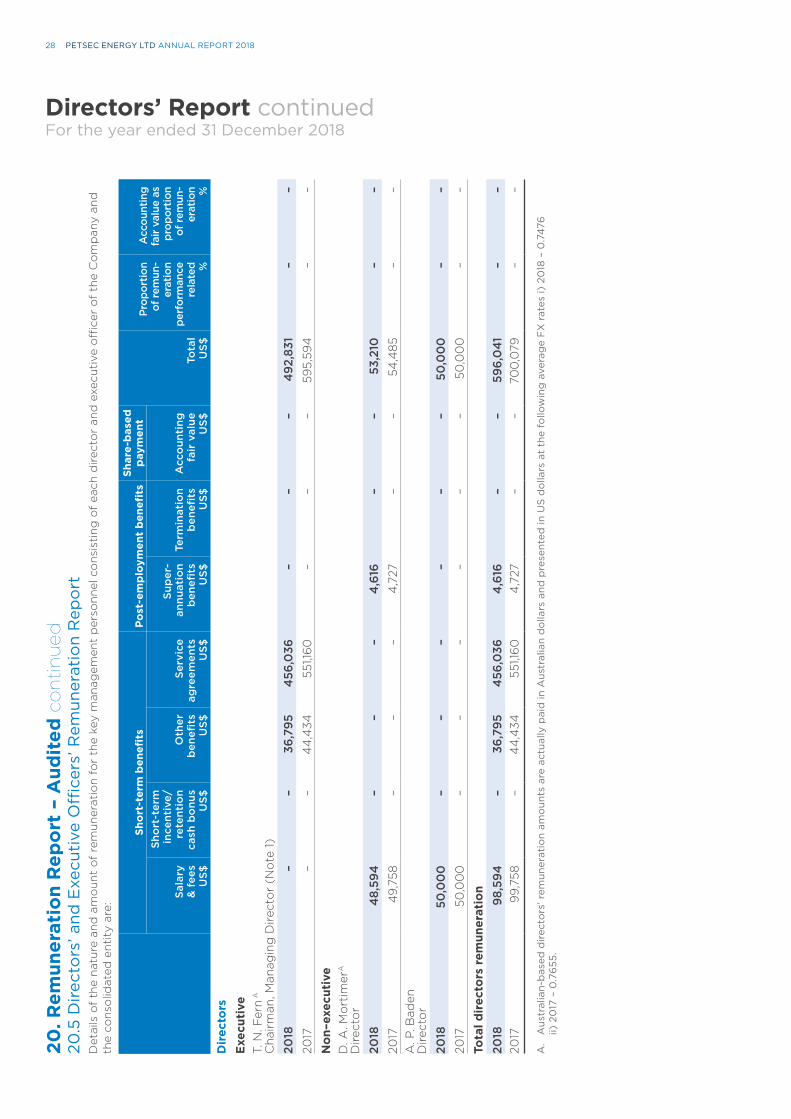
Directors’ Report continuedFor the year ended 31 December 2018
20. R
emun
erat
ion
Rep
ort
– A
udit
ed continued
20.5
Dir
ecto
rs’ a
nd E
xecu
tive
Offi
cers
’ Rem
uner
atio
n R
epo
rtD
etai
ls o
f th
e n
atu
re a
nd
am
ou
nt
of
rem
un
erat
ion
fo
r th
e ke
y m
anag
emen
t p
erso
nn
el c
on
sist
ing
of
each
dir
ecto
r an
d e
xecu
tive
offi
cer
of
the
Co
mp
any
and
th
e co
nso
lidat
ed e
nti
ty a
re:
Sho
rt-t
erm
ben
efits
Po
st-e
mp
loym
ent
ben
efits
Shar
e-b
ased
p
aym
ent
Tota
lU
S$
Prop
ortio
nof
rem
un-
erat
ion
perf
orm
ance
rela
ted %
Acc
ount
ing
fair
valu
e as
prop
ortio
nof
rem
un-
erat
ion %
Sala
ry&
fee
sU
S$
Sho
rt-t
erm
ince
ntiv
e/re
tent
ion
cash
bo
nus
US$
Oth
erb
enefi
tsU
S$
Serv
ice
agre
emen
tsU
S$
Sup
er-
annu
atio
nb
enefi
tsU
S$
Term
inat
ion
ben
efits
US$
Acc
oun
ting
fair
val
ue
US$
Dir
ecto
rsEx
ecut
ive
T. N
. Fer
n A
Cha
irm
an, M
anag
ing
Dire
cto
r (N
ote
1)
2018
––
36,7
954
56,0
36–
––
492
,831
––
2017
––
44
,434
551,1
60
––
–59
5,59
4–
–
Non
–exe
cuti
veD
. A. M
ort
imer
A
Dire
cto
r
2018
48,
594
––
–4
,616
––
53,2
10–
–20
174
9,75
8–
––
4,7
27–
–54
,485
––
A. P
. Bad
en
Dire
cto
r
2018
50,0
00
––
––
––
50,0
00
––
2017
50,0
00
––
––
––
50,0
00
––
Tota
l dir
ecto
rs r
emun
erat
ion
2018
98,5
94–
36,7
954
56,0
364
,616
––
596,
041
––
2017
99,
758
–4
4,4
3455
1,16
04
,727
––
700
,079
––
A.
Aus
tral
ian-
bas
ed d
irec
tors
’ rem
uner
atio
n am
oun
ts a
re a
ctua
lly p
aid
in A
ustr
alia
n d
olla
rs a
nd p
rese
nted
in U
S d
olla
rs a
t th
e fo
llow
ing
ave
rag
e F
X r
ates
i) 2
018
– 0
.74
76
ii) 2
017
– 0
.76
55.
PETSEC ENERGY LTD ANNUAL REPORT 201828
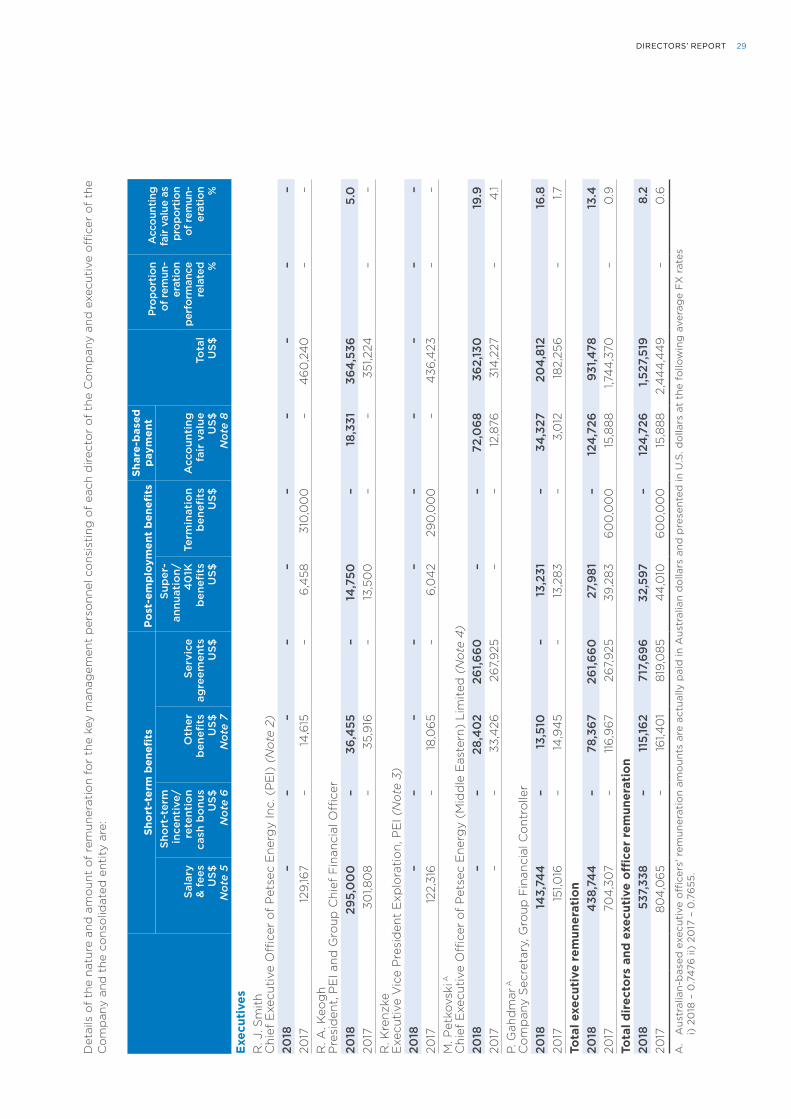
Det
ails
of
the
nat
ure
an
d a
mo
un
t o
f re
mu
ner
atio
n f
or
the
key
man
agem
ent
per
son
nel
co
nsi
stin
g o
f ea
ch d
irec
tor
of
the
Co
mp
any
and
exe
cuti
ve o
ffice
r o
f th
e C
om
pan
y an
d t
he
con
solid
ated
en
tity
are
:
Sho
rt-t
erm
ben
efits
Po
st-e
mp
loym
ent
ben
efits
Shar
e-b
ased
p
aym
ent
Tota
lU
S$
Prop
ortio
nof
rem
un-
erat
ion
perf
orm
ance
rela
ted %
Acc
ount
ing
fair
valu
e as
prop
ortio
nof
rem
un-
erat
ion %
Sala
ry&
fee
sU
S$N
ote
5
Sho
rt-t
erm
ince
ntiv
e/re
tent
ion
cash
bo
nus
US$
No
te 6
Oth
erb
enefi
tsU
S$N
ote
7
Serv
ice
agre
emen
tsU
S$
Sup
er-
annu
atio
n/ 4
01K
ben
efits
US$
Term
inat
ion
ben
efits
US$
Acc
oun
ting
fair
val
ue
US$
No
te 8
Exec
utiv
esR
. J. S
mit
h C
hief
Exe
cuti
ve O
ffice
r o
f P
etse
c E
nerg
y In
c. (
PE
I) (
No
te 2
)20
18–
––
––
––
––
–20
1712
9,16
7–
14,6
15–
6,4
5831
0,0
00
–4
60
,24
0–
–R
. A. K
eog
h P
resi
den
t, P
EI a
nd G
roup
Chi
ef F
inan
cial
Offi
cer
2018
295,
00
0–
36,4
55–
14,7
50–
18,3
3136
4,5
365.
020
1730
1,80
8–
35,9
16–
13,5
00
––
351,2
24–
–R
. Kre
nzke
E
xecu
tive
Vic
e P
resi
den
t E
xplo
rati
on,
PE
I (N
ote
3)
2018
––
––
––
––
––
2017
122,
316
–18
,06
5–
6,0
42
290
,00
0–
436
,423
––
M. P
etko
vski
A
Chi
ef E
xecu
tive
Offi
cer
of
Pet
sec
Ene
rgy
(Mid
dle
Eas
tern
) Li
mit
ed (
No
te 4
)20
18–
–28
,40
226
1,660
––
72,0
6836
2,13
019
.920
17–
–33
,426
267,
925
––
12,8
7631
4,2
27–
4.1
P. G
ahd
mar
A
Co
mp
any
Sec
reta
ry, G
roup
Fin
anci
al C
ont
rolle
r20
1814
3,74
4–
13,5
10–
13,2
31–
34,3
2720
4,8
1216
.820
1715
1,016
–14
,94
5–
13,2
83–
3,0
1218
2,25
6–
1.7To
tal e
xecu
tive
rem
uner
atio
n20
184
38,7
44
–78
,367
261,6
6027
,981
–12
4,7
2693
1,478
13.4
2017
704
,30
7–
116
,967
267,
925
39,2
836
00
,00
015
,888
1,74
4,3
70–
0.9
Tota
l dir
ecto
rs a
nd e
xecu
tive
offi
cer
rem
uner
atio
n20
1853
7,33
8–
115,
162
717,
696
32,5
97–
124
,726
1,527
,519
8.2
2017
804
,06
5–
161,4
01
819,
085
44
,010
60
0,0
00
15,8
882,
44
4,4
49
–0
.6
A.
Aus
tral
ian-
bas
ed e
xecu
tive
offi
cers
’ rem
uner
atio
n am
oun
ts a
re a
ctua
lly p
aid
in A
ustr
alia
n d
olla
rs a
nd p
rese
nted
in U
.S. d
olla
rs a
t th
e fo
llow
ing
ave
rag
e F
X r
ates
i)
20
18 –
0.7
476
ii)
2017
– 0
.76
55.
DIRECTORS’ REPORT 29
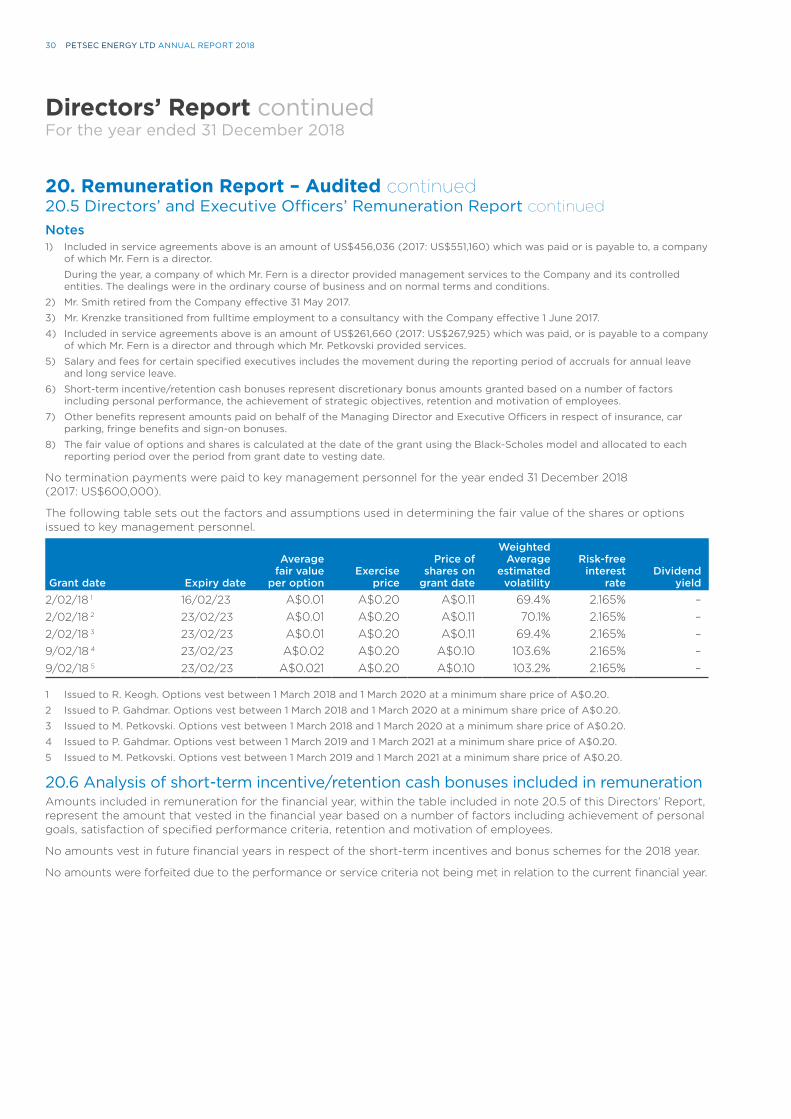
Directors’ Report continuedFor the year ended 31 December 2018
20. Remuneration Report – Audited continued20.5 Directors’ and Executive Officers’ Remuneration Report continuedNotes1) Included in service agreements above is an amount of US$456,036 (2017: US$551,160) which was paid or is payable to, a company
of which Mr. Fern is a director.
During the year, a company of which Mr. Fern is a director provided management services to the Company and its controlled entities. The dealings were in the ordinary course of business and on normal terms and conditions.
2) Mr. Smith retired from the Company effective 31 May 2017.
3) Mr. Krenzke transitioned from fulltime employment to a consultancy with the Company effective 1 June 2017.
4) Included in service agreements above is an amount of US$261,660 (2017: US$267,925) which was paid, or is payable to a company of which Mr. Fern is a director and through which Mr. Petkovski provided services.
5) Salary and fees for certain specified executives includes the movement during the reporting period of accruals for annual leave and long service leave.
6) Short-term incentive/retention cash bonuses represent discretionary bonus amounts granted based on a number of factors including personal performance, the achievement of strategic objectives, retention and motivation of employees.
7) Other benefits represent amounts paid on behalf of the Managing Director and Executive Officers in respect of insurance, car parking, fringe benefits and sign-on bonuses.
8) The fair value of options and shares is calculated at the date of the grant using the Black-Scholes model and allocated to each reporting period over the period from grant date to vesting date.
No termination payments were paid to key management personnel for the year ended 31 December 2018 (2017: US$600,000).
The following table sets out the factors and assumptions used in determining the fair value of the shares or options issued to key management personnel.
Grant date Expiry date
Averagefair value
per optionExercise
price
Price ofshares on
grant date
WeightedAverage
estimatedvolatility
Risk-freeinterest
rateDividend
yield
2/02/18 1 16/02/23 A$0.01 A$0.20 A$0.11 69.4% 2.165% –2/02/18 2 23/02/23 A$0.01 A$0.20 A$0.11 70.1% 2.165% –2/02/18 3 23/02/23 A$0.01 A$0.20 A$0.11 69.4% 2.165% –9/02/18 4 23/02/23 A$0.02 A$0.20 A$0.10 103.6% 2.165% –9/02/18 5 23/02/23 A$0.021 A$0.20 A$0.10 103.2% 2.165% –
1 Issued to R. Keogh. Options vest between 1 March 2018 and 1 March 2020 at a minimum share price of A$0.20.
2 Issued to P. Gahdmar. Options vest between 1 March 2018 and 1 March 2020 at a minimum share price of A$0.20.
3 Issued to M. Petkovski. Options vest between 1 March 2018 and 1 March 2020 at a minimum share price of A$0.20.
4 Issued to P. Gahdmar. Options vest between 1 March 2019 and 1 March 2021 at a minimum share price of A$0.20.
5 Issued to M. Petkovski. Options vest between 1 March 2019 and 1 March 2021 at a minimum share price of A$0.20.
20.6 Analysis of short-term incentive/retention cash bonuses included in remunerationAmounts included in remuneration for the financial year, within the table included in note 20.5 of this Directors’ Report, represent the amount that vested in the financial year based on a number of factors including achievement of personal goals, satisfaction of specified performance criteria, retention and motivation of employees.
No amounts vest in future financial years in respect of the short-term incentives and bonus schemes for the 2018 year.
No amounts were forfeited due to the performance or service criteria not being met in relation to the current financial year.
PETSEC ENERGY LTD ANNUAL REPORT 201830
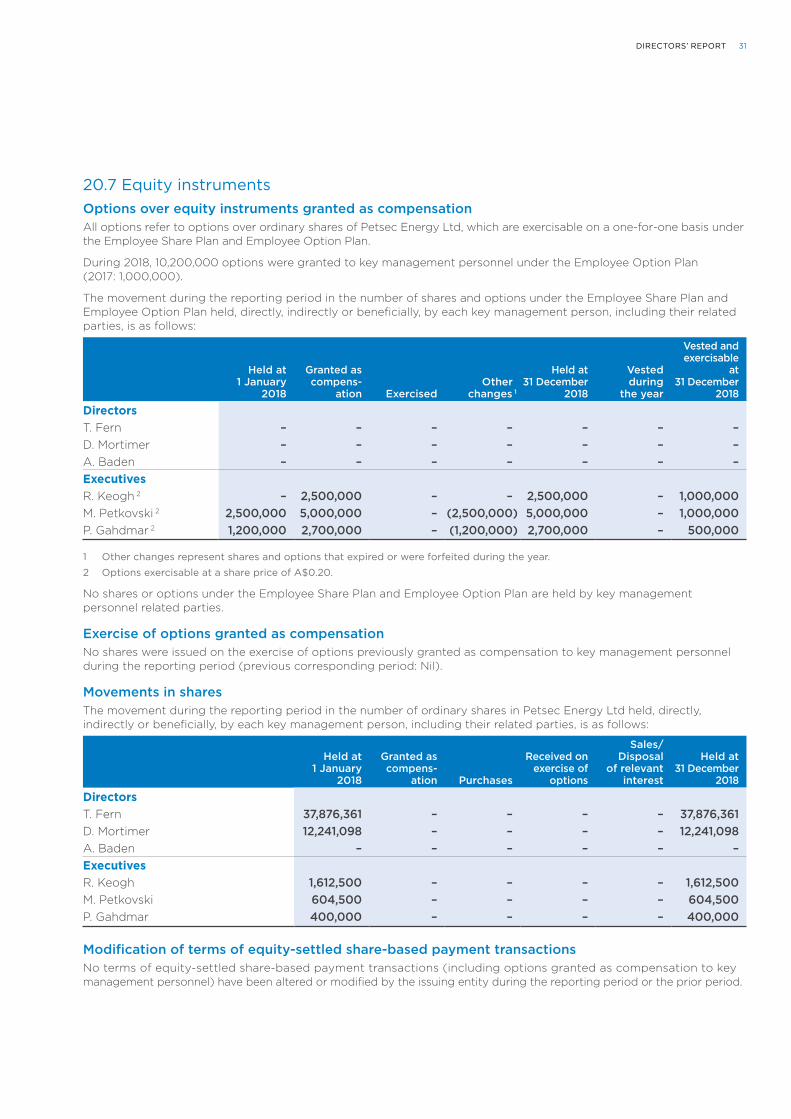
20.7 Equity instrumentsOptions over equity instruments granted as compensationAll options refer to options over ordinary shares of Petsec Energy Ltd, which are exercisable on a one-for-one basis under the Employee Share Plan and Employee Option Plan.
During 2018, 10,200,000 options were granted to key management personnel under the Employee Option Plan (2017: 1,000,000).
The movement during the reporting period in the number of shares and options under the Employee Share Plan and Employee Option Plan held, directly, indirectly or beneficially, by each key management person, including their related parties, is as follows:
Held at 1 January
2018
Granted ascompens-
ation ExercisedOther
changes 1
Held at31 December
2018
Vestedduring
the year
Vested andexercisable
at31 December
2018
DirectorsT. Fern – – – – – – –D. Mortimer – – – – – – –A. Baden – – – – – – –ExecutivesR. Keogh 2 – 2,500,000 – – 2,500,000 – 1,000,000M. Petkovski 2 2,500,000 5,000,000 – (2,500,000) 5,000,000 – 1,000,000P. Gahdmar 2 1,200,000 2,700,000 – (1,200,000) 2,700,000 – 500,000
1 Other changes represent shares and options that expired or were forfeited during the year.
2 Options exercisable at a share price of A$0.20.
No shares or options under the Employee Share Plan and Employee Option Plan are held by key management personnel related parties.
Exercise of options granted as compensationNo shares were issued on the exercise of options previously granted as compensation to key management personnel during the reporting period (previous corresponding period: Nil).
Movements in sharesThe movement during the reporting period in the number of ordinary shares in Petsec Energy Ltd held, directly, indirectly or beneficially, by each key management person, including their related parties, is as follows:
Held at 1 January
2018
Granted ascompens-
ation Purchases
Received on exercise of
options
Sales/Disposal
of relevant interest
Held at31 December
2018
DirectorsT. Fern 37,876,361 – – – – 37,876,361D. Mortimer 12,241,098 – – – – 12,241,098A. Baden – – – – – –ExecutivesR. Keogh 1,612,500 – – – – 1,612,500M. Petkovski 604,500 – – – – 604,500P. Gahdmar 400,000 – – – – 400,000
Modification of terms of equity-settled share-based payment transactionsNo terms of equity-settled share-based payment transactions (including options granted as compensation to key management personnel) have been altered or modified by the issuing entity during the reporting period or the prior period.
DIRECTORS’ REPORT 31

Lead Auditor’s Independence Declarationunder Section 307C of the Corporations Act 2001
Lead Auditor’s Independence Declaration under Section 307C of the Corporations Act 2001
To: the directors of Petsec Energy Ltd I declare that, to the best of my knowledge and belief, in relation to the audit for the financial year ended 31 December 2018 there have been:
(i) no contraventions of the auditor independence requirements as set out in the Corporations Act 2001 in relation to the audit; and
(ii) no contraventions of any applicable code of professional conduct in relation to the audit.
KPMG Daniel Camilleri
Partner
Sydney
25 February 2019
35
KPMG, an Australian partnership and a member firm of the KPMG network of independent member firms affiliated with KPMG International Cooperative (“KPMG International”), a Swiss entity.
Liability limited by a scheme approved under Professional Standards Legislation.
PETSEC ENERGY LTD ANNUAL REPORT 201832
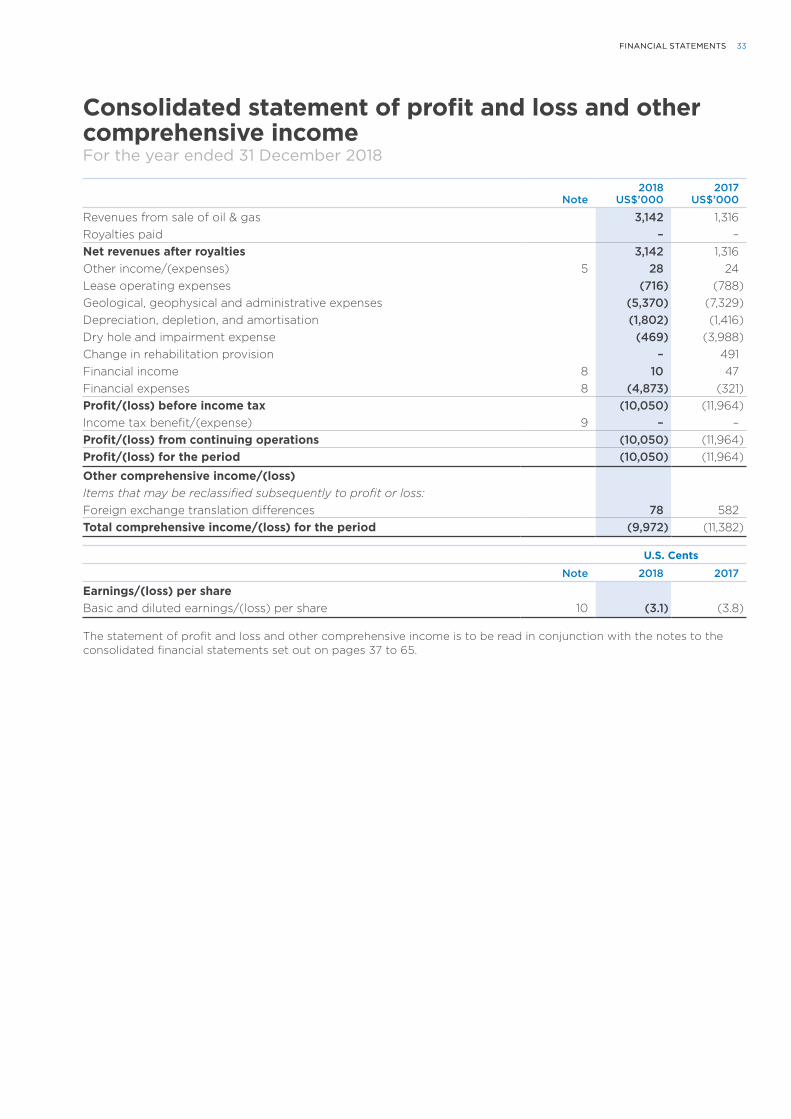
Consolidated statement of profit and loss and other comprehensive incomeFor the year ended 31 December 2018
Note2018
US$’0002017
US$’000
Revenues from sale of oil & gas 3,142 1,316Royalties paid – –Net revenues after royalties 3,142 1,316Other income/(expenses) 5 28 24Lease operating expenses (716) (788)Geological, geophysical and administrative expenses (5,370) (7,329)Depreciation, depletion, and amortisation (1,802) (1,416)Dry hole and impairment expense (469) (3,988)Change in rehabilitation provision – 491Financial income 8 10 47Financial expenses 8 (4,873) (321)Profit/(loss) before income tax (10,050) (11,964)Income tax benefit/(expense) 9 – –Profit/(loss) from continuing operations (10,050) (11,964)Profit/(loss) for the period (10,050) (11,964)
Other comprehensive income/(loss)Items that may be reclassified subsequently to profit or loss:Foreign exchange translation differences 78 582Total comprehensive income/(loss) for the period (9,972) (11,382)
U.S. Cents
Note 2018 2017
Earnings/(loss) per shareBasic and diluted earnings/(loss) per share 10 (3.1) (3.8)
The statement of profit and loss and other comprehensive income is to be read in conjunction with the notes to the consolidated financial statements set out on pages 37 to 65.
33FINANCIAL STATEMENTS
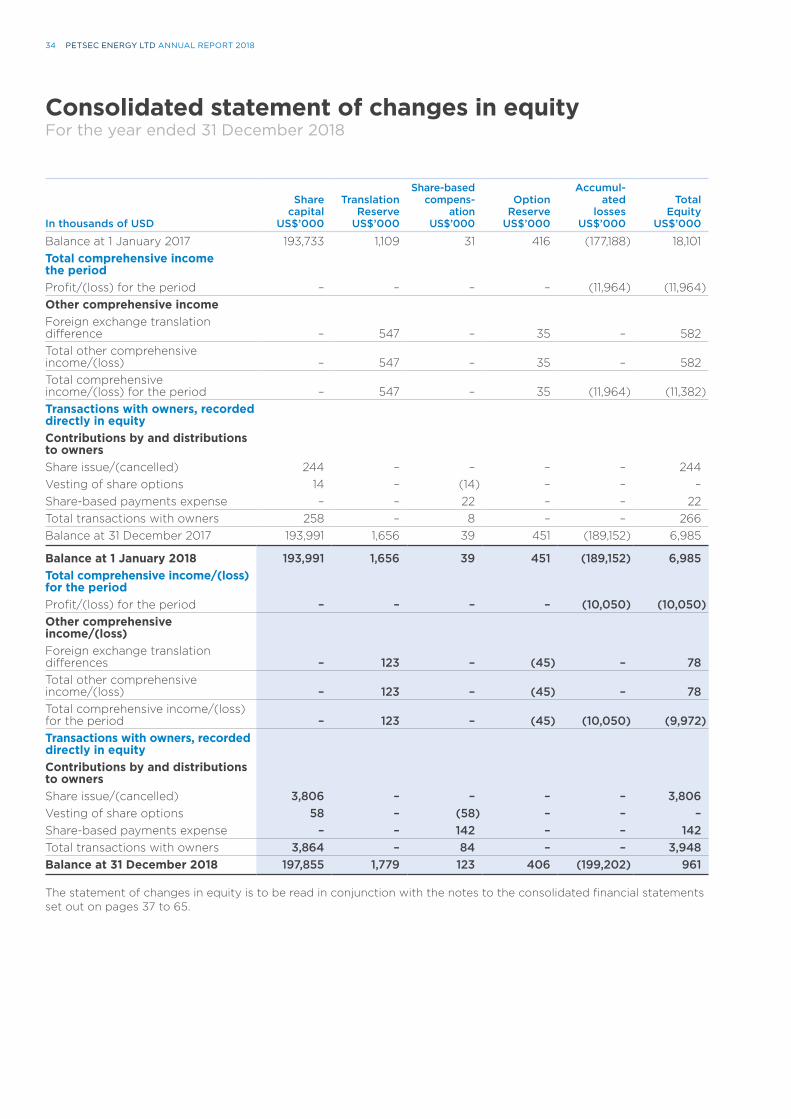
Consolidated statement of changes in equityFor the year ended 31 December 2018
In thousands of USD
Sharecapital
US$’000
TranslationReserve
US$’000
Share-basedcompens-
ationUS$’000
OptionReserve
US$’000
Accumul-ated
lossesUS$’000
TotalEquity
US$’000
Balance at 1 January 2017 193,733 1,109 31 416 (177,188) 18,101Total comprehensive income the periodProfit/(loss) for the period – – – – (11,964) (11,964)Other comprehensive income Foreign exchange translation difference – 547 – 35 – 582Total other comprehensive income/(loss) – 547 – 35 – 582Total comprehensive income/(loss) for the period – 547 – 35 (11,964) (11,382)Transactions with owners, recorded directly in equityContributions by and distributions to ownersShare issue/(cancelled) 244 – – – – 244Vesting of share options 14 – (14) – – –Share-based payments expense – – 22 – – 22Total transactions with owners 258 – 8 – – 266Balance at 31 December 2017 193,991 1,656 39 451 (189,152) 6,985
Balance at 1 January 2018 193,991 1,656 39 451 (189,152) 6,985Total comprehensive income/(loss) for the periodProfit/(loss) for the period – – – – (10,050) (10,050)Other comprehensive income/(loss)Foreign exchange translation differences – 123 – (45) – 78Total other comprehensive income/(loss) – 123 – (45) – 78Total comprehensive income/(loss) for the period – 123 – (45) (10,050) (9,972)Transactions with owners, recorded directly in equityContributions by and distributions to ownersShare issue/(cancelled) 3,806 – – – – 3,806Vesting of share options 58 – (58) – – –Share-based payments expense – – 142 – – 142Total transactions with owners 3,864 – 84 – – 3,948Balance at 31 December 2018 197,855 1,779 123 406 (199,202) 961
The statement of changes in equity is to be read in conjunction with the notes to the consolidated financial statements set out on pages 37 to 65.
PETSEC ENERGY LTD ANNUAL REPORT 201834
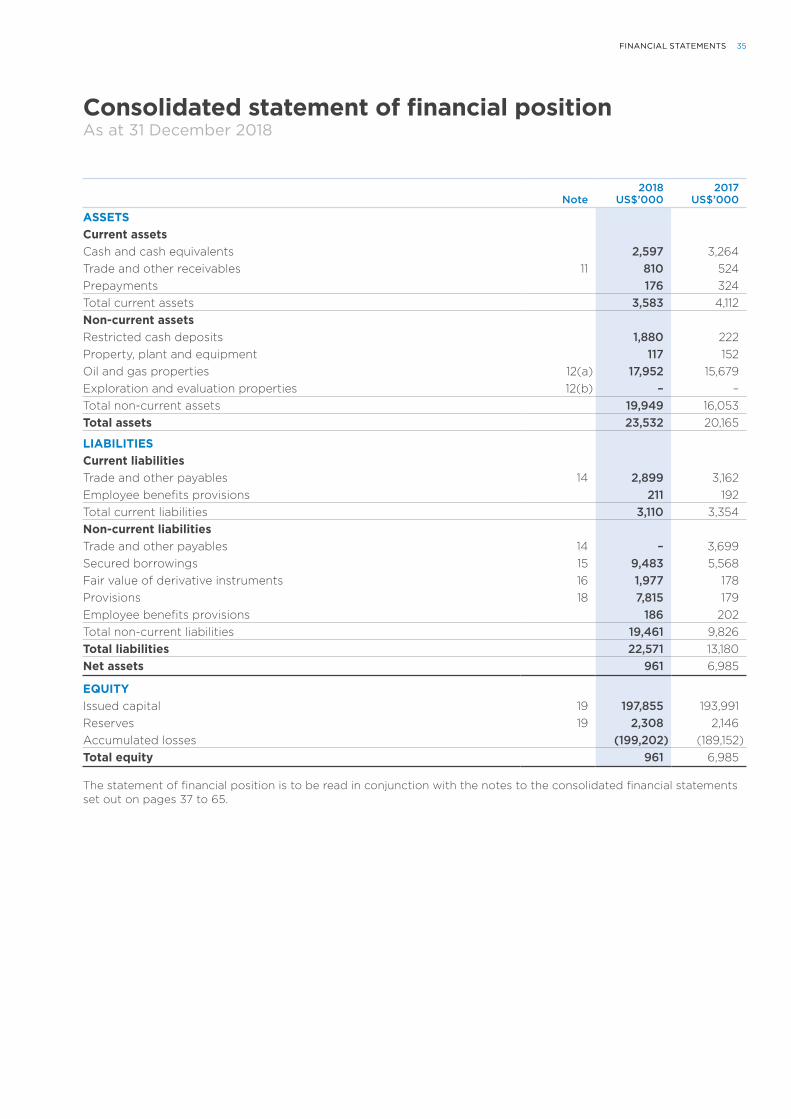
Consolidated statement of financial positionAs at 31 December 2018
Note2018
US$’0002017
US$’000
ASSETSCurrent assetsCash and cash equivalents 2,597 3,264Trade and other receivables 11 810 524Prepayments 176 324Total current assets 3,583 4,112Non-current assetsRestricted cash deposits 1,880 222Property, plant and equipment 117 152Oil and gas properties 12(a) 17,952 15,679Exploration and evaluation properties 12(b) – –Total non-current assets 19,949 16,053Total assets 23,532 20,165
LIABILITIESCurrent liabilitiesTrade and other payables 14 2,899 3,162Employee benefits provisions 211 192Total current liabilities 3,110 3,354Non-current liabilitiesTrade and other payables 14 – 3,699Secured borrowings 15 9,483 5,568Fair value of derivative instruments 16 1,977 178Provisions 18 7,815 179Employee benefits provisions 186 202Total non-current liabilities 19,461 9,826Total liabilities 22,571 13,180Net assets 961 6,985
EQUITYIssued capital 19 197,855 193,991Reserves 19 2,308 2,146Accumulated losses (199,202) (189,152)Total equity 961 6,985
The statement of financial position is to be read in conjunction with the notes to the consolidated financial statements set out on pages 37 to 65.
35FINANCIAL STATEMENTS

Consolidated statement of cashflowsFor the year ended 31 December 2018
Note2018
US$’0002017
US$’000
Cashflows from operating activitiesCash receipts from customers 2,841 1,300Cash payments to suppliers and employees (4,947) (9,629)Interest received 10 47Restricted deposits (1,680) 3,373Net cash used in operating activities 29 (3,776) (4,909)Cashflows from investing activitiesPayments for property, plant and equipment (3) (55)Payments for oil and gas, exploration and evaluation properties (2,646) (4,198)Aggregate cashflows from acquisitions 1,327 –Net cash used in investing activities (1,322) (4,253)Cashflows from financing activitiesProceeds from shares issued – net of transaction costs – 1,957Proceeds from drawdown of convertible note facility 4,500 492Net cash from financing activities 4,500 2,449Net (decrease)/increase in cash and cash equivalents (598) (6,713)Cash and cash equivalents at 1 January 3,264 9,504Effects of exchange rate changes on cash held (69) 473Cash and cash equivalents at 31 December 2,597 3,264
The statement of cashflows is to be read in conjunction with the notes to the consolidated financial statements set out on pages 37 to 65.
PETSEC ENERGY LTD ANNUAL REPORT 201836
Notes to the consolidated financial statementsFor the year ended 31 December 2018
1. Reporting entityPetsec Energy Ltd (the “Company”) is a company domiciled in Australia. The registered office of the Company is Level 27, Governor Macquarie Tower, One Farrer Place Sydney NSW 2000. The consolidated financial statements of the Company as at and for the year ended 31 December 2018 comprise the Company and its subsidiaries (together referred to as the “consolidated entity”).
The financial report is presented in United States dollars, which is the consolidated entity’s choice of presentation currency.
The consolidated entity is a for-profit entity and is primarily involved in oil and gas exploration and production with operations in the shallow waters of the Gulf of Mexico and onshore Louisiana, USA, and in the Republic of Yemen.
2. Basis of preparation(a) Statement of complianceThe financial report is a general purpose financial report which has been prepared in accordance with Australian Accounting Standards (“AASBs”) (including Australian Interpretations) adopted by the Australian Accounting Standards Board (“AASB”) and the Corporations Act 2001. The consolidated financial report of the consolidated entity and the financial report of the Company comply with International Financial Reporting Standards (“IFRSs”) and interpretations adopted by the International Accounting Standards Board (IASB).
The Board of Directors approved the financial statements on 25 February 2019.
(b) Basis of measurement The consolidated financial statements have been prepared on the historical cost basis except for the following:
• Derivative financial instruments are measured at fair value;
The methods used to measure fair values are discussed further in note 4.
The consolidated entity is of a kind referred to in ASIC Corporations (Rounding in Financial/Directors’ Reports) Instrument 2016/191 and in accordance with that instrument, all financial information presented in U.S. dollars has been rounded to the nearest thousand unless otherwise stated.
(c) Use of estimates and judgementsThe preparation of financial statements requires management to make judgements, estimates and assumptions that affect the application of accounting policies and the reported amounts of assets, liabilities, income and expenses. Actual results may differ from these estimates.
Estimates and underlying assumptions are reviewed on an ongoing basis. Revisions to accounting estimates are recognised in the period in which the estimate is revised and in any future periods affected.
In particular, information about significant areas of estimation uncertainty and critical judgements in applying accounting policies that have the most significant effect on the amount recognised in the financial statements are described in note 3(d) – Exploration, evaluation properties and oil and gas properties, note 3(l) Rehabilitation provision and note 3(q) – Income tax.
The estimated recoverable amount of oil and gas assets is based on discounted cash flow projections which are based on estimates and assumptions that are subject to change. Key assumptions include the ultimate prices realised on the sale of oil and gas and the reserves ultimately recovered. A sustained deterioration in prices or reduction in reserves may result in future asset impairments.
(d) Going concern basis of preparationThe financial statements of the consolidated entity have been prepared on the basis of a going concern. The going concern basis of preparation assumes that an entity will realise its assets and discharge its liabilities in the normal course of business.
The directors have approved cash flow projections which support the going concern basis of preparation. The preparation of these projections incorporate a number of assumptions and judgements and include estimates of production from the Company’s U.S. oil and gas fields and reduction in general and administrative expenditure across the group. The cash flow projections assume no restart of production from the An Nagyah Oilfield in Yemen nor the drilling of any further wells on the Hummer Gas/Oil Field in the USA in the forecast period.
The Directors have concluded that the range of possible outcomes considered in preparing the cashflow projections do not give rise to a material uncertainty casting significant doubt on the consolidated entity’s ability to continue as a going concern.
37NOTES TO THE CONSOLIDATED FINANCIAL STATEMENTS
Notes to the consolidated financial statements continuedFor the year ended 31 December 2018
3. Significant accounting policiesThe accounting policies set out below have been applied consistently to all periods presented in these consolidated financial statements, and have been applied consistently by the Company and consolidated entity.
(a) Basis of consolidation(i) SubsidiariesSubsidiaries are entities controlled by the Company. The Company controls an entity when it is exposed to, or has rights to, variable returns from its involvement with the entity and has the ability to affect those returns through its power over the entity. The financial statements of subsidiaries are included in the consolidated financial statements from the date that control commences until the date that control ceases. The accounting policies of subsidiaries have been changed when necessary to align them with the policies adopted by the consolidated entity.
In the Company’s financial statements, investments in subsidiaries are carried at cost, less accumulated impairments.
(ii) Joint operating arrangementsJoint operating arrangements are those legal entities over whose activities the consolidated entity has joint control, whereby the Company has rights to the assets and obligations for the liabilities relating to the arrangement. The interest of the consolidated entity in unincorporated joint operating arrangements and jointly operated assets are brought to account by recognising in its financial statements the Company’s share of the arrangements underlying assets and liabilities, and the expenses it incurs and its share of income that it earns from the sale of goods or services by the joint arrangements.
(iii) Transactions eliminated on consolidationIntra-group balances and any unrealised gains and losses or income and expenses arising from intra-group transactions, are eliminated in preparing the consolidated financial statements. Unrealised losses are eliminated in the same way as unrealised gains, but only to the extent that there is no evidence of impairment.
(iv) Loss of controlUpon the loss of control, the consolidated entity derecognises the assets and liabilities of the subsidiary, any non-controlling interests and the other components of equity related to the subsidiary. Any surplus or deficit arising on the loss of control is recognised in profit or loss. If the consolidated entity retains any interest in the previous subsidiary, then such interest is measured at fair value at the date that control is lost. Subsequently it is accounted for as an equity-accounted investee or as an available-for-sale financial asset depending on the level of influence retained.
(b) Foreign currency(i) Functional and presentation currencyItems included in the financial statements of each of the consolidated entity’s subsidiaries are measured using the currency of the primary economic environment in which the subsidiary operates (“the functional currency”). The functional currency of the Company and its Australian subsidiaries is Australian dollars (A$) and the functional currency of the Company’s overseas subsidiaries is United States dollars (US$).
The financial statements are presented in United States dollars. The consolidated entity believes the U.S. dollar is the best measure of performance for Petsec Energy Ltd because oil and gas, the consolidated entity’s dominant sources of revenue, are priced in U.S. dollars and the consolidated entity’s main operations are based in jurisdictions where most of the costs incurred are denominated in U.S. dollars.
Prior to consolidation, the results and financial position of each entity within the consolidated entity are translated from the functional currency into the consolidated entity’s presentation currency as follows:
• Assets and liabilities are translated at the closing rate at the date of that balance sheet;
• Income and expenses are translated at average exchange rates (unless this is not a reasonable approximation of the cumulative effect of the rates prevailing on the transaction dates, in which case income and expenses are translated at the dates of the transactions);
• Components of equity are translated at the historical rates; and
• All resulting exchange differences are recognised as a separate component of equity.
(ii) Foreign currency transactions and balancesForeign currency transactions are translated into the functional currency at the exchange rates prevailing at the date of the transaction. Monetary assets and liabilities denominated in foreign currencies at the balance sheet date are translated to the respective functional currency at the foreign exchange rate ruling at that date. Foreign exchange gains and losses resulting from the settlement of such transactions and from the translation at year-end exchange rates of monetary assets and liabilities denominated in foreign currencies are recognised in the statement of comprehensive income.
Non-monetary assets and liabilities that are measured in terms of historical cost in a foreign currency are translated using the exchange rate at the date of the transaction.
Foreign exchange gains and losses arising from a monetary item receivable from or payable to a foreign operation, the settlement of which is neither planned nor likely in the foreseeable future, are considered to form part of a net investment in a foreign operation and are recognised directly in equity in the foreign currency translation reserve (FCTR).
PETSEC ENERGY LTD ANNUAL REPORT 201838
(c) Derivative financial instruments and hedging activities
The consolidated entity’s revenues are exposed to changes in commodity prices. From time to time, the consolidated entity enters into derivative financial instruments to manage a portion of its oil and gas sales price risks.
The consolidated entity does not hold derivative financial instruments for speculative purposes.
Derivatives are initially measured at fair value. Subsequent to initial recognition, derivatives are measured at fair value, and changes therein are generally recognised in profit or loss.
The consolidated entity designates certain derivatives as hedging instruments to hedge the variability in cash flows associated with highly probable forecast transactions arising from changes in foreign exchange rates and interest rates and certain derivatives and non-derivative financial liabilities as hedges of foreign exchange risk on a net investment in a foreign operation.
At inception of designated hedging relationships, the consolidated entity documents the risk management objective and strategy for undertaking the hedge. The consolidated entity also documents the economic relationship between the hedged item and the hedging instrument, including whether the changes in cash flows of the hedged item and hedging instrument are expected to offset each other.
(i) Cash flow hedgeChanges in the fair value of the derivative-hedging instrument designated as a cash flow hedge are recognised directly in equity to the extent that the hedge is effective. To the extent that the hedge is ineffective, changes in fair value are recognised in the statement of profit or loss.
If the hedging instrument no longer meets the criteria for hedge accounting, expires or is sold, terminated or exercised, then hedge accounting is discontinued prospectively. The cumulative gain or loss previously recognised in equity remains there until the forecast transaction occurs. When the hedged item is a non-financial asset, the amount recognised in equity is transferred to the carrying amount of the asset when it is recognised. In other cases the amount recognised in equity is transferred to the income statement in the same period that the hedged item affects profit or loss.
(ii) Derivative financial instruments that do not qualify for hedge accounting
Certain derivative financial instruments do not qualify for hedge accounting. Changes in the fair value of any derivative financial instrument that does not qualify for hedge accounting are recognised immediately in the statement of profit and loss.
Other derivative financial instruments are recognised initially at fair value; attributable transaction costs are recognised in profit or loss as incurred. Subsequent to initial recognition, derivatives are measured at fair value and changes therein are recognised immediately in profit or loss.
(d) Exploration, evaluation properties and oil and gas properties
Exploration and evaluation expenditure is accumulated in respect of each separate area of interest. The consolidated entity’s capitalisation policy for its natural gas and crude oil exploration and development activities is to capitalise expenditure of productive exploratory wells, development drilling and productive wells, and expenditure to acquire mineral interests. Exploration expenditure, including personnel costs, certain geological and geophysical expenses including seismic costs where exploration rights have not been obtained for oil and natural gas leases, are charged to expense as incurred. Exploratory drilling expenditures are initially capitalised, but charged to expense if and when the well is determined not to have found reserves in commercial quantities.
Exploration and evaluation expenditures relating to an area of interest are capitalised where exploration rights have been obtained. This expenditure is carried forward only to the extent that they are expected to be recouped through successful development and exploitation, or sale of the area, or where exploration and evaluation activities have not yet reached a stage which permits a reasonable assessment of the existence of economically recoverable reserves, and active and significant exploration operations are continuing. This expenditure is not subject to amortisation. Once management has determined the existence of economically recoverable reserves for an area of interest, expenditure is reclassified from exploration and evaluation to oil and gas properties on the balance sheet. Oil and gas properties are amortised using a units-of-production method, as further discussed in note 3(e).
Exploration and evaluation properties and oil and gas properties are assessed for impairment when facts and circumstances suggest that the carrying amount of the asset may exceed its recoverable amount. In the event that indicators of impairment are present, an impairment loss is recorded based on the higher of an asset’s fair value less costs to sell and value in use (see note 3(g)). When an area of interest is abandoned or the directors decide that it is not commercial, any accumulated costs in respect of that area are written off in the financial period the decision is made.
39NOTES TO THE CONSOLIDATED FINANCIAL STATEMENTS
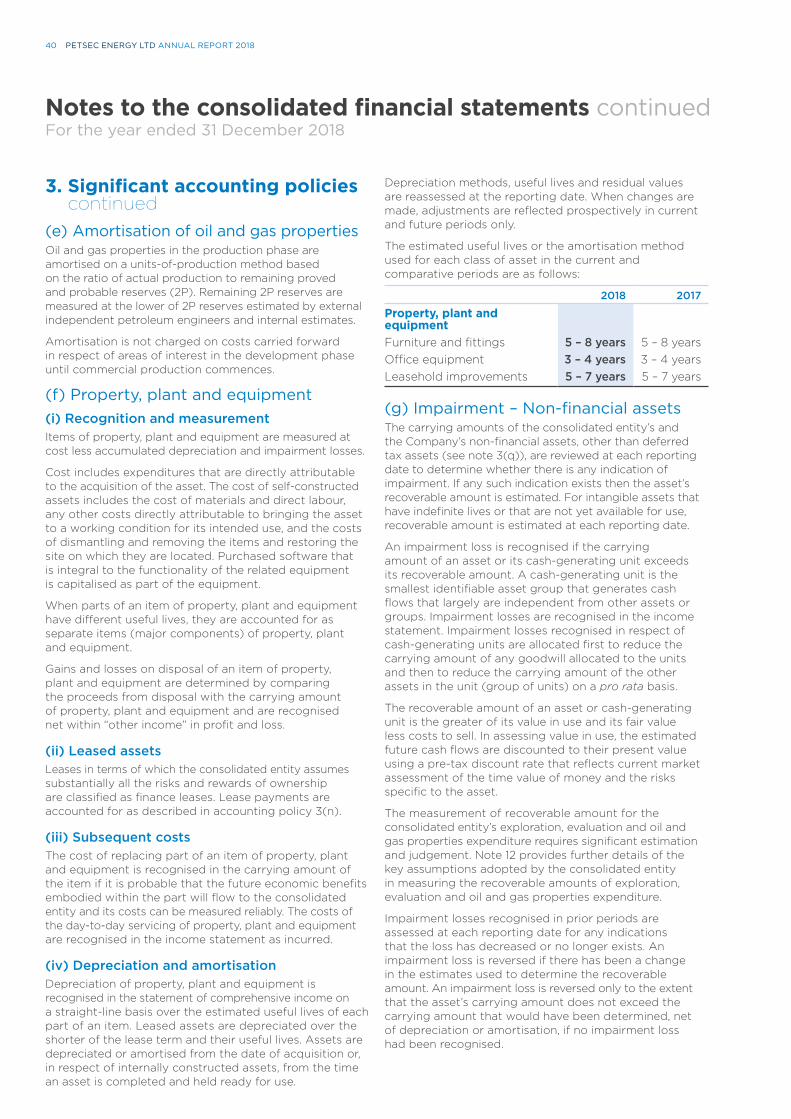
3. Significant accounting policies continued
(e) Amortisation of oil and gas propertiesOil and gas properties in the production phase are amortised on a units-of-production method based on the ratio of actual production to remaining proved and probable reserves (2P). Remaining 2P reserves are measured at the lower of 2P reserves estimated by external independent petroleum engineers and internal estimates.
Amortisation is not charged on costs carried forward in respect of areas of interest in the development phase until commercial production commences.
(f) Property, plant and equipment(i) Recognition and measurementItems of property, plant and equipment are measured at cost less accumulated depreciation and impairment losses.
Cost includes expenditures that are directly attributable to the acquisition of the asset. The cost of self-constructed assets includes the cost of materials and direct labour, any other costs directly attributable to bringing the asset to a working condition for its intended use, and the costs of dismantling and removing the items and restoring the site on which they are located. Purchased software that is integral to the functionality of the related equipment is capitalised as part of the equipment.
When parts of an item of property, plant and equipment have different useful lives, they are accounted for as separate items (major components) of property, plant and equipment.
Gains and losses on disposal of an item of property, plant and equipment are determined by comparing the proceeds from disposal with the carrying amount of property, plant and equipment and are recognised net within “other income” in profit and loss.
(ii) Leased assetsLeases in terms of which the consolidated entity assumes substantially all the risks and rewards of ownership are classified as finance leases. Lease payments are accounted for as described in accounting policy 3(n).
(iii) Subsequent costsThe cost of replacing part of an item of property, plant and equipment is recognised in the carrying amount of the item if it is probable that the future economic benefits embodied within the part will flow to the consolidated entity and its costs can be measured reliably. The costs of the day-to-day servicing of property, plant and equipment are recognised in the income statement as incurred.
(iv) Depreciation and amortisationDepreciation of property, plant and equipment is recognised in the statement of comprehensive income on a straight-line basis over the estimated useful lives of each part of an item. Leased assets are depreciated over the shorter of the lease term and their useful lives. Assets are depreciated or amortised from the date of acquisition or, in respect of internally constructed assets, from the time an asset is completed and held ready for use.
Depreciation methods, useful lives and residual values are reassessed at the reporting date. When changes are made, adjustments are reflected prospectively in current and future periods only.
The estimated useful lives or the amortisation method used for each class of asset in the current and comparative periods are as follows:
2018 2017
Property, plant and equipmentFurniture and fittings 5 – 8 years 5 – 8 yearsOffice equipment 3 – 4 years 3 – 4 yearsLeasehold improvements 5 – 7 years 5 – 7 years
(g) Impairment – Non-financial assetsThe carrying amounts of the consolidated entity’s and the Company’s non-financial assets, other than deferred tax assets (see note 3(q)), are reviewed at each reporting date to determine whether there is any indication of impairment. If any such indication exists then the asset’s recoverable amount is estimated. For intangible assets that have indefinite lives or that are not yet available for use, recoverable amount is estimated at each reporting date.
An impairment loss is recognised if the carrying amount of an asset or its cash-generating unit exceeds its recoverable amount. A cash-generating unit is the smallest identifiable asset group that generates cash flows that largely are independent from other assets or groups. Impairment losses are recognised in the income statement. Impairment losses recognised in respect of cash-generating units are allocated first to reduce the carrying amount of any goodwill allocated to the units and then to reduce the carrying amount of the other assets in the unit (group of units) on a pro rata basis.
The recoverable amount of an asset or cash-generating unit is the greater of its value in use and its fair value less costs to sell. In assessing value in use, the estimated future cash flows are discounted to their present value using a pre-tax discount rate that reflects current market assessment of the time value of money and the risks specific to the asset.
The measurement of recoverable amount for the consolidated entity’s exploration, evaluation and oil and gas properties expenditure requires significant estimation and judgement. Note 12 provides further details of the key assumptions adopted by the consolidated entity in measuring the recoverable amounts of exploration, evaluation and oil and gas properties expenditure.
Impairment losses recognised in prior periods are assessed at each reporting date for any indications that the loss has decreased or no longer exists. An impairment loss is reversed if there has been a change in the estimates used to determine the recoverable amount. An impairment loss is reversed only to the extent that the asset’s carrying amount does not exceed the carrying amount that would have been determined, net of depreciation or amortisation, if no impairment loss had been recognised.
Notes to the consolidated financial statements continuedFor the year ended 31 December 2018
PETSEC ENERGY LTD ANNUAL REPORT 201840
(h) Trade and other receivablesTrade receivables, which generally have 30–60 day terms, are recognised and carried at original invoice amount less an allowance for any uncollectible amounts.
An estimate for doubtful debts is made when collection of the full amount is no longer probable. Bad debts are written off when identified.
(i) Cash and cash equivalentsCash and cash equivalents in the balance sheet comprise cash at bank and on hand and short-term deposits with an original maturity of three months or less.
For the purposes of the Statement of Cash Flows, cash and cash equivalents consist of cash and cash equivalents as defined above, net of outstanding bank overdrafts.
(j) Interest-bearing loans and borrowingsAll loans and borrowings are initially recognised at cost, being the fair value of the consideration received net of debt issue costs associated with the borrowing.
After initial recognition, interest-bearing loans and borrowings are subsequently measured at amortised cost using the effective interest method. Amortised cost is calculated by taking into account any issue costs, and any discount or premium on settlement.
(k) Borrowing costsBorrowing costs comprise interest payable on borrowings calculated using the effective interest rate method, lease finance charges, amortisation of discounts or premiums relating to borrowings, and the unwinding of discounts on the rehabilitation provisions.
Borrowing costs relating to oil and gas properties under development are capitalised as a cost of development up to the date production commences. The actual borrowing costs are capitalised where funds are borrowed specifically for oil and gas properties under development. Borrowing costs on general funding are capitalised based on the weighted average borrowing rate.
(l) ProvisionsA provision is recognised if, as a result of a past event, the consolidated entity has a present legal or constructive obligation that can be estimated reliably, and it is probable that an outflow of economic benefits will be required to settle the obligation. Provisions are determined by discounting the expected future cash flows at a pre-tax rate that reflects current market assessments of the time value of money and the risks specific to the liability.
Where discounting is used, the increase in the provision due to the passage of time is recognised as a finance cost.
RehabilitationThe consolidated entity recognises a provision for the legal obligation associated with the retirement of long-lived assets that results from the acquisition, construction, development, and (or) the normal operation of oil and natural gas properties. The initial recognition of a liability for rehabilitation, which is discounted using a risk-free interest rate, increases the carrying amount of the related long-lived asset by the same amount as the liability. In periods subsequent to initial measurement, period-to-period changes in the liability are recognised for the passage of time (unwinding of discount) as a borrowing cost. Additionally, the capitalised asset retirement cost is subsequently allocated to expense on a units-of-production basis over its estimated useful life.
Changes in the estimate of the liability arising from revised timing or estimated cost-to-complete the rehabilitation are recognised with a corresponding adjustment to the relevant long-lived asset.
The rehabilitation provision requires significant estimation and judgement. These estimates include:
• Expected method of remediation;
• Forecast costs-to-complete the future remediation; and
• Anticipated timing of the remediation work.
The consolidated entity monitors the estimates and judgements involved in measuring this provision.
(m) Employee benefits and director benefits
(i) Short-term employee benefits Liabilities for employee benefits for wages, salaries, annual leave, sick leave and bonuses represent present obligations resulting from employees’ services provided to reporting date which are expected to be wholly settled by the Company within the next financial year. Such liabilities are calculated at undiscounted amounts based on remuneration wage and salary rates that the consolidated entity expects to pay as at reporting date including related on-costs, such as workers’ compensation insurance and payroll tax.
(ii) Long-term employee benefitsThe provision for employee benefits for long service leave represents the present value of the estimated future cash outflows to be made resulting from employees’ services provided to reporting date.
The provision is calculated using expected future increases in wage and salary rates including related on-costs and expected settlement dates based on turnover history and is discounted using the rates attaching to national government bonds at reporting date which most closely match the terms of maturity of the related liabilities.
(iii) Defined contribution pension plansThe Company and other controlled entities contribute to several defined contribution pension plans. Obligations for contributions to defined contribution pension plans are recognised as an expense in the statement of comprehensive income when they are due.
41NOTES TO THE CONSOLIDATED FINANCIAL STATEMENTS

3. Significant accounting policies continued
(m) Employee benefits and director benefits continued
(iv) Share-based compensation transactionsShare-based compensation benefits are provided to employees of the consolidated entity, including directors, via the Company’s Employee Option Plan and Employee Share Plan.
The grant date fair value of options granted to employees is recognised as an employee expense, with a corresponding increase in equity, over the period in which the employees become unconditionally entitled to the options.
(n) LeasesLeases in terms of which the consolidated entity assumes substantially all the risks and rewards of ownership are classified as finance leases. Upon initial recognition the leased asset is measured at an amount equal to the lower of its fair value and the present value of the minimum lease payments. Subsequent to initial recognition, the asset is accounted for in accordance with the accounting policy applicable to that asset.
Lease payments are apportioned between the finance charges and reduction of the lease liability so as to achieve a constant rate of interest on the remaining balance of the liability. Finance charges are charged directly against income.
Leases where the lessor retains substantially all the risks and benefits of ownership of the asset are classified as operating leases. Operating lease payments are recognised as an expense in the statement of profit and loss on a straight-line basis over the lease term. Lease incentives received are recognised as an integral part of the total lease expense, over the term of the lease.
(o) Revenue and other income recognition
Revenue is recognised when (or as) the consolidated entity transfers control of goods or services to a customer at a point in time and at the amount to which the entity expects to be entitled. The following specific recognition criteria must also be met before revenue is recognised:
Sale of oil and gasRevenues from the sale of oil and gas is recognised when the product is in the form in which it is to be delivered and an actual physical quantity has been provided or allocated to a purchaser pursuant to a contract. Revenue from oil and gas sales is measured at the fair value of the consideration receivable.
Revenue from oil and gas royalties is recognised on an accrual basis in accordance with the terms of underlying royalty agreements. Revenue from oil and gas royalties is measured at the fair value of the consideration receivable.
Sale of non-current assetsGains or losses on sale of non-current assets are recognised as other income at the date control of the asset passes to the buyer, usually when an unconditional contract of sale is signed.
(p) Finance income and finance expenseThe consolidated entity’s finance income and finance expenses include:
• Interest income.
• Interest expense.
• The remeasurement to fair value of financial liabilities.
• Facility fees in relation to financial liabilities.
Interest income or expense is recognised using the effective interest method, which is the rate that discounts estimated future cash payments or receipts through the expected life of the financial instrument to the amortised cost of the financial liability.
(q) Earnings per shareThe consolidated entity presents basic and diluted earnings per share (EPS) data for its ordinary shares. Basic EPS is calculated by dividing the profit or loss attributable to ordinary shareholders of the Company by the weighted average number of ordinary shares outstanding during the period. Diluted EPS is determined by adjusting the profit or loss attributable to ordinary shareholders and the weighted average number of ordinary shares outstanding for the effects of all dilutive potential ordinary shares, which comprise share options granted to employees.
(r) Income taxIncome tax expense comprises current and deferred tax. Income tax expense is recognised in the statement of comprehensive income except to the extent that it relates to items recognised directly in equity, in which case it is recognised in equity.
Current tax is the expected tax payable on the taxable income for the year, using tax rates enacted or substantively enacted at the reporting date, and any adjustment to tax payable in respect of previous years.
Deferred tax is recognised using the balance sheet method, providing for temporary differences between the carrying amounts of assets and liabilities for financial reporting purposes and the amounts used for taxation purposes. Deferred tax is not recognised for the following temporary differences: the initial recognition of assets or liabilities that affect neither accounting nor taxable profit nor differences relating to investments in subsidiaries to the extent that they will probably not reverse in the foreseeable future. Deferred tax is measured at the tax rates that are expected to be applied to the temporary differences when they reverse, based on the laws that have been enacted or substantively enacted by the reporting date.
Notes to the consolidated financial statements continuedFor the year ended 31 December 2018
PETSEC ENERGY LTD ANNUAL REPORT 201842
A deferred tax asset is recognised to the extent that it is probable that future taxable profits will be available against which the temporary difference or tax losses can be utilised. Deferred tax assets are reviewed at each reporting date and are reduced to the extent that it is no longer probable that the related tax benefit will be realised.
(s) Segment reportingAn operating segment is a distinguishable component of the consolidated entity whose information is reviewed regularly by the CEO, the consolidated entity’s chief decision making officer, and that is engaged in providing related products or services which are subject to risk and rewards that are different to other segments.
(t) Changes in accounting policiesExcept as described below, the accounting policies applied in these financial statements are the same as those applied in the consolidated entity’s financial statements as at and for the year ended 31 December 2017.
(i) AASB 9 Financial Instruments AASB 9 sets out requirements for recognising and measuring financial assets, financial liabilities and some contracts to buy or sell non-financial items. This standard replaces AASB 139 Financial Instruments: Recognition and Measurement.
The consolidated entity has initially adopted AASB 9 from 1 January 2018 and assessed that there is no material effect on the consolidated entity’s financial statements.
(ii) AASB 15 Revenue from Contracts with Customers
Under AASB 15 Revenue from Contracts with Customers, revenue is recognised when a customer obtains control of the goods or services. Determining the timing of the transfer of control – at a point in time or over time – requires judgement.
The consolidated entity has initially adopted AASB 15 from 1 January 2018 and assessed that there is no material effect on the consolidated entity’s financial statements.
(u) New standards and interpretations not yet adopted
A number of new standards, amendments to standards and interpretations are effective for annual periods beginning after 1 January 2019, and have not been applied in preparing these consolidated financial statements. Those which may be relevant to the consolidated entity are set out below. The consolidated entity does not plan to adopt these standards early.
(i) AASB 16 LeasesAASB 16 introduces a single, on-balance sheet lease accounting model for lessees. A lessee recognises a right-of-use asset representing its right to use the underlying asset and a lease liability representing its obligation to make lease payments. There are recognition exemptions leases and leases of low-value items.
The consolidated entity is required to adopt AASB 16 Leases from 1 January 2019. The consolidated has assessed the estimated impact that initial application of AASB 16 will have on its consolidated financial statements. The consolidated entity estimates the right-of-use asset and liability as of 1 January 2019 is approximately US$466,000. The actual impacts of adopting the standard on 1 January 2019 may change because the new accounting policies are subject to change until the consolidated entity presents its first financial statements that include the date of initial application.
4. Determination of fair valuesA number of the consolidated entity’s accounting policies and disclosures require the determination of fair value, for both financial and non-financial assets and liabilities. Fair values have been determined for measurement and/or disclosure purposes based on the following methods. The Company has applied fair value methodologies that approximate the price that would be received to sell an asset or paid to transfer a liability in an orderly transaction between market participants at the measurement date.
Where applicable, further information about the assumptions made in determining fair values is disclosed in the notes specific to that asset or liability.
Derivative InstrumentsThe fair values of derivative instruments are initially recognised at fair value on the date at which the derivative contracts are entered into and subsequently remeasured to fair value. On subsequent revaluation the derivatives are carried as assets when their fair value is positive and liabilities when their fair value is negative.
When the fair values of financial assets and financial liabilities recorded in the statement of financial position cannot be measured based on quoted prices in active markets, their fair value is measured using valuation techniques including discounted cash flow models. The inputs to these models are taken from observable markets where possible, but where this is not feasible, a degree of judgement is required in establishing fair values. Judgements include considerations of inputs such as liquidity risk, credit risk and volatility. Changes in assumptions relating to these factors could affect the reported fair value of financial instruments.
Equity securitiesThe fair value of equity securities (level 3 category instruments) is determined using an option pricing model – the Black-Scholes-Merton formula – in arriving at an expected present value for options granted by the consolidated entity at period end. Measurement inputs include observable inputs, such as the share price on the measurement date, the exercise price of the instrument, share price target and the risk-free interest rate (based on government bonds), as well as unobservable inputs, such as expected volatility, expected term of the instruments, and expected dividends which represent management’s best estimates at period end.
43NOTES TO THE CONSOLIDATED FINANCIAL STATEMENTS
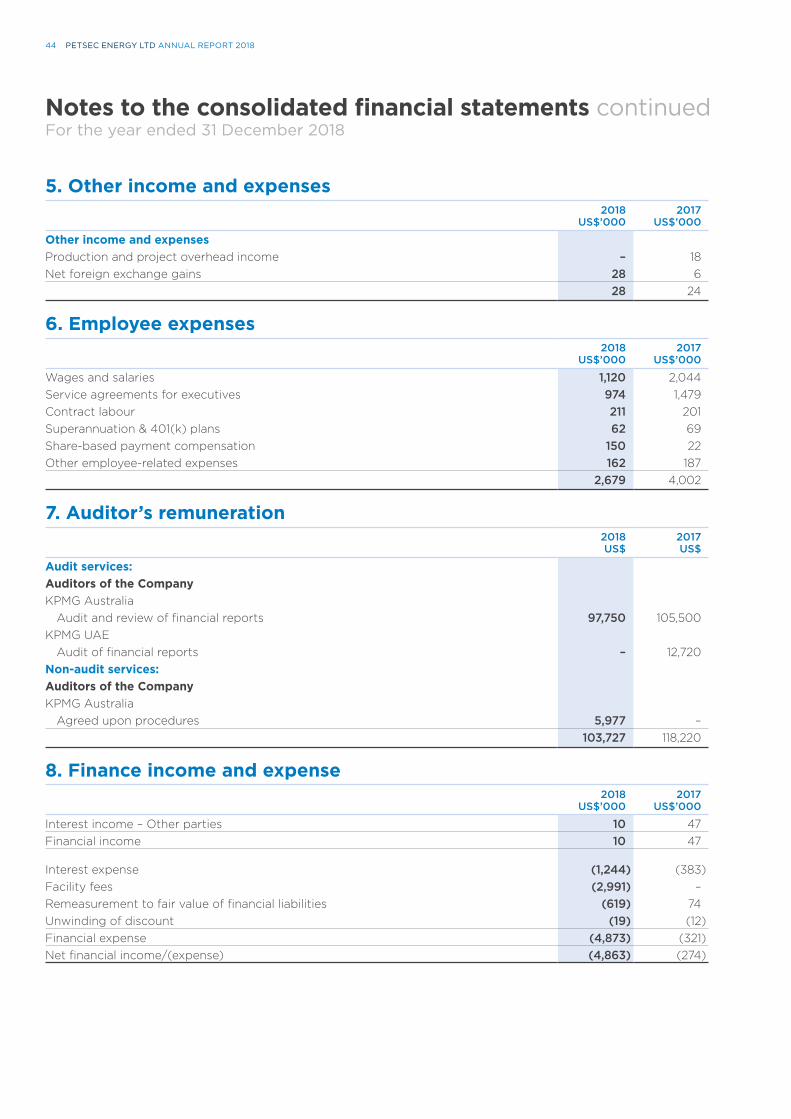
5. Other income and expenses 2018
US$’0002017
US$’000
Other income and expensesProduction and project overhead income – 18Net foreign exchange gains 28 6
28 24
6. Employee expenses2018
US$’0002017
US$’000
Wages and salaries 1,120 2,044Service agreements for executives 974 1,479Contract labour 211 201Superannuation & 401(k) plans 62 69Share-based payment compensation 150 22Other employee-related expenses 162 187
2,679 4,002
7. Auditor’s remuneration2018US$
2017US$
Audit services:Auditors of the CompanyKPMG Australia Audit and review of financial reports 97,750 105,500KPMG UAE Audit of financial reports – 12,720Non-audit services:Auditors of the CompanyKPMG Australia Agreed upon procedures 5,977 –
103,727 118,220
8. Finance income and expense2018
US$’0002017
US$’000
Interest income – Other parties 10 47Financial income 10 47
Interest expense (1,244) (383)Facility fees (2,991) –Remeasurement to fair value of financial liabilities (619) 74Unwinding of discount (19) (12)Financial expense (4,873) (321)Net financial income/(expense) (4,863) (274)
Notes to the consolidated financial statements continuedFor the year ended 31 December 2018
PETSEC ENERGY LTD ANNUAL REPORT 201844
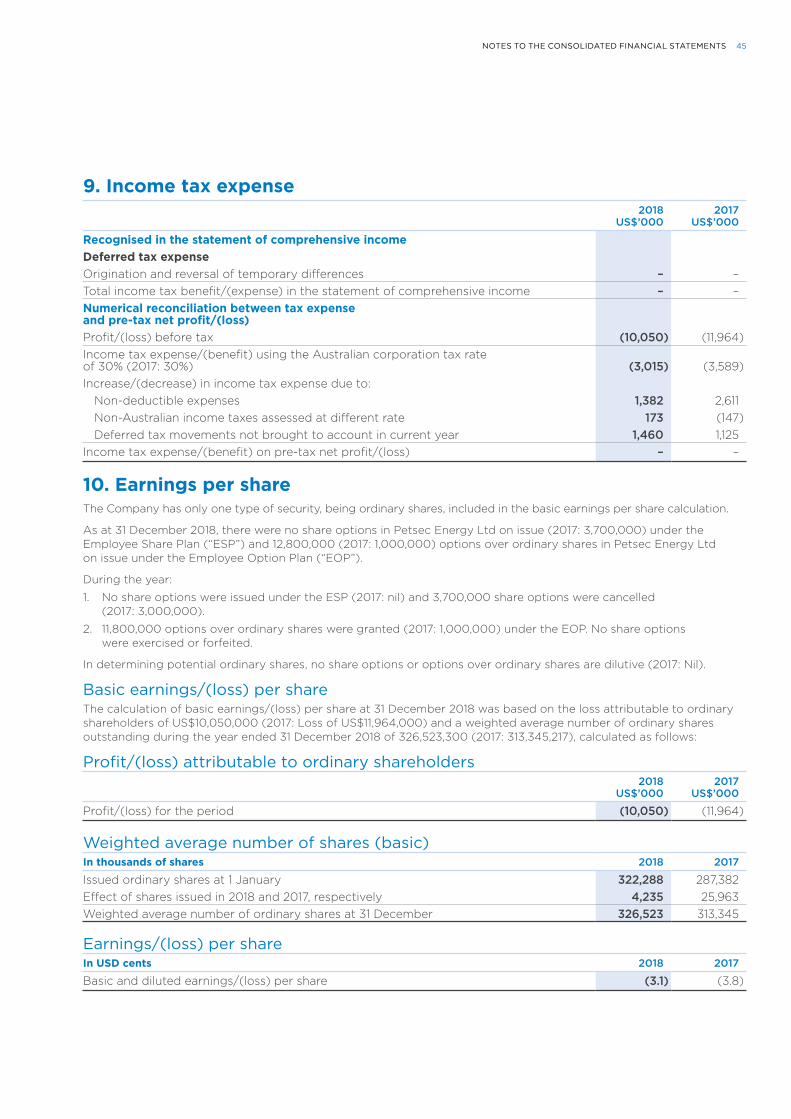
9. Income tax expense2018
US$’0002017
US$’000
Recognised in the statement of comprehensive incomeDeferred tax expenseOrigination and reversal of temporary differences – –Total income tax benefit/(expense) in the statement of comprehensive income – –Numerical reconciliation between tax expense and pre-tax net profit/(loss)Profit/(loss) before tax (10,050) (11,964)Income tax expense/(benefit) using the Australian corporation tax rate of 30% (2017: 30%) (3,015) (3,589)Increase/(decrease) in income tax expense due to: Non-deductible expenses 1,382 2,611 Non-Australian income taxes assessed at different rate 173 (147) Deferred tax movements not brought to account in current year 1,460 1,125Income tax expense/(benefit) on pre-tax net profit/(loss) – –
10. Earnings per shareThe Company has only one type of security, being ordinary shares, included in the basic earnings per share calculation.
As at 31 December 2018, there were no share options in Petsec Energy Ltd on issue (2017: 3,700,000) under the Employee Share Plan (“ESP”) and 12,800,000 (2017: 1,000,000) options over ordinary shares in Petsec Energy Ltd on issue under the Employee Option Plan (“EOP”).
During the year:
1. No share options were issued under the ESP (2017: nil) and 3,700,000 share options were cancelled (2017: 3,000,000).
2. 11,800,000 options over ordinary shares were granted (2017: 1,000,000) under the EOP. No share options were exercised or forfeited.
In determining potential ordinary shares, no share options or options over ordinary shares are dilutive (2017: Nil).
Basic earnings/(loss) per shareThe calculation of basic earnings/(loss) per share at 31 December 2018 was based on the loss attributable to ordinary shareholders of US$10,050,000 (2017: Loss of US$11,964,000) and a weighted average number of ordinary shares outstanding during the year ended 31 December 2018 of 326,523,300 (2017: 313,345,217), calculated as follows:
Profit/(loss) attributable to ordinary shareholders2018
US$’0002017
US$’000
Profit/(loss) for the period (10,050) (11,964)
Weighted average number of shares (basic)In thousands of shares 2018 2017
Issued ordinary shares at 1 January 322,288 287,382Effect of shares issued in 2018 and 2017, respectively 4,235 25,963Weighted average number of ordinary shares at 31 December 326,523 313,345
Earnings/(loss) per shareIn USD cents 2018 2017
Basic and diluted earnings/(loss) per share (3.1) (3.8)
45NOTES TO THE CONSOLIDATED FINANCIAL STATEMENTS
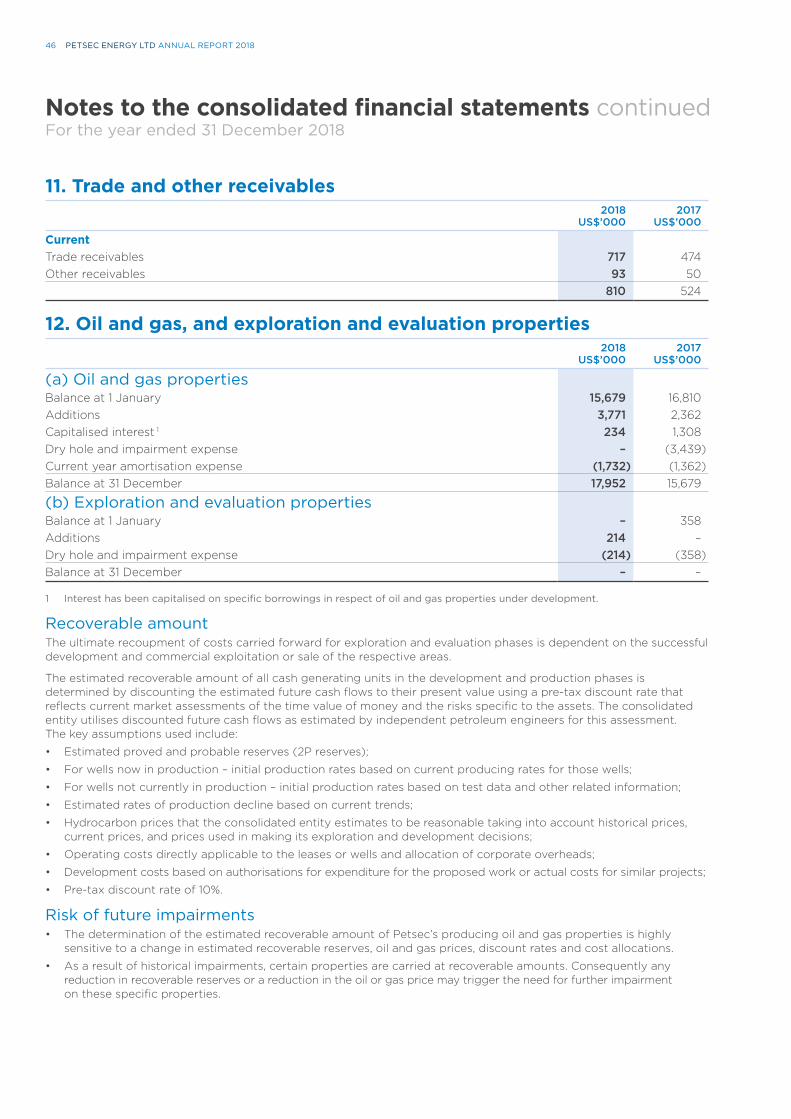
11. Trade and other receivables2018
US$’0002017
US$’000
CurrentTrade receivables 717 474Other receivables 93 50
810 524
12. Oil and gas, and exploration and evaluation properties2018
US$’0002017
US$’000
(a) Oil and gas properties Balance at 1 January 15,679 16,810Additions 3,771 2,362Capitalised interest 1 234 1,308Dry hole and impairment expense – (3,439)Current year amortisation expense (1,732) (1,362)Balance at 31 December 17,952 15,679
(b) Exploration and evaluation propertiesBalance at 1 January – 358Additions 214 –Dry hole and impairment expense (214) (358)Balance at 31 December – –
1 Interest has been capitalised on specific borrowings in respect of oil and gas properties under development.
Recoverable amountThe ultimate recoupment of costs carried forward for exploration and evaluation phases is dependent on the successful development and commercial exploitation or sale of the respective areas.
The estimated recoverable amount of all cash generating units in the development and production phases is determined by discounting the estimated future cash flows to their present value using a pre-tax discount rate that reflects current market assessments of the time value of money and the risks specific to the assets. The consolidated entity utilises discounted future cash flows as estimated by independent petroleum engineers for this assessment. The key assumptions used include:
• Estimated proved and probable reserves (2P reserves);
• For wells now in production – initial production rates based on current producing rates for those wells;
• For wells not currently in production – initial production rates based on test data and other related information;
• Estimated rates of production decline based on current trends;
• Hydrocarbon prices that the consolidated entity estimates to be reasonable taking into account historical prices, current prices, and prices used in making its exploration and development decisions;
• Operating costs directly applicable to the leases or wells and allocation of corporate overheads;
• Development costs based on authorisations for expenditure for the proposed work or actual costs for similar projects;
• Pre-tax discount rate of 10%.
Risk of future impairments• The determination of the estimated recoverable amount of Petsec’s producing oil and gas properties is highly
sensitive to a change in estimated recoverable reserves, oil and gas prices, discount rates and cost allocations.
• As a result of historical impairments, certain properties are carried at recoverable amounts. Consequently any reduction in recoverable reserves or a reduction in the oil or gas price may trigger the need for further impairment on these specific properties.
Notes to the consolidated financial statements continuedFor the year ended 31 December 2018
PETSEC ENERGY LTD ANNUAL REPORT 201846
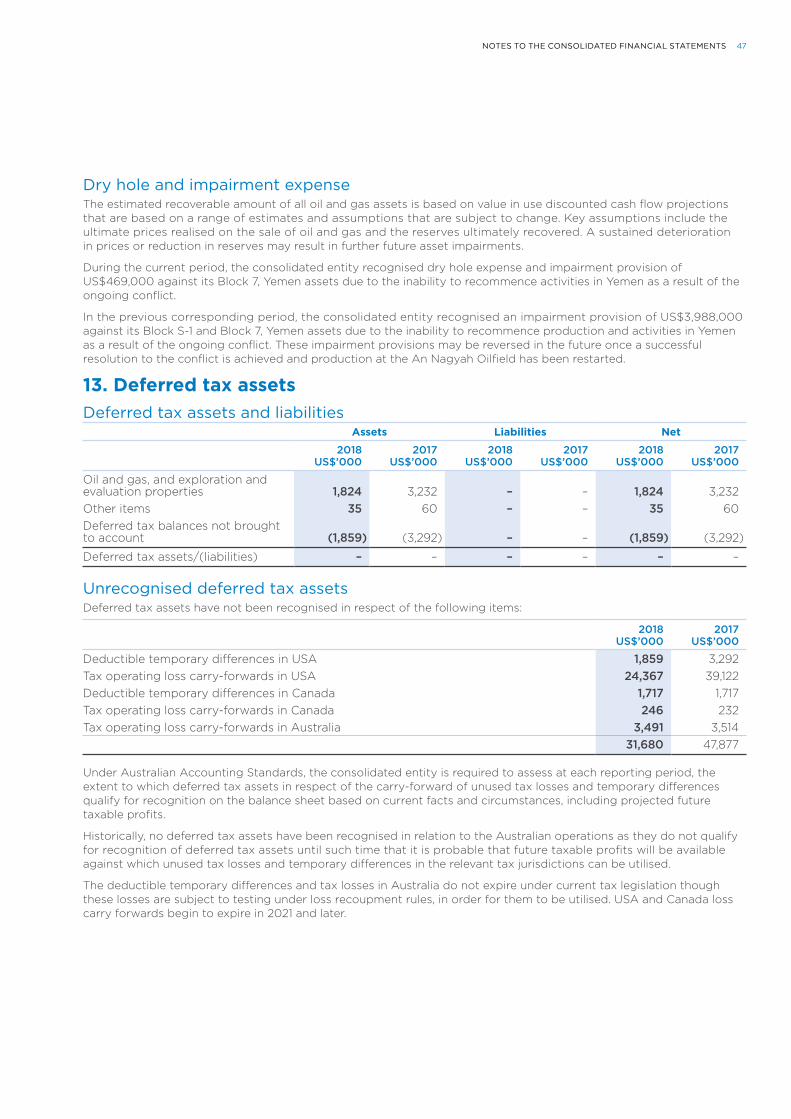
Dry hole and impairment expense The estimated recoverable amount of all oil and gas assets is based on value in use discounted cash flow projections that are based on a range of estimates and assumptions that are subject to change. Key assumptions include the ultimate prices realised on the sale of oil and gas and the reserves ultimately recovered. A sustained deterioration in prices or reduction in reserves may result in further future asset impairments.
During the current period, the consolidated entity recognised dry hole expense and impairment provision of US$469,000 against its Block 7, Yemen assets due to the inability to recommence activities in Yemen as a result of the ongoing conflict.
In the previous corresponding period, the consolidated entity recognised an impairment provision of US$3,988,000 against its Block S-1 and Block 7, Yemen assets due to the inability to recommence production and activities in Yemen as a result of the ongoing conflict. These impairment provisions may be reversed in the future once a successful resolution to the conflict is achieved and production at the An Nagyah Oilfield has been restarted.
13. Deferred tax assetsDeferred tax assets and liabilities
Assets Liabilities Net
2018US$’000
2017US$’000
2018US$’000
2017US$’000
2018US$’000
2017US$’000
Oil and gas, and exploration and evaluation properties 1,824 3,232 – – 1,824 3,232Other items 35 60 – – 35 60Deferred tax balances not brought to account (1,859) (3,292) – – (1,859) (3,292)
Deferred tax assets/(liabilities) – – – – – –
Unrecognised deferred tax assetsDeferred tax assets have not been recognised in respect of the following items:
2018US$’000
2017US$’000
Deductible temporary differences in USA 1,859 3,292Tax operating loss carry-forwards in USA 24,367 39,122Deductible temporary differences in Canada 1,717 1,717Tax operating loss carry-forwards in Canada 246 232Tax operating loss carry-forwards in Australia 3,491 3,514
31,680 47,877
Under Australian Accounting Standards, the consolidated entity is required to assess at each reporting period, the extent to which deferred tax assets in respect of the carry-forward of unused tax losses and temporary differences qualify for recognition on the balance sheet based on current facts and circumstances, including projected future taxable profits.
Historically, no deferred tax assets have been recognised in relation to the Australian operations as they do not qualify for recognition of deferred tax assets until such time that it is probable that future taxable profits will be available against which unused tax losses and temporary differences in the relevant tax jurisdictions can be utilised.
The deductible temporary differences and tax losses in Australia do not expire under current tax legislation though these losses are subject to testing under loss recoupment rules, in order for them to be utilised. USA and Canada loss carry forwards begin to expire in 2021 and later.
47NOTES TO THE CONSOLIDATED FINANCIAL STATEMENTS
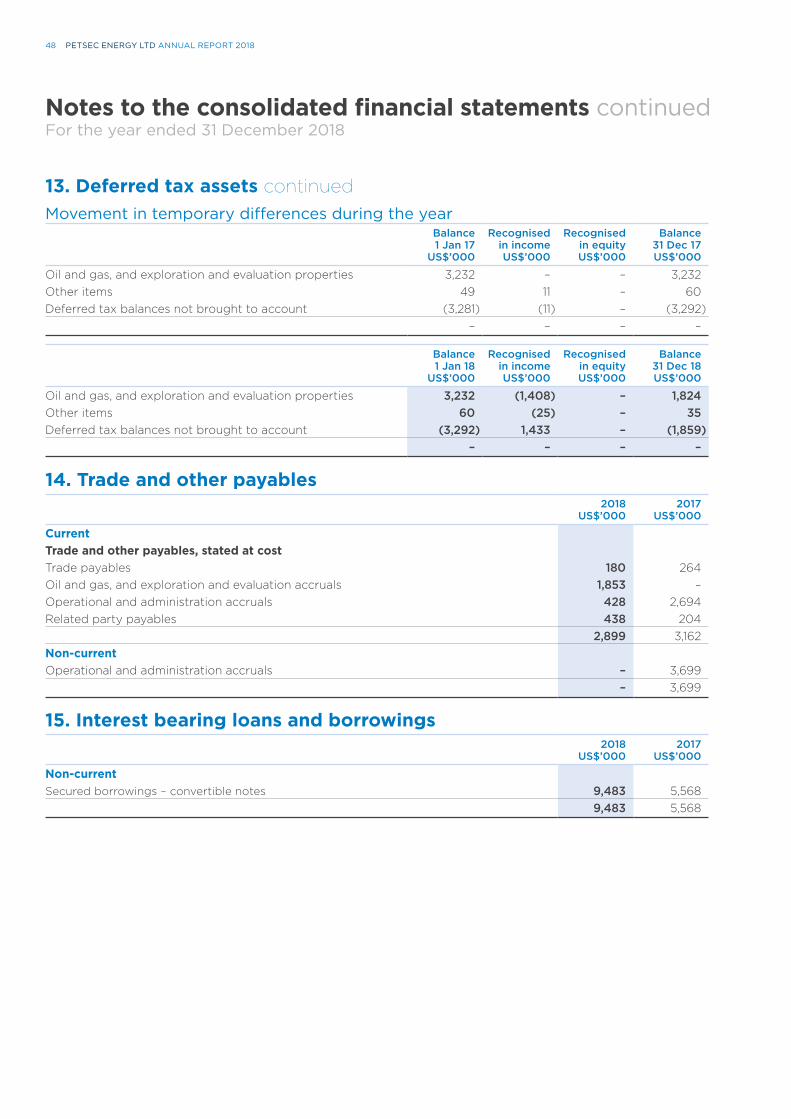
13. Deferred tax assets continuedMovement in temporary differences during the year
Balance1 Jan 17
US$’000
Recognisedin incomeUS$’000
Recognisedin equityUS$’000
Balance31 Dec 17US$’000
Oil and gas, and exploration and evaluation properties 3,232 – – 3,232Other items 49 11 – 60Deferred tax balances not brought to account (3,281) (11) – (3,292)
– – – –
Balance1 Jan 18
US$’000
Recognisedin incomeUS$’000
Recognisedin equityUS$’000
Balance31 Dec 18US$’000
Oil and gas, and exploration and evaluation properties 3,232 (1,408) – 1,824Other items 60 (25) – 35Deferred tax balances not brought to account (3,292) 1,433 – (1,859)
– – – –
14. Trade and other payables2018
US$’0002017
US$’000
CurrentTrade and other payables, stated at cost Trade payables 180 264Oil and gas, and exploration and evaluation accruals 1,853 –Operational and administration accruals 428 2,694Related party payables 438 204
2,899 3,162Non-currentOperational and administration accruals – 3,699
– 3,699
15. Interest bearing loans and borrowings2018
US$’0002017
US$’000
Non-currentSecured borrowings – convertible notes 9,483 5,568
9,483 5,568
Notes to the consolidated financial statements continuedFor the year ended 31 December 2018
PETSEC ENERGY LTD ANNUAL REPORT 201848
Secured borrowings – convertible notesSecured borrowings represent the outstanding balance at 31 December 2018 under a convertible note facility with Republic Investment Management and associates in Singapore, managed through the registrar Sing Rim Pte Ltd of Singapore. The consolidated entity entered into a US$15 million facility in August 2016.
The key terms and conditions of the convertible note facility have been varied subsequent to the initial terms agreed in the secured convertible notes Deed Poll dated 23 August 2016. The terms have been amended by a Deed of Variation dated 14 September 2016, Letter of Variation dated 28 December 2016, Letter of Variation dated 30 March 2017, Letter of Variation dated 17 August 2017, Letter of Variation dated 18 February 2018, Letter of Variation dated 26 March 2018, Letter of Variation dated 9 May 2018, Letter of Variation dated 20 August 2018, Letter of Variation dated 6 September 2018, and Letter of Variation dated 19 December 2018. The specific details of each of these variations are outlined within the announcements lodged with the ASX.
The key terms and conditions of the convertible note facility (Tranches 1, 2 & 3) as varied on 19 December 2018 are as follows:
(a) Facility amount – US$15 million.
(b) Facility drawdown – available in three tranches of US$5 million each.
• Tranche 1 fully drawn as at 31 December 2018 (US$5 million);
• Tranche 2 fully available as at 31 December 2018 (US$5 million). Drawdown required by 23 January 2020.
• Tranche 3 drawn down to US$4.5 million as at 31 December 2018. Drawdown required by 23 April 2019.
(c) Facility term – redemption date of 23 January 2021.
(d) Interest – interest accrues daily at 12.5% per annum for the period of 1 January 2018 through to the 23 January 2019, and thereafter increasing to 15% compounding monthly.
(e) Security – the convertible notes constitute unsubordinated and secured obligations of the Company. The Company and the registrar entered into a general security deed on 23 August 2016 under which the Company granted the registrar a general security interest over all of the Company’s assets as security for the Company’s obligations under the convertible notes. In addition, the Company granted the registrar mortgages over certain assets of its U.S. subsidiaries.
(f) Conversion to Petsec Energy Ltd shares – the noteholder will be entitled to convert up to 50% of the outstanding amount of the convertible notes into shares, by delivering a conversion notice at any time prior to the maturity date. The maximum number of shares issued on conversion is restricted to 140 million shares.
(g) Conversion price – 12.5 cents per share or reducing to the net issue price of stock in the period to redemption should that price be less than 12.5 cents per share.
The funds from Tranche 1 of the facility were applied to fund the development of the initial Hummer B-1 gas/oil discovery well offshore Louisiana, USA, including the construction and installation of a 4 pile jacket, completion and testing of the initial well to determine production rates and gas and oil volumes, and construction of the production facilities on the Main Pass Block 270 Field. The well was brought into production on 21 November 2017.
The funds from Tranche 2 of the Facility provides access to additional funding for any of the Company’s operations, but primarily the development of the Main Pass 270 gas/oil Field.
The funds from Tranche 3 of the Facility have been applied to fund the Company’s share of drilling costs associated with the Hummer B-2 appraisal/development well.
On 25 January 2019, a further US$1.5 million was drawn under Tranche 3 (US$0.5 million) and Tranche 2 (US$1 million).
In accordance with the terms of the Letter of Variation dated 19 December 2018, the Company issued 35 million shares at A$0.10/share on 24 January 2019, being the facility fee shares, to the Registrar of the secured convertible note facility.
49NOTES TO THE CONSOLIDATED FINANCIAL STATEMENTS
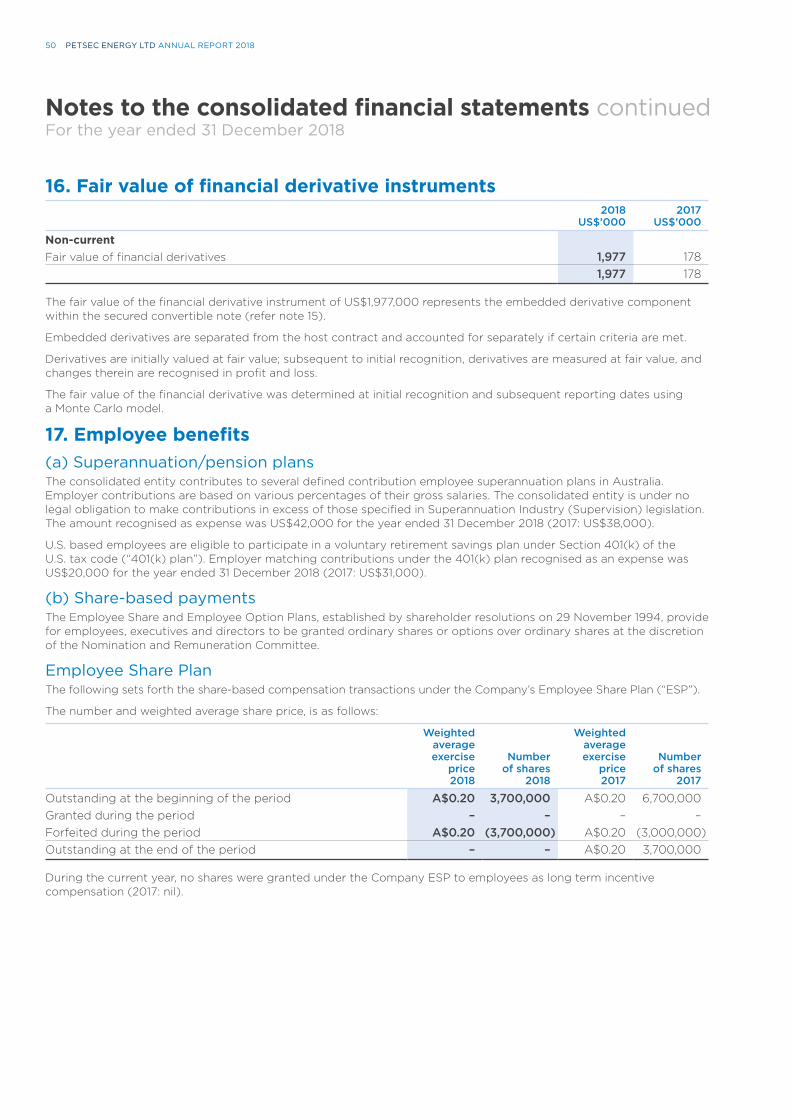
16. Fair value of financial derivative instruments 2018
US$’0002017
US$’000
Non-currentFair value of financial derivatives 1,977 178
1,977 178
The fair value of the financial derivative instrument of US$1,977,000 represents the embedded derivative component within the secured convertible note (refer note 15).
Embedded derivatives are separated from the host contract and accounted for separately if certain criteria are met.
Derivatives are initially valued at fair value; subsequent to initial recognition, derivatives are measured at fair value, and changes therein are recognised in profit and loss.
The fair value of the financial derivative was determined at initial recognition and subsequent reporting dates using a Monte Carlo model.
17. Employee benefits(a) Superannuation/pension plansThe consolidated entity contributes to several defined contribution employee superannuation plans in Australia. Employer contributions are based on various percentages of their gross salaries. The consolidated entity is under no legal obligation to make contributions in excess of those specified in Superannuation Industry (Supervision) legislation. The amount recognised as expense was US$42,000 for the year ended 31 December 2018 (2017: US$38,000).
U.S. based employees are eligible to participate in a voluntary retirement savings plan under Section 401(k) of the U.S. tax code (“401(k) plan”). Employer matching contributions under the 401(k) plan recognised as an expense was US$20,000 for the year ended 31 December 2018 (2017: US$31,000).
(b) Share-based paymentsThe Employee Share and Employee Option Plans, established by shareholder resolutions on 29 November 1994, provide for employees, executives and directors to be granted ordinary shares or options over ordinary shares at the discretion of the Nomination and Remuneration Committee.
Employee Share Plan The following sets forth the share-based compensation transactions under the Company’s Employee Share Plan (“ESP”).
The number and weighted average share price, is as follows:
Weightedaverageexercise
price2018
Numberof shares
2018
Weightedaverageexercise
price2017
Numberof shares
2017
Outstanding at the beginning of the period A$0.20 3,700,000 A$0.20 6,700,000Granted during the period – – – –Forfeited during the period A$0.20 (3,700,000) A$0.20 (3,000,000)Outstanding at the end of the period – – A$0.20 3,700,000
During the current year, no shares were granted under the Company ESP to employees as long term incentive compensation (2017: nil).
Notes to the consolidated financial statements continuedFor the year ended 31 December 2018
PETSEC ENERGY LTD ANNUAL REPORT 201850
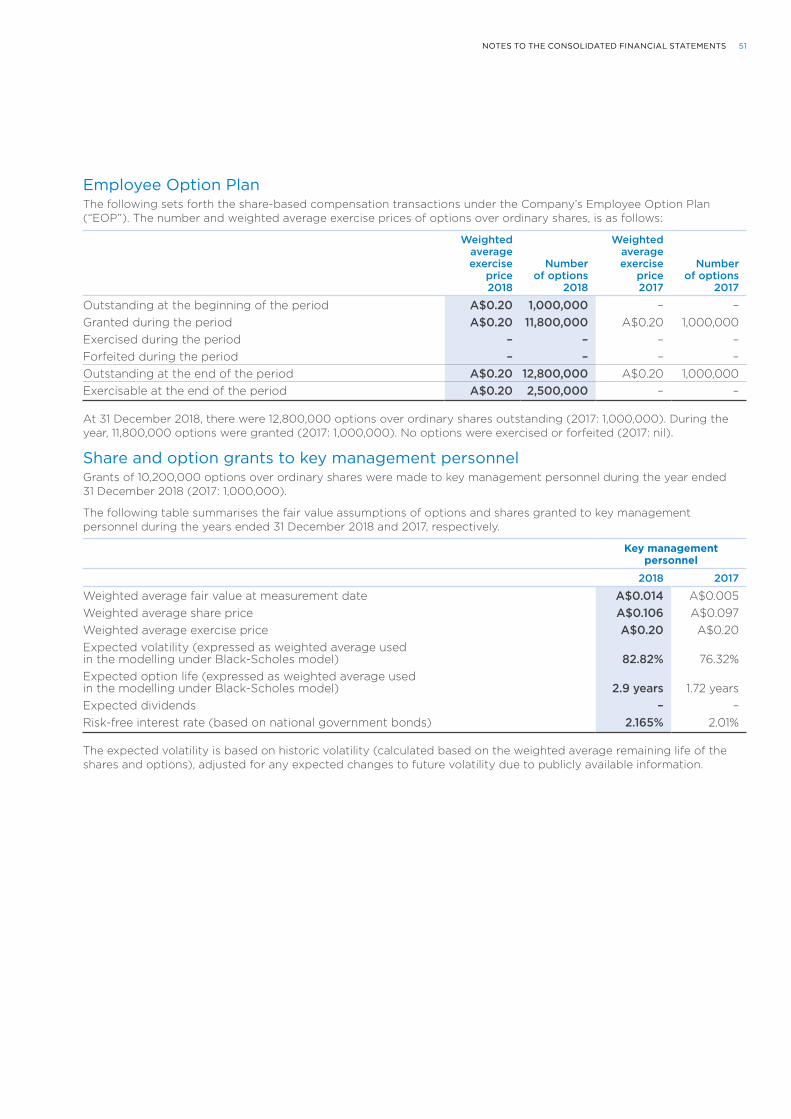
Employee Option Plan The following sets forth the share-based compensation transactions under the Company’s Employee Option Plan (“EOP”). The number and weighted average exercise prices of options over ordinary shares, is as follows:
Weightedaverageexercise
price2018
Numberof options
2018
Weightedaverageexercise
price2017
Numberof options
2017
Outstanding at the beginning of the period A$0.20 1,000,000 – –Granted during the period A$0.20 11,800,000 A$0.20 1,000,000Exercised during the period – – – –Forfeited during the period – – – –Outstanding at the end of the period A$0.20 12,800,000 A$0.20 1,000,000Exercisable at the end of the period A$0.20 2,500,000 – –
At 31 December 2018, there were 12,800,000 options over ordinary shares outstanding (2017: 1,000,000). During the year, 11,800,000 options were granted (2017: 1,000,000). No options were exercised or forfeited (2017: nil).
Share and option grants to key management personnel Grants of 10,200,000 options over ordinary shares were made to key management personnel during the year ended 31 December 2018 (2017: 1,000,000).
The following table summarises the fair value assumptions of options and shares granted to key management personnel during the years ended 31 December 2018 and 2017, respectively.
Key management personnel
2018 2017
Weighted average fair value at measurement date A$0.014 A$0.005Weighted average share price A$0.106 A$0.097Weighted average exercise price A$0.20 A$0.20Expected volatility (expressed as weighted average used in the modelling under Black-Scholes model) 82.82% 76.32%Expected option life (expressed as weighted average used in the modelling under Black-Scholes model) 2.9 years 1.72 yearsExpected dividends – –Risk-free interest rate (based on national government bonds) 2.165% 2.01%
The expected volatility is based on historic volatility (calculated based on the weighted average remaining life of the shares and options), adjusted for any expected changes to future volatility due to publicly available information.
51NOTES TO THE CONSOLIDATED FINANCIAL STATEMENTS
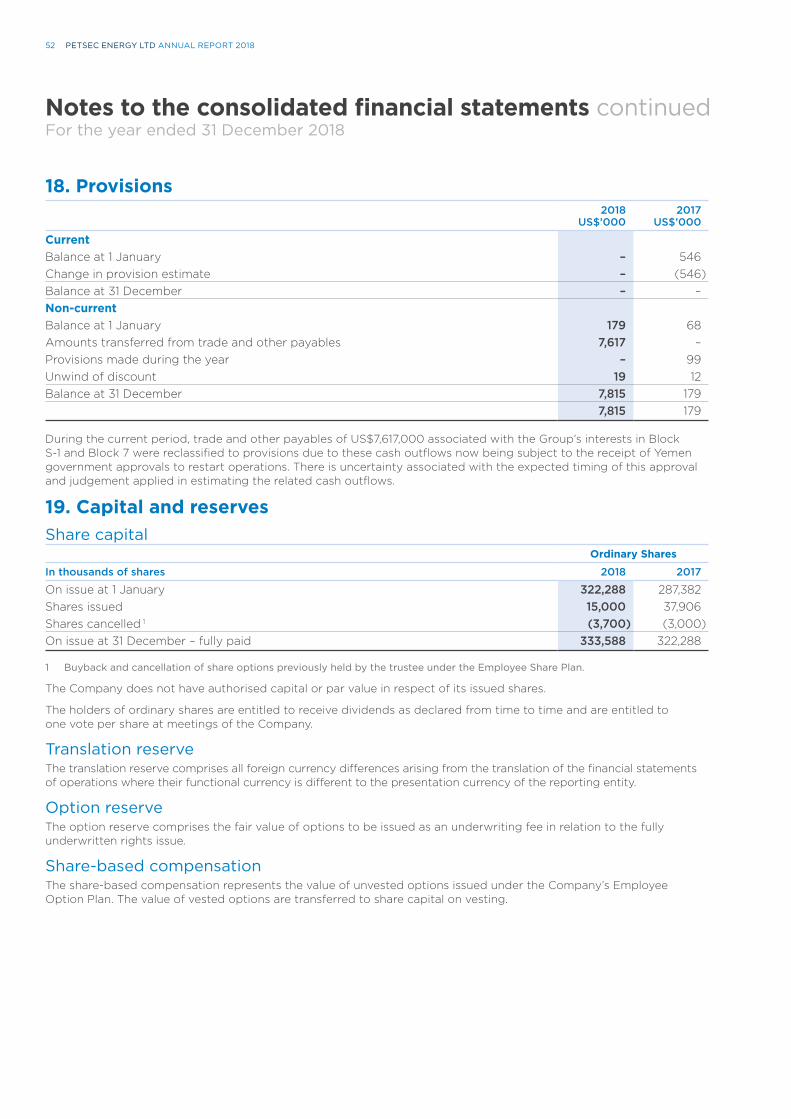
18. Provisions2018
US$’0002017
US$’000
CurrentBalance at 1 January – 546Change in provision estimate – (546)Balance at 31 December – –Non-current Balance at 1 January 179 68Amounts transferred from trade and other payables 7,617 –Provisions made during the year – 99Unwind of discount 19 12Balance at 31 December 7,815 179
7,815 179
During the current period, trade and other payables of US$7,617,000 associated with the Group’s interests in Block S-1 and Block 7 were reclassified to provisions due to these cash outflows now being subject to the receipt of Yemen government approvals to restart operations. There is uncertainty associated with the expected timing of this approval and judgement applied in estimating the related cash outflows.
19. Capital and reservesShare capital
Ordinary Shares
In thousands of shares 2018 2017
On issue at 1 January 322,288 287,382Shares issued 15,000 37,906Shares cancelled 1 (3,700) (3,000)On issue at 31 December – fully paid 333,588 322,288
1 Buyback and cancellation of share options previously held by the trustee under the Employee Share Plan.
The Company does not have authorised capital or par value in respect of its issued shares.
The holders of ordinary shares are entitled to receive dividends as declared from time to time and are entitled to one vote per share at meetings of the Company.
Translation reserveThe translation reserve comprises all foreign currency differences arising from the translation of the financial statements of operations where their functional currency is different to the presentation currency of the reporting entity.
Option reserveThe option reserve comprises the fair value of options to be issued as an underwriting fee in relation to the fully underwritten rights issue.
Share-based compensation The share-based compensation represents the value of unvested options issued under the Company’s Employee Option Plan. The value of vested options are transferred to share capital on vesting.
Notes to the consolidated financial statements continuedFor the year ended 31 December 2018
PETSEC ENERGY LTD ANNUAL REPORT 201852
20. Risk management framework and additional financial instruments disclosures
Capital management The Board’s policy is to maintain an appropriate capital base to sustain future development of the consolidated entity. This capital base may comprise equity and borrowings.
Neither the Company nor any of its subsidiaries are subject to externally imposed capital requirements.
Risk Management FrameworkThe Board of Directors has overall responsibility for the establishment and oversight of the risk management framework. There is no separate risk management committee.
Risk management policies are established to identify and analyse the risks faced by the consolidated entity, to set appropriate risk limits and controls, and to monitor risks and adherence to limits. Risk management policies and systems are reviewed regularly to reflect changes in market conditions and the consolidated entity’s activities. The consolidated entity, through their training and management standards and procedures, aim to develop a disciplined and constructive control environment in which all employees understand their roles and obligations.
The forecast financial position of the consolidated entity is continually monitored and derivative financial instruments can be used to hedge exposure to fluctuations in commodity prices (refer to Commodity Price Risk below for further details).
The Board oversees how management monitors compliance with the consolidated entity’s risk management policies and procedures and reviews the adequacy of the risk management framework in relation to the risks faced by the consolidated entity.
Additional financial instruments disclosuresOverviewThe consolidated entity has exposure to the following risks from its use of financial instruments:
• Credit risk
• Liquidity risk
• Market risk
This note presents information about the consolidated entity’s exposure to each of the above risks, their objectives, policies and processes for measuring and managing risk, and the management of capital. Further quantitative disclosures are included throughout this financial report.
53NOTES TO THE CONSOLIDATED FINANCIAL STATEMENTS
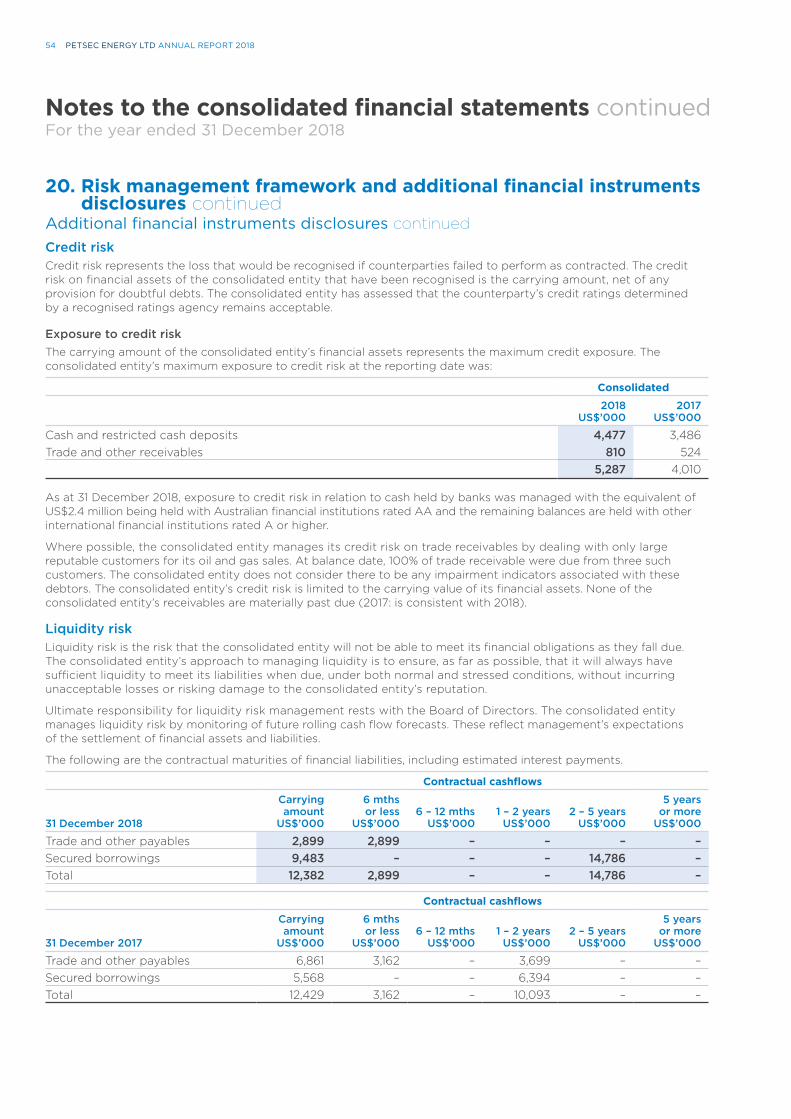
20. Risk management framework and additional financial instruments disclosures continued
Additional financial instruments disclosures continuedCredit risk Credit risk represents the loss that would be recognised if counterparties failed to perform as contracted. The credit risk on financial assets of the consolidated entity that have been recognised is the carrying amount, net of any provision for doubtful debts. The consolidated entity has assessed that the counterparty’s credit ratings determined by a recognised ratings agency remains acceptable.
Exposure to credit riskThe carrying amount of the consolidated entity’s financial assets represents the maximum credit exposure. The consolidated entity’s maximum exposure to credit risk at the reporting date was:
Consolidated
2018US$’000
2017US$’000
Cash and restricted cash deposits 4,477 3,486Trade and other receivables 810 524
5,287 4,010
As at 31 December 2018, exposure to credit risk in relation to cash held by banks was managed with the equivalent of US$2.4 million being held with Australian financial institutions rated AA and the remaining balances are held with other international financial institutions rated A or higher.
Where possible, the consolidated entity manages its credit risk on trade receivables by dealing with only large reputable customers for its oil and gas sales. At balance date, 100% of trade receivable were due from three such customers. The consolidated entity does not consider there to be any impairment indicators associated with these debtors. The consolidated entity’s credit risk is limited to the carrying value of its financial assets. None of the consolidated entity’s receivables are materially past due (2017: is consistent with 2018).
Liquidity risk Liquidity risk is the risk that the consolidated entity will not be able to meet its financial obligations as they fall due. The consolidated entity’s approach to managing liquidity is to ensure, as far as possible, that it will always have sufficient liquidity to meet its liabilities when due, under both normal and stressed conditions, without incurring unacceptable losses or risking damage to the consolidated entity’s reputation.
Ultimate responsibility for liquidity risk management rests with the Board of Directors. The consolidated entity manages liquidity risk by monitoring of future rolling cash flow forecasts. These reflect management’s expectations of the settlement of financial assets and liabilities.
The following are the contractual maturities of financial liabilities, including estimated interest payments.
Contractual cashflows
31 December 2018
Carryingamount
US$’000
6 mthsor less
US$’0006 – 12 mths
US$’0001 – 2 years
US$’0002 – 5 years
US$’000
5 yearsor more
US$’000
Trade and other payables 2,899 2,899 – – – –Secured borrowings 9,483 – – – 14,786 –Total 12,382 2,899 – – 14,786 –
Contractual cashflows
31 December 2017
Carryingamount
US$’000
6 mthsor less
US$’0006 – 12 mths
US$’0001 – 2 years
US$’0002 – 5 years
US$’000
5 yearsor more
US$’000
Trade and other payables 6,861 3,162 – 3,699 – –Secured borrowings 5,568 – – 6,394 – –Total 12,429 3,162 – 10,093 – –
Notes to the consolidated financial statements continuedFor the year ended 31 December 2018
PETSEC ENERGY LTD ANNUAL REPORT 201854
Market risk Market risk is the risk that changes in market prices, such as foreign exchange rates, commodity prices, interest rates will affect the consolidated entity’s income or the value of its holdings of financial instruments. The objective of market risk management is to manage and control market risk exposures within acceptable parameters, while optimising the return.
Foreign exchange riskDuring 2017 and 2018, operating costs were incurred in U.S., Australian and Canadian dollars, Arab Emirates Dirham and Yemeni Rials.
Throughout 2017 and 2018, the consolidated entity held the majority of its liquid funds in U.S. dollars.
Fluctuations in the Australian dollar/U.S. dollar exchange rate have impacted the underlying performance of the consolidated entity. The consolidated entity’s policy is not to hedge the Australian dollar/U.S. dollar exchange rate risk as income (cash inflows) and expenses (cash outflows), are predominantly denominated in U.S. dollars, with the exception of Australian dollar denominated equity funding, consequently surplus funds are primarily held in U.S. dollars. The impact of Arab Emirates Dirham, Canadian dollars and Yemeni Rials was not material.
Commodity price riskThe revenue and income of the consolidated entity are affected by changes in natural gas and crude oil prices, and from time to time various financial transactions (swap contracts and collar contracts involving NYMEX commodity prices for natural gas and crude oil) may be undertaken to reduce the effect of these changes. The consolidated entity ensures that it has sufficient proved reserves of these commodities to cover all these transactions and it only enters into such derivatives to match its anticipated underlying physical production and reserves. The consolidated entity also limits the term of the transactions and the percentage of the Company’s expected aggregate oil and natural gas production that may be hedged at any time.
SwapsIn a natural gas swap agreement the consolidated entity receives from the counterparty the difference between the agreed contracted fixed price and the quoted or published reference settlement price if the latter is lower than the fixed price. If the reference settlement price is higher than the agreed fixed price, the consolidated entity will pay the difference to the counterparty.
CollarsIn a collar agreement, a floor price and a ceiling price are established. If there is no cash outlay upon entering a collar arrangement, it is called a “costless” or “cashless” collar. If quoted reference prices at the specified date (expiration date) are lower than the floor price, then the counterparty pays the price difference multiplied by the notional quantity to the consolidated entity. If the quoted reference prices at the specified date are higher than the ceiling price, then the consolidated entity pays the price difference multiplied by the notional quantity to the counterparty.
At 31 December 2018, the consolidated entity had no outstanding oil or natural gas hedges in place (previous corresponding period: Nil).
Interest rate riskThe consolidated entity’s exposure to market interest rates primarily relates to the consolidated entity’s cash holdings (2017: cash holdings).
The financial instruments exposed to interest rate risk are as follows:
2018US$’000
2017US$’000
Financial assetsCash and restricted cash deposits 4,477 3,486
4,477 3,486
55NOTES TO THE CONSOLIDATED FINANCIAL STATEMENTS
20. Risk management framework and additional financial instruments disclosures continued
Additional financial instruments disclosures continuedSensitivity analysis In managing commodity price and interest rate risks the consolidated entity aims to reduce the impact of short-term fluctuations on the consolidated entity’s earnings. However, credit considerations limit the amount of hedging with derivative instruments that the consolidated entity can enter into. The consolidated entity and the Company do not use derivative instruments to manage foreign exchange rate risk. Over the longer-term, permanent changes in commodity prices, interest rates and exchange rates will have an impact on profit.
The estimated impact of a 10 per cent change in the average commodity price for the year ended 31 December 2018 would have increased or decreased the consolidated entity’s profit or loss by US$313,000 (2017: US$132,000) excluding potential impact of impairments. The estimated impact of a change of 100 basis points in interest rates would have increased or decreased the consolidated entity’s profit or loss by US$1,000 (2017: US$5,000). The estimated impact of a 10 per cent change in the USD/AUD and USD/CAD exchange rates would have increased or decreased the consolidated entity’s profit or loss by a total of US$126,000 (2017: US$183,000).
Fair values of financial assets and liabilitiesThe carrying values of financial assets and liabilities of the consolidated entity approximate their fair values.
The consolidated entity measures and recognises in the statement of financial position on a recurring basis certain assets and liabilities at fair value in accordance with AASB13 Fair value measurement. The fair value must be estimated for recognition and measurement or for disclosure purposes in accordance with the following hierarchy:
Level 1: Quoted prices (unadjusted) in active markets for identical assets or liabilities;
Level 2: Inputs other than quoted prices included within level 1 that are observable for the asset or liability, either directly (as priced) or indirectly (derived from prices); and
Level 3: Inputs for the asset or liability which are not based on observable market data (unobservable inputs).
The fair values of financial assets and liabilities, together with the carrying amounts shown in the balance sheet, are as follows:
2018 2017
Carryingamount
US$’000
Fairvalue
US$’000
Carryingamount
US$’000
Fairvalue
US$’000
Trade and other receivables 810 810 524 524Cash and restricted cash deposits 4,477 4,477 3,486 3,486Trade and other payables (2,899) (2,899) (6,861) (6,861)Secured borrowings (9,483) (9,483) (5,568) (5,568)Financial derivative instruments (1,977) (1,977) (178) (178)
(9,072) (9,072) (8,597) (8,597)
The financial derivative instrument of US$1,977,000 (2017: US$178,000) is a level 2 instrument.
Refer to note 4 for the determination of fair values.
Notes to the consolidated financial statements continuedFor the year ended 31 December 2018
PETSEC ENERGY LTD ANNUAL REPORT 201856
21. Operating leasesLeases as lesseeNon-cancellable operating lease rentals are payable as follows:
2018US$’000
2017US$’000
Less than 1 year 297 306Between 1 and 2 years 255 249Between 2 and 3 years 202 256Between 3 and 4 years – 206
754 1,017
The consolidated entity leases office space in Australia and the USA under operating leases. The leases typically run for a period between 1 and 5 years. None of the leases includes contingent rentals.
During the year ended 31 December 2018, US$395,000 was recognised as an expense in the statement of comprehensive income in respect of operating leases including month-to-month leases (2017: US$511,000).
22. Capital and other commitments2018
US$’0002017
US$’000
Capital expenditure commitmentsExploration, evaluation and development expenditureContracted but not provided for and payable: Within one year 1,776 –One year or later and no later than five years – –
1,776 –
23. Contingencies and legal mattersThe consolidated entity is a defendant from time to time in legal proceedings. Where appropriate the consolidated entity takes legal advice. The consolidated entity does not consider that the outcome of any current proceedings is likely to have a material effect on its operations or financial position.
The production, handling, storage, transportation and disposal of oil and natural gas, by-products thereof and other substances and materials produced or used in connection with oil and natural gas operations were subject to regulation under U.S. federal, state and local laws and regulations primarily relating to protection of human health and environment. To date, expenditure related to complying with these laws and for remediation of existing environmental contamination has not been significant in relation to the results of operations of the Company.
From time to time, the consolidated entity is required to provide bonding or security for the benefit of U.S. and Yemen regulatory authorities in relation to its obligations to pay lease rentals and royalties, the plugging and abandonment of oil and natural gas wells, the removal of related facilities, and to meet minimum exploration expenditure commitments. As at 31 December 2018, the consolidated entity had US$1.7 million in secured guarantees in place to meet minimum exploration expenditure commitments (December 2017: nil).
57NOTES TO THE CONSOLIDATED FINANCIAL STATEMENTS
24. Deed of cross guaranteePursuant to ASIC Corporations Instrument 2016/785, relief is granted to certain wholly owned Australian subsidiaries of the Company from the Corporations Act requirements for preparation, audit, and publication of Financial Reports and Directors’ Reports.
It is a condition of the Class Order that the Company and each of its subsidiaries enter into a Deed of Cross Guarantee Indemnity. The effect of the deed is that the Company guarantees to each creditor payment in full of any debt in the event of winding up of any of the subsidiaries under certain provisions of the Corporations Act. If a winding-up occurs under other provisions of the Act, the Company will only be liable in the event that after six months any creditor has not been paid in full. The subsidiaries have also given similar guarantees in the event that the Company is wound up.
The subsidiaries subject to the Deed are:
• Petsec Investments Pty. Limited
• Petroleum Securities Pty. Limited
• Najedo Pty. Ltd
• Petroleum Securities Share Plan Pty Limited
• Laurel Bay Petroleum Limited
• Ginida Pty. Limited
• Western Medical Products Pty. Limited
A consolidated statement of comprehensive income and consolidated balance sheet, comprising the Company and subsidiaries which are a party to the Deed, after eliminating all transactions between parties to the Deed of Cross Guarantee, as at 31 December 2018 and 2017, is set out as follows:
Summarised consolidated statement of profit or loss and other comprehensive income and retained earnings/(accumulated losses)
2018US$’000
2017US$’000
Other income and expenses 11,304 2,246Operating expenses (1,653) (1,841)Finance income/(expense) (3,600) (268)Net movement in provisions against loans and investments in controlled entities (30,009) (593)Profit/(loss) before tax (23,958) (456)Income tax benefit/(expense) – –Profit/(loss) after tax (23,958) (456)Other comprehensive income – –Total comprehensive income for the period (23,958) (456)Retained earnings/(accumulated losses) at beginning of year (164,667) (164,211)Retained earnings/(accumulated losses) at end of year (188,625) (164,667)
Notes to the consolidated financial statements continuedFor the year ended 31 December 2018
PETSEC ENERGY LTD ANNUAL REPORT 201858
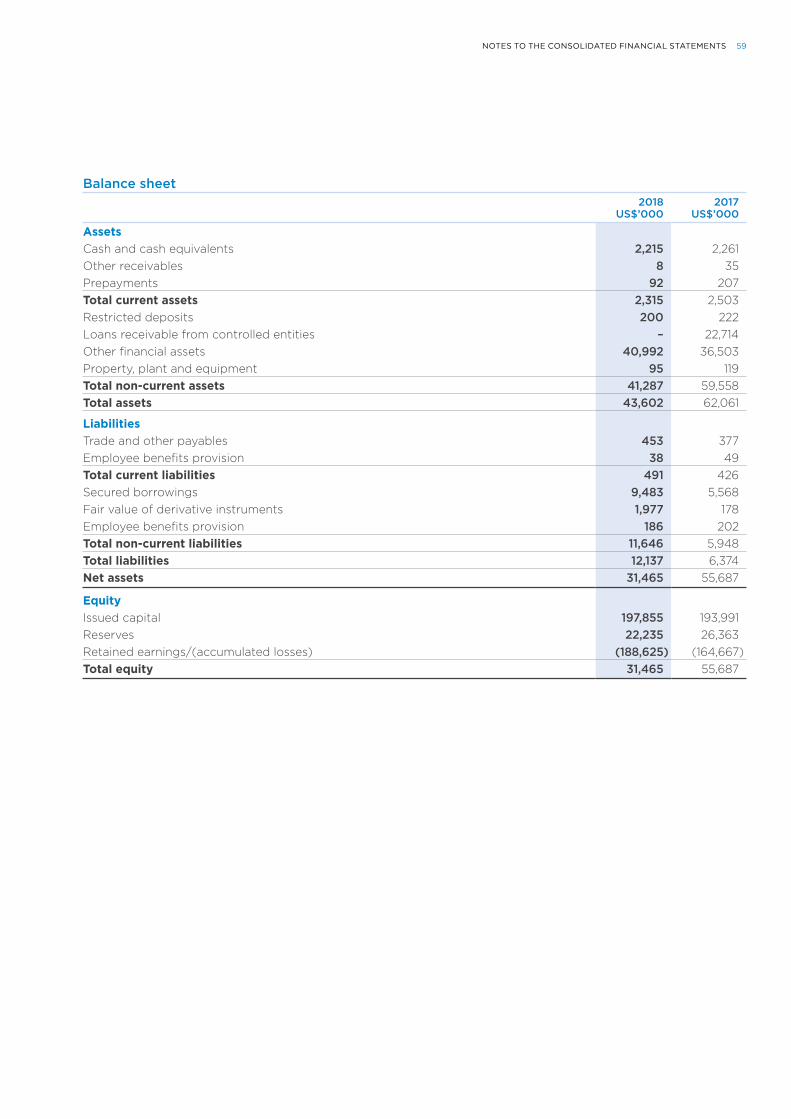
Balance sheet2018
US$’0002017
US$’000
AssetsCash and cash equivalents 2,215 2,261Other receivables 8 35Prepayments 92 207Total current assets 2,315 2,503Restricted deposits 200 222Loans receivable from controlled entities – 22,714Other financial assets 40,992 36,503Property, plant and equipment 95 119Total non-current assets 41,287 59,558Total assets 43,602 62,061
LiabilitiesTrade and other payables 453 377Employee benefits provision 38 49Total current liabilities 491 426Secured borrowings 9,483 5,568Fair value of derivative instruments 1,977 178Employee benefits provision 186 202Total non-current liabilities 11,646 5,948Total liabilities 12,137 6,374Net assets 31,465 55,687
EquityIssued capital 197,855 193,991Reserves 22,235 26,363Retained earnings/(accumulated losses) (188,625) (164,667)Total equity 31,465 55,687
59NOTES TO THE CONSOLIDATED FINANCIAL STATEMENTS
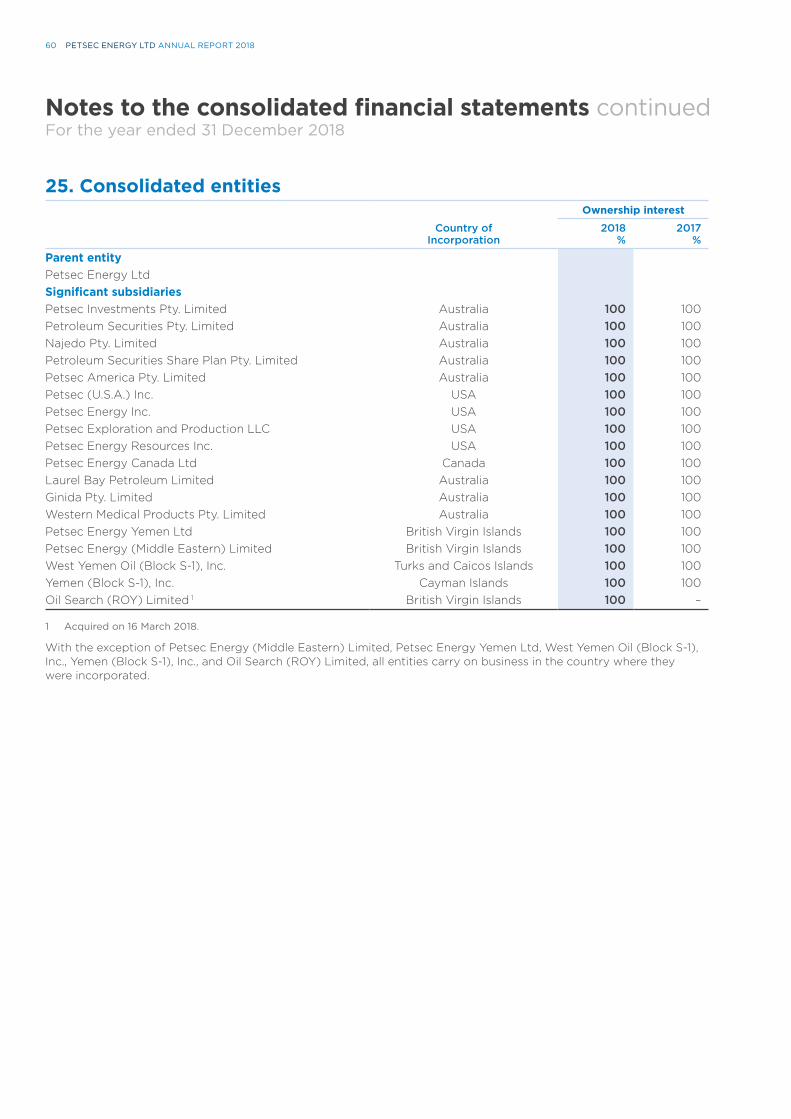
25. Consolidated entities
Country ofIncorporation
Ownership interest
2018%
2017%
Parent entityPetsec Energy LtdSignificant subsidiariesPetsec Investments Pty. Limited Australia 100 100Petroleum Securities Pty. Limited Australia 100 100Najedo Pty. Limited Australia 100 100Petroleum Securities Share Plan Pty. Limited Australia 100 100Petsec America Pty. Limited Australia 100 100Petsec (U.S.A.) Inc. USA 100 100Petsec Energy Inc. USA 100 100Petsec Exploration and Production LLC USA 100 100Petsec Energy Resources Inc. USA 100 100Petsec Energy Canada Ltd Canada 100 100Laurel Bay Petroleum Limited Australia 100 100Ginida Pty. Limited Australia 100 100Western Medical Products Pty. Limited Australia 100 100Petsec Energy Yemen Ltd British Virgin Islands 100 100Petsec Energy (Middle Eastern) Limited British Virgin Islands 100 100West Yemen Oil (Block S-1), Inc. Turks and Caicos Islands 100 100Yemen (Block S-1), Inc. Cayman Islands 100 100Oil Search (ROY) Limited 1 British Virgin Islands 100 –
1 Acquired on 16 March 2018.
With the exception of Petsec Energy (Middle Eastern) Limited, Petsec Energy Yemen Ltd, West Yemen Oil (Block S-1), Inc., Yemen (Block S-1), Inc., and Oil Search (ROY) Limited, all entities carry on business in the country where they were incorporated.
Notes to the consolidated financial statements continuedFor the year ended 31 December 2018
PETSEC ENERGY LTD ANNUAL REPORT 201860
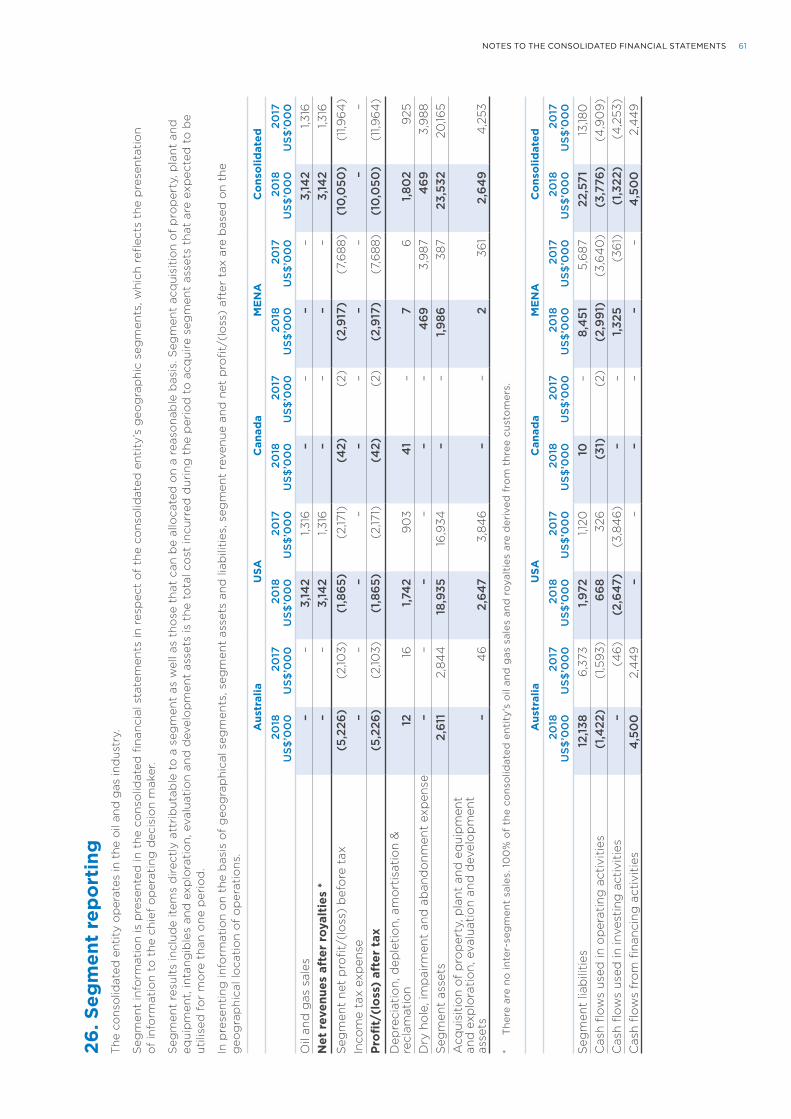
26. S
egm
ent
rep
ort
ing
The
co
nso
lidat
ed e
ntit
y o
per
ates
in t
he o
il an
d g
as in
dus
try.
Seg
men
t in
form
atio
n is
pre
sen
ted
in t
he
con
solid
ated
fin
anci
al s
tate
men
ts in
res
pec
t o
f th
e co
nso
lidat
ed e
nti
ty’s
geo
gra
ph
ic s
egm
ents
, wh
ich
refl
ects
th
e p
rese
nta
tio
n
of
info
rmat
ion
to
th
e ch
ief
op
erat
ing
dec
isio
n m
aker
.
Seg
men
t re
sult
s in
clu
de
item
s d
irec
tly
attr
ibu
tab
le t
o a
seg
men
t as
wel
l as
tho
se t
hat
can
be
allo
cate
d o
n a
rea
son
able
bas
is. S
egm
ent
acq
uis
itio
n o
f p
rop
erty
, pla
nt
and
eq
uip
men
t, in
tan
gib
les
and
exp
lora
tio
n, e
valu
atio
n a
nd
dev
elo
pm
ent
asse
ts is
th
e to
tal c
ost
incu
rred
du
rin
g t
he
per
iod
to
acq
uir
e se
gm
ent
asse
ts t
hat
are
exp
ecte
d t
o b
e u
tilis
ed f
or
mo
re t
han
on
e p
erio
d.
In p
rese
nti
ng
info
rmat
ion
on
th
e b
asis
of
geo
gra
ph
ical
seg
men
ts, s
egm
ent
asse
ts a
nd
liab
iliti
es, s
egm
ent
reve
nu
e an
d n
et p
rofi
t/(l
oss
) af
ter
tax
are
bas
ed o
n t
he
geo
gra
ph
ical
loca
tio
n o
f o
per
atio
ns.
Aus
tral
iaU
SAC
anad
aM
EN
AC
ons
olid
ated
2018
US$
’00
020
17U
S$’0
00
2018
US$
’00
020
17U
S$’0
00
2018
US$
’00
020
17U
S$’0
00
2018
US$
’00
020
17U
S$’0
00
2018
US$
’00
020
17U
S$’0
00
Oil
and
gas
sal
es
––
3,14
21,3
16–
––
–3,
142
1,316
Net
rev
enue
s af
ter
roya
ltie
s *
––
3,14
21,3
16–
––
–3,
142
1,316
Seg
men
t ne
t p
rofit
/(lo
ss)
bef
ore
tax
(5,2
26)
(2,10
3)(1
,865
)(2
,171)
(42)
(2)
(2,9
17)
(7,6
88)
(10
,050
)(1
1,96
4)
Inco
me
tax
exp
ense
––
––
––
––
––
Profi
t/(l
oss)
aft
er t
ax(5
,226
)(2
,103)
(1,8
65)
(2,17
1)(4
2)(2
)(2
,917
)(7
,688
)(1
0,0
50)
(11,9
64
)
Dep
reci
atio
n, d
eple
tio
n, a
mo
rtis
atio
n &
re
clam
atio
n12
161,7
42
90
341
–7
61,8
02
925
Dry
ho
le, i
mp
airm
ent
and
ab
and
onm
ent
exp
ense
––
––
––
469
3,9
874
693,
988
Seg
men
t as
sets
2,61
12,
844
18,9
3516
,934
––
1,986
387
23,5
3220
,165
Acq
uisi
tio
n o
f p
rop
erty
, pla
nt a
nd e
qui
pm
ent
and
exp
lora
tio
n, e
valu
atio
n an
d d
evel
op
men
t as
sets
–4
62,
647
3,84
6–
–2
361
2,64
94
,253
* T
here
are
no
inte
r-se
gm
ent
sale
s. 1
00
% o
f th
e co
nso
lidat
ed e
ntit
y’s
oil
and
gas
sal
es a
nd r
oyal
ties
are
der
ived
fro
m t
hree
cus
tom
ers.
Aus
tral
iaU
SAC
anad
aM
EN
AC
ons
olid
ated
2018
US$
’00
020
17U
S$’0
00
2018
US$
’00
020
17U
S$’0
00
2018
US$
’00
020
17U
S$’0
00
2018
US$
’00
020
17U
S$’0
00
2018
US$
’00
020
17U
S$’0
00
Seg
men
t lia
bili
ties
12,13
86
,373
1,972
1,120
10–
8,4
515,
687
22,5
7113
,180
Cas
h flo
ws
used
in o
per
atin
g a
ctiv
itie
s(1
,422
)(1
,593
)66
832
6(3
1)(2
)(2
,991
)(3
,64
0)
(3,7
76)
(4,9
09
)C
ash
flow
s us
ed in
inve
stin
g a
ctiv
itie
s–
(46
)(2
,647
)(3
,84
6)
––
1,325
(361
)(1
,322
)(4
,253
)C
ash
flow
s fr
om
fina
ncin
g a
ctiv
itie
s4
,50
02,
44
9–
––
––
–4
,50
02,
44
9
61NOTES TO THE CONSOLIDATED FINANCIAL STATEMENTS
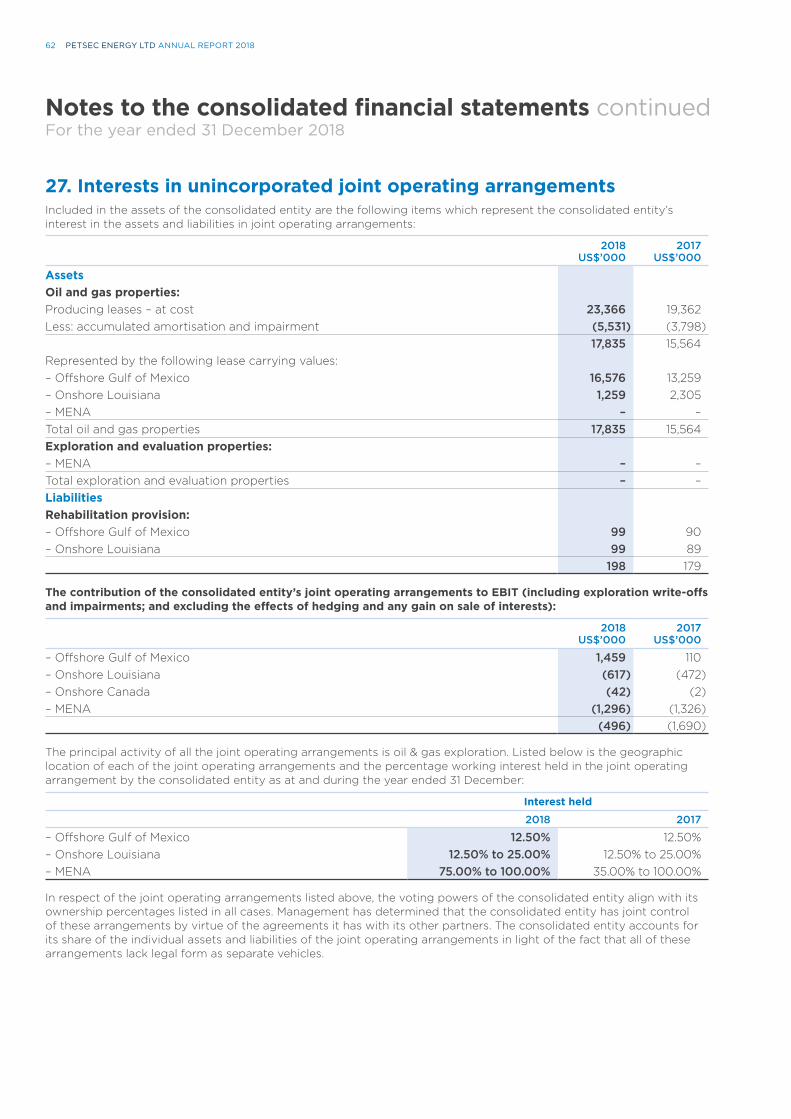
27. Interests in unincorporated joint operating arrangementsIncluded in the assets of the consolidated entity are the following items which represent the consolidated entity’s interest in the assets and liabilities in joint operating arrangements:
2018 US$’000
2017 US$’000
AssetsOil and gas properties:Producing leases – at cost 23,366 19,362Less: accumulated amortisation and impairment (5,531) (3,798)
17,835 15,564Represented by the following lease carrying values:– Offshore Gulf of Mexico 16,576 13,259– Onshore Louisiana 1,259 2,305– MENA – –Total oil and gas properties 17,835 15,564Exploration and evaluation properties:– MENA – –Total exploration and evaluation properties – –LiabilitiesRehabilitation provision:– Offshore Gulf of Mexico 99 90– Onshore Louisiana 99 89
198 179
The contribution of the consolidated entity’s joint operating arrangements to EBIT (including exploration write-offs and impairments; and excluding the effects of hedging and any gain on sale of interests):
2018 US$’000
2017 US$’000
– Offshore Gulf of Mexico 1,459 110– Onshore Louisiana (617) (472)– Onshore Canada (42) (2)– MENA (1,296) (1,326)
(496) (1,690)
The principal activity of all the joint operating arrangements is oil & gas exploration. Listed below is the geographic location of each of the joint operating arrangements and the percentage working interest held in the joint operating arrangement by the consolidated entity as at and during the year ended 31 December:
Interest held
2018 2017
– Offshore Gulf of Mexico 12.50% 12.50%– Onshore Louisiana 12.50% to 25.00% 12.50% to 25.00%– MENA 75.00% to 100.00% 35.00% to 100.00%
In respect of the joint operating arrangements listed above, the voting powers of the consolidated entity align with its ownership percentages listed in all cases. Management has determined that the consolidated entity has joint control of these arrangements by virtue of the agreements it has with its other partners. The consolidated entity accounts for its share of the individual assets and liabilities of the joint operating arrangements in light of the fact that all of these arrangements lack legal form as separate vehicles.
Notes to the consolidated financial statements continuedFor the year ended 31 December 2018
PETSEC ENERGY LTD ANNUAL REPORT 201862
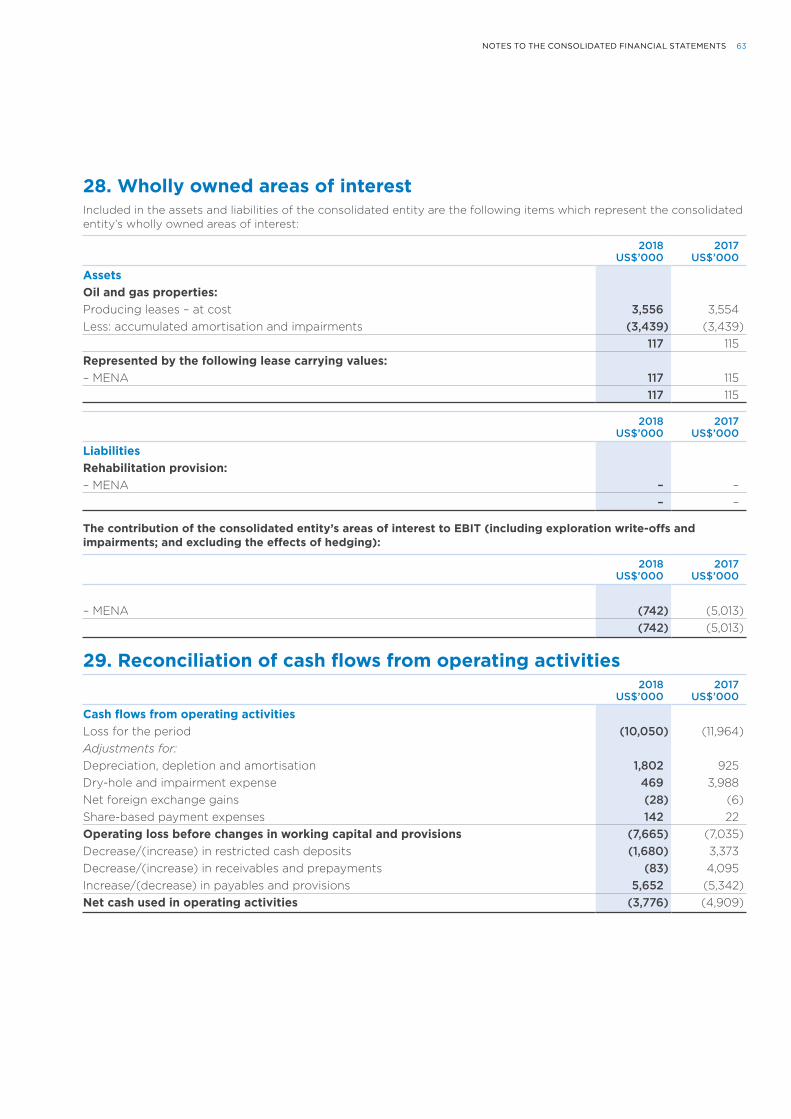
28. Wholly owned areas of interestIncluded in the assets and liabilities of the consolidated entity are the following items which represent the consolidated entity’s wholly owned areas of interest:
2018US$’000
2017US$’000
Assets Oil and gas properties:Producing leases – at cost 3,556 3,554Less: accumulated amortisation and impairments (3,439) (3,439)
117 115Represented by the following lease carrying values:– MENA 117 115
117 115
2018US$’000
2017US$’000
Liabilities Rehabilitation provision:– MENA – –
– –
The contribution of the consolidated entity’s areas of interest to EBIT (including exploration write-offs and impairments; and excluding the effects of hedging):
2018US$’000
2017US$’000
– MENA (742) (5,013)(742) (5,013)
29. Reconciliation of cash flows from operating activities2018
US$’0002017
US$’000
Cash flows from operating activitiesLoss for the period (10,050) (11,964)Adjustments for:Depreciation, depletion and amortisation 1,802 925Dry-hole and impairment expense 469 3,988Net foreign exchange gains (28) (6)Share-based payment expenses 142 22Operating loss before changes in working capital and provisions (7,665) (7,035)Decrease/(increase) in restricted cash deposits (1,680) 3,373Decrease/(increase) in receivables and prepayments (83) 4,095Increase/(decrease) in payables and provisions 5,652 (5,342)Net cash used in operating activities (3,776) (4,909)
63NOTES TO THE CONSOLIDATED FINANCIAL STATEMENTS
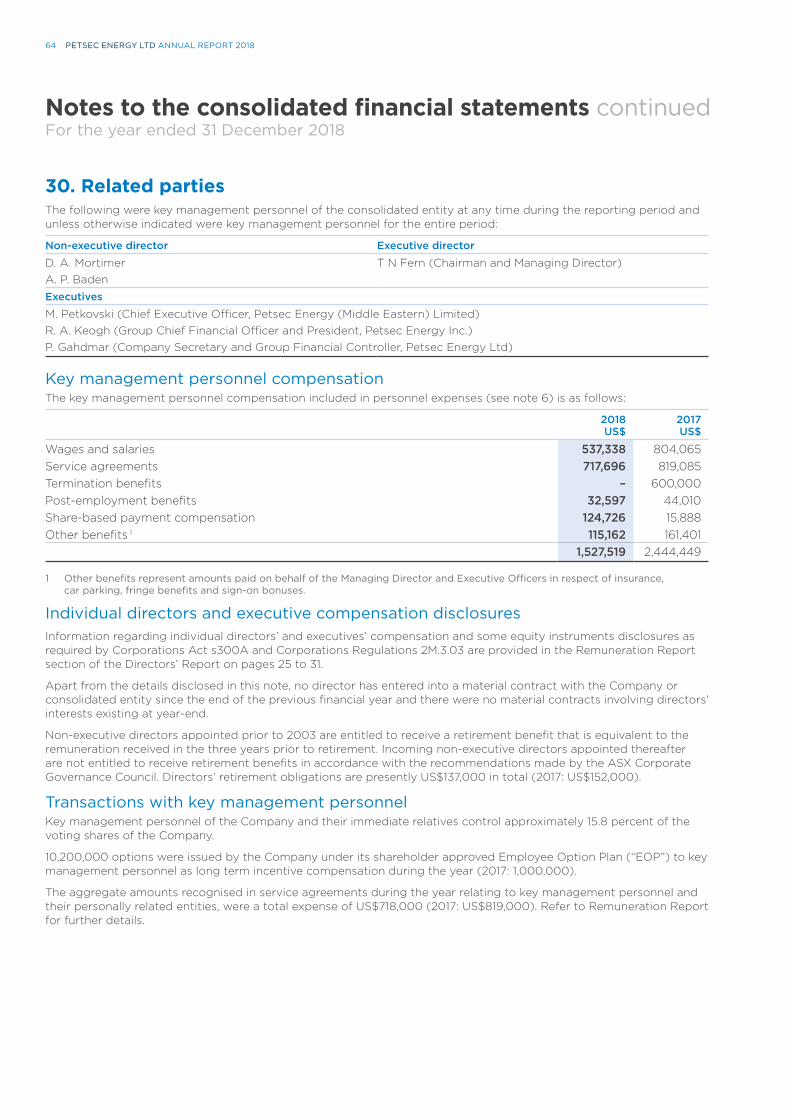
30. Related partiesThe following were key management personnel of the consolidated entity at any time during the reporting period and unless otherwise indicated were key management personnel for the entire period:
Non-executive director Executive director
D. A. Mortimer T N Fern (Chairman and Managing Director)A. P. BadenExecutives
M. Petkovski (Chief Executive Officer, Petsec Energy (Middle Eastern) Limited)R. A. Keogh (Group Chief Financial Officer and President, Petsec Energy Inc.)P. Gahdmar (Company Secretary and Group Financial Controller, Petsec Energy Ltd)
Key management personnel compensationThe key management personnel compensation included in personnel expenses (see note 6) is as follows:
2018US$
2017US$
Wages and salaries 537,338 804,065Service agreements 717,696 819,085Termination benefits – 600,000Post-employment benefits 32,597 44,010Share-based payment compensation 124,726 15,888Other benefits 1 115,162 161,401
1,527,519 2,444,449
1 Other benefits represent amounts paid on behalf of the Managing Director and Executive Officers in respect of insurance, car parking, fringe benefits and sign-on bonuses.
Individual directors and executive compensation disclosuresInformation regarding individual directors’ and executives’ compensation and some equity instruments disclosures as required by Corporations Act s300A and Corporations Regulations 2M.3.03 are provided in the Remuneration Report section of the Directors’ Report on pages 25 to 31.
Apart from the details disclosed in this note, no director has entered into a material contract with the Company or consolidated entity since the end of the previous financial year and there were no material contracts involving directors’ interests existing at year-end.
Non-executive directors appointed prior to 2003 are entitled to receive a retirement benefit that is equivalent to the remuneration received in the three years prior to retirement. Incoming non-executive directors appointed thereafter are not entitled to receive retirement benefits in accordance with the recommendations made by the ASX Corporate Governance Council. Directors’ retirement obligations are presently US$137,000 in total (2017: US$152,000).
Transactions with key management personnelKey management personnel of the Company and their immediate relatives control approximately 15.8 percent of the voting shares of the Company.
10,200,000 options were issued by the Company under its shareholder approved Employee Option Plan (“EOP”) to key management personnel as long term incentive compensation during the year (2017: 1,000,000).
The aggregate amounts recognised in service agreements during the year relating to key management personnel and their personally related entities, were a total expense of US$718,000 (2017: US$819,000). Refer to Remuneration Report for further details.
Notes to the consolidated financial statements continuedFor the year ended 31 December 2018
PETSEC ENERGY LTD ANNUAL REPORT 201864
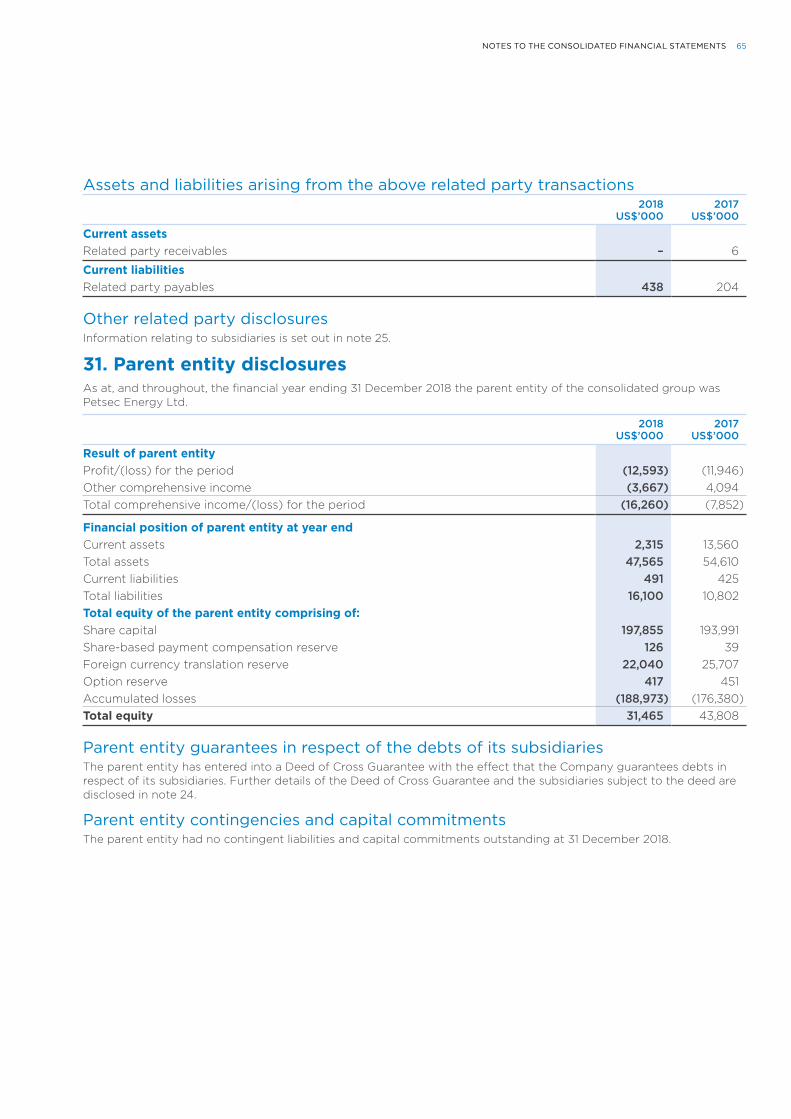
Assets and liabilities arising from the above related party transactions2018
US$’0002017
US$’000
Current assetsRelated party receivables – 6
Current liabilitiesRelated party payables 438 204
Other related party disclosuresInformation relating to subsidiaries is set out in note 25.
31. Parent entity disclosuresAs at, and throughout, the financial year ending 31 December 2018 the parent entity of the consolidated group was Petsec Energy Ltd.
2018US$’000
2017US$’000
Result of parent entityProfit/(loss) for the period (12,593) (11,946)Other comprehensive income (3,667) 4,094Total comprehensive income/(loss) for the period (16,260) (7,852)
Financial position of parent entity at year endCurrent assets 2,315 13,560Total assets 47,565 54,610Current liabilities 491 425Total liabilities 16,100 10,802Total equity of the parent entity comprising of:Share capital 197,855 193,991Share-based payment compensation reserve 126 39Foreign currency translation reserve 22,040 25,707Option reserve 417 451Accumulated losses (188,973) (176,380)Total equity 31,465 43,808
Parent entity guarantees in respect of the debts of its subsidiaries The parent entity has entered into a Deed of Cross Guarantee with the effect that the Company guarantees debts in respect of its subsidiaries. Further details of the Deed of Cross Guarantee and the subsidiaries subject to the deed are disclosed in note 24.
Parent entity contingencies and capital commitments The parent entity had no contingent liabilities and capital commitments outstanding at 31 December 2018.
65NOTES TO THE CONSOLIDATED FINANCIAL STATEMENTS
Directors’ Declaration
1 In the opinion of the directors of Petsec Energy Ltd (“the Company”):
(a) the financial statements and notes and the Remuneration report in the Directors’ Report, set out on pages 33 to 65, are in accordance with the Corporations Act 2001 including:
(i) giving a true and fair view of the financial position of the Company and the consolidated entity as at 31 December 2018 and of their performance, as represented by the results of their operations and their cash flows, for the year ended on that date; and
(ii) complying with Australian Accounting Standards and the Corporations Regulation 2001; and
(b) the financial report also complies with International Financial Reporting Standards as disclosed in note 2; and
(c) there are reasonable grounds to believe that the Company will be able to pay its debts as and when they become due and payable.
2 There are reasonable grounds to believe that the Company and the controlled entities identified in note 25 will be able to meet any obligations or liabilities to which they are or may become subject to by virtue of the Deed of Cross Guarantee between the Company and those controlled entities pursuant to ASIC Corporations Instrument 2016/785.
3 The directors have been given the declarations required by Section 295A of the Corporations Act 2001 from the Chief Executive Officer and Chief Financial Officer for the financial year ended 31 December 2018.
Signed in accordance with a resolution of the directors:
Terrence N. Fern Director
Sydney, 25 February 2019
PETSEC ENERGY LTD ANNUAL REPORT 201866

Auditor’s ReportTo the shareholders of Petsec Energy Ltd
Independent Auditor’s Report
To the shareholders of Petsec Energy Ltd
We have audited the Financial Report of Petsec Energy Ltd (the Company).
In our opinion, the accompanying Financial Report of the Company is in accordance with the Corporations Act 2001, including:
giving a true and fair view of the Groupfinancial position as at 31 December2018 and of its financial performance forthe year ended on that date; and
complying with Australian AccountingStandards and the CorporationsRegulations 2001.
The Financial Report comprises:
Consolidated statement of financialposition as at 31 December 2018;
Consolidated statement of profit or loss andother comprehensive income, Consolidatedstatement of changes in equity, andConsolidated statement of cash flows for theyear then ended;
Notes including a summary of significantaccounting policies; and
Directors’ Declaration.
The Group consists of the Company and the entities it controlled at the year end or from time to time during the financial year.
We conducted our audit in accordance with Australian Auditing Standards. We believe that the audit evidence we have obtained is sufficient and appropriate to provide a basis for our opinion.
Our responsibilities under those standards are further described in the Auditor’s responsibilities for the audit of the Financial Report section of our report.
We are independent of the Company and Group in accordance with the Corporations Act 2001 and the ethical requirements of the Accounting Professional and Ethical Standards Board’s APES 110 Code of Ethics for Professional Accountants (the Code) that are relevant to our audit of the Financial Report in Australia. We have fulfilled our other ethical responsibilities in accordance with the Code.
75
KPMG, an Australian partnership and a member firm of the KPMG network of independent member firms affiliated with KPMG International Cooperative (“KPMG International”), a Swiss entity.
Liability limited by a scheme approved under Professional Standards Legislation.
Basis for opinion
Report on the audit of the Financial Report
Opinion
67AUDITOR’S REPORT
Auditor’s Report continuedTo the shareholders of Petsec Energy Ltd
76
The Key Audit Matters we identified are:
Going concern basis of preparation; and
Oil and Gas Properties.
Key Audit Matters are those matters that, in our professional judgment, were of most significance in our audit of the Financial Report of the current period.
These matters were addressed in the context of our audit of the Financial Report as a whole, and in forming our opinion thereon, and we do not provide a separate opinion on these matters.
Going Concern Basis for Preparation
Refer to Note 2d “Going Concern basis of preparation”.
The key audit matter How the matter was addressed in our audit
The Group’s use of the going concern basis of preparation and the associated extent of uncertainty is a key audit matter due to the high level of judgment required by us in evaluating the Group’s assessment of going concern.
The Directors have determined that the use of the going concern basis of preparation is appropriate in preparing the financial report. Their assessment of going concern was based on cash flow projections. The preparation of these projections incorporated a number of assumptions and judgments, and the Directors have concluded that the range of possible outcomes considered in arriving at this judgment does not give rise to a material uncertainty casting significant doubt on the Group’s ability to continue as a going concern.
We critically assessed the levels of uncertainty, as it related to the Group’s ability to continue as a going concern, within these assumptions and judgments, focusing on the following:
Impact of future commodity prices to cash inflows projected.
The Group’s planned levels of operational and capital expenditures, and the ability of the Group to manage cash outflows within available funding.
Our audit procedures included, amongst others:
We analysed the cash flow projections by:
Evaluating the underlying data used to generate the projections. We specifically looked for their consistency including commodity prices with those used by management, and tested by us, as set out in the oil and gas properties key audit matter, their consistency with the Group’s intentions, as outlined in Directors minutes and strategy documents, and their comparability to past practices;
Analysing the impact of reasonably possible changes in projected cash flows and their timing, to the projected periodic cash positions. Assessing the resulting impact on the ability of the Group to pay debts as and when they fall due and continue as a going concern. The specific areas we focused on were informed from the results of our tests of the accuracy of previous Group cash flow projections and sensitivity analysis on key cash flow projection assumptions.
Assessing the planned levels of operating and capital expenditures for consistency of relationships and trends to the Group’s historical results, results since year end, and our understanding of the business, industry and economic conditions of the Group.
Key Audit Matters
PETSEC ENERGY LTD ANNUAL REPORT 201868
77
Oil and Gas properties $17.95m
Refer to Note 12(a) to the financial report.
The key audit matter How the matter was addressed in our audit
The Group’s Oil and Gas properties were a significant portion (76.3%) of the Group’s total assets, and their carrying value was a key audit matter due to the high level of judgement required by us to assess the carrying value.
The key judgements involved in the carrying value assessment are forward looking assumptions, as used in the Group’s value in use models. The key assumptions are forecast production, oil and gas prices, discount rates and reserve estimates. Management obtain a reserve report from a third party expert to assist in their carrying value assessment.
Our assessment is made more challenging given certain recent operating conditions, intermittent production issues, political instability in Middle Eastern located wells and the oil and gas price volatility, each of which are uncertain as to their future improvement.
Our audit procedures included, amongst others:
We held discussions with management and read the minutes of directors meetings and ASX announcements to understand if the Group had decided to discontinue production at any well. We used this knowledge when assessing forecast production assumptions and the recoverability of the oil and gas properties.
We compared historical production profiles for consistency with forecast production trends. We analysed the impact of the political instability in the Middle East to forecast production. We compare forecast production to third party expert reserve reports and investigated inconsistencies.
We used our valuation specialists to compare management’s discount rates to equivalent industry participants.
The nature and feasibility of planned methods the Group has to meet its financing commitments.
In assessing this key audit matter, we involved senior audit team members who understand the Group’s business, industry and the economic environment it operates in.
We assessed significant non-routine forecast cash inflows and outflows for feasibility, quantum and timing, and their impact to going concern and funding conditions. We used our knowledge of the Group, its industry and status to assess the level of associated uncertainty.
We read correspondence with existing financiers to understand and assess the options available to the Group including renegotiation of existing debt facilities;
We evaluated the Group’s going concern disclosures in the financial report by comparing them to our understanding of the matter, the events or conditions incorporated into the cash flow projection assessment, the Group’s plans, and accounting standard requirements
69AUDITOR’S REPORT
Auditor’s Report continuedTo the shareholders of Petsec Energy Ltd
78
Other Information is financial and non-financial information in Petsec’s annual reporting which is provided in addition to the Financial Report and the Auditor’s Report. The Directors are responsible for the Other Information.
Our opinion on the Financial Report does not cover the Other Information and, accordingly, we do not express any form of assurance conclusion thereon.
In connection with our audit of the Financial Report, our responsibility is to read the Other Information. In doing so, we consider whether the Other Information is materially inconsistent with the Financial Report or our knowledge obtained in the audit, or otherwise appears to be materially misstated.
We are required to report if we conclude that there is a material misstatement of this Other Information, and based on the work we have performed on the Other Information that we obtained prior to the date of this Auditor’s Report we have nothing to report.
For all oil and gas properties we performed sensitivity analysis on key assumptions in the value in use models such as production forecasts, discount rates and oil and gas prices to identify areas of increased audit focus.
We compared management’s oil and gas price assumptions against published forecasts such as the (WTI oil price) and investigated inconsistencies.
We obtained the Group’s value in use models and agreed amounts to Board approved production plans, budgets and the third party reserve report.
We assessed the competence and the independence of the third party experts who prepare the third party reserve report used by management to assist in their carrying value assessment of oil and gas properties
Other Information
PETSEC ENERGY LTD ANNUAL REPORT 201870
79
The Directors are responsible for:
preparing the Financial Report that gives a true and fair view in accordance with Australian Accounting Standards and the Corporations Act 2001.
implementing necessary internal control to enable the preparation of a Financial Report that gives a true and fair view and is free from material misstatement, whether due to fraud or error.
assessing the Company and Group’s ability to continue as a going concern and whether the use of the going concern basis of accounting is appropriate. This includes disclosing, as applicable, matters related to going concern and using the going concern basis of accounting unless they either intend to liquidate the Company and Group or to cease operations, or have no realistic alternative but to do so.
Our objective is:
to obtain reasonable assurance about whether the Financial Report as a whole is free from material misstatement, whether due to fraud or error; and
to issue an Auditor’s Report that includes our opinion.
Reasonable assurance is a high level of assurance, but is not a guarantee that an audit conducted in accordance with Australian Auditing Standards will always detect a material misstatement when it exists.
Misstatements can arise from fraud or error. They are considered material if, individually or in the aggregate, they could reasonably be expected to influence the economic decisions of users taken on the basis of this Financial Report.
A further description of our responsibilities for the Audit of the Financial Report is located at the Auditing and Assurance Standards Board website at: http://www.auasb.gov.au/auditors_responsibilities/ar1.pdf This description forms part of our Auditor’s Report.
Responsibilities of the Directors for the Financial Report
Auditor’s responsibilities for the audit of the Financial Report
71AUDITOR’S REPORT
Auditor’s Report continuedTo the shareholders of Petsec Energy Ltd
80
Opinion
In our opinion, the Remuneration Report of Petsec Energy Ltd for the year ended 31 December 2018, complies with Section 300A of the Corporations Act 2001.
Director’s responsibilities
The Directors of the Company are responsible for the preparation and presentation of the Remuneration Report in accordance with Section 300A of the Corporations Act 2001.
Our responsibilities
We have audited the Remuneration Report included in pages 25 to 31 of the Director’s report for the year ended 31 December 2018.
Our responsibility is to express an opinion on the Remuneration Report, based on our Audit conducted in accordance with Australian Auditing Standards.
KPMG Daniel Camilleri
Partner
Sydney
25 February 2019
Report on the Remuneration Report
PETSEC ENERGY LTD ANNUAL REPORT 201872
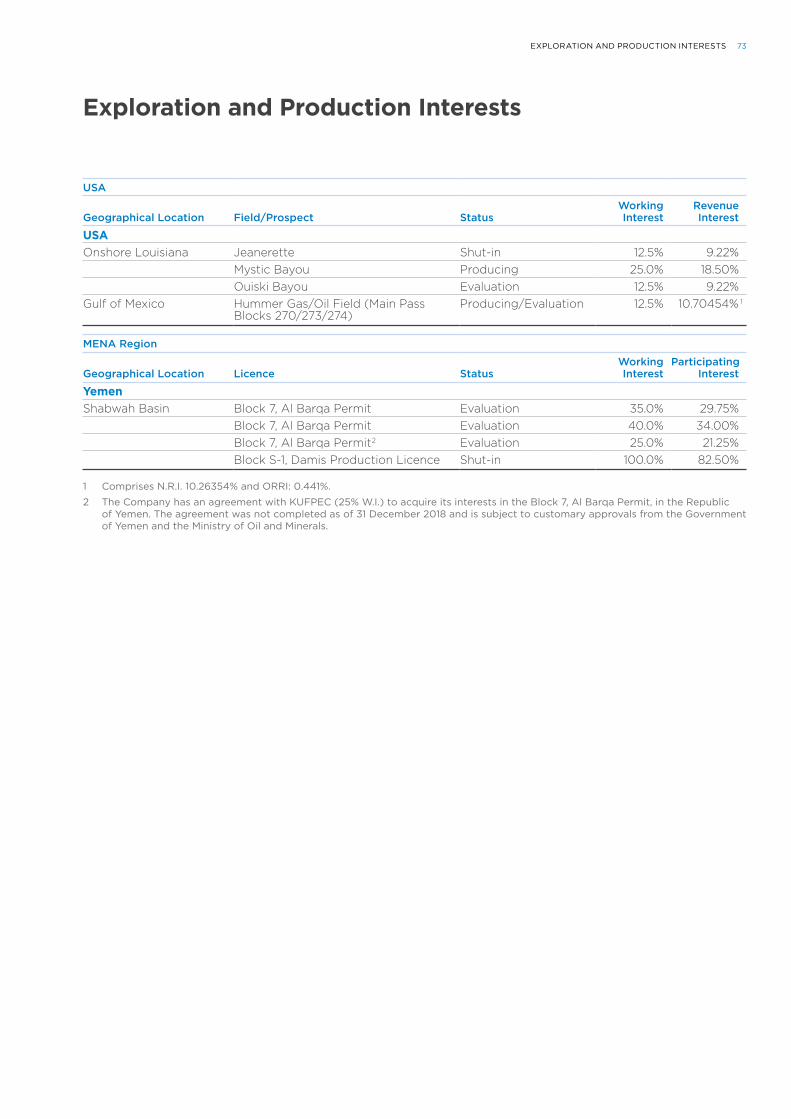
Exploration and Production Interests
USA
Geographical Location Field/Prospect StatusWorkingInterest
RevenueInterest
USAOnshore Louisiana Jeanerette Shut-in 12.5% 9.22%
Mystic Bayou Producing 25.0% 18.50%Ouiski Bayou Evaluation 12.5% 9.22%
Gulf of Mexico Hummer Gas/Oil Field (Main Pass Blocks 270/273/274)
Producing/Evaluation 12.5% 10.70454% 1
MENA Region
Geographical Location Licence StatusWorkingInterest
ParticipatingInterest
YemenShabwah Basin Block 7, Al Barqa Permit Evaluation 35.0% 29.75%
Block 7, Al Barqa Permit Evaluation 40.0% 34.00%Block 7, Al Barqa Permit2 Evaluation 25.0% 21.25%Block S-1, Damis Production Licence Shut-in 100.0% 82.50%
1 Comprises N.R.I. 10.26354% and ORRI: 0.441%.
2 The Company has an agreement with KUFPEC (25% W.I.) to acquire its interests in the Block 7, Al Barqa Permit, in the Republic of Yemen. The agreement was not completed as of 31 December 2018 and is subject to customary approvals from the Government of Yemen and the Ministry of Oil and Minerals.
73EXPLORATION AND PRODUCTION INTERESTS
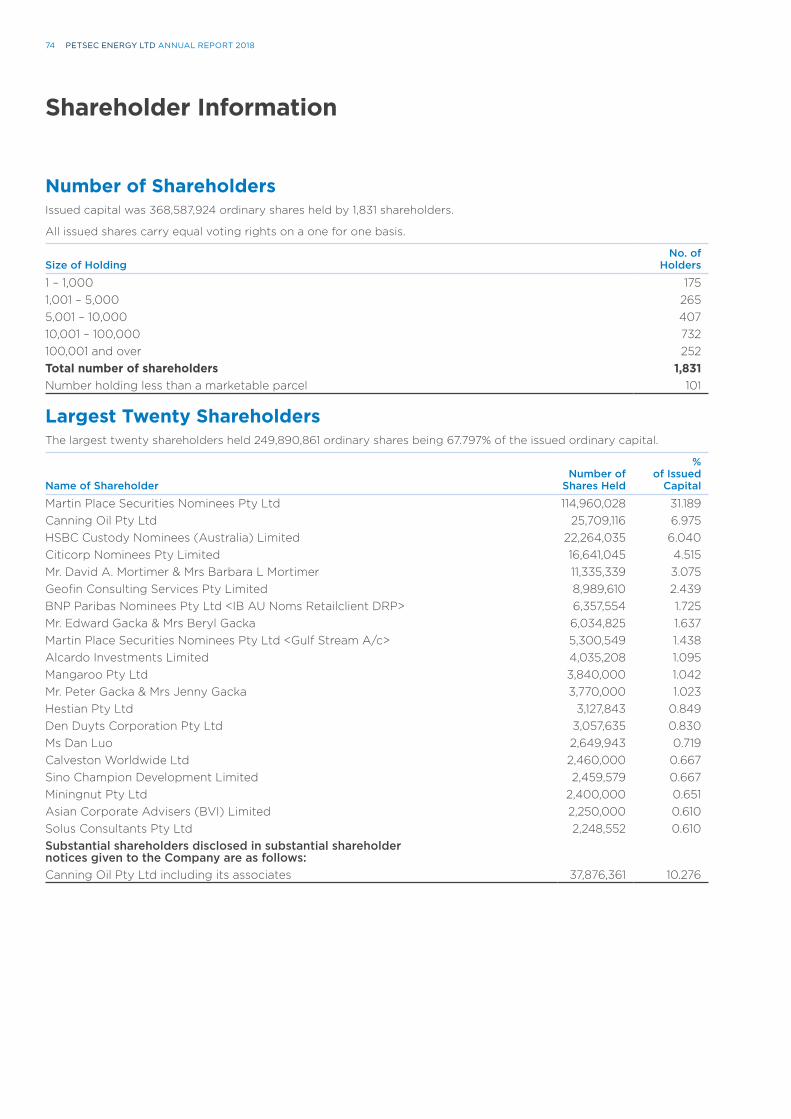
Shareholder Information
Number of ShareholdersIssued capital was 368,587,924 ordinary shares held by 1,831 shareholders.
All issued shares carry equal voting rights on a one for one basis.
Size of HoldingNo. of
Holders
1 – 1,000 1751,001 – 5,000 2655,001 – 10,000 40710,001 – 100,000 732100,001 and over 252Total number of shareholders 1,831Number holding less than a marketable parcel 101
Largest Twenty ShareholdersThe largest twenty shareholders held 249,890,861 ordinary shares being 67.797% of the issued ordinary capital.
Name of ShareholderNumber of
Shares Held
% of Issued
Capital
Martin Place Securities Nominees Pty Ltd 114,960,028 31.189Canning Oil Pty Ltd 25,709,116 6.975HSBC Custody Nominees (Australia) Limited 22,264,035 6.040Citicorp Nominees Pty Limited 16,641,045 4.515Mr. David A. Mortimer & Mrs Barbara L Mortimer 11,335,339 3.075Geofin Consulting Services Pty Limited 8,989,610 2.439BNP Paribas Nominees Pty Ltd <IB AU Noms Retailclient DRP> 6,357,554 1.725Mr. Edward Gacka & Mrs Beryl Gacka 6,034,825 1.637Martin Place Securities Nominees Pty Ltd <Gulf Stream A/c> 5,300,549 1.438Alcardo Investments Limited 4,035,208 1.095Mangaroo Pty Ltd 3,840,000 1.042Mr. Peter Gacka & Mrs Jenny Gacka 3,770,000 1.023Hestian Pty Ltd 3,127,843 0.849Den Duyts Corporation Pty Ltd 3,057,635 0.830Ms Dan Luo 2,649,943 0.719Calveston Worldwide Ltd 2,460,000 0.667Sino Champion Development Limited 2,459,579 0.667Miningnut Pty Ltd 2,400,000 0.651Asian Corporate Advisers (BVI) Limited 2,250,000 0.610Solus Consultants Pty Ltd 2,248,552 0.610Substantial shareholders disclosed in substantial shareholder notices given to the Company are as follows:Canning Oil Pty Ltd including its associates 37,876,361 10.276
PETSEC ENERGY LTD ANNUAL REPORT 201874
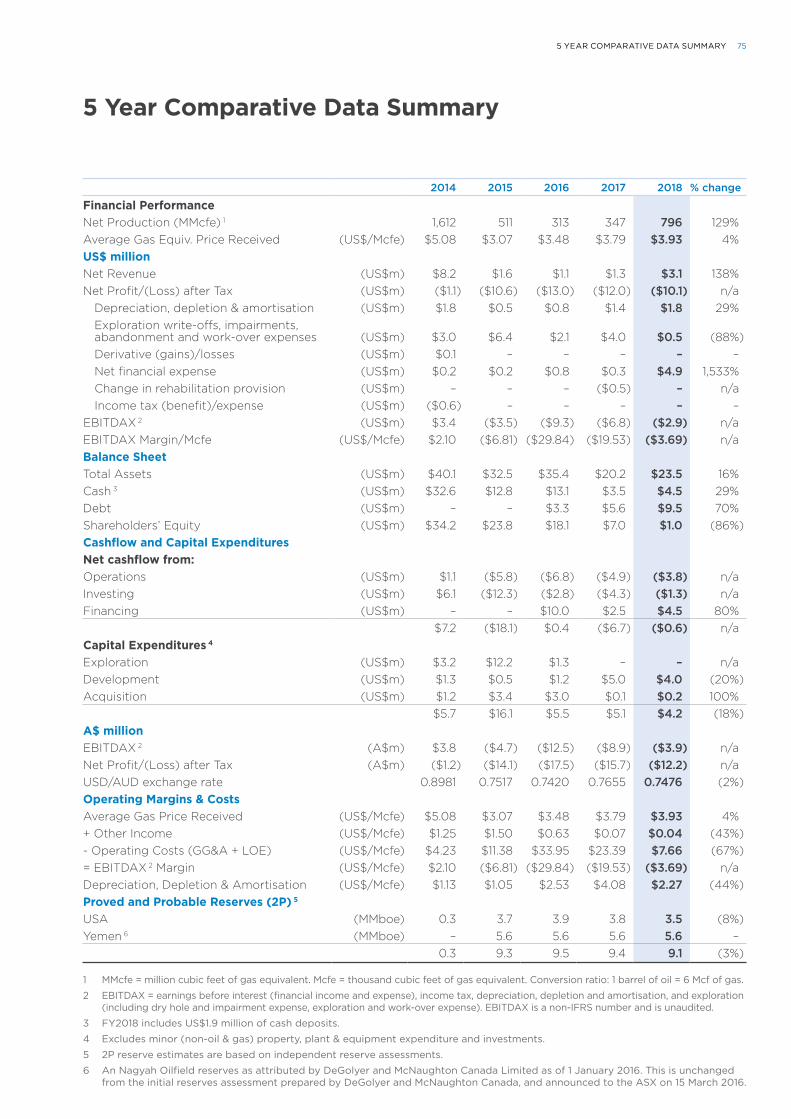
5 Year Comparative Data Summary
2014 2015 2016 2017 2018 % change
Financial PerformanceNet Production (MMcfe) 1 1,612 511 313 347 796 129%Average Gas Equiv. Price Received (US$/Mcfe) $5.08 $3.07 $3.48 $3.79 $3.93 4%US$ millionNet Revenue (US$m) $8.2 $1.6 $1.1 $1.3 $3.1 138%Net Profit/(Loss) after Tax (US$m) ($1.1) ($10.6) ($13.0) ($12.0) ($10.1) n/a Depreciation, depletion & amortisation (US$m) $1.8 $0.5 $0.8 $1.4 $1.8 29% Exploration write-offs, impairments,
abandonment and work-over expenses (US$m) $3.0 $6.4 $2.1 $4.0 $0.5 (88%) Derivative (gains)/losses (US$m) $0.1 – – – – – Net financial expense (US$m) $0.2 $0.2 $0.8 $0.3 $4.9 1,533% Change in rehabilitation provision (US$m) – – – ($0.5) – n/a Income tax (benefit)/expense (US$m) ($0.6) – – – – –EBITDAX 2 (US$m) $3.4 ($3.5) ($9.3) ($6.8) ($2.9) n/aEBITDAX Margin/Mcfe (US$/Mcfe) $2.10 ($6.81) ($29.84) ($19.53) ($3.69) n/aBalance SheetTotal Assets (US$m) $40.1 $32.5 $35.4 $20.2 $23.5 16%Cash 3 (US$m) $32.6 $12.8 $13.1 $3.5 $4.5 29%Debt (US$m) – – $3.3 $5.6 $9.5 70%Shareholders’ Equity (US$m) $34.2 $23.8 $18.1 $7.0 $1.0 (86%)Cashflow and Capital ExpendituresNet cashflow from:Operations (US$m) $1.1 ($5.8) ($6.8) ($4.9) ($3.8) n/aInvesting (US$m) $6.1 ($12.3) ($2.8) ($4.3) ($1.3) n/aFinancing (US$m) – – $10.0 $2.5 $4.5 80%
$7.2 ($18.1) $0.4 ($6.7) ($0.6) n/aCapital Expenditures 4
Exploration (US$m) $3.2 $12.2 $1.3 – – n/aDevelopment (US$m) $1.3 $0.5 $1.2 $5.0 $4.0 (20%)Acquisition (US$m) $1.2 $3.4 $3.0 $0.1 $0.2 100%
$5.7 $16.1 $5.5 $5.1 $4.2 (18%)A$ millionEBITDAX 2 (A$m) $3.8 ($4.7) ($12.5) ($8.9) ($3.9) n/aNet Profit/(Loss) after Tax (A$m) ($1.2) ($14.1) ($17.5) ($15.7) ($12.2) n/aUSD/AUD exchange rate 0.8981 0.7517 0.7420 0.7655 0.7476 (2%)Operating Margins & CostsAverage Gas Price Received (US$/Mcfe) $5.08 $3.07 $3.48 $3.79 $3.93 4%+ Other Income (US$/Mcfe) $1.25 $1.50 $0.63 $0.07 $0.04 (43%)- Operating Costs (GG&A + LOE) (US$/Mcfe) $4.23 $11.38 $33.95 $23.39 $7.66 (67%)= EBITDAX 2 Margin (US$/Mcfe) $2.10 ($6.81) ($29.84) ($19.53) ($3.69) n/aDepreciation, Depletion & Amortisation (US$/Mcfe) $1.13 $1.05 $2.53 $4.08 $2.27 (44%)Proved and Probable Reserves (2P) 5
USA (MMboe) 0.3 3.7 3.9 3.8 3.5 (8%)Yemen 6 (MMboe) – 5.6 5.6 5.6 5.6 –
0.3 9.3 9.5 9.4 9.1 (3%)
1 MMcfe = million cubic feet of gas equivalent. Mcfe = thousand cubic feet of gas equivalent. Conversion ratio: 1 barrel of oil = 6 Mcf of gas.
2 EBITDAX = earnings before interest (financial income and expense), income tax, depreciation, depletion and amortisation, and exploration (including dry hole and impairment expense, exploration and work-over expense). EBITDAX is a non-IFRS number and is unaudited.
3 FY2018 includes US$1.9 million of cash deposits.
4 Excludes minor (non-oil & gas) property, plant & equipment expenditure and investments.
5 2P reserve estimates are based on independent reserve assessments.
6 An Nagyah Oilfield reserves as attributed by DeGolyer and McNaughton Canada Limited as of 1 January 2016. This is unchanged from the initial reserves assessment prepared by DeGolyer and McNaughton Canada, and announced to the ASX on 15 March 2016.
755 YEAR COMPARATIVE DATA SUMMARY
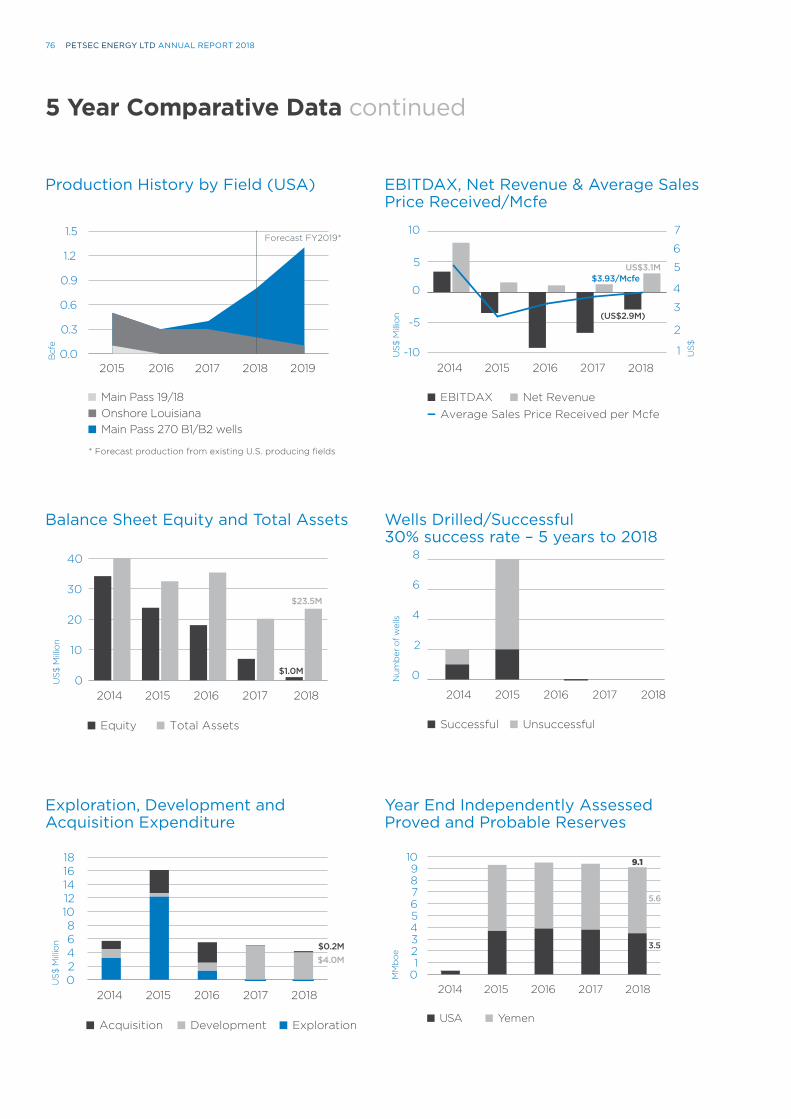
5 Year Comparative Data continued
Main Pass 270 B1/B2 wells
Bcf
e
Forecast FY2019*
* Forecast production from existing U.S. producing fields
20192015 2017 20182016
Main Pass 19/18Onshore Louisiana
0.0
0.3
0.6
0.9
1.2
1.5
Production History by Field (USA)
Balance Sheet Equity and Total Assets
Exploration, Development and Acquisition Expenditure
EBITDAX, Net Revenue & Average Sales Price Received/Mcfe
Wells Drilled/Successful 30% success rate – 5 years to 2018
Year End Independently Assessed Proved and Probable Reserves
US
$ M
illio
n
US
$
10
-102014 2015 2016
EBITDAX Net Revenue Average Sales Price Received per Mcfe
2017 2018
0
US$3.1M $3.93/Mcfe
(US$2.9M)
1
2
3
4
5
6
7
-5
5
US
$ M
illio
n
2017 20182014 2015 2016
Equity Total Assets
$1.0M
$23.5M
0
10
20
30
40
US
$ M
illio
n
Exploration development
20182014 2015 2016 2017
Acquisition Development Exploration
$0.2M$4.0M
02468
1012141618
Num
ber
of w
ells
2014 2015 2016 2017
Successful Unsuccessful
2018
0
2
4
6
8
MM
bo
e
Year End Independent
9.1
5.6
3.5
2017 20182014 2015 2016
USA Yemen
0123456789
10
PETSEC ENERGY LTD ANNUAL REPORT 201876
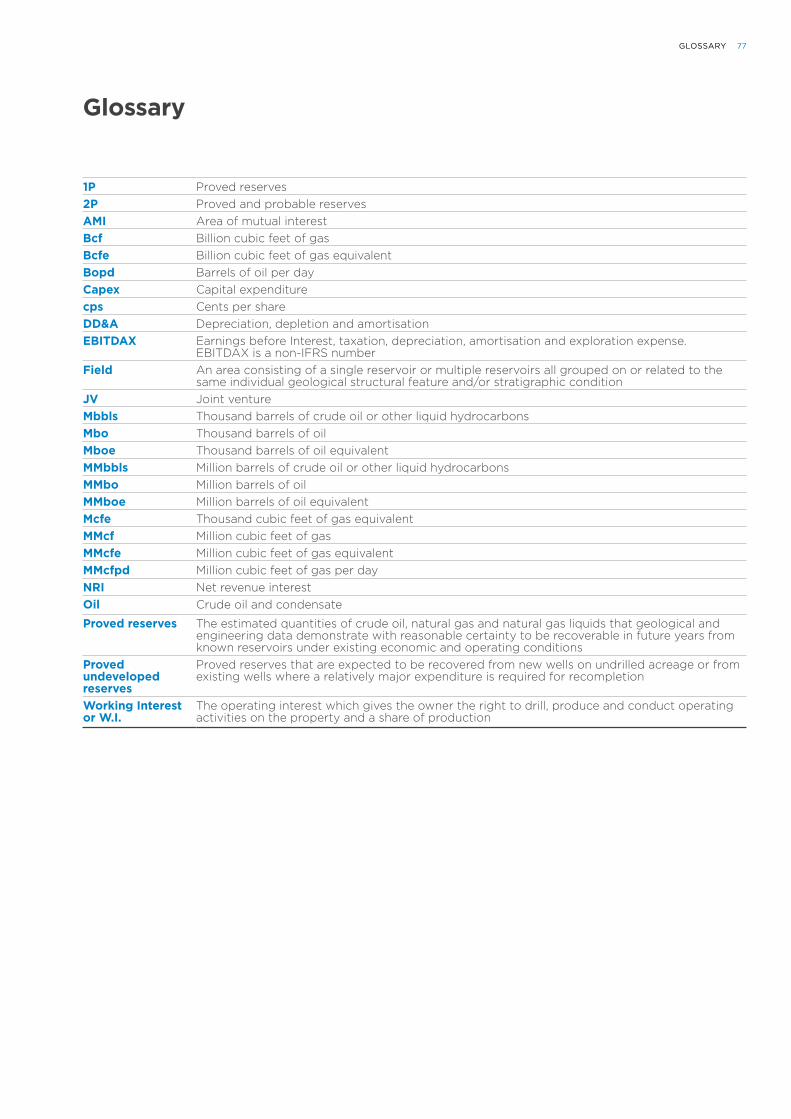
Glossary
1P Proved reserves2P Proved and probable reservesAMI Area of mutual interestBcf Billion cubic feet of gasBcfe Billion cubic feet of gas equivalentBopd Barrels of oil per dayCapex Capital expenditurecps Cents per shareDD&A Depreciation, depletion and amortisationEBITDAX Earnings before Interest, taxation, depreciation, amortisation and exploration expense.
EBITDAX is a non-IFRS numberField An area consisting of a single reservoir or multiple reservoirs all grouped on or related to the
same individual geological structural feature and/or stratigraphic conditionJV Joint ventureMbbls Thousand barrels of crude oil or other liquid hydrocarbonsMbo Thousand barrels of oilMboe Thousand barrels of oil equivalentMMbbls Million barrels of crude oil or other liquid hydrocarbonsMMbo Million barrels of oilMMboe Million barrels of oil equivalentMcfe Thousand cubic feet of gas equivalentMMcf Million cubic feet of gasMMcfe Million cubic feet of gas equivalentMMcfpd Million cubic feet of gas per dayNRI Net revenue interestOil Crude oil and condensate
Proved reserves The estimated quantities of crude oil, natural gas and natural gas liquids that geological and engineering data demonstrate with reasonable certainty to be recoverable in future years from known reservoirs under existing economic and operating conditions
Proved undeveloped reserves
Proved reserves that are expected to be recovered from new wells on undrilled acreage or from existing wells where a relatively major expenditure is required for recompletion
Working Interest or W.I.
The operating interest which gives the owner the right to drill, produce and conduct operating activities on the property and a share of production
77GLOSSARY

Corporate Directory
Board of DirectorsTerrence N. Fern – Chairman and Managing Director
David A. Mortimer – Non-executive Director
Alan P. Baden – Non-executive Director
Company SecretaryPaul Gahdmar
Australian ManagementTerrence N. Fern – Chairman and Managing Director
Paul Gahdmar – Company Secretary and Group Financial Controller
Manny Anton – Head of Investor Relations & Corporate Development
MENA Management Maki M. Petkovski – Chief Executive Officer of Petsec Energy (Middle Eastern) Limited (“PEMEL”)
John L. Rees – Vice President Technical of PEMEL
Riad Saleh Mohammed Fadle – General Manager Yemen
Ajay Goyal – General Manager Finance of PEMEL
USA Management Ross A. Keogh – President of PEI and Group Chief Financial Officer
Registered Office and Principal Business OfficeLevel 27
Governor Macquarie Tower
One Farrer Place
Telephone: + 61 2 9247 4605
Facsimile: + 61 2 9251 2410
MENA OfficesIndigo Icon Tower, Suite 2908
Dubai, United Arab Emirates
Telephone: +971 4 454 7714
Facsimile: +971 4 451 8443
6th Floor, Libyan Trade Center
Algeria (ST)
Sana’a, Yemen
Telephone: + 967 1 448392
Facsimile: + 967 1 448368
USA Offices1201 Louisiana, Suite 306
Houston, TX 77002
Telephone: +1 713 457 5800
Facsimile: +1 713 457 5838
301 E. Kaliste Saloom Road
Suite 300, Lafayette
LA 70508 USA
Telephone: +1 337 989 1942
Facsimile: +1 337 989 7271
Share RegisterBoardroom Pty Limited
Level 12, 225 George Street, Sydney NSW 2000 Australia
Postal: GPO Box 3993, Sydney NSW 2001
Telephone: 1300 737 760
International: + 61 2 9290 9600
Facsimile: 1300 653 459
International: + 61 2 9279 0664
Email: [email protected]
Depositary Receipts RegisterThe Bank of New York
6th Floor, 620 Avenue of the Americas
New York NY 10011 USA
Telephone: + 1 646 885 3300
Facsimile: + 1 646 885 3043
AuditorsKPMG Australia
Level 38, Tower Three
International Towers Sydney
300 Barangaroo Avenue
Sydney NSW 2000 Australia
Stock ExchangeListed on the Australian Stock Exchange, Symbol: PSA
Traded in USA on ADRs, Symbol: PSJEY
For further informationWeb: www.petsec.com.au
PETSEC ENERGY LTD ANNUAL REPORT 201878


PETSEC.COM.AU