petrology of sedimentary rocks (folk, 1980)geoweb.uwyo.edu/geol2100/sedimentaryrocks.pdf · tion...
TRANSCRIPT

INTRODUCTION TO SEDIMENTARY ROCKS
Sedimentary rocks cover some 80 percent of the earth’s crust. All our knowledge of stratigraphy, and the bulk of our knowledge of structural geology are based on studies of sedimentary rocks. An overwhelming percentage of the world’s economic mineral deposits, in monetary value, come from sedimentary rocks: oil, natural gas, coal, salt, sulfur, potash, gypsum, limestone, phosphate, uranium, iron, manganese, not to mention such prosaic things as construction sand, building stone, cement rock, or ceramic clays. Studies of the composition and properties of sedimentary rocks are vital in interpreting stratigraphy: it is the job of the sedimentary petrologist to determine location, lithology, relief, climate, and tectonic activity of the source area; to deduce the character of the environment of deposition; to determine the cause for changes in thickness or Iithology; and to correlate beds precisely by mineral work. Sedimentary studies are also vital in prospecting for economic mineral reserves, especially as new deposits become harder to locate. Study of sediments is being pursued intensely by oil companies, phosphate, uranium, and iron mining companies in order to locate new deposits and explain the origin of those already known.
Fundamental Classification of Sedimentary Rocks. Sediments consist fundamen- tally of three components, which may be mixed in nearly all proportions: (I) Terrige- nous components, (2) Allochemical components, and (3) Orthochemical components.
a. Terrigenous components are those substances derived from erosion of a land area outside the basin of deposition, and carried into the basin as som examples: quartz or feldspar sand, heavy minerals, clay minerals, chert or limestone pebbles derived from erosion of older rock outcrops.
b. Allochemical constituents (Greek: “allo” meaning different from normal) are those substances precipitated from solution within the basin of deposi- tion but which are “abnormal” chemical precipitates because in general they have been later moved as solids within the basin; they have a higher degree of organization than simple precipitates. Examples: broken or whole shells, oolites, calcareous fecal pellets, or fragments of penecontemporaneous carbonate sediment torn up and reworked to form pebbles.
C. Orthochemical constituents (Greek: “ortho” meaning proper or true) are “normal” chemical precipitates in the customary sense of the word. They are produced chemically within the basin and show little or no evidence of significant transportation or aggregation into more complex entities. Exam- ples: microcrystalline calcite or dolomite ooze, probably some evaporites, calcite or quartz porefi llings in sandstones, replacement minerals.
Classes (b) and (c) are collectively referred to as “Chemical” constituents; classes (a) and (b) can be collectively termed “Fragmental.” Some people use “detrital” or “elastic” as equivalent to “terrigenous”; other people use “detrital” or “elastic” as a collective term including both “terrigenous” and “allochemical” above.
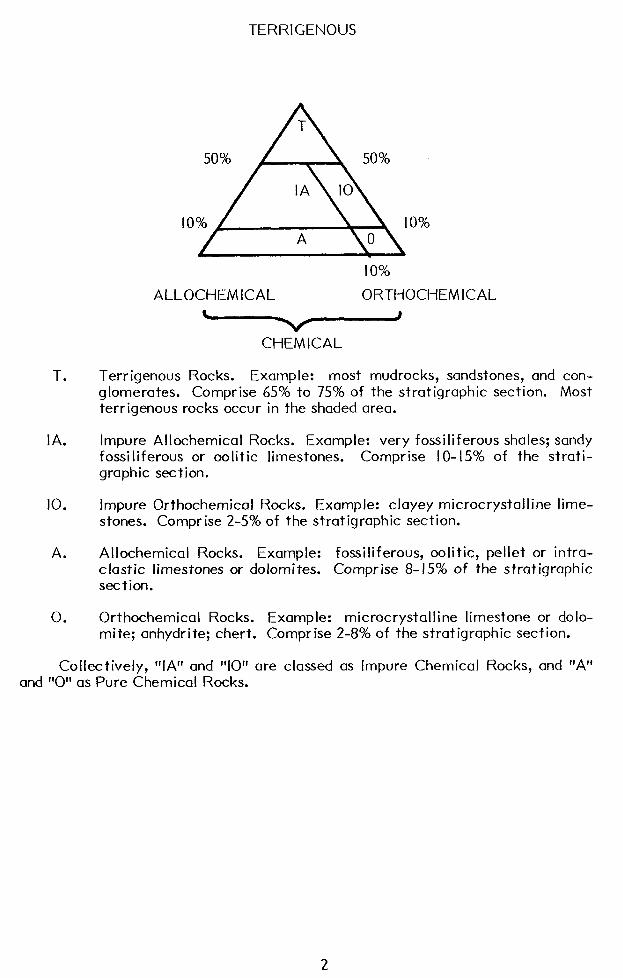
Sedimentary rocks are divided into five basic classes based on the proportions of these three fundamental end members, as shown in the triangular diagram:
I
TERRIGENOUS
T.
IA.
IO.
A.
0.
10%
ALLOCHEMICAL ORTHOCHEMICAL
c J
CHEMICAL
Terrigenous Rocks. Example: most mudrocks, sandstones, and con- glomerates. Comprise 65% to 75% of the stratigraphic section. Most terrigenous rocks occur in the shaded area.
Impure Allochemical Rocks. Example: very fossiliferous shales; sandy fossiliferous or oolitic limestones. Comprise I O-15% of the strati- graphic section.
Impure Orthochemical Rocks. Example: clayey microcrystalline lime- stones. Comprise 2-5% of the stratigraphic section.
Allochemical Rocks. Example: fossiliferous, oolitic, pellet or intra- elastic limestones or dolomites. Comprise 8-15% of the stratigraphic section.
Orthochemical Rocks. Example: microcrystalline limestone or dolo- mite; anhydr i te; chert. Comprise 2-8% of the strat igraphic section.
Collectively, “IA” and “10” are classed as Impure Chemical Rocks, and “A” and “0” as Pure Chemical Rocks.
PROPERTIES OF SEDIMENTARY ROCKS
Grain Size
Quantitative measurement of such grain size parameters as size and sorting is required for precise work. To measure grain size, one must first choose a scale. Inasmuch as nature apparently favors ratio scales over arithmetic scales, the grain size scale, devised by Udden, is based on a constant ratio of 2 between successive classes; names for the class intervals were modified by Wentworth. Krumbein devised the phi (41) scale as a logarithmic transformation of the Wentworth scale, and modern data is nearly always stated in Q terms because mathematical computations are much simpli- fied.
Grain size of particles larger than several centimeters is us,Jally determined by direct measurement with calipers or meter sticks; particles down to about 4$ (0.062 mm) are analyzed by screening; and silts and clays (fine than 44) are analyzed by pipette or hydrometer, utilizing differential settling rates in water. Sands can also be measured by petrographic microscope or by various settling devices.
Results of grain-size analysis may be plotted as histograms, cumulative curves or frequency curves. Curve data is summarized by means of mathematical parameters allowing ready comparison between samples. As measures of average size the median, mode, and mean are frequently used; as a measure of sorting the standard deviation is best. Skewness and kurtosis are also useful parameters for some work.
Geological significance of the measures is not fully known. Many generalizations have been made on far too little evidence, but significant studies are now going on. As of our present state of knowledge, we can make a few educated guesses about the meaning of grain-size statistics.
The significance of mean grain size is not yet well enough known to make any positive statements; volumes of data on recent sediments must be collected before we can say anything really meaingful. To be sure there is a certain correlation of grain size with environments (see page l07)--e.g. you usually do not find conglomerates in swamps or silts on beaches-- but there is a great deal of overlapping. These questions can only be solved by integration of size analysis results with shape study, detailed field mapping, study of sedimentary structures, fossils, thickness pattern changes, etc. It is extremely risky to postulate anything based on size analysis from one sample or one thin section, unless that sample is known to be representative of a large thickness of section. One thing that is an especially common error is the idea that if a sediment is fine it must be far from the source, while if it is coarse it must be near to a source. Many studies of individual environments show sediments getting finer away from the source but these changes are so varied that they can be deciphered only by extensive field and laboratory work. For example, strong rivers may carry large pebbles a thousand or so miles away from their source, while on the other hand the finest clays and silts are found in playa lakes a matter of a few miles from encircling rugged mountains. Grain size depends largely on the current strength of the local environment (together with size of available particles), not on distance. Flood plainlays may lie immediately adjacent to course fluvial gravels, both being the very same distance from their source. One must work up a large number of samples before anything much can be
3

said about the significance of grain size. Still, it is an important descriptive property, and only by collecting data on grain size will we be able to learn the meaning of it.
Mean size is a function of (I) the size range of available materials and (2) amount of energy imparted to the sediment which depends on current velocity or turbulence of the transporting medium. If a coastline is made up of out-crops of soft, fine-grained sands, then no matter how powerful the waves are no sediments coarser than the fine sands will ever be found on the beach. If a coastline is made up of well-jointed, hard rocks which occasionally tumble down during rains, then the beach sediment will be coarse no matter how gentle the waves of the water body. Once the limitations of source material are understood, though, one can apply the rule that sediments generally become finer in the direction of transport; this is the case with most river sands, beach sands, spits and bars. This is largely the result not of abrasion, but of selective sorting whereby the smaller grains outrun the larger and heavier ones in a downcurrent ,direction. Pettijohn and students have made excellent use of maximum pebble size in predicting distance of transport quantitatively. Sediments usually become finer with decrease in energy of the transporting medium; thus, where wave action is dominant sediments become finer in deeper water because in deep water the action of waves on the sea bottom is slight, whereas this turbulence is at a maximum in shallow waters at the breaker zone. Where current action dominates, particularly in tidal channels, coarses sediments occur in deeper waters, largely because of scour. Research is needed to quantify these changes so that the rate of grain-size change with depth can be correlated with wave energy expenditure or other environmental factors.
Sorting is another measure which is poorly understood. It depends on at least three major factors: (I) Size range of the material supplied to the environment-- obviously, if waves are attacking a coastline composed of glacial till with everything from clay to room-sized boulders, the beach sediments here will not be very well sorted; or if a turbulent river is running through outcrops of a friable well-sorted Tertiary sand then the river bars will be well sorted. (2) Type of deposition--“bean spreading”, with currents working over thin sheets of grains continuously (as in the swash and backwash of a beach) will give better sorting than the “city-dump” deposition in which sediments are dumped down the front of an advancing series of crossbeds and then rapidly buried by more sediment. (3) Current characteristics--currents of relatively constant strength whether low or high, will give better sorting than currents which fluctuate rapidly from almost slack to violent. Also very weak currents do not sort grains well, neither do very strong currents. There is an optimum current velocity or degree of turbulence which produced best sorting. For best sorting, then, currents must be of intermediate strength and also be of constant strength. (4) Time--rate of supply of detritus compared with efficiency of the sorting agent. Beach sediments where waves are attacking continually caving cliffs, or are battling great loads of detritus brought to the shore by vigorous rivers, will be generally more poorly sorted than beaches on a flat, stable coast receiving little sediment influx.
It is probable that in every environment, sorting is strongly dependent on grain size. This can be evaluated by making a scatter plot of mean size versus sorting (standard deviation). In making many of these plots, a master trend seems to stand revealed: the best sorted sediments are usually those with mean sizes of about 2 to 3$1 (fine sand) (Griffiths; Inman). As one measures coarser sediments, sorting worsens until those sediments with a mean size of 0 to -IQ (I to 2 mm) show the poorest sorting values. From here sorting improves again into the gravel ranges (-3 to -5@), and some gravels are as well sorted as the best-sorted sands (Folk and Ward). Followed from fine sand into finer sediments, the sorting worsens so that sediments with a mean size of 6 to 8$ (fine silts) have the poorest sorting values, then sorting gradually improves into
4

the pure clay range (IO@). Thus the general size vs. sorting trend is a distorted sine curve of two cycles. Work so far indicates that the apparent reason for this is that Nature produces three basic populations of detrital grains to rivers and beaches (Wentworth). ( I) A pebble population, resulting from massive rocks that undergo blocky breakage along joint or bedding planes, e.g. fresh granite or metaquartzite outcrops, limestone or chert beds, vein quartz masses. The initial size of the pebbles probably depends on spacing of the joint or bedding planes. (2) A sand-coarse silt population, representing the stable residual products liberated from weathering of granular rocks like granite, schist, phyll ite, metaquartzite or older sandstones whose grains were derived ultimately from one of these sources. The initial size of the sand or silt grains corresponds roughly to the original size of the quartz or feldspar crystal units in the disintegrating parent rocks. (3) A clay population, representing the reaction products of chemical decay of unstable minerals in soil, hence very fine grained. Clays may also be derived from erosion of older shales or slates whose grain size was fixed by the same soil-forming process in their ultimate source areas. Under this hypothesis, a granite undergoing erosion in a humid climate and with moderate relief should produce (I) pebbles of granite or vein quartz from vigorous erosion and plucking of joint blocks along the stream banks, (2) sand-size quartz grains, and (3) clay particles, both as products formed in the soils during weathering.
Because of the relative scarcity in nature of granule-coarse sand (0 to -2$) particles, and fine silt [6 .to 84 grains, sediments with mean sizes in these ranges must -- be a mixture of either (I) sand with pebbles, or (2) sand or coarse silt with clay, hence will be more poorly sorted than the pure end-members (pure gravel, sand, or clay)]. This is believed to be the explanation of the sinusoidal sorting vs. size trend. Of course exceptions to this exist, e. g. in disintegration of a coarse-grained granite or a very fine phyllite which might liberate abundant quartz grains in these normally-rare sizes. If a source area liberates grains abundantly over a wide range of sizes, sorting will remain nearly constant over that size range (Blatt) and no sinusoidal relation will be produced. Shea (I 974 JSP) denies existence of “gaps” in natural particle sizes.
Although it appears that all sediments (except glacial tills) follow this sinusoidal relation, there is some differentiation between environments. It is believed that given the same source material, a beach will produce better sorting values for each size than will a river; both will produce sinusoidal trends, but the beach samples will have better sorting values all along the trend because of the “bean spreading” type of deposition. Considering only the range of sands with mean sizes between I$ and 3$., most beach sands so far measured here have sorting VI) values between .25-.50$, while most river sands have values of .35-l -OO@. Thus there is some averlap, and of course there are some notable exceptions; beach sands formed off caving cliffs are more poorly sorted because the continual supply of poorly sorted detritus is more than the waves can take care of, and rivers whose source is a well-sorted ancient beach or marine sand will have well-sorted sediments. Coastal dune sands tend to be slightly better sorted than associated beaches, though the difference is very slight, but inland desert dunes are more poorly sorted than beaches. Near shore marine sands are sometimes more poorly sorted than corresponding beaches, but sometimes are better sorted if longshore currents are effective. Flood-plain, alluvial fan, and offshore marine sediments are still more poorly sorted although this subject is very poorly known and needs a great deal more data. Beach gravels between 0 4 and - 8 4, whether made of granite, coral, etc., have characteristic sorting values of 0.4 -0.6 $ (if they are composed mainly of one type of pebble); there seems to be no difference in sorting between beaches with gentle wave action vs. those with vigorous surf. (Folk).
5

S 0 R T I N G (a;)
Good Poor
6

Skewness and kurtosis tell how closely the grain-size distribution approaches the normal Gaussian probability curve, and the more extreme the values the more non- normal the size curve. It has been found that single-source sediments (e.g. most beach sands, aeolian sands, etc.) tend to have fairly normal curves, while sediments from multiple sources (such as mixtures of beach sands with lagoonal clays, or river sands with locally-derived pebbles) show pronouned skewness and kurtosis. Bimodal sediments exhibit extreme skewness and kurtosis values; although the pure end-members of such mixtures have nearly normal curves, sediments consisting dominantly of one end member with only a small amount of the other end member are extremely leptokurtic and skewed, the sign of the skewness depending on which end member dominates; sediments consisting of subequal amounts of the two end-members are extremely platykurtic. (Folk and Ward). Plots of skewness against kurtosis are a promising clue to environmental differentiation, for example on Mustang Island (Mason) beaches give nearly normal curves, dunes are positively-skewed mesokurtic, and aeolian flats are positively-skewed leptokurtic. Friedman showed that dunes tend to be positive skewed and beaches negative skewed for many areas all over the Earth, but Hayes showed on Padre Island that this is often modified by source of supply. Eolian deflation sediments are commonly bimodal.
Fluvial environments consisting chiefly of traction load (coarse) with some infiltrated suspension load (finer grains) are commonly positive-skewed leptokurtic; glacial marine clays with ice-ratified pebbles are negative-skewed, etc. It would be emphasized that faulty sampling may also cause erroneous skewness and kurtosis values, if a worker samples two adjoining layers of different size - i. e., a gravel streak in the sand. Each layer should be sampled separately.
Size analysis has been used practically in correlation of formations; in deter- mining if a sand will contain oil, gas or water (Griffiths); in determining direction of sediment transport; and an intensive study is being made to determine if characteristic grain size distributions are associated with certain modern environments of sedimenta- tion, so that such deposits may be identified by analysis of ancient sediments in the stratigraphic column. Furthermore many physical properties of sediments such as porosity, permeability, or firmness (Krumbein) are dependent on the grain size.
Particle Morphology
Under the broad term “particle morphology” are included at least four concepts. Listed approximately in decreasing order of magnitude, these are (I) form, (2) sphericity, (3) roundness, and (4) surface features.
Form is a measure of the relation between the three dimensions of an object, and thus particles may be classed quantitatively as compact (or equidimensional), elongated (or rodlike) and platy (or disclike), with several intermediate categories, by plotting the dimensions on a triangular graph (Sneed and Folk: see p. 9).
Sphericity is a property whose definition is simple, but which can be measured in numerous very different ways. It states quantitatively how nearly equal the three dimensions of an object are. C. K. Wentworth made the first quantitative study of shapes. Later, Waddell defined sphericity as
V 3 “P
v,,

where Vp is the actual volume of the particle (measured by immersion in water) and
Vcsis the volume of the circumscribing sphere (the smallest sphere that will just enclose
the particle); actually the diameter of this sphere is considered as equal to the longest dimension of the particle. A sphere has a sphericity of I .OO; most pebbles or sand grains have a sphericity of about 0.6-0.7 when measured by this system. One can get an approximation of this measure by the formula,
where L, I and S (Krumbein).
represent the long, intermediate and short dimensions respectively
The above formula, although in common use today, does not indicate how the particle behaves upon settling in a fluid medium and is thus rather unsatisfactory. Actually, a rod settles faster than a disk of the same volume, but Waddell’s formula would have us believe the opposite. A sphericity value which shows better the behavior of a particle during transport is the Maximum Projection Sphericity (Sneed and Folk, J. Geol. 19581, given by the formula
3 s2 Jr-
. LI Particles tend to settle with the maximum projection area (the plane of the L and I axes) perpendicular to the direction of motion and hence resisting the movement of the particle. This formula compares the maximum projection area of a given particle with the maximum projection area of a sphere of the same volume; thus if a pebble has a sphericity of 0.6 it means that a sphere of the same volume would have a maximum projection area only 0.6 as large as that of the pebble. Consequently the pebble would settle about 0.6 as fast as the sphere because of the increased surface area resisting downward motion. The derivation follows: assuming the particle to be a triaxial ellipsoid, the maximum projection area of the particle is IT/~ (LI). The volume of the particle is IT/~ (LIS). Hence the volume of the equivalent sphere will also be
n/6 (LIS). The general formula for the volume of a sphere is IT/~ d3. Therefore, in
this example, d3 = LIS and the diameter of the equivalent sphere, d, will equal
3 v- 11s . The maximum projection area of this sphere will equal
3
P->
2 n LIS 4
*
The maximum projection sphericity then equals
8

which reduces to
w P l
COMPACT
PLATY 33 BLADE0 6’ ELONGATE
Form triangle. Shapes of particles falling at various points on the triangle are illustrated by a series of blocks with axes of the correct ratio; all blocks have the same volume. Independence of the concepts of sphericity and form may be demonstrated by following an isosphericity contour from the disklike extreme at the left to the rodlike extreme at the right.
For two-dimensional purposes (as in thin sections) two other “sphericity” measure- ments have been applied. Riley Sphericity is given as
* Di II- D,
where DC is the diameter of the smallest circumscribing circle and Di is the diameter
of the largest inscribed circle. These can be easily measured by a celluloid scale ruled off in a series of closely-spaced concentric circles of known diameter, which can then be placed over the sand grain image. Another measure is Elongation which is simply width (actually least projection width) over length measured by rectangular grid. This is probably the most satisfactory two dimensional measure (Griffiths; Dapples and Romi nger).
Although individual grains may have widely varying W/L values, sample means (obtained by counting 100 quartz grains in one thin section, for example) show a much more restricted range. Measurement of many sandstones has suggested the following
9

scale: under .60, very elongate; .60-.63, elongate; .63-.66, subelongate; .66-.69, intermediate shape; .69-72, subequant; .72-.75, equant; and over .75, very equant.
Actual lona
least project i
widt
least projec length
on
h
tion
RILEY SPHERICITY
/
LEAST PROJECTION ELONGATION Roundness was first quantitatively measured by Wentworth, who used the curva-
ture of the sharpest corner. Later, it was defined by Waddell as the average radius of curvature of all the corners divided by the radius of the largest inscribed circle. This is impractical to measure, though, and now roundness values are obtained by comparison with photographic charts for sand grains (Powers). A perfect ball has a roundness of 1.0; most sand grains have roundnesses about 0.3-0.4 on the Waddeli scale. Use of the Powers roundness images for sand grains is facilitated by a logarithmic (rho, p) scale in which the limits of the very angular class are taken as 0.0-1.0, of angular I .O-2.0, subangular 2.0-3.0, subround 3.0-4.0, round 4.0-5.0, and very round 5.0-6.0~ (Folk). On this scale, perfect balls have a roundness of 6.0~ and most sand grains have average roundness about 2.5~ (subangular).
largest inscribed circle
The concept of roundness sorting (uniformity of roundness) may be expressed by the roundness standard deviation, op. This can be determined by plotting the roundness data as a cumulative curve and determine op by the intercept method, as is done in grain size curves. Plotting of these values for many samples gives the following limits for roundness standard deviation: under 0.60, very good roundness sorting; 0.60-0.80, good; 0.80- 1.00, moderate; 1.00-I .20, poor; over I .20, very poor roundness sorting. St. Peter sand, uniformly well rounded, has up under 0.60; the average value for Recent
IO

sands is about 0.90; and the Colorado River at Austin, with its mixture of well-rounded, Cambrian and Cretaceous quartz with freshly broken Llano granitic quartz has a ap of I .30.
Pebble roundness can be measured more quantitatively by dividing the radius of curvature of the sharpest single corner, by the radius of the largest inscribed circle (see Dobkins and folk, 1970 J. S. P.)
Surface Features. As yet no way has been developed to measure these quantitatively. Frosted surfaces are noticeable chiefly on round grains, although not all round grains are frosted. Frosting may be caused by chemical etching (as by dolomite replacement), by incipient tiny quartz overgrowths, or by aeolian abrasion (where the frosting is due to minute crescentic percussion marks caused by the greater impact and velocity in air). These may be distinguished by examining the grain with petrographic microscope in water. Polished surfaces are caused by a fine smoothing of the tiny irregularities and are ascribed to rubbing of the grains in water; thus they are the first stage in rounding of aqueous sands. They are supposedly common on beaches but much less so in neritic or river sands where the grains are not rolled back and forth so much; but there is considerable question as to the validity of this criterion, and some polish may form chemically (Kuenen). Much volcanic phenocryst quartz has naturally polished faces. Unpolished surfaces have neither frosting or polish, and are dull or jagged because of tiny angular irregularities or fresh fracture surfaces. They are chiefly found in river or neritic sands and indicate lack of much abrasive action. Percussion marks are found on pebbles (especially chert or quartzite) and indicate high-velocity impact. Glacial action sometimes produces scratches or striae on soft pebbles like limestone. The entire subject of surface features needs much more research to find out what happens in various environments and to what extent the observed surface features are a function of grain size.
As a possible explanation for the conflicting data on surface features and environment, the following completely untested wild idea is put forth: all abrasional environments produce all types of surface features, but on different sizes of particles. In each environment the coarsest grains are frosted (probably by percussion marks), intermediate grains are polished, and the finest grains are dull (unmodified). The size ranges over which these surface features develop on quartz varies with the environ- ment, perhaps as below:
size -4 -2 0 2 4
Neritic D U L L
River Frosted Polished D u 1 1
Beach Frosted Polished D u 11
Dune F r 0 s t e d Polished Dull
The most common size inspected for surface features is about medium sand, which would explain the feeling that most dunes are frosted, most beach sands polished, and river sands dull. Of course, rate of deposition, time available, and rate of supply add complications, and some surface features are formed chemically. Mature desert quartz often has a greasy luster caused by a minutely pimply deposition of quartz “turtle-skin” overgrowths.
I I

As a rule, it is difficult to study surface features in ancient sediments because of cementation. An attempt may be made by cleaning the grains thoroughly in warm HCI to remove carbonates and iron stains. They should be studied under highest power of the binocular microscope, on a black surface and under strong light. After this, the grain should be mounted in water and examined with petrographic microscope. Electron microscopy has made great contributions to study of grain surface features (Krinsley), and intimate details of grain history can be studied.
Graphic and Statistical Analysis of Shape Data. Graphic or statistical analysis is necessary to show (I) the variation 2 grain morphology with size, which is nearly always present, and (2) environmental, spatial, or stratigraphic differences between samples. In comparing a set of samples, one should choose the same size interval throughout for his analyses, because coarser grains are usually better rounded, and show different surface features. However on some of the samples, shape study should be made on all sizes. This is called an H pattern of sampling.
If a significant difference in morphology is found, (for example if beach sands in an area are more angular than dune sands), you must always consider whether it is due to (I) an actual difference in the processes going on (that the dunes are rounding more effectively) or whether (2) it is simply the result of selective sorting, where e.g. rounded and more spherical grains are left behind by wind currents which selectively sweep away the more angular and less spherical grains.
To determine if a difference in Form is present between two sets of samples, one can (I) using a moving circular mask, contour the points on the triangular diagram as is
done in contouring joint or petrofabric diagrams; (2) use the X2 test by counting the number of particles in each shape “cell” and comparing the results; (3) obtain by counting a median shape for each set of data; (4) superimpose a sheet of transparent triangular-ruled graph paper over the data, and assign each point a “percent elongation” and a “percent platiness” by measuring its distance from the base line of the triangle; this data may be treated by finding its mean and standard deviation and comparing by the t test.
Sphericity differences between samples can be evaluated by finding a mean and standard deviation for each set of particles and comparing by means of the t test.
Roundness is analyzed by counting a large number of particles using comparison charts; then, use the log transformations of the roundness values (p scale) and compute means (average roundness) and standard deviations (roundness sorting), then compare by the t test. The roundness data may also be plotted by means of cumulative curves if probability paper is used. In doing a set of samples from two or more environments, formations, or localities, it is well to have an associate mix the samples up so that you do not know which set you are working on when you count a sample; thus you avoid a bias and the data is more “honest.”
Surface features may be compared by counting the number of frosted, polished
grains etc. and comparing by the X2 test. Again, an associate should mix the samples up so you do not know which sets you are counting, in order to avoid bias.
Significance of Grain Morphology
Form and Sphericity are the result of (I) Structure (internal properties, inherited from the source; (2) Process (work of the depositional environment e.g. glacier, river or
I2
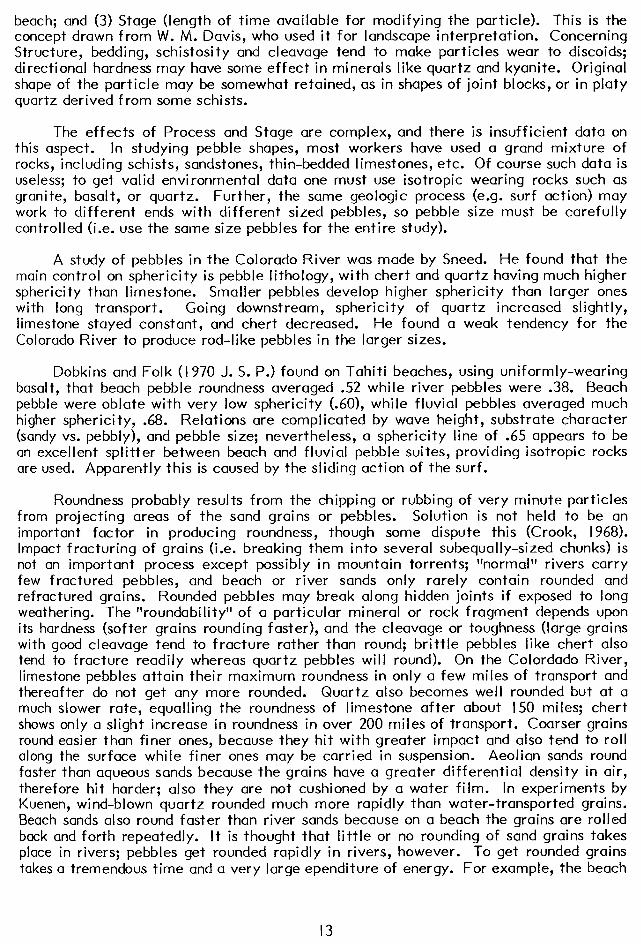
beach; and (3) Stage (length of time available for modifying the particle). This is the concept drawn from W. M. Davis, who used it for landscape interpretation. Concerning Structure, bedding, schistosity and cleavage tend to make particles wear to discoids; directional hardness may have some effect in minerals like quartz and kyanite. Original shape of the particle may be somewhat retained, as in shapes of joint blocks, or in platy quartz derived from some schists.
The effects of Process and Stage are complex, and there is insufficient data on this aspect. In studying pebble shapes, most workers have used a grand mixture of rocks, including schists, sandstones, thin-bedded limestones, etc. Of course such data is useless; to get valid environmental data one must use isotropic wearing rocks such as granite, basalt, or quartz. Further, the same geologic process (e.g. surf action) may work to different ends with different sized pebbles, so pebble size must be carefully controlled (i.e. use the same size pebbles for the entire study).
A study of pebbles in the Colorado River was made by Sneed. He found that the main control on sphericity is pebble Iithology, with chert and quartz having much higher sphericity than limestone. Smaller pebbles develop higher sphericity than larger ones with long transport. Going downstream, sphericity of quartz increased slightly, limestone stayed constant, and chert decreased. He found a weak tendency for the Colorado River to produce rod-like pebbles in the larger sizes.
Dobkins and Folk (I 970 J. S. P.) found on Tahiti beaches, using uniformly-wearing basalt, that beach pebble roundness averaged .52 while river pebbles were .38. Beach pebble were oblate with very low sphericity (.60), while fluvial pebbles averaged much higher spherici ty, .68. Relations are complicated by wave height, substrate character (sandy vs. pebbly), and pebble size; nevertheless, a sphericity line of .65 appears to be an excellent splitter between beach and fluvial pebble suites, providing isotropic rocks are used. Apparently this is caused by the sliding action of the surf.
Roundness probably results from the chipping or rubbing of very minute particles from projecting areas of the sand grains or pebbles. Solution is not held to be an important factor in producing roundness, though some dispute this (Crook, 1968). Impact fracturing of grains (i.e. breaking them into several subequally-sized chunks) is not an important process except possibly in mountain torrents; “normal” rivers carry few fractured pebbles, and beach or river sands only rarely contain rounded and refractured grains. Rounded pebbles may break along hidden joints if exposed to long weathering. The “roundability” of a particular mineral or rock fragment depends upon its hardness (softer grains rounding faster), and the cleavage or toughness (large grains with good cleavage tend to fracture rather than round; brittle pebbles like chert also tend to fracture readily whereas quartz pebbles will round). On the Colordado River, limestone pebbles attain their maximum roundness in only a few miles of transport and thereafter do not get any more rounded. Quartz also becomes well rounded but at a much slower rate, equalling the roundness of limestone after about 150 miles; chert shows only a slight increase in roundness in over 200 miles of transport. Coarser grains round easier than finer ones, because they hit with greater impact and also tend to roll along the surface while finer ones may be carried in suspension. Aeolian sands round faster than aqueous sands because the grains have a greater differential density in air, therefore hit harder; also they are not cushioned by a water film. In experiments by Kuenen, wind-blown quartz rounded much more rapidly than water-transported grains. Beach sands also round faster than river sands because on a beach the grains are rolled back and forth repeatedly. It is thought that little or no rounding of sand grains takes place in rivers; pebbles get rounded rapidly in rivers, however. To get rounded grains takes a tremendous time and a very large ependiture of energy. For example, the beach
I3

sands of the Gulf Coast show very little rounding taking place simply because the shoreline fluctuates so rapidly that time is not adequate. Balasz and Klein report rapid rounding in a “merry-go-round” tidal bar.
In studying roundness watch for two things: (I) an abnormal relation between roundness and mineral hardness, e.g. if tourmaline is round and softer hornblende is angular it means there is a multiple source area; and (2) an abnormal relation between size and rounding, e.g. if coarse grains are angular and fine ones are round it again usually means a multiple source with the angular grains being primary, the rounder ones coming from reworked sediments. Also, poor roundness sorting (i.e. within the same grade size there are both very rounded and very angular grains) indicates a multiple source. To determine how much rounding is taking place in the last site of deposition, look for the most angular grains; for example a sand consisting of 70% well rounded grains and 30Ggular grains indicates little or no rounded grains have simply been inherited from older sediments. Perhaps the I6 percentile of roundness is the best parameter to evaluate the present rate of rounding.
Effect of transportation on grain size and morphology. Transportation does reduce size of pebbles through chipping or rubbing and occasionally through fracturing; but it is thought that very little size reduction of sand-sized quartz is effected through transport. The differences in size between deposiisarexfly due to selective sorting (where the finer particles, which travel in almost ali curren-is, outrun the coarser particles, which can travel only in the strong currents), rather than to abrasion. Thus one cannot say that a very fine sand has been abraded longer than a fine sand: simply it has been carried farther or deposited by weaker curents. The effect of abrasion on sphericity of sand is slight but noticeable. Crushed quartz and many angular sands have W/L values of about .60-.64; very well rounded sands have W/L of over .70. Selective sorting will also produce form and sphericity differences between samples.
It can be certainly stated that abrasion does cause rounding of sand grains (albeit very slowly), and that it even more rapidly will produce polish. Thus the smallest order features are affected first: considering sand grains in water, starting initially with crushed quartz, the first thing that happens is that the grains become polished; after much more abrasion, they become rounded; after an extreme length of time they begin to attain higher sphericity values; and still later their size is reduced. Really these processes are all taking place at once, and the above list simply gives the rates at which these changes are being effected. Surface features and, secondarily, roundness are the important clues to the latest environment in which the sand was deposited; sphericity and form are the clues to the earliest environment in which the sand was formed, namely source rock.
I4