petroleum and liquid fuels charter final audit report€¦ · liquid fuels . charter . final audit...
TRANSCRIPT

PETROLEUM AND
LIQUID FUELS
CHARTER
FINAL AUDIT REPORT
5th August 2011
[This is a private and confidential report compiled by Moloto Solutions on behalf of the Department of Energy. It
may not be distributed to any other party except with the express and written permission of both the
Department of Energy and Moloto Solutions]
2
Foreword
2010 marked the 10th anniversary of the signing of the South African Petroleum and Liquid Fuels Charter (LFC), to provide the necessary framework for transformation of the Petroleum and Liquid Fuels Industry. The Petroleum and Liquid Fuels charter was the first empowerment charter to be crafted and signed in 2000, long before the BBBEE codes of good practice (COGP) were gazetted, in February 2007. In the intervening period there was an unwritten rule within the industry that (in the absence of clear targets and weights within the LFC) focus should rather go towards compliance with the COGP. This LFC audit report also coincides with the busiest time in the arena of empowerment legislation. The DTI (Department of Trade and Industry) has recently announced that that the very BBBEE codes are up for review to among others address the ambiguities, inconsistencies, and loopholes. The long awaited PPPFA regulations to bring the PPPFA in line with the COGP were also released on the 8th June 2011. About 6 Sector codes have also been gazetted, providing lessons of experience for such development by the DOE. The second phase, higher targets under the BBBEE codes are also meant to start operating next year. This confirms that our decision to not only try and measure all critical aspects of the charter (in spite of the challenge of objective targets for some), whilst also incorporating BBBEE measures where they made the most sense, but also probe key empowerment criteria not currently accommodated by either framework, was a prudent choice. This allowed us to cast the net of the review as widely as possible, ready for any eventuality in terms of the turn that the revised BBBEE codes take. It also provides the foundation for the development of a sector code or equivalent arrangement for the industry, which would ensure that all ideals of the charter are accommodated within a measurable, consistent framework. This approach has, however meant that some questions asked as part of this review had never been considered (and the related back-up information prepared) by the auditees. Some of the respondents rose to the challenge admirably, and some could, understandably, not generate the required information within the timeframe allowed by the audit, as they did not possess the required data and/or tools.
I thus thank the oil industry leaders for accommodating our requests and graciously hosting our teams for the interviews and the DOE for the trust placed in our team. Kate Moloto
CEO Moloto Solutions
3
No. Index Page No.
(i) Foreword
2
(ii) Index
3
(iii) Table of contents
4
(iv) List of tables and diagrams
7
(v) Definitions and Abbreviations
8
(vi) Layout of the report
10
(vii) Executive Summary 11
1. Terms of Reference 16
2. Legislative background 19
3. Comparison with BBBEE 26
4. Methodology and Approach 35
5. Process challenges and Mitigations 43
6. Quality of submissions 45
7. Findings By Element 47
8. Summary Audit Results 98
9. Value Chain & Other Financial Information 111
10. Access to Finance 114
11. Conclusions 117
12. Recommendations 129
13. Bibliography 138

4
No.
Table of Contents
Page No.
(i) Foreword 2
(ii) Index 3
(iii) Table of contents 4
(iv) List of tables and diagrams 7
(v) Definitions and Abbreviations 8
(vi) Layout of the report 10
(vii) Executive Summary 11
1. Terms of Reference 16
1.1 Terms of reference 16
1.2 Exclusions 16
1.3 Elements and requirements of the LFC 17
2. Legislative Background 19
2.1 The White Paper on the Energy Policy 19
2.2 Petroleum and Liquid Fuels Charter 20
2.3 Petroleum Products Amendment Act (58, 2003) 20
2.4 Amended Import Policy Gazette (Gazette no. 29328) 21
2.5 Petroleum Pipelines Act (60, 2003) 22
2.6 The Competition Acts 23
2.7 Preferential Procurement Policy Framework Act 5 of 2000 24
2.8 Other Important Legislation 24
3. Comparison with BBBEE 26
3.1 The Broad Black Economic Empowerment Act Framework 26
3.2 LFC Weaknesses 29
3.3 Oil Charter / BBBEE Codes Comparison table 30
3.4 Sector Code Process 30
4. Methodology and Approach 35
4.1 Objectives 35
4.2 Key Project timelines 35
4.3 Process Followed 36
4.4 Auditee details 36
4.5 List of interviewees 37
4.6 Measuring Period 38
4.7 The Scoring principles 38
4.8 The Scoring Legend Applied 41
5. Process Challenges and Mitigations 43
5.1 Challenges experienced and related mitigations 43
6. Quality of Submissions 45
7. Findings by Element 47
7.1 Ownership 47
7.1.1 Audit Summary results 47
7.1.2 Additional indicators 48
7.1.3 Key observations 48
7.1.3.1 Analysis of the ownership Indicators 48
7.1.3.2 Key Characteristics of the Deals 49
7.1.3.3 Observations on policies and strategies 50
5
7.2 Management Control 51
7.2.1 Audit Summary results 51
7.2.2 Additional Indicators w.r.t Directors 51
7.2.2.1 Executive/Non-Executive/Independent Status 51
7.2.2.2 Directors by Race and Gender 52
7.2.2.4 Analysis of the Director Statistics 52
7.2.3 Key Observations 53
7.3 Supportive Culture 54
7.3.1 Audit Summary results 54
7.3.2 Additional Indicators 55
7.3.3 Key Observations 55
7.4 Capacity Building 57
7.4.1 Audit summary results 57
7.4.2 Additional Indicators 58
7.4.3. Key Observations 58
7.4.3.1 Summary of Training Interventions 58
7.4.3.2 Capacity Building Interventions by Race and Gender 59
7.4.3.3 Details of Capacity Building Interventions 60
7.4.3.4 Analysis by Moloto Solutions 61
7.5 Employment Equity 63
7.5.1. Audit Summary Results 63
7.5.2 Summary of Employment Equity Profile 64
7.5.2.1 Race and Gender Split Summary Table 64
7.5.2.2 Race and Gender Split Summary Graph 65
7.5.2.3 Race and Gender Comparisons : A to E Levels 67
7.5.2.4 Executive Level Analysis 68
7.5.2.5 Management Responsibility 69
7.5.2.6 Budget Responsibility 70
7.5.2.7 Contrasting of HDSA participation levels 70
7.5.3 Key Observations 71
7.6 Procurement 73
7.6.1 Audit Summary Results 73
7.6.2 Additional Observations 74
7.6.2.1 Detailed Procurement Spend Analysis 74
7.6.2.2 HDSA procurement Spend as a % of Discretionary Spend 74
7.6.2.3 HDSA Procurement as a % of Total Procurement Spend 75
7.6.2.4 Crude Procurement 75
7.6.2.5 Spend Analysis from >50% HDSA Companies 75
7.6.3 Key Observations 77
7.7 Access to Joint Facilities and other Infrastructure 80
7.7.1 Audit Summary Results 80
7.7.2 Key Observations 80
7.8 Refining Capacity 83
7.8.1 Audit Summary Results 83
7.8.2 Key Observations 83
7.9 Retailing 85
7.9.1 Audit Summary Results 85
7.9.2 Additional Observations 86
7.9.3 Key Observations
88

6
7.10 Wholesaling 91
7.10.1 Audit Summary Results 91
7.10.2 Additional Indicators 91
7.10.3 Key Observations 92
7.11 Enterprise Development 95
7.11.1 Implemented Enterprise Development Initiatives 95
7.12 Socio-Economic development 96
8 Summary Audit Results 98
8.1 Preamble 98
8.2 Summary Results by Sub – Element 99
8.3 Summary of Results by Element 102
8.4 Analysis of the Overall LFC Results 103
8.5 Summary Comparison : LFC and BEE Results 104
8.6 Summary Results : 2006 Comparison 109
9 Value Chain Performance and other Financial Information 111
9.1 Objective 111
9.2 Share in Assets 111
9.3 Analysis of Financial Information 112
9.4 Share in Procurement Spend 112
9.5 Supply Side Information 114
10 Access to Finance 114
11. Conclusions 117
11.1 Ownership 117
11.2 Management Control 117
11.3 Employment Equity 118
11.4 Supportive Culture 118
11.5 Procurement 118
11.6 Capacity Building 119
11.7 Refining Capacity 119
11.8 Retailing 120
11.9 Access to Joint Facilities 120
11.10 Wholesaling 122
11.11 Enterprise Development 122
11.12 Access to Finance 123
11.13 Value Chain Performance 123
11.14 Progress since 2006 123
11.15 Overall Achievement and Progress 124
11.16 B-BBEE 125
11.17 Impact Analysis 127
11.18 Reporting, Monitoring and Evaluation 128

7
12. Recommendations 129
12.1. Ownership 130
12.2 Management Control 130
12.3 Supportive Culture 131
12.4 Employment Equity 131
12.5 Capacity Building 132
12.6 Procurement 133
12.7 Access to Joint Facilities and Other Infrastructure 133
12.8 Refining Capacity 134
12.9 Retailing 134
12.10 Wholesaling 134
12.11 Enterprise Development 135
12.12 Access to Finance 135
12.13 Legislation 136
12.14 Reporting, Monitoring and Evaluation 136
12.15 Sector Code Recommendation 137
13 Bibliography 138
8
Reference List of figures Page No. Chapter 4 Methodology and approach 35
4.1 Key Project Timelines 36
4.2 Process Followed 37
4.3 Auditee Details 38
4.4 List of Interviewees 38
4.5 Liquid Fuels Charter Scoring Table 40
4.6 Scoring Legend Applied 42
Chapter 5 Challenges and Mitigations 44
5.1 Challenges Experienced 44
Chapter 6 Quality of Submission 46
6.1 Quality of Submissions 46
Chapter 7 Findings by Element 48
7.1 - Ownership Additional Ownership Indicators 49
7.2 BEE Consortium Introduction 50
7.3 – Management Control Total Directors By Race and Gender 52
7.4 Analysis of the Director Statistics 53
7.5- Capacity Building Summary of Training Interventions 59
7.6 Capacity Building initiatives by Race and by Gender 60
7.7– Employment Equity Staff Summary 66
7.8 Companies : A to E Levels 68
7.9 Executives and Top Management by Race & Gender 69
7.10 Management Responsibility 70
7.11 Budget Allocations 71
7.12- Procurement Detailed Procurement Spend By Service 75
7.13 Procurement Spend from >50% HDSA’s 77
7.14 Procurement Reconciliation Summary 78
7.15- Access to joint Refinery Capacity 85
7.16 Retailing Company Owned Retail Landscape by Race 87
7.17 Dealer Owned Retail Landscape By Race 88
7.18 – Enterprise Development ED Initiatives 96
Chapter 8 Summary Audit Results 99
8.1 LFC Audit Scoring Principles 100
8.2 Spread of Sub Element Responses 101
8.3 Response Table 101
8.4 Overall LFC Audit Results % 102
8.5 Summary Results by Element 103
8.6 BEE/LFC Ranking Comparison 105
8.7 BEE and LFC Top Performers 106
8.8 BEE and LFC Lowest Performers 106
8.9 LFC Results Comparison 2006-2011 110
Chapter 9 Value Chain Performance and other Financial Information 112
9.1 Value Chain Participation 118
Chapter 10 Access to finance 115
10.1 Access to Finance 115
Chapter 11 Conclusions 118
11.1 Overall Achievement and Progress 124
11.2 B-BBEE influence 125

9
DEFINITIONS AND ABBREVIATIONS
Assignees-Out/Secondees Employees who are South African by birth or descent, who have been assigned on a short term basis to operations which are outside the country.
Black People Natural persons who are citizens of the Republic of South Africa by birth or descent; or are citizens of the Republic of South Africa by naturalizations:
a) Occurring before the commencement date of the constitution of the Republic of South Africa Act of 1993 or
b) Occurring after the commencement date of the Constitution of the Republic of South Africa Act of 1993 but whom, without the Apartheid policy would have qualified for naturalization before then.
Business Entity / Type of Operation
The specific area of operation indicating the core business of the entity pertaining to the petroleum and liquid fuels value chain (i.e. Exploration, Extraction, Transportation, Refining, Supply and Trading, Marketing and Distribution)
Challenges Any major stumbling blocks resulting in the operation not meeting or achieving set targets or objectives
Contractors Any employees not employed on a full time basis by your organisation but are provided through a third party and work on a contract basis for an extended period. This includes workers employed for ad-hoc services on a need basis.
Compliance Measures whether or not there is some level of performance, no matter how low, where no minimum target is specified by the charter OR the performance level against the minimum level of performance specified where this has been done e.g. Ownership and Management Control.
Core Skills These are value adding to the activities of the measured entity in line with its core business, in areas the measured entity cannot outsource or within the production/ operational part of the measured entity’s value chain as opposed to the supply side, services or downstream operations
DoE Department of Energy
Element The 13 LFC headings, representing the quantitative or qualitative, specific requirements of the LFC. Most of these are closely aligned to the 7 elements of BBBEE.
Exercisable Voting Rights Exercisable Voting rights means a voting right of a participant that is not subject to any limit.
Governing Body Board of Directors or any other committee responsible for the oversight management and not the daily operational management of the business entity / enterprise.
HDSA Any person, category of persons or community, disadvantaged by unfair discrimination before the Constitution of the Republic of South Africa, 1993 (Act No. 200 of 1993) came into operation. The term Historically Disadvantaged South Africans (HDSA) refers to all persons and groups who have been discriminated against on the basis of race, gender and disability.
LFC The Petroleum and Liquid Fuels Charter
Net Value The value of the part of the business that the HDSA shareholder own, less any outstanding financial obligations ( including the capitalized/ accumulated interest) that financed the purchase of his/ her share of the business, as a

10
percentage of the current value of the company.
NSA Non-South African Citizens
Operating Assets These are long-lived assets that are used in normal business operations. They are not held for resale to customers. There are three major categories of operating assets: property, plant, and equipment, sometimes referred to as plant assets or fixed assets; natural resources; and intangible assets.
Other Top Management Means employees of a measured entity who are members of occupation category of Top Management as determined using EE Regulations who:
a) Are appointed by or on the authority of the Board, are operationally involved to undertake the day to day management of that business,
b) Have individual responsibility for their particular areas of responsibility within the business,
c) Are actively involved in developing and or implementing the businesses’ strategy insofar as it relates to their particular area of responsibility.
Ownership Ownership refers to equity participation and the ability to exercise rights and obligations that accrue under such ownership. Recognizes and measures the entitlement of black people to the voting rights and economic interest associated with equity holding.
Performance Level Gauges the level of performance against either the specified target or the maximum possible performance level (usually 100%).
Priority Skills Specific “top-up” skills required for performance within that occupation to fill a “skills gap” that might have arisen as a result of changing technology or new forms of work organisation
Race BCIW Indication of race or population group, either B-Black, C-Coloured, I-Indian, W-White
Scarce Skills Refers to those occupations characterised by a scarcity of qualified and experienced people (current and anticipated)
Senior Top Management Means employees of a measured entity who are members of occupation category of Top Management as determined using EE Regulations who:
d) Are appointed by or on the authority of the Board, are operationally involved to undertake the day to day management of that business,
e) Have individual responsibility for the overall management and for the financial management of that measured entity,
f) Are actively involved in developing and implementing the entity’s overall strategy.
Sub-element The detailed requirements or compliance indicators of each of the LFC elements, representing the quantitative or qualitative, specific indicators of compliance with each element.
Voting rights Means the control of the Enterprise, through the exercise of voting rights at shareholders meeting.

11
Report Layout
Executive Summary - provides a high level summary of the key aspects of the report. Chapter 1 - Terms of Reference – outlines the terms of reference as well as other significant considerations taken into account during the LFC audit. Chapter 2 - Legislative Background – outlines the background of the legislative and policy framework that governs the LFC. . Chapter 3 - Comparison with BBBEE – provides a comparison and outline of the synergies between the Petroleum and Liquid Fuels Charter and the BBBEE Codes of Good Practice.
Chapter 4 - Approach and Methodology – outlines the approach and methodology followed during the audit process. Chapter 5 - Process Challenges - provides an account of the challenges experienced during the course of the LFC Audit and how the related challenges were addressed and resolved.
Chapter 6 - Quality of Submissions – outlines the quality and completeness of the submissions from the oil companies and the overall impact thereof on the audit results. Chapter 7 - Results and Findings by Element – provides a detailed account of compliance to each specific element and findings from company submissions, site visits and other industry stakeholders. The element reports cover: Key LFC percentages, LFC sub-elements compliance status, 2006/11 Audit results comparison, Additional element indicators and Key observations. Chapter 8 – Audit Results – outlines a summary of all the audit results on the status of transformation of the industry as well as the overall compliance status of the industry with the LFC. It also contrasts the charter results with BBBEE results of the auditees and the 2006 results, to the extent possible. Chapter 9 - Value Chain and other financial information – sets out the performance in terms of asset base and activity levels of each value chain segment. Chapter 10 – Access to funding – provides a summary of findings on funding opportunities afforded industry players. Chapter 11 – Conclusions – provide a synopsis of the status quo and key findings.
Chapter 12 - Recommendations – provides all recommendations, legislation / policy considerations, critical success factors and key action steps recommended towards the DOE and the industry.
12
EXECUTIVE SUMMARY
Introduction
The DOE commissioned an assessment of the extent of compliance with and the contribution and impact of the LFC, as an effective tool for transformation during its 10 year existence.
Scoring principles
We have endeavoured to take into account concerns of auditing a charter with broad objectives and
little by way of specific targets - through the development of a comprehensive interpretive guide
(scoring principles) to ensure a reasonable amount of objectivity of the audit process.
Scoring legend
The scoring principles applied during the audit were based on 6 possible compliance levels i.e. Yes, Not Applicable, High, Medium , Low and No - taking into account absolute compliance to a particular sub-element, to partial compliance with some aspects still outstanding, no compliance at all where the sub element’s requirements have not been fulfilled at all by the particular oil company. We have also converted this simple scoring method to numerical values so as to better distinguish and rank average performance levels of the elements and sub-elements as follows: Yes, N/A, High, Medium,
Low, Unknown and No = 5 /5 /4 /2.5 /1.5 /0 and 0 respectively.
Legislative Framework
Key legislation, apart from the LFC, to be borne in mind in the charter review includes the following:
The White Paper on Energy Policy
Petroleum and Liquid Fuels Charter
Petroleum Products Amendment Act (58, 2003)
Amended Import Policy Gazette (Gazette no. 29328)
Petroleum Pipelines Act (60, 2003)
The Competition Act (89, 1998), amended Act (35, 1999), subsequent amendments Act (15 of 2000); Act (39, 2000)
Preferential Procurement Policy Framework Act 5 of 2000
The Broad Based Black Economic Empowerment Act
Linkage with BBBEE Codes
The LFC and the BBBEE codes of good practice have notable synergies as both sought to achieve the
same objective, of the advancement of HDSA’s, to facilitate their equitable participation in the economy
of the country.
13
Both frame-works, however, have shortcomings, - the LFC lacks uniform measurability, and the COGP do
not embrace certain key sectoral imperatives.
Approach and Methodology
The approach followed was two-fold viz: firstly performing a full audit of the 7 oil majors as signatories
of the charter - which entailed companies submitting questionnaires, accompanied by documentary
evidence (of the progress and status of transformation), followed by visiting the various operations to
corroborate the company submissions. The second aspect involved consultative sessions with other
critical industry players to obtain their perspective of achievements, challenges, lessons learnt and
recommendations for enhancing transformation initiatives in the industry.
The results are in 3 categories – (1) a report on strict compliance with the LFC, at element and sub-
element level, (2) a short synopsis of how the companies fared on BBBEE, and (3) a number of other key
measures, not accommodated by either framework, (and not scored in terms of key LFC compliance)
that are key to understanding the transformation extent of the industry.
Quality of Submissions
During the process of collating data and conducting site visits, challenges were encountered which
mostly centred on delays and the unavailability of sufficient accurate information making it difficult to
make a conclusive assessment and analysis.
The areas with the most incomplete information were with regard to financial information (on the net
book value of assets, value of hydrocarbon stock, turnover and operating profits per value chain and in
total); procurement spend on HDSA’s by service category and value chain segment; wholesaling
information especially purchases; as well as the racial, categorical and geographical split on retail for
some companies. The dearth of information on access to facilities and refineries and import wholesalers
was expected due to the general lack of activity in this area.
The quality of the submissions determines the credibility and integrity that can be ascribed to the audit
results. Overall, the quality ranged from an estimated 55% to about 90% per company.
In the end Moloto Solutions improvised and used the available information, with intermittent
qualification of results, where deemed necessary.

14
Summary Audit Results
The performance at sub-element level yielded only 19 % outright “Yes” (full compliance) answers.
The average performance level using a semi-scientific basis is 48% of the LFC requirements, whilst the
overall compliance level is 62%.
The performance rate on BBBEE requirements is 70%.
The Top 4 sub elements that scored a “Yes” are Ownership and Procurement related. The top 6 worst
performing requirements, scoring an overall “no” are related to the three worst performing elements,
being Capacity Building, EE targets and Access to Infrastructure.
The two top performing elements in terms of the LFC were Management Control and Ownership, whilst
the worst performing elements were Enterprise Development, Skills Development and Employment
Equity.
The overall average compliance level with each (sub) element is 3.5 out of 7 companies.
The results are very similar to the BEE ones in terms of the worst performing elements, where-in Skills
Development and Employment Equity scored lowest. The top performing element in both frameworks is
Management Control.
The major difference between the LFC and BEE results is w.r.t. Enterprise Development. It is the worst
performing element with the LFC; yet was second place under BEE.
All scores improved significantly since 2006 because of the time lag. However, the following four
indicators have worryingly decreased: Supportive Culture: Full time Executive Director Level; Capacity
Building: Total skills spend on HDSA , percentage spend on HDSA’S and learnerships; Employment
Equity: Semi Skilled and Unskilled black people and Retailing.
Value Chain Performance
Ownership across the value chain follows on the overall ownership deals and is thus 18.91%. Exploration and Production is however 0% as it is either separately incorporated or based outside the country. The value chain stages with the highest spend from HDSAs are: Transport, followed by Supply and Trading.
On the supply side the HDSA Retail percentage is 40% and wholesaling 33%.

15
Access to funding
Access to affordable and practical financing mechanisms is a major issue for retailers and wholesalers, in
terms of cost and accessibility to credit and own contribution requirements. Local banks lack expertise
to effectively service the wholesale market.
Final Conclusions
The results indicate that technical skills transfer to HDSA’s at all levels suffered the most set-back during
the past 10 years. The highest scoring areas are the quickest to remedy and involve a narrow base of
beneficiaries, whereas the laggers generally take long to set up and implement – yet they have wider
reach.
The focus on BEE has been detrimental to some of the key LFC requirements, especially in Enterprise
Development. The performance rate gap between the two frameworks is 22% (70% vs 48%).
Apart from the LFC, there are also key legislation enforcement issues that need to be attended to by the
DoE to ensure opening up of the opportunities for particularly black entrepreneurs.
Recommendations
The key recommendation is that the department facilitate the development of a sector code in line with
the BEE framework or a process that could achieve similar objectives, taking into account the expected
changes to the BBBEE codes. This will ensure not only measurability but will accommodate the key
tenets of the current charter that cannot be accommodated in the generic codes while taking into
account the recommended biases per sub-element as stated in the report.
16

17
1. TERMS OF REFERENCE
1.1 Terms of Reference
In November 2010 The DOE commissioned an audit to assess the extent of compliance with the LFC by the oil majors as well as the contribution and impact of the LFC, as an effective tool for transformation during its 10 year existence. This required a comprehensive audit focused on the LFC signatories. The recommendations contained in the audit report, would help develop an empowerment measurement framework for the Petroleum and Liquid Fuels Sector, as well as improve future interventions that will enable the Department of Energy to fast track petroleum industry transformation across the value chain. This report will then also form the basis of a review of the Charter going forward and related Monitoring and Evaluation framework.
1.2 Exclusions
The report does not specifically cover initiatives / progress made by the oil companies after 30th
October 2010 the following, reference to which is only incidental:
Price-sensitive information has been avoided as much as possible in the probes and the report
itself, to avoid falling foul of the Competition Act.

18
1.3. Elements and requirements of the LFC
The different elements of the Petroleum and Liquid Fuels Charter pertaining to the Private Sector are
outlined in the table below:
OIL CHARTER SUBELEMENTS
No. Element Charter Sub-Elements
1. Ownership (From preamble / interpretation)
25% ownership and control of entity that holds the SA operating assets of the Oil company.
HDSA ownership to apply to all segments of the Value Chain
Sustainable presence/Sustainability through medium to long term viability.
2. Management Control Control of the entity through majority shareholding, effective controlling shareholding or majority of board of directors.
3. Supportive Culture
Appointment of managers to create a supportive culture and enabling environment for business success
Appointing appropriate managers who will understand the spirit and background of the charter policies
Fostering of a supportive culture w.r.t all aspects of this Charter when dealing with HDSA’s
Incorporating culture change policies in business principles.
4. Capacity Building Training of HDSA employees on core, priority and scarce skills
Overseas training programs for HDSA’s
Identifying a talent pool & fast tracking it
Implementing mentorship programs
Annual progress reports in agreed format
5. Employment Equity
Publishing of equity stretch targets and achievements
Ensuring inclusiveness of gender
6. Private Sector Procurement
Supportive procurement policies - Towards growth of HDSA companies - With criteria that favour HDSA companies
Scope of preferential procurement to include all supplies (including crude)
List of HDSA suppliers
Vessels used in the transportation of supplies/products to meet all prescribed health, safety and environmental standards
7. Access to joint facilities
Fair ownership opportunities
Non-discriminatory access to uncommitted capacity for the movement and storage of crude oil and petroleum products
8. Refining Capacity Selling shares in the refinery to HDSAs
Making refining capacity available to HDSA companies, thru , e.g. toll refining agreements
Providing JV opportunities by including HDSA’s in expansion/upgrade programmes
9. Retailing Fair opportunities for entry to the retail network
10. Wholesaling Fair opportunity for entry into wholesale / commercial sectors
11. Financing Investigation and implementation of internal and external financing mechanisms for giving HDSA’s access to equity ownership and entry into viable strategic partnerships.
12. Terms of Credit Providing terms of credit to HDSA customers (e.g. retailers and client wholesalers)
13. Synfuels Supply Parties to accommodate HDSA’s, which lack the facilities to comply fully, in the fairest way possible
19

20
2. LEGISLATIVE BACKGROUND
The legislative framework is considered in light of the legislative mandate for the effective
transformation of the energy sector, to amongst others result in effective governance that will
facilitate economic growth and development, thereby improving the quality of life of all the citizens
of South Africa; leaving a good legacy for generations to come.
The following are the key legislations in the area of empowerment in the energy sector:
2.1. The White Paper on Energy Policy
The White Paper on Energy Policy emphasises the empowerment of the historically disadvantaged South Africans (HDSA) in the liquid fuels industry. The policy acknowledges that one of the challenges facing the South African liquid fuels industry is restructuring/transformation to include HDSA’s in all facets of the industry. The Policy states that the “Policy challenges for the South African liquid fuels industry include the need to achieve: “The meaningful inclusion of those interests which have been historically disadvantaged” – section 7.4.2.

21
The Policy further highlights the need for the restructuring of the liquid fuels industry in section 7.4.4: “The cornerstones of the future policy framework will thus be:- Black economic empowerment reflected in the composition of the industry at all levels and significant domestic black ownership or control in all facets of the industry” The Liquid Fuels Charter makes reference to the White Paper on Energy Policy paying particular attention to the policy objective to achieve “The sustainable presence, ownership or control by historically disadvantaged South Africans of approximately a quarter of all facets of the liquid fuels industry or plans to achieve this”.
2.2. Petroleum and Liquid Fuels Charter The White Paper contains the following key provisions w.r.t. the LFC: “The first phase of the process will allow for interim adjustments to fuel price mechanisms and settling of over/under-recovery accounts with the oil industry. It will also create opportunities for the negotiation of intra-industry agreements, such as upliftment and market access agreements for synthetic fuels. During this phase mechanisms will be put into place to ameliorate any negative impact on employment opportunities as a result of the restructuring process. This phase will also allow the state to pursue the restructuring of its assets within the liquid fuels sector”. Key milestone to be achieved in the first phase will be: - “The sustainable presence, ownership or control by historically disadvantaged South Africans of approximately a quarter of all facets of the liquid fuels industry or plans to achieve this”. The Charter interpretation/definition of ownership and control by HDSA’s should be reviewed e.g. (b) “An effective controlling shareholding” and (e) “A shareholders agreement”, as some of the ways of achieving control of a business.
2.3. Petroleum Products Amendment Act (58, 2003) In 2005 the liquid fuels industry supply chain (from refining to retailing) was licensed for the first time. The licensing framework is provided for in the Petroleum Products Amendment Act 2003, Act (administered by the Department of Energy) as follows:
Promoting an efficient manufacturing, wholesaling and retailing petroleum industry;
Facilitating an environment conducive to efficient and commercially justifiable investment;
Promoting the advancement of historically disadvantaged individuals; and
Creating employment opportunities and small businesses in the petroleum sector The act emphasises the promotion of transformation, including the empowerment of HDSA’s (which is the main guiding principle of the Petroleum and Liquid Fuels Charter), in the South African petroleum and liquid fuels industry. In order to promote the Charter objectives the Act has been

22
amended to include the definition of the Charter. The Charter was also appended as Schedule 1 in the Act. The Act supports the Charter in terms of the license application procedure. It states that: “In considering license applications in terms of this Act, the Controller of Petroleum Products shall – Promote the advancement of historically disadvantaged South Africans; and give effect to the Charter”. It further states that: “The Controller of Petroleum Products may require any category of license holder to furnish information, as prescribed, in respect of the implementation of the Charter”.
Section 12A of the principal Act was substituted, to cater for HDSA’s as follows: Regulations 12C
(1) The Minister may, without derogating from his or her general regulatory powers, make regulations – (a) Regarding manufacturing, wholesale, site or retail licenses, including –
(v) conditions of license which may be imposed by the Controller of Petroleum Products in respect of a particular license or a category of licenses, including – (bb) conditions relating to the advancement of historically disadvantaged South Africans.
The Act is therefore explicit in terms of advancing HDSA’s. It provides clear guidelines for promoting the empowerment of HDSA’s across the value chain in the petroleum industry.
2.4. Amended Import Policy Gazette (Gazette no. 29328)
Government notice 1069: Guidelines governing the recommendation by the Department of Minerals and Energy to the International Trade Administration Commission in respect of the Importation and Exportation of crude oil, petroleum products and blending components – 3 November 2006. The guidelines for the importation of crude oil, petroleum products and blending components state that “Only licensed manufacturers and licensed HDSA wholesalers may apply for a recommendation to import petroleum products or blending components unless elsewhere specified in these Guidelines. Provided that a licensed manufacturer may be permitted to import blending components and only the types of petroleum products specified in the manufacturing license”. The guidelines also state that “Only licensed manufacturers and licensed HDSA wholesalers may apply for a recommendation to import jet fuel unless elsewhere specified in these guidelines, provided that any commercial airline company or representative thereof may apply for a recommendation to import jet fuel for their own consumption”.
23
2.5. Petroleum Pipelines Act (60, 2003)
The National Energy Regulator of South Africa (NERSA) is responsible for the regulation of this Act. Their responsibilities include the following:
Licensing the construction, operation and conversion of petroleum pipelines, storage facilities and loading facilities;
Gathering and storing of information relating to these activities;
Undertaking investigations into these activities; and
Setting and approving tariffs in a manner prescribed.
In the context of the empowerment of historically disadvantaged South Africans (HDSA’s) the Petroleum Pipelines Act promotes the participation of HDSA’s in the oil industry facilities in terms of access, ownership, control and management/operation. The facilities that the Act focuses on are petroleum pipelines, loading facilities and storage facilities. The Act states that an interested party who wishes to construct and operate any of the above facilities must apply to NERSA for a license. As stated in the Act, one of its objectives is to: “promote companies in the petroleum pipeline industry that are owned or controlled by historically disadvantaged South Africans, by means of license conditions to enable them to become competitive”.
Access to oil industry logistics facilities continues to be a challenge especially for HDSA’s. However, the Act makes provisions to facilitate access by HDSA’s and also to ensure the conditions of a license encourage the participation of HDSA’s in the oil sector. According to the Act, the requirements for the conditions of a license are “to promote historically disadvantaged South Africans, in the manner prescribed” and that “licensees must provide the prescribed information to the authority on the commercial arrangements regarding the participation of historically disadvantaged South Africans in the licensees’ activities.
The Regulations in terms of the Act in relation to access to and construction and operation of the abovementioned facilities address the following:
Regulation 2 - Conditions of license: to be read in conjunction with Section 20 of the Act
Regulation 3 - Third party access to storage facilities: to be read in conjunction with section 20 (1) (k) and (n) and section 21 of the Act
Regulation 4 – Setting of tariffs for petroleum pipelines
Regulation 5 - Approval of tariffs for loading and storage facilities: to be read in conjunction with Section 28 of the Act
Regulation 6 - Rendering of information to authority
Regulation 7 - Expropriation procedures and timelines. To be read in conjunction with section 32 of the Act
Regulation 8 - Mechanisms to promote Historically Disadvantaged South Africans: section 20 (1) (b) and (d) of the Act
Regulation 9 - Rehabilitation of land
Regulation 10 - Liaison between licensees and local authorities

24
Regulation 11 - Fair administrative action
Regulation 12 - Mediation
Regulation 13 - Arbitration
Regulation 14 - Mediation and arbitration fee.
2.6. The Competition Act (89, 1998), amended Act (35, 1999), subsequent amendments Act (15 of 2000); Act (39, 2000)
The Act makes provisions for the Competition Commission to exempt HDSA companies from certain “prohibited practices” that lessen or prevent competition in the market such as horizontal (e.g. collusive tendering and price fixing) and vertical (e.g. the practice of minimum resale pricing) relationships. The HDSA companies may also be exempted from abuse of dominance in the market e.g. charging excessive prices.
Part C of the Act deals with exemptions from application of chapter 2 - Prohibited Practices (e.g. abuse of dominant position by a firm and restrictive practices). The companies which may otherwise be prohibited to engage in certain practices in terms of the Act may be exempted if such practices are meant for HDSA companies to be competitive.
The Act states that: “The Competition Commission may grant an exemption in terms of subsection (2)(a) only if – the agreement or practice concerned, or category of agreements or practices concerned, contributes to any of the following objectives: promotion of the ability of small businesses, or firms controlled or owned by historically disadvantaged persons, to become competitive”. The purpose of the Act with regards to HDSA’s is: “to promote and maintain competition in the Republic in order to promote a greater spread of ownership, in particular to increase the ownership stakes of historically disadvantaged persons”. The HDSA in this Act is defined as follows: “a person is a historically disadvantaged person if that person -
(a) is one of a category of individuals who, before the Constitution of the Republic of South Africa, 1993 (Act No. 200 of 1993), came into operation, were disadvantaged by unfair discrimination on the basis of race;
(b) is an association, a majority of whose members are individuals referred to in paragraph (a);
(c) is a juristic person other than an association, and individuals referred to in paragraph (a) own and control a majority of its issued share capital or members’ interest and are able to control a majority of its votes; or
(d) is a juristic person or association, and persons referred to in paragraph (a), (b) or (c) own and control a majority of its issued share capital or members’ interest and are able to control a majority of its votes”.
NB: Please note that white women are not part of this definition

25
2.7. Preferential Procurement Policy Framework Act 5 of 2000
The purpose of the Act is “To give effect to section 217 (3) of the Constitution by providing a framework for the implementation of the procurement policy contemplated in section 217 (2) of the Constitution…” However, section 217 (which deals with Procurement) is applicable to the organs of state only – it is silent on the private sector. Section 2 of the Act deals with the “Framework for implementation of preferential procurement policy” and does make reference to the advancement of HDSA’s. It is also applicable to organs of state only. The final Preferential Procurement Regulations, (2011) were gazetted on the 8th June 2011. The aim there-of is “to ensure that Government’s preferential procurement procedures are aligned with the aims of the BBBEE Act, 2003 and associated Codes of Good Practice”. However, these regulations are not applicable to the private sector.
2.8. Other Important Legislation
Other legislation to be taken into consideration during the audit include:
The BBBEE Act 52 (2003)
The Constitution of S.A. Act 108 (1996)
The Employment Equity Act 55 (1998)
The Integrated Energy Plan (2003)
The MPRD Act 28 (2002)
The National Efficiency Energy Strategy (2009)
The National Energy Act 34 (2008)
The Skills Development Act 97 (1998)

26

27
3. COMPARISON WITH BBBEE
3.1 The Broad Based Black Economic Empowerment Act Framework
The BBBEE Act aim to redress the inequalities of the past. The main objectives are to:
Increase broad based and effective participation of black people in the economy
Promote economic growth
Create more employment
Ensure distribution of income is more equitable. The diagram below depicts the targeted beneficiaries of each BBBEE element, and envisaged tools (elements) for their empowerment:
Source: DTI
5 The Poverty Barrier
The Skills Barrier
The Business Barrier
The Opportunity Barrier
Employment Equity/Job creation
Corporate Social Investment
Skills Development & Employment Equity
Affirmative Procurement
Ownership And Management
Equitable Economic Opportunities
Enterprise Development
Emerging Black Middle class & Investors
Black Entrepreneurs
Black Workers and Job - Seekers
Black Unemployed & Rural Poor
BROAD BASED BENEFICIARY BASE

28
The objectives of this Act, as depicted in the diagram above, are to facilitate broad-based black economic empowerment by-
promoting economic transformation in order to enable meaningful participation of black people in the economy;
achieving a substantial change in the racial composition of ownership and management structures and in the skilled occupations of existing and new enterprises;
increasing the extent to which communities, workers, cooperatives and other collective enterprises own and manage existing and new enterprises and increasing their access to economic activities, infrastructure and skills training;
increasing the extent to which black women own and manage existing and new enterprises, and increasing their access to economic activities, infrastructure and skills training;
promoting investment programmes that lead to broad-based and meaningful participation in the economy by black people in order to achieve sustainable development and general prosperity;
empowering rural and local communities by enabling access to economic activities, land, infrastructure, ownership and skills; and
promoting access to finance for black economic empowerment.
The Codes of good practice are explicit in terms of black women empowerment. The Act states
that: “In order to promote the achievement of equality of women, as provided for in section 9(2)
of the Constitution, a code of good practice issued in terms of subsection (1) and any targets
specified in a code of good practice in terms of subsection (3), may distinguish between black men
and black women”.
Codes of good practice on BBBEE gazetted on 9th Feb 2007 are binding on all organs of state and
public entities. Private sector enterprises must apply the COGP should they wish to interact with
organs of state and public entities e.g. tendering for business, applying for licenses and
concessions, entering into PPP’s and purchasing state owned assets.
Below is the generic scorecard of the BBBEE codes, depicting the weightings and compliance
targets of each element:

29
The Generic Scorecard
Element WeightingCompliance
Targets
Ownership 20 points 25% +1
Management control 10 points (40% to 50%)
Employment Equity 15 points (43% to 80%)
Skills Development 15 points 3% of payroll
Preferential Procurement 20 points 70%
Enterprise Development 15 points 3% (NPAT)
Socio-Economic Development 5 points 1% (NPAT)
TOTAL 100 points
The BBBEE status of companies will be recognised based on the status table below.
The Contribution Levels:
BEE Recognition Level
135% (e.g. R1 = R1.35)
1255
110%
100% (e.g. R1 = R1)
80%
60%
50%
10%
0% (e.g. R1 = R0)
It is planned and envisaged that customers (public and private sector) will prefer to interact and procure
from companies with higher BEE status (to enhance their own BBBEE recognition status).
Level BEE Score
1 100
2 85 - 100
3 75 - 85
4 65 - 75
5 55 - 65
6 45 - 55
7 40 - 45
8 30 - 40
Not Compliant < 30

30
3.2 LFC Weaknesses
The LFC thus lacks the following, as compared to the BBBEE framework:
Weights (is it not clear which requirements carry more weight and should thus to be prioritized
by companies).
Targets (there are no clear compliance targets for all elements except ownership).
Categories / indicators (there are no measurable indicators for some elements, e.g. on EE).
Broad Base (the LFC is biased towards ownership and enterprise development).
It should, however be noted that the LFC has a number of key requirements to underpin transformation
in the sector, that are not accommodated in the generic codes of good practice, e.g.:
Crude procurement
Specific ED initiatives – e.g. access to joint facilities for HDSA wholesalers.
However, the DTI codes are also up for review because of some weaknesses – including inconsistencies,
clarification gaps, loop-holes, and unintended (unforeseen) consequences.
3.3 Oil Charter / BBBEE Codes Comparison
Although the Petroleum and Liquid Fuels’ Charter was signed 7 years prior to the BBBEE codes being
effected, a brief comparison with the BBBEE generic codes indicates that there has always been
consistency in the governments’ objectives and intended focus areas for transformation and
advancement of HDSA’s.

31
The following diagram depicts how the charter sub-elements correspond with the 7 elements of the
BBBEE codes:
OIL CHARTER /BBBE CODES COMPARISON
LFC ELEMENT BBBEE ELEMENT
Ownership Ownership
Management Control Management Control
Supportive Culture N/A
Capacity Building Skills Development
Employment Equity Employment Equity
Skills Development
Private Sector Procurement Preferential Procurement
Enterprise Development
Access to Joint Facilities Ownership Procurement Enterprise Development
Refining Capacity Ownership
Procurement
Enterprise Development
Retailing Enterprise Development
Wholesaling Procurement
Enterprise Development
Financing Ownership
Enterprise Development
Procurement
Terms of Credit Enterprise Development
Synfuels Supply Ownership
Enterprise Development
3.4 Sector Code Process All industries that wish to have their sector charters gazetted as sector codes are required to align these with the BBBEE generic codes.

32
3.4.1 Sector code process summary
Here-under are summarized extracts from the Codes of Good Practice regarding the development of sector codes and charters.
The issues are covered below under the following headings
Procedure for developing and gazetting of Transformation Charters
Procedure for developing and gazetting of Sector Codes
Principles to developing Sector Codes:
Status of Transformation Charters and Sector Codes
Recommended Model for Development of Transformation Charters
Matters needing consideration
Recommended model for developing a Transformation Charter:
Recommended Consulting Process, Representatives and Stakeholders identification.
The Role of the Charter Council
Variation of Indicators in Codes 200 and 300
3.4.2 Procedure for developing and gazetting of Transformation Charters
The representative body of a sector seeking to gazette a Transformation charter under section 12 must:
apply in writing to the Minister (of Trade and Industry) and
provide evidence of compliance with section 12 of the Act.
The Minister may refuse an application to gazette a Transformation Charter if the applicant has failed to comply with section12 of the Act
3.4.3 Procedure for developing and gazetting of Sector Codes
The following principles apply to developing Sector Codes: There must be common commercial and other characteristics within the entities operating in
the sector which would make it feasible to formulate a transformation charter subject to the proposed Sector Code:
the proposed Sector Code must fully address all the Elements in the Generic Scorecard.
the proposed sector code must use the same definitions in respect of all beneficiaries as those used in the Codes:
the proposed Sector Code must use the same calculation methodologies to measure compliance as those used in the Codes:
the proposed Sector Code may deviate from Targets and Weightings used in the Codes only where those deviations are justifiable based on sound economic principles, sectoral characteristics or empirical research

33
the proposed Sector Code may introduce a new additional; Element for measurement where such additional is justifiable based on sound economic principles, sectoral characteristics or empirical research:
The Proposed Sector Code must clearly define its scope of application:
3.4.4 Status of Transformation Charters and Sector Codes
A Sector Code enjoys equal status to any other Code.
3.4.5 Recommended Model for Development of Transformation Charters
The following represents the matters needing consideration by sectors developing a Transformation Charter for gazetting under section 12 of the Act.
The sector seeking to gazette their Transformation Charter should interact or transact with the organs of state or public entities.
There should be common commercial and other characteristics within the entities forming part of the proposed sector.
The sector should be significant having regard to:
The national strategic importance of the sector as determined by government: and
the volume and value of transactions taking place between the sector and organs of state or public entities collectively – this is measurable by reference to the total volume and value of transactions taking place within the sector.
The following represents a recommended model for developing a Transformation Charter:
Public Proclamation of Charter: there must be a public proclamation of the object of developing a Transformation Charter.
Setting of Charter Mandate: the initiators of the Charter process propose setting the mandate of the Charter and the charter’s overall objectives. These initiators should then present a proposed mandate for the Charter, to relevant shareholders for consideration and comment. The final mandate of the Charter must reflect the concerns and needs of the Stakeholders.
Appointment of a steering committee: The initiators of the Charter process appoint a steering committee. This steering committee should represent relevant groups of stakeholders and should consist of senior and influential members of entities, organizations and departments in the sector.
Appointment of relevant Working Groups: the steering committee appoints several working groups to aid in drafting the Charter. Element specific working group are desirable.
First Draft: based on recommendations by appointed Working Groups, the Steering Committee must compile the first draft of the Charter for presentation to stakeholders.
Consultation with Stakeholders: the Steering committee will communicate the key elements of the first draft of the Transformation Charter, including a draft of its scorecard to stakeholders.
34
3.4.6 Recommended Consulting Process, Representatives and Stakeholders identification.
The consultation process for developing a Transformation can take any of the following forms:
A major gathering of the key stakeholders in the sector.
Workshops addressing particular issues in the Transformation Charter;
sector-wide road shows; or
Other interactive mechanism that would ensure effective communication with and participation by the relevant stakeholders.
The relevant stakeholders may include:
Key enterprises within the sector:
Industry bodies for the sector and relevant chamber of commerce.
Government and in particular, the relevant government departments having jurisdiction over the particular sector.
Labour bodies or the relevant trade unions.
Industry Regulators and Civil Society Organisations ; and
Any others with relevant interest in the sector.
The Steering committee should have equitable representation to enable participation by all the different stakeholders in the Transformation Charter formulation.
Presentation of the Transformation Charter to the Advisory Council. The ministry in the government responsible for the relevant sector and to the Minister of Trade and Industry.
Setting the mandate and the powers of the Charter council.
3.4.7 The Role of the Charter Council
The following represents a recommended model for settings up Charter Council: Equitable composition of stakeholders in the members of the Charter Council
Ensuring application of good Corporate Governance principles in the Charter Council
The functions of the Charter Council may include:
To provide guidance on sector-specific matters effecting B-BBEE in entities within the sector.
To compile reports on the status of broad-based black empowerment within the sector, and
To share information with sector members approved accreditation agencies or the Minister.
3.4.8 Variation of Indicators in Codes 200 and 300
A Sector Code may allow the use of indicators that differ from those contained in codes 200 and 300 (Management control and Employment Equity) as a means of fixing the relevant measurement categories.

35
36
4 APPROACH AND METHODOLOGY
4.1 Objectives
Below are the specific goals and intended objectives of the process which underpinned all engagements and site visits with both the Oil majors as well as other critical stakeholders and players in the South African petroleum and oil industry. The objectives of the LFC audit were thus to properly:-
Understand the extent to which compliance to the LFC has been achieved
Appreciate the challenges experienced during implementation of LFC
Note and acknowledge achievements over and above LFC to advance transformation of the oil industry by companies
Realise the lessons learnt by companies in an endeavour to comply with the LFC.
Collate recommendations from both the oil companies and industry stakeholders for review process going forward.
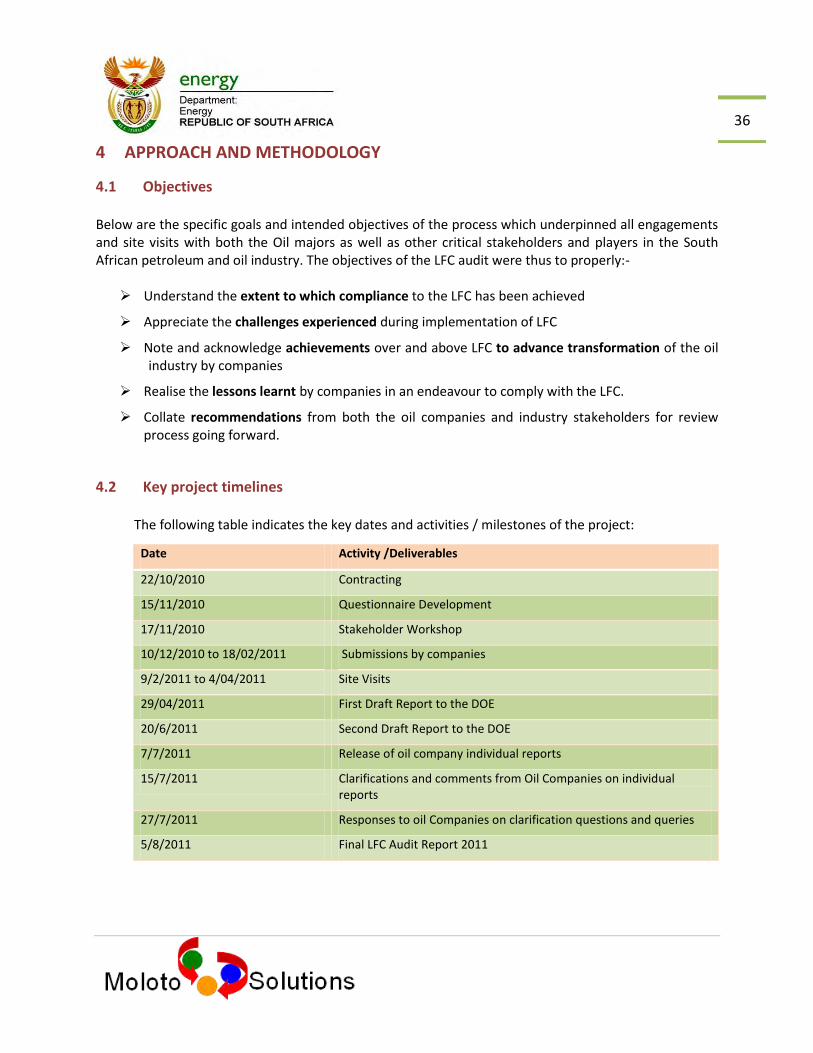
4.2 Key project timelines
The following table indicates the key dates and activities / milestones of the project:
Date Activity /Deliverables
22/10/2010 Contracting
15/11/2010 Questionnaire Development
17/11/2010 Stakeholder Workshop
10/12/2010 to 18/02/2011 Submissions by companies
9/2/2011 to 4/04/2011 Site Visits
29/04/2011 First Draft Report to the DOE
20/6/2011 Second Draft Report to the DOE
7/7/2011 Release of oil company individual reports
15/7/2011 Clarifications and comments from Oil Companies on individual reports
27/7/2011 Responses to oil Companies on clarification questions and queries
5/8/2011 Final LFC Audit Report 2011

37
4.3 Process followed
The illustration below depicts the approach followed by Moloto Solutions in conducting the audit.
4.4 Auditee details
Below is a list of the parties who were audited as they were signatories and were thus bound by the
stipulations of the LFC and those who were consulted in order to get a perspective of their collective
experiences as significant players and stakeholders in the South African oil industry.

38
Audited Consulted o BP South Africa o Chevron o Engen Petroleum Limited o PetroSA o Sasol Oil South Africa o Shell Marketing & Refining South Africa o Total South Africa
o A. Kock & Associates Inc. o Black Petroleum Institute o BNP Paribus o Fuel Retailers Association o Kwande Petroleum o Makwande Energy Trading o National Empowerment Fund o National Energy Regulator South Africa o New Oil Trading o South African Petroleum Retailers Association o SAPIA o SASDA o Women in Oil and Energy South Africa
4.5 List of Interviewees in each oil company
The following people were interviewed in each company, when availed:
Charter Element Details per interviewees
Ownership Internal coordinator , Consortium
Management Control CEO ,HDSA director & Board chairperson
Supportive Culture Executive in charge , divisional staff
Capacity Building HR Executive , each candidate for : - fast track / mentoring / internship / key HRD initiative - @ about 2 per area
Employment Equity
HR Executive , Payroll Executive , each HDSA manager (+/- 6) 2 each senior, middle & junior , union representatives, each with non-managerial employees (+/-3)
Preferential Procurement & Terms of Credit Procurement Executive, 3 Top 10 HDSA suppliers
Joint Facilities & other Infrastructure Joint Facilities Executive , 1 HDSA supplier
Refining Capacity Joint Refinery Executive , 2 HDSA suppliers
Retailing Retailing Executive , 1 HDSA supplier
Wholesaling Wholesaling Executive, 1 HDSA supplier
Synfuel Supply Synfuels Executive, 1 HDSA supplier
Enterprise Development Enterprise Development Executive / Representative
Social economic Development Socio Economic Development Executive / Representative

39
4.6 Measurement period
The period measured is the full 10 years from 2000 to 2010, with special emphasis on the financial year ended on or near the 31st October 2010. To ensure reliability of the amounts and percentages used during the audit, reliance was placed on independently verified information as much as possible, e.g. audited financial statements and BBBEE reports.
This means that the measurement period will not be uniform for all the companies as their financial years ends are different and their BBBEE certificates were issued at different dates during 2010.
4.7 The Scoring principles Most industry stakeholders have expressed concern with auditing compliance to the Petroleum and Liquid Fuels Charter in that its outlined objectives are largely only broad statements of intent. The charter does not always have quantitative values and standards against which compliance can be measured. This results in a possibly subjective interpretation of compliance requirements.
4.7.1 The 2002 measurement framework
It should, however, be noted that there was an attempt by the industry to agree on measurable indicators attached to the charter, which culminated in a signed agreement in 2002. These indicators were, however, not far-reaching enough in that they themselves were mainly not measurable, and they did not cover most critical elements of the charter.
4.7.2 The interpretive guide
In order to ensure consistency and transparency in measuring compliance, Moloto Solutions then developed an LFC interpretation / scoring principles guide, which helps to clarify how each element’s requirements would be measured and what has been considered as an acceptable level of compliance.
To ensure fairness to the industry, the sub-elements are as encapsulated in the charter, and the measurement framework used is largely that used in the 2002 guidelines. As pointed out above, however, because the 2002 guidelines did not cover all requirements of the charter, Moloto Solutions has added objectives to all key requirements. All the additional measures added by Moloto Solutions to the framework are coloured in blue in the guideline below. Below is a summary of the guide used during the audit, with particular emphasis on the measurement principles which Moloto Solutions adopted to quantify/qualify the results.

40
4.7.2.1. LFC Audit Scoring Principles Table LIQUID FUELS CHARTER SCORING PRINCIPLES
Element Charter sub-elements Scoring principles Moloto Measurement VS 2002 Guideline
Ownership (From preamble / interpretation)
25% ownership and control of entity that holds the SA operating assets of the Oil company.
25%Legal and effective black shareholding, through voting rights, rights to economic interest
Legal and effective black shareholding, through voting rights, rights to economic interest and sustainability. Applicability to all value chain
operations of the oil company
Analysis of financial indicators and
ratios
HDSA ownership to apply to all segments of the Value Chain
Legal and effective black shareholding, through voting rights, rights to economic interest and sustainability.
Sustainable presence/Sustainability through medium to long term viability.
Analysis of financial indicators and ratios
Management Control
Control of the entity through majority shareholding, effective controlling shareholding or majority of board of directors.
Percentage of black people in directorship positions (both executive & non-executive)
Percentage of black people in directorship positions (both executive & non-executive)
Supportive Culture Appointment of managers to create a supportive culture and enabling environment for business success
Number and seniority of appointed manager
Number and seniority of appointed manager Perception of appointed managers by HDSAs in all elements Demonstration of this culture through actual programs in all aspects of the charter Qualitative analysis of criteria which
facilitate the creation of a
transformative business environment
Inclusion of appropriate wording in
business policies and principles
Appointing appropriate managers who will understand the spirit and background of the charter policies
Perception of appointed managers by HDSAs in all elements
Fostering of a supportive culture w.r.t all aspects of this Charter when dealing with HDSA’s
Qualitative and qualitative analysis of
criteria which facilitate the creation of a
transformative business environment
Demonstration of this culture through
actual programs in all aspects of the
charter
Incorporating culture change policies in
business principles.
Inclusion of appropriate wording in
business policies and principles
Capacity Building Training of HDSA employees on core, priority and scarce skills
Quantitative and qualitative (effectiveness) analysis of black spend
Quantitative analysis of skills spend on black employees, learner-ship opportunities for black employees training opportunities for black employees Overseas training Talent pool & related fast-track Qualitative & effectiveness analysis of training & appropriate periodic reviews
Overseas training programs for HDSA’s Quantitative and qualitative (effectiveness) analysis of black spend
Identifying a talent pool & fast tracking it Quantitative and qualitative (effectiveness) analysis of black spend
Implementing mentorship programs Quantitative and qualitative (effectiveness) analysis of black spend
Learner-ship opportunities Quantitative and qualitative (effectiveness) analysis of black spend
Annual progress reports in agreed format Quantitative and qualitative (effectiveness) analysis of annual reports produced
Employment Equity
Publishing of equity stretch targets and achievements
Quantitative and qualitative analysis of Employment Equity reports submitted to the Department of Labour. Evidence of publishing.
Quantitative and qualitative analysis of Employment Equity reports submitted to the Department of Labour Meeting of equity targets Job content of HDSAs vs non-HDSAs Percentage representation of women
at all levels
Meeting of stretch equity targets including
equitable HDSA job content
Meeting of equity targets.
Job content of HDSAs vs non-HDSAs
Ensuring inclusiveness of gender Percentage representation of women at all levels

41
Private Sector Procurement
Supportive procurement policies - Towards growth of HDSA companies - With criteria that favour HDSA
companies
Inclusion of exact wording in policy documents and proof of implementation
Scope of preferential procurement to include all supplies (including crude) Inclusion of exact wording in policy documents and proof of implementation Availability of comprehensive listing of appropriate quality
Scope of preferential procurement to include all supplies (including crude)
Scope of preferential procurement to include all supplies (including crude)
List of HDSA suppliers
Availability of comprehensive listing of appropriate quality
Vessels used in the transportation of supplies/products to meet all prescribed health, safety and environmental standards
Inclusion of exact wording in policy documents and proof of implementation
Access to joint facilities
Fair ownership opportunities Analysis of BEE ownership percentage. 25%Legal and effective black shareholding, through voting rights, rights to economic interest
Analysis of BEE ownership percentage
25%Legal and effective black
shareholding, through voting rights,
rights to economic interest
Non-discriminatory access to HDSA
businesses to these joint facilities (over
and above HDSA shareholders)
Non-discriminatory access to uncommitted
capacity for the movement and storage of
crude oil and petroleum products
Non-discriminatory access to HDSA
businesses to these joint facilities (over
and above HDSA shareholders)
Refining Capacity Selling shares in the refinery to HDSAs Analysis of BEE ownership percentage. 25%Legal and effective black shareholding, through voting rights, rights to economic interest
Analysis of BEE ownership percentage
25%Legal and effective black
shareholding, through voting rights,
rights to economic interest
Non-discriminatory access to HDSA
businesses to refining capacity (over
and above HDSA shareholders)
JV opportunities to HDSAs in
expansions / upgrades
Making refining capacity available to HDSA
companies, thru , e.g. toll refining
agreements
Non-discriminatory access to HDSA
businesses to refining capacity (over and
above HDSA shareholders)
Providing JV opportunities by including
HDSA’s in expansion/upgrade programmes
JV opportunities to HDSAs in expansions /
upgrades
Retailing Fair opportunities for entry to the retail network
Analysis of BEE Ownership percentage Analysis of BEE Ownership percentage
Equitable retail opportunities to HDSAs Equitable retail opportunities to HDSAs
Wholesaling Fair opportunity for entry into wholesale / commercial sectors
Analysis of BEE Ownership percentage Analysis of BEE Ownership percentage
Equitable wholesaling opportunities to HDSAs
Equitable wholesaling opportunities to HDSAs
Financing Investigation and implementation of internal and external financing mechanisms for giving HDSA’s access to equity ownership and entry into viable strategic partnerships.
Debt schedules of BEE participants. Facilitation of ownership deals by HDSAs through own funding / guarantees, etc
Debt schedules of BEE participants. Facilitation of ownership deals by HDSAs through own funding / guarantees, etc
Terms of Credit Providing terms of credit to HDSA customers (e.g. retailers and client wholesalers)
Quantification of the effective benefit of preferential payment terms to BEE suppliers. Favorable credit terms to HDSAs
Quantification of the effective benefit of preferential payment terms to BEE suppliers. Favorable credit terms to HDSAs
Synfuels Supply Parties to accommodate HDSA’s, which lack the facilities to comply fully, in the fairest way possible
Non-discriminatory access to HDSA businesses to synfuel refining capacity (over and above HDSA shareholders)
Non-discriminatory access to HDSA businesses to synfuel refining capacity (over and above HDSA shareholders)
42
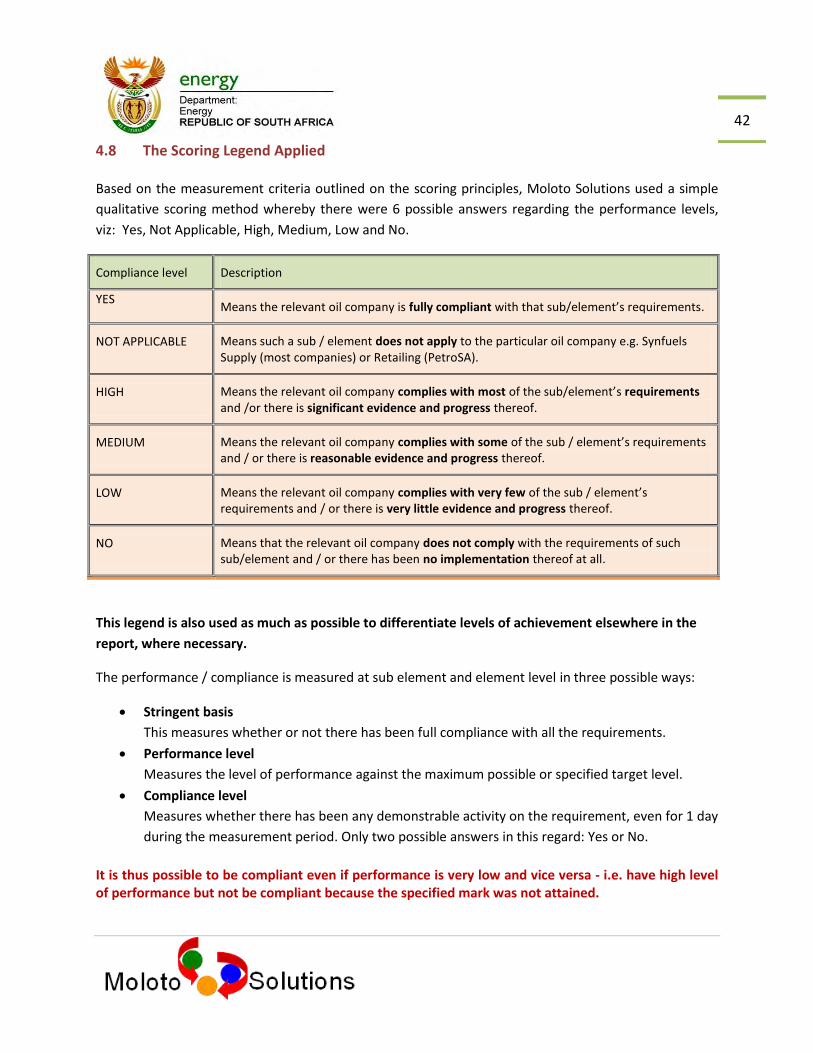
4.8 The Scoring Legend Applied
Based on the measurement criteria outlined on the scoring principles, Moloto Solutions used a simple
qualitative scoring method whereby there were 6 possible answers regarding the performance levels,
viz: Yes, Not Applicable, High, Medium, Low and No.
Compliance level Description
YES Means the relevant oil company is fully compliant with that sub/element’s requirements.
NOT APPLICABLE Means such a sub / element does not apply to the particular oil company e.g. Synfuels Supply (most companies) or Retailing (PetroSA).
HIGH Means the relevant oil company complies with most of the sub/element’s requirements and /or there is significant evidence and progress thereof.
MEDIUM Means the relevant oil company complies with some of the sub / element’s requirements and / or there is reasonable evidence and progress thereof.
LOW Means the relevant oil company complies with very few of the sub / element’s requirements and / or there is very little evidence and progress thereof.
NO Means that the relevant oil company does not comply with the requirements of such sub/element and / or there has been no implementation thereof at all.
This legend is also used as much as possible to differentiate levels of achievement elsewhere in the
report, where necessary.
The performance / compliance is measured at sub element and element level in three possible ways:
Stringent basis
This measures whether or not there has been full compliance with all the requirements.
Performance level
Measures the level of performance against the maximum possible or specified target level.
Compliance level
Measures whether there has been any demonstrable activity on the requirement, even for 1 day
during the measurement period. Only two possible answers in this regard: Yes or No.
It is thus possible to be compliant even if performance is very low and vice versa - i.e. have high level of performance but not be compliant because the specified mark was not attained.
43
PR
OC
ESS C
HA
LLEN
GES &
MIT
IGA
TIO
NS

44
5 PROCESS CHALLENGES AND MITIGATIONS 5.1 Challenges Experienced and Related Mitigations
Challenges experienced and related mitigation measures taken are:
CHALLENGES MITIGATION
1. Late submissions Extended the deadline 4 times from 15 December 2010 – 21 January 2011 to allow all companies to submit. Final submission only on the 8
th February.
2. Inadequate / incomplete information from the oil companies.
For incomplete questionnaires, schedules and documentary companies were given opportunity to review and resubmit even after the site visits were completed. to facilitate accountability for submissions and subsequent audit results. Some companies made the final such submissions only in the second week of April 2011. We also utilized information contained in the individual companies’ BBBEE reports for the previous two (2) years, to augment some submissions
3. Crucial schedules not submitted at all by some auditees
The relevant company’s score is indicated as unknown or non-compliant. However the
average compliance rates are based on the number of companies that submitted
information. Note is made on the report of such instances as much as possible.
4. Possible inaccuracy and amounts not tallying due to different year-ends and submission periods
Requested oil companies to complete the overarching reconciliation sheet, to help assess
the reasonableness and accuracy of measurement periods and sources of key amounts and
other quantitative figures used in the LFC returns.
Most of these reconciliations were however also not completed in full by the companies, and
most followed after the visits and thus there was no opportunity to engage thereon with the
companies.
Also ensured that information used is not older / newer than 6 months from the 31st
October 2010 and has an independent confirmation source as much as possible.
Two people from Moloto Solutions attended most interviews so as to able to compare notes
and confirm findings.
5. Possible inaccuracies due to multiple submissions by companies
The auditees were requested to make list of all submissions with dates, to help us pinpoint the latest submission in each case. Not all the auditees compiled this list.
6. Initial unavailability of industry stakeholders for consultation.
Most of the stakeholders that were critical to a comprehensive view of the state of transformation of the industry were accommodated up to March 2011 bar Transnet, National Unions and South African commercial banks, who were still not available.
7. Possibility of compliance on paper only
An extensive interview schedule was implemented within each oil company, which sought to, as much as possible target both the supposed implementer and beneficiary of each intervention claimed by the oil major; e.g. on Human Resource matters, interviewed both the HR executive and the employees. Independent stakeholder interviews also conducted
8. Non-quantifiable targets for most of the elements of the Charter
Developed a transparent and objective interpretation/scoring principles document. Additional information on the scale of performance also requested and is reported on, to facilitate the creation of a baseline.
9. Insufficient financial and wholesaling information
The related analyses have been excluded from the report as the information was too insufficient.
10. Procurement information not completely reconcilable
Estimations and assumptions were made as much as possible. The procurement results have been qualified as necessary, to warn the reader about this.

45
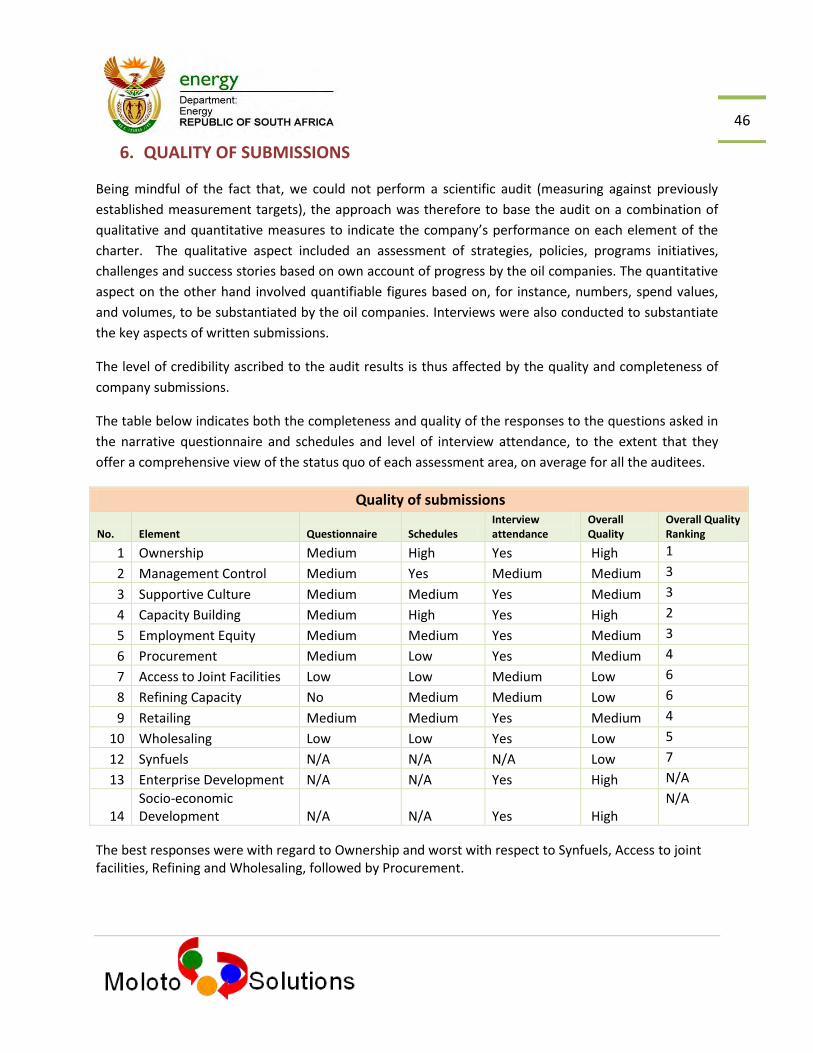
46
6. QUALITY OF SUBMISSIONS
Being mindful of the fact that, we could not perform a scientific audit (measuring against previously
established measurement targets), the approach was therefore to base the audit on a combination of
qualitative and quantitative measures to indicate the company’s performance on each element of the
charter. The qualitative aspect included an assessment of strategies, policies, programs initiatives,
challenges and success stories based on own account of progress by the oil companies. The quantitative
aspect on the other hand involved quantifiable figures based on, for instance, numbers, spend values,
and volumes, to be substantiated by the oil companies. Interviews were also conducted to substantiate
the key aspects of written submissions.
The level of credibility ascribed to the audit results is thus affected by the quality and completeness of
company submissions.
The table below indicates both the completeness and quality of the responses to the questions asked in
the narrative questionnaire and schedules and level of interview attendance, to the extent that they
offer a comprehensive view of the status quo of each assessment area, on average for all the auditees.
Quality of submissions
No. Element Questionnaire Schedules Interview attendance
Overall Quality
Overall Quality Ranking
1 Ownership Medium High Yes High 1
2 Management Control Medium Yes Medium Medium 3
3 Supportive Culture Medium Medium Yes Medium 3
4 Capacity Building Medium High Yes High 2
5 Employment Equity Medium Medium Yes Medium 3
6 Procurement Medium Low Yes Medium 4
7 Access to Joint Facilities Low Low Medium Low 6
8 Refining Capacity No Medium Medium Low 6
9 Retailing Medium Medium Yes Medium 4
10 Wholesaling Low Low Yes Low 5
12 Synfuels N/A N/A N/A Low 7
13 Enterprise Development N/A N/A Yes High N/A
14 Socio-economic Development N/A N/A Yes High
N/A
The best responses were with regard to Ownership and worst with respect to Synfuels, Access to joint facilities, Refining and Wholesaling, followed by Procurement.

47

48
7. FINDINGS BY CHARTER ELEMENT
NB – Non compliance with any sub-element requirement results in overall non-compliance with the particular element and all sub-elements bear equal weight.
7.1 Ownership Charter Objective: Equity participation in the petroleum and liquid fuels industry across the value
chain, with HDSA owning in total, not less than 25% of the aggregate value of the equity of the various entities that hold the operating assets of the South African oil industry. Sustainable presence and long term viability across all segments of the value chain.
7.1.1. Audit Results
7.1.1.1. Ownership Summary Results LFC Key Percentages
Economic Interest Voting Rights
Average 18.91% 18.29%
Average compliance status of the industry High
2006 / 2011 LFC Audit Results Comparison
Element Indicator 2006 2011 Increase
Ownership Voting Rights Black People 8.16% 18.29% 124%
Economic Interest Black People 0 18.91% 100%
NB – Due to the explicit percentage compliance requirement of 25% stated in the Charter for this
element, all companies that scored lower than the 25% economic interest and voting rights are scored
as overall non-compliant.
Only one of the Oil majors claimed (very minor) white women related shareholding. All the others
have largely deferred to the BBBEE definitions and approach in this regard.
LFC Sub-Element Compliance Status
Element Charter Sub-Element Scoring Principles Average
Ownership 25% ownership and control of entity that holds the SA operating assets of the Oil company.
25%Legal and effective black shareholding, through voting rights, rights to economic interest M
HDSA ownership to apply to all segments of the Value Chain
Legal and effective black shareholding, through voting rights, rights to economic interest and sustainability.
YES
Sustainable presence/Sustainability through medium to long term viability.
Analysis of financial indicators and ratios YES
Compliance 3 out of 6 (50%) companies complied with the LFC on Ownership

49
7.1.2. Additional Ownership Indicators
7.1.2.1 Ownership Table
The following are additional ownership indicators, using BBBEE scoring principles:
Additional ownership indicators
Indicators Average %
a) Exercisable voting rights by black women 7.31%
b) Economic interest in the Enterprise to which black women are entitled 6.72%
c) Economic interest in the Enterprise to which certain black natural people are entitled 6.09%
d) Ownership fulfilment 0
e) Net value 12.74%
f) Ownership involvement by black new entrants (bonus) 5.94% Additional ownership indicators
7.1.3. Key Observations
7.1.3.1 Analysis of the ownership indicators
Voting Rights
The average voting rights for black people/HDSAs are 73% of the 25% target and for black /all women are 29%. The lowest scoring company has zero%, and the highest 25%. These rights are mostly linked to the economic interest. However, most of the companies advanced the full 25% voting rights ahead of the vesting or in spite of the lower economic interest, presumably to score higher points for BBBEE purposes, among others.
Economic Interest
Similar results to those for voting rights were achieved, albeit due to a slightly different mix, (at 76% and 24% respectively for all black people / HDSAs and women). The lowest rate is 4.22%, which is by design of the equity partners for various reasons The reasons for the other lower than 25% economic interest rates include: a minor sprinkle of white women shareholders not well quantified in all the companies (due to the focus on BEE which does not recognize them), minor percentage of white males, small percentage of discretionary trusts and institutional shareholders in primary Special Purpose Vehicles (SPVs) and private investment vehicles.
Economic Interest of Other Black People
This indicator measures the interest of black designated groups, including broad based groups and Employee Share Ownership Schemes (ESOPS). Only 2 companies were found to have significant economic interest attributable to other designated groups in the companies audited. The average economic interest for all the companies is at 6.09%.
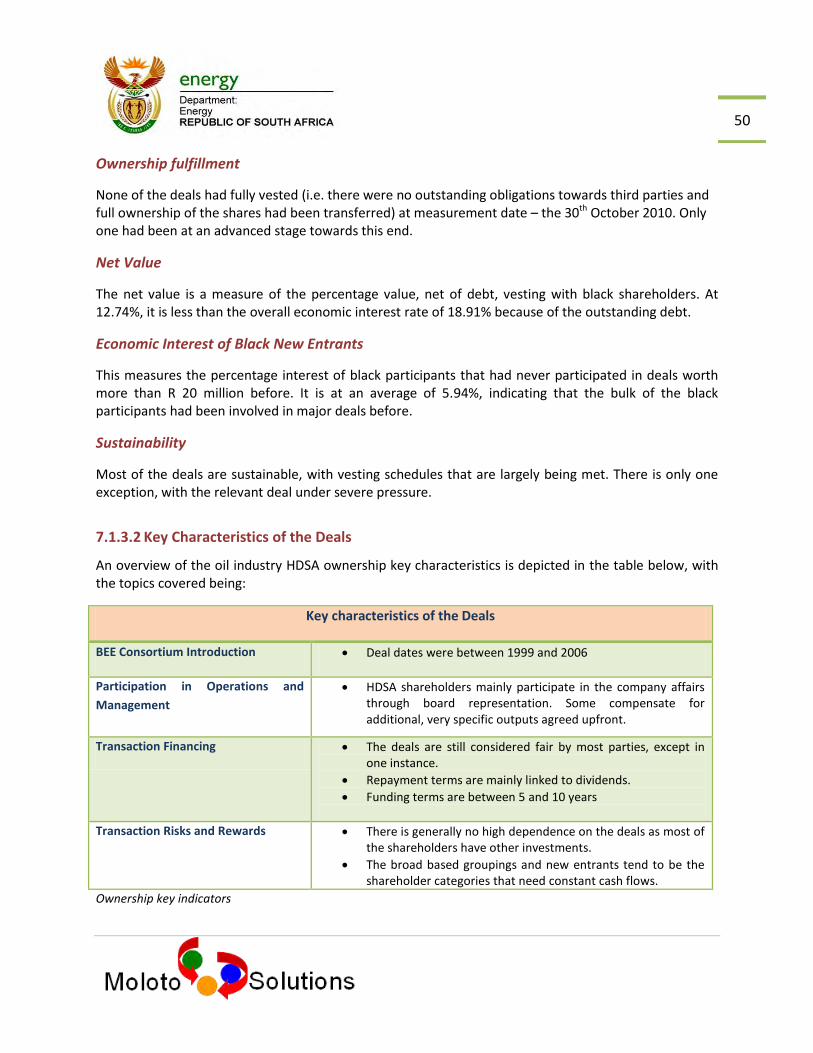
50
Ownership fulfillment
None of the deals had fully vested (i.e. there were no outstanding obligations towards third parties and full ownership of the shares had been transferred) at measurement date – the 30th October 2010. Only one had been at an advanced stage towards this end.
Net Value
The net value is a measure of the percentage value, net of debt, vesting with black shareholders. At 12.74%, it is less than the overall economic interest rate of 18.91% because of the outstanding debt.
Economic Interest of Black New Entrants
This measures the percentage interest of black participants that had never participated in deals worth more than R 20 million before. It is at an average of 5.94%, indicating that the bulk of the black participants had been involved in major deals before.
Sustainability
Most of the deals are sustainable, with vesting schedules that are largely being met. There is only one exception, with the relevant deal under severe pressure.
7.1.3.2 Key Characteristics of the Deals
An overview of the oil industry HDSA ownership key characteristics is depicted in the table below, with the topics covered being:
Key characteristics of the Deals
BEE Consortium Introduction Deal dates were between 1999 and 2006
Participation in Operations and
Management
HDSA shareholders mainly participate in the company affairs through board representation. Some compensate for additional, very specific outputs agreed upfront.
Transaction Financing The deals are still considered fair by most parties, except in one instance.
Repayment terms are mainly linked to dividends.
Funding terms are between 5 and 10 years
Transaction Risks and Rewards There is generally no high dependence on the deals as most of the shareholders have other investments.
The broad based groupings and new entrants tend to be the shareholder categories that need constant cash flows.
Ownership key indicators

51
7.1.3.3 Observations on policies and strategies
7.1.3.3.1 Effect of BBBEE Codes
The BBBEE Codes of Good Practice largely benefited HDSA shareholders in that a lot of the agreements that had unnecessarily punitive/unfair clauses have been changed to ensure scoring of the relevant voting rights and economic interest points. Even though the BBBEE codes (ABVA Best Practice note especially) allow discretion on broad based schemes, this is open to abuse and should be backed by strong corporate governance protocols. White women are largely excluded from all the deals, (and not considered as HDSAs) by participants, and the oil majors- possibly because of the influence of the BBBEE Codes.
7.1.3.3.2 Family Trusts
Discretionary family trusts are largely the norm. A concern arises where they have female beneficiaries and are set up by males - as the economic interest of black females is thus not fixed.
A lot of the private investment vehicles (like family trusts) also have institutional investors through ordinary and preference shareholding, making it difficult to determine the undiluted black percentage ownership percentages. The matter gets exacerbated by the modified flow through principle of the codes which allows >50% black owned companies to be treated as if 100% black owned. There are also some discretionary ESOPS and Trusts, most of which have revised the relevant paragraphs.
7.1.3.3.3 Dividends
There is a tension between quick realization of net value (and scoring higher BEE points) and constant cash flow through regular, relatively higher dividend retention. Most black shareholders have so far only received (at most) a trickle dividend with the rest servicing the debt.
7.1.3.3.4 BEE score differences
There were also differences of opinion with regard to some of the scoring based on BBBEE Codes, involving voting rights, economic interest, black new entrants, trusts and net value calculations. Only the scores related to the voting rights and black new entrants were adjusted due to the quantum involved – as not doing so would unnecessarily distort the results significantly. The other differences were relatively minor and have thus not been adjusted for.
7.1.3.3.5 25% threshold
The 25% threshold is 1 more vote less than desired in that holders may not block a special resolution among others .That is why the BBBEE codes target is 25% + 1. In the meantime, it behoves the black shareholders to further negotiate stronger minority shareholders rights.

52
7.2. MANAGEMENT CONTROL Charter Objective: Control of a business entity can be achieved in a number of ways; (a) a majority
shareholding position, i.e. 50% + 1 share; (b) an effective controlling shareholding; (c) a majority of a board of directors; and/or (d) a shareholders’ agreement.
7.2.1. Audit Results
7.2.1.1 Management Control Results Summary
LFC Key Percentages
% HDSA average 59.1%
LFC Sub-Element Compliance Status
Element Charter Sub-Element Scoring Principles Average
Management Control
Control of the entity through majority shareholding, effective controlling shareholding or majority of board of directors.
Percentage of black people in directorship positions (both executive & non-executive)
H
Average compliance status of the industry High
Compliance : 4 out of 7 (57%) companies complied with the LFC on Management Control
2006 / 2011 LFC Audit Results Comparison
Element Indicator 2006 2011 Increase
Management Control
Black Directors 46% 59.1% 28.48%
Black Women Directors 13% 20% 53.85%
Black Executive Directors 13% 14% 7.69%
Black Women Executive Directors 1% 27% 2600%
7.2.2. Additional indicators on Directors
7.2.2.1 Executive/Non-Executive /independent Status
Overall
Totals
EXECUTIVE NON-EXECUTIVE INDEPENDENT Total
B C I W B C I W B C I W
M F M F M F M F M F M F M F M F M F M F M F M F
No 5 2 0 0 1 0 9 1 13 7 0 0 2 1 13 1 1 2 58
% 9 3 2 16 2 22 12 3 2 22 2 2 3 0 0 0 0 0 0 100
EXECUTIVE DIRECTORS NON-EXECUTIVE DIRECTORS INDEPENDENT DIRECTORS
Total Overall Total HDSA
Total White Total
Overall Total HDSA
Total White
Total Overall
Total HDSA
Total White
31% 14% 17% 64% 40% 24% 5% 5% 0
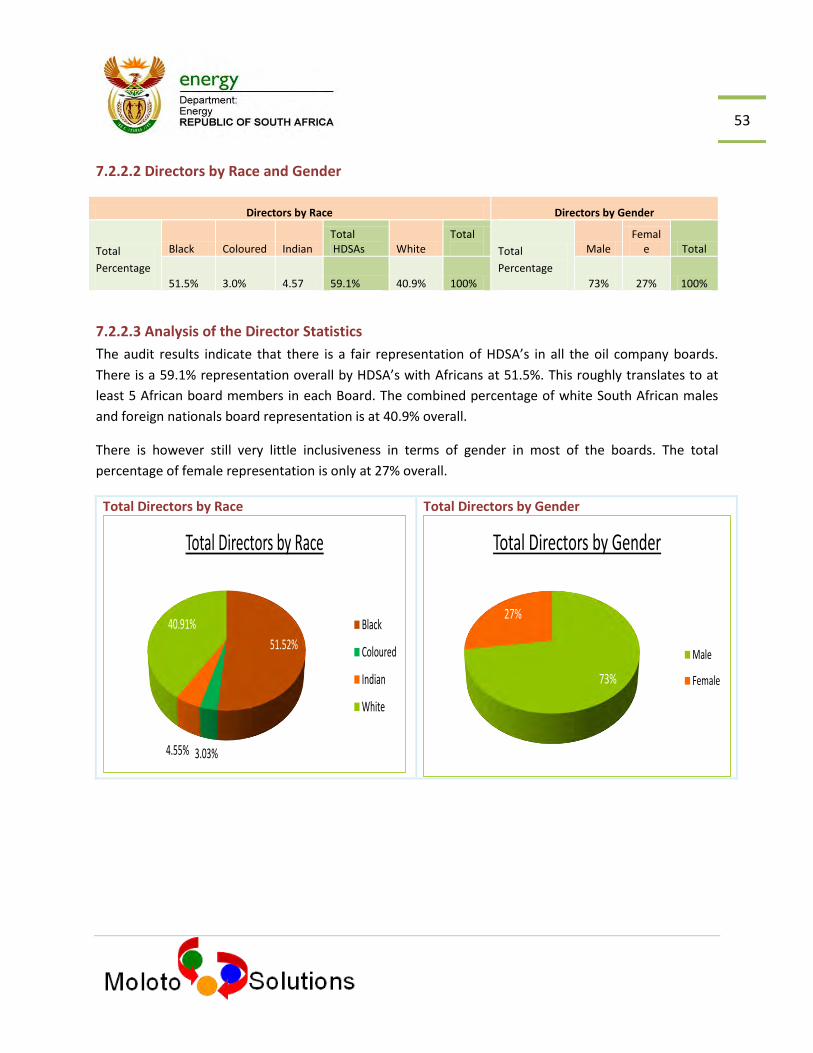
53
7.2.2.2 Directors by Race and Gender
7.2.2.3 Analysis of the Director Statistics
The audit results indicate that there is a fair representation of HDSA’s in all the oil company boards.
There is a 59.1% representation overall by HDSA’s with Africans at 51.5%. This roughly translates to at
least 5 African board members in each Board. The combined percentage of white South African males
and foreign nationals board representation is at 40.9% overall.
There is however still very little inclusiveness in terms of gender in most of the boards. The total
percentage of female representation is only at 27% overall.
Total Directors by Race
51.52%
3.03%4.55%
40.91%
Total Directors by Race
Black
Coloured
Indian
White
Total Directors by Gender
73%
27%
Total Directors by Gender
Male
Female
Directors by Race Directors by Gender
Total
Percentage
Black Coloured Indian Total HDSAs White
Total Total
Percentage
Male Femal
e Total
51.5% 3.0% 4.57 59.1% 40.9% 100% 73% 27% 100%

54
7.2.3 Key Observations The oil companies have been largely successful in this element, as it is the highest scoring.
Policies, Strategies and Plans
Companies are at different stages in the life cycle of the Charter, some have documented
policies some have not.
There are largely no specific plans outlined to advance HDSA’s in management control.
Most of the companies also, did not have focused strategic leadership pipeline processes.
Challenges
The impact and effectiveness of HDSA directors is hampered by the fact that the effective legal
(and therefore financial) control of the entities lies in the multinationals where applicable.
o Local boards are only consulted on some critical matters like transfer pricing and local
strategy.
o Local boards almost always counter-balanced by a large representation of foreign
nationals as well.
In other multinationals, some of the CEO’s report directly to the overseas management.
o Although international reporting empowers most of the CEOs and particularly the black
CEOs, it inadvertently lowers the influence of or dis-empowers the other black directors
in those companies’ boards.
Attracting strong, particularly black female talent has been cited as a serious challenge as the
industry had not been made attractive to women in the past.
A significant percentage of the black directors are non – executives, further curtailing their
potential influence. (Black executive directors are only 14% of all the directors).
The percentage of independent, particularly black directors, at 5% is also very low.

55
7.3. SUPPORTIVE CULTURE
Charter Objective: Appointment of managers by both government and companies who will create a supportive culture and enabling environment for business success.
7.3.1 Audit Results
7.3.1.1 Supportive Culture Results Summary
LFC Key Percentages
Number of dedicated managers on average of all Oil companies 1.71 people
LFC Sub-Element Compliance Status
Element Charter Sub-Element Scoring Principles Average
Supportive Culture
Appointment of managers to create a supportive culture and enabling environment for business success
Number and seniority of appointed manager
M
Appointing appropriate managers who will understand the spirit and background of the charter policies
Perception of appointed managers by HDSAs in all elements M
Fostering of a supportive culture w.r.t all aspects of this Charter when dealing with HDSA’s
Demonstration of this culture through actual programs in all aspects of the charter
M
Average compliance status of the industry M
Compliance: 7 out of 7 (100%) companies complied with the LFC on Supportive Culture
2006 / 2011LFC Audit Results Comparison
Element Indicator 2006 2011 Increase
Supportive Culture
Transformation Committee Existence 100% 100% 0%
Full Time Executive Director 43% 0% -100%
Black Full Time Skills Development Facilitator 71% 100% 40.8%
Approved policy prohibiting unfair discrimination
100% 100% 0%
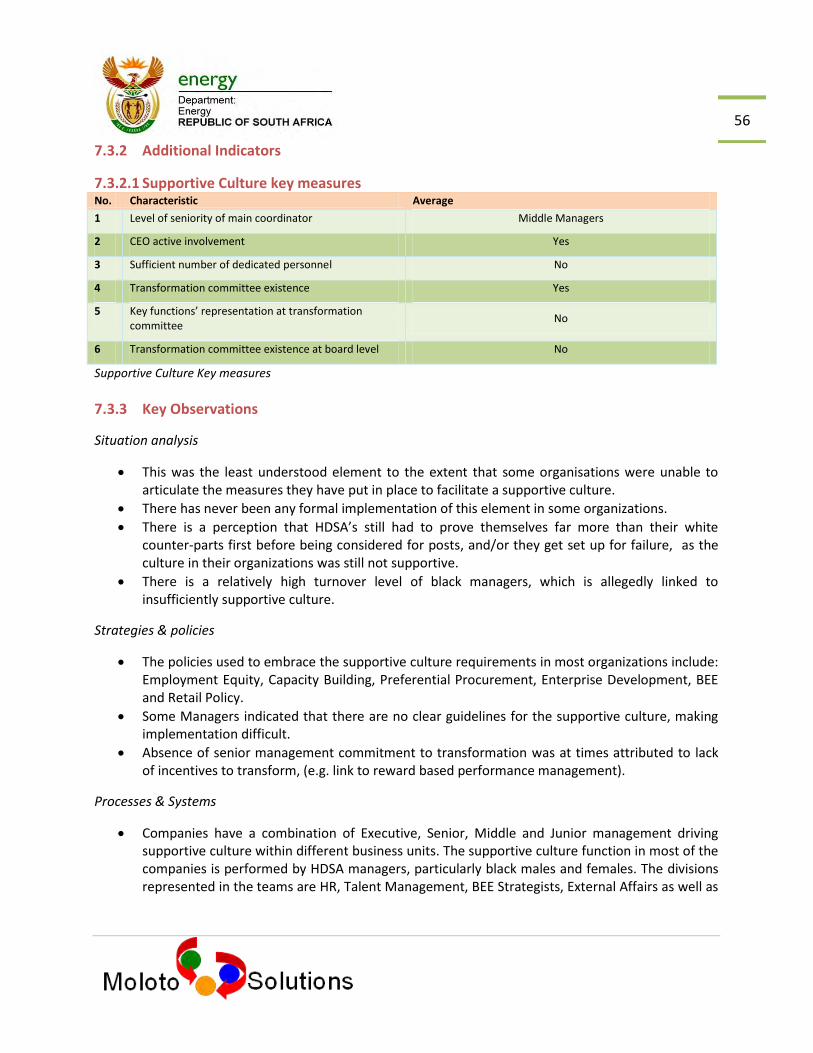
56
7.3.2 Additional Indicators
7.3.2.1 Supportive Culture key measures No. Characteristic Average
1 Level of seniority of main coordinator Middle Managers
2 CEO active involvement Yes
3 Sufficient number of dedicated personnel No
4 Transformation committee existence Yes
5 Key functions’ representation at transformation committee
No
6 Transformation committee existence at board level No
Supportive Culture Key measures
7.3.3 Key Observations
Situation analysis
This was the least understood element to the extent that some organisations were unable to articulate the measures they have put in place to facilitate a supportive culture.
There has never been any formal implementation of this element in some organizations.
There is a perception that HDSA’s still had to prove themselves far more than their white counter-parts first before being considered for posts, and/or they get set up for failure, as the culture in their organizations was still not supportive.
There is a relatively high turnover level of black managers, which is allegedly linked to insufficiently supportive culture.
Strategies & policies
The policies used to embrace the supportive culture requirements in most organizations include: Employment Equity, Capacity Building, Preferential Procurement, Enterprise Development, BEE and Retail Policy.
Some Managers indicated that there are no clear guidelines for the supportive culture, making implementation difficult.
Absence of senior management commitment to transformation was at times attributed to lack of incentives to transform, (e.g. link to reward based performance management).
Processes & Systems
Companies have a combination of Executive, Senior, Middle and Junior management driving supportive culture within different business units. The supportive culture function in most of the companies is performed by HDSA managers, particularly black males and females. The divisions represented in the teams are HR, Talent Management, BEE Strategists, External Affairs as well as
57
Procurement. There is only one company that has included the Retail Manager as part of the supportive culture team.
The organisations who demonstrated commitment and notable progress were those where transformation is driven by the CEO and Executive team and had a notable number of senior staff being champions of the transformation.
There was no evidence of processes to evaluate the supportive culture initiatives and programs for their effectiveness post implementation, so as to enhance or improve them in the future.
Initiatives & Programs
The special initiatives and programmes implemented by the companies include:
Various Diversity Management programs emphasizing gender sensitization and disability surveys and sensitisation workshops.
Change management and organizational development programs through initiatives such as values sessions and instilling a high performance culture.
Mentorship and Employment Equity Programs.
Supplier Development Initiatives.
Those targeting women include included Capacity Development through the Leadership in Oil and Energy (LOE) program, Women’s Network Forum for empowerment and development and Supplier development initiatives.
Challenges
There is insufficient awareness of the LFC within the companies, even at senior level in some instances.
The fact that the function did not permeate the entire organization with different functions having dedicated champions of transformational initiatives resulted in appoint individuals not being able to command the right influence
Organizational giving the transformation responsibility to either 1 or 2 people to drive almost single handedly resulted in slower progress.
Overall system challenges were also observed due to the implementation of supportive culture initiatives or programs being driven from HR instead of through line functions to enable buy-in.
Insufficient support by both the executive and board in their efforts to advance transformation within the organizations hindered progress for the appointed BEE personnel.
The contract terms of foreign national CEO’s sometimes end just as they are getting acquainted with the local dynamics and transformation imperatives. Managers lose traction in the process and progress slows down.
Some managers felt there was still a foreign culture prevalent without sufficient understanding and appreciation of local dynamics. In these instances employees do not feel a sense of belonging to the company.
Some staff at remote locations like storage depots /terminals believe that they are not afforded the same level of support as staff at head offices.

58
7.4. CAPACITY BUILDING
Charter Objective: Training and development of employees on core, priority and scarce skills recognized by SAQA/ SETA. Multinationals to focus their overseas training programmes on historically disadvantaged South Africans. Identify a talent pool and fast track it, implement mentorship programmes.
7.4.1. Audit Results
7.4.1.1 Capacity Building Summary Results
LFC Key percentages
Company
Overall HDSA spend
%
Core Skills
Priority Skills
Scarce Skills
Core, Priority
and Scarce Skills
Learner-ships
Mentorships Talent pool
Overseas training
% Black Delegates
Average 55% 72.25% 72.25 47.84% 66.70% 94.07% 21.19% 23.74% 64.11% 79.50%
LFC Sub-Element Compliance Status
Element Charter Sub-Element Scoring Principles Average
Capacity Building
Training of HDSA employees on core, priority and scarce skills
Quantitative and qualitative (effectiveness) analysis of black spend
M-H
Overseas training programs for HDSA’s Quantitative and qualitative (effectiveness) analysis of black spend
L
Identifying a talent pool & fast tracking it Quantitative and qualitative (effectiveness) analysis of black spend
NO
Implementing mentorship programs Quantitative and qualitative (effectiveness) analysis of black spend
NO
Learner-ship opportunities Quantitative and qualitative (effectiveness) analysis of black spend
L
Annual progress reports in agreed format Quantitative and qualitative (effectiveness) analysis of annual reports produced
M
Average compliance status in the industry L-M
Compliance: None of the companies complied with this element
2006 / 2011LFC Audit Results Comparison
Element Indicator 2006 2011 Increase
Capacity Building
Total Skills Spend on HDSA’s % 71% 55% -22.5%
HDSA Learnerships 96% 94.07% -2.01%
Black delegates trained as % of all trained delegates
73% 79.50% 8.90%
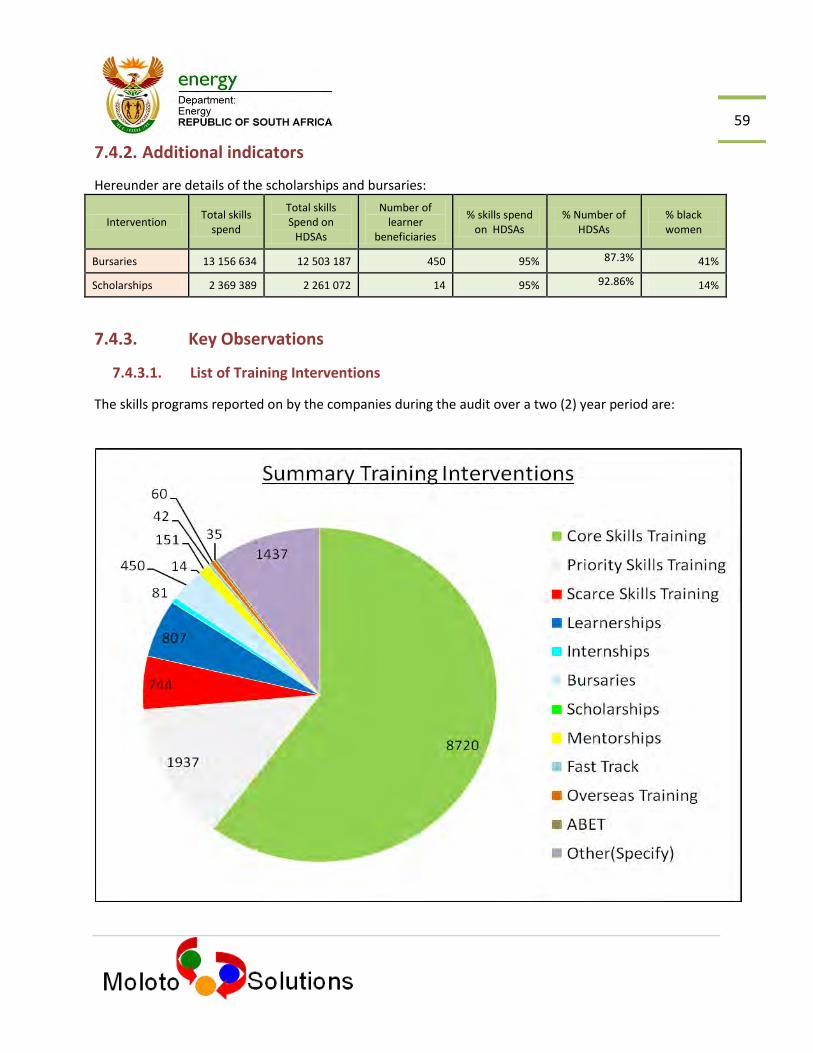
59
7.4.2. Additional indicators
Hereunder are details of the scholarships and bursaries:
Intervention Total skills
spend
Total skills Spend on
HDSAs
Number of learner
beneficiaries
% skills spend on HDSAs
% Number of HDSAs
% black women
Bursaries 13 156 634 12 503 187 450 95% 87.3% 41%
Scholarships 2 369 389 2 261 072 14 95% 92.86% 14%
7.4.3. Key Observations
7.4.3.1. List of Training Interventions
The skills programs reported on by the companies during the audit over a two (2) year period are:

60
7.4.3.2. Capacity Building Interventions By Race and Gender The participation of HDSA’s by race and gender is depicted below:
Race
Gender

61
7.4.3.3. Details of Capacity Building Interventions
Core and Priority and Scarce Skills
A larger portion of the skills spend by companies is directed towards the Core, Priority and Scarce skills which include varied skills programs which are in the following areas among others: Health, Safety and Environment, Risk Management, Petrochemicals, Planning and Marketing. These courses are offered at different NQF levels. Courses offered are both certified and uncertified. Employees underwent Occupationally Directed Internal Instruction Programs through conferences, workshop, seminars and short courses as well as through institutions as a top up skill. Some courses are Work - based Informal Programs and Structured, supervised experiential learning which include among others Hazard Identification and Forklift training.
The majority of employees attended formal institution based learning programs offered at different tertiary institutions. Learning programs are in manufacturing, logistics, procurement, supply and trading and technical skills. Scholarship programs targeted at the scarce and core skills seem to be insufficient.
Learnerships
There are varied learnership areas that companies offer through the SETA (CHIETA) to learners which include among others Welding, Boiler Maker, and Mechanical Fitting at NQF 4 for some companies and National certificate in Professional Driving at NQF3 in others. It has been observed that there is lack of continuity for external learners who were given learner-ship opportunities to progress in the respective fields.
Internships
The Interns are recruited from the tertiary institutions due to the relationships and partnerships established by both institutions of higher learning and oil majors. The Internships include among others, Process Engineering, Chemical and Mechanical Engineering.
Bursaries
The bursaries offered were among others in Project Management, Mechanical Engineering and Chemical Engineering. Bursaries are offered to employees according to their skills needs.
Mentorships
There are a number of companies which informally implemented mentorship programs, however the success rate could not be measured. Mentoring through on the job training is required to facilitate career progression is lacking.
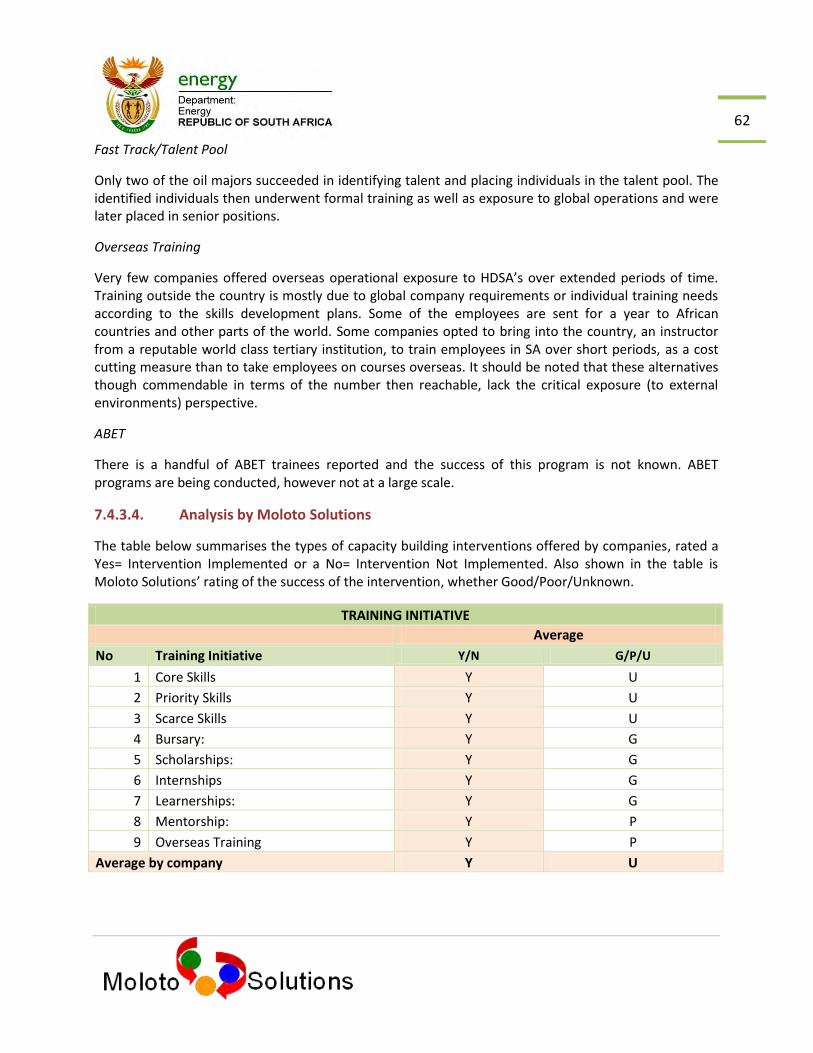
62
Fast Track/Talent Pool
Only two of the oil majors succeeded in identifying talent and placing individuals in the talent pool. The identified individuals then underwent formal training as well as exposure to global operations and were later placed in senior positions.
Overseas Training
Very few companies offered overseas operational exposure to HDSA’s over extended periods of time. Training outside the country is mostly due to global company requirements or individual training needs according to the skills development plans. Some of the employees are sent for a year to African countries and other parts of the world. Some companies opted to bring into the country, an instructor from a reputable world class tertiary institution, to train employees in SA over short periods, as a cost cutting measure than to take employees on courses overseas. It should be noted that these alternatives though commendable in terms of the number then reachable, lack the critical exposure (to external environments) perspective.
ABET
There is a handful of ABET trainees reported and the success of this program is not known. ABET programs are being conducted, however not at a large scale.
7.4.3.4. Analysis by Moloto Solutions
The table below summarises the types of capacity building interventions offered by companies, rated a Yes= Intervention Implemented or a No= Intervention Not Implemented. Also shown in the table is Moloto Solutions’ rating of the success of the intervention, whether Good/Poor/Unknown.
TRAINING INITIATIVE
Average
No Training Initiative Y/N G/P/U
1 Core Skills Y U
2 Priority Skills Y U
3 Scarce Skills Y U
4 Bursary: Y G
5 Scholarships: Y G
6 Internships Y G
7 Learnerships: Y G
8 Mentorship: Y P
9 Overseas Training Y P
Average by company Y U

63
This summary indicates that:
Companies are training on: o Core, priority and scarce skills, and through learner-ships and internships (graduate
programs), bursaries and scholarships, leadership development programs via Leadership in Oil & Energy (LOE), Women Leadership Programs, and Accelerated Leadership Program for high flyers.
o In some companies, the internship program requires each trainee to personally drive their own initiatives and is therefore not formally structured / uniform.
o There is also no follow up by the company after the learner-ship program is completed. This means these learners are not recognized as a potential talent pool.
Most companies did not have formalized and effective mentorship programs for proper skills transfer.
o There are no processes to ensure transfer of skills by qualified experts to HDSA’s implemented and monitored by HR and senior managers particularly on the strategic contract based projects in some organisations.
There is no evidence of Talent Pool and Fast Track Programs, particularly of HDSA’s. o No formal talent pool policy at some of the companies o Some companies reported that they do identify and fast track certain individuals,
however, the strategy has been not to publicize the initiative so as to not be seen as cherry picking and also creating inadvertent expectations on the part of the individuals being fast tracked.
Most of the overseas training entails attendance of conferences and short courses with very little operational exposure over a length of time.
The companies were not able to provide the ratings for the success and effectiveness of training on core, priority and scarce skills as they indicated that information was not collated and therefore not readily available although they did provide training spend on these initiatives. Most companies were also only able to rate the success rate and or effectiveness of their bursary/scholarship and learnership/internship programs as being good overall. It is important however, to note the contradictory reports on the ineffectiveness of these programs, by the intended beneficiaries that these are only good for companies to report on numbers achieved, because, among others, there are limited jobs or career opportunities offered to them, on completion of the initiatives Almost all the companies rely on the fact/ assumption that SAQA offers quality courses and thus have no own record of the measure of the success and or impact of their initiatives.
There has been minimal improvement and or enhancements of these programs over the years
About 55% of the total skills spend by all the companies has been spent on HDSAs overall.

64
7.5. EMPLOYMENT EQUITY Charter Objective: Publishing stretch EE targets and achievements. Multinationals to focus their
EE programmes on historically disadvantaged South Africans, and ensure inclusiveness of gender.
7.5.1 Audit Results 7.5.1.1 Employment Equity Summary Results
LFC Key Percentages
% HDSA (ABCDE) % HDSA (EDC) E Band Equitable Job Content Equitable Budget
Average 74.3% 71.2% 50.4% 44% 17%
LFC Sub-Element Compliance Status
Element Charter Sub-Element Scoring Principles Average
Employment Equity
Publishing of equity stretch targets and achievements
Quantitative and qualitative analysis of Employment Equity reports submitted to the Department of Labour. Evidence of publishing.
M
Meeting of stretch equity targets including equitable HDSA job content
Meeting of equity targets. NO
Meeting of stretch equity targets including equitable HDSA job content
Analysis of job content of HDSAs vs. non-HDSAs
L
Ensuring inclusiveness of gender Percentage representation of women at all levels
L
Average compliance status of the industry LOW
Compliance Level: 3 out of 7 companies, (43%) complied with the LFC on Employment Equity
2006 / 2011 LFC Audit Results Comparison
Element Indicator 2006 2011 Increase
Employment Equity
Senior Management Black 41% 50.4 22.9%
Senior Management Women 8% 13% 62.5%
Middle Management Black 52% 64% 23.1%
Middle Management Women 14% 30% 114.3%
Junior Management Black 69% 78% 13.0%
Junior Management Women 22% 31% 40.9%
Semi and Unskilled Black 95% 82% -13.68%
Semi and Unskilled Women 8.1% 17% 112.50%
Black Executives 44% 53% 18.18%

65
7.5.2 Summary of Employment Equity Profile
7.5.2.1 Race and gender split summary table
The tables below show the summary of the overall race and gender representation in the different
occupational levels (A to E). These numbers exclude all levels greater than E.
Numbers
Race by gender E D C TOTAL CDE A&B TOTAL
African Male 39 463 884 1386 1320 2706
African Female 19 267 605 891 279 1170
Coloured Male 38 315 639 992 454 1446
Coloured Female 13 183 427 623 117 740
Indian Male 27 312 267 606 162 768
Indian Female 3 97 135 235 38 273
Total Black, Indian, Coloured %
139 1637 2957 4733 2370 7103
White Male 90 665 513 1268 461 1729
White Female 20 227 317 564 71 635
Foreign Male 24 38 7 69 0 69
Foreign Female 3 10 3 16 2 18
GRANDTOTAL 276 2577 3797 6650 2904 9554
Percentages
Race by gender E D C TOTAL EDC A&B TOTAL
African Male 14% 18% 23% 21% 45% 28%
African Female 7% 10% 16% 13% 10% 12%
Coloured Male 14% 12% 17% 15% 16% 15%
Coloured Female 5% 7% 11% 9% 4% 8%
Indian Male 10% 12% 7% 9% 6% 8%
Indian Female 1% 4% 4% 4% 1% 3%
Total Black, Indian, Coloured %
50.4% 63.5% 77.9% 71.2% 81.6% 74.3%
White Male 33% 26% 14% 19% 16% 18%
White Female 7% 9% 8% 8% 2% 7%
Foreign Male 9% 2% 0% 1% 0% 1%
Foreign Female 1% 0% 0% 0% 0% 0%
GRANDTOTAL 100% 100% 100% 100% 100% 100%

66
7.5.2.2 Race and gender split all staff summary graph
The overall race and gender split can be graphically represented as follows:
Total All Staff
0
500
1000
1500
2000
2500
3000
1678 (17.6%)
634(6.6%)
2705(28.3%)
1164(12.2%)
1435(15%)
730(7.6%)
831(8.7%)
290(3.0%)
69(0.7%) 18
(0.2%
White Male
White Female
African Male
African Female
Coloured Male
Coloured Female
Indian Male
Indian Female
Foreign Male
Foreign Female

67
An analysis of the results by staff category shows that:
The total senior management (E) level overall, inclusive of functional experts and other senior personnel,
in most companies is dominated by white South Africans at 40% and Foreign nationals at 50%, with
blacks at 21%, coloureds at 19% while Indians are at 11%.
In the total middle management (D) level overall, which also includes the professionally qualified and
experienced specialists, the break down is 37% for whites and foreign nationals followed by blacks at
28% and then Coloured and Indian males at 19% and 16% respectively.
The junior management (C) level, inclusive of the technically skilled, academically qualified, junior
management and supervisor employees is mostly occupied by the HDSA groupings with black and
coloured males at 23% and 17% respectively.
The semi-skilled and unskilled occupational category is mostly dominated by Africans at 55% overall.
A racial and gender analysis of all A to E level staff shows that:
African males dominate, followed by white males, coloured males and African females. Indian
males are the fifth largest group.
However, in one company, and to a lesser degree in two others, there was an over-representation of
Indians in all management categories, who actually dominated all other race groups. In all the instances
this could not be justified by national and geographical demographics.
Two of the oil companies hardly had any black people in the executive and senior management levels.
They scored a zero for these levels on the BEE scorecards
People with disabilities make up 0.66% of all staff and are split as follows: 39 (0.42%) males and 25
(0.28%) females.

68
7.5.2.3 Race and Gender comparison: A to E levels

69
7.5.2.4 Executive Level Analysis
The table and graphs below indicate the number of incumbents at both executive / top and other top
management levels collapsed into one, who are responsible for the development and implementation of
either the overall strategy or for their particular functions and involved in the day to day operational and
financial management of the oil company. The black representation at this level is 53%, and women
representation at 22%.
7.5.2.4.1 Executive & Top Management by Race and by Gender
Black Coloured Indian
Total B I C White Foreign Total
Male
Female
Total 30 12 5 47 36 10 93 73
20
Total % 32% 13% 8% 53% 37% 11% 100% 78%
22%
Total Executive Management by Race
32%
13%8%
37%
11%
Executive & Top
Management by Race
Black
Coloured
Indian
White
Foreigner
Total Executive Management by Gender
78%
22%
Executive & Top Management
by Gender
Male
Female
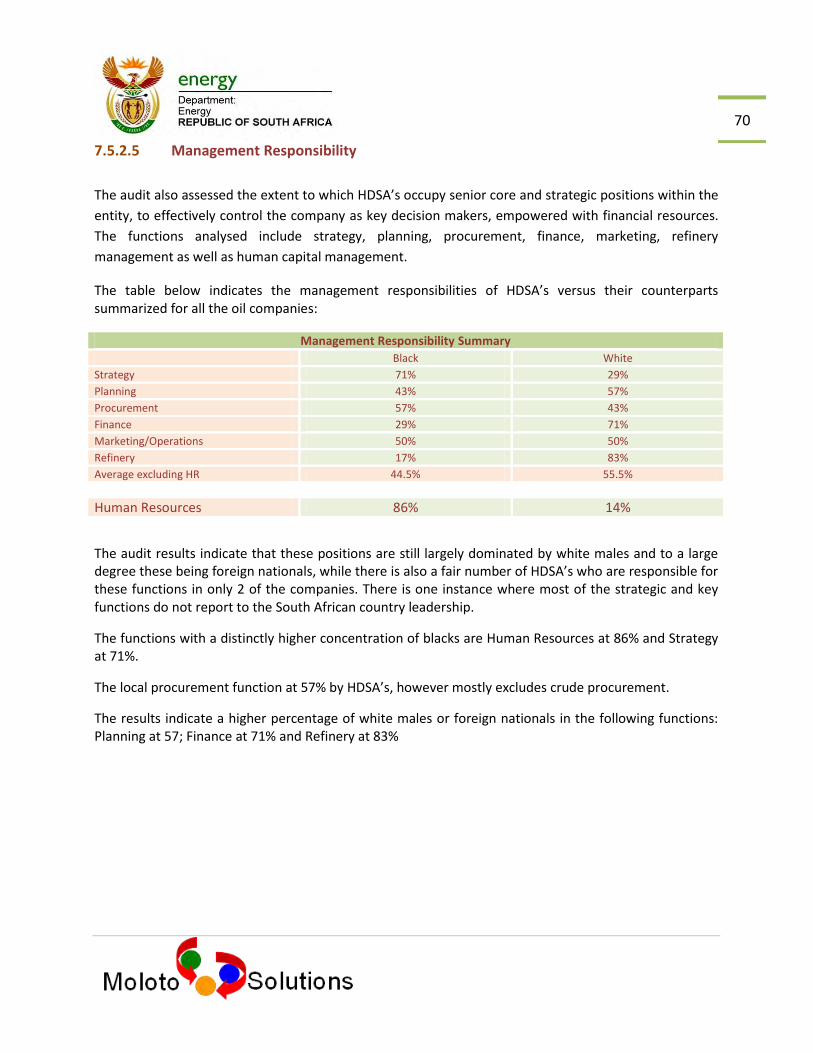
70
7.5.2.5 Management Responsibility
The audit also assessed the extent to which HDSA’s occupy senior core and strategic positions within the
entity, to effectively control the company as key decision makers, empowered with financial resources.
The functions analysed include strategy, planning, procurement, finance, marketing, refinery
management as well as human capital management.
The table below indicates the management responsibilities of HDSA’s versus their counterparts summarized for all the oil companies:
Management Responsibility Summary
Black White
Strategy 71% 29%
Planning 43% 57%
Procurement 57% 43%
Finance 29% 71%
Marketing/Operations 50% 50%
Refinery 17% 83%
Average excluding HR 44.5% 55.5%
Human Resources 86% 14%
The audit results indicate that these positions are still largely dominated by white males and to a large degree these being foreign nationals, while there is also a fair number of HDSA’s who are responsible for these functions in only 2 of the companies. There is one instance where most of the strategic and key functions do not report to the South African country leadership.
The functions with a distinctly higher concentration of blacks are Human Resources at 86% and Strategy at 71%.
The local procurement function at 57% by HDSA’s, however mostly excludes crude procurement.
The results indicate a higher percentage of white males or foreign nationals in the following functions: Planning at 57; Finance at 71% and Refinery at 83%

71
7.5.2.6 Budget Responsibility
The table below depicts the budget responsibilities of the senior top management or executives at the oil companies. The overall summary indicates a 17% allocation of the total budget to blacks or HDSA’s executives versus the total allocation to whites and foreign nationals which is at 83% overall, indicating a skewed delegated power and access to financial resources in favor of white males and foreign nationals.
Budget Allocations
Overall Company Budget Allocations
Black Whites & Foreign Nationals
17% 83%
7.5.2. 7. Contracting HDSA responsibility Levels
The graph below contrasts the Participation, Job Content and Budget Responsibility levels of the HDSA’s and depicts the imbalance.
0
10
20
30
40
50
60
HDSA Participation HDSA Job Content HDSA Budget Responsibility

72
7.5.3 Key Observations
Summary
A quick review of the income differentials did not indicate major differences between the race and
gender groups. However it is important to understand that conclusive findings regarding income
differentials can only be achieved through industry benchmarks and in-depth analysis of a
representative sample of all incumbents.
Strategies and Policies
EE strategies have been developed by most companies which include Talent, Remuneration and
Retention and Exit Management.
The EE policies, to guide the development, implementation and monitoring of EE have been
implemented by most companies.
At times the policies are very specific e.g. recruitment and selection policy forecast to bring
HDSA’s at the ratio of 25% whites and 75% blacks and in the manager’s KPI.
Some have an unwritten policy to prioritise black people.
Processes and Systems
The experience of some staff is that the recruitment and selection process is just a compliance
issue as the candidate for the job is identified before the recruitment and selection process
especially when there is an internal advert.
It has been alleged that line managers give higher level positions different titles and job profiles
with unnecessarily stringent specifications, so as to motivate for new recruits as a way of
sidelining existing staff, especially HDSA’s.
One company reported to have recently invested in an Employment Equity Scenario planning
tool which assists with planning, Implementation and monitoring of numerical goals.

73
Initiatives and Programs
The establishment of the EE forum to facilitate all employment equity discussion and challenges
did not progress very well for some companies.
Women Network Forums to network with global counterparts also exist.
In some companies women are provided coaching and mentoring opportunities and identified
women are sponsored for fast track global career advancement.
Organisation seen to be bringing a lot of black graduates, interns, learnerships and other black
staff just to improve on their equity profile, without an intention to prepare and absorb them b
into the permanent workforce. As a result blacks languish in junior positions.
Challenges
There are also challenges of implementation in some organisations due to the fact that the EE
plan has not always been published or successfully communicated across the company.
Employment opportunities for HDSA’s are allegedly mostly afforded one race group, in some
instances, which is perceived as nepotism by other HDSA groupings.
Most Africans still occupy the lower levels in the organisations and are not at management
levels.
There is a perception that although the company has black executives and directors whites still
run the show. The decrease in black representation at senior management levels seems to bear
this out.
There is still a perception by some that blacks are not capable of performing certain tasks such
as running the refinery.
There is still very little progress regarding the inclusiveness of gender at senior management
level in the oil industry overall.
Also the recruitment of employees with disabilities remains a serious challenge.

74
7.6. PROCUREMENT Charter Objective: Industry players to subscribe to and adopt supportive procurement policies to
facilitate and leverage the growth of HDSA companies. Such policies include criteria that favour HDSA companies, all else being equal.
7.6.1. Audit Results 7.6.1.1. Procurement Summary Results
LFC Key Performance Level Percentage
Crude from HDSA’s Crude HDSA’s > 50%
Average 4.9% 2.71%
LFC Sub-Element Compliance Status
Element Charter Sub-Element Scoring Principles Average
Procurement Supportive procurement policies Inclusion of exact wording in policy documents and proof of implementation
M
- Towards growth of HDSA companies
- With criteria that favour HDSA companies
Scope of preferential procurement to include all supplies (including crude)
Scope of preferential procurement to include all supplies (including crude)
M
List of HDSA suppliers Availability of comprehensive listing of appropriate quality
H
Vessels used in the transportation of supplies/products to meet all prescribed health, safety and environmental standards
Inclusion of exact wording in policy documents and proof of implementation YES
Average compliance status in the industry MEDIUM
Compliance: 3 out of 7 (42.86%) companies complied fully with the LFC on Procurement
2006 / 2011LFC Audit Results Comparison
Element Indicator 2006 2011 Increase
Total all procurement total from >25% black owned companies
3.28% 7.2% 28.81%

75
7.6.2. Additional Observations
7.6.2.1 Detailed Procurement Spend Analysis
Outsourcing and Procurement Category
(excludes expenditure on internal activities)
Total spend for use within South
Africa (Rand Mil)
Share to HDSA companies
(R'000)
Share to HDSA
companies (%)
Spend split by % HDSA ownership/
control
Over 50% 25 to 50%
TOTAL INDUSTRY
Total Discretionary Spend 31,867,492,552 8,568,760,067 26.9% 12.0% 10.7%
Crude Oil 91,972,032,709 4,506,922,764 4.9% 2.7% 1.9%
Grand - Total 163,124,949,850 14,039,520,031 8.6% 4.5% 3.2%
TOTAL INDUSTRY LESS PETROSA
Grand - Total 155,358,749,850 12,810,857,531 8.2% 4.0% 3.2%
7.6.2.2 Important notes on the spend analysis table
It should be noted that these amounts are largely as reported by the oil companies except for minor adjustments for errors and inconsistencies. Moloto Solutions also had to rely on the systems used by the oil companies to distinguish these percentages. We did, however review the manner in which the systems work and test-checked some entries, in 4 of the 7 companies. It will also be noted that the two columns representing over 50% HDSA and 22-59% HDSA do not exactly add up to the column representing procurement from all HDSA’s. The minor discrepancies are due to a combination of the following reasons:
The fact that most of the systems used by the oil companies to determine HDSA spend are largely in compliance with BEE and therefore only pick up black as opposed to HDSA spend in this regard, whereas the HDSA column in some instances included spend with white women owned companies and expenditure with less than 25% black-owned companies.
Minor adjustments made by Moloto Solutions where some claimed HDSA spend was not justifiable and/or there was obvious finger / logical error in the submitted information.
7.6.2.3 HDSA Discretionary as a % of Total Procurement Spend
The total discretionary spend amounts to R31.9 billion. Of this amount, 26.9%, = R8.6 billion is spent on all HDSA’s, 12% is spent on HDSA's with black ownership in excess of 50% and 10.7% is on HSDAs with black ownership between 25% and 50%.

76
7.6.2.4 HDSA Procurement as a % of Total Procurement Spend
Total procurement spend by the industry amounts to R 163 billion. Of this amount, 8.6%, = R14 billion is spent on all HDSA’s, 4.5% is spent on HDSA's with black ownership in excess of 50% and 3.2% is on HSDAs with black ownership between 25% and 50%.
7.6.2.5 Crude Procurement
Total procurement spend on crude reported by the industry amounts to R 92 billion. Of this amount, 4.9%, = R4.5 billion is spent on all HDSA’s, 2.7% is spent on HDSA's with black ownership in excess of 50% and 1.9% is on HSDAs with black ownership between 25% and 50%. One company reported some expenditure on a Crude trading house that was 25% black woman owned. This expenditure is however excluded in the above amounts as the last purchase was in 2009 and the company has since been dissolved.
7.6.2.6 Spend analysis from >50% HDSA companies
The purpose of the table below is to highlight the lowest to highest procurement spend from HDSA's that have black ownership in excess of 50%.
Expenditure of at least 25% - Civil and Maintenance, Transport and Service Industries.
Expenditure of at least 20% - IT & IM (info management and hardware), Logistics, Industrial and
Mechanical Maintenance.
Expenditure of at least 10% - Marketing and Advertising, Chemicals & Allied Products, Global
Procurement, Food, Catering & Office services and Stationary & Consumables.
Expenditure of at least 5% - Professional Services, HSE Spend, Electrical & Instrumental Maintenance
and Protective Clothing and Uniforms.
Expenditure of below 5% - Packaging, Crude Oil, Telecommunication, Natural Gas, Other Capex,
Additives, finance & Insurance and Coal.

77
Rating of Procurement spend from >50% HDSA's
Service area and percentage spend
25 % or greater
Civil and Maintenance
Transportation
Service Industries
20 – 24.99%
Industrial and Mechanical maintenance
Logistics
IT & IM (info management and hardware)
9.9 –1 9.99%
Chemicals and Allied products
Marketing and Advertising
Stationery and Consumables
Food, catering and office services
Global Procurement
4.9 – 9.99%
Electrical and Instrumental Maintenance
Professional Services
HSE Spend
Protective Clothing and Uniforms
Less than 5%
Additives
Finance and Insurance Services
Telecommunication
Packaging
Crude Oil
Natural Gas
Coal
Other Capex

78
7.6.3. Key observations
Preamble
It is critical to indicate that during the audit we experienced challenges in analyzing information received from participating companies because: The information supplied was not completed as per requirements and some key schedules requested were not completed by some of the auditees.
The information contained herein is mostly for 5 out of the 7 audited oil companies. 2 companies did not complete the Detailed and Summary Procurement Spend Analysis schedules as required.
All the companies’ information could not be adequately reconciled as the reconciliation sheets were not filled in completely accurately.
Here-under is a summary of the possible TMPS, Crude Oil and Total expenditure amounts as per the various sources. The rows shaded green contain the information used in the report.
Moloto Solutions essentially used the amounts as per the detailed spend analyses submitted by the companies as much as possible, slightly adjusted in 2 cases, as this is the only schedule in which details of purchases from HDSA companies were provided.
Procurement Reconciliation Summary
Crude approximations per the different schedules
Imports 83,952,916,082 Per TMPS schedule
Crude 87,190,677,074 Per original detailed spend analyses
Crude 91,972,032,709 Per detailed spend analysis estimates & report
Supply & Trading 68,275,529,748 Per summary spend analyses
TMPS approximations per the different schedules
TMPS (Total measured procurement Spend) 90,452,821,276 Per TMPS schedule
Discretionary Spend 31,867,492,552 Per detailed spend analyses
TMPS (Total measured procurement Spend) 88,669,820,959 Per audit reconciliations
Total expenditure approximations per the different schedules
Cost of sales, Operational expenses, Capital expenditure 214,018,482,319 Per TMPS schedules
Cost of sales, Operational expenses, Capital expenditure 163,124,949,850 Per detailed spend analyses
Cost of sales and exclusions 262,856,111,884 Per audit reconciliations
Cost of sales, Operational expenses, Capital expenditure 146,073,767,000 Per financial statements
79
Policies and Strategies
The following policies are commonly used for the advancement and development of HDSA suppliers:
Some companies indicated that some policies and processes are developed from global office and used by all levels of operations. Provision is however made to accommodate local requirements and compliance with local laws.
Crude is sourced outside South Africa for most of the companies who largely procure from equity sources or international markets. They only procure locally during unplanned shortages.
One company has a crude policy guideline which sets aside 25% of crude and product purchases to HDSAs. (They have however not made any HDSA purchases in the past financial year).
Most companies give highest preference to level 1- 4 BBBEE contributors with a special preference if the company is black owned and black woman owned. 2 of the companies scored full points on the BBBEE scorecard w.r.t. procurement from black woman owned companies.
However most companies do not have incentives/ preference for companies owned by youth and people with disabilities.
Processes and Systems
Registered suppliers are required to go through a BEE status verification process before they are classified as BBBEE compliant (HDSA). For larger tenders, in addition to the verification process, a due diligence audit at the suppliers premises is conducted to confirm the veracity of the information.
The tender process is largely run on a closed tender basis and reliance is placed on internal supplier databases.
HDSA supplier data bases which are monitored and maintained on an on-going basis.
Initiatives and Programs
SASDA had been expected to assist companies to develop suppliers and develop an industry supplier data base. However companies allege that SASDA has not managed to create this database and it employs independent service providers to develop suppliers, which is not ideal. As a result some companies have created own supplier development departments and initiatives. SASDA in turn, lacks sufficient financial resources to be able to provide this level of service, amongst other challenges.
The following are the typical supplier development support initiatives:
Payment guarantees to enable facilitation of more favorable terms with counterparts and financial institutions.
Early payment cycles.
Preferential credit terms on a case by case basis. Capacity building programs for a period of 2 years to ensure suppliers have sufficient capacity
and skills in one instance. Tender process training HSEQ training

80
In some companies the HDSA suppliers were not aware of the development initiatives available to them. Challenges
The auditees reported the following challenges in improving HDSA procurement:
Most Crude procurement and supply is controlled by international parent companies.
Delays in the completion and availability of the SASDA database.
Lack of visibility of technically qualified and competent suppliers including black owned and
black women owned enterprises for among others construction projects in forecourt, and
mechanical, engineering, civil and processing jobs.
The challenge of buying crude from local traders is that they do not really trade but are brokers /
facilitators. It is thus generally more expensive to buy from them.
Some HDSA suppliers fail Health and Safety requirements.
Lack of development finance.
Process Challenges
Moloto Solutions has interpreted the LFC requirements for this element only as contained in the Private Sector Procurement paragraph. There is merit in the interpretation, by some, of the LFC’s requirement in the preamble of a “quarter of each facet of the industry... across the value chain...” to partly mean that 25% of all procurement should be from (>50%) HDSA companies across the value chain.
If this interpretation is used, none of the companies comply with this element as they do not meet this target with respect to Crude and a number of the other product areas, and in terms of total procurement as detailed in the above table. (Only 1 company seemed to comply at the level of total procurement on this basis, subject to proper reconciliation).

81
7.7. ACCESS TO JOINT FACILITIES AND OTHER INFRASTRUCTURE Charter Objective: Access to large infrastructure for the movement and storage of crude oil and
petroleum products, such as SBMs, pipelines and depots and storage tanks, is acknowledged as a critical weakness in the supply chain of emerging companies. Owners to provide third parties with non-discriminatory access to uncommitted capacity.
7.7.1. Audit Results 7.7.1.1. Access to Joint Facilities Summary Results
LFC Key Requirements
Ownership Access
Average Status Fair Ownership opportunities No access by HDSAs
LFC Sub-Element Compliance Status
Element Charter Sub-Element Scoring Principles Average
Access to Joint
Facilities
Fair ownership opportunities Analysis of BEE ownership percentage. 25%Legal and effective black shareholding, through voting rights, rights to economic interest
M
Non-discriminatory access to uncommitted capacity for the movement and storage of crude oil and petroleum products
Non-discriminatory access to HDSA businesses to these joint facilities (over and above HDSA shareholders)
NO
Average compliance status in the industry NO
Compliance Level: 3 out of 7 companies complied with the LFC on Access to Joint Facilities NO
7.7.2. Key observations
Situation Analysis These key facilities include: SBM (Single buoy mooring), Berth facilities, Depot & storage facilities and Pipelines.
The Oil majors own and operate most of the petroleum facilities and infrastructure (SBM, berths and storage terminals) in the country. The pipeline is owned and operated by Transnet Pipelines (TPL). They (TPL) also own and operate storage facilities for product accumulation purposes and ‘intermixture’ handling and a storage terminal.
These facilities and infrastructure require large capital investment. Most of them are old and have depreciated in value, especially the storage tanks. However the oil majors are reportedly investing a lot of capital in building new ones and revamping old ones.
The oil majors claim that there is no uncommitted capacity in their facilities for access by third parties as required by the Petroleum Pipelines Act number 60 of 2003. They also do not have allocation mechanisms for uncommitted capacity. HDSA wholesalers are thus forced to import through Mozambique as there is no access in Durban.
82
The refined products pipeline network is currently constrained in terms of capacity. This, however, will be resolved by the commissioning of the new multiproduct pipeline (NMPP) expected early 2013. The crude oil pipeline is currently not constrained; both the refined products and crude oil pipelines are used mainly by the oil majors.
A lot of facilities (especially, inland storage and distribution depots) were closed down without availing them to HDSA’s.
Policies and Strategies
Most companies indicated that they do not have policies/strategies to provide access to joint
facilities and other infrastructure to HDSA companies. The initial thinking was that their
ownership deals would suffice for this purpose.
Nersa’s failure, for a number of reasons to enforce the PPA in this regard, i.e. that “licensees
should annually submit their allocation mechanisms and uncommitted capacity and Nersa must
use this information to facilitate ownership, control or management of operations of petroleum
pipelines, storage facilities and loading facilities”, among others, exacerbated the matter.
There is too much uncertainty on modus operandi and applicable policies in that allocation
mechanism guidelines had not been finalised until recently and are seemingly still not properly
and uniformly understood.
This also gets worsened by concurrent legislation – e.g. LFC / BEE / PPPFA / Ports Act / PPA /
PPAA - compliance with one could mean breach of another.
There are no supplier development efforts by oil companies in this area.
Access to facilities at the ports is so far largely based on “gentlemen’s agreements” and with no
room to accommodate new entrants – whereas this is critical for anyone who needs to import.
The Competition Act is lately cited as the reason for inability to provide this information, by
some.
Processes and Systems
The oil companies do not have allocation schedules/mechanisms.
The oil companies also generally admitted that the HDSA’s do not have access to information
regarding uncommitted capacity. However, a few insisted that they have advertised the sale of
storage terminals on major newspapers whilst others maintained that there have not been any
enquiries from HDSA’s regarding uncommitted capacity.

83
Initiatives and Programs
Companies did not offer any joint venture opportunities to HDSAs. A recent consideration has
been to sell depots which are no longer in use. HDSA wholesalers believe these to be white
elephants which will add no value to them as well.
Activities reported / observed include the following minimal recent efforts, mostly in remote
areas:
o Enabling access to facilities by closing some of their storage terminals and putting them
up for sale.
o Selling fleet via internal auction to enable smaller distributors to buy, giving them
opportunity to compete in the transportation of bulk fuels.
o Ceding of operational management of some of their depots to HDSA’s (SDCOs – small
distributor companies).
o Indirectly providing access to the empowerment partner, at cost.
o Enabling access to pipeline to an HDSA wholesaler.
o Selling a bulk storage terminal to a 100% HDSA company.
Plans reported include:
One company pointed out that Berth 6 industry partners have established a project team to
source an HDSA company as a new entrant owner. The company is prepared to sell a minimum
of 50% of their shares in berth 6 – the amount of shares to be sold will depend on the needs and
negotiations with the prospective HDSA buyer.
Another indicated that it is in the process of constructing additional tank capacity and therefore
opportunities will be available for access by HDSA’s.
The other company is in the process of developing a depot infrastructure strategy and this will
most likely include hosting arrangements with third parties.
Challenges
The common challenge experienced by the oil companies is the current capacity constraints in
storage terminals, pipeline and marine tankers.
Bulk storage facilities at areas requested by HDSAs are currently used at full capacity, in most
cases the uncommitted capacity is for LRP (lead replacement petrol), whereas the requirement
is on diesel.
Challenges of HDSA’s center around the legislative environment. There are some inadvertent
loop holes and failure to enforce the provisions in their favour.

84
7.8. REFINING CAPACITY Charter Objective: Sell shares to the refinery to HDSA’s. Make refining capacity available to HDSA’s.
Offer opportunities for joint ventures for expanding or upgrading refineries.
7.8.1. Audit Results 7.8.1.1 Refining Capacity Results
Key Requirements
Sell Shares Avail Capacity JV Opportunities
Average Status Fair Ownership opportunities No Available capacity No JV opportunities
LFC Sub-Element Compliance Status
Element Charter Sub-Element Scoring Principles Average
Refining Capacity
Selling shares in the refinery to HDSAs Analysis of BEE ownership percentage. 25%Legal and effective black shareholding, through voting rights, rights to economic interest
M
Making refining capacity available to HDSA companies, thru , e.g. toll refining agreements
Non-discriminatory access to HDSA businesses to refining capacity (over and above HDSA shareholders)
NO
Providing JV opportunities by including HDSA’s in expansion/upgrade programmes
JV opportunities to HDSAs in expansions / upgrades
NO
Average compliance status of the industry NO
Compliance Level: All 7 companies did not comply with the LFC on Refining Capacity
7.8.2 Key Observations
Situation analysis Summary of Current Infrastructure Landscape South Africa is reported to be amongst the few major refining centres in Africa, together with Nigeria, Egypt and Algeria. The SAPREF refinery is said to be the second largest in Sub-Saharan Africa following the Port Harcourt refinery I and II in Nigeria.
South Africa has four (4) refineries and two (2) synfuel plants i.e. Sasol plant in Secunda and PetroSA
plant in Mossel Bay. These two (2) plants produce gasoline and diesel fuels from coal and natural gas
respectively.
All the six refineries are running at full capacity and therefore the oil majors are unable to offer HDSA companies spare capacity. The only way the HDSA companies are benefiting is through the share ownership scheme allocated to them. A refinery requires huge capital investment which could be one of the barriers to entry by HDSA’s.
Products from local refineries are reported to provide about 17% of South Africa’s primary energy needs

85
7.8.2.1. Refinery Capacity
Refinery Nameplate Capacity (crude throughput)
Refinery Production Current SA Supply Current SA Demand
Chevron 110 000 bbl/d 3.5 bill l pa
24 bill l pa 26 bill l pa Enref 125 000 bbl/d 3.5 bill l pa
Natref 109 000 bbl/d 4.8 bill l pa
Sapref 165 000 bbl/d 5.2 bill l pa
Table Source: MBendi Oil Refining in Africa Overview
Policies and Strategies
There are no policies and strategies in place that are related to offering refining capacity to
HDSA’s
All the oil companies have sold shares to HDSA companies. However the effective Black
shareholding as measured by way of mainly voting rights and economic interest is much lower
for some. Refer to ownership section.
The oil companies agree that they do not have plans for HDSA access to their refining capacity.
Processes and Systems
No allocation schedules/mechanisms due to unavailability of uncommitted capacity.
Spare capacity offered to other oil companies during emergencies.
Initiatives and Programs
Generally no supplier development has taken place with regards to refining.
One company claimed to have partnered with a BEE company to do engineering work at its
refinery.
One company established a Refineries Transformation Forum due to the fact that the refinery
procurement spend is not being shared with HDSA’s.
Challenges
Companies have indicated that they do not have spare capacity in their refineries.
The state of the refineries needs to be improved and that requires huge capital investment.
Refineries are unable to service growth in demand, depending largely on the pipeline for the
inland markets and also have to cope with insufficient rail capacity.
Scarcity of technically skilled and qualified Africans, especially women, who can be promoted
through the ranks, to operate and manage the refinery, or provide services to refineries.
Negative impact of crude oil price volatility, while the refining margins are relatively low.

86
7.9. RETAILING
Charter Objective: Create fair opportunity for entry to the retail network and commercial sectors by HDSA companies.
7.9.1. Audit Results
7.9.1.1 Retailing Results Summary
LFC Key Percentages
% HDSA Retailers % HDSA Volumes
Average 40% 41.25%
LFC Sub-Element Compliance Status
Element Charter Sub-Element Scoring Principles Average
Retailing Fair opportunities for entry to the retail network
Analysis of BEE Ownership percentage L
Fair opportunities for entry to the retail network
Equitable retail opportunities to HDSAs L
Average compliance status of the industry Low
Compliance: 4 out of 6 (50%) companies complied fully with the LFC on Retailing
2006 / 2011 LFC Audit Results Comparison
Element Indicator 2006 2011 Increase
Retailing
All sites for all Companies black volumes % 44% 40.00% -9.1%
7.9.1.2 Detailed results summary
Total Sites & Volumes Overall % Total Sites Overall % Total Volumes
African Dealer owned 5% 4%
African Company owned 9% 10%
African Total owned 14% 13%
Coloured Dealer owned 3% 2%
Coloured Company owned 2% 2%
Coloured Total owned 4% 5%
Indian Dealer owned 9% 8%
Indian Company owned 13% 14%
Indian Total owned 22% 23%
Black, coloured Indian Dealer owned 16% 15%
Black, Coloured, Indian Company owned 24% 26%
Total Black, coloured Indian sites owned 40% 41%
White Dealer owned 31% 28%
White Company owned 29% 32%
White Total 60% 59%
Total all Dealer sites 48% 43%
Total all Company sites 52% 57%
Total Sites 100% 100%

87
7.9.2. Additional Observations
7.9.2.1 Company Owned Retail Landscape by Race
White people are still managing and owning more sites compared to HDSA’s combined but there is a
slight decrease in the number of whites managing the urban compared to the transient sites. The
volumes pumped at these sites almost mirror the percentage of ownership per race group, except with
one company where the HDSA percentage volumes are 87.5% of the sites and thus not equitable.
Percentage Number by Race
17%0%2%
80%
Transient% - Site
Black
ColouredIndian
Percentage Volumes by Race
6% 0%1%
93%
Transient Race% - Volume
Black
Coloured
Indian
White
Percentage Number by Race
17%3%
26%
54%
Urban% - Site
Black
Coloured
Indian
White
Percentage Volumes by Race
19%
5%
29%
47%
Urban Race% - Volume
Black
Coloured
Indian
White
Percentage Number by Race
22%
5%
19%
55%
Rural% - Site
Black Coloured Indian White
Percentage Volumes by Race
17%
2%
22%59%
Rural Race% - Volume
Black
Coloured
Indian
White

88
7.9.2.2 Dealer Owned Retail Landscape by Race
The Ownership of and volumes pumped by Whites outnumber those of the HDSA’s collectively. White dealers pump 3 times more than Indians who are second in dominance.
Percentage Number by Race
Percentage Volumes by Race
Percentage Number by Race
10%4%
21%
66%
Urban% - Site
Black
Coloured
Indian
White
Percentage Volumes by Race
10%4%
21%
66%
Urban Race% - Volume
Black
Coloured
Indian
White
Total Rural Sites by Race
10%10%
13%
68%
Rural% - Site
Black
Coloured
Indian
White
Total Rural Volumes by Race
8%12%
16%
64%
Rural Race% - Volume
Black
Coloured
Indian
White

89
7.9.3. Key observations
7.9.3.1 Situation Analysis
Summary
It should be noted that the results above are based on only 4 companies, as the other two could not present their information in the required format for this analysis.
The oil companies still own a large number of transient sites and the management of those sites is still
largely white (approximately 81%). Blacks manage only +/-17% and Indians 2%. The volumes pumped at
these sites indicate that 78% are pumped at the sites managed by Whites.
The overall % HDSA retail sites are 40% and the related volumes are 41%. The African component of this is 14% and 13% respectively. The site / volume ratios are generally equitable except in one of the oil majors – where the HDSA volumes are only 87.5% of the site percentages.
There is an almost 10% gap between Indian and African representation rates. The reasons seem to include:
Some of the more successful retail operations have been family operated sites where experience cascaded through different generations.
o Some sites have been passed on to current Indian owners in this manner.
o There are some advantages of scale for Indian owners who might own or be related to
someone that is closely linked to the wholesale suppliers for the shops.
o Most Indian dealers seem to have the necessary capital to invest, when there is an
opportunity, and the inclination for the business.
Africans do not always seem to have own capital to invest although willing to put in the long
hours required by this type of operation. Some Africans who have the necessary capital are not
willing or able to work full time and manage the operation closely, only operating as venture
capitalists.
Policies, Strategies and Systems
The companies generally do have strategies and policies for recruitment and appointment of
franchisees and specific policies to increase HDSA participation.
Basic rural sites with low rentals which were started by general dealers/shop owners with the
assistance of Oil Company and local government (homeland) grants tended to be successful.
Forced partnership sites did not succeed due to the fact that sites are generally unable to sustain
2 households.
The initial capital outlay requirements have reportedly increased over the years.
Some companies use a point system with more points awarded for African applicants.

90
Initiatives and Programs
The following supplier development initiatives are in place:
Most companies have specific operational training and retail support structures that support
retailers on a day to day basis.
Mostly theoretical training is offered by oil companies to the retailers.
Limited aftercare and advice on critical success factors.
Most of the training is generic. No HDSA focused Retail Programs.
7.9.3.2 Challenges
7.9.3.2.1 Generic Challenges
Franchising
Franchise standards are not favorable to local economic development. Township / Rural
franchisees are unable to support promotion and development of local suppliers as oil
companies for instance, do not allow display / promotion of local community products.
The pricing structure on the franchise agreements is deemed as unfavourable to the retailer.
Most retailers have a sense of being bullied by the oil majors.
Retailers cited an ‘us against them’ mentality adopted by oil majors and too much emphasis on
company policy without any consideration for their welfare as marketers of the brand.
Some termination clauses in franchise contracts imply that should the retailer be in breach
(because they do not own assets), they would exit the business with nothing.
The rental and royalty levies are perceived as unfavorable against the retailer as rental is based
on the volumes sold. Retailers get discouraged to market and sell the products because their
efforts tend to be swallowed by the rental and royalty fee.
Barriers to entry
A lot of potential retailers face financial constraints and are not able to get financial assistance.
There is a perception of low gross profit margins. Generally, the revenue generated from the
first five years is used to service the loan, due to this.
Some retailers have cash flow management constraints, especially when fuel prices rise.
7.9.3.2.2 HDSA Retailer Challenges
Barriers to entry
High barrier to entry for HDSA’s due to increasing goodwill values by current owners. Goodwill is
also not regulated; therefore the seller is at liberty to charge any price to the detriment of most
HDSA’s.
Rules to on-sell are very stringent and restrict the black retailers from selling in the event of
financial challenges.

91
Nature of opportunities
HDSAs believe they are overlooked for the more lucrative opportunities like high volume sites
and expansion opportunities (e.g. additional products ranges).
Funding
The process of applying for and approval of funding is allegedly too long.
7.9.3.2.3 Oil company challenges
Technical skills/resource constraints
Not being able to find suitable candidates for the sites that are being sold, sometimes.
Some of the entrepreneurs have lack of industry retail experience.
Some owners purchase sites when they have other occupations and are thus not involved in the
operation of the site, including site manager supervision.
Non-compliance to standards by some retailers.
Business Plans and Projections used as criteria for granting of licenses don’t always work as
planned.
Access to finance.
7.9.3.2.4 Opportunity availment
Some earlier retailers have retail agreements that span many years and thus limiting
opportunities for black entrants. In one case the relevant arrangement involves even future
developments.
The affordability of sites is limited because of the prices, inclusive of goodwill, charged by private
sellers.
The ‘’Horse with a Rider’’ tendency, whereby the property owner insists that it be developed
and that he/she retains the exclusive right to operate the business.
The number of sites which can be developed annually and the period it takes to develop a new
site hamper any rapid growth of HDSA’s in the retail sector.
7.9.3.2. 5. Regulatory Matters
The fact that site licenses are transferable (though operational licenses not) makes it difficult to
enforce BEE compliance.
There are also concerns with turn-around times on applications for new licenses and
approval of changes.
o These have sometimes led to retailers being forced to operate without licenses.

92
7.10 WHOLESALING
Charter Objective: Create fair opportunity for entry to the retail network and commercial sectors by HDSA companies.
7.10.1. Audit Results 7.10.1.1. Wholesaling Results Summary
Key LFC Indicators
Ownership Equitable Opportunity
Average Medium Yes
LFC Sub-Element Compliance Status
Element Charter Sub-Element Scoring Principles Average
Retailing Fair opportunity for entry into wholesale / commercial sectors
Analysis of BEE Ownership percentage M
Fair opportunity for entry into wholesale / commercial sectors
Equitable wholesaling opportunities to HDSAs at all levels, i.e. reselling
M
Average compliance status in industry Medium
Compliance Level: 7 out of 7 companies complied with the LFC on wholesaling Yes
7.10.2 Additional Indicators
7.10.2.1 Wholesaling Purchases
Only 3 companies reported reliable information with regard to sales (reseller) amounts-in terms of both total and HDSA portion.
All the companies reported sales volume totals and related HDSA portion. However the information for only 4 of the 7 seemed reliable. The estimated HDSA reseller volume percentage provided is 33%.
In terms of wholesale purchases, only 3 of the oil majors and PetroSA provided information. The private sector companies only provided information with regard to Crude. It has thus been assumed that no other HDSA wholesale purchase takes place except by PetroSA.

93
7.10.3 Key observations
7.10.3.1 Situation Analysis
The wholesalers are categorized as follows:
Crude oil wholesalers – they import crude oil and sell to oil companies
Wholesale importers – they import refined products and sell to oil companies or direct to retail
and commercial customers. They also import crude oil. They have both wholesale and import
licenses.
Wholesale Distributors/ Resellers / Local wholesalers – they buy from local oil companies and
sell to their customers
Summary of Wholesaling Landscape
The most supported type of wholesalers are the resellers.
Policies and Strategies
Generally, the oil companies have policies and strategies that promote HDSA participation in the
local wholesale sector. Only 3 have these in place for imports.
Some multinationals have their own crude wells, and therefore buy only the type of crude they
do not extract.
A strategy by one company is to cap the number of HDSA’s used so as to accelerate their growth.
The two most important measures of success for HDSA wholesale participation that were
outlined by the oil companies were safety and reliability of service
The legislation issues were related mainly to exchange control rules affecting some of the
wholesalers who needed to purchase product in foreign currency. Exchange control regulations
state that no South African companies should trade in foreign currencies yet HDSA wholesalers
require foreign currency to pay for the product.
Initiatives and Programs
The supplier development programs offered include the following:
Letters of support to the bankers indicating that funds would be available on delivery of the
product. This applies to HDSA wholesalers in both crude and refined products.
Facilitating letter of good standing from the wholesaler’s bank.
Negotiating with development banks and commercial banks on the financing models; e.g. NEF.
Leveling the playing field by inviting HDSA wholesalers to bid in a closed tender process.
Imposing no penalties when HDSA wholesalers fail to take product as initially agreed.

94
Giving terms of credit – e.g. distributors only having to pay once the products have been sold
Offering of rebates / discounts.
Debt factoring (buying & managing the wholesaler’s debtor’s book).
Interest free loans.
One oil major used to pay a premium when purchasing from HDSA’s. This is no longer practiced.
Availing facilities, finance and other enterprise development support at cost/ or for free to
empowerment partners.
Training on compliance, safety and other technical matters.
7.10.3.2 Challenges
7.10.3.2.1 Challenges of Wholesalers
The major challenges facing HDSA wholesalers, resulting in an overall negative competitive position are funding, low margins, product shortages, access to joint facilities and other infrastructure, and legislation related. Specifically:
Funding access and cost
Margins – Large, continual volumes are required for business sustainability.
Product supply disruptions - Unstable diesel industry and petrol shortages.
Storage - Oil companies claiming that Storage is at full capacity, especially import storage in
Durban.
Access to pipelines - Pipeline owned by Transnet to move product from the coast has also not
been availed to oil minors thus far.
Imports - The import problems are around discharge equipment which belongs to the oil majors
and the price quoted for service is uncompetitive.
The use of Mozambique ports is an option but has its unique challenges including additional
importing costs (ad valorem to Mozambique customs vs. flat duty to SARS), and additional
transport costs to inland clients, where applicable.
Stringent technical and safety requirements.
Alleged illegal operators - Competing in areas where there are inferior products sold at reduced
prices, in Mpumalanga (primarily products coming from across the border), mining & farming
sectors
Lack of enforcement - No enforcement of supportive legislation w.r.t access to infrastructure
Negative competitive position - Only called upon to supply at spot, and tenders are mostly all -
inclusive and therefore a challenge on pricing in that the wholesaler competes with oil majors.

95
7.10.3.2.1 Challenges of oil companies The oil companies reported the following challenges regarding HDSA wholesalers:
Storage capacity constraints - Unavailability of spare/uncommitted capacity at the depots where
the wholesalers need to operate
Cash flow constraints – Non-payment for product by some HDSA wholesalers due to cash flow
constraints, and Poor Cash flow management.
Lack of strategy and commitment
o Some HDSAs generally do not have long term strategy for their businesses. They pull out of
the business at the first sign of problems
o Some owners of the HDSA companies are not focused on the wholesale business, especially
those who entered the market solely because they had money to do so.
o Some of the wholesalers have licenses but do not operate. They code their licenses to other
companies and become commission earners.
Lack of industry knowledge - Shortage of HDSAs with adequate experience in the industry.
Security of supply - Products not always available at highest demand areas.
Unprofitable to deal with HDSA wholesalers – largely no benefit for an oil company in terms of
margins from dealing with black wholesalers. The HDSA wholesalers therefore have to move
very large volumes to make it worthwhile for the oil company.
Regulations not aligned - DOE and the Reserve Bank regulations are not aligned, which makes it
very difficult to do business with HDSA wholesalers.
Too many licensed HDSA wholesalers - There is a perception that too many wholesalers acquire
licenses without the requisite knowledge to operate and be supported effectively in the
industry.

96
7.11. ENTERPRISE DEVELOPMENT
Charter Objective: Create fair opportunity for entry to the retail network and commercial sectors by HDSA companies.
Through enterprise development companies can help create sustainable businesses by providing them
with the necessary tools, knowledge and finance, thus reducing dependence on Government and bigger
businesses for grants and subsidies, and increasing the number of self-sustained businesses and
individuals.
The table below depicts the enterprise development activities that were encouraged by the LFC and whether or not these are being implemented by the oil majors. It shows that most of the charter recommended activities are not implemented by the oil companies, who have opted for quick wins in terms of the BBBEEE codes, like early payments, as opposed to strategic, intensive interventions like support of import wholesalers and access to strategic facilities. It thus shows the extent of the lost opportunity to meaningfully contribute to HDSA advancement – as these interventions were well considered at the time of drafting the charter.
It also partly explains why Enterprise Development is the lowest scoring LFC element.
7.11.1. Implemented Enterprise Development Initiatives
ED INITIATIVES
No. Charter Element Recommended ED initiative Average
1 Private Sector Procurement Supportive/Preferential Procurement policies Medium
2 Access to Joint Facilities Non discriminatory access to joint facilities Low
3 Refining Capacity Non discriminatory access to refinery No
3 Refining Capacity Joint venture opportunities for upgrade No
4 Retailing Fair entry opportunity to HDSAs Medium
5 Wholesaling Imports Fair entry opportunity to HDSAs Low
5 Wholesaling Local Fair entry opportunity to HDSAs High
6 Financing Access to funding for ownership & strategic relationships High
7 Terms of Credit Purchases Favorable terms of credit to HDSA suppliers High
7 Terms of Credit Retailers Favorable terms of credit to HDSA retailers Medium
7 Terms of Credit Local Wholesalers Favorable terms of credit to HDSA wholesalers No
8 Synfuel Supply Fair entry opportunity U

97
7.12. SOCIO-ECONOMIC DEVELOPMENT
Charter Objective: N/A.
The following are projects that oil companies are supporting among others:
1. Education Sector
- Maths and Science
- Teacher education
2. Health Sector
- HIV – AIDS
- Children’s Hospitals
3. Welfare
- Food Bank of SA
4. Environment sector
- Natural Disasters
5. Heritage / Arts and Culture sector
6. Economic Development projects
Only 3 companies had quantified the projects; their total spend during the measurement period was R
40 million.

98

99
8. SUMMARY AUDIT RESULTS 8.1. Preamble
The following over-arching principles need to be borne in mind in reviewing the results following:
Scoring is at the level of the 34 sub elements (requirements) of the charter.
Element level scores are aggregates / averages of the sub-element results.
The ownership and management control elements are scored strictly according to the
specific charter requirements because of the explicit nature of these for the 2 elements
Any “No” result for any sub-element requirement results in an overall “No” for that
element.
No weighting has been applied to any sub-elements, to avoid subjectivity
Scoring is only on LFC related percentages. There is no scoring attached to additional
indicators on each element – these indicators are only for information, baseline and future
framework use.
The terms HDSA / Black have been used inter changeably through-out the report. This was
also the approach with the 2006 audit.
o Except where a critical distinction had to be made between the two. The only such
major occurrence has been in the communication of the ownership scores of one of
the oil majors due to minor white women shareholding.
The period of the audit is 10 years from 1st November 2000 to 30 October 2010. The last
year or two have been used as the basis for most of the progress review. However, where
there has been no progress over the last two years and/or there is a significant recent
change in circumstances, as in for instance access to refineries and infrastructure, we have
investigated whether there was relevant performance in the earlier life of the charter, when
circumstances were different.
All the above was done to ensure as much objectivity and uniformity of scoring as the
current charter (with acknowledged shortcomings in terms of uniform / objective
measurability) could allow.
The following information was not considered:
o Information provided in different format –Only information submitted in the requested
format was scored for certain elements where the format was crucial to the analysis and
underlying interrogation.
o Information provided verbally or in the questionnaire only –Certain information
needed to be corroborated through the schedules requested. Auditees’ unsubstantiated
or insufficiently corroborated information could not be used in those instances as it
would compromise the overall integrity of the audit.
o Interventions or corrective measures after 31/10/10 / (cut-off date of audit).

100
8.2. Summary results by sub-element
The summary audit results below indicate a consolidated view of the results of all 7 oil companies based
solely on the current LFC.
LFC AUDIT SCORING PRINCIPLES Performance Level
No Element
Charter sub-elements
Simple Qualitative
Basis
Numeric Semi-
Scientific Basis
Compliance Level by all companies
1 Ownership
1 25% ownership and control of entity that holds the SA operating assets of the Oil company. M 70% N
2 HDSA ownership to apply to all segments of the Value Chain Y 100% Y
3 Sustainable presence/Sustainability through medium to long term viability. Y 90% N
2 Management Control 4
Control of the entity through majority shareholding, effective controlling shareholding or majority of board. H 89%
Y
3 Supportive Culture
5 Appointment of managers to create a supportive culture and enabling environment for business success M 51%
Y
6 Appointing appropriate managers who will understand the spirit and background of the charter policies M 46%
Y
7 Fostering of a supportive culture w.r.t all aspects of this Charter when dealing with HDSA’s M 44% Y 8 Incorporating culture change policies in business principles. M 49% Y
4 Capacity Building
9 Training of HDSA employees on core, priority and scarce skills M 64% Y
10 Overseas training programs for HDSA’s L 24% N
11 Identifying a talent pool & fast tracking it NO 11% N
12 Implementing mentorship programs NO 11% N
13 Learner-ship opportunities M 46% Y
14 Annual progress reports in agreed format M 50% Y
5 Employment Equity
15 Publishing of equity stretch targets and achievements M 57% Y
16 Meeting of stretch equity targets NO 17% N
17 Job content of HDSAs vs non-HDSAs M 49% N 18 Ensuring inclusiveness of gender L 30% Y
6
Private Sector Procurement
19 Supportive procurement policies M 53% Y
- Towards growth of HDSA companies
- With criteria that favour HDSA companies
20 Scope of preferential procurement to include all supplies (including crude) M 50% N
21 List of HDSA suppliers H 71% N
22 Vessels used in the transportation of supplies/products to meet all prescribed HSE standards Y 100% Y
7
Access to Joint facilities
23 Fair ownership opportunities M 70% Y
24 Non-discriminatory access to uncommitted capacity for movement and storage of crude oil and petroleum products NO 16%
N
8 Refining Capacity
25 Selling shares in the refinery to HDSAs M 70% Y
26 Making refining capacity available to HDSA companies, thru , e.g. toll refining agreements NO 0% N
27 Providing JV opportunities by including HDSA’s in expansion/upgrade programmes NO 5% N
9 Retailing
28 Analysis is of BEE ownership percentage L 30% Y
29 Fair opportunities for entry to the retail network L 32% Y
10 Wholesaling
30 Analysis is of BEE ownership percentage M 57% Y
31 Fair opportunity for entry into wholesale / commercial sectors M 43% Y
11 Financing 32 Investigation and implementation of internal and external financing mechanisms for giving HDSA’s access to equity ownership and entry into viable strategic partnerships. Y 93% Y
12 Terms of Credit 33 Providing terms of credit to HDSA customers (e.g. retailers and client wholesalers) M 56% N
13 Synfuels Supply 34
Parties to accommodate HDSA’s, which lack the facilities to comply fully, in the fairest way possible UN 0% U
Average M 48% 62%

101
8.2.1. Spread of sub - element responses
To better distinguish levels of performance, the scoring was converted to numerical semi-scientific measures as follows: Yes & N/A High Medium Low Unknown No
5 4 2.5 15 0 0
The scores can be summarized as follows:
Stringent Basis:
The audit results indicate an average 19% rate of full compliance by the oil companies. This is
determined from the number of out-right “Yes” responses which signify full compliance at sub-
element level. This percentage thus represents the total percentage of sub-elements
(requirements) of the charter that have been fully met. There are 34 of these per company,
which means that an average of 6.5 requirements out of 34 per company have been met in full.
Performance Levels:
- The average performance rate is 48% on the semi-scientific basis.
- This is in line with the qualitative summary, which resulted in 50% of the scores lying
between “Medium” and “Yes”.
o By contrast 40% of responses represent No or Low levels of performance.
o 7% and 3% are “Not applicable” and “Unknown” answers respectively.
- The sub-element results table shows that the “Medium” qualitative rating is largely
represented by percentages between 41% and 70%, High is > 70% and Low is < or = 40%.
Compliance Levels:
- This represents all shades of performance levels from “Low” to complete “Yes”, and
thus would be the converse of “No” and ”Unknown” answers.
- This rate is 62% at sub-element level, based on whether any company was non-
compliant with each sub-element.
- On average 4 out of 7 companies (51%) complied with each element.
The table below gives a summary of the performance by the oil companies at sub-element level,
calculated at the level of each individual response by company. This shows the following spread:
Scores Yes High Medium
Total M-H-Y-N/A
N/A
Low Unknown No Total
Number 45 22 53 120 16 57 6 39 238
Percentages 19% 9% 22% 50% 7% 24% 3% 16% 100%
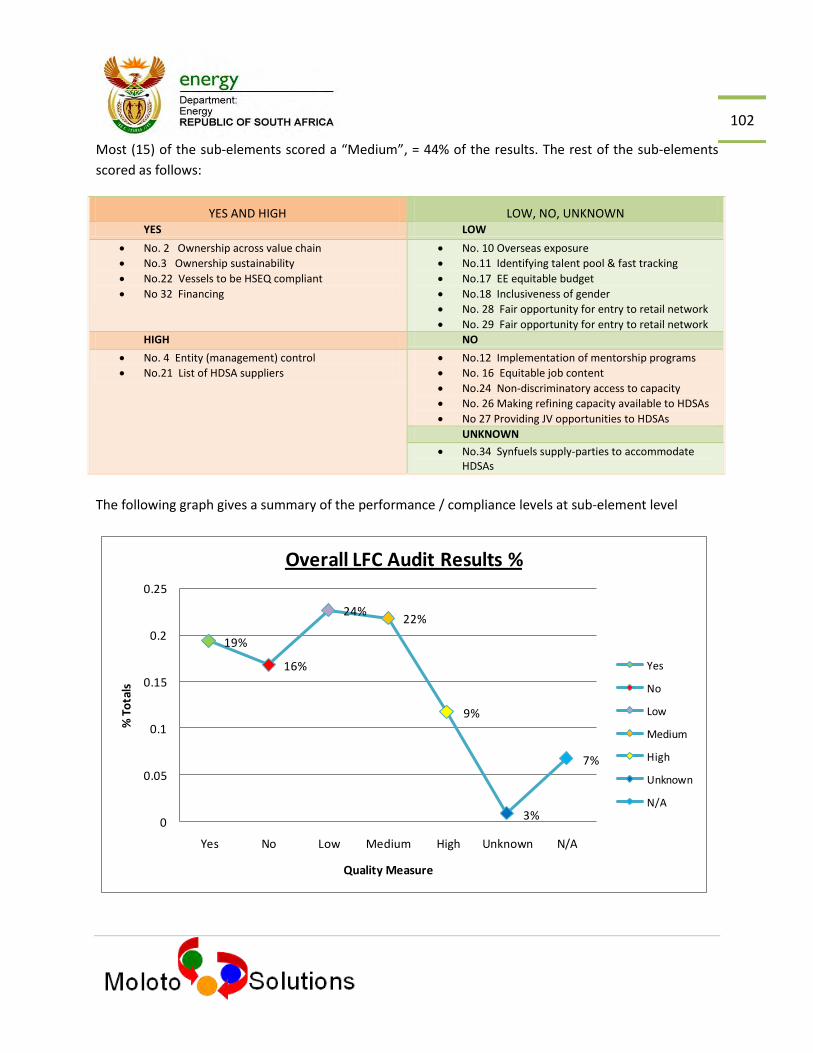
102
Most (15) of the sub-elements scored a “Medium”, = 44% of the results. The rest of the sub-elements
scored as follows:
YES AND HIGH LOW, NO, UNKNOWN YES LOW
No. 2 Ownership across value chain
No.3 Ownership sustainability
No.22 Vessels to be HSEQ compliant
No 32 Financing
No. 10 Overseas exposure
No.11 Identifying talent pool & fast tracking
No.17 EE equitable budget
No.18 Inclusiveness of gender
No. 28 Fair opportunity for entry to retail network
No. 29 Fair opportunity for entry to retail network
HIGH NO
No. 4 Entity (management) control
No.21 List of HDSA suppliers
No.12 Implementation of mentorship programs
No. 16 Equitable job content
No.24 Non-discriminatory access to capacity
No. 26 Making refining capacity available to HDSAs
No 27 Providing JV opportunities to HDSAs
UNKNOWN
No.34 Synfuels supply-parties to accommodate HDSAs
The following graph gives a summary of the performance / compliance levels at sub-element level
19%
16%
24%22%
9%
3%
7%
0
0.05
0.1
0.15
0.2
0.25
Yes No Low Medium High Unknown N/A
% T
ota
ls
Quality Measure
Overall LFC Audit Results %
Yes
No
Low
Medium
High
Unknown
N/A

103
Results Summary
8.3. Summary results by element
Element Average Numeric Charter Score %
LFC Charter Sub-element Performance Level Ranking
BEE Equivalent
Ranking
Compliance Level (Percentage compliant
companies) %
Compliance Level ranking
Ownership 87 3 2 50 6
Financing 93 1 2 71 3
Management Control 89 2 1 57 5
Supportive Culture 49 7 N/A 100 1
Capacity Building 35 10 5 0 8
Employment Equity 38 9 4 43 7
Private Sector Procurement 69 4 3 43 7
Enterprise Development (Average) 34 8-13 6 49
Access to joint facilities 45 8 6 43 7
Refining Capacity 25 12 6 0 8
Retailing 31 11 6 67 4
Wholesaling 50 6 6 100 1
Terms of Credit 56 5 6 86% 2
Synfuels Supply 0 13 6 0% 8
Average Totals 51%
51%
NB: SED (Socio Economic Development) is not an element in any form in the Charter, therefore not scored for LFC
purposes.
NB – Wholesaling excludes crude procurement, which is dealt with under procurement.
On average the compliance rate measured by way of compliant companies with each element is 51%, =
3.5 out of 7 companies. This is lower than the un-aggregated compliance level at sub-element level, of
62%, which accounts for the average for each sub-element.
The two top performing elements were Management Control and Ownership whilst the worst
performing elements were Enterprise Development, Skills Development and Employment Equity.
It should also be noted that the Enterprise development scores would be even worse if not for the fact
that most sub-elements also take into account either the equity ownership of the oil company or the
ownership by HDSA’s of the operations – e.g. Retail and Wholesaling.
104
8.4. Analysis of the overall LFC results
The companies were measured against the 13 elements of the liquid fuels charter. It should be noted
that PetroSA was measured on 10 elements out of the 13 as some were not applicable.
All the companies met the minimum requirements of ownership as they HDSA shareholders but only
50% had met the 25% requirement, with the fourth one very close.
The Oil companies did well, though not fully compliant, on management control. HDSAs are represented
in all categories: executive, non executive and independent.
The average company performance level for supportive culture was medium.
The company performance in capacity building was high in some indicators, but there was low
performance in the following specific charter requirements: identifying a talent pool and fast tracking,
implementing mentoring programs and overseas placement programs.
The companies scored low on the employment equity element. The areas of concern were meeting of
equity targets and percentage representation of women at all levels. Some companies are struggling
with the job content of HDSAs vs. non HDSAs. The EAP target has also not been met in any of the
management levels.
Core to advancing HDSA’s in procurement is crude procurement, yet only 2 companies seem to have
made pulpable strides in this regard.
Access to joint facilities seems to be the one area where the industry is still resisting change and facing
the most challenges. The uncommitted space is not made available to HDSAs by the majority of the
companies. There has been no progress in the area of refining in advancing HDSAs as well. The key
issues are selling shares in the refinery to HDSAs, making refining capacity available to HDSA companies
as well as providing JV opportunities by including HDSAs in expansion/upgrade programs.
The companies have scored low to medium in offering HDSA’s fair retail opportunities, as the number of
both company owned and dealer owned sites is still dominated by whites. The average performance
was low to medium for most of the companies in wholesaling as well. Most used resellers or
distributors, and few importing wholesalers.
Oil companies have done well in terms of providing finance to HDSA’s for the ownership deals. The
majority of companies are also doing well in terms of offering HDSA customers terms of credit.
No meaningful information was provided regarding Synfuel Supply.

105
8.5. Summary Comparison: LFC and BEE results
8.5.1. BEE/ LFC Ranking Comparison
Core component of BEE
Out of BEE Average
Weighting BEE
Average % BEE
Ranking LFC Numeric
Score % LFC Charter
Ranking
Ownership 20 14.64 73.20% 4 86.7% 2
Management Control 10 8.78 87.80% 1 88.6% 1
Employment equity 15 10.75 71.67% 6 38.2% 4
Skills development 15 4.31 28.73% 7 34.5% 5
Preferential procurement
20 14.43 72.15% 5 68.6% 3
Enterprise development
15 12.12 80.80% 2 34.4% 6
Socio- economic development
5 3.75 75.00% 3 N/A N/A
Average 100
69.91%
48%
Conversion of BEE scores
The average compliance level on BEE was calculated by dividing the average weighting achieved by the total points possible to score under each element.
This shows an average compliance level of about 70% under this framework – as opposed to the LFC’s 48%.The performance rate gap between the 2 frameworks is thus 22%.
8.5.2. Notes on the BBBEE results
The oil companies scored as follows under BEE:
2 level 3's, 4 level 4's and 1 level 6 The percentage achievement is largely above 70% of weighting points for each element, except for skills development, which is scored an overall non-compliant level, at 29%.
General analysis of the overall results
The above weightings’ percentages exclude PetroSA as it uses a different scorecard but include Shell
Refining since we were provided with the information and this results in a fairer reflection of the sector
as a whole.

106
The overall scores (LFC vs BEE) differ quite widely in spite of an attempt to bring them close by using a
similar legend because of the different emphases of the 2 frameworks.
The major differences in the ranking are in the following elements:
o Skills Development – LFC higher
o Enterprise development – LFC lower
o Employment Equity – LFC lower
PetroSA’s weightings also differ quite significantly from those of the sector in terms of both frameworks
except with regards to:
o Management control. However it has achieved 100% and is therefore an outright “Yes” and not
just “High”.
o Socio-economic development – which is also medium / average.
Its average weighting is also in line with the industry’s.
8.5.3.1 The top performers in terms of BEE and LFC are:
BEE Score LFC Score
Management control 88% Management control 89%
Enterprise development 81% Ownership 87%
Socio-economic development 75% Preferential Procurement 69%
8.5.3.2 The lowest performers in terms of BEE and LFC are:
BEE Score LFC Score
Preferential procurement 72 % Enterprise development 34%
Employment equity 72% Skills development 35%
Skills development 29% Employment equity 38%

107
8.5.3. Analysis by element
Ownership
The higher score on the LFC is due to the fact that the LFC does not take into account the following sub-
elements on the BEE scorecard that have resulted in lower BEE scores:
o Women representation
o Ownership fulfillment
o Net value
o Participation of designated groups
Management Control
The two frameworks result in the same average score of “High” and almost equal percentage
achievement levels. This is also the highest ranking level in terms of both frameworks.
Employment Equity
The lower score on the LFC is due to the fact that the LFC scoring took into account the following criteria
not accommodated by the BBBEE scorecards:
Achievement of set targets
Job content equitability (BEE weighting inadvertently encourages the higher black
representation at lower levels)
Budget management equitability.
PetroSA scored lower than the industry average.
Skills Development
This is the lowest ranking element in terms of BBBEE and supports our observation that insufficient
effort has been made by the industry to ensure relevance of the programmes.
The companies scored lowest overall, with regard to the following requirements in terms of BBBEE:
o Some learnerships and other Category B, C and D programmes using adjusted recognition
for gender.
These programmes include apprenticeships, and institution based learning coupled with
practical learning and formal assessments.
o Training of people with disabilities.

108
This performance could also be linked to the low scores on EE, that is, that the companies do not
actually have sufficient HDSA employees to train, especially black women.
A further concern in this regard is that the expenditure on capacity building, in rand terms decreased in
the current period, as compared to 2006.
PetroSA scored very high on this element.
Preferential Procurement
In spite of the fact that the BBBEE scorecard is more lenient, by excluding crude procurement and other
imports, the overall ranking score on both frameworks is a “Medium”, which shows that this area still
needs improvement.
The BEE scorecard penalizes lack of performance in the following areas currently not catered for in the
LFC:
o Smaller businesses
o Black women-owned businesses
o Majority black-owned as opposed to at least 25% black-owned companies.
The other reason for the higher than expected LFC score is because of the equal weight applied to all
sub-elements, one of the requirements under this element, e.g. is for vessels to meet HSE requirements,
which gets given equal weight to, e.g. Crude Procurement.
One of the companies procuring Crude from HDSA’s scored very low on BEE in spite of this because
Crude procurement is treated as an exclusion in this framework. This disincentive would need to be
addressed in a future framework.
PetroSA scored full marks and the weighting points are the same for both scorecards on this element.
Enterprise Development
This seems to have been the focus area for BEE purposes as all the companies improved scores
dramatically this year except for 1.
I company scored a zero for this element under the BBBEE framework.
The lower LFC overall score is because BEE does not penalize non-activity on certain key charter
recommended initiatives.
PetroSA scored very low on this element.
109
Socio-Economic Development
The LFC audit did not delve into this element as it is not a specific requirement currently.
An observation was however made that insufficient attention is paid by the oil majors to local communities, especially where there are refineries. One company scored a zero (NIL) for this element under the BBBEE framework.
8.5.4 Conclusion
The above analysis bears out the conclusions made above that:
The two frameworks have different areas of emphasis / priority.
The current LFC is not clear enough in terms of expectations, resulting in anomalous results, e.g.
in procurement i.e. it did not provide weightings for each requirement – e.g. even though
preferential procurement, and particularly crude procurement was clearly a priority, it was not
weighted differently to other elements and other sub-elements within the Preferential
procurement element.
The focus on BEE has resulted in non-adherence with some key LFC requirements, especially
Enterprise Development related. The irony is that the oil companies did fairly well on Enterprise
development in terms of the BBBEE Codes.
o Further strengthening the motivation that a future framework needs to ensure that
performance on the agreed sectoral priorities / imperatives is adequately rewarded and
non-performance dis-incentivised.

110
8.6 Summary Results – 2006 comparison
LFC RESULTS COMPARISON - 2006 / 2011
Charter Element 2006 % 2011 % % INCREASE
1.Ownership
Voting Rights Black people 8.16% 18.29% 124.14%
Economic interest Black people 0% 18.91% 100.00%
2.Management Control
Black directors % 46% 59% 28.48%
Black woman directors % 13% 20% 53.85%
Black Executive Directors % 13% 14% 7.69%
Black Women Executive Directors % 1% 27% 2600.00%
3.Supportive Culture
Transformation committee existence 100% 100% 0%
Full time executive director 43% 0% -100.00%
Black full time SD facilitator
71% 100% 40.85%
Approved policy prohibiting unfair discrimination 100% 100% 0.00%
4.Capacity Building
Total Skills Spend on HDSAs % 71% 55% -22.54%
HDSA Learner-ships 96% 94.07% -2.01%
Black delegates trained as a total of all trained delegates.
73% 79.50% 8.90%
5.Employment Equity
Black executives % 44% 52% 18.18%
Senior Management Black 41% 50.4% 22.93%
Senior Management Black Women 8% 13% 62.50%
Middle Management Black 52% 64% 23.10%
Middle Management Black Women 14% 30% 114.29%
Junior Management Black 69% 78% 13.04%
Junior Management Black Women 22% 31% 40.9%
Semi-Skilled and Unskilled Black 95% 82% -13.68%
Semi-Skilled and Unskilled Women 8% 15% 112.50%
6.Procurement
Total all procurement total HDSA 3.28% 7.2% 28.81%
Total crude procurement total HDSA 3.28% 4.9% 49.39%
7.Retailing
All sites for all Companies black volumes %
44% 40.00% -9.09%

111

112
9. Value Chain and Other Financial information
9.1. Objective
Two policy objectives informed the review of value chain participation:
The stated objective of the Energy Policy White Paper is to achieve sustainable presence,
ownership and control of a quarter of all facets of the liquid fuels industry by HDSA’s.
The LFC’s intent to advance and empower HDSA’s is an integrated strategy aimed at
substantially increasing black participation at all levels of the value chain.
There were thus three areas of consideration for this section of the audit:
o The first being an indication of the percentage HDSA share of assets in each stage of the
Petroleum and Liquid Fuels value chain.
o The percentage procurement spend with HDSA’s at each stage/segment of the value
chain.
o The percentage sales to HDSA’s at each stage/segment of the value chain.
9.2. Share in assets
The HDSA share of the assets in the oil companies mostly follows on the trail of the main ownership deal
for each company and the ownership deals cover all the operations within South Africa. The average
ownership by HDSA’s in the oil companies translates to 18.91%, which is below the charter objective of a
25% share of all facets of the value chain by HDSA’s. This means on average, the HDSA share of assets
across the value chain is 18.91%.
It should also be noted that the extent of the assets in all the South African operations is curtailed by the
fact that they own no exploration and production assets, as these have been left with the multinationals
where applicable, or separately incorporated. One company has also separately incorporated the
refinery operations and assets.
The relevant operating profits and skills empowerment opportunities have also then not been available
to the South African Oil operation’s shareholders and staff to the extent initially envisaged.
All the companies that provided some information indicated that they do not operate in / have assets in
the following value chain segments:
Transportation – included in marketing for some
Storage and handling – included in marketing for some

113
9.3. Analysis of financial information
It should be noted that the percentage Ownership by HDSA’s should ideally be weighted, taking into
account the difference in size vs. percentage ownership. When weighted the average ownership
percentage reduces slightly to ± 18%.
A rough estimate of the total value of the industry excluding PetroSA’s (as estimated by the oil
companies) is R37 billion. The underlying total assets are estimated at R55 billion.
9.4. Share in procurement spend
Only 5 companies were able to provide the required information and still not in all segments as most
indicated that the required information is not available.
The analysis indicates that the segment with the highest HDSA procurement spend on average is
transportation followed by supply and trading.
9.5. Supply side information
This section involves largely Retail and Reselling (local wholesaling). The relevant percentages are 40%
and 33% respectively.
114

115
10. ACCESS TO FINANCE
As the sector is very capital intensive, as part of the audit we also consulted the various providers of finance to understand their perspective regarding the status quo and transformation opportunities through access to finance by HDSA’s. The NEF and BNP Baribus were the only financiers who were consulted during this process as the commercial banks and other funders were unavailable. Below are the findings:-
National Empowerment Fund BNP Paribus
Target: Retailers Target: Wholesalers
Service Offering:
Interest rate of prime mines 1.
7 years repayment term.
Offer capital holiday.
No admin charges.
Free Mentorship Program - legislative requirements, operational, finance, HR management.
Service Offering:
Direct finance to individual companies offering independent credit lines.
Transactional and structured short term financing – LC, guarantees & loans.
Structured commodity financing tailored to product / transaction – in-port, in-pipe, on-rail or production financing.
Criteria Up to R1 mill own contribution.
Assessment of expertise.
Criteria No balance sheet required.
Assess knowledge of markets, product and understanding on specifications.
Lessons Learnt:
Inability of retailers to read and understand AFS.
Inadequate control measures
No mentorship among new and old dealers.
Limited understanding of regulatory requirements.
Lessons Learnt:
Regarding local commercial banks: transferable letter of credit in favour of the oil majors and not traders.
Local commercial banks: Have no confidence in HDSA’s, also Lack knowledge of crude trading and commodity financing.
Period Assisting HDSA’s since early 2010 Period Assisting HDSA’s since late 2009.
Recommendations
Practical mentorship approach.
Tailored program developed in conjunction with entrepreneur.
Recommendations
Local HDSAs require more capacity and knowledge of trading to succeed besides just finance.
Identification of credible HDSA’s who will add value to supply market in medium term.
Important to distinguish between a broker with no control of product and money flow or a real trader.

116
According to reports from would be beneficiaries, some of the instruments which were implemented by government in order to facilitate entry of HDSA’s into the mainstream economy and also enable broad based economic empowerment inadvertently became stumbling blocks due to their ineffective implementation processes. In their experience, the funding process of the NEF and other institutions like IDC and Khula are still not enabling and advancing entry of BEE companies.
They reportedly take up to 90 days or more to approve a simple R2 million deal. Commercial banks on the other hand have been experienced to take less than that time’’
Retailers reported having had to resort to commercial banks as the process was taking too long and they would not be able to raise the funds within the 60 days grace period commonly provided to raise funding to buy an existing service station.
The HDSA wholesalers also pointed out that:
The lack of confidence in them by banks results in more expensive credit forms – where oil majors operate largely on open credit or letters of undertaking, which are relatively free of charge, the insistence on at least a letter of credit where HDSA wholesalers are concerned results in additional (unnecessary) costs to both the oil major purchaser and the HDSA seller.
International suppliers do not have confidence in local banks also. Standard Bank is reported to have attempted to introduce cheaper letters of credit recently. This was however unsuccessful because of the negative attitude and lack of knowledge of international suppliers – who still prefer to deal with well-known international banks.
117
118
11. CONCLUSIONS
11.1. Ownership
The oil companies have done fairly well on this element. It is the second – highest scoring.
The average effective ownership by black shareholders is 18.91% with women representation at
6.72%.
None of the black shareholders have fully fulfilled obligations of ownership and thus had related
rights transferred.
The net value is in HDSA hands is 12.74%
Most of the black women ownership indicated is as trust beneficiaries or junior consortium
partners- i.e. there is no attendant participation as shareholders in most of the companies, and
therefore control or active exercising of their ownership rights.
Most of the black shareholders can be surmised as being more of passive, serial investors than
active entrepreneurs
o The participation of broad based groups and new entrants in the deals is thus low.
Most of the deals are relatively clean - with no contentious clauses- owing partly to B-BBEE
reviews over the past few years.
o There are, however, some unhealthy tensions on two deals between the oil company
and black shareholders and among the black shareholders.
11.2. Management Control
Compliance is very high. This is the highest scoring element in terms of both the LFC and BEE.
o However women are still lagging too far behind.
The appointment of black directors has however not yielded envisaged results.
o This is partly because they are mainly non executives with fewer executives and
independents.
o Their influence is also curtailed by multinational leadership structures and the fact that
they do not have real financial control over the companies.
o For some HDSA directors the monitoring of progress on transformation is also not a key
focus area or priority, as they are more concerned with securing own business interests
and/or bottom line objectives.
The rotation of foreign national CEOs sometimes results in loss of transformation momentum.

119
11.3. Employment Equity
This is the third lowest scoring element.
o The major reasons are: failure to meet targets, non-equitable job content and budget
allocations, and lack of gender inclusiveness.
There has been fair progress in terms of black representation in general. However, women
representation is still too low, especially on the higher levels.
The representation of black people increases as the management levels decrease.
Two of the companies hardly had black people at the executive level and very few at senior
management level, thus scoring a zero under BEE on these two levels.
There are some inexplicable pockets of over-representation by Indians in some management
levels of some of the companies.
Black representation in all the management levels is below the EAP target of 87.5%
11.4. Supportive Culture
Although it seems that most companies have developed and implemented policies to facilitate a
supportive culture for HDSA’s this is still the least understood element of the LFC and yet still so
pertinent.
The most notable challenge is the level of seniority and accountability of managers appointed as
well as the establishment of proper governance structures to ensure the effectiveness of this
element in most organisations.
The level of seniority of the dedicated managers has over the years been lowered from
executive director level to middle manager level on average suggesting a view that this function
is now viewed as superfluous - yet interviews with staff and HDSA suppliers and customers
suggest otherwise.
Without a properly coordinated and resourced transformation committee it becomes difficult
for individuals to monitor and report on progress, to table challenges which require urgent
attention and to ensure that all areas of the company’s operations which can provide
opportunities and immediately benefit HDSA’s are implementing the right policies and thus
effecting transformation to the required scale in all aspects.
Transformation has seemingly not permeated to the middle and lower levels of most
organisations. There seems to be insufficient buy-in at levels below senior management i.e line
managers / supervisors are said by most to not demonstrate supportive culture.
11.5. Procurement
It should be noted that the procurement submissions were not complete and the conclusions
are based on largely 5 of 7 companies, whose information was also not fully reconcilable.

120
Most of the companies have adequate policies and systems. The challenge is in effective
strategies and processes to effect the correct levels of HDSA procurement.
Also, some of the companies’ procurement departments/decisions are located outside South
Africa, especially w.r.t. crude and other product imports.
Only 3 of the 6 oil companies comply with this element, the main differentiator being Crude Oil
procurement. The third company’s last purchase was however, only in 2009.
Crude Oil purchases from >50% HDSA companies are estimated at 2.71%
Procurement from HDSAs is less than 5% for about 50% of the product lines. The
greatest spend areas are Civil and Maintenance, Transport and Services.
The support to and from SASDA has not worked according to plan for various reasons. Among
others the casualty of this is an industry – wide HDSA Supplier database.
Supplier development efforts are also sparse and unstructured and seemingly not effective.
11.6. Capacity Building
This was the second worst performing element due mainly to lack of mentorship programs,
overseas exposure, talent pool identification and fast –tracking and effectiveness reviews.
It is the worst performing element under the BBBEE framework, largely due to the lack of work-
based exposure and assessed programmes.
o This backs the LFC review’s finding that there is insufficient review of the effectiveness
of the programmes implemented, and practical exposure (where learner-ships not
possible or appropriate).
There is some progress made by the oil companies, on certain capacity building initiatives, in
particular, bursaries, scholarships, (some) learnerships and internships.
However training on artisan skills required for refurbishments, renovations and expansion of
refineries and other facilities as well as for other strategic projects is lacking.
Another opportunity loss was the acquisition of trading knowledge and expertise by HDSA’s, as
the function has been relocated and is now mainly performed through overseas operations
within some oil companies.
Another concern is that the average spend on HDSAs has decreased from 71% to 55% since
2006. The actual rand amount expenditure also decreased during this time.
11.7. Refining Capacity
The refineries are operating at full capacity and unable to meet all the market demand for products.
The oil companies are, therefore, importing refined products in order to cover the shortfall. As a
result the HDSA’s are unable to access refining capacity.
121
JV opportunities with HDSA’s within the current refineries infrastructure have also been largely
ruled out by the oil companies because of the shortage of relevant skills.
High capital costs have been cited by oil companies as the main reason for not improving
capacity. However, they have accepted that some huge capital outlays will have to be made
when the new product specifications are enforced.
Some oil companies already have plans to build additional refineries to be commissioned by 2017. We hope this will present opportunities for HDSA’s to participate in the refining business.
11.8. Retailing
The overall HDSA retail operation level is at 40%. There is still a challenge of ensuring equitable allocation of sites to HDSA’s for various reasons.
The main challenges facing the HDSA retailers are the following:
o Very low margin, highly regulated business (especially petrol), and high capital and management intensity.
o Insufficient support. The support that is required most is operational, technical and working capital management and reliable product supplies.
o The capacity to negotiate and manage contracts proved to be another area of need for e.g. the structure of royalties and rental payments to oil companies and the treatment of unreliable product supplies.
o Access to funding. o Site affordability. o Nature of opportunities – e.g. insufficient transient sites. o Regulatory process anomalies and turn-around times.
Oil companies face the challenge of limited opportunities as few sites can be availed each year.
They are also constrained by some old evergreen agreements with white retailers, property
owners and developers, especially w.r.t. the more lucrative opportunities.
The modus operandi of Oil majors is not friendly towards local small businesses.
11.9. Access to Joint Facilities
Very little effort was made by industry to advance this element of the charter.
There had been no consideration of offering HDSA’s access even long before companies experienced current capacity constraints.
Up until recently there were no plans to provide HDSA’s with access to infrastructure and any recent considerations are for facilities in remote areas and away from markets or supply areas and as such would be of no benefit to HDSA’s.
The oil companies operate on gentleman’s agreements based on long standing relationships without any formal processes followed for access and co-usage of facilities and infrastructure.
Some of the infrastructure critical for HDSA participation is state owned and managed through the Transnet subsidiaries. Lack of integrated infrastructure planning and access has resulted in HDSA’s not gaining access even to these state assets.

122
The legislation for empowerment of HDSA’s in order for them to conduct business competitively
is not adequately enforced and facilitated by Nersa for various reasons, and is not adequately
aligned and could sometimes be in conflict e.g. Charter vs PPPFA vs BBBEE codes on the part of
Transnet and Nersa.
The legislative environment is also inadvertently stacked against the HDSA wholesaler.
11.10. Wholesaling
A reliable estimate of the overall level of HDSA wholesale activity could not be made.
There is overall negative competitive positioning of HDSA wholesalers (spot purchases,
insufficient finance, higher finance cost, more stringent license conditions).
The Oil companies seem to focus more on wholesale distributors than wholesale importers
(both refined products and crude oil).
The few active import wholesalers have received support from only a few oil majors in the
country.
Legislation and Public Sector policies are also not properly aligned for effective support to this
sector – in particular exchange control regulations.
There are also allegations of rampant illegal operation and unethical behavior by some licensed
operators.
The oil major challenges include:
a) Cashflow constraints
b) There are no benefits / incentives and it is more expensive.
c) Insufficient commitment of some HDSA’s
11.11. Enterprise development
Enterprise development is not a stand-alone element of the LFC. It however permeates most of the
elements and more specifically:
Access to joint facilities
Access to refining capacity
Retailing
Wholesaling
Terms of credit
Synfuel supply
As can be seen in the results section this was the lowest performing element – possibly because of
the following combination of reasons:
123
Some of the sub-elements involved there-in are not scored under the BEE codes, (which have
now become the focus for most oil majors). There is thus insufficient incentive for the oil
companies to improve on these areas:
o Retailing (This could be partly why this is one of the elements whose performance has
actually regressed since 2006).
o Synfuel Supply
o Local wholesaling (reselling)
o Import wholesaling / Crude procurement (treated as an exclusion by the BEE codes)
There is no minimum target (under which the element will score zero points), and no bonus
incentive for improving on the following:
o Access to key infrastructure
o Import wholesaling / Crude procurement
Oil majors have been able to participate in enterprise development and earn full points under BEE codes whilst they have not done any intervention in these key LFC recommended areas as a result.
11.12. Access to finance There are still unnecessary impediments in accessing finance – including cost, lack of confidence,
international supplier demands, turnaround periods and insufficient tailor made products.
There is a perception that there are too many HDSA wholesalers acquiring licenses without the requisite basics.
11.13. Value Chain Performance
In terms of HDSA asset ownership the level is drawn from the ownership deals and is thus 18.91%,
across the board. Exploration and production is however 0% as it is either separately incorporated
or based outside the country.
The value chain category enjoying the most supportive for HDSA’s, in terms of procurement is Transport.
11.14. Progress since 2006
All the indicators showed improvement, understandably, due to the large time gap. There are
however, decreases, which are all of concern, viz: (% decrease)
Supportive Culture: full time executive director - 43 – 0 %( 100%)
Capacity Building: Total skills spend on HDSAs - 71% - 55% (22.5%)
Capacity Building: Learnerships: From 96% - 94.07% (2.01%)
Employment Equity: Semi skilled & unskilled blacks 95% - 82% (13.68%)
Retailing: All sites for all companies - 44% - 40% (9%)

124
11.15. Overall achievement and progress
Minimal progress to date
The Oil Companies have done fairly well towards their equity partners and in including them on
the Boards.
Oil companies have however only made progress regarding some transformation objectives as outlined by the LFC, only in the last 2 years i.e. 2008/09 – 2009/10. Most of the incumbents who are custodians and main drivers of transformation have been in their positions from 2008, which this resulted in the related frameworks, programs and initiatives being developed, finalized and implemented only from 2009.
o As a result what has been achieved in the last 10 years, by some, in some areas, is the development of strategies, policies, programs, with no related, specific plans and systems, for some critical LFC requirements, like access to infrastructure.
Interviewed employees and other stakeholders feel that some of the programs are only good on
paper, implementation is very slow, not always done in the spirit of the LFC, and thus not
effective.
o The leadership in some companies was also very candid that they had taken their eyes
off the ball and had not given the LFC the full attention and urgency it required.
o Some leaders believe they are making progress however in our assessment significant
progress cannot be achieved without impact / effectiveness reviews.
The illustration below indicates that there is still a lot of work ahead, as there was very little achieved
since 2000.

125
Coordination of this exercise
The people allocated the responsibility of coordinating the company’s readiness and responses
to this exercise were mostly, in a number of respondents, middle managers that sometimes did
not seem to have the support of their seniors to ensure that the company prepares adequately
for it.
o The companies that exhibited high cooperation levels allocated very senior personnel, including CEOs.
In some instances it was only once the leadership had gone through the interview sessions that
they understood the criticality and modus operandi of the exercise and requested to review the
company’s submission for accuracy and completeness.
The battle to coordinate responses to the exercise by some companies suggested that they
were not used to having to review themselves to this extent and in some respect their own
reporting and assessment was hither – to very superficial.
Change management / supportive culture
There were no visible campaigns to sensitize employees about the transformation efforts
though the LFC and no evidence that this had been done before, recently.
There were no visible change management efforts to solicit buy-in particularly from line
managers who were identified as the main stumbling block for various reasons by most
interviewees.
11.16. B-BBEE Influence
Focus on BEE
A number of interviewees were not familiar with the
charter requirements, including officials and therefore
supposed guardians of related policies.
In most companies employees were quick to share the
achievements regarding BBBEE compliance and yet had
no information to share regarding achievements
against the LFC objectives.

126
BEE Partial exemption
Oil companies are some-what exempted from the BBBEE Codes of good practice, subject to later review,
in that the framework was gazetted before the BBBEE Codes.
The motivations for adopting the BBBEE framework include:
Rating complexities - Oil companies have to get BEE certified for among others clients that
do not fall under the sector. Who only accept valid BBBEE certificates for procurement
decisions.
Compliance / M& E burden - Compliance burden of complying with 2 empowerment
frameworks, unless there is a link built in or additional way of incentivizing.
Ongoing Review - Advantage of a more vibrant BBEEE Codes Framework environment
LFC ignored
- Oil majors are currently largely ignoring the LFC.
- Oil majors are in various stages of ensuring at least level 4 (65 – 75% compliance level)
under the BBBEE Codes
- The LFC requires additional information and related tools that oil companies are
currently not collecting.
The disadvantages of adopting BBBEEE are:
Generic BEE weaknesses
o Some key LFC requirements are ignored by Generic BBBEE Codes, e.g. Crude Oil
purchases are treated as exclusions and no points for sales to HDSAs e.g. resellers.
o No incentives in BBBEE codes for some key LFC requirements e.g. Procurement from
HDSA wholesalers
o A company can score full points for Enterprise Development (ED) without implementing
some crucial LFC requirements. ED is one of the best performing BEE elements whilst it
is the worst performing under the LFC.
Also:
- The sector Code process is long and also complex
- Verification agencies’ compliance burden with respect to sector codes is onerous
- DTI is weary of adding more sector codes at this stage

127
- DTI Codes are also up for review
- A Sector Code will most likely involve other auditees except oil majors
- A concern has also been expressed by HDSA wholesalers and relaters that the BBBEE Codes framework pushes them to higher thresholds than is justified by their operation sizes because of the large turnover amounts involved in the sector.
11.17 Impact analysis
Given that the bottom 3 performing elements in terms of the both the LFC and BEE framework are:
Enterprise Development
Skills Development
Employment Equity and
Preferential Procurement
The biggest lost opportunity over the past 10 years in terms of HDSA empowerment is technical
skills transfer:
- There was insufficient training to directly transfer the skills.
- Due to less than desirable levels of promotion and employment of HDSAs, they were thus not
afforded the opportunity for at least on the job training.
- Black entrepreneurs were also not capacitated through enterprise development and trial
/gradually improving procurement levels to afford them the same experience as their counter –
parts.
What was initially envisaged was an opportunity of fair ownership opportunities of assets, across
the petroleum and liquid fuels value chain by HDSA entrepreneurs who wanted to be significant
players in the oil sector in South Africa. However what has been achieved was partial ownership of
some assets by individuals who can be characterised as more of investors with other business
interests who largely do not actively participate in any operations within the sector.
Support of the other and greater number of entrepreneurs, apart from the equity partners –
including retailers, and wholesalers is also the most wanting area.

128
11.18 Reporting, Monitoring and Evaluation
There was also no evidence of proper self- evaluation and continuous improvement of the LFC
initiatives in place by the oil companies:
Some companies lacked proper reporting and monitoring tools and systems and there largely
were no enhancements and plans for continuous improvement.
Some organisations do not have a transformation committee in their board structure which in
turn would detract focus and prioritization as among others, there would be no special sitting to
address transformation specific issues.
In a number of instances, the board members interviewed were unable to provide their
companies’ transformation progress or status figures, as they were not sufficiently aware
thereof.
DOE has not performed regular enough reviews of the transformation progress of the industry.
o There is therefore a lost opportunity for a carrot and stick approach – e.g. only 3 oil
majors buy crude from HDSA wholesalers. There is no special incentive for them and no
censor to non performers.

129

130
12. RECOMMENDATIONS
12.1. Ownership
• All companies that failed to make the 25% cut should be requested to commit to concrete
plans to deal with the gaps, within a set time frame.
o A further disincentive for this by way of lower points in the new scorecards is
required.
• DOE to consider increasing HDSA ownership requirements to at least 26% and to
appropriately reward higher ownership percentages, even towards majority control by
HDSAs, so as to ensure that there is even better levels and always an incentive to achieve.
o Women, broad-based and / marginalized groupings including youth to be prioritized
in the deals to augment these percentages.
o Appropriate incentives should be built in for participation by these groups in
ownership structures to include either quota and/or bonus points, in a future
framework.
• DOE to develop the capacity of staff to assess the BEE deals and interrogate the related
structures during the processing of license applications.
• DOE needs to play a pro-active role of ensuring that the best possible advantage is gained by
HDSAs and women in particular, from all the divestments from downstream operations
taking place and all sales of related assets.
• DOE needs to consider a strategy similar to the equity equivalents scheme, combined with
appropriate incentives for locating these functions in South Africa and structuring BEE deals
around them for the Upstream business of Oil Majors
• DOE to facilitate amicable and mutually beneficial solutions for the deals under pressure
and where there is impasse and set up mechanisms to help pick up such signs sooner and
more systematically in future.
12.2. Management Control
• Appropriate incentives for women appointments to be built into the future scorecard for
the industry. There should be clear and measurable stretch targets.
• Companies to effectively increase the participation of black women.
• DOE to facilitate a standardized orientation / fast – track program on transformation / the
LFC for new foreign national CEO’s.
• Oil companies to focus more on executive and independent directors in future.

131
12.3. Supportive Culture
• This element is not covered in the generic codes as it is difficult to measure. It is, however still critical and some way of preserving it, by allocating points for demonstrated and measured improvement / attention it issue should be accommodated.
• Reliable organizational climate checks should be regularly conducted by industry leaders to
help effectively gauge the level of this culture. To be managed directly by CEO’s and
reported on to the Boards.
• The level and extent of the desired supportive culture should be clearly spelled out in
company policies and strategies to enable smooth and assured implementation of this
element.
• The relavant supportive culture targets to be included in the performance contracts of senior managers as part of their Key Performance Indicators (KPIs).
12.4. Employment Equity
• Oil Companies should ensure that there is equitable allocation of budget and job content responsibilities to black executives and managers.
• Job- shadowing should be implemented as one of the means of fast-tracking HDSAs,
particularly women, where appropriate. Adequate and realistic incentives to be provided to
the shadower to ensure success.
• The junior and middle levels of management should be regarded as a general talent pool
and be exposed to high quality operational exposure, including overseas placements.
• Top management should encourage a learning environment / culture and encourage line
managers to take better calculated risks in terms of providing opportunities for HDSAs and
guard against line managers continuously sidelining HDSA’s by attaching unnecessarily high
experience specifications to some positions.
• Companies to improve their recruitment and retention strategies for black senior managers,
in particular women.
o The relavant targets to be included in the performance contracts of senior managers
as part of their Key Performance Indicators (KPIs).
• Companies need to publish employment equity targets beyond the notice boards, and
intranet facilities and make sure they are institutionalized.
• Regular road shows in conjunction with DOE should be organized by the industry to educate
on and reveal opportunities available in other areas of the liquid fuels and petroleum value
chain, targeting particularly women and youth.
• Oil companies to ensure balance amongst the black groups as well and investigate and
address any over-representation by one category that is not justifiable by National and
geographical demographics.

132
• It would be advisable for DOE to seek guidance from the DOL on how to approach these
instances and to then reach an understanding with the relevant companies on how the
situation is being managed.
• A higher target (in a future scorecard) of the number of HDSAs in Senior, Middle and Junior
management mentored and / or , fast tracked into core functions, (as opposed to support
functions) should be set, for achievement within a certain timeframe, with appropriate
additional incentives for these to be women, youth and where possible, people with
disabilities.
• Government should enforce penalties on companies that are not advancing HDSA’s in
Employment Equity, in a joint strategy / intervention programme with the Department of
Labour.
12.5. Capacity Building
• More practical and formally assessed exposure should be provided to black trainees.
o Any future framework should adequately incentivize these interventions.
• Effective implementation of structured mentorship programs is required.
• Capacity building programs should be implemented uniformly across the companies
including the lower levels within the depots and transport and logistics divisions.
• Vocational training to HDSAs to be granted, to entice them into and build capacity in the
maintenance sector.
• Given all the divestment related and other retrenchments, potable skills need to be
developed and offered to employees to prepare them to continue to generate income after
the company has scaled down operations.
• Companies need to understand that training and development is a lifelong exercise and
hence avoid the reduction of training levels of particular black people.
• Skills development targets in the areas of lack to be included in managers‘ KPIs.
• A mechanism is required to reward and progress employees that have studied towards
needed skills.
• DOE to collaborate more with CHIETA and SAPIA to ensure that appropriate work related
training programmes are developed and delivered, including fast-track type interventions.
• Scarce skills occupations should be continuously communicated to the institutions of higher
learning for their development. There must be an effective partnership among DOL, DOE,
DHE and the industry for development of programmes in critical skills areas.
133
12.6. Procurement
• Parent oil companies to allocate a set percentage of Crude oil Procurement from HDSA
companies.
• HDSA’s to be granted longer term projects that would facilitate sustainability.
• Awareness drives to be undertaken by companies to educate particularly black SMME’s on
procurement requirements and all available opportunities, especially in areas generally over
– looked by black companies.
• DOE to include minimum specified levels of crude procurement in the future procurement
scorecard.
• DOE to investigate why SASDA is not fully supported by Oil companies in its commendable
mandate, and address the gaps so identified.
12.7. Access to Joint Facilities and Other Infrastructure DOE needs to facilitate the alignment of all legislation and tools to promote HDSA participation through
a coherent strategy, and ensure adequate enforcement. In particular:
• The conflicting regulatory objectives between Competition Authorities and the Department of
Energy need to be addressed.
• Investigation of inadvertent loopholes in legislation allowing vertical integration and therefore
competitive advantage by oil majors is required.
• DOE and public entities need to enforce all legislation in this regard
• DOE needs to facilitate assurance of compliance with all regulations.
• DOE needs to investigate the allegations of use of unlicensed wholesalers and illegal activities
by licensed wholesalers and address the root causes
DOE to facilitate allocation of spare capacity in facilities and related infrastructure. This should include:
• Robust effort to make information available on spare capacity.
• Finalization and full implementation of NERSA’s Allocation Mechanism guidelines for 3rd Party
access to petroleum Storage Facilities (November 2009). To also ensure uniform understanding
of the requirements from all parties in this regard.
• Development of funding model for HDSA’s in importing crude through one or more of the DFIs.
• Assessing the feasibility of developing a model for HDSAs to share vessels when importing
product.
• Allocation of minimum capacity in the New Multi Products Pipeline to HDSAs.

134
12.8. Refining Capacity
• Consider including economic development requirements and or minimum procurement levels towards local communities where refineries are located as part of a future scorecard. This will give an opportunity for HDSA’s to participate actively in the refining business.
• HDSA companies should be assisted to optimally get involved in investing in the refinery upgrades and in providing services and related products there to as much as possible.
12.9. Retailing
• Oil companies to improve on practical aspects of training through structured mentorship, amongst other measures.
• Oil companies to more determinedly consider ways of renegotiating the stumbling block types
of evergreen contracts. DOE to consider related incentives so as to open up more lucrative
opportunities to black retailers.
• Oil Companies and government to assist with the evaluation of the goodwill prices for existing
service stations.
• Oil companies to introduce product lines from local small business suppliers – especially those surrounding refineries, e.g. bakery supplies, on a regional basis.
DOE needs to: • Improve the retail and site license management program and exercise vigilance during the retail
site change over process, to ensure no inadvertent set – back to HDSA advancement takes place. • Consider incentivizing the current Non-HDSA retailers to sell (shares) to HDSA’s, to avoid
overtrading of the industry and expand opportunities for entry by HDSA’s.
• Facilitate guidance on clauses to be discouraged from franchise agreements after properly
investigating the complaints of franchisees.
• Investigate and address the perception of low retail margins.
• Investigate and strike an understanding with the oil companies on the over-representation of
Indians among the black groups, and how this will be managed in future.
• Set stretch targets in a future framework to ensure this element does not regress further, but
improves.
• Continue discussions with DFIs commercial banks, to encourage appropriate funding and support packages.
12.10. Wholesaling
DOE must ensure the enforcement of the petroleum and liquid fuels charter by all, and in particular:
o Revise the regulatory barriers which disadvantage the HDSA wholesalers
o Address inadvertent unfair competition by oil Majors.
o Better regulate importing by oil companies in order to allow HDSA’s to be competitive.
o Investigate alleged fronting.

135
o Ensure that NERSA monitors and enforces compliance of oil companies to the Petroleum
Pipelines Act 60 of 2003
o Ensure and facilitate TransNet to more aggressively implement an empowerment
framework for HDSAs.
o Set measurable stretching targets for wholesaling with clear indication of requirements with
respect to all types of wholesalers.
In terms of enterprise development, DOE to:
• Facilitate development and access to beginners’ guides into wholesaling clearly setting out
critical success factors.
• Consider rationalising number of licensed wholesalers.
• Facilitate creation of a benchmark for realistic HDSA wholesale license conditions.
• Continue to support HDSA wholesalers in all of its departments and entities by designing and
enforcing policies that favor HDSA’s., e.g. in procurement
Facilitate access to strategic infrastructure as covered in 12.7 above.
12.11. Enterprise Development
Some way of incentivizing the oil majors to make greater effort in the following charter-specific
elements not accommodated by the Codes currently to be found:
o Access to joint facilities
o Access to refining capacity
o Retailing
o Wholesaling
o Terms of credit – as part of procurement?
o Synfuel supply
12.12. Access to Finance
• Local international banks like ABSA to be lobbied to make appropriate introductions and
facilitation with their international arms.
• DFI’s to be assisted to develop tailor-made and relevant product packages for the sector.
• International suppliers to be sensitised through their governments by means of a.o. trade
agreements, to relax unnecessary demands; and be educated on the country’s capabilities and
transformation objectives and modus operandi.
136
12.13. Legislation
In summary, DOE to deal with the following legislative / policy matters:
Alignment of the different legislation requirements resulting from concurrent jurisdiction
affecting industry / sector participants.
Review of LFC in line with BBBEE sector codes through the development of a sector code.
Vigilance by government licensing department in enforcing BEE ownership particularly
during the retail site change over process.
The compliance burden on small companies and HDSA wholesalers in particular regarding
licensing and other requirements to be relooked, so that targets and requirements are more
achievable and favourable and don’t prove to be a stumbling block for their advancement in
the sector.
Conditions for allowing companies to continue having a valid license and consequences of
not following through on the intended purpose to be made and enforced.
Articulation of the extent to which the government will intervene in matters of disputes
between oil companies and their suppliers and options / channels available to suppliers in
the event of a dispute.
12.14. Reporting, Monitoring and Evaluation
Establishment of a reporting framework for the monitoring and measurement of compliance
against set objectives and targets, resulting in uniform reporting by all the oil companies.
Web based monitoring and evaluation system that would allow companies to post their
compliance reports annually.
o The electronic system should allow for exception reports that will allow the
department to spot problem and potential problems sooner and deal with these
expediently.
A mechanism for more regular/ systematic reviews of the new framework.
Conducting of these compliance assessments (to the LFC charter) annually, to keep the
companies on their toes and maintain the momentum created by this review.
Establishment of a vibrant platform on which to share information and strategies on the
new empowerment framework.
Any future framework would require clarity on the following matters among others:
o A pronouncement would be required on what qualifies as TMPS (total measured
procurement spend) and exclusions there from, to ensure uniformity.
o Conditions for the MFT (modified flow-through principle) in calculating ownership
levels to be recognised.

137
Real incentives to be provided to companies that comply and punitive measures taken
against those who will not.
To also consider the introduction of awards for oil companies that do well in their
transformation programs, (i.e. compliance with LFC requirements), to further bolster the
necessary competitive environment and strife for excellence.
12.15. Sector Code Recommendation
It is recommended that the DOE lead a process to develop a sector code in terms of the BBBEE
framework to the DTI Codes. This will ensure measurability and yet preservation of the cornerstones
of the previous charter that are not adequately catered for in the Generic BEE Codes.
OR strike an agreement with the DTI that would achieve a similar end result, taking into account
envisaged upcoming changes to the BBBEE codes.
Sector code enablers include:
Categories/Indicators / sub - elements
Weighting points
Compliance targets
Bonus points/ Sub - minimums
Additional elements
138
13. Bibliography
1. Baptiste Audren, LFC Audit BNP PARIBAS Presentation, December 2010.
2. Business Monitor International, South Africa Oil and Gas Report Q1 2011, 14 January 2011.
3. Charter for the South African Petroleum and Liquid Fuels Industry: Empowering Historically Disadvantaged South Africans, 2 November 2000.
4. Department of Minerals and Energy Annual Report 2009/2010.
5. Department of Minerals and Energy, Energy Security Master Plan - Liquid Fuels 2007.
6. Dipuo Peters, MP, Remarks of the Minister of Energy South Africa at the Press Briefing ahead of the Energy Budget Vote, Cape Town, 20 April 2010.
7. D.W. Right, Macquarie Liquid Fuels Conference Changing SA Supply/Demand Balance, 10 November 2010.
8. Evolution of Fuel Specifications and Refinery Development in Africa, Conference Report, Kampala-Uganda 24th – 25th November 2009.
9. Jacob.G. Zuma, State President of the Republic of South Africa, State of the Nation Address, 10 February 2011.
10. Jan Stuart, Tighter Balances, our outlook for global oil supply and demand through 2015, SAPIA – Macquarie Liquid Fuels Conference, Cape Town, 10 November 2010.
11. Khumo Ntla, Liquid Fuels Charter Review, WOESA Presentation, 30 November 2010.
12. Masami Kojima, William Matthews and Fred Sexsmith, Petroleum Markets in Sub-Saharan Africa, March 2010.
13. Market Publishers, Oil and Gas in South Africa, Market Report Database, July 2010.
14. MBendi Information Services, Oil Refining in Africa - Overview, 11 March 2011.
15. Nelisiwe Magubane, DG DOE, Key Note Address at the Liquid Fuels Conference, Cape Town, 10 November 2010.
16. Peter Noke, Liquid Fuels Charter and Retail, SAPRA Presentation, January 2011.
17. Pravin Gordhan, MP, Minister of Finance South Africa, 2011 Budget Speech, Cape Town, 23 February 2011.
18. Reggie Sibiya, Liquid Fuels Empowerment Charter – Journey, FRA Presentation, 7/8 December 2010.
19. Rod Crompton, Dr, Petroleum and Liquid Fuels Industry Charter, NERSA Presentation, 30 November 2010.
20. SAPIA Annual Report 2009.
21. Sulaiman Said, Fundamentals of the South African Oil Industry – The Value Chain, Institute for Petroleum Strategy and Research, 6 March 2001.
22. Strategic Plan 2011/12 – 2015/16, Department of Energy.
23. Swiss Business Hub South Africa, South African Infrastructure Report, February 2009.
24. Thandiwe Noruwana, LFC Audit NEF Presentation, 26 January 2011
25. Thembinkosi Bonakele, Competition Law Challenges in the Petroleum Industry, Liquid Fuels Conference Cape Town, 10 November 2010.
26. WWW.Energy.Gov.Za\Petroleum Sources\Overview
27. Xhinua News Agency, BRIC forum helps four emerging nations reach common goals: experts, 16 April 2010.