petrobras releases third-quarter 2005 … releases third-quarter 2005 results ... petrobras reported...
TRANSCRIPT
1
PETROBRAS RELEASES THIRD-QUARTER 2005 RESULTS (Rio de Janeiro – November 11, 2005) – PETRÓLEO BRASILEIRO S.A. – PETROBRAS releases its consolidated results today, expressed in millions of reais, according to Brazilian GAAP. PETROBRAS reported consolidated net income of R$ 5.632 million in 3Q-2005, 27% higher than net income reported in 3Q-2004 (R$ 4.440 million), excluding the effect of the fiscal benefit from declaration of interest on own capital in 3Q-2004. Consolidated net operating revenues were R$ 35.711 million, 18% higher than in the same period of 2004 (R$ 30.170 million). EBITDA in 3Q-2005 reached R$ 12.488 million, which result was 31% higher than the R$ 9.548 million reported in 3Q-2004. The Company’s market value on September 30, 2005, reached R$ 168.035 million.
• Net income in 3Q-2005 was 27% higher than net income in 3Q-2004, excluding the effect of the fiscal benefit from the declaration of interest on own capital in 3Q-2004. Higher net income was a result of the profitability obtained in the period due to the increase in prices and volumes sold in the domestic and external markets. These effects were partially offset by growth in cost of goods sold, where higher expenses related to government take are highlighted, and in expenses with oil products imports, technical services and materials.
• In 3Q-2005, consolidated gross and net revenues were
R$ 46.555 million and R$ 35.711 million, respectively. Growth in consolidated gross and net revenues in comparison to 3Q-2004 was R$ 5.980 million (15%) and R$ 5.541 million (18%), respectively.
• Total production of oil, NGL and natural gas rose 10% over 3Q-2004, reaching an average of 2,257 thousand barrels of oil equivalent per day, due in part to the coming on line of Platforms P-43 (Barracuda) and P-48 (Caratinga) in December 2004 and February 2005, respectively. Production of oil and NGL in Brazil reached an average of 1,725 thousand bpd, with 84% coming from the Campos Basin (1,445 thousand bpd).
• Net financial debt of the PETROBRAS System fell from
R$ 33.316 million on June 30, 2005, to R$ 26.203 million on September 30, 2005, reflecting the appreciation of the real against the dollar in the quarter.
• The Company’s market value on September 30, 2005, was R$ 168.035 million, a 54% increase over September 30, 2004 (R$ 109.152 million).
• From January through September 2005, the PETROBRAS System invested R$ 16.921 million, with R$ 8.907 million in development of oil and natural gas production capacity. These investments include those made by Special Purpose Companies (SPCs), which totaled R$ 1.914 million.
• The value added by the PETROBRAS System in the
period from January through September 2005 was R$ 81.003, 19% higher than in the same period of 2004, with R$ 46.946 million destined to government take and to federal, state and municipal taxes, R$ 10.798 million to financial institutions and suppliers for payment of expenses related to financing, rent and freight, R$ 17.170 million to shareholders, and R$ 6.089 million to salaries and benefits.
This document is broken down into 5 sections: PETROBRAS SYSTEM Table of Contents PETROBRAS Table of Contents Financial Performance 3 Financial Statements 29 Operating Performance 5 Financial Statements 15 Appendices 24
PETROBRAS SYSTEM ,
2
A word from the President, Mr. José Sérgio Gabrielli de Azevedo It is with great satisfaction that we again report excellent quarterly results with consolidated net income of R$ 5.632 million. In addition, we consolidated our already-strong financial position with our significant cash generation, which reached R$ 12.488 million in the quarter (EBITDA). As a result of our efforts in the operating and corporate arenas, we recently achieved an investment grade rating of Baa2 from Moody´s Investor Services for our foreign currency bond offering. This rating is 4 notches above the rating of the Republic of Brazil. In their analysis, Moody’s recognized both the improvement in the Republic of Brazil´s financial outlook, as well as the reduction in PETROBRAS’S consolidated financial debt, the integration of our operations, and the growth in production and exports, all of which have contributed to increasing our capacity to generate foreign currency flows. In this quarter we also released the revision of our 2006-2010 Business Plan, which, in general lines, maintains PETROBRAS’ aggressive growth goals and defines investment priorities for the next few years. All the described goals and achievements are the result of the dedication of PETROBRAS and its entire workforce in putting this business plan into action in a profitable manner, with social and environmental responsibility, and guaranteeing sustainable growth in its activities. The excellent quarterly result reflected numerous measures that have been implemented in the operating and corporate areas, in particular the following: Price readjustment of PETROBRAS’ main products: gasoline by 10% and diesel by 12%. These adjustments were defined
by the Company considering new levels of oil prices from a medium- and long-term perspective. These prices reflect our corporate strategy of aligning domestic prices with prices signals from the international market.
In August, PETROBRAS reached an average throughput of 1,828 thousand bpd, which represents a new monthly record in
the utilization of the company’s refining capacity. This record was established while part of our installed capacity of conversion was under maintenance, and despite that there was an 80% participation of national oil in the processed throughput.
Executive Board approval for the study of five initiatives with the state-owned company Petróleos de Venezuela S.A.
(PDVSA), most notably a detailed study for a 50/50 joint venture to build a refinery in Pernambuco with the capacity to process 200,000 barrels of oil per day. The refinery would be configured to maximize the production of diesel oil and liquefied petroleum gas in order to satisfy the expected demand for such products in the Northeast by 2011.
The chartering of two FPSOs (floating oil production, storage and transfer system) destined for the development of Module II of the Golfinho field and areas to the south of the Espadarte field, and an FSO (floating oil storage and transfer system) destined to the Director Plan for Oil Transport and Treatment (PDET) on the continental shelf of Espírito Santo and Campos.
In the International arena, PETROBRAS’S active participation in exploration tenders resulted in a number of successful
acquisitions: In the United States, our wholly owned subsidiary Petrobras America, submitted the largest number of winning proposals in the most recent tender promulgated by the U.S. Government´s Minerals Management Service (MMS); in Nigeria, PETROBRAS obtained an exploratory block as operator in Nigerian deepwater. PETROBRAS’ investments in those regions are a direct result of our acknowledged leadership in deep water exploration. An example of our technological capacity was the discovery of gas reserves in the first well operated by Petrobras América in deepwater in the Gulf of Mexico, where high-quality gas reserves were found with total density of 40 meters;
In the corporate area, I would particularly like to highlight the share split of the Company’s capital on September 1st, 2005, which has substantially increased the trading activity of our shares, thereby contributing to the greater liquidity and value of our shareholder equity. This has principally benefited our minority shareholders. Along the same lines, PETROBRAS and its subsidiary Petrobras International Finance Company (PIFCO) have added to their financial flexibility and ability to access to the international capital markets by renewing their Shelf Registration with the U.S. Securities and Exchange Commission (SEC). the Shelf enables PETROBRAS or PIFCO to issue a wide range of debt and equity instruments for up to US$ 6.5 billion over the next 24 months. In activities related to corporate governance, and in compliance with the Sarbanes Oxley Act, we have made available lines of communication to receive information on possible accounting, financing and/or auditing irregularities. Thus, any person, including shareholders, employees, suppliers and clients of PETROBRAS or its controlled companies, may communicate facts of this nature to the Company Audit Committee by means of e-mail to [email protected] or by mail, furnishing the facts that will permit the full investigation of any wrongdoing. As a reflection of good corporate governance practices, for the second consecutive year PETROBRAS won the Transparency Trophy offered annually by ANEFAC (National Association of Finance, Administrative and Accounting Executives), whose importance is indicated by the technical rigor in selection of participants. The award is recognition for Brazilian companies that today incorporate and practice intangible values in a globalized world, such as education, community development, preservation
PETROBRAS SYSTEM ,
3
of the environment, and preservation of the social values of the populations located in the areas in which the companies operate. A subsequent event to the 3rd quarter was PETROBRAS achievements in the 7th ANP (National Petroleum Agency) Exploratory Bid. The Company acquired 96 exploratory blocks, of which 54 in partnerships and 42 alone, being the biggest acquirer. These new concession areas will allow us to rebuild and strength our exploration portfolio.

PETROBRAS SYSTEM Financial Performance
4
Net Income and Consolidated Economic Indicators
PETROBRAS, its subsidiaries and controlled companies, reported net income of R$ 15.583 million for the period ended September 30, 2005, 23% higher than the net income reported for the period ended September 30, 2004..
2Q - 2005 (1) 2005 (1) 2004 (2) % 2005 (1) 2004 (2) %
42.646 46.555 40.575 15 Gross Operating Revenue 128.999 110.876 1632.359 35.711 30.170 18 Net Operating Revenue 97.967 81.387 209.576 10.630 7.901 35 Operating Profit (3) 29.017 21.948 32(630) (1.018) 30 - Financial Result (2.721) (2.610) 4
4.930 5.632 5.559 1 Net Income 15.583 12.650 231,12 1,28 1,27 1 Net Income per Share (4) 3,55 2,88 23
126.543 168.035 109.152 54 Market Value (Parent Company) 168.035 109.152 54
45 42 42 - Gross Margin (%) 44 42 230 30 26 4 Operating Margin (%) 30 27 315 16 18 (2) Net Margin (%) 16 16 -
11.809 12.488 9.548 31 EBITDA – R$ million (5) 34.781 26.806 30
Financial and Economic Indicators51,59 61,53 41,54 48 Brent (US$/bbl) 53,54 36,28 48
2,4822 2,3449 2,9773 (21) US Dollar Average Price - Sale (R$) 2,4970 2,9732 (16) 2,3504 2,2222 2,8586 (22) US Dollar Last Price - Sale (R$) 2,2222 2,8586 (22)
R$ Million Jan-SepThird Quarter
(1) As of January 1, 2005, the Special Purpose Companies whose activities are directly or indirectly controlled by PETROBRAS were included in the Consolidated Financial Statements, as per CVM Instruction No. 408/2004.
(2) To facilitate comparison, the Special Purpose Companies were also included in the 3Q-2004 financial statements, and in the accumulated period January-September 2004.
(3) Income before financial revenues and expenses, equity income and taxes.
(4) For purposes of comparison, net income per share was recalculated for the prior periods, due to the stock split approved at the Extraordinary Shareholders Meeting on July 22, 2005.
(5) Operating income before the financial result and equity income + depreciation/amortization/well write-offs.
2Q-2005 2005 2004 2005 2004
8.462 9.353 7.599 Operating Income as per Brazilian Company Law 25.754 19.463 630 1.018 (30) (-) Financial Result 2.721 2.610 484 259 332 (-) Equity Income Results 542 (125)
9.576 10.630 7.901 Operating Profit 29.017 21.948 2.233 1.858 1.647 Depreciation & Amortization 5.764 4.858
11.809 12.488 9.548 EBITDA 34.781 26.806
36 35 32 EBITDA Margin (%) 36 33
EBITDA COMPONENTS
R$ Million Third Quarter Jan-Sep

PETROBRAS SYSTEM Financial Performance
5
Growth in consolidated net income in the period ended September 30, 2005, in comparison to the same period of 2004, was mainly due to the increase in average sale prices and volumes sold, as shown below:
• R$ 8.637 million increase in gross income, mainly due to the increase in prices and commercialized volume in the domestic and external market. The following table details the gross income variation:
Jan-Sep 2005 / Jan-Sep 2004 VARIATION
Net Revenues
Cost of Goods Sold
Gross Income
Domestic Market: - Effect of Volumes Sold 1.179 (468) 711 - Effect of Prices 9.651 - 9.651
. Intl. Market: - Effect of Export Volumes 1.888 (704) 1.184 - Effect of Export Price 2.674 - 2.674
Increased expenses: - Oil and Oil Product Imports - (1.019) (1.019) - Third-Party Services - (596) (596) - Domestic Government Take - (1.883) (1.883) - Sea Freight and Pipelines - (471) (471) - Salaries, Perquisites and Benefits - (539) (539) - Materials, Services and Depreciation - (733) (733)
. Increase in Profitability of Distribution Segment 718 - 718
. Increased Operations of Commercialization Abroad 695 (660) 35
. Increase (Decrease) in International Sales (124) 92 (32)
(733) (114) (847)
. Others 632 (848) (216)
16.580 (7.943) 8.637
. FX Effect on Controlled Companies' Revenues and Costs Abroad
Analysis of Gross Income - Main Items
R$ Million
• Increased Sales Expenses (R$ 303 million), due to the increased volume commercialized in the domestic and external markets, as well as the increase in sea freight.
• Higher General and Administrative Expenses (R$ 853 million), due to higher expenses for salaries and benefits related to the 2004/2005 Collective Bargaining Agreement, an increase in the workforce, and expenses related to the pension and health plans following the actuarial revision in December 2004, plus the expenses for maintaining the networks and software licenses.
• Increase in other operating expenses (R$ 969 million), mainly due to legal contingencies (R$ 246 million), institutional relations and cultural projects (R$ 106 million), and to the pension and health plans of retirees and pensioners following the actuarial revision that occurred in December 2004 (R$ 596 million).
• Reduction in tax expenses (R$ 406 million) due to the change as of August 2004 in legislation (Decree No. 5164/04) that reduced to zero the PIS/PASEP and COFINS amounts incident on financial revenues.
• Lower prospecting and exploration expenses (R$ 306 million), mainly due to the write-off of the signing bonus of Block 34 in Angola in 2004 (R$ 206 million) and from exploration expenses in Ecuador and the United States (R$ 128 million).
• An R$ 111 million decrease in the financial result, caused by losses in net financial assets exposed to exchange rate variation, following the appreciation of the Real.
• Increase in the provision for income tax and social contribution on profit in the amount of R$ 2.720 million, due to the increase in basic net income for taxation and the impact of the provisioning for interest on own capital in June, 30th, 2005 (R$ 2.193 million), which was lower than during the same period in 2004 (R$ 3.290 million) because of its deductibility from the basis of calculation of the provision for income tax and social contribution on profit.
• Loss in participation in subsidiaries, mainly abroad, from January through September 2005, in relation to the same period of the prior year of R$ 667 million. This was influenced by the impact of the appreciation of the real against the dollar from January through September 2005 (16.28%), when compared to the appreciation that occurred in the same period of the previous year (1.06%), which generated a negative exchange rate effect of R$ 672 million.

PETROBRAS SYSTEM Operating Performance
6
2Q-2005 2005 2004 % 2005 2004 %
1.897 1.889 1.691 12 Oil and LNG production 1.832 1.655 11 1.730 1.725 1.523 13 Domestic 1.667 1.487 12
167 164 168 (2) International 165 168 (2) 382 368 368 - Natural Gas Production (1) 372 360 3 284 271 270 - Domestic 274 265 3
98 97 98 (1) International 98 95 3 2.279 2.257 2.059 10 Total Production 2.204 2.015 9
(1) Does not include liquid gas and includes reinjected gas
Oil (US$/bbl)43,04 54,24 36,13 50 Brazil (2) 45,17 32,94 3734,05 37,38 28,03 33 International 34,25 26,01 32
Natural Gas (US$/bbl)12,23 13,09 10,62 23 Brazil (3) 12,39 11,13 11
9,16 10,13 6,60 53 International 9,12 6,82 34
333 393 439 (10) Crude Oil Imports 350 450 (22)
83 115 166 (31) Oil Product Imports 82 101 (19)
137 139 137 1 Import of Gas, Alcohol & Others 130 123 6
343 247 208 19 Crude Oil Exports 249 196 27
221 244 258 (5) Oil Product Exports 234 240 (3) 9 18 5 260 Other Exports 12 5 140
(20) 138 271 (49) Net Imports 67 233 (71) 1.767 1.907 1.763 8 Output of Oil Products 1.830 1.785 3
1.668 1.804 1.659 9 • Brazil 1.727 1.685 2 99 103 104 (1) • International 103 100 3
2.114 2.114 2.114 - Primary Processed Installed Capacity 2.114 2.114 -
1.985 1.985 1.985 - • Brazil (4) 1.985 1.985 -
129 129 129 - • International 129 129 - Use of Installed Capacity (%)
83 91 86 5 • Brazil 87 86 1
75 77 79 (2) • International 78 76 2 81 80 77 3 Domestic Crude as % of Total Feedstock Processed 80 76 4
Lifting Costs: • Brazil (5)
4,88 5,83 4,09 43 • • w/out Govt. Participation 5,54 4,18 33 13,29 15,48 10,71 45 • • with Govt. Participation 14,12 10,18 39 2,74 2,78 2,53 10 • International 2,69 2,49 8
Refining Cost2,06 1,93 1,32 46 • Brazil (5) 1,93 1,29 50 1,34 1,41 1,10 28 • International 1,29 1,08 19 335 400 235 70 Overhead Corporate (US$ million) - Holding 1.048 650 61
Third Quarter Jan - Sep
Average Sales Price - US$ per bbl
(5) Considers revision of accounting criteria of the indicator through appropriation of expenses made for scheduled stops and accumulation of expenses for the Pension and Health Plans as per US GAAP.
Costs - US$/barrel
Exploration & Production - Thousand bpd
Refining, Transport and Supply - Thousands bpd
(3) Internal transfer prices from E&P to Gas & Energy.
(4) As per ownership recognized by the ANP.
(2) Average of the exports and the internal transfer prices from E&P to Supply.
PETROBRAS SYSTEM Operating Performance
7
2Q-2005 2005 2004 % 2005 2004 %
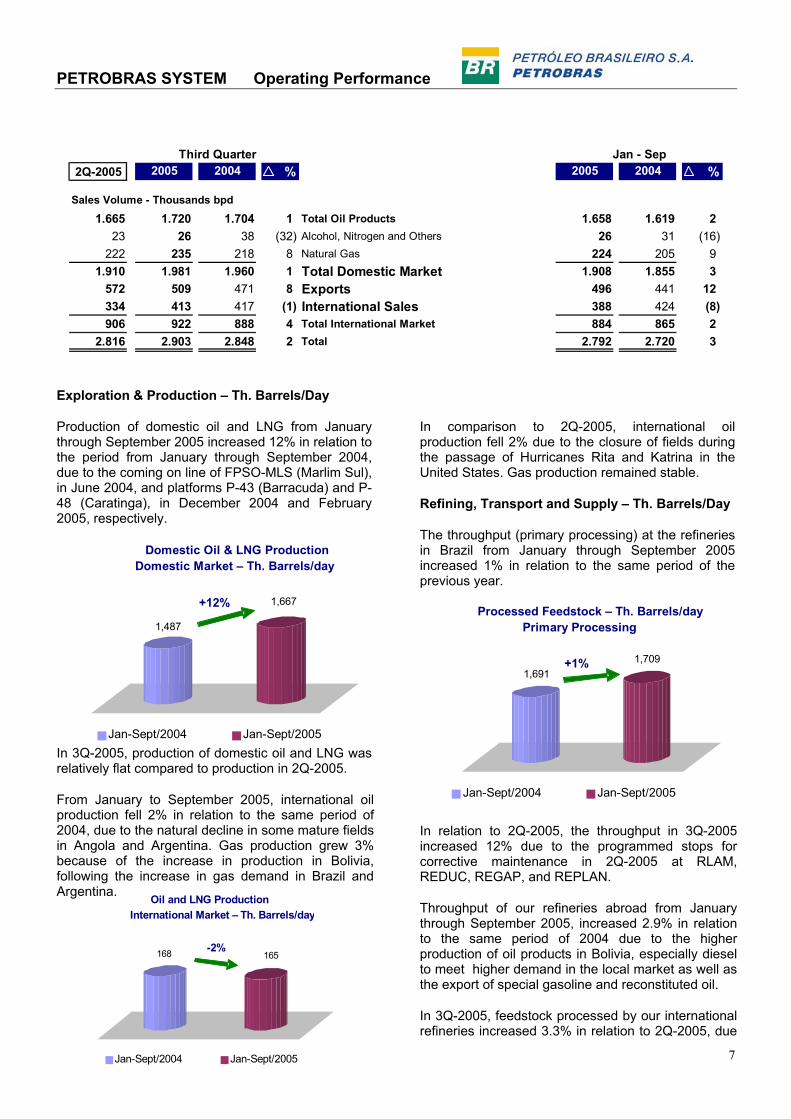
Sales Volume - Thousands bpd
1.665 1.720 1.704 1 Total Oil Products 1.658 1.619 223 26 38 (32) Alcohol, Nitrogen and Others 26 31 (16)
222 235 218 8 Natural Gas 224 205 91.910 1.981 1.960 1 Total Domestic Market 1.908 1.855 3
572 509 471 8 Exports 496 441 12334 413 417 (1) International Sales 388 424 (8)906 922 888 4 Total International Market 884 865 2
2.816 2.903 2.848 2 Total 2.792 2.720 3
Third Quarter Jan - Sep
Exploration & Production – Th. Barrels/Day
Production of domestic oil and LNG from January through September 2005 increased 12% in relation to the period from January through September 2004, due to the coming on line of FPSO-MLS (Marlim Sul), in June 2004, and platforms P-43 (Barracuda) and P-48 (Caratinga), in December 2004 and February 2005, respectively.
In 3Q-2005, production of domestic oil and LNG was relatively flat compared to production in 2Q-2005.
From January to September 2005, international oil production fell 2% in relation to the same period of 2004, due to the natural decline in some mature fields in Angola and Argentina. Gas production grew 3% because of the increase in production in Bolivia, following the increase in gas demand in Brazil and Argentina.
In comparison to 2Q-2005, international oil production fell 2% due to the closure of fields during the passage of Hurricanes Rita and Katrina in the United States. Gas production remained stable.
Refining, Transport and Supply – Th. Barrels/Day
The throughput (primary processing) at the refineries in Brazil from January through September 2005 increased 1% in relation to the same period of the previous year.
In relation to 2Q-2005, the throughput in 3Q-2005 increased 12% due to the programmed stops for corrective maintenance in 2Q-2005 at RLAM, REDUC, REGAP, and REPLAN.
Throughput of our refineries abroad from January through September 2005, increased 2.9% in relation to the same period of 2004 due to the higher production of oil products in Bolivia, especially diesel to meet higher demand in the local market as well as the export of special gasoline and reconstituted oil.
In 3Q-2005, feedstock processed by our international refineries increased 3.3% in relation to 2Q-2005, due
1,487 1,667
Domestic Oil & LNG ProductionDomestic Market – Th. Barrels/day
Jan-Sept/2004 Jan-Sept/2005
+12%
168 165
Oil and LNG Production International Market – Th. Barrels/day
Jan-Sept/2004 Jan-Sept/2005
-2%
1,6911,709
Processed Feedstock – Th. Barrels/dayPrimary Processing
Jan-Sept/2004 Jan-Sept/2005
+1%
PETROBRAS SYSTEM Operating Performance
8
to the realization of the test for feedstock load in the refineries in Bolivia.
Costs
Lifting Cost (US$/Barrel)
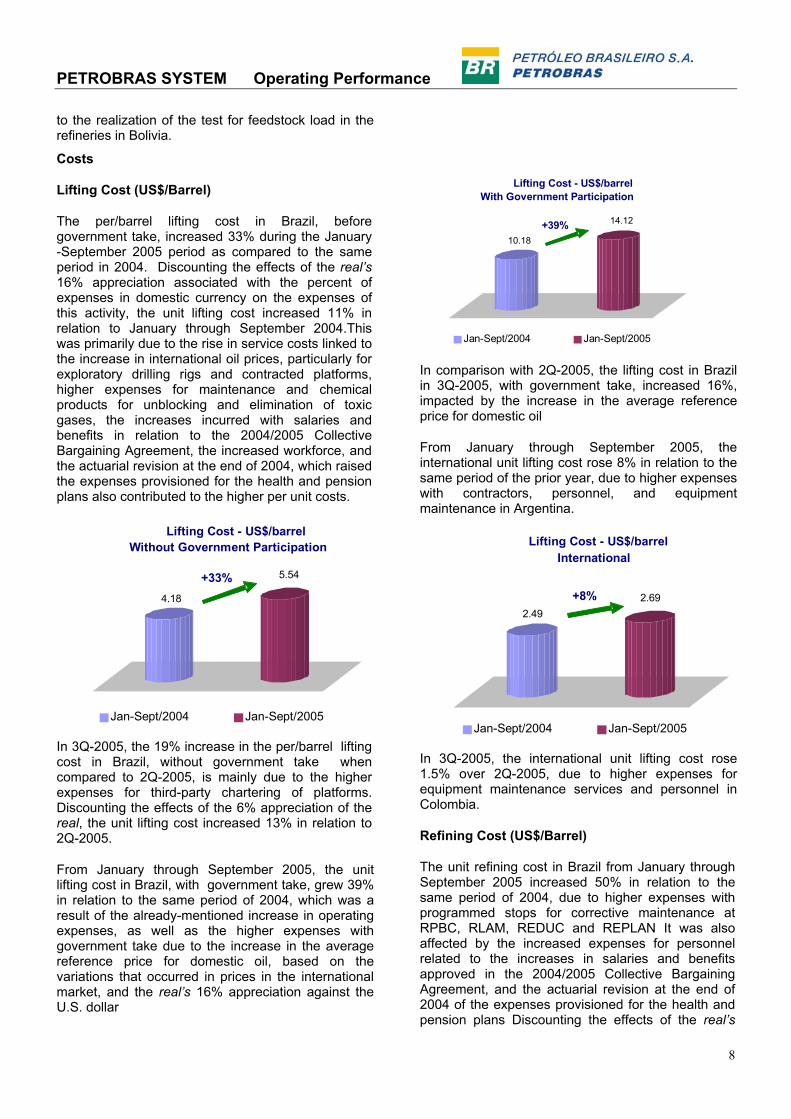
The per/barrel lifting cost in Brazil, before government take, increased 33% during the January -September 2005 period as compared to the same period in 2004. Discounting the effects of the real’s 16% appreciation associated with the percent of expenses in domestic currency on the expenses of this activity, the unit lifting cost increased 11% in relation to January through September 2004.This was primarily due to the rise in service costs linked to the increase in international oil prices, particularly for exploratory drilling rigs and contracted platforms, higher expenses for maintenance and chemical products for unblocking and elimination of toxic gases, the increases incurred with salaries and benefits in relation to the 2004/2005 Collective Bargaining Agreement, the increased workforce, and the actuarial revision at the end of 2004, which raised the expenses provisioned for the health and pension plans also contributed to the higher per unit costs.
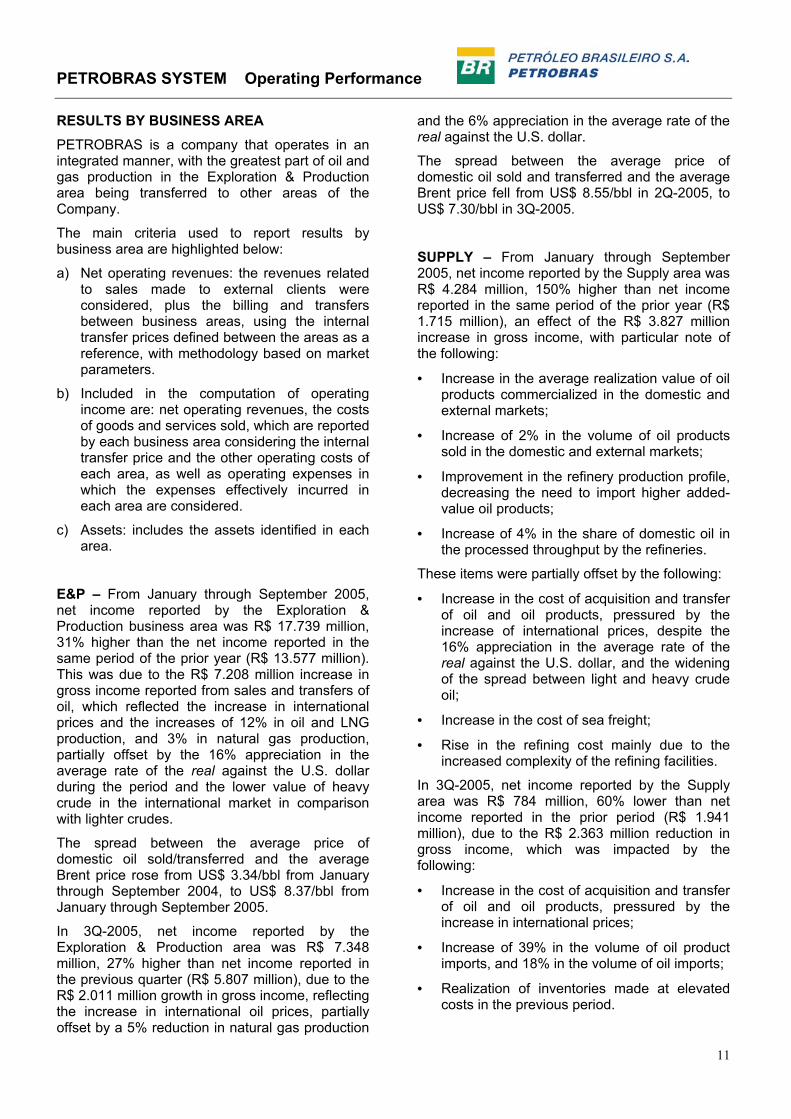
In 3Q-2005, the 19% increase in the per/barrel lifting cost in Brazil, without government take when compared to 2Q-2005, is mainly due to the higher expenses for third-party chartering of platforms. Discounting the effects of the 6% appreciation of the real, the unit lifting cost increased 13% in relation to 2Q-2005.
From January through September 2005, the unit lifting cost in Brazil, with government take, grew 39% in relation to the same period of 2004, which was a result of the already-mentioned increase in operating expenses, as well as the higher expenses with government take due to the increase in the average reference price for domestic oil, based on the variations that occurred in prices in the international market, and the real’s 16% appreciation against the U.S. dollar
In comparison with 2Q-2005, the lifting cost in Brazil in 3Q-2005, with government take, increased 16%, impacted by the increase in the average reference price for domestic oil
From January through September 2005, the international unit lifting cost rose 8% in relation to the same period of the prior year, due to higher expenses with contractors, personnel, and equipment maintenance in Argentina.
In 3Q-2005, the international unit lifting cost rose 1.5% over 2Q-2005, due to higher expenses for equipment maintenance services and personnel in Colombia.
Refining Cost (US$/Barrel)
The unit refining cost in Brazil from January through September 2005 increased 50% in relation to the same period of 2004, due to higher expenses with programmed stops for corrective maintenance at RPBC, RLAM, REDUC and REPLAN It was also affected by the increased expenses for personnel related to the increases in salaries and benefits approved in the 2004/2005 Collective Bargaining Agreement, and the actuarial revision at the end of 2004 of the expenses provisioned for the health and pension plans Discounting the effects of the real’s
4.18 5.54
Lifting Cost - US$/barrel Without Government Participation
Jan-Sept/2004 Jan-Sept/2005
+33%
10.18
14.12
Lifting Cost - US$/barrel With Government Participation
Jan-Sept/2004 Jan-Sept/2005
+39%
2.492.69
Lifting Cost - US$/barrelInternational
Jan-Sept/2004 Jan-Sept/2005
+8%

PETROBRAS SYSTEM Operating Performance
9
16% appreciation, associated with the percent of expenses in domestic currency on the expenses of this activity, the unit refining cost increased 29% in relation to January through September 2004.
In comparison to 2Q-2005, the unit refining cost in Brazil in 3Q-2005 fell 6%, due mainly to the 12% increase in the volume processed, as well as lower consumption of catalyzers and chemical products in the current quarter. This reduction was partly offset by the growth in expenses for programmed stops for preventive maintenance at RPBC and REDUC.
From January through September 2005, the average international unit refining cost increased 19% over the same period of 2004, due to higher expenses with personnel, electricity and third-party services at the refineries in Argentina, plus the expenses related to equipment maintenance, electricity and personnel in Bolivia.
The average international unit refining cost in 3Q-2005 increased 5% in relation to 2Q-2005, due to higher expenses for personnel, energy and equipment maintenance services at the refineries in Argentina and Bolivia.
Overhead (US$ millions)
In comparison to January through September 2004, corporate overhead rose 61% due to higher expenses for contracted services, mainly those linked to data processing, safety, environment and health, expenses related to sponsorships, publicity and institutional propaganda, expenses connected to maintenance and infrastructure of the administrative buildings, the increased expenses for salaries and benefits approved in the 2004/2005 Collective Bargaining Agreement, and revision of the actuarial calculation linked to the health and pension plans. Discounting the effects of the 16% appreciation of the real, with all the expenses in this area in reais, overhead increased 38% in relation to January through September 2004.
In comparison to 2Q-2005, corporate overhead in 3Q-2005 increased 19%, due mainly to higher expenses with services contracted for publicity and advertising, sponsorships, health, safety and the environment, and consulting in the area of data processing. Discounting the effects of the 6% appreciation of the real, with all the expenses in this area in reais, overhead increased 12% in relation to 2Q-2005.
Sales Volume – Th. Barrels/Day
The sales volume of oil products increased 2% in the domestic market from January through September 2005 in relation to the same period of the previous year, especially in increased sales of gasoline, diesel oil and jet fuel, which were offset by the reduction in sales of fuel oil. The retraction in consumption of fuel oil was due to strong competition from substitute products such as coal, coke, biomass, wood, and natural gas.
1.29
1.93
Refining Cost - US$/barrel Brazil
Jan-Sept/2004 Jan-Sept/2005
+50%
1.08 1.29
Refining Cost - US$/barrel International
Jan-Sept/2004 Jan-Sept/2005
+19%
650
1,048
Corporate Overhead US$ Millions
Jan-Sept/2004 Jan-Sept/2005
+61%
PETROBRAS SYSTEM Operating Performance
10
Consolidated Statement of Results by Business Area
2Q-2005 (4) 2005 2004 % 2005 2004 %
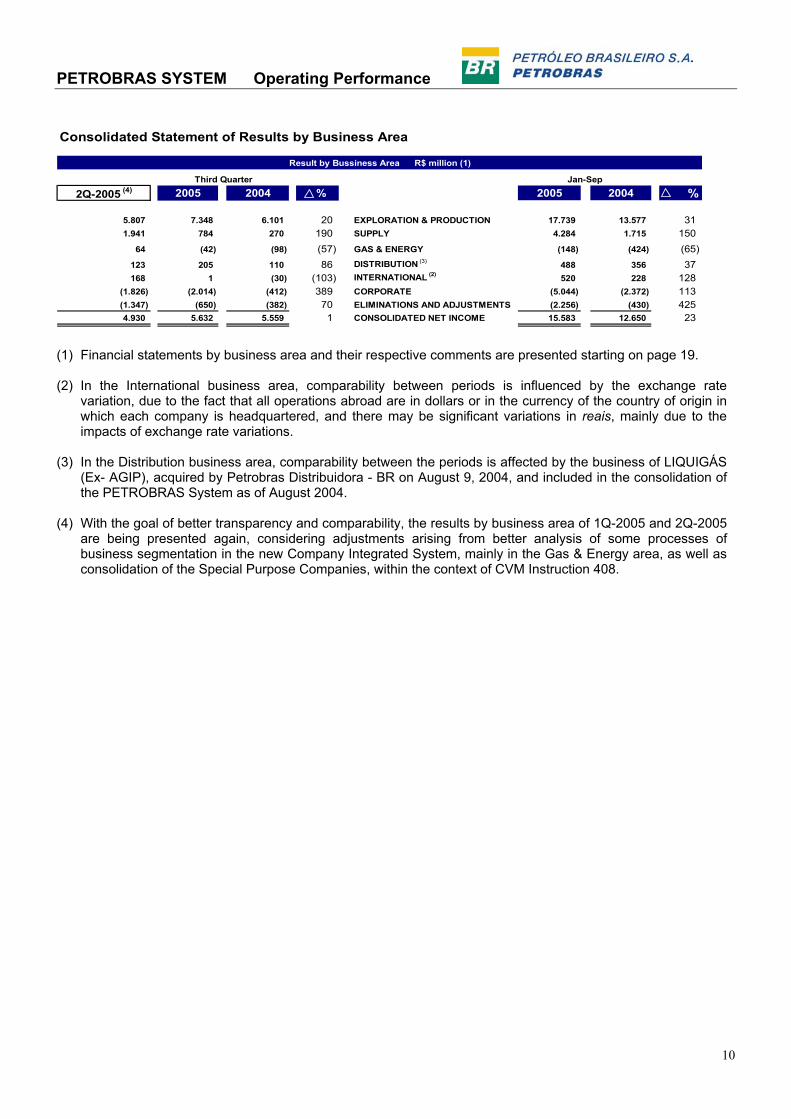
5.807 7.348 6.101 20 EXPLORATION & PRODUCTION 17.739 13.577 311.941 784 270 190 SUPPLY 4.284 1.715 150
64 (42) (98) (57) GAS & ENERGY (148) (424) (65)123 205 110 86 DISTRIBUTION (3) 488 356 37168 1 (30) (103) INTERNATIONAL (2) 520 228 128
(1.826) (2.014) (412) 389 CORPORATE (5.044) (2.372) 113(1.347) (650) (382) 70 ELIMINATIONS AND ADJUSTMENTS (2.256) (430) 4254.930 5.632 5.559 1 CONSOLIDATED NET INCOME 15.583 12.650 23
Result by Bussiness Area R$ million (1)
Third Quarter Jan-Sep
(1) Financial statements by business area and their respective comments are presented starting on page 19.
(2) In the International business area, comparability between periods is influenced by the exchange rate
variation, due to the fact that all operations abroad are in dollars or in the currency of the country of origin in which each company is headquartered, and there may be significant variations in reais, mainly due to the impacts of exchange rate variations.
(3) In the Distribution business area, comparability between the periods is affected by the business of LIQUIGÁS
(Ex- AGIP), acquired by Petrobras Distribuidora - BR on August 9, 2004, and included in the consolidation of the PETROBRAS System as of August 2004.
(4) With the goal of better transparency and comparability, the results by business area of 1Q-2005 and 2Q-2005
are being presented again, considering adjustments arising from better analysis of some processes of business segmentation in the new Company Integrated System, mainly in the Gas & Energy area, as well as consolidation of the Special Purpose Companies, within the context of CVM Instruction 408.
PETROBRAS SYSTEM Operating Performance
11
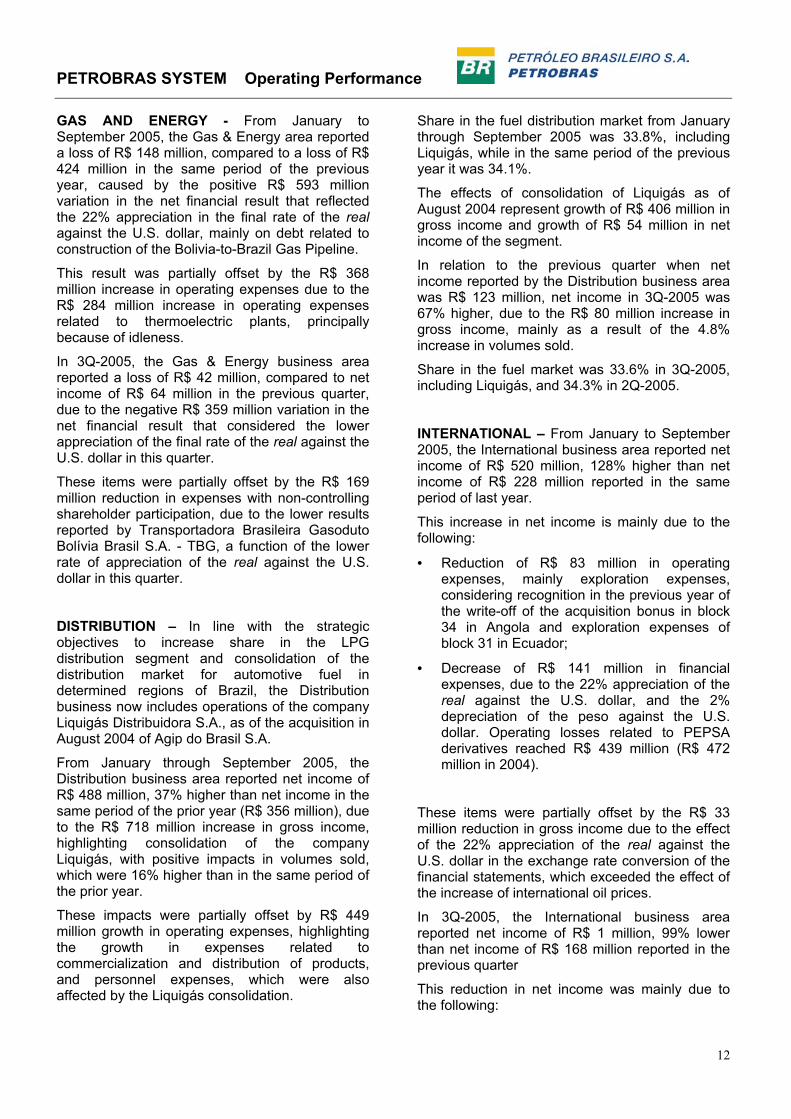
RESULTS BY BUSINESS AREA PETROBRAS is a company that operates in an integrated manner, with the greatest part of oil and gas production in the Exploration & Production area being transferred to other areas of the Company.
The main criteria used to report results by business area are highlighted below:
a) Net operating revenues: the revenues related to sales made to external clients were considered, plus the billing and transfers between business areas, using the internal transfer prices defined between the areas as a reference, with methodology based on market parameters.
b) Included in the computation of operating income are: net operating revenues, the costs of goods and services sold, which are reported by each business area considering the internal transfer price and the other operating costs of each area, as well as operating expenses in which the expenses effectively incurred in each area are considered.
c) Assets: includes the assets identified in each area.
E&P – From January through September 2005, net income reported by the Exploration & Production business area was R$ 17.739 million, 31% higher than the net income reported in the same period of the prior year (R$ 13.577 million). This was due to the R$ 7.208 million increase in gross income reported from sales and transfers of oil, which reflected the increase in international prices and the increases of 12% in oil and LNG production, and 3% in natural gas production, partially offset by the 16% appreciation in the average rate of the real against the U.S. dollar during the period and the lower value of heavy crude in the international market in comparison with lighter crudes.
The spread between the average price of domestic oil sold/transferred and the average Brent price rose from US$ 3.34/bbl from January through September 2004, to US$ 8.37/bbl from January through September 2005.
In 3Q-2005, net income reported by the Exploration & Production area was R$ 7.348 million, 27% higher than net income reported in the previous quarter (R$ 5.807 million), due to the R$ 2.011 million growth in gross income, reflecting the increase in international oil prices, partially offset by a 5% reduction in natural gas production
and the 6% appreciation in the average rate of the real against the U.S. dollar.
The spread between the average price of domestic oil sold and transferred and the average Brent price fell from US$ 8.55/bbl in 2Q-2005, to US$ 7.30/bbl in 3Q-2005.
SUPPLY – From January through September 2005, net income reported by the Supply area was R$ 4.284 million, 150% higher than net income reported in the same period of the prior year (R$ 1.715 million), an effect of the R$ 3.827 million increase in gross income, with particular note of the following:
• Increase in the average realization value of oil products commercialized in the domestic and external markets;
• Increase of 2% in the volume of oil products sold in the domestic and external markets;
• Improvement in the refinery production profile, decreasing the need to import higher added-value oil products;
• Increase of 4% in the share of domestic oil in the processed throughput by the refineries.
These items were partially offset by the following:
• Increase in the cost of acquisition and transfer of oil and oil products, pressured by the increase of international prices, despite the 16% appreciation in the average rate of the real against the U.S. dollar, and the widening of the spread between light and heavy crude oil;
• Increase in the cost of sea freight;
• Rise in the refining cost mainly due to the increased complexity of the refining facilities.
In 3Q-2005, net income reported by the Supply area was R$ 784 million, 60% lower than net income reported in the prior period (R$ 1.941 million), due to the R$ 2.363 million reduction in gross income, which was impacted by the following:
• Increase in the cost of acquisition and transfer of oil and oil products, pressured by the increase in international prices;
• Increase of 39% in the volume of oil product imports, and 18% in the volume of oil imports;
• Realization of inventories made at elevated costs in the previous period.
PETROBRAS SYSTEM Operating Performance
12
GAS AND ENERGY - From January to September 2005, the Gas & Energy area reported a loss of R$ 148 million, compared to a loss of R$ 424 million in the same period of the previous year, caused by the positive R$ 593 million variation in the net financial result that reflected the 22% appreciation in the final rate of the real against the U.S. dollar, mainly on debt related to construction of the Bolivia-to-Brazil Gas Pipeline. This result was partially offset by the R$ 368 million increase in operating expenses due to the R$ 284 million increase in operating expenses related to thermoelectric plants, principally because of idleness.
In 3Q-2005, the Gas & Energy business area reported a loss of R$ 42 million, compared to net income of R$ 64 million in the previous quarter, due to the negative R$ 359 million variation in the net financial result that considered the lower appreciation of the final rate of the real against the U.S. dollar in this quarter.
These items were partially offset by the R$ 169 million reduction in expenses with non-controlling shareholder participation, due to the lower results reported by Transportadora Brasileira Gasoduto Bolívia Brasil S.A. - TBG, a function of the lower rate of appreciation of the real against the U.S. dollar in this quarter.
DISTRIBUTION – In line with the strategic objectives to increase share in the LPG distribution segment and consolidation of the distribution market for automotive fuel in determined regions of Brazil, the Distribution business now includes operations of the company Liquigás Distribuidora S.A., as of the acquisition in August 2004 of Agip do Brasil S.A.
From January through September 2005, the Distribution business area reported net income of R$ 488 million, 37% higher than net income in the same period of the prior year (R$ 356 million), due to the R$ 718 million increase in gross income, highlighting consolidation of the company Liquigás, with positive impacts in volumes sold, which were 16% higher than in the same period of the prior year.
These impacts were partially offset by R$ 449 million growth in operating expenses, highlighting the growth in expenses related to commercialization and distribution of products, and personnel expenses, which were also affected by the Liquigás consolidation.
Share in the fuel distribution market from January through September 2005 was 33.8%, including Liquigás, while in the same period of the previous year it was 34.1%.
The effects of consolidation of Liquigás as of August 2004 represent growth of R$ 406 million in gross income and growth of R$ 54 million in net income of the segment.
In relation to the previous quarter when net income reported by the Distribution business area was R$ 123 million, net income in 3Q-2005 was 67% higher, due to the R$ 80 million increase in gross income, mainly as a result of the 4.8% increase in volumes sold.
Share in the fuel market was 33.6% in 3Q-2005, including Liquigás, and 34.3% in 2Q-2005.
INTERNATIONAL – From January to September 2005, the International business area reported net income of R$ 520 million, 128% higher than net income of R$ 228 million reported in the same period of last year.
This increase in net income is mainly due to the following:
• Reduction of R$ 83 million in operating expenses, mainly exploration expenses, considering recognition in the previous year of the write-off of the acquisition bonus in block 34 in Angola and exploration expenses of block 31 in Ecuador;
• Decrease of R$ 141 million in financial expenses, due to the 22% appreciation of the real against the U.S. dollar, and the 2% depreciation of the peso against the U.S. dollar. Operating losses related to PEPSA derivatives reached R$ 439 million (R$ 472 million in 2004).
These items were partially offset by the R$ 33 million reduction in gross income due to the effect of the 22% appreciation of the real against the U.S. dollar in the exchange rate conversion of the financial statements, which exceeded the effect of the increase of international oil prices.
In 3Q-2005, the International business area reported net income of R$ 1 million, 99% lower than net income of R$ 168 million reported in the previous quarter
This reduction in net income was mainly due to the following:
PETROBRAS SYSTEM Operating Performance
13
• Increase of R$ 106 million in operating expenses, mainly due to the provision for losses in company investments in PEPSA, and by the loss from the write-off of the fiscal credit in Ecuador;
• Increase of R$ 102 million in financial expenses, mainly due to higher losses in derivative operations at PEPSA in the amount of R$ 33 million, and losses in financial operations in Venezuela in the amount of R$ 34 million.
CORPORATE – The units that comprise the Corporate segment of the PETROBRAS System generated a loss of R$ 5.044 million from January to September 2005, 113% higher than the loss reported from January to September 2004 (R$ 2.372 million), due to the following:
• Growth in corporate overhead due to higher expenses for personnel, publicity and institutional advertising, and because of the actuarial revision of the expenses provisioned for the health and pension plans of retirees and pensioners;
• Increase of R$ 1.211 million in net financial expenses, caused by losses in net financial assets exposed to exchange rate variation, following the appreciation of the real;
• Loss of R$ 793 million in the exchange rate conversion on company investments abroad from January to September 2005, due to the 16% appreciation of the final rate of the real against the dollar.
These factors were partially offset by the R$ 388 million decrease in tax expenses, due to the validity as of August 2, 2004, of Decree 5,164/04, that reduced to zero the contribution amounts for PIS/PASEP and COFINS incident on financial revenues.
In 3Q-2005, the loss reported by the Corporate area was R$ 2.014 million, 10% higher than the loss reported in the previous quarter (R$ 1.826 million). In particular, the R$ 834 million impact on the results of income tax and social contribution was due to the fiscal savings of R$ 746 million in 2Q-2005 following the provisioning of interest on own capital.
These items were partially offset by the positive R$ 356 million variation in the exchange rate conversion on Company investments made abroad in 3Q-2005, due to the lower appreciation of the real against the dollar.
PETROBRAS SYSTEM Operating Performance
14
Consolidated Debt
9/30/2005 6/30/2005 %
Short-Term Debt (1) 8.991 9.645 (7)
Long-Term Debt (1) 38.422 40.866 (6)
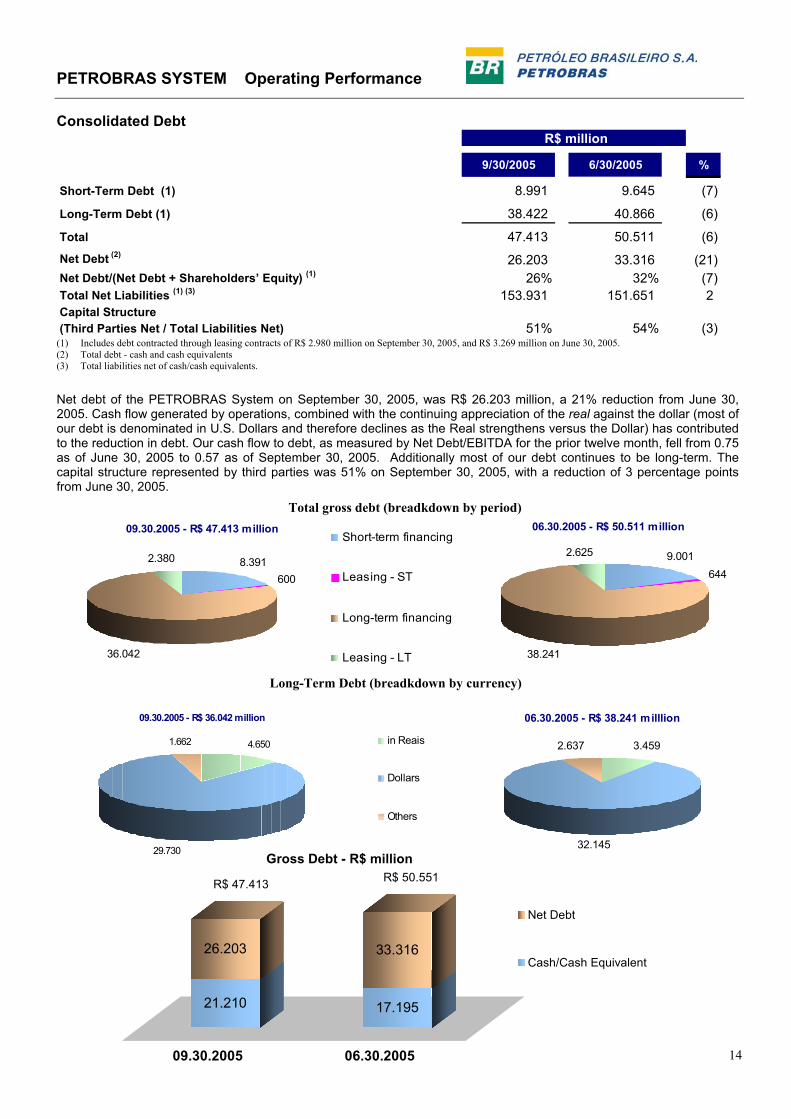
Total 47.413 50.511 (6) Net Debt (2) 26.203 33.316 (21) Net Debt/(Net Debt + Shareholders’ Equity) (1) 26% 32% (7) Total Net Liabilities (1) (3) 153.931 151.651 2 Capital Structure (Third Parties Net / Total Liabilities Net) 51% 54% (3)
R$ million
(1) Includes debt contracted through leasing contracts of R$ 2.980 million on September 30, 2005, and R$ 3.269 million on June 30, 2005. (2) Total debt - cash and cash equivalents (3) Total liabilities net of cash/cash equivalents.
Net debt of the PETROBRAS System on September 30, 2005, was R$ 26.203 million, a 21% reduction from June 30, 2005. Cash flow generated by operations, combined with the continuing appreciation of the real against the dollar (most of our debt is denominated in U.S. Dollars and therefore declines as the Real strengthens versus the Dollar) has contributed to the reduction in debt. Our cash flow to debt, as measured by Net Debt/EBITDA for the prior twelve month, fell from 0.75 as of June 30, 2005 to 0.57 as of September 30, 2005. Additionally most of our debt continues to be long-term. The capital structure represented by third parties was 51% on September 30, 2005, with a reduction of 3 percentage points from June 30, 2005.
21.210
26.203
17.195
33.316
09.30.2005 06.30.2005
Gross Debt - R$ million
Net Debt
Cash/Cash Equivalent
R$ 47.413 R$ 50.551
09.30.2005 - R$ 47.413 million
8.391600
36.042
2.380
Short-term financing
Leasing - ST
Long-term financing
Leasing - LT
06.30.2005 - R$ 50.511 million
9.001644
38.241
2.625
Long-Term Debt (breadkdown by currency)
06.30.2005 - R$ 38.241 milllion
3.459
32.145
2.637
Total gross debt (breadkdown by period)
09.30.2005 - R$ 36.042 million
4.650
29.730
1.662 in Reais
Dollars
Others

PETROBRAS SYSTEM Operating Performance
15
Consolidated Investments
2005 % 2004 % %• Own Investments 14.751 87 14.490 92 2 Exploration & Production 8.907 53 8.693 55 2 Supply 2.184 13 2.674 17 (18) Gas and Energy 1.098 6 235 2 367 International 1.871 11 1.429 9 31 Distribution 368 2 1.107 7 (67) Corporate 323 2 352 2 (8) • Special Purpose Companies (SPCs) 1.914 11 591 4 224 • Ventures under Negotiation 169 1 422 3 (60) • Project Finance 87 1 162 1 (46) Exploration & Production 87 1 162 1 (46) Espadarte/Marimbá/Voador 52 1 25 - 108 Cabiúnas - - 45 - - Marlim / NovaMarlim Petróleo - - 17 - - PCGC 35 - 75 1 (53)
Total Investments 16.921 100 15.665 100 8
2005 % 2004 % %InternationalExploration & Production 1.633 87 1.215 85 34 Supply 114 6 29 2 293 Gas and Energy 58 3 61 4 (5) Distribution 21 1 25 2 (16) Others 45 3 99 7 (55) Total Investments 1.871 100 1.429 100 31
2005 % 2004 % %Special Purpose Companies (SPCs)
Marlim Leste 514 27 - PDET Offshore 284 15 - - - Barracuda & Caratinga 267 14 566 96 (53) Malhas - Nordeste 373 19 - Malhas - Sudeste 324 17 - - - Cabiúnas 5 - 25 4 (80) Amazônia 147 8 - - - Total Investments 1.914 100 591 100 224
R$ millionJan-Sep
R$ million
R$ millionJan-Sep
Jan-Sep
**
In line with its strategic objectives, PETROBRAS acts in consortiums with other companies as a concessionaire of oil and natural gas exploration, development and production rights. The Company currently has partnerships in 101 blocks through 63 consortiums. Total investment of US$ 8,490 million is projected for these undertakings.
In fulfillment of the goals outlined in its strategic plan, PETROBRAS continues to prioritize investments in developing its oil and natural gas production capabilities through its own investments and the structuring of undertakings with partners. From January through September 2005, total investments were R$ 16.921 million, which is an 8% increase over the resources invested in the same period of 2004.
PETROBRAS SYSTEM Financial Statements
16
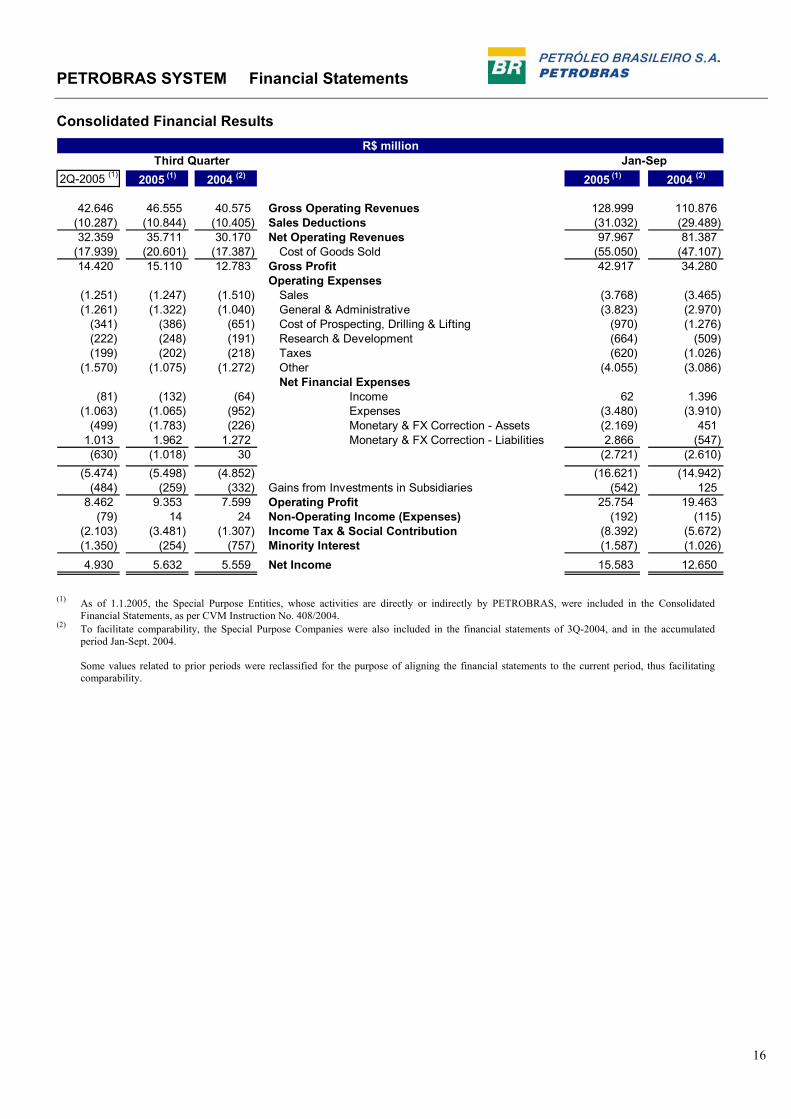
Consolidated Financial Results
2Q-2005 (1) 2005 (1) 2004 (2) 2005 (1) 2004 (2)
42.646 46.555 40.575 Gross Operating Revenues 128.999 110.876(10.287) (10.844) (10.405) Sales Deductions (31.032) (29.489)32.359 35.711 30.170 Net Operating Revenues 97.967 81.387
(17.939) (20.601) (17.387) Cost of Goods Sold (55.050) (47.107)14.420 15.110 12.783 Gross Profit 42.917 34.280
Operating Expenses(1.251) (1.247) (1.510) Sales (3.768) (3.465)(1.261) (1.322) (1.040) General & Administrative (3.823) (2.970)
(341) (386) (651) Cost of Prospecting, Drilling & Lifting (970) (1.276)(222) (248) (191) Research & Development (664) (509)(199) (202) (218) Taxes (620) (1.026)
(1.570) (1.075) (1.272) Other (4.055) (3.086)Net Financial Expenses
(81) (132) (64) Income 62 1.396(1.063) (1.065) (952) Expenses (3.480) (3.910)
(499) (1.783) (226) Monetary & FX Correction - Assets (2.169) 4511.013 1.962 1.272 Monetary & FX Correction - Liabilities 2.866 (547)(630) (1.018) 30 (2.721) (2.610)
(5.474) (5.498) (4.852) (16.621) (14.942)(484) (259) (332) Gains from Investments in Subsidiaries (542) 125
8.462 9.353 7.599 Operating Profit 25.754 19.463(79) 14 24 Non-Operating Income (Expenses) (192) (115)
(2.103) (3.481) (1.307) Income Tax & Social Contribution (8.392) (5.672)(1.350) (254) (757) Minority Interest (1.587) (1.026)4.930 5.632 5.559 Net Income 15.583 12.650
R$ millionThird Quarter Jan-Sep
(1) As of 1.1.2005, the Special Purpose Entities, whose activities are directly or indirectly by PETROBRAS, were included in the Consolidated
Financial Statements, as per CVM Instruction No. 408/2004. (2) To facilitate comparability, the Special Purpose Companies were also included in the financial statements of 3Q-2004, and in the accumulated
period Jan-Sept. 2004. Some values related to prior periods were reclassified for the purpose of aligning the financial statements to the current period, thus facilitating comparability.
PETROBRAS SYSTEM Financial Statements
17
Consolidated Balance Sheet
Assets
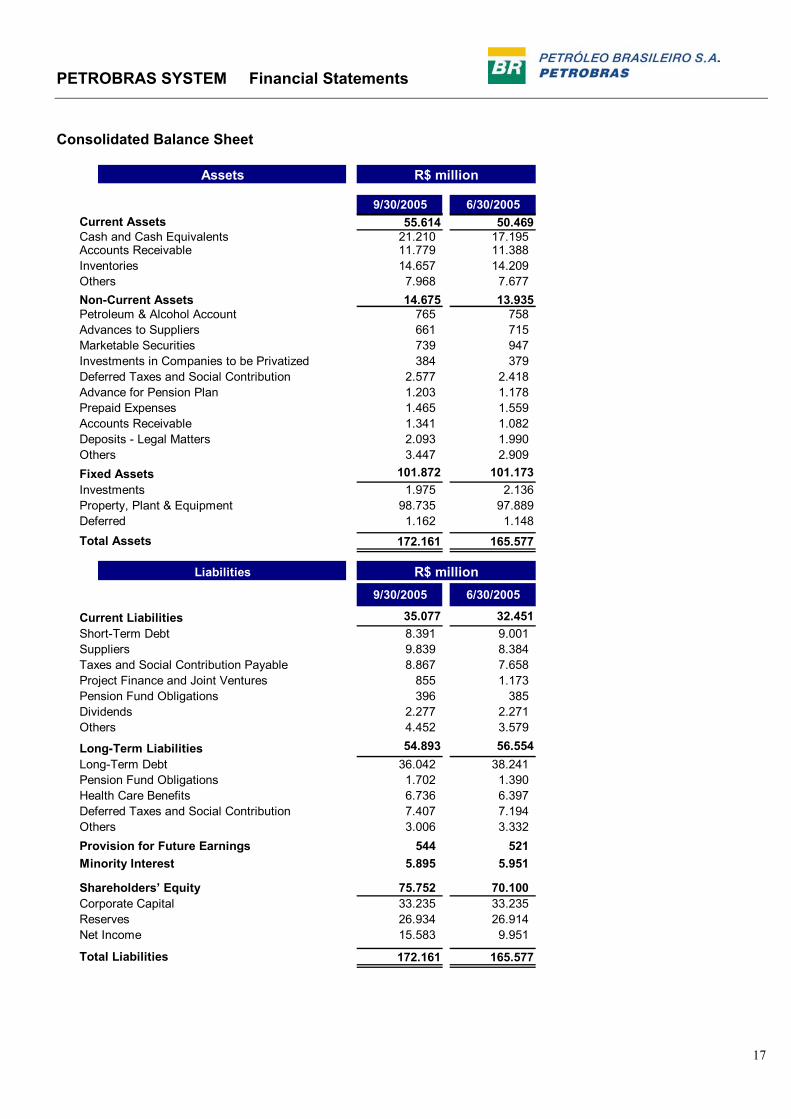
9/30/2005 6/30/2005Current Assets 55.614 50.469 Cash and Cash Equivalents 21.210 17.195 Accounts Receivable 11.779 11.388 Inventories 14.657 14.209 Others 7.968 7.677 Non-Current Assets 14.675 13.935 Petroleum & Alcohol Account 765 758 Advances to Suppliers 661 715 Marketable Securities 739 947 Investments in Companies to be Privatized 384 379 Deferred Taxes and Social Contribution 2.577 2.418 Advance for Pension Plan 1.203 1.178 Prepaid Expenses 1.465 1.559 Accounts Receivable 1.341 1.082 Deposits - Legal Matters 2.093 1.990 Others 3.447 2.909 Fixed Assets 101.872 101.173 Investments 1.975 2.136 Property, Plant & Equipment 98.735 97.889 Deferred 1.162 1.148 Total Assets 172.161 165.577
Liabilities
9/30/2005 6/30/2005
Current Liabilities 35.077 32.451 Short-Term Debt 8.391 9.001 Suppliers 9.839 8.384 Taxes and Social Contribution Payable 8.867 7.658 Project Finance and Joint Ventures 855 1.173 Pension Fund Obligations 396 385 Dividends 2.277 2.271 Others 4.452 3.579
Long-Term Liabilities 54.893 56.554 Long-Term Debt 36.042 38.241 Pension Fund Obligations 1.702 1.390 Health Care Benefits 6.736 6.397 Deferred Taxes and Social Contribution 7.407 7.194 Others 3.006 3.332 Provision for Future Earnings 544 521 Minority Interest 5.895 5.951
Shareholders’ Equity 75.752 70.100 Corporate Capital 33.235 33.235 Reserves 26.934 26.914 Net Income 15.583 9.951
Total Liabilities 172.161 165.577
R$ million
R$ million
PETROBRAS SYSTEM Financial Statements
18
As of 1.1.2005, the Special Purpose Entities, whose activities are directly or indirectly by PETROBRAS, were included in the Consolidated Financial Statements, as per CVM Instruction No. 408/2004.
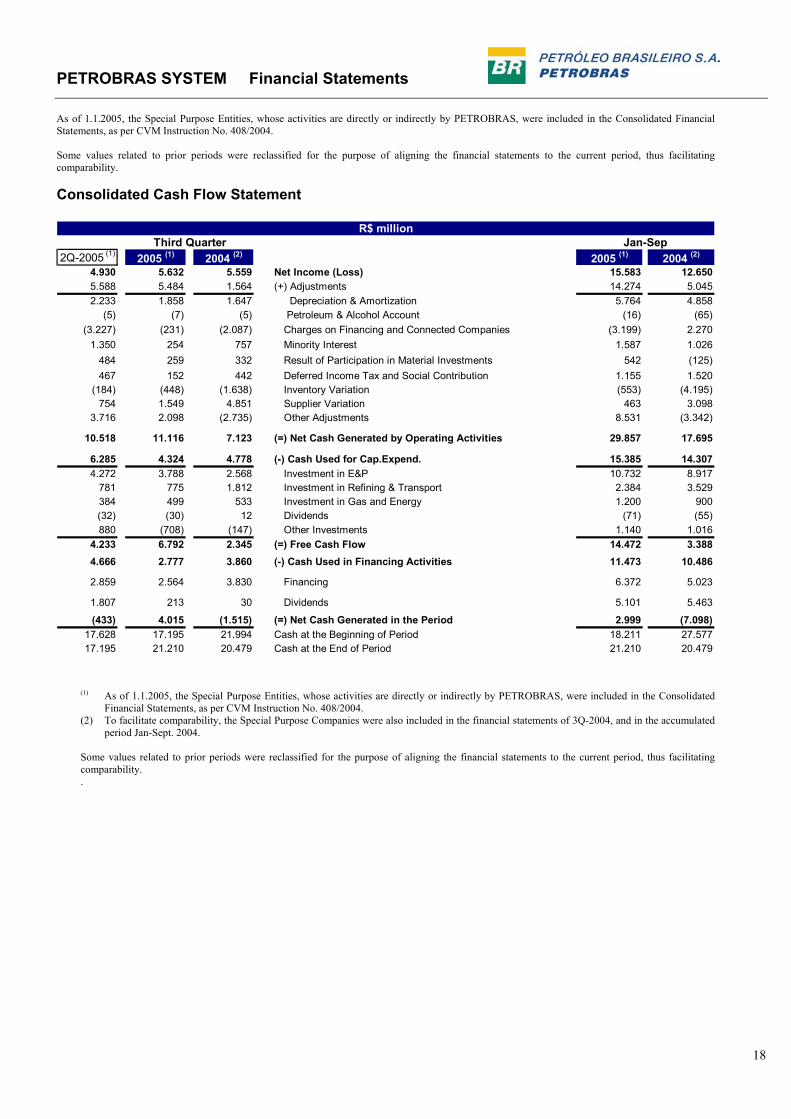
Some values related to prior periods were reclassified for the purpose of aligning the financial statements to the current period, thus facilitating comparability. Consolidated Cash Flow Statement
2Q-2005 (1) 2005 (1) 1 2004 (2) 2005 (1) 2004 (2)
4.930 5.632 5.559 Net Income (Loss) 15.583 12.650 5.588 5.484 1.564 (+) Adjustments 14.274 5.045 2.233 1.858 1.647 Depreciation & Amortization 5.764 4.858
(5) (7) (5) Petroleum & Alcohol Account (16) (65)(3.227) (231) (2.087) Charges on Financing and Connected Companies (3.199) 2.270
1.350 254 757 Minority Interest 1.587 1.026 484 259 332 Result of Participation in Material Investments 542 (125)467 152 442 Deferred Income Tax and Social Contribution 1.155 1.520
(184) (448) (1.638) Inventory Variation (553) (4.195)754 1.549 4.851 Supplier Variation 463 3.098
3.716 2.098 (2.735) Other Adjustments 8.531 (3.342)
10.518 11.116 7.123 (=) Net Cash Generated by Operating Activities 29.857 17.695
6.285 4.324 4.778 (-) Cash Used for Cap.Expend. 15.385 14.307 4.272 3.788 2.568 Investment in E&P 10.732 8.917
781 775 1.812 Investment in Refining & Transport 2.384 3.529 384 499 533 Investment in Gas and Energy 1.200 900 (32) (30) 12 Dividends (71) (55)880 (708) (147) Other Investments 1.140 1.016
4.233 6.792 2.345 (=) Free Cash Flow 14.472 3.388 4.666 2.777 3.860 (-) Cash Used in Financing Activities 11.473 10.486
2.859 2.564 3.830 Financing 6.372 5.023
1.807 213 30 Dividends 5.101 5.463
(433) 4.015 (1.515) (=) Net Cash Generated in the Period 2.999 (7.098) 17.628 17.195 21.994 Cash at the Beginning of Period 18.211 27.577
17.195 21.210 20.479 Cash at the End of Period 21.210 20.479
Jan-SepThird QuarterR$ million
(1) As of 1.1.2005, the Special Purpose Entities, whose activities are directly or indirectly by PETROBRAS, were included in the Consolidated Financial Statements, as per CVM Instruction No. 408/2004.
(2) To facilitate comparability, the Special Purpose Companies were also included in the financial statements of 3Q-2004, and in the accumulated period Jan-Sept. 2004.
Some values related to prior periods were reclassified for the purpose of aligning the financial statements to the current period, thus facilitating comparability. .

PETROBRAS SYSTEM Financial Statements
19
Consolidated Statement of Added Value
2005 (1) 2004 (2)
DescriptionSales of Products and Services and Non-Operating Revenues 129.262 110.389 Raw Materials Used (4.074) (4.981) Products for Resale (20.364) (23.130) Materials, Energy, Services & Others (15.782) (11.633) Added Value Generated 89.042 70.645
Depreciation & Amortization (5.764) (4.858) Participation in Related Companies, Goodwill & Negative Goodwill (542) 125 Financial Result (2.107) 1.848 Rent and Royalties 374 281 Total Distributable Added Value 81.003 68.041
Distribution of Added Value
Personnel
Salaries, Benefits and Charges 6.089 4.699 6.089 4.699
Government Entities
Taxes, Fees and Contributions 36.483 33.898 Government Take 10.463 7.991
46.946 41.889 Financial Institutions and Suppliers
Financial Expenses, Interest, Rent & Freight 10.798 7.777
Shareholders
Dividends / Interest on Own Capital 2.193 3.290 Retained Earnings 13.390 9.360
15.583 12.650 Minority Interest 1.587 1.026
17.170 13.676
R$ millionJan-Sep
1) As of 1.1.2005, the Special Purpose Entities, whose activities are directly or indirectly by PETROBRAS, were included in the Consolidated Financial Statements, as per CVM Instruction No. 408/2004.
2) To facilitate comparability, the Special Purpose Companies were also included in the financial statements the accumulated period Jan-
Sept. 2004. Some values related to prior periods were reclassified for the purpose of aligning the financial statements to the current period, thus facilitating comparability.
PETROBRAS SYSTEM Financial Statements
20
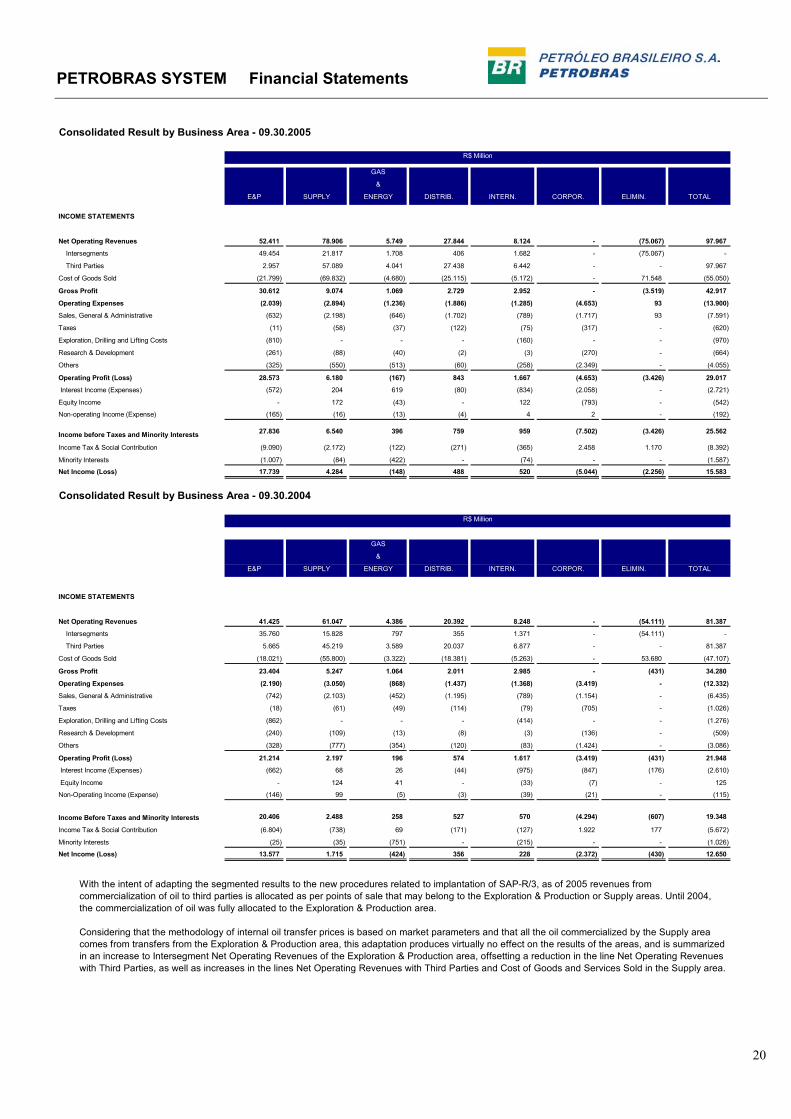
Consolidated Result by Business Area - 09.30.2005
GAS
&
E&P SUPPLY ENERGY DISTRIB. INTERN. CORPOR. ELIMIN. TOTAL
INCOME STATEMENTS
Net Operating Revenues 52.411 78.906 5.749 27.844 8.124 - (75.067) 97.967
Intersegments 49.454 21.817 1.708 406 1.682 - (75.067) -
Third Parties 2.957 57.089 4.041 27.438 6.442 - - 97.967
Cost of Goods Sold (21.799) (69.832) (4.680) (25.115) (5.172) - 71.548 (55.050)
Gross Profit 30.612 9.074 1.069 2.729 2.952 - (3.519) 42.917
Operating Expenses (2.039) (2.894) (1.236) (1.886) (1.285) (4.653) 93 (13.900)
Sales, General & Administrative (632) (2.198) (646) (1.702) (789) (1.717) 93 (7.591)
Taxes (11) (58) (37) (122) (75) (317) - (620)
Exploration, Drilling and Lifting Costs (810) - - - (160) - - (970)
Research & Development (261) (88) (40) (2) (3) (270) - (664)
Others (325) (550) (513) (60) (258) (2.349) - (4.055)
Operating Profit (Loss) 28.573 6.180 (167) 843 1.667 (4.653) (3.426) 29.017
Interest Income (Expenses) (572) 204 619 (80) (834) (2.058) - (2.721)
Equity Income - 172 (43) - 122 (793) - (542)
Non-operating Income (Expense) (165) (16) (13) (4) 4 2 - (192)
Income before Taxes and Minority Interests 27.836 6.540 396 759 959 (7.502) (3.426) 25.562
Income Tax & Social Contribution (9.090) (2.172) (122) (271) (365) 2.458 1.170 (8.392)
Minority Interests (1.007) (84) (422) - (74) - - (1.587)
Net Income (Loss) 17.739 4.284 (148) 488 520 (5.044) (2.256) 15.583
Consolidated Result by Business Area - 09.30.2004
GAS
&
E&P SUPPLY ENERGY DISTRIB. INTERN. CORPOR. ELIMIN. TOTAL
INCOME STATEMENTS
Net Operating Revenues 41.425 61.047 4.386 20.392 8.248 - (54.111) 81.387
Intersegments 35.760 15.828 797 355 1.371 - (54.111) -
Third Parties 5.665 45.219 3.589 20.037 6.877 - - 81.387
Cost of Goods Sold (18.021) (55.800) (3.322) (18.381) (5.263) - 53.680 (47.107)
Gross Profit 23.404 5.247 1.064 2.011 2.985 - (431) 34.280
Operating Expenses (2.190) (3.050) (868) (1.437) (1.368) (3.419) - (12.332)
Sales, General & Administrative (742) (2.103) (452) (1.195) (789) (1.154) - (6.435)
Taxes (18) (61) (49) (114) (79) (705) - (1.026)
Exploration, Drilling and Lifting Costs (862) - - - (414) - - (1.276)
Research & Development (240) (109) (13) (8) (3) (136) - (509)
Others (328) (777) (354) (120) (83) (1.424) - (3.086)
Operating Profit (Loss) 21.214 2.197 196 574 1.617 (3.419) (431) 21.948
Interest Income (Expenses) (662) 68 26 (44) (975) (847) (176) (2.610)
Equity Income - 124 41 - (33) (7) - 125
Non-Operating Income (Expense) (146) 99 (5) (3) (39) (21) - (115)
Income Before Taxes and Minority Interests
Income Tax & Social Contribution (6.804) (738) 69 (171) (127) 1.922 177 (5.672)
Minority Interests (25) (35) (751) - (215) - - (1.026)
Net Income (Loss) 13.577 1.715 (424) 356 228 (2.372) (430) 12.650
R$ Million
2.488 258 527 570 (4.294) (607) 19.348
R$ Million
20.406
With the intent of adapting the segmented results to the new procedures related to implantation of SAP-R/3, as of 2005 revenues from commercialization of oil to third parties is allocated as per points of sale that may belong to the Exploration & Production or Supply areas. Until 2004, the commercialization of oil was fully allocated to the Exploration & Production area.
Considering that the methodology of internal oil transfer prices is based on market parameters and that all the oil commercialized by the Supply area comes from transfers from the Exploration & Production area, this adaptation produces virtually no effect on the results of the areas, and is summarized in an increase to Intersegment Net Operating Revenues of the Exploration & Production area, offsetting a reduction in the line Net Operating Revenues with Third Parties, as well as increases in the lines Net Operating Revenues with Third Parties and Cost of Goods and Services Sold in the Supply area.
PETROBRAS SYSTEM Financial Statements
21
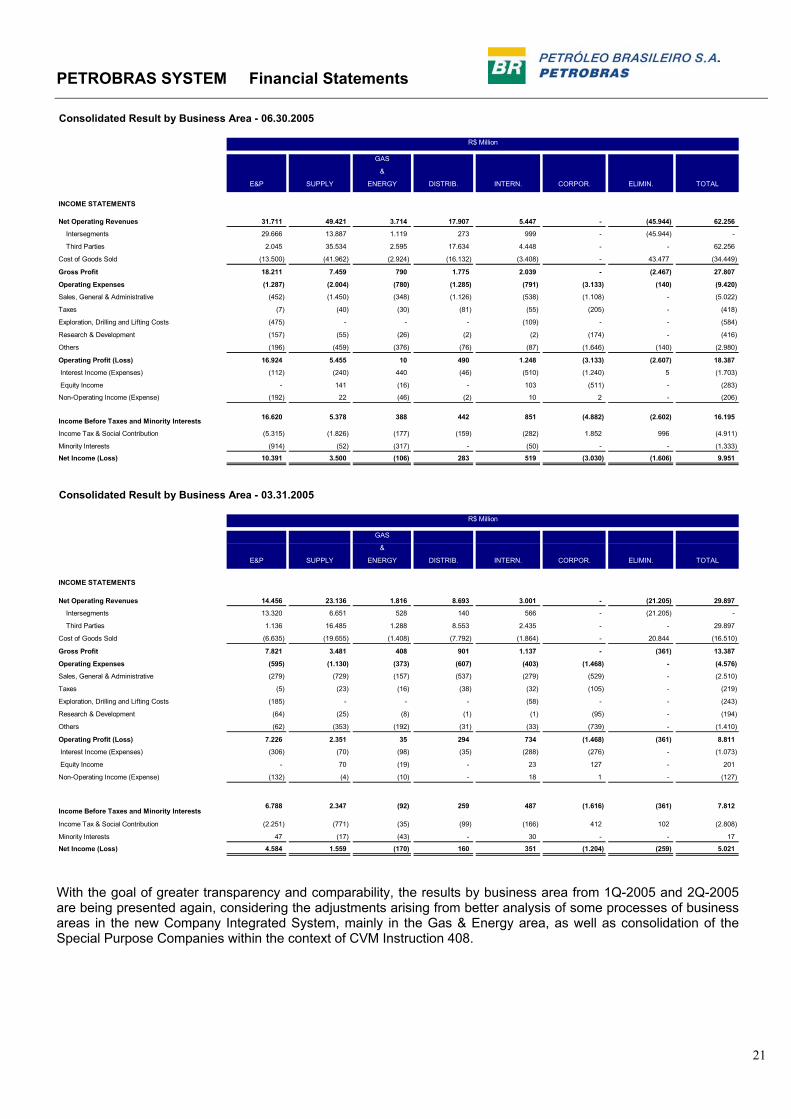
Consolidated Result by Business Area - 06.30.2005
GAS
&
E&P SUPPLY ENERGY DISTRIB. INTERN. CORPOR. ELIMIN. TOTAL
INCOME STATEMENTS
Net Operating Revenues 31.711 49.421 3.714 17.907 5.447 - (45.944) 62.256
Intersegments 29.666 13.887 1.119 273 999 - (45.944) -
Third Parties 2.045 35.534 2.595 17.634 4.448 - - 62.256
Cost of Goods Sold (13.500) (41.962) (2.924) (16.132) (3.408) - 43.477 (34.449)
Gross Profit 18.211 7.459 790 1.775 2.039 - (2.467) 27.807
Operating Expenses (1.287) (2.004) (780) (1.285) (791) (3.133) (140) (9.420)
Sales, General & Administrative (452) (1.450) (348) (1.126) (538) (1.108) - (5.022)
Taxes (7) (40) (30) (81) (55) (205) - (418)
Exploration, Drilling and Lifting Costs (475) - - - (109) - - (584)
Research & Development (157) (55) (26) (2) (2) (174) - (416)
Others (196) (459) (376) (76) (87) (1.646) (140) (2.980)
Operating Profit (Loss) 16.924 5.455 10 490 1.248 (3.133) (2.607) 18.387
Interest Income (Expenses) (112) (240) 440 (46) (510) (1.240) 5 (1.703)
Equity Income - 141 (16) - 103 (511) - (283)
Non-Operating Income (Expense) (192) 22 (46) (2) 10 2 - (206)
Income Before Taxes and Minority Interests 16.620 5.378 388 442 851 (4.882) (2.602) 16.195
Income Tax & Social Contribution (5.315) (1.826) (177) (159) (282) 1.852 996 (4.911)
Minority Interests (914) (52) (317) - (50) - - (1.333)
Net Income (Loss) 10.391 3.500 (106) 283 519 (3.030) (1.606) 9.951
Consolidated Result by Business Area - 03.31.2005
GAS
&
E&P SUPPLY ENERGY DISTRIB. INTERN. CORPOR. ELIMIN. TOTAL
INCOME STATEMENTS
Net Operating Revenues 14.456 23.136 1.816 8.693 3.001 - (21.205) 29.897
Intersegments 13.320 6.651 528 140 566 - (21.205) -
Third Parties 1.136 16.485 1.288 8.553 2.435 - - 29.897
Cost of Goods Sold (6.635) (19.655) (1.408) (7.792) (1.864) - 20.844 (16.510)
Gross Profit 7.821 3.481 408 901 1.137 - (361) 13.387
Operating Expenses (595) (1.130) (373) (607) (403) (1.468) - (4.576)
Sales, General & Administrative (279) (729) (157) (537) (279) (529) - (2.510)
Taxes (5) (23) (16) (38) (32) (105) - (219)
Exploration, Drilling and Lifting Costs (185) - - - (58) - - (243)
Research & Development (64) (25) (8) (1) (1) (95) - (194)
Others (62) (353) (192) (31) (33) (739) - (1.410)
Operating Profit (Loss) 7.226 2.351 35 294 734 (1.468) (361) 8.811
Interest Income (Expenses) (306) (70) (98) (35) (288) (276) - (1.073)
Equity Income - 70 (19) - 23 127 - 201
Non-Operating Income (Expense) (132) (4) (10) - 18 1 - (127)
Income Before Taxes and Minority Interests6.788 2.347 (92) 259 487 (1.616) (361) 7.812
Income Tax & Social Contribution (2.251) (771) (35) (99) (166) 412 102 (2.808)
Minority Interests 47 (17) (43) - 30 - - 17
Net Income (Loss) 4.584 1.559 (170) 160 351 (1.204) (259) 5.021
R$ Million
R$ Million
With the goal of greater transparency and comparability, the results by business area from 1Q-2005 and 2Q-2005 are being presented again, considering the adjustments arising from better analysis of some processes of business areas in the new Company Integrated System, mainly in the Gas & Energy area, as well as consolidation of the Special Purpose Companies within the context of CVM Instruction 408.
PETROBRAS SYSTEM Financial Statements
22
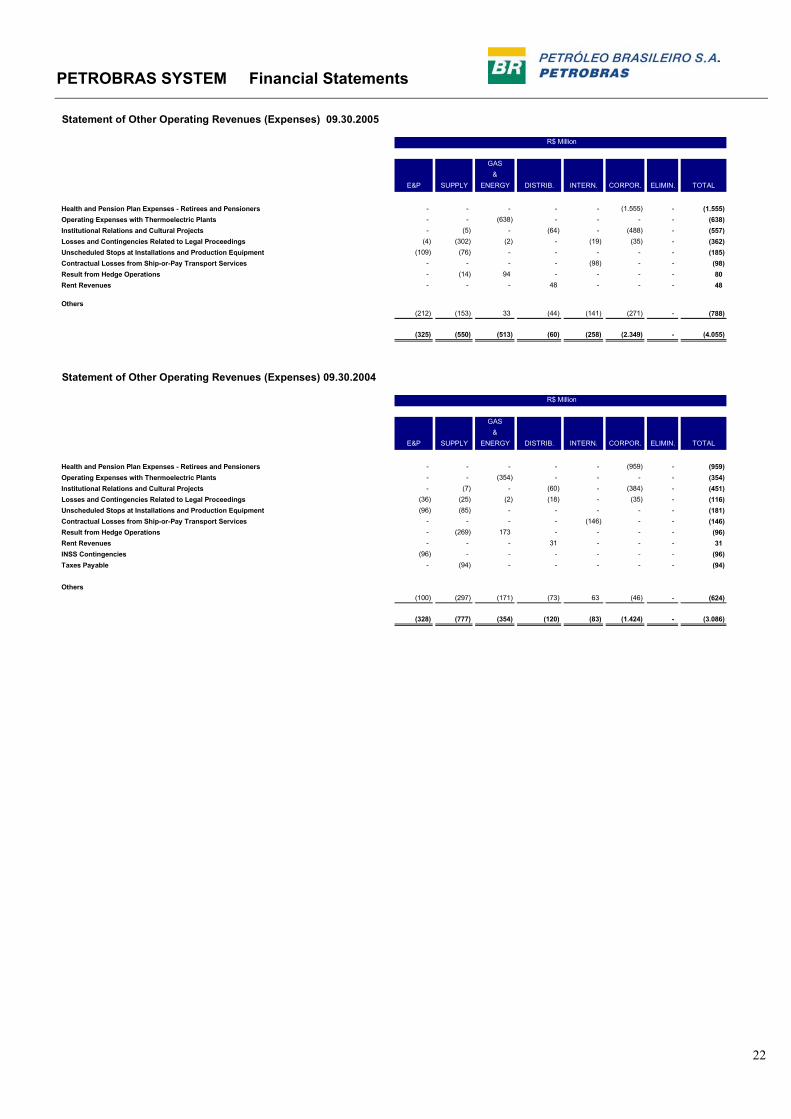
Statement of Other Operating Revenues (Expenses) 09.30.2005
GAS&
E&P SUPPLY ENERGY DISTRIB. INTERN. CORPOR. ELIMIN. TOTAL
Health and Pension Plan Expenses - Retirees and Pensioners - - - - - (1.555) - (1.555)Operating Expenses with Thermoelectric Plants - - (638) - - - - (638)Institutional Relations and Cultural Projects - (5) - (64) - (488) - (557)Losses and Contingencies Related to Legal Proceedings (4) (302) (2) - (19) (35) - (362)Unscheduled Stops at Installations and Production Equipment (109) (76) - - - - - (185)Contractual Losses from Ship-or-Pay Transport Services - - - - (98) - - (98)Result from Hedge Operations - (14) 94 - - - - 80Rent Revenues - - - 48 - - - 48
Others(212) (153) 33 (44) (141) (271) - (788)
(325) (550) (513) (60) (258) (2.349) - (4.055)
Statement of Other Operating Revenues (Expenses) 09.30.2004
GAS&
E&P SUPPLY ENERGY DISTRIB. INTERN. CORPOR. ELIMIN. TOTAL
Health and Pension Plan Expenses - Retirees and Pensioners - - - - - (959) - (959)Operating Expenses with Thermoelectric Plants - - (354) - - - - (354)Institutional Relations and Cultural Projects - (7) - (60) - (384) - (451)Losses and Contingencies Related to Legal Proceedings (36) (25) (2) (18) - (35) - (116)Unscheduled Stops at Installations and Production Equipment (96) (85) - - - - - (181)Contractual Losses from Ship-or-Pay Transport Services - - - - (146) - - (146)Result from Hedge Operations - (269) 173 - - - - (96)Rent Revenues - - - 31 - - - 31INSS Contingencies (96) - - - - - - (96)Taxes Payable - (94) - - - - - (94) Others
(100) (297) (171) (73) 63 (46) - (624)
(328) (777) (354) (120) (83) (1.424) - (3.086)
R$ Million
R$ Million
PETROBRAS SYSTEM Financial Statements
23
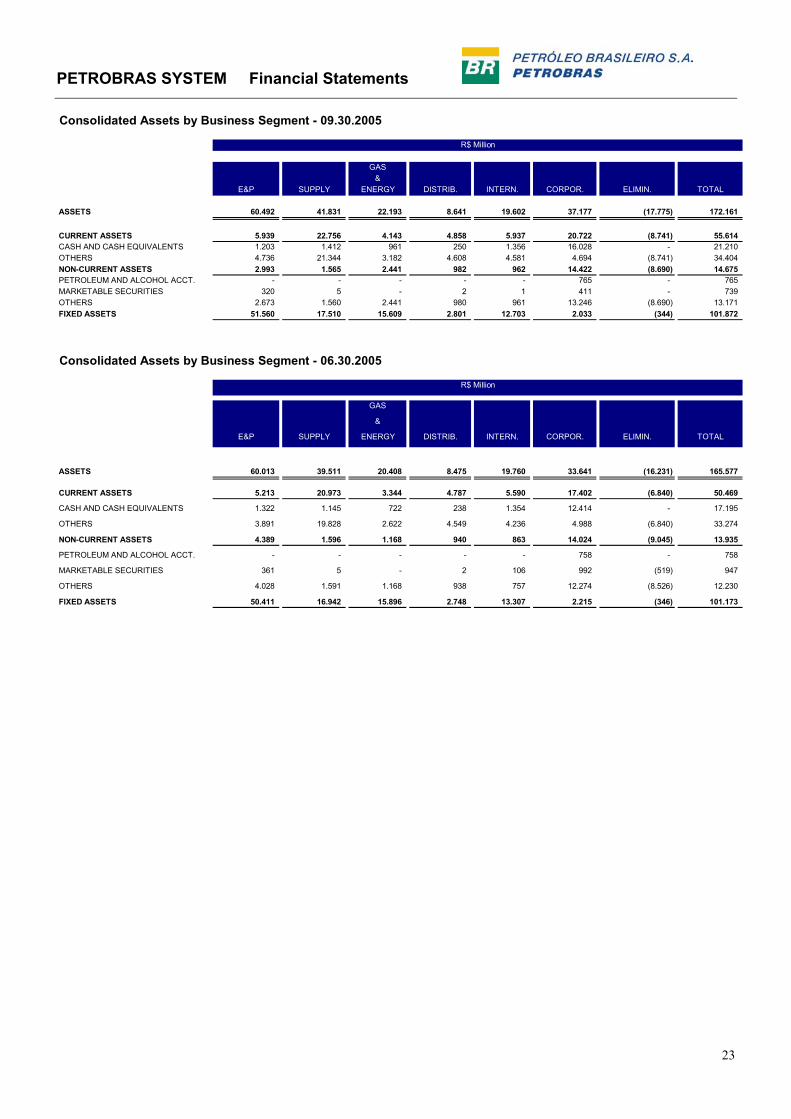
Consolidated Assets by Business Segment - 09.30.2005
GAS&
E&P SUPPLY ENERGY DISTRIB. INTERN. CORPOR. ELIMIN. TOTAL
ASSETS 60.492 41.831 22.193 8.641 19.602 37.177 (17.775) 172.161
CURRENT ASSETS 5.939 22.756 4.143 4.858 5.937 20.722 (8.741) 55.614 CASH AND CASH EQUIVALENTS 1.203 1.412 961 250 1.356 16.028 - 21.210 OTHERS 4.736 21.344 3.182 4.608 4.581 4.694 (8.741) 34.404 NON-CURRENT ASSETS 2.993 1.565 2.441 982 962 14.422 (8.690) 14.675 PETROLEUM AND ALCOHOL ACCT. - - - - - 765 - 765 MARKETABLE SECURITIES 320 5 - 2 1 411 - 739 OTHERS 2.673 1.560 2.441 980 961 13.246 (8.690) 13.171 FIXED ASSETS 51.560 17.510 15.609 2.801 12.703 2.033 (344) 101.872
Consolidated Assets by Business Segment - 06.30.2005
GAS
&
E&P SUPPLY ENERGY DISTRIB. INTERN. CORPOR. ELIMIN. TOTAL
ASSETS 60.013 39.511 20.408 8.475 19.760 33.641 (16.231) 165.577
CURRENT ASSETS 5.213 20.973 3.344 4.787 5.590 17.402 (6.840) 50.469
CASH AND CASH EQUIVALENTS 1.322 1.145 722 238 1.354 12.414 - 17.195
OTHERS 3.891 19.828 2.622 4.549 4.236 4.988 (6.840) 33.274
NON-CURRENT ASSETS 4.389 1.596 1.168 940 863 14.024 (9.045) 13.935
PETROLEUM AND ALCOHOL ACCT. - - - - - 758 - 758
MARKETABLE SECURITIES 361 5 - 2 106 992 (519) 947
OTHERS 4.028 1.591 1.168 938 757 12.274 (8.526) 12.230
FIXED ASSETS 50.411 16.942 15.896 2.748 13.307 2.215 (346) 101.173
R$ Million
R$ Million
PETROBRAS SYSTEM Financial Statements
24
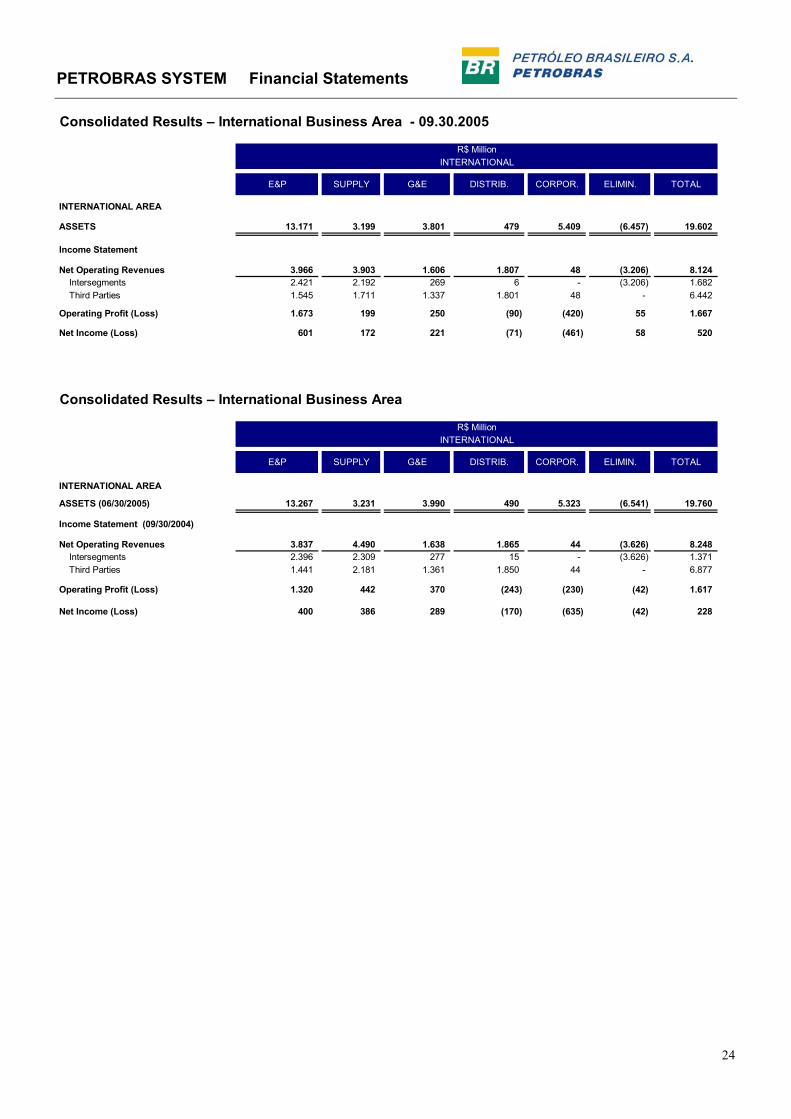
Consolidated Results – International Business Area - 09.30.2005
E&P SUPPLY G&E DISTRIB. CORPOR. ELIMIN. TOTAL
INTERNATIONAL AREA
ASSETS 13.171 3.199 3.801 479 5.409 (6.457) 19.602
Income Statement
Net Operating Revenues 3.966 3.903 1.606 1.807 48 (3.206) 8.124 Intersegments 2.421 2.192 269 6 - (3.206) 1.682 Third Parties 1.545 1.711 1.337 1.801 48 - 6.442
Operating Profit (Loss) 1.673 199 250 (90) (420) 55 1.667
Net Income (Loss) 601 172 221 (71) (461) 58 520
Consolidated Results – International Business Area
E&P SUPPLY G&E DISTRIB. CORPOR. ELIMIN. TOTAL
INTERNATIONAL AREA
ASSETS (06/30/2005) 13.267 3.231 3.990 490 5.323 (6.541) 19.760
Income Statement (09/30/2004)
Net Operating Revenues 3.837 4.490 1.638 1.865 44 (3.626) 8.248 Intersegments 2.396 2.309 277 15 - (3.626) 1.371 Third Parties 1.441 2.181 1.361 1.850 44 - 6.877
Operating Profit (Loss) 1.320 442 370 (243) (230) (42) 1.617
Net Income (Loss) 400 386 289 (170) (635) (42) 228
R$ MillionINTERNATIONAL
R$ MillionINTERNATIONAL

PETROBRAS Financial Statements
25
1. Changes in the Oil and Alcohol Accounts
2Q-2005 2005 2004 2005 2004752 758 750 Initial Balance 749 689
- - - Reimbursement to Petrobras - 4 6 7 4 Intercompany Lending Charges 16 11 - - - Regularization - GTI* - 50
758 765 754 Final Balance 765 754
Jan - SepR$ Million
Third Quarter
OFFSET OF ACCOUNTS WITH THE GOVERNMENT
By means of Official Document Number 11/2004 of June 23, 2004, the Integrated Audit Commission ANP/STN presented the final audit report certifying and homologating the amount in the petroleum and alcohol account and enabling the offset of accounts between PETROBRAS and the government. This is now underway.
As per Law Number 10,742 of October 6, 2003, account rectification with the government should have occurred by June 30, 2004. PETROBRAS, after having furnished all the information required by the National Treasury Secretary – STN, is in discussion with the Ministry of Mines and Energy – MME, seeking to equalize the disparities that still exist between the parties in an effort to conclude the offset of accounts with the government, as per Provisionary Measure Number 2,181-45, dated August 24, 2001.
On July 2, 2004, the government made a deposit in the amount of R$ 172 million, equivalent to National Treasury Notes – H Series (NTNs-H) that were issued in favor of PETROBRAS to guarantee payment of the amount due in relation to the petroleum and alcohol account, as they matured on June 30, 2004. Of this amount, R$ 8 million were available to PETROBRAS, and the remaining amount of R$ 164 million was placed in an open account in favor of the Company as a blocked deposit linked to the STN order. The amount of the account may be paid through the issue of National Treasury bonds in a value equal to the final amount of the account rectification or with other amounts that PETROBRAS may owe to the federal government, including tax amounts or a combination of the foregoing options.
PETROBRAS Financial Statements
26
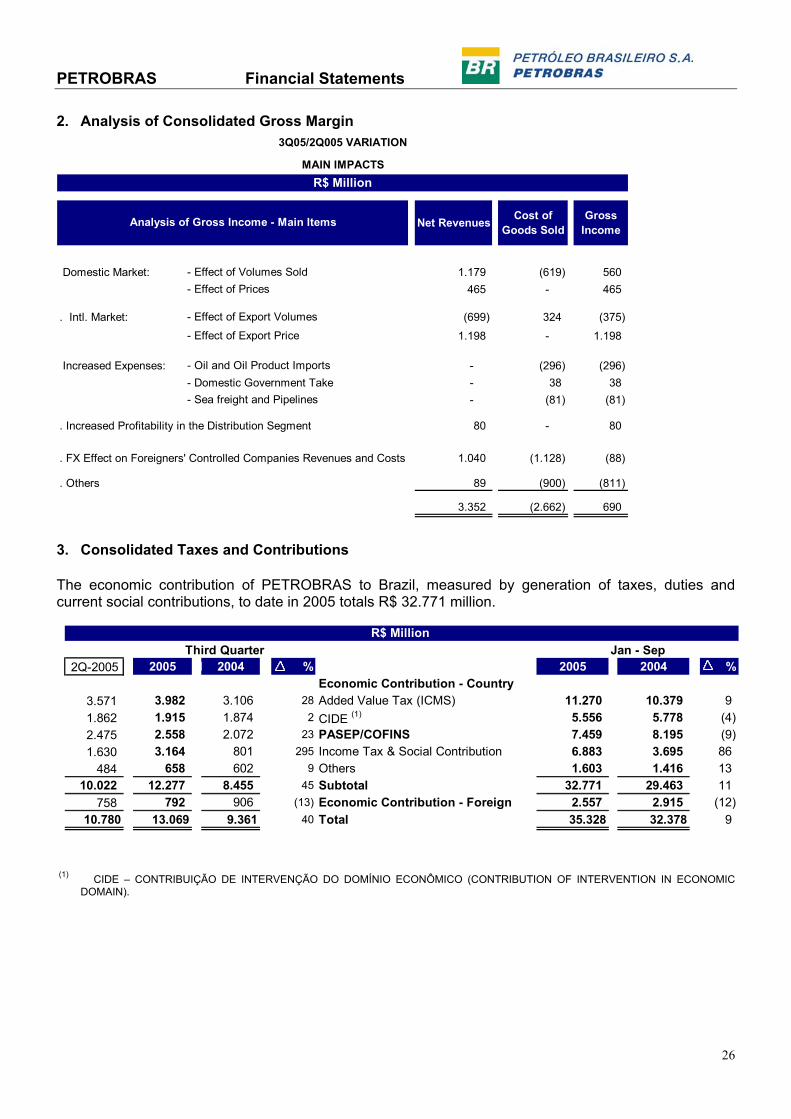
2. Analysis of Consolidated Gross Margin
Net Revenues Cost of Goods Sold
Gross Income
Domestic Market: - Effect of Volumes Sold 1.179 (619) 560 - Effect of Prices 465 - 465
. Intl. Market: - Effect of Export Volumes (699) 324 (375) - Effect of Export Price 1.198 - 1.198
Increased Expenses: - Oil and Oil Product Imports - (296) (296) - Domestic Government Take - 38 38 - Sea freight and Pipelines - (81) (81)
. Increased Profitability in the Distribution Segment 80 - 80
1.040 (1.128) (88)
. Others 89 (900) (811)
3.352 (2.662) 690
3Q05/2Q005 VARIATION
MAIN IMPACTS
. FX Effect on Foreigners' Controlled Companies Revenues and Costs
Analysis of Gross Income - Main Items
R$ Million
3. Consolidated Taxes and Contributions The economic contribution of PETROBRAS to Brazil, measured by generation of taxes, duties and current social contributions, to date in 2005 totals R$ 32.771 million.
2Q-2005 2005 1 2004 % 2005 2004 %Economic Contribution - Country
3.571 3.982 3.106 28 Added Value Tax (ICMS) 11.270 10.379 9 1.862 1.915 1.874 2 CIDE (1) 5.556 5.778 (4) 2.475 2.558 2.072 23 PASEP/COFINS 7.459 8.195 (9) 1.630 3.164 801 295 Income Tax & Social Contribution 6.883 3.695 86
484 658 602 9 Others 1.603 1.416 13 10.022 12.277 8.455 45 Subtotal 32.771 29.463 11
758 792 906 (13) Economic Contribution - Foreign 2.557 2.915 (12) 10.780 13.069 9.361 40 Total 35.328 32.378 9
R$ Million Third Quarter Jan - Sep
(1) CIDE – CONTRIBUIÇÃO DE INTERVENÇÃO DO DOMÍNIO ECONÔMICO (CONTRIBUTION OF INTERVENTION IN ECONOMIC
DOMAIN).

PETROBRAS Financial Statements
27
4. Government Take
2Q - 2005 2005 2004 % 2005 2004 %Country
1.580 1.769 1.355 31 Royalties 4.654 3.585 30 1.658 2.035 1.529 33 Special Participation 5.287 3.941 34 15 18 24 (25) Surface Rental Fees 52 67 (22) 3.253 3.822 2.908 31 Subtotal 9.993 7.593 32 134 188 112 68 Foreign 470 398 18 3.387 4.010 3.020 33 Total 10.463 7.991 31
R$ Million Third Quarter Jan - Sep
The government take in the country increased 31% in 3Q-2005 over the same period of 2004, reflecting the 45% increase in the reference price for domestic oil, which reached the average price of US$ 46.98 (US$ 32.30 in 2004). 5. Reconciliation of Shareholders’ Equity and Consolidated Net Income
Shareholders' Equity Result
. According to Petrobras Information as of September 30, 2005 77.556 15.485
. Profit from Sales of Products in Affiliated Company Inventories (567) (567)
. Reversal of Profits on Inventory in Previous Years - 384
. Capitalized Interest (389) 48
. Absorption of Negative Shareholders' Equity in Affiliated Companies (*) (139) 433
. Other Eliminations (709) (200)
. According to Consolidated Information as of September 30, 2005 75.752 15.583
R$ Million
* As per CVM Instruction Number 247/96, the losses that are considered to be of a non-permanent type (temporary) on investments evaluated by the equity in results of non-consolidated companies method, whose invested company does not show signs of paralysis or need for financial help from the investor company, should be limited to the value of the controlling company’s investment. Therefore, the losses occasioned by unfunded liabilities (negative net shareholder’s equity) of controlled companies did not affect the results and the net shareholder’s equity of Petrobras in 3Q-2005, generating a conciliatory item between the Financial Statements of Petrobras and the Consolidated Financial Statements.

PETROBRAS Financial Statements
28
6. PETROBRAS Stock Split The General Extraordinary Assembly that met on July 22, 2005, deliberated and approved a stock split representing company capital of 300%, resulting in the free distribution of 3 (three) new same-type shares for each 1 (one) share, based on shareholder position on August 31, 2005. Thus, company capital in the amount of R$ 32.896 million, as of September 1, 2005, will be divided into 4,386 million shares without nominal value, of which 2,537 million are ordinary shares and 1,849 million are preferred shares, and the relationship between the American Depositary Receipts (ADRs) and the shares corresponding to each type, will be altered from the current “one share per one ADR” to “four shares per one ADR.” 7. Activity of PETROBRAS Shares and ADRs
2Q-2005 2005 2004 2005 20043,23% 32,71% 21,00% Petrobras ON 51,15% 23,30%4,03% 32,87% 21,37% Petrobras PN 46,77% 22,83%
17,99% 37,14% 25,58% ADR- Level III - ON 79,71% 20,55%19,68% 38,47% 26,67% ADR- Level III - PN 76,06% 19,73%-5,86% 26,08% 9,91% IBOVESPA 20,57% 4,54%-2,18% 2,86% -3,40% DOW JONES -1,99% -3,57%2,89% 4,61% -7,37% NASDAQ -1,09% -5,32%
Nominal ValuationThird Quarter Jan - Sep
The book value of a PETROBRAS share on September 30, 2005, was R$ 17, 68.

PETROBRAS Financial Statements
29
8. Exchange Rate Exposure Exchange rate exposure of the PETROBRAS System is measured as per the following table:
09.30.2005 06.30.2005
Current Assets 18.374 18.780 Cash and Cash Equivalents 7.172 6.626 Other Current Assets 11.202 12.154
Non-Current Assets 4.440 3.221
Fixed Assets 30.072 28.556 Investiments 184 193 Property, Plant & Equipment 29.375 27.794 Others 513 569
Total Assets 52.886 50.557
09.30.2005 06.30.2005
Current Liabilities 16.459 16.061 Short-Term Debt 8.178 7.656 Suppliers 5.793 5.277 Other Current Liabilities 2.488 3.128
Long-Term Liabilities 34.164 35.637 Long-Term Debt 32.630 34.104 Other Long-Term Liabilities 1.534 1.533
Total Liabilities 50.623 51.698
Net Assets (Liabilities) in Real 2.263 (1.141)
9.572 4.465
651 678
11.184 2.646
5.033 1.126
Fx rate (*) 2,2222 2,3504
R$ Million
R$ Million
Assets
Liabilities
(-) FINAME Loans - in dollar indexed reias
Net Assets in Reais
(+) Investment Funds - Exchange
Net Assets in Dollar
(1) Considers the conversion of the value in reais by the dollar sell rate on the closing date of the period

PETROBRAS Financial Statements
30
Holding Company – Statement of Results
2Q-2005 2005 2004 2005 200435.426 37.871 33.332 Gross Operating Revenues 104.652 87.800(9.321) (9.779) (9.452) Sales Deductions (27.889) (25.115)26.105 28.092 23.880 Net Operating Revenues 76.763 62.685
(14.531) (15.030) (13.911) Cost of Goods Sold (41.613) (35.146)11.574 13.062 9.969 Gross Profit 35.150 27.539
Operating Expenses(1.702) (2.117) (1.605) Sales, General & Administrative (5.445) (3.942)
(291) (334) (373) Cost of Prospecting, Drilling & Lifting (810) (862)(222) (247) (187) Research & Development (662) (501)(102) (114) (117) Taxes (323) (707)
(1.620) (859) (1.528) Others (3.981) (3.636)Net Financial Expense
107 272 192 Income 904 1.730(587) (555) (576) Expense (1.721) (1.635)
(4.776) (1.750) (2.367) Monetary & Foreign Exchange Correction - Assets (6.308) 283.854 1.349 2.861 Monetary & Foreign Exchange Correction - Liabilities 4.867 (38)
(1.402) (684) 110 (2.258) 8587 86 182 Equity Income / Negative Goodwill Amortization 1.089 1.329
6.322 8.793 6.451 Operating Profit 22.760 19.305(64) 1 (67) Non-Operating Income (Expense) (215) (197)
(1.559) (3.115) (1.097) Income Tax & Social Contribution (7.060) (5.392)4.699 5.679 5.287 Net Income (Loss) 15.485 13.716
Third Quarter Jan - SepR$ Million
Some values related to prior periods were reclassified for the purpose of aligning the financial statements to the current period, thus facilitating comparability.

PETROBRAS S.A Financial Statements
31
Holding Company – Balance Sheet
Liabilities09.30.2005 06.30.2005
Current Liabilities 44.603 42.365
Short-Term Debt 1.154 1.249 Suppliers 26.722 25.524 Taxes & Social Contribution Payable 7.429 6.187 Dividends / Interest on Own Capital 2.193 2.193 Project Finance and Joint Ventures 3.917 4.777 Pension Fund Obligations 362 354 Others 2.826 2.081
Long-Term Liabilities 24.867 25.001
Long-Term Debt 6.948 7.659 Subsidiaries & Controlled Companies 1.968 2.145 Pension Fund Obligations 1.561 1.266 Health Care Benefits 6.208 5.891 Deferred Taxes & Social Contribution 6.094 5.839 Others 2.088 2.201
Shareholders’ Equity 77.556 71.877 Corporate Capital 33.235 33.235 Reserves 28.836 28.836 Net Income 15.485 9.806
Total Liabilities 147.026 139.243
R$ Million
PETROBRAS S.A Financial Statements
32
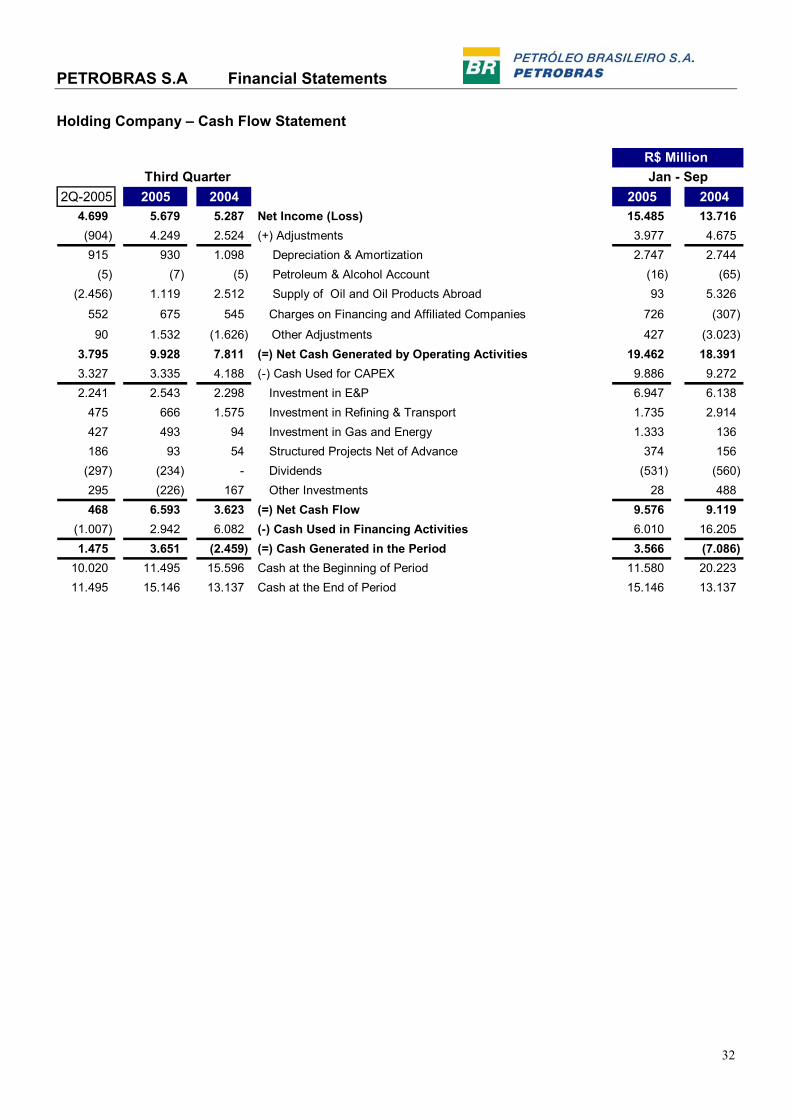
Holding Company – Cash Flow Statement
2Q-2005 2005 2004 2005 20044.699 5.679 5.287 Net Income (Loss) 15.485 13.716(904) 4.249 2.524 (+) Adjustments 3.977 4.675915 930 1.098 Depreciation & Amortization 2.747 2.744
(5) (7) (5) Petroleum & Alcohol Account (16) (65)(2.456) 1.119 2.512 Supply of Oil and Oil Products Abroad 93 5.326
552 675 545 Charges on Financing and Affiliated Companies 726 (307)
90 1.532 (1.626) Other Adjustments 427 (3.023)3.795 9.928 7.811 (=) Net Cash Generated by Operating Activities 19.462 18.3913.327 3.335 4.188 (-) Cash Used for CAPEX 9.886 9.2722.241 2.543 2.298 Investment in E&P 6.947 6.138
475 666 1.575 Investment in Refining & Transport 1.735 2.914427 493 94 Investment in Gas and Energy 1.333 136186 93 54 Structured Projects Net of Advance 374 156
(297) (234) - Dividends (531) (560) 295 (226) 167 Other Investments 28 488468 6.593 3.623 (=) Net Cash Flow 9.576 9.119
(1.007) 2.942 6.082 (-) Cash Used in Financing Activities 6.010 16.2051.475 3.651 (2.459) (=) Cash Generated in the Period 3.566 (7.086)
10.020 11.495 15.596 Cash at the Beginning of Period 11.580 20.22311.495 15.146 13.137 Cash at the End of Period 15.146 13.137
Third Quarter Jan - SepR$ Million
PETROBRAS S.A Financial Statements
33
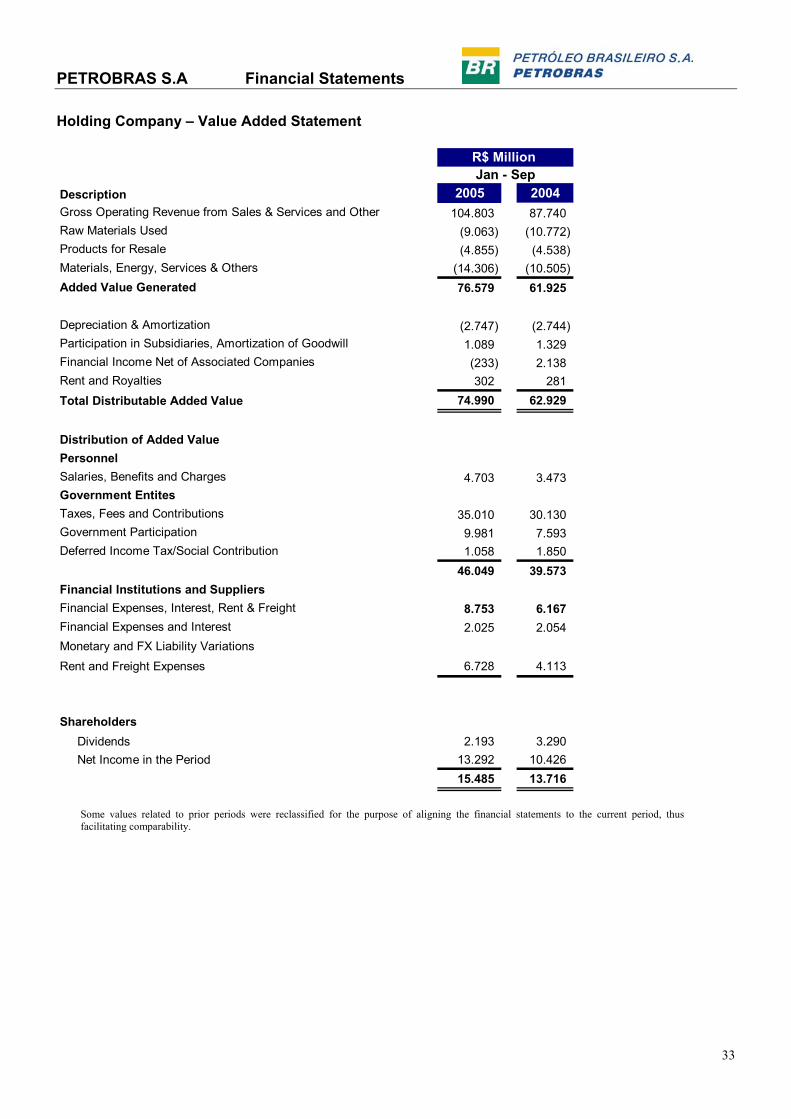
Holding Company – Value Added Statement
Description 2005 2004Gross Operating Revenue from Sales & Services and Other 104.803 87.740Raw Materials Used (9.063) (10.772)Products for Resale (4.855) (4.538)Materials, Energy, Services & Others (14.306) (10.505)Added Value Generated 76.579 61.925
Depreciation & Amortization (2.747) (2.744)Participation in Subsidiaries, Amortization of Goodwill 1.089 1.329Financial Income Net of Associated Companies (233) 2.138Rent and Royalties 302 281Total Distributable Added Value 74.990 62.929
Distribution of Added Value PersonnelSalaries, Benefits and Charges 4.703 3.473Government EntitesTaxes, Fees and Contributions 35.010 30.130Government Participation 9.981 7.593 Deferred Income Tax/Social Contribution 1.058 1.850
46.049 39.573Financial Institutions and SuppliersFinancial Expenses, Interest, Rent & Freight 8.753 6.167Financial Expenses and Interest 2.025 2.054Monetary and FX Liability VariationsRent and Freight Expenses 6.728 4.113
Shareholders Dividends 2.193 3.290 Net Income in the Period 13.292 10.426
15.485 13.716
R$ Million Jan - Sep
Some values related to prior periods were reclassified for the purpose of aligning the financial statements to the current period, thus facilitating comparability.
PETROBRAS S.A
34
http: //www.petrobras.com.br/ri
For more information, please contact:
PETRÓLEO BRASILEIRO S.A – PETROBRAS Investor Relations
Raul Adalberto de Campos – Executive Manager E-mail: [email protected] Av. República do Chile, 65 - 401-E
20031-912 – Rio de Janeiro, RJ Telephone: (55-21) 3224-1510 / 9947
0800-282-1540
This document may contain forecasts that merely reflect the expectations of the Company’s management. Such terms as “anticipate”, “believe”, “expect”, “forecast”, “intend”, “plan”, “project”, “seek”, “should”, along with similar or analogous expressions, are used to identify such forecasts. These predictions involve risks and uncertainties, whether foreseen or not by the Company. Therefore, the future results of operations may differ from current expectations, and readers must not base their expectations exclusively on the information presented herein.