peter scanlon: diabetic eye screening, past present and future part 2
TRANSCRIPT
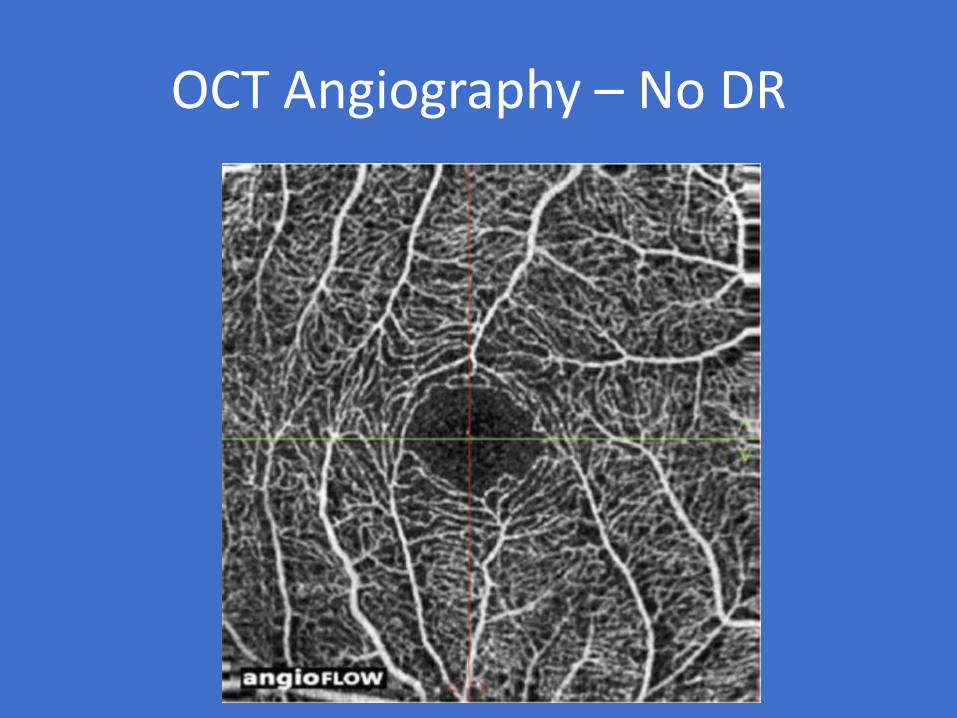
OCT Angiography – No DR

OCT Angiography – background DR
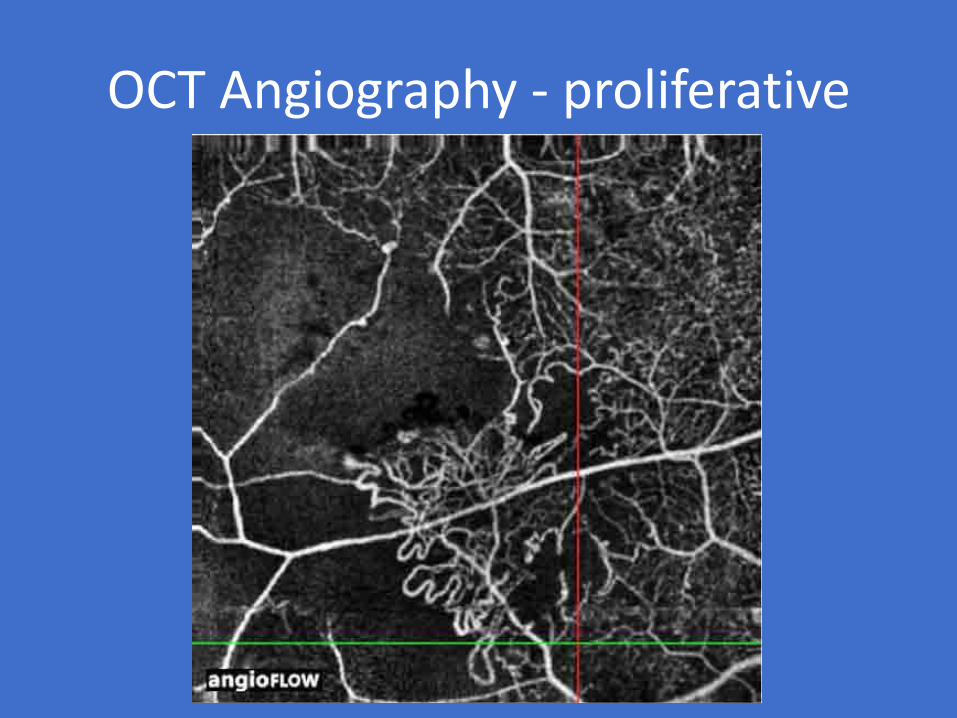
OCT Angiography - proliferative

31 yr male old footballer
Presented in 2014 with proliferative DR Rt & Lt.Treated with bilateral PRP
Dec 2016 despite extensive PRP

September 2017

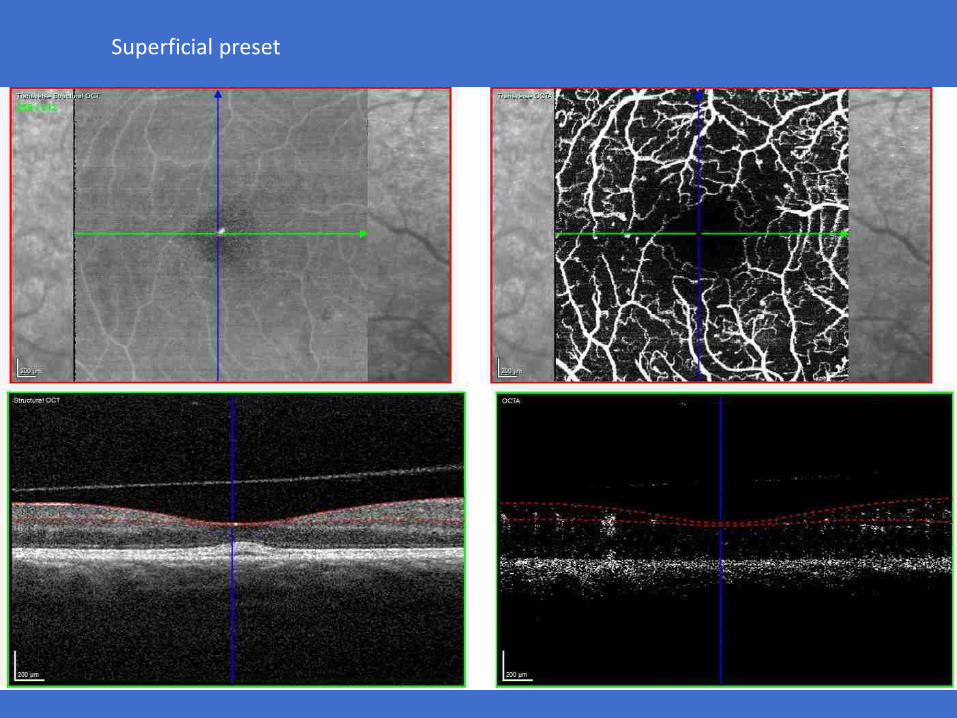
Superficial preset
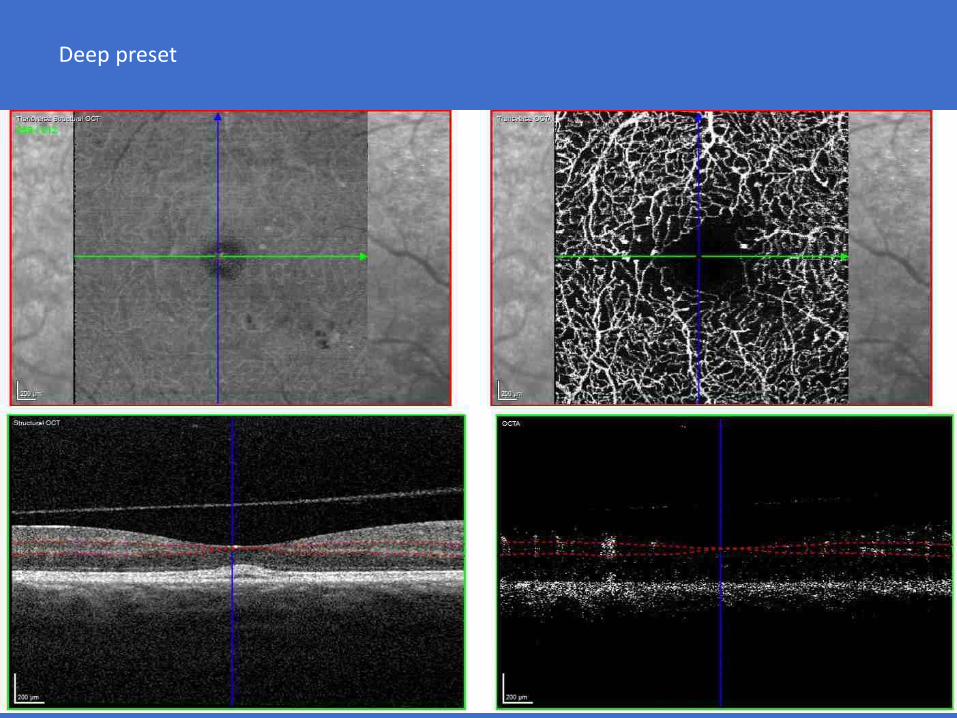
Deep preset
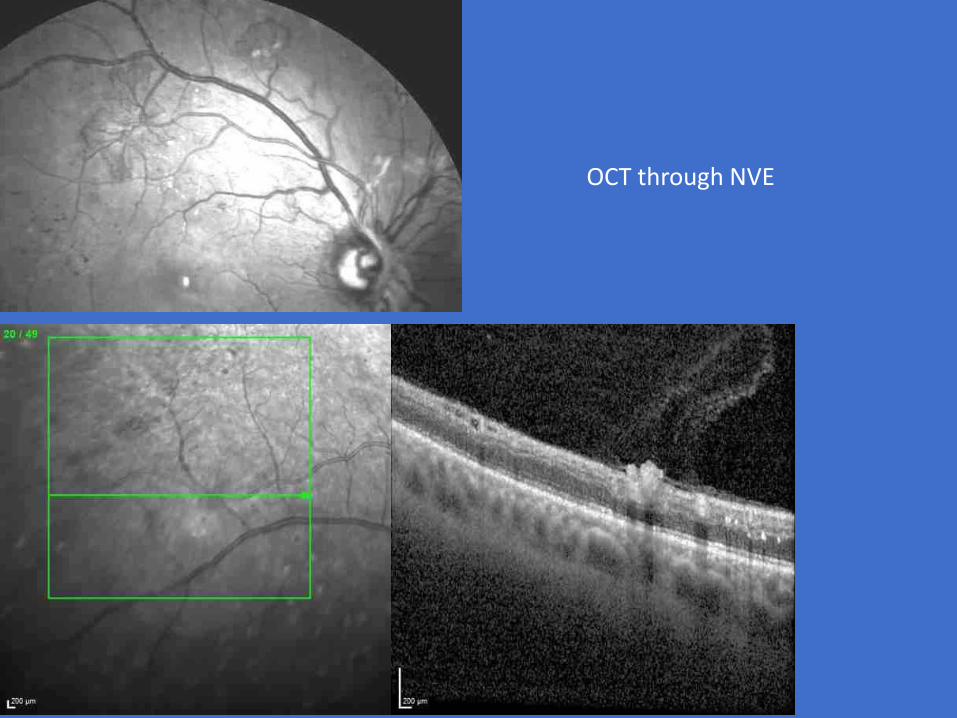
OCT through NVE

Superficial
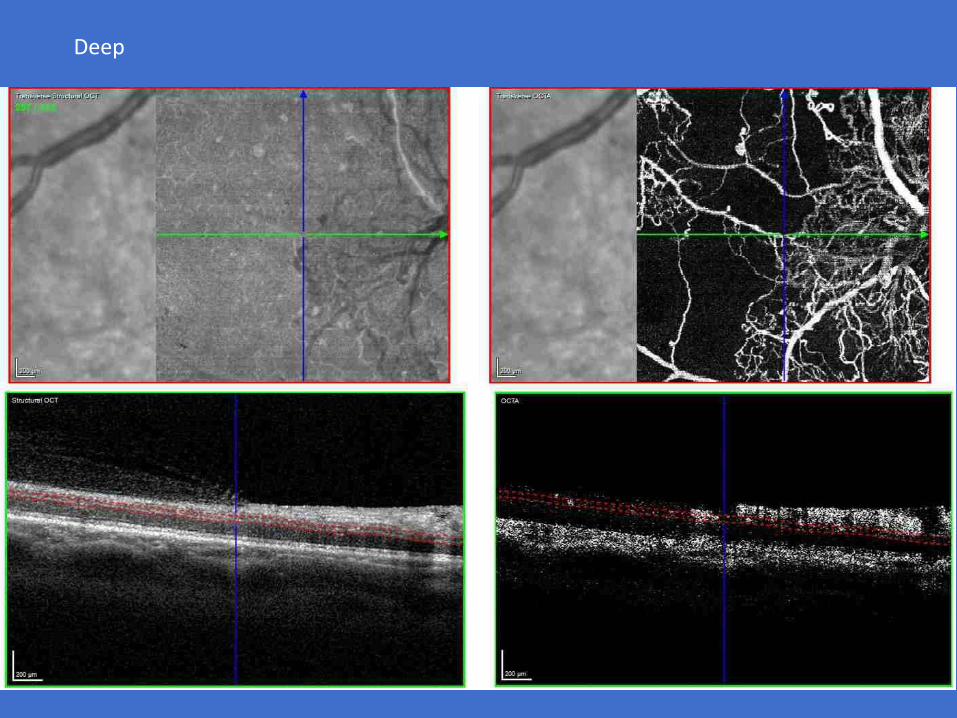
Deep
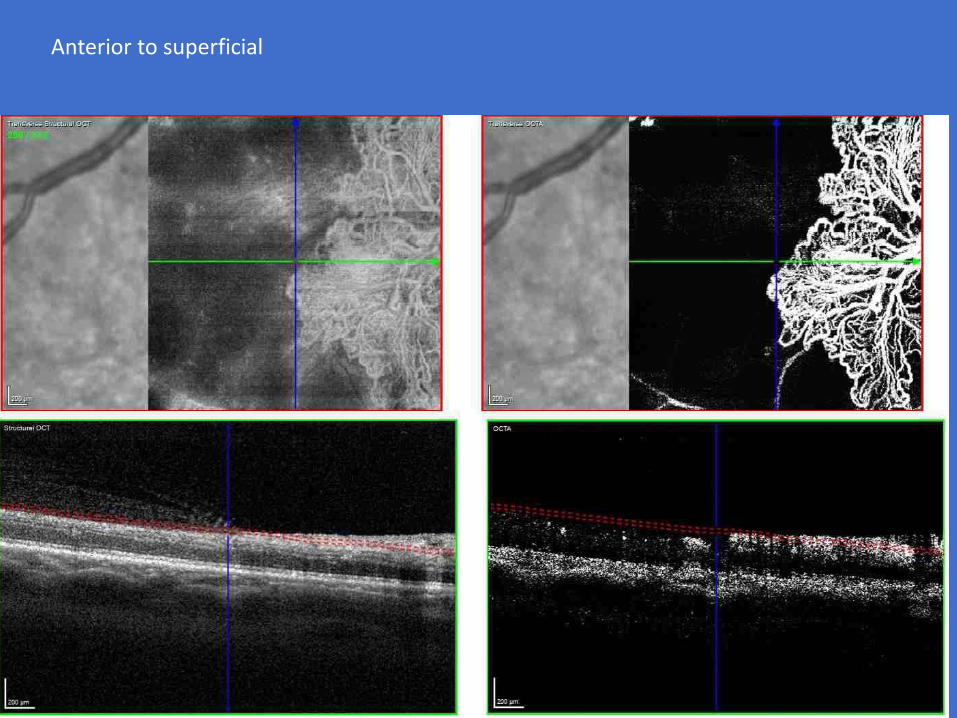
Anterior to superficial

Limitations of OCTA
• Small field of view
• Vessels are only visible if there is reasonable flow in the vessel
2 x 2 mm

Limitations of OCTA
Image Artifacts Decorrelation projection
~15%
Software
• Automated analysis
• Communication with patients
• Extended screening intervals
• Joining up with the rest of the body
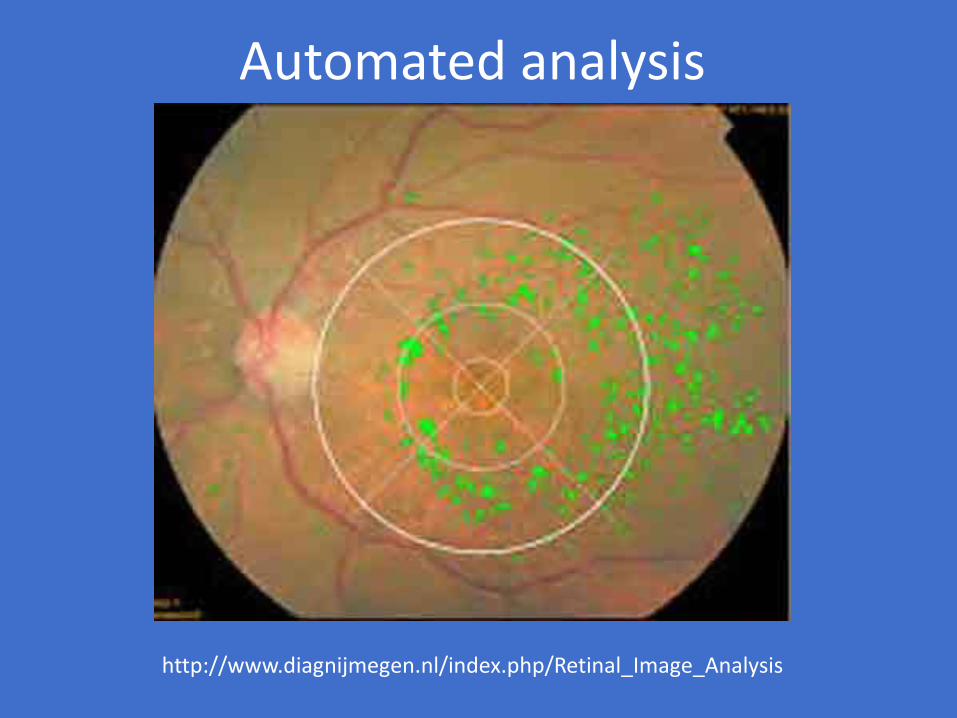
Automated analysis
http://www.diagnijmegen.nl/index.php/Retinal_Image_Analysis
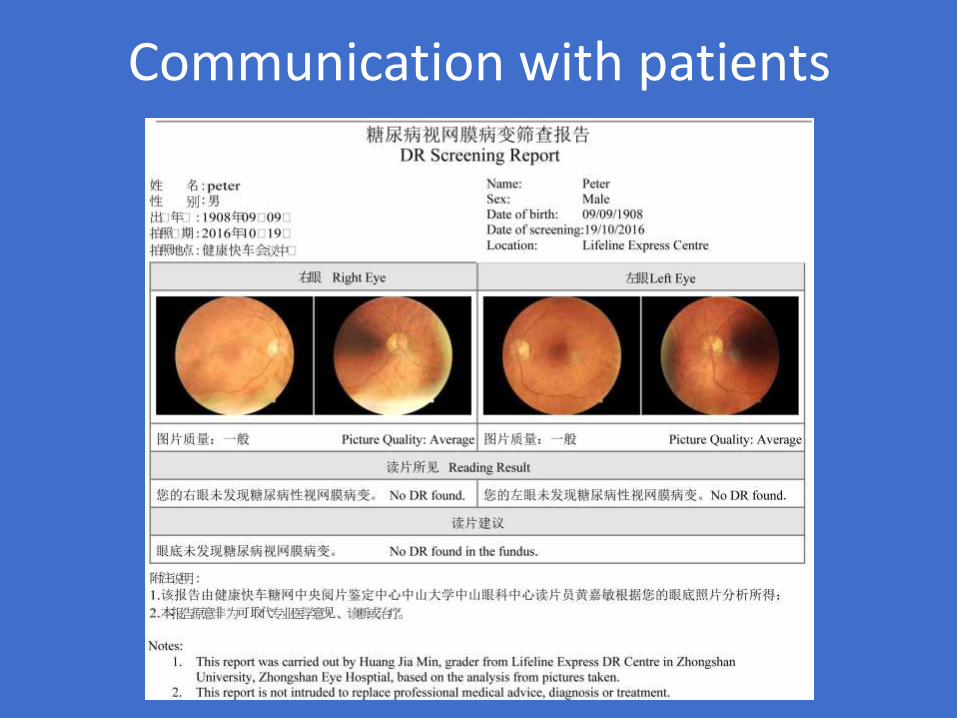
Communication with patients
Extended Screening Intervals

Irene Stratton
STUDY PI DETAILS STATUS
HTA – DR Screening
PS HTA – Development of a cost-effectiveness model for
optimisation of the screening interval in diabetic retinopathy
screening. Total awarded £394,696. Start date May 2012.
Duration 30 months.
Completed
Scanlon, P. H., et al. (2015). "Development of a cost-effectiveness model for optimisation of the screening interval in diabetic retinopathy screening." Health Technol Assess 19(74): 1-116.

UK NSC – Progress on Extended Screening Intervals
UK NSC agreed at their committee on 19th November 2015 and published their recommendation in Jan 2016:
For people with diabetes at low risk of sight loss, the interval between screening tests should change from one year to two years.
The current one year interval should remain unchanged for the remaining people at high risk of sight loss.
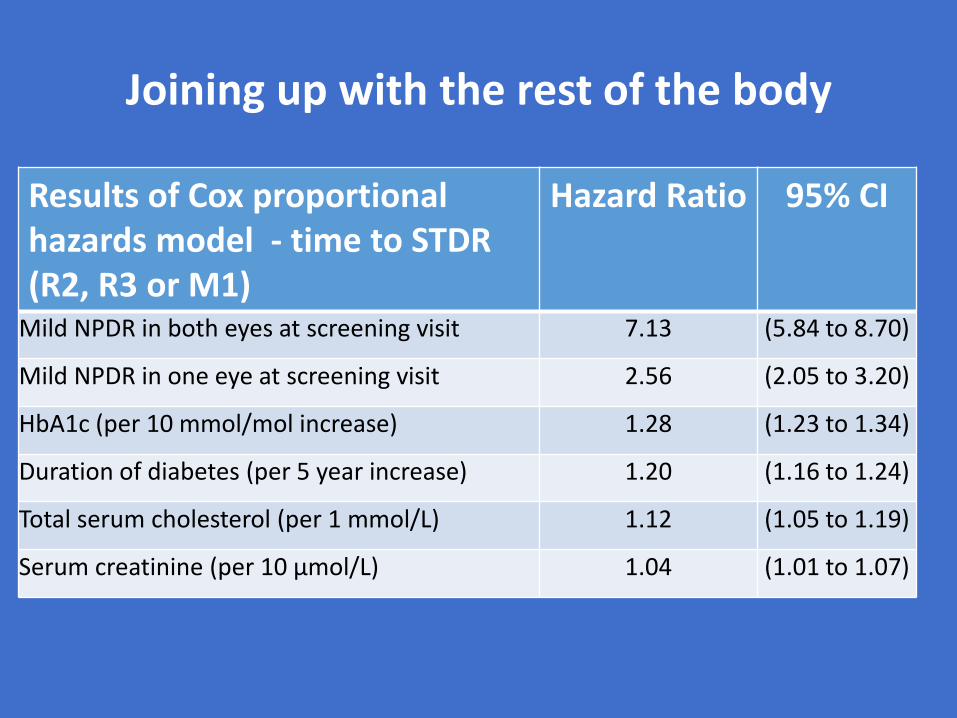
Joining up with the rest of the body
Results of Cox proportional hazards model - time to STDR (R2, R3 or M1)
Hazard Ratio 95% CI
Mild NPDR in both eyes at screening visit 7.13 (5.84 to 8.70)
Mild NPDR in one eye at screening visit 2.56 (2.05 to 3.20)
HbA1c (per 10 mmol/mol increase) 1.28 (1.23 to 1.34)
Duration of diabetes (per 5 year increase) 1.20 (1.16 to 1.24)
Total serum cholesterol (per 1 mmol/L) 1.12 (1.05 to 1.19)
Serum creatinine (per 10 µmol/L) 1.04 (1.01 to 1.07)

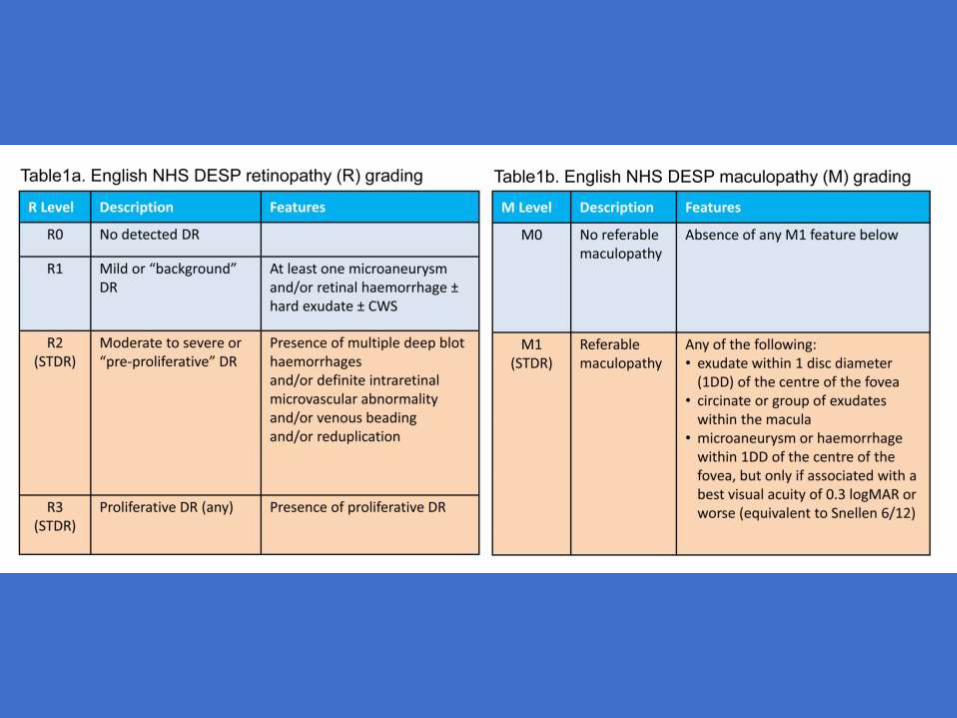
Point 1 - Retinopathy levels at age 12-13 Four Nations Collaborative Group
• Data were extracted from 4 English screening programmes and from the Scottish, Welsh and Northern Irish programmes:
• Time from diagnosis of diabetes to first screening
• Age at diagnosis
• Retinopathy level.
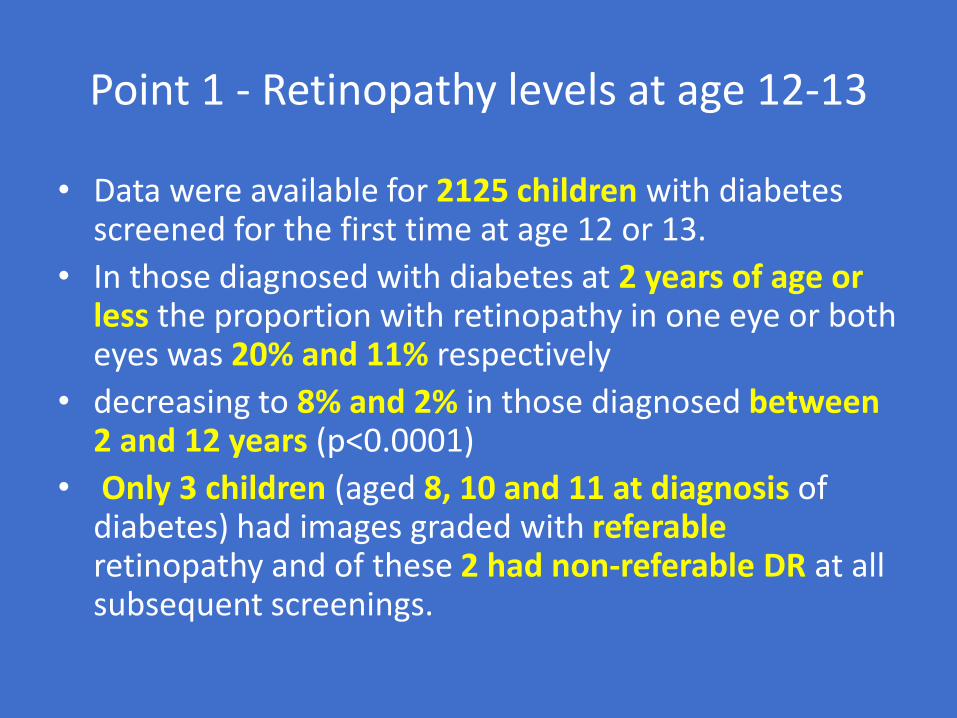
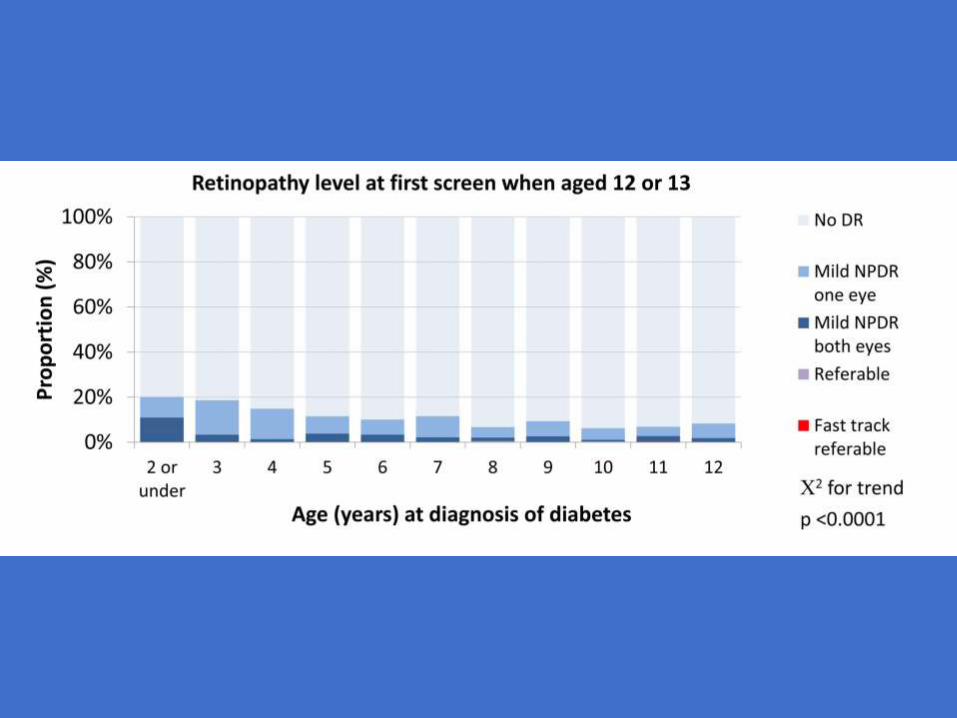
Point 1 - Retinopathy levels at age 12-13
• Data were available for 2125 children with diabetes screened for the first time at age 12 or 13.
• In those diagnosed with diabetes at 2 years of age or less the proportion with retinopathy in one eye or both eyes was 20% and 11% respectively
• decreasing to 8% and 2% in those diagnosed between2 and 12 years (p<0.0001)
• Only 3 children (aged 8, 10 and 11 at diagnosis of diabetes) had images graded with referableretinopathy and of these 2 had non-referable DR at all subsequent screenings.

Should the screening age be reduced?
• Making the assumption that screening is to detect referable DR:
• In this large cohort of children diagnosed with diabetes before the age of twelve the low prevalence and incidence rates of referable DR suggest that earlier screening is not necessary in this age group

Results of the baseline screen at the age of 12 years or 13 years
** Three children were reported as having referable retinopathy at first screening:
Age at diagnosis of diabetes
Number
Total = 2125
Proportion with any DR
Proportion with mild NPDR in one eye
Proportion with mild NPDR in both eyes
Proportion with fast track or referable DR
2 or under 164 20.1% 9.1% 11.0% 0.0%
3 118 18.6% 15.3% 3.4% 0.0%
4 141 14.9% 13.5% 1.4% 0.0%
5 130 11.5% 7.7% 3.8% 0.0%
6 149 10.1% 6.7% 3.4% 0.0%
7 181 11.6% 9.4% 2.2% 0.0%
8 193 6.7% 4.7% 1.6% 0.5%**
9 224 9.4% 6.7% 2.7% 0.0%
10 271 6.3% 5.2% 0.7% 0.4%**
11 290 6.9% 4.1% 2.4% 0.3%**
12 264 8.3% 6.4% 1.9% 0.0%


Point 1 - Retinopathy levels at age 12-13
• Of 1703 children with subsequent images
• 25 were graded with referable DR over a mean follow-up of 3.1 years,
• incidence rate of 4.7 (95% confidence interval (CI) 3.1-7.0) per 1,000 per year.
• Those with longer duration of diabetes were at higher risk of progression to referable DR with hazard ratio of 1.36 per year since diagnosis of diabetes (95% CI 1.20 to 1.53)

. Time to STDR from baseline screen at 12 or 13 years by age of diagnosis of
diabetes

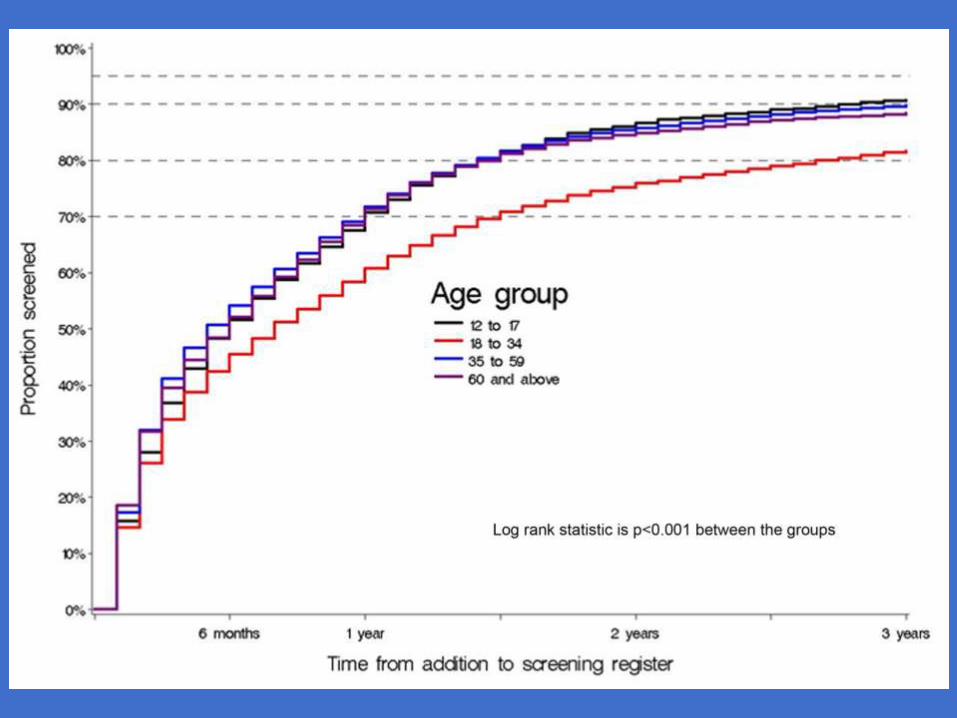
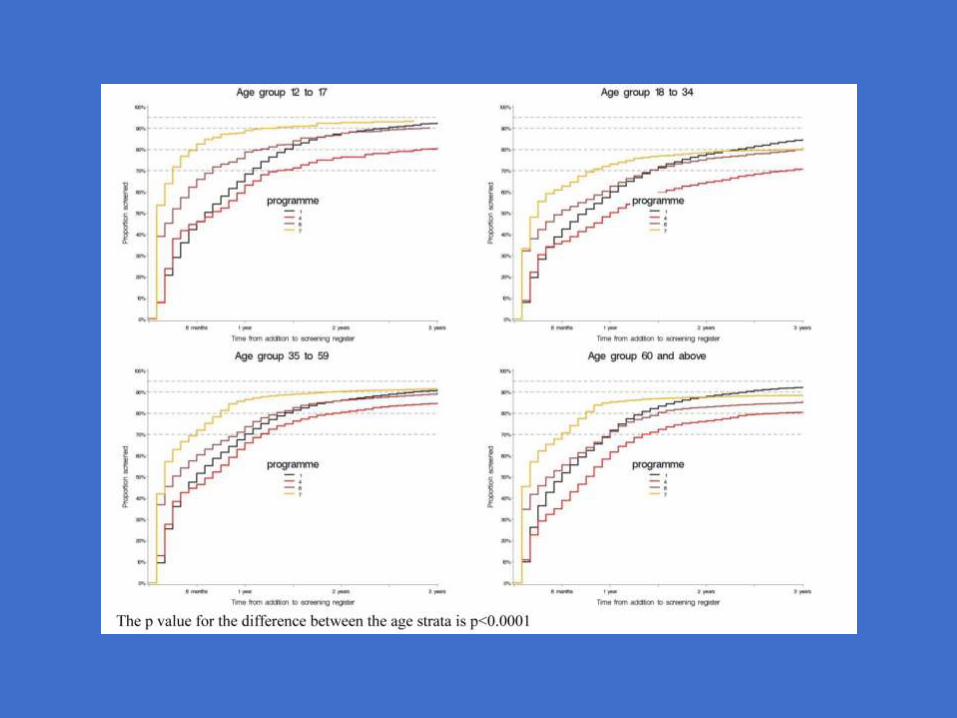
Screening Attendance, Age Group and Diabetic Retinopathy Level at First Screen.Four Nations Collaborative Group
• The time to first screening episode is strongly related to age at registration.
• Within 18 months of registration 89% of 3,958 young people under 18 years of age and 81% of 391,293 people over 35 were seen.
• In 19,058 people between 18 and 34 years of age 80% coverage was not reached until 2 years and 9 months.
• The time from diagnosis of diabetes to first screening is positively associated with severity of disease (p<0.0001).
Scanlon PH, Stratton IM, Leese GP, et al. Screening attendance, age group and diabetic retinopathy level at first screen. Diabet Med 2015. Diabet Med. 2015 Sep 4. doi: 10.1111/dme.12957. . [Epub ahead of print]


Proportion with referable DR
• Between those diagnosed in 2010 or 2011 and those diagnosed before 1990 the proportion with any diabetic retinopathy increased from 18% to 67%,
• and the proportion with ‘fast track’ referable diabetic retinopathy increased from 0.1% to 8.7% (Table) (chi-squared for trend p<0.0001).
• Those diagnosed with diabetes before 1990 and first screened in 2010 or 2011 were 19 (95% CI 16 to 21) times more likely to have referable diabetic retinopathy than those diagnosed in 2010 or 2011 and 69 (95% CI 47 to 101) times more likely to have ‘fast track’ referable diabetic retinopathy.

Results of first screening by date of diagnosis of diabetes, at first screening
in 2011, all programmes combined.
Chi squared for trend for level of DR p<0.0001
Year of diagnosis of diabetes
Total image sets No DR
Mild NPDR in 1 eye
Mild NPDR in both eyes
Referable DR (not fast-track)
Fast track referable DR Ungradable*
n
% of graded image sets
n
% of graded image sets
n
% of graded image sets
n
% of graded image sets
n
% of graded image sets
n % of all image sets
1989 and earlier
1,462 443 33.0 176 13.1 362 27.0 244 18.2 116 8.7 121 8.3
1990 to 1999 2,936 1,453 52.6 381 13.8 507 18.4 323 11.7 99 3.6 173 5.9
2000 to 2004 3,923 2,574 68.5 527 14.0 389 10.4 210 5.6 56 1.5 167 4.3
2005 to 2009 3,063 4,504 76.7 802 13.7 379 6.5 157 2.7 27 0.5 212 3.5
2010 to 2011 27,326 21,508 82.0 3,244 12.4 1,108 4.2 344 1.3 33 0.1 1,089 4.0
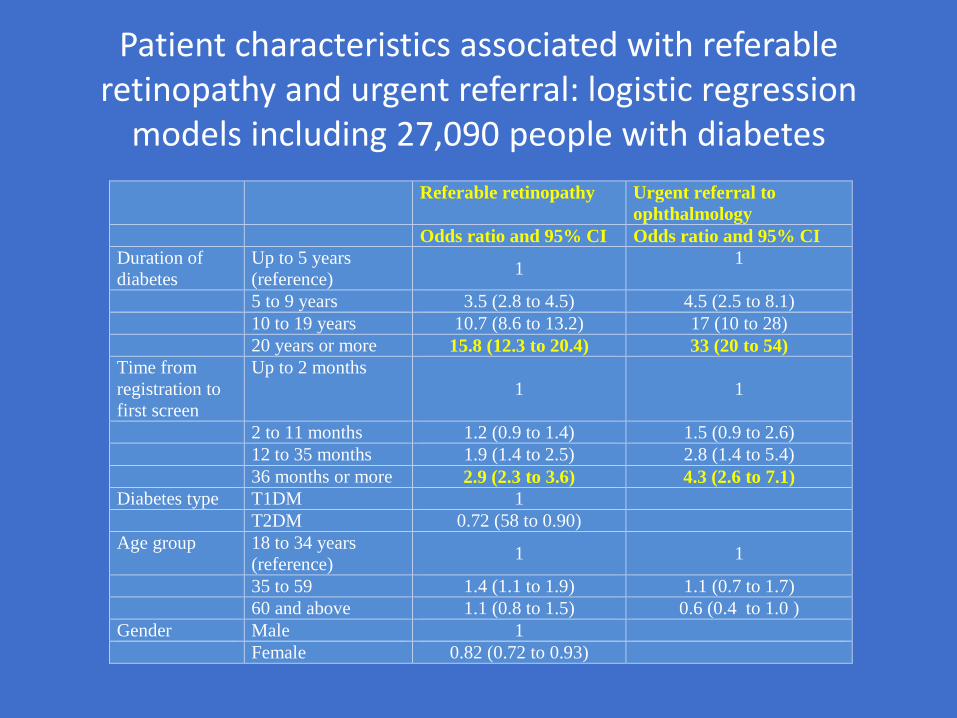
Patient characteristics associated with referable retinopathy and urgent referral: logistic regression
models including 27,090 people with diabetes
Referable retinopathy Urgent referral to
ophthalmology
Odds ratio and 95% CI Odds ratio and 95% CI
Duration of
diabetes
Up to 5 years
(reference) 1
1
5 to 9 years 3.5 (2.8 to 4.5) 4.5 (2.5 to 8.1)
10 to 19 years 10.7 (8.6 to 13.2) 17 (10 to 28)
20 years or more 15.8 (12.3 to 20.4) 33 (20 to 54)
Time from
registration to
first screen
Up to 2 months
1 1
2 to 11 months 1.2 (0.9 to 1.4) 1.5 (0.9 to 2.6)
12 to 35 months 1.9 (1.4 to 2.5) 2.8 (1.4 to 5.4)
36 months or more 2.9 (2.3 to 3.6) 4.3 (2.6 to 7.1)
Diabetes type T1DM 1
T2DM 0.72 (58 to 0.90)
Age group 18 to 34 years
(reference) 1 1
35 to 59 1.4 (1.1 to 1.9) 1.1 (0.7 to 1.7)
60 and above 1.1 (0.8 to 1.5) 0.6 (0.4 to 1.0 )
Gender Male 1
Female 0.82 (0.72 to 0.93)