pet/ct qa and acceptance testing - amos...
TRANSCRIPT

1
PET/CT QA and
Acceptance Testing
Magnus Dahlbom Ph.D
Osama Mawlawi Ph.D
UCLA School of Medicine , Los Angeles CA
MD Anderson Cancer Center, Houston TX
O. Mawlawi MDACC
Learning Objectives:
• Summarize the signal processing steps for coincidence
detection
• Understand the components of daily a QA
• Identify and troubleshoot sources of failure in daily QA
• List the recommended frequency of QA/QC tests.
• Describe the process of scanner calibration
• Name the different components of the NEMA tests used
for PET acceptance testing
• Understand the meaning of the NEMA test results
O. Mawlawi MDACC
O. Mawlawi MDACC
Osama Mawlawi, Ph.D.
Department of Imaging Physics
MD Anderson Cancer Center
PET NEMA Acceptance Testing

2
Disclosures
• ACR reviewer for NM and PET
O. Mawlawi MDACC
Learning Objectives
• Describe the PET NEMA acceptance tests
• Understand the results of the NEMA
acceptance tests for PET scanners.
• Describe the recommended QA/QC tests for
PET imaging and their frequency.
• Troubleshoot potential problems with PET
images.
O. Mawlawi MDACC
O. Mawlawi MDACC
What is NEMA?
The acronym stands for: National Electrical Manufacturers Association
• In 1991 a task group from the SNM published a set of measurements to
standardize the performance characterization of PET scanners.
• At the same time, NEMA formed its own committee to address the same issue
and ended up publishing a standard that adopted the SNM publication however
with some refinements. That standard became the NU 2-1994.
• Also at the same time, the European Economic Community underwent a similar
process which resulted in an International Electrotechnical Commission (IEC)
standard.
• The NEMA and IEC are two different standards although similar in purpose.
• Recently, the NEMA standard has been updated. The new document is known as
the NU 2-2001 which is still different from the IEC standard.
3
O. Mawlawi MDACC
Three NEMA Standards:
• NU2-94: Mainly used for neuroimaging (2D).
• NU2-01: Mainly used for whole Body imaging (2D/3D).
•NU2-07: Mainly to account for radioactive detectors (2D/3D)
The original NEMA standard (NU 2-94) was developed for PET
scanners that were used in 2D mode and had a limited axial FOV.
New scanner developments which acquire data in 3D and have
large axial FOVs, as well as the major shift in the use of PET from
neuroimaging to whole body imaging necessitated updating the
first NEMA standard.
Three NEMA Standards:
• The latest NEMA standard (NU2-07) takes
into consideration intrinsically radioactive
detectors.
– This will have impact on measurements of
Count losses and randoms, as well as sensitivity
– Additionally, spatial resolution has been
expanded to include the measurement and
reporting of the source position.
O. Mawlawi MDACC
O. Mawlawi MDACC
Performance Characterization Measurements:
NEMA NU2-94 (2D)
• Transverse/Axial Resolution
• Sensitivity
• Scatter Fraction
• Count Rate and deadtime
• Uniformity
• Accuracy of count rate, scatter & attenuation correction
NEMA NU2-01 and 07 (2D/3D)
• Spatial Resolution
• Sensitivity
• Scatter Fraction/Count Rate Performance
• Image Quality
• Accuracy of count losses and randoms correction
4
O. Mawlawi MDACC
2D and 3D imaging capability using septa
For systems with 2D and 3 D capabilities, Acceptance
testing should be performed in both modes
O. Mawlawi MDACC
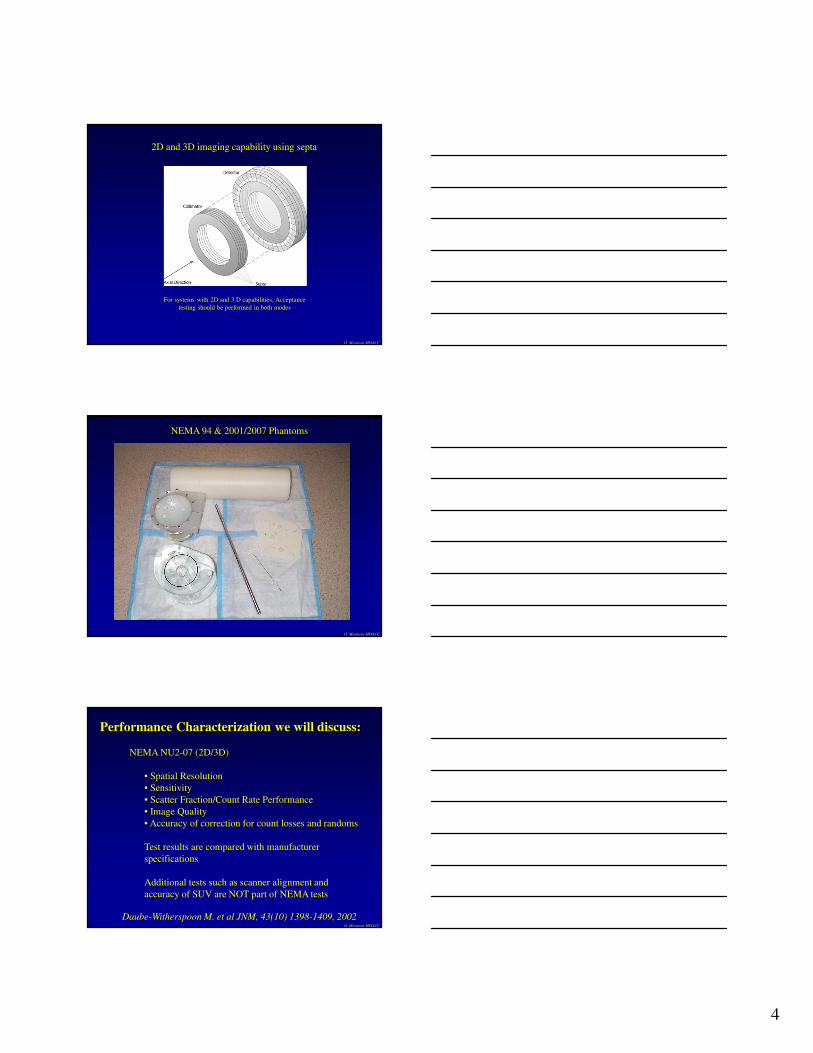
NEMA 94 & 2001/2007 Phantoms
O. Mawlawi MDACC
Performance Characterization we will discuss:
NEMA NU2-07 (2D/3D)
• Spatial Resolution
• Sensitivity
• Scatter Fraction/Count Rate Performance
• Image Quality
• Accuracy of correction for count losses and randoms
Test results are compared with manufacturer
specifications
Additional tests such as scanner alignment and
accuracy of SUV are NOT part of NEMA tests
Daube-Witherspoon M. et al JNM, 43(10) 1398-1409, 2002
5
O. Mawlawi MDACC
Spatial Resolution:
This test measures the capability of the PET system to localize the position of a
point source of activity after image reconstruction. The measurement is done using
Multiple point sources suspended in air at different locations.
• 3 point sources are made from a solution with an activity concentration of 5mci/cc
• The point sources are positioned at (0,1), (0,10), and (10,0) in center of axial FOV
• Data is acquired for 1 min in 2D and 3D modes.
• Images were reconstructed using FBP (2D) and FORE +FBP (3D)
• Use 256*256 matrix, 25cm FOV, centered at (5,-5), with ramp filter at 4mm cutoff
• No correction for dead time
• Repeat with sources positioned at 4cm from edge of axial FOV.
• Final results are the average of the two measurements.
• Analysis is done by measuring the FWHM and FWTM in the radial and tangential
directions
O. Mawlawi MDACC
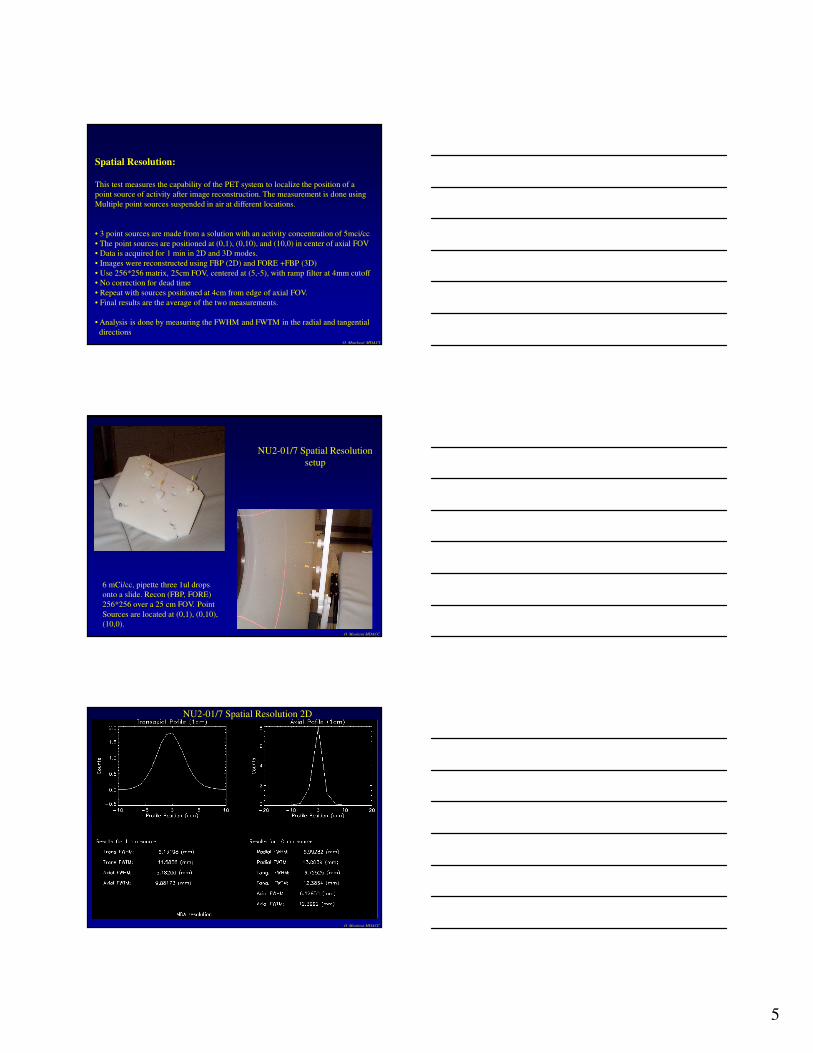
NU2-01/7 Spatial Resolution
setup
6 mCi/cc, pipette three 1ul drops
onto a slide. Recon (FBP, FORE)
256*256 over a 25 cm FOV. Point
Sources are located at (0,1), (0,10),
(10,0).
O. Mawlawi MDACC
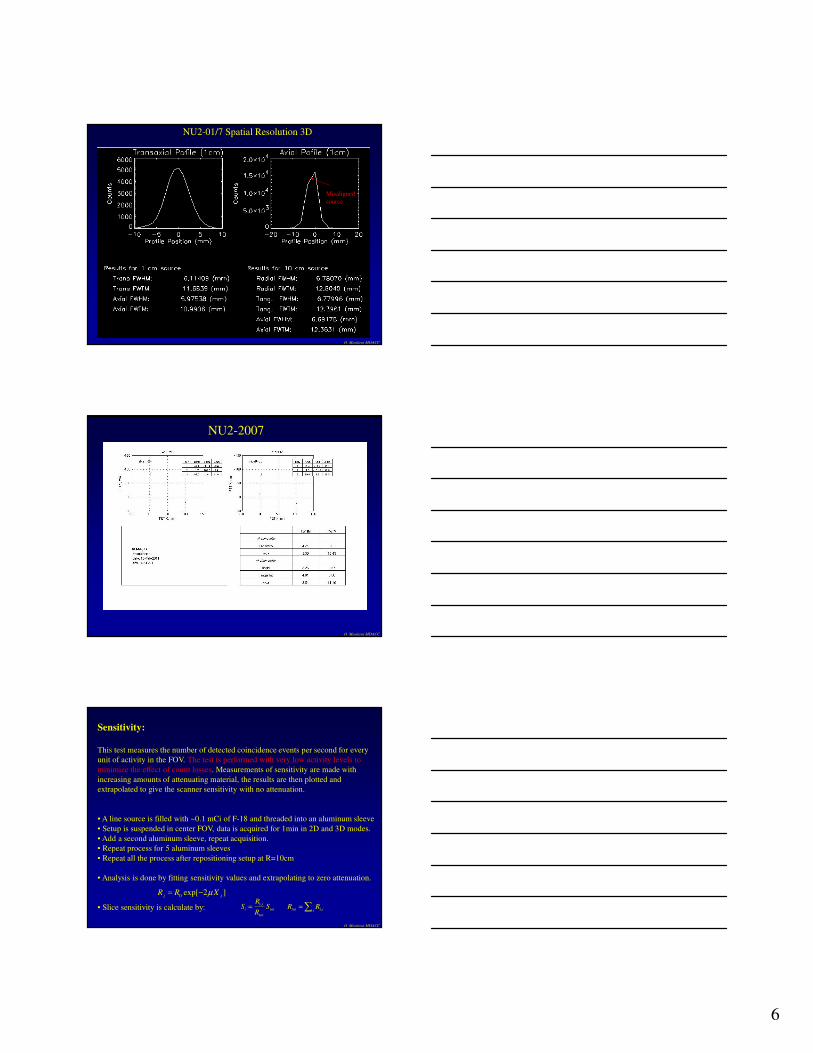
NU2-01/7 Spatial Resolution 2D
6
O. Mawlawi MDACC
NU2-01/7 Spatial Resolution 3D
Misaligned
source
O. Mawlawi MDACC
NU2-2007
O. Mawlawi MDACC
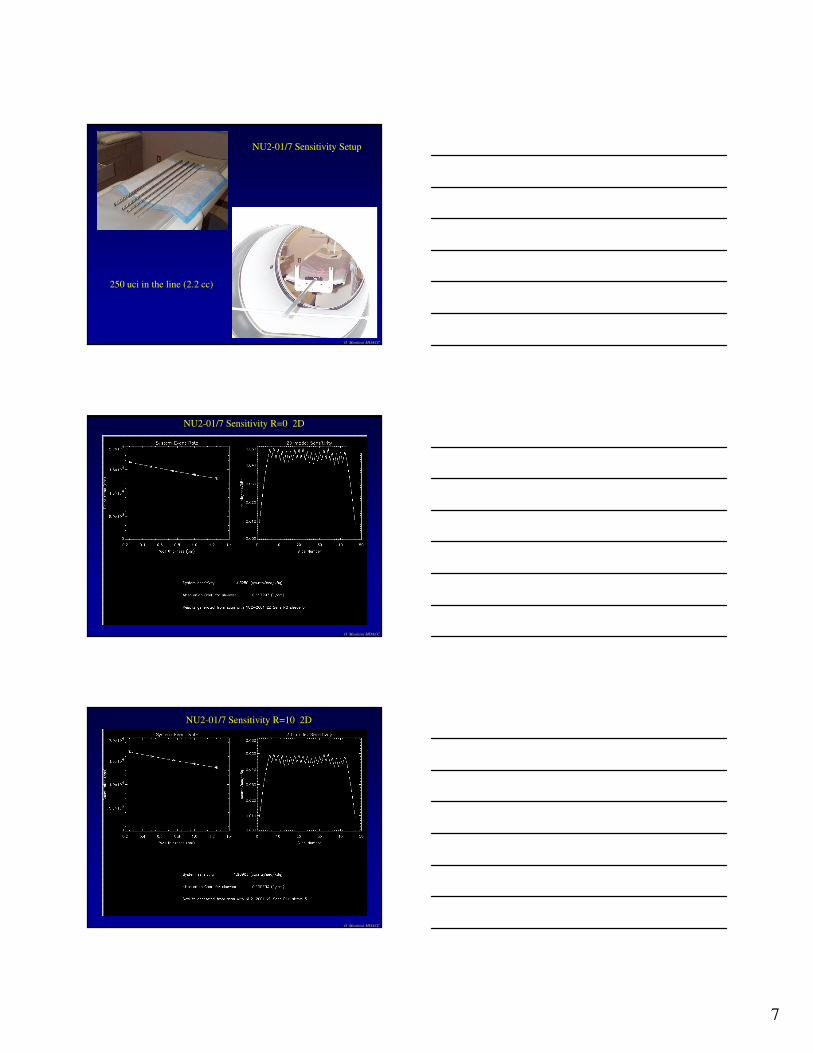
Sensitivity:
This test measures the number of detected coincidence events per second for every
unit of activity in the FOV. The test is performed with very low activity levels to
minimize the effect of count losses. Measurements of sensitivity are made with
increasing amounts of attenuating material, the results are then plotted and
extrapolated to give the scanner sensitivity with no attenuation.
• A line source is filled with ~0.1 mCi of F-18 and threaded into an aluminum sleeve
• Setup is suspended in center FOV, data is acquired for 1min in 2D and 3D modes.
• Add a second aluminum sleeve, repeat acquisition.
• Repeat process for 5 aluminum sleeves
• Repeat all the process after repositioning setup at R=10cm
• Analysis is done by fitting sensitivity values and extrapolating to zero attenuation.
• Slice sensitivity is calculate by:
0exp[ 2 ]
j jR R Xµ= −
1,
1,
i
i tot tot iitot
RS S R R
R= =∑
7
O. Mawlawi MDACC
NU2-01/7 Sensitivity Setup
250 uci in the line (2.2 cc)
O. Mawlawi MDACC
NU2-01/7 Sensitivity R=0 2D
O. Mawlawi MDACC
NU2-01/7 Sensitivity R=10 2D

8
O. Mawlawi MDACC
NU2-01/7 Sensitivity R=0 3D
O. Mawlawi MDACC
NU2-01/7 Sensitivity R=10 3D
O. Mawlawi MDACC
NU2-01/7 Sensitivity R=0 3D
Example from a Philips system
9
O. Mawlawi MDACC
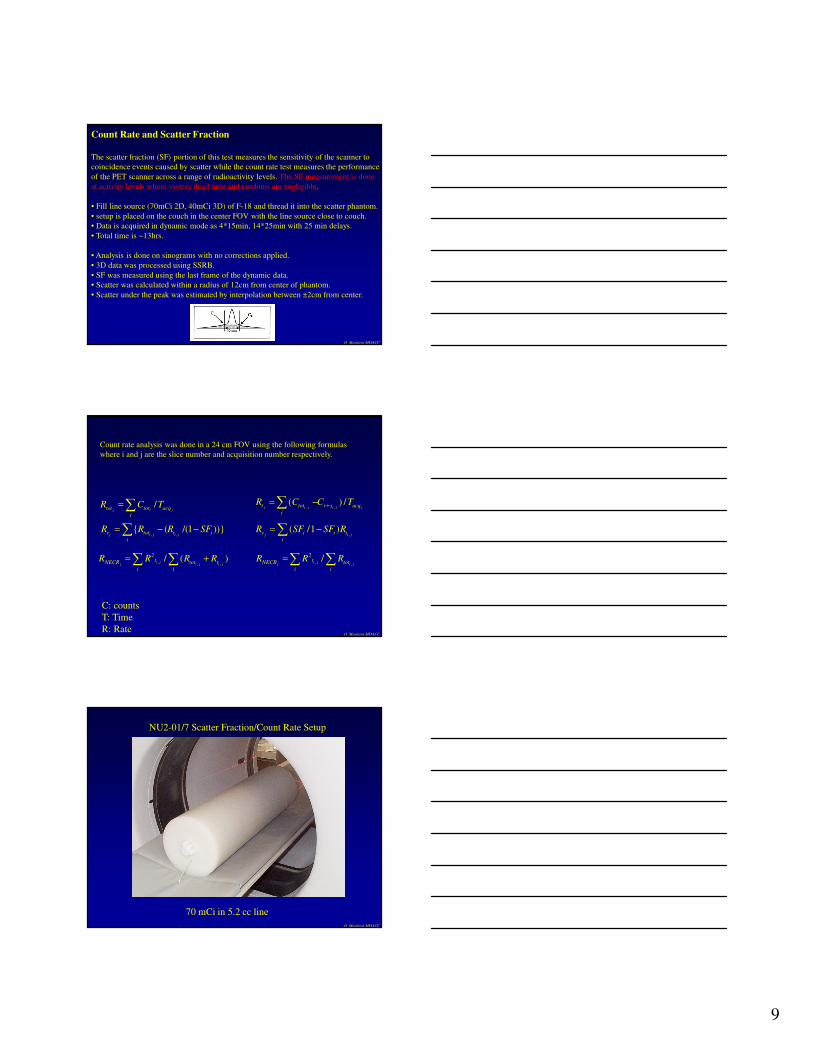
Count Rate and Scatter Fraction
The scatter fraction (SF) portion of this test measures the sensitivity of the scanner to
coincidence events caused by scatter while the count rate test measures the performance
of the PET scanner across a range of radioactivity levels. The SF measurement is done
at activity levels where system dead time and randoms are negligible.
• Fill line source (70mCi 2D, 40mCi 3D) of F-18 and thread it into the scatter phantom.
• setup is placed on the couch in the center FOV with the line source close to couch.
• Data is acquired in dynamic mode as 4*15min, 14*25min with 25 min delays.
• Total time is ~13hrs.
• Analysis is done on sinograms with no corrections applied.
• 3D data was processed using SSRB.
• SF was measured using the last frame of the dynamic data.
• Scatter was calculated within a radius of 12cm from center of phantom.
• Scatter under the peak was estimated by interpolation between ±2cm from center.
O. Mawlawi MDACC
Count rate analysis was done in a 24 cm FOV using the following formulas
where i and j are the slice number and acquisition number respectively.
/j i jtot tot acq
i
R C T=∑ , ,( ) /
j i j i j jt tot r s acq
i
R C C T+
= −∑
, ,{ ( /(1 ))}
j i j i jr tot t i
i
R R R SF= − −∑ ,( /1 )
j i js i i t
i
R SF SF R= −∑
,,
2 /i j
j i jtNECR tot
i i
R R R=∑ ∑,, ,
2 / ( )i j
j i j i jtNECR tot r
i i
R R R R= +∑ ∑
C: counts
T: Time
R: Rate
O. Mawlawi MDACC
NU2-01/7 Scatter Fraction/Count Rate Setup
70 mCi in 5.2 cc line
10
O. Mawlawi MDACC
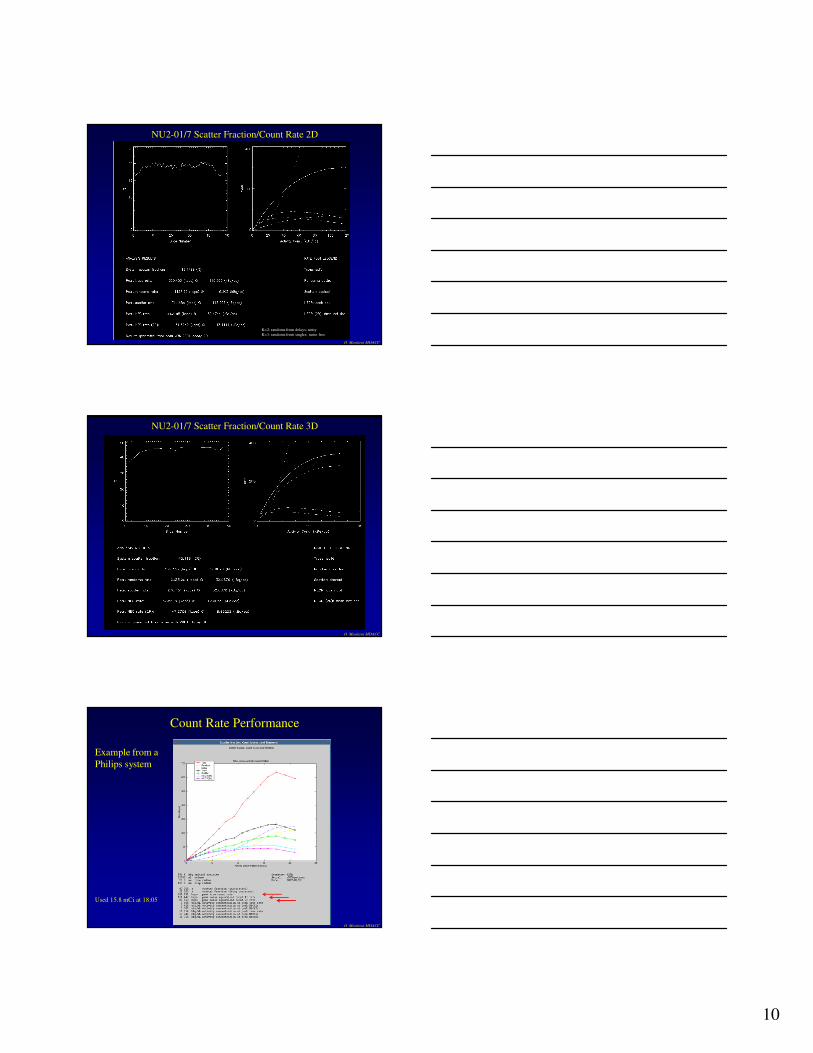
NU2-01/7 Scatter Fraction/Count Rate 2D
K=2: randoms from delays; noisy
K=1: randoms from singles; noise free
O. Mawlawi MDACC
NU2-01/7 Scatter Fraction/Count Rate 3D
Count Rate Performance
Used 15.8 mCi at 18:05
O. Mawlawi MDACC
Example from a
Philips system
11
O. Mawlawi MDACC
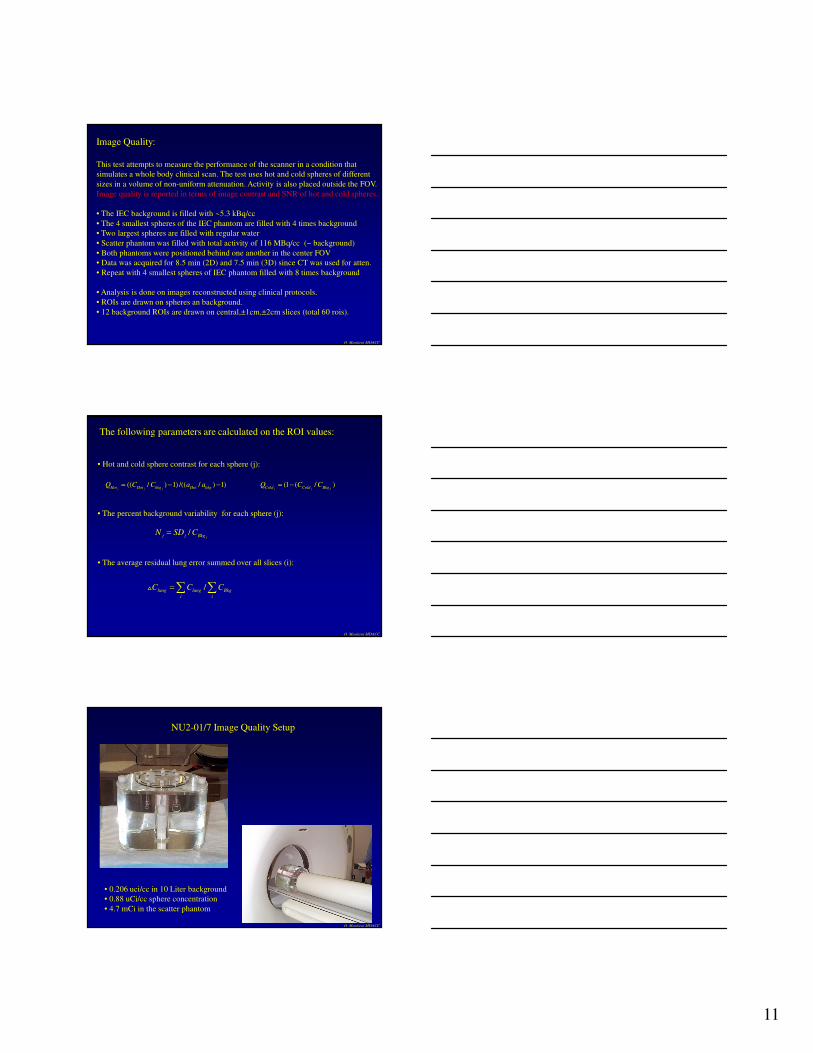
Image Quality:
This test attempts to measure the performance of the scanner in a condition that
simulates a whole body clinical scan. The test uses hot and cold spheres of different
sizes in a volume of non-uniform attenuation. Activity is also placed outside the FOV.
Image quality is reported in terms of image contrast and SNR of hot and cold spheres.
• The IEC background is filled with ~5.3 kBq/cc
• The 4 smallest spheres of the IEC phantom are filled with 4 times background
• Two largest spheres are filled with regular water
• Scatter phantom was filled with total activity of 116 MBq/cc (~ background)
• Both phantoms were positioned behind one another in the center FOV
• Data was acquired for 8.5 min (2D) and 7.5 min (3D) since CT was used for atten.
• Repeat with 4 smallest spheres of IEC phantom filled with 8 times background
• Analysis is done on images reconstructed using clinical protocols.
• ROIs are drawn on spheres an background.
• 12 background ROIs are drawn on central,±1cm,±2cm slices (total 60 rois).
O. Mawlawi MDACC
The following parameters are calculated on the ROI values:
• Hot and cold sphere contrast for each sphere (j):
• The percent background variability for each sphere (j):
• The average residual lung error summed over all slices (i):
(( / ) 1) /(( / ) 1)j j jHot Hot bkg Hot bkgQ C C a a= − − (1 ( / )
j j JCold Cold BkgQ C C= −
/jj j Bkg
N SD C=
/lung lung Bkg
i i
C C C=∑ ∑�
O. Mawlawi MDACC
NU2-01/7 Image Quality Setup
• 0.206 uci/cc in 10 Liter background
• 0.88 uCi/cc sphere concentration
• 4.7 mCi in the scatter phantom

12
O. Mawlawi MDACC
O. Mawlawi MDACC
NU2-01/7 Image Quality 2D
Should be 100%
Should be 100%
O. Mawlawi MDACC
Used: 146 uCi/200 cc in spheres, 1.65 mCi in Bkg, and 3.04 mCi in line source, all at 4:11
NU2-01/7 Image Quality 3D
Example from a Philips system
13
O. Mawlawi MDACC
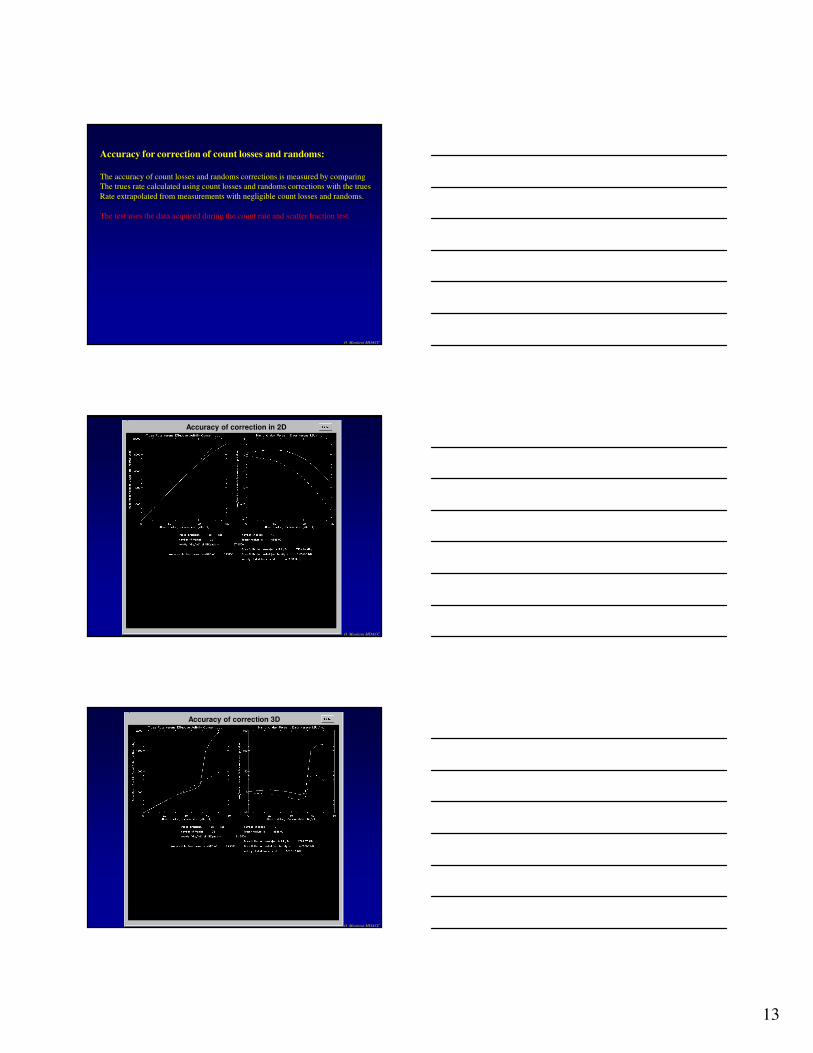
Accuracy for correction of count losses and randoms:
The accuracy of count losses and randoms corrections is measured by comparing
The trues rate calculated using count losses and randoms corrections with the trues
Rate extrapolated from measurements with negligible count losses and randoms.
The test uses the data acquired during the count rate and scatter fraction test.
O. Mawlawi MDACC
Accuracy of correction in 2D
O. Mawlawi MDACC
Accuracy of correction 3D

14
O. Mawlawi MDACC
Accuracy of Corrections
Example from a Philips system
NEMA Acceptance testing
• Results should be compared to
manufacturers specification.
• Each system from each manufacturer has
specifications for each of the NEMA tests
• These specifications are available upon
request from the manufacturer.
O. Mawlawi MDACC
O. Mawlawi MDACC
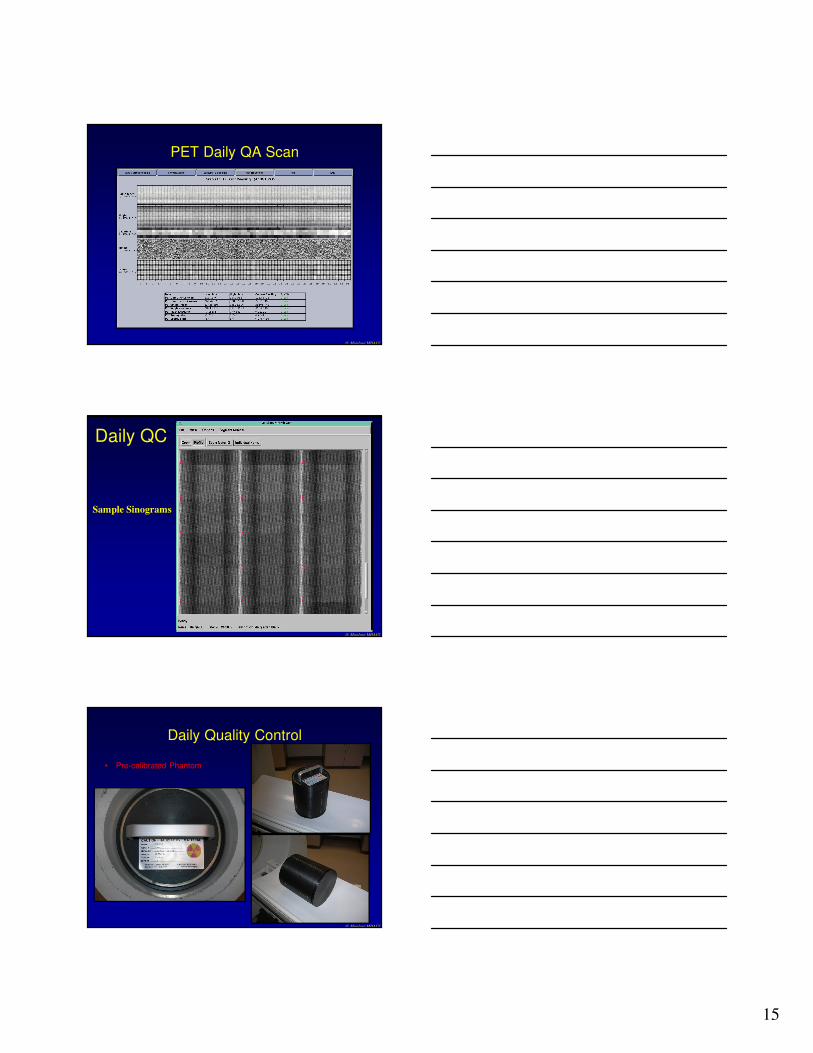
Quality Control Schedule
• Daily:– Check singles, coincidences, timing, energy
– Sinograms
• Weekly:– Update gains
• Quarterly– Normalization and well counter calibration
• Annually– ACR or NEMA tests, TG126.
15
O. Mawlawi MDACC
PET Daily QA Scan
O. Mawlawi MDACC
Sample Sinograms
Daily QC
O. Mawlawi MDACC
Daily Quality Control
• Pre-calibrated Phantom
16
O. Mawlawi MDACC
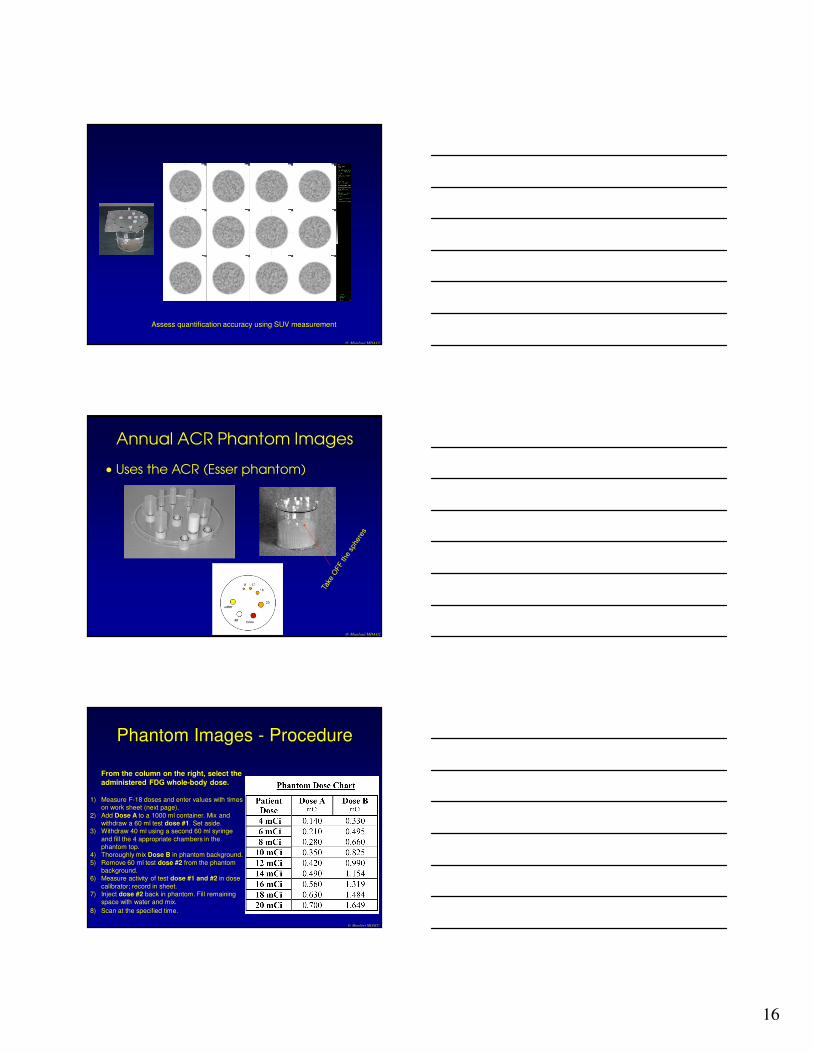
Assess quantification accuracy using SUV measurement
O. Mawlawi MDACC
Annual ACR Phantom Images
• Uses the ACR (Esser phantom)
O. Mawlawi MDACC
Phantom Images - Procedure
From the column on the right, select the
administered FDG whole-body dose.
1) Measure F-18 doses and enter values with times on work sheet (next page).
2) Add Dose A to a 1000 ml container. Mix and withdraw a 60 ml test dose #1. Set aside.
3) Withdraw 40 ml using a second 60 ml syringe
and fill the 4 appropriate chambers in the phantom top.
4) Thoroughly mix Dose B in phantom background.
5) Remove 60 ml test dose #2 from the phantom background.
6) Measure activity of test dose #1 and #2 in dose
calibrator; record in sheet.7) Inject dose #2 back in phantom. Fill remaining
space with water and mix.
8) Scan at the specified time.
17
O. Mawlawi MDACC
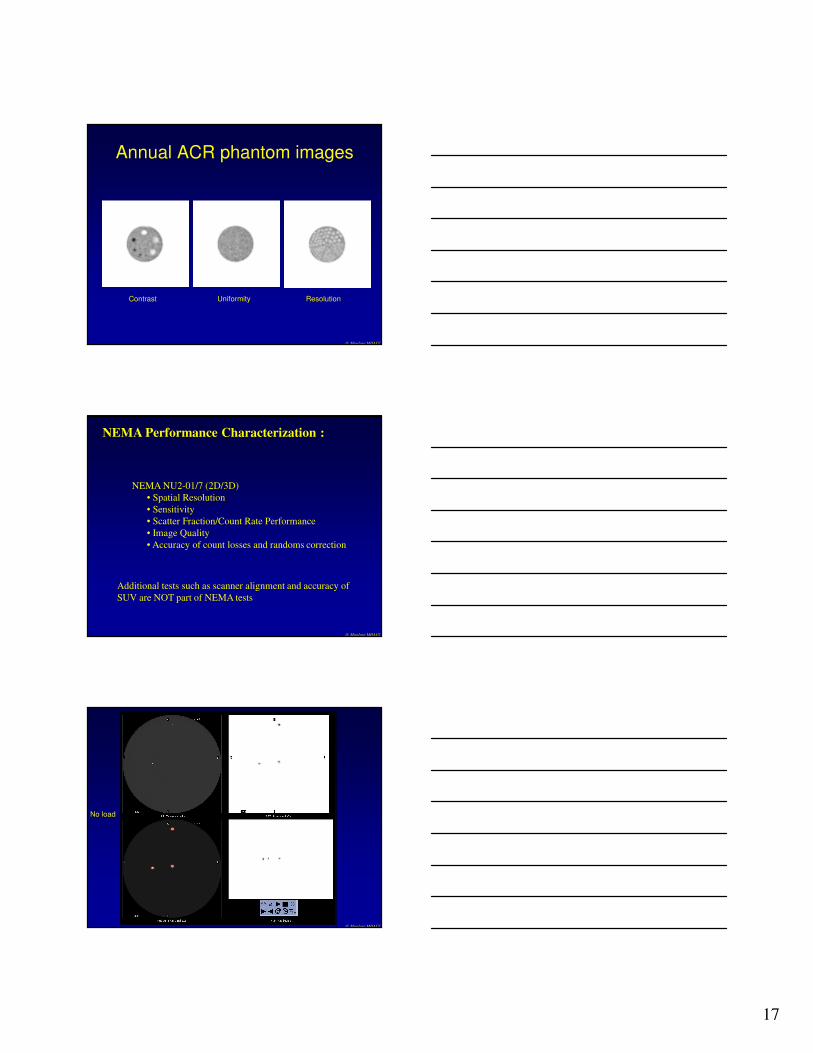
Annual ACR phantom images
Contrast Uniformity Resolution
O. Mawlawi MDACC
NEMA Performance Characterization :
NEMA NU2-01/7 (2D/3D)
• Spatial Resolution
• Sensitivity
• Scatter Fraction/Count Rate Performance
• Image Quality
• Accuracy of count losses and randoms correction
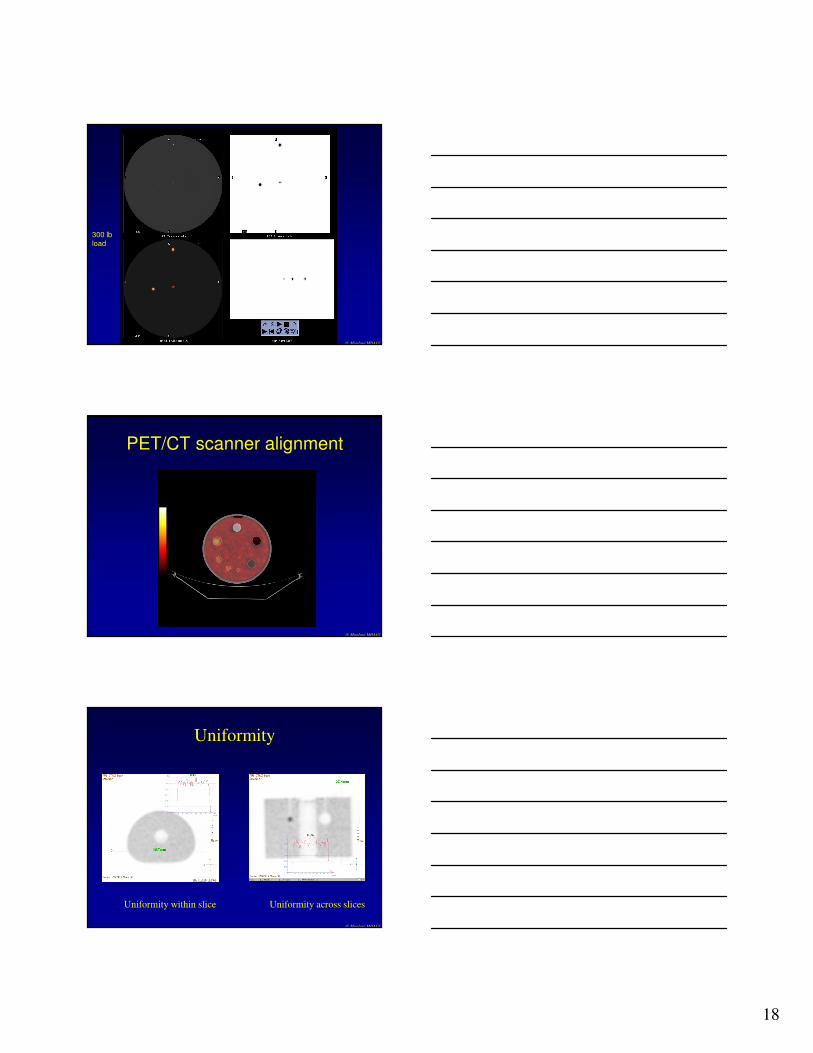
Additional tests such as scanner alignment and accuracy of
SUV are NOT part of NEMA tests
O. Mawlawi MDACC
No load
18
O. Mawlawi MDACC
300 lbload
O. Mawlawi MDACC
PET/CT scanner alignment
Uniformity
O. Mawlawi MDACC
Uniformity within slice Uniformity across slices

19
Additional tests
• Timing resolution for TOF systems
• Energy resolution
• Gating functionality
• List mode recording
O. Mawlawi MDACC
O. Mawlawi MDACC
CT Daily QA Scan
Normal operations include the following 3 tasks (in order):
• Tube Warmup- A built-in prep scan that gradually increases heat loading in the X-ray tube in order to prevent thermal cracking and eliminate the potential for an arc to occur. It includes a series of exposures made at incrementing kVp
• Daily Air Cals- A built-in prep scan that performs a series of exposures at varying techniques in order to normalize the detector response using air as the attenuating media. These scans essentially adjust the detector gains to achieve
a uniform response
• Daily QC Phantom scan- Provides data for 3 areas of concern in daily quality
assurance: Linearity, Uniformity, Artifact analysis.
O. Mawlawi MDACC
CT Daily QC Scan
• Linearity– Linear attenuation coefficients
track linearly with material density
– Remember that CT numbers are defined WRT the attenuation coefficient of water:
– The mean CT numbers of air (-1000 HU), water (0 HU), and acrylic (120 HU) displayed within an ROI should be consistent with the defined value +/- manufacture specified tolerance
(x,y) water
water
µ -µCT(x,y) = 1000 ( )
µ
20
O. Mawlawi MDACC
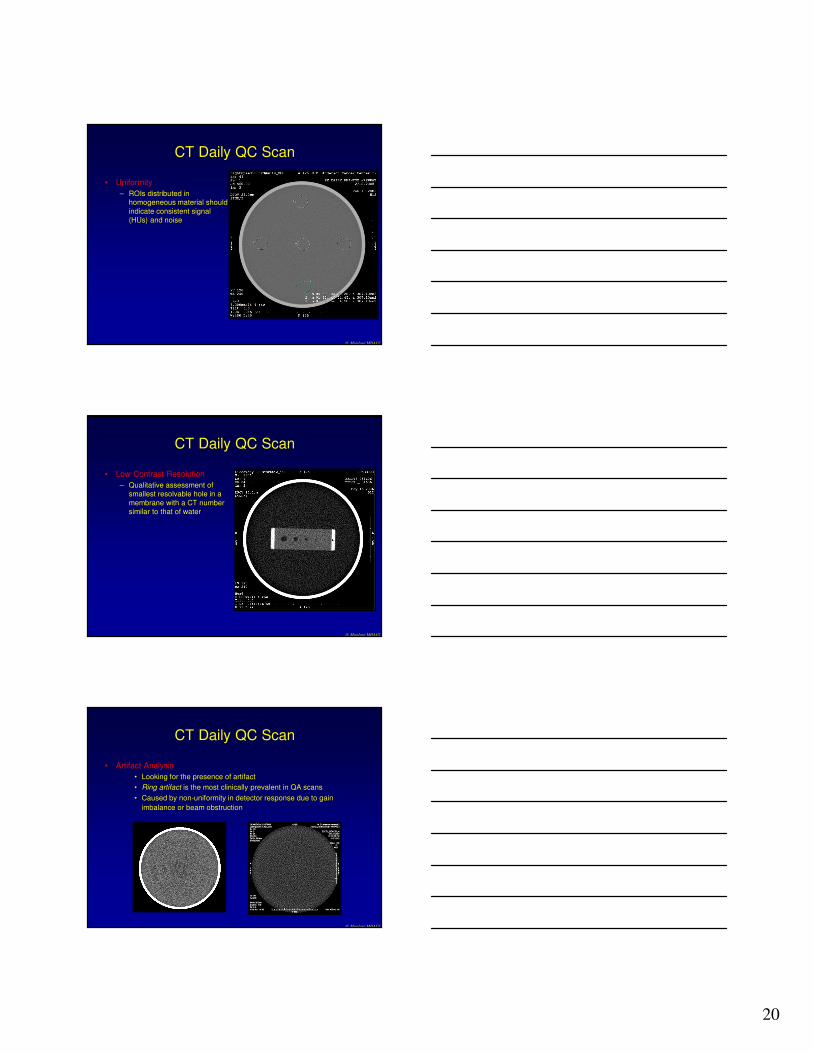
CT Daily QC Scan
• Uniformity
– ROIs distributed in homogeneous material should
indicate consistent signal (HUs) and noise
O. Mawlawi MDACC
• Low Contrast Resolution
– Qualitative assessment of smallest resolvable hole in a
membrane with a CT number similar to that of water
CT Daily QC Scan
O. Mawlawi MDACC
CT Daily QC Scan
• Artifact Analysis
• Looking for the presence of artifact
• Ring artifact is the most clinically prevalent in QA scans
• Caused by non-uniformity in detector response due to gain
imbalance or beam obstruction
21
O. Mawlawi MDACC
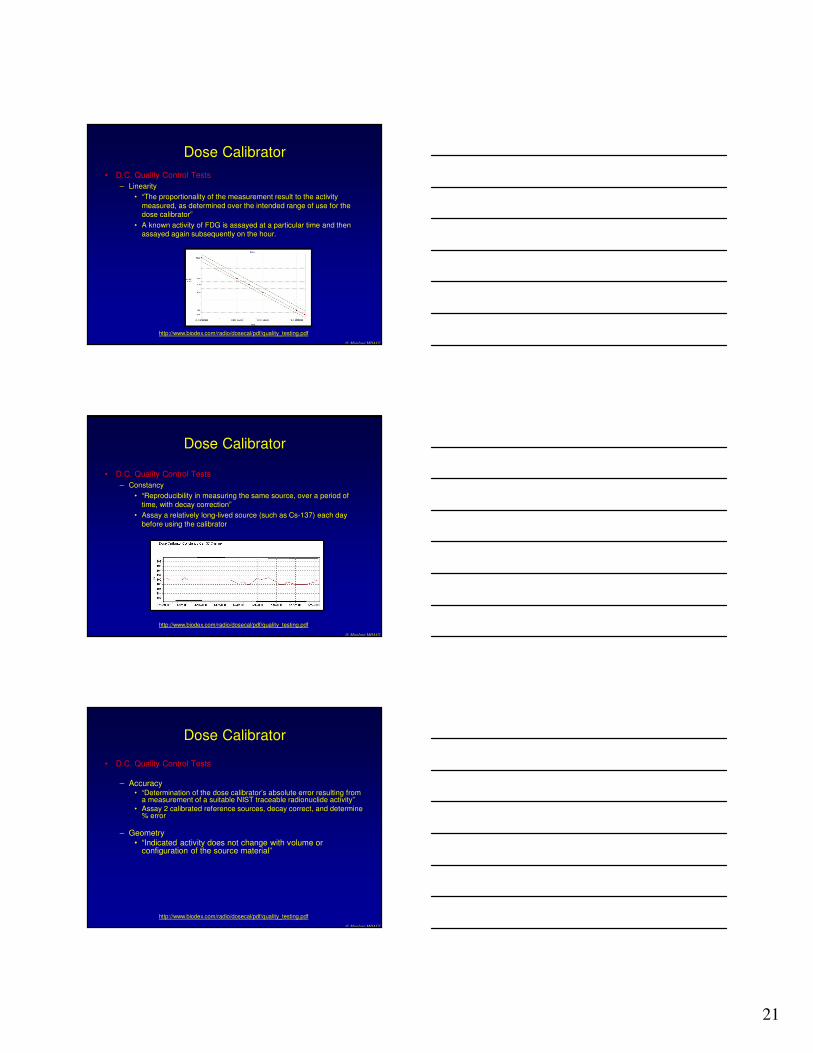
Dose Calibrator
• D.C. Quality Control Tests
– Linearity
• “The proportionality of the measurement result to the activity
measured, as determined over the intended range of use for the dose calibrator”
• A known activity of FDG is assayed at a particular time and then assayed again subsequently on the hour.
http://www.biodex.com/radio/dosecal/pdf/quality_testing.pdf
O. Mawlawi MDACC
Dose Calibrator
• D.C. Quality Control Tests
– Constancy
• “Reproducibility in measuring the same source, over a period of
time, with decay correction”
• Assay a relatively long-lived source (such as Cs-137) each day
before using the calibrator
http://www.biodex.com/radio/dosecal/pdf/quality_testing.pdf
O. Mawlawi MDACC
Dose Calibrator
• D.C. Quality Control Tests
– Accuracy• “Determination of the dose calibrator’s absolute error resulting from
a measurement of a suitable NIST traceable radionuclide activity”
• Assay 2 calibrated reference sources, decay correct, and determine % error
– Geometry• “Indicated activity does not change with volume or
configuration of the source material”
http://www.biodex.com/radio/dosecal/pdf/quality_testing.pdf

22
O. Mawlawi MDACC
TG 126
• TG126: PET/CT QA/QC and testing
– Chair: Osama Mawlawi
– Charge: to develop a report describing procedures for acceptance testing and routine quality assurance of PET scanners.
– Representation: Academia, industry, consulting, hospitals.
– Sources: NEMA, IAEA (QA for PET and PET/CT systems)
– Current issues:• Acceptance testing: NEMA standard + alignment as well other aspects ie TOF, Cardiac, dynamic, gated.• Annual testing: NEMA-lite; issues with some vendors
– Meetings: SNM, AAPM, RSNA, (IEEE – MIC)
– Expected draft date: 2012 http://www-pub.iaea.org/MTCD/publications/PDF/Pub1393_web.pdf
Artifacts
O. Mawlawi MDACC
O. Mawlawi MDACC
23
O. Mawlawi MDACC
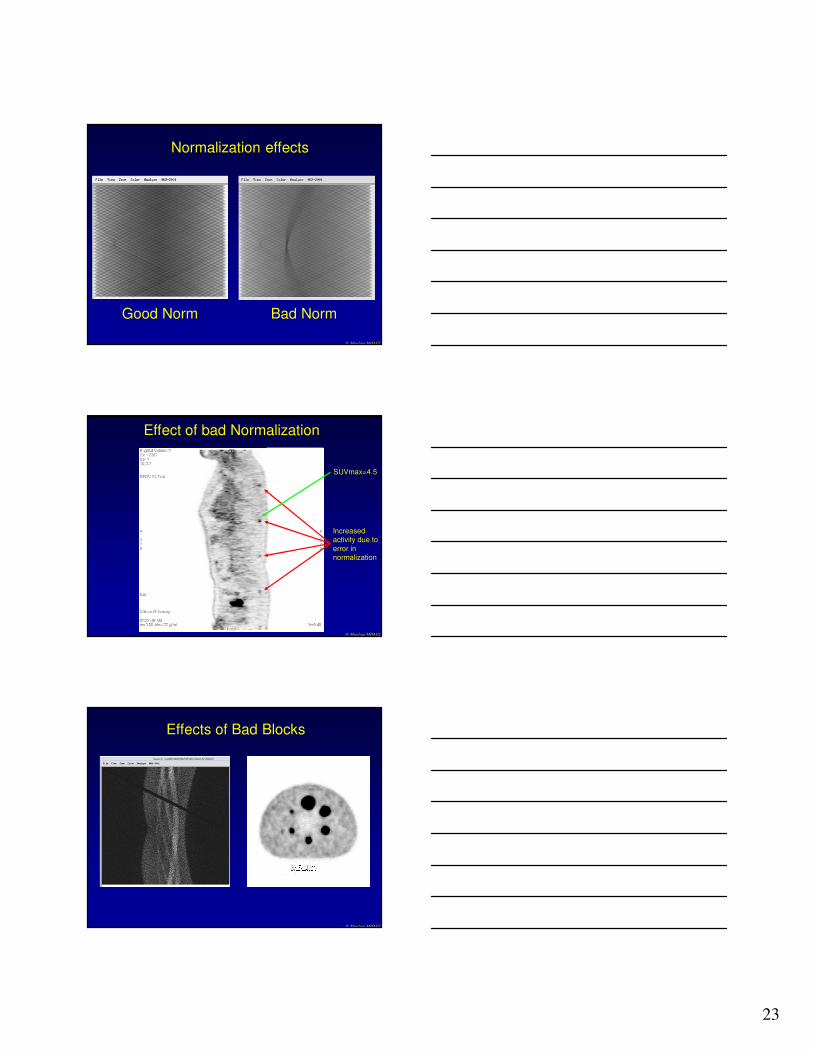
Normalization effects
Good Norm Bad Norm
O. Mawlawi MDACC
Effect of bad Normalization
Increased activity due to
error in normalization
SUVmax=4.5
O. Mawlawi MDACC
Effects of Bad Blocks
24
O. Mawlawi MDACC
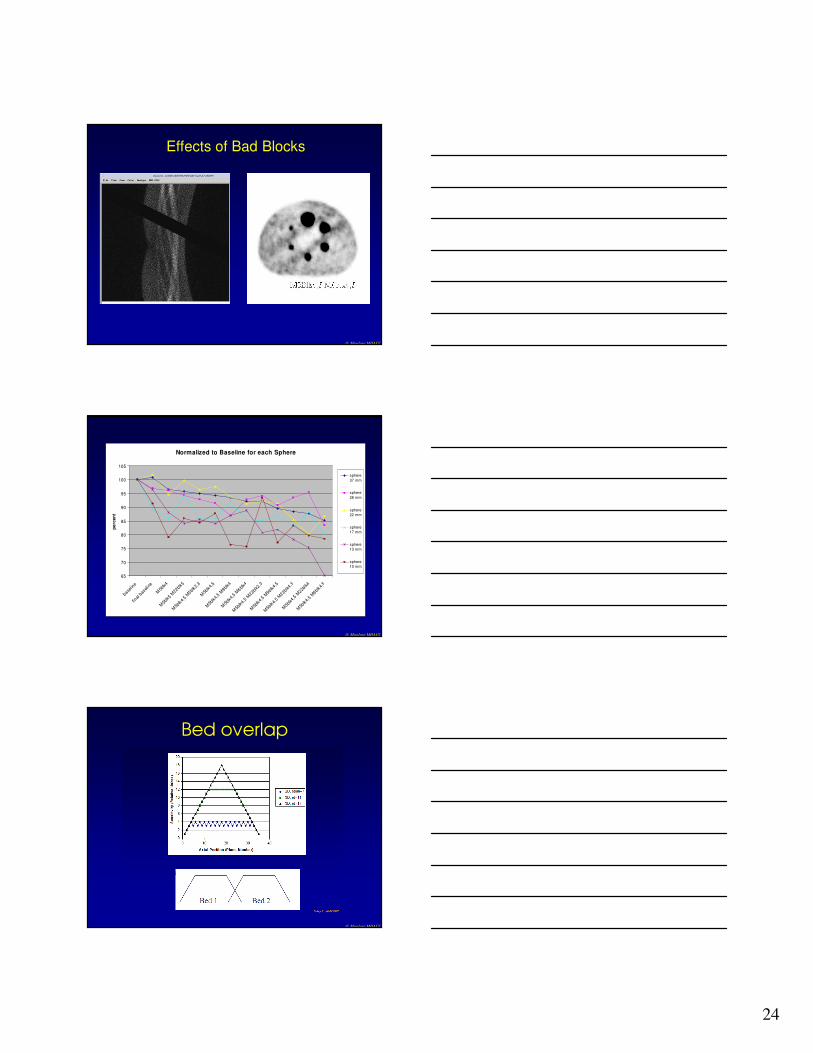
Effects of Bad Blocks
O. Mawlawi MDACC
Normalized to Baseline for each Sphere
65
70
75
80
85
90
95
100
105
base
l ine
final
bas
elin
e
M5b
lk4
M5b
lk5
M22
blk5
M5b
lk4,
5 M5bl
k2,3
M5b
lk4,
5
M5b
lk4,
5 M9bl
k4
M5b
lk4,
5 M6bl
k4
M5b
lk4,
5 M22b
lk2,3
M5b
lk4,
5 M9bl
k4,5
M5b
lk4,
5 M22b
lk4 ,5
M5b
lk4,
5 M22b
lk4
M5b
lk4,
5 M6bl
k4,5
pe
rce
nt
sphere
37 mm
sphere
28 mm
sphere
22 mm
sphere
17 mm
sphere
13 mm
sphere
10 mm
Bed overlap
O. Mawlawi MDACC
25
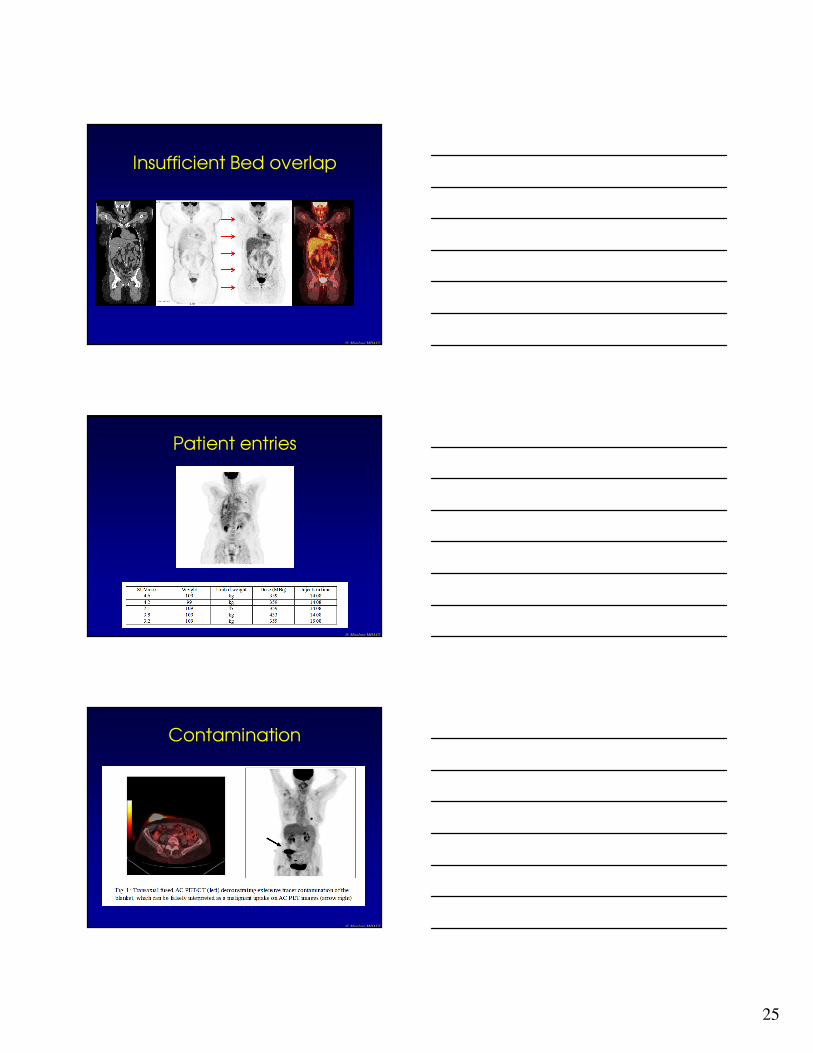
Insufficient Bed overlap
O. Mawlawi MDACC
Patient entries
O. Mawlawi MDACC
Contamination
O. Mawlawi MDACC

26
O. Mawlawi MDACC
Thank you