perspectives on the internationalisation of the new
TRANSCRIPT
Perspectives on the internationalisation of the New Zealand labour market A case study of roaming eggheads
NZ Trade Consortium working paper no 44
April 2006
The New Zealand Trade Consortium
in association with the
New Zealand Institute of Economic Research (Inc)


Preface
NZIER is a specialist consulting firm that uses applied economic research and analysis to provide a wide range of strategic advice to clients in the public and private sectors, throughout New Zealand and Australia, and further afield.
NZIER is also known for its long-established Quarterly Survey of Business Opinion and Quarterly Predictions.
Our aim is to be the premier centre of applied economic research in New Zealand. We pride ourselves on our reputation for independence and delivering quality analysis in the right form, and at the right time, for our clients. We ensure quality through teamwork on individual projects, critical review at internal seminars, and by peer review at various stages through a project by a senior staff member otherwise not involved in the project.
NZIER was established in 1958.
Authorship
This report has been prepared by Nicolas Weinhold and reviewed by Chris Nixon, Sarah Spring, and John Yeabsley.
8 Halswell St, Thorndon
P O Box 3479, Wellington
Tel: +64 4 472 1880
Fax: +64 4 472 1211
www.nzier.org.nz
NZIER’s standard terms of engagement for contract research can be found at www.nzier.org.nz.
While NZIER will use all reasonable endeavours in undertaking contract research and producing reports to ensure the information is as accurate as practicable, the Institute, its contributors, employees, and Board shall not be liable (whether in contract, tort (including negligence), equity or on any other basis) for any loss
or damage sustained by any person relying on such work whatever the cause of such loss or damage.


Executive Summary The New Zealand economy faces the possibility of growth constraints because of its small domestic market, reliance on biologically constrained industries, and large distances from potential trading partners. Migration can be a strategy to partially overcome these constraints by strengthening links with other economies and profiting from skills that are not readily available from the domestic labour market.
Migration, as a potential source of economic growth, has been aided by advances in technology and international trade policy, reducing the transaction costs that distance and other factors imposes on trade. The reduction in transaction costs offers opportunities for trade and migration that have not been feasible in the past.
Our focus is on migration, particularly temporary migration. The literature points to a substantial positive impact on the flows of capital, human capital, and goods and services, which could boost economic growth. However, concerns about the negative effects (e.g. increased competition for jobs and cultural conflict) need to be addressed by an appropriate immigration policy, which ensures that migrants’ skills complement the domestic labour force. Moreover, social cohesion is largely dependent on economic outcomes and successful integration mechanisms.
In the market for university professors, internationalisation has taken place. Employees that hold foreign qualifications make up about 40 per cent of the market. We identify the prerequisites for such an integrated market, as well as the non-transferable characteristics which are associated with the internationalisation of that labour market.
We conclude that the academic labour market is a special case (corner solution), exhibiting a large degree of mobility with high rates of foreign labour and temporary migration. Despite its unusual characteristics, it can be used as a benchmark to:
• Foreshadow the degree international labour markets will change as the result of continued globalisation; and
• Act as a pointer for policy making. This includes policy aimed at facilitating temporary migration and ensuring easier comparability of qualifications.
NZIER – Perspectives on the internationalisation of the New Zealand labour market i

Contents 1. Introduction...............................................................................................1
2. Shaping the global economy...................................................................2
2.1 Improved global communication… .........................................................2
2.2 …and transportation technology.............................................................2
2.3 Trade liberalisation .................................................................................3
3. The global integration of the New Zealand economy ............................4
3.1 Chances and challenges ........................................................................4
3.2 The goods market...................................................................................5
3.2.1 Policy vs. outcome measures ............................................................6
3.3 Service markets......................................................................................8
3.3.1 How services are traded ....................................................................9
3.4 Capital market ......................................................................................10
3.4.1 FDI restrictions.................................................................................10
3.4.2 FDI source countries........................................................................11
4. Integration of the labour market............................................................12
4.1 Economic impact of migration ..............................................................13
4.1.1 Labour market: wage levels and unemployment..............................14
4.2 Short and long term skill shortages ......................................................14
4.2.1 Trade links and migration ................................................................16
4.2.2 Fiscal impact....................................................................................17
4.2.3 Social cohesion................................................................................18
4.3 Migration in New Zealand: policy development and current practices .......................................................................................................18
5. Economic analysis of migration............................................................20
5.1 Modelling migrant behaviour ................................................................20
5.2 Brain drain, networks and return migration...........................................23
5.2.1 Incentive effect of emigration...........................................................23
5.2.2 The kiwi diaspora and return migration............................................23
5.2.3 The “New Paradigm” and temporary migrants .................................24
6. Case study: The academic labour market. ...........................................25
6.1 The demand for professors ..................................................................25
6.1.1 Professorial salaries ........................................................................27
NZIERPerspectives on the internationalisation of the New Zealand labour market ii

6.2 The supply of professors ......................................................................28
7. The data...................................................................................................29
8. Concluding remarks ...............................................................................35
9. References ..............................................................................................37
Appendices Appendix A : Trade indices............................................................................45
Figures Figure 1: Trends in average tariff rates for developing and industrial
countries.............................................................................................4
Figure 2: Foreign Direct Investment ..................................................................11
Figure 3: Foreign born residents .......................................................................13
Figure 4: Full professors in New Zealand..........................................................31
Figure 5: Short term positions ...........................................................................32
Figure 6: Transients by origin............................................................................32
Figure 7: Professors by times of observation ....................................................33
Figure 8: Hazard curve I....................................................................................34
Figure 9: Hazard curve II...................................................................................34
Figure 10: Origin of first degree of NZ professors .............................................35
Tables Table 1: Trade in goods ......................................................................................6
Table 2: Trade restrictiveness indices.................................................................8
Table 3: Comparison of academic salaries .......................................................27
Table 4: Trade Restrictiveness indices for selected countries ..........................45
NZIER – Perspectives on the internationalisation of the New Zealand labour market iii


1. Introduction What will the future of New Zealand’s labour market look like as a result of continued globalisation and how will this influence other parts of the economy.
To understand the current situation and attempt to develop a sustainable policy framework, we have to first clarify what we mean by globalisation. It is not a recent phenomenon. The rapid integration of national and international economies is almost two hundred years old, but suffered a severe setback during the world wars. There are two underlying causes for integration:
• Technological innovation, most notably in two areas, communication and transport. Cheaper and faster communication allows transactions to take place that would not have been feasible before; and
• The reduction of political trade barriers in the form of tariffs and other trade regulation.
Both of these affects have increased reliability and changed the flow of capital, goods, services, and labour in ways we could not have anticipated even a few years ago.
This paper focuses on an internationalised sector of the New Zealand labour market. It presents the market for university professors as an extreme case of international integration. This market represents a corner solution for integration, because of the transferability of the skills involved and the institutions that have arisen in the academic market that lower transaction costs to enable mobility. The significance of this corner solution becomes clear only when set against the background of the historical development of the New Zealand economy.
We will argue that the forces that shape the New Zealand economy will create conditions that are similar to those of the academic labour market. Understanding the academic labour market might prove useful in anticipating changes in the labour market in general and help identify strategies for business and policy makers to adapt to these changes.
NZIERPerspectives on the internationalisation of the New Zealand labour market 1

2. Shaping the global economy The drive behind global economic integration is a decline in transaction costs. The two reasons for this decline are technological innovation and political deregulation of markets.
Transaction costs are defined extremely broadly in this context as: the economic costs that are accumulated when trading with and migrating to other regions. This includes transport costs, collecting and evaluating information about alternative exchange/migrating options, of negotiating the conditions of exchange transactions and of monitoring and enforcing exchange contracts.
2.1 Improved global communication…
We mostly equate improvements in communications technology with the recent developments such as the internet and other computer applications. However, these developments disguise an incremental decline in information costs that has a far longer history; e.g., the transatlantic cable cut communication times between New York and Britain from ten days to one day (O’Rourke and Williamson 1999, p.219). Not only did this speed up transactions, but it created new opportunities as arbitrageurs took advantage of faster communication.
Today complex data, video, and text communication is almost instantaneous. Not only has the speed of communication risen, costs have also decreased dramatically. Since the 1930s, the cost of a three minute telephone call from the US to the UK has fallen by 99.9 per cent (Nees and Nixon 2005).
Many transactions that were unprofitable are now commercially viable. The same reasoning that applies to search and information costs also applies to monitoring. Establishing a commercial presence overseas is always risky partly because it is harder to control. However, improved inventory control, real-time, and cheaper communication can reduce that risk. Although the availability of information at little cost does not mean that processing it is easy to interpret. More information to be processed can put a significant risk burden on an institution, as the downfall of Barings Bank illustrates.
Consequently, the new technology creates a demand for interpreting information that focuses on technology such as firm networks and skilled labour such as researchers, marketing experts, and managers (Beardsley et al 2005).
2.2 …and transportation technology
The development of rail networks and steamboats were among the most prominent early innovations that gave momentum to the globalisation process. Suddenly transportation became widely available and less risky. Other innovations such as the arrival of refrigeration made possible transportation of perishable goods such as New Zealand butter and South American meat over large
NZIERPerspectives on the internationalisation of the New Zealand labour market 2

distances. The latest wave of innovations in transport have been the improvements in logistics that have mostly benefited the handling of shipped goods and the arrival of cheap personal air travel with the Boeing 747 (the “jumbo jet”) in 1969. These reductions in costs have made trade with much lower margins possible.
Early trade was mostly in luxuries, where comparative advantage was quite distinct and there were only a few producing regions. Countries with slight comparative disadvantages would still produce many goods, because trade was not an option, for example, even if the price of good A is 20 cents per unit lower in the UK than in France, importing it will be profitable only if transportation cost is lower than the difference in prices. Low transportation costs will lead to price convergence, which can be seen as a measurement of global integration (O’Rourke and Williamson 1999).1
Cheaper and faster transport of goods and persons allows trade on a larger scale than ever before. As with communication technology, recent advances are certainly impressive, but again, the decline in transportation costs is not a new phenomenon. In Britain, utilising waterways provided cost reductions of up to 75 per cent compared to roads in the 18th century, Girard (1966).
2.3 Trade liberalisation
Technological change can be regarded as the driving force of globalisation pre-WW1. After WW2, the importance of policy reform increased, though the different causes are difficult to untangle, (Baier and Bergstrand 2001). Political barriers to trade work exactly the same way as transportation costs. One can think of a tariff as an “artificial ocean” that has to be crossed by a good. Lowering tariffs therefore has the same effect as slashing transportation costs (see Figure 1).
As a consequence of these combined effects, the ratio of world trade to world GDP rose from about one tenth in the 1950s to one third in 2000, (Mussa 2000).
1 For a basic model of international trade with transportation costs showing how exchange opportunities
suddenly increase when transaction costs fall below price difference thresholds see Falvey (1976). Falvey shows that country A will only export a good if the price in county A plus transportation costs is less than the price in country B. If transportation costs are low, even small differences in price will lead to trade.
NZIERPerspectives on the internationalisation of the New Zealand labour market 3

Figure 1: Trends in average tariff rates for developing and industrial countries Data type 1981-2003 (unweighted in %)
0.0
5.0
10.0
15.0
20.0
25.0
30.0
1988 1989 1990 1991 1992 1993 1994 1995 1996 1997 1998 1999 2000 2001 2002 2003
High Income OECDs (9)
Developing Co (141)
New Zealand
Source: NZIER
Liberalisation has taken place not only in the regulation of goods, it also intensified streams of capital and labour, which are normally interdependent. As economic links are established, further opportunities for trade and interconnection emerge as more knowledge about trading partners, investment, and job opportunities become known.
3. The global integration of the New Zealand economy
3.1 Chances and challenges
Since transaction costs are at the heart of globalisation, potentially this could be of benefit to New Zealand. Size and location are a constraint on prosperity for New Zealand, but that constraint can be lifted to varying degrees, depending on the industry, by making the most of the opportunities that globalisation brings, (Skilling 2001).
Market size limits the level of specialisation and the availability of economies of scale (Stigler 1951). It can also limit the number of viable firms in a market and thereby reduce competitive pressures. International trade can improve these conditions, but some countries’ locations are better suited to trade than others. However, even with the cost of distance greatly reduced, only four million people live within a 2,200km radius of Wellington. For the capital of Finland, in some ways a comparable small economy, the same radius captures well over 300 million people (The Economist 2000).
NZIERPerspectives on the internationalisation of the New Zealand labour market 4

This has consequences for firm size, innovation, and investment into human capital. Skilling (2001) suggests that small size will lead to a shallow labour market, with disincentives to invest in highly specialised human capital and incentives to rely on more general sets of skills, i.e. becoming a general economist instead of becoming a labour economist.
Some commentators point to a lack of specialised managerial expertise and skill shortages in some areas as holding back the New Zealand economy (Deutsche Bank 2003). The same holds for firms that are too small to benefit from specialised inputs and may therefore forego opportunities to add margin to their products. Clustering might ameliorate the second problem, but integration could generate markets large enough to allow further specialisation. Lack of integration could worsen New Zealand’s comparative advantage relative to other economies and create a low productivity, low income equilibrium.
The equilibrium characteristics of the scenario that Skilling describes remain unproven, however, the argument that a small market might offer less room for growth of individual companies, and limits competition and specialisation; highlights a problem. Also, as long as factor markets are integrated, specialised inputs, skills as well as intermediate goods will be available to firms even in small markets.
How internationally integrated is the New Zealand economy? We know that globalisation has strengthened the economic links between countries, but we can also safely assume that countries have been affected to varying degrees. North Korea is significantly less well integrated into the global economy than Singapore. Where in that continuum do we place New Zealand? The economic reforms of the late 1980s have created the impression that New Zealand is a leader in terms of international integration. However, comparative statistics show that New Zealand is no more internationally integrated than the average within the OECD, (Plater and Claridge, 2000).
3.2 The goods market
Up until the 1960s, New Zealand’s role in the world trade was largely limited to supplying Britain with meat and dairy produce, while importing manufactured goods, mostly from the UK and Australia. The UK was the destination for 80 per cent of New Zealand exports. That share had fallen to 6 per cent in 1999, as New Zealand was forced, once the UK joined the EEC, to diversify both its trading partners and its range of exports, (Nixon and Yeablsey, 2002).
The assessment of the current integration of the New Zealand goods market depends on the countries one chooses as the basis of comparison. Comparing New Zealand with other high income countries, its level of integration seems quite high. Trade in goods to GDP increased by 30 per cent in 1986 to 45 per cent in 1996 and was at 44 per cent in 2003, a percentage consistently higher than the average of high income countries (see Table 1).
NZIERPerspectives on the internationalisation of the New Zealand labour market 5

Table 1: Trade in goods Trade in goods as a per cent of GDP for selected OECD countries
1986 1996 2000 2003 New Zealand 30 45 52 44 Australia 24 34 35 31 United Kingdom 33 46 44 39 United States 14 19 21 19 Finland 52 70 67 59 Sweden 62 87 67 61 Norway 68 80 57 48 Denmark 59 74 61 59 Ireland 87 122 136 95 Netherlands 87 102 122 109 Switzerland 67 90 67 61 Hong Kong 112 148 252 295 Singapore 191 316 298 298 High-income countries 27 39 40 37 World 21 29 42 41
Source: World Bank Development Indicators, NZIER
Compared to other small countries, such as Ireland, New Zealand’s share of trade in goods to GDP is much higher. On the other hand, Plater and Claridge (2000) report that import penetration, (the share of consumed goods that are imported): “New Zealand is more integrated with the world than is the case in most other OECD countries.” However, the OECD (2005) show that New Zealand was very close to the median in terms of import penetration, and again behind comparable small nations. This is not a strong result for New Zealand since you would expect smaller economies to trade more, as they specialise in a limited number of goods, and rely on their comparative advantage in these fields to obtain a wider range of goods, while larger countries can realise economies of scale and specialisation in more fields e.g. Singapore is noted for its trade in services.
3.2.1 Policy vs. outcome measures
Integration is a means to higher welfare through trade, so focusing on outcomes, such as trade ratios is justified. However, the meaning of these measures retains some ambiguity. High import penetration can be a symptom of a very open economy, but it can also imply imbalances in the exchange rate or uncompetitive domestic firms. Therefore, the economic “context” in which an economy is operating in is extremely important when prescribing a policy fix.
For example, Skilling (2005) examines outcome data, mostly relative to other small countries, and while Skilling’s results show New Zealand is falling behind in some measures, it provides little in the way of possible solutions, either for business or policy makers.
Just as crucial to the picture is to examine the conditions for integration, i.e. the policy environment so that trade can take place. There is a distinction between openness of an economy, pertaining to its policy setting, and integration,
NZIERPerspectives on the internationalisation of the New Zealand labour market 6

measuring its de facto involvement in the international division of labour2.This gives us different indicators of the openness of a society. A number of these indicators are available, for example, from the IMF, the World Bank, Freedom House and the Heritage Foundation. Of these, the World Bank Overall Trade Restrictiveness Index (OTRI) appears to be the most theoretically sound (Kee et al 2005). It estimates the level of tariffs that would be equivalent with the trade that is taking place under a country’s current scheme of tariffs, non-tariff and regulatory barriers. Table 2 shows a selection of available trade indices, the IMF index, the average of the most favoured nations (MFN) tariffs, the ORTI, the Heritage Foundation’s trade component of the Freedom index and the Cline TTE, (IMF 2005). These indices are provided for a wide selection of countries in Table 4, in Appendix A. It shows that rank ordering of openness for countries can differ significantly depending on the indicator.
2 Different terms and measures are used in the literature. A proxy for openness is usually some ratio of trade
to GDP, while the degree of internationalisation refers to interdependent cross-national flows of goods, services and factors (Lloyd & Williams 1996, p. 69).
NZIERPerspectives on the internationalisation of the New Zealand labour market 7

Table 2: Trade restrictiveness indices
Index Description Range Data intensive Problems
IMF-TRI Tariffs & NTBs scored & combined.
1 to 10. Low. V. rough guide, 75% of IMF regions rate as “1” or “2”
Simple average MFN Tariff
Average of all tariffs with equal weights.
n.a. Low. Unweighted tariffs neglect trade volumes. NTBs not included. Basis of other indices or comparison.
Cline TTE Average tariffs plus weighted NTB tariff equivalent.
n.a. Very high, to compute the tariff equivalent.
NTB data & disaggregated trade volumes available only for a small subset of countries.
World Bank OTRI
Estimation of the uniform tariff that would lead to the same real income as the tariffs and NTB in place.
n.a High. Data available only for a small subset of countries. Therefore not plans to produce regularly.
Freedom Index Import weighted average of tariffs is scored; NTBs increase the score by 1.
1 to 5. Low. Very simplistic.
Source: NZIER
3.3 Service markets
Services are becoming more and more important for the New Zealand economy, with the service sector accounting for 67 per cent of economic output in 2004. In 1960, the comparable figure was 50 per cent. It now employs 58 per cent of the male and 83 per cent of the female labour force (Stephenson & Ballingall 2004). In 2003, over one quarter of New Zealand’s export earnings came from trade in services, and as the service sector and trade in services continues to grow faster than other sectors, this share will probably increase further.
NZIERPerspectives on the internationalisation of the New Zealand labour market 8

3.3.1 How services are traded
International trade in services poses some conceptual and measurement problems that do not arise when dealing with trade in goods. Services are intangible and therefore not all are readily observable as crossing barriers and being evaluated at customs. To ease classification and direct data collection, the WTO General Agreement on Trade in Services (GATS) distinguishes four categories, or modes, based on the delivery of the service:
• Mode 1: Cross border supply: The service is produced in one country and crosses the border(s) to the country of the customer, where the service is transported either by electronic means, telecommunication or infrastructure. This mode includes reports made by consultants in other countries that are (e)mailed to a client, medical or legal opinion given on the phone and electronic lectures.
• Mode 2: Consumption abroad: the consumer crosses the border to the provider of the service, the prime example being tourism and education, where hotels and universities respectively provide services for residents of other countries. Other examples would be medical services, such as plastic surgery undergone in another country.
• Mode 3: Commercial presence: a company establishes a subsidiary in another country to provide a service there. Examples are consulting firms and banks with local branches in different countries.
• Mode 4 Movement of natural persons: individuals travel to another country to provide a service there without becoming permanent residents but living there temporarily.3
Because most of the available data on trade in services in New Zealand stems from the balance of payments statistics, which does not accurately identify and classify the trade (in particular, it is inaccurate in its distinction between modes 1 and 4 and very little coverage of mode 3 transactions, (Cave 2002), there are limits to what we can say about the detailed make-up of New Zealand trade in services.
Exports of New Zealand services have become more diverse in the last decade. While transport, travel and education exports still accounted for 79.8 per cent in 2003, that share is down from 85.4 per cent in 1995, with the shares of all other sectors increasing, with the exception of advertising and market research, which fell from 0.4 to 0.3 per cent. Service export destinations closely mirror those of trade in goods, though the share of services that goes to Asian countries is somewhat smaller than the share of goods, especially if tourism is neglected. This suggests that culture might have larger effect on trade in services than on trade in goods. Van Welsum (2003) argues that the intangibility of services implies higher uncertainty about their quality and the more frequent use of reputation as a signalling device. Assuming reputation and trust are more easily built up between
3 The definitions of temporary vary from country to country and the term is used in international agreements
to signify stays from 2 up to 5 years.(UNSTAT 2002)
NZIERPerspectives on the internationalisation of the New Zealand labour market 9

similar cultures, this would explain why services are less likely to be traded across cultures.
Barriers to services trade usually come from restrictions such as licensing, restrictions on people movement, and limits on capital investment. Due to the general competitiveness and relative absence of on-shore barriers to doing business, New Zealand’s service sector seems to be highly integrated, as indicated by the World Bank’s “Doing Business” survey, which ranks New Zealand first in 145 countries for business friendly legislation (http://www.doingbusiness.org). In the absence of more precise measures of openness to service trade that are distinct from capital and labour markets, this is the best indication of openness presently available.4
3.4 Capital market
While concern exists about the effects of capital mobility and foreign investment, including alleged balance of payments deficits, crowding out of domestic firms, and reduced employment and research, the widely accepted economic opinion is that inward FDI is largely beneficial (Graham and Krugman 1995), therefore governments have encouraged FDI. Not only does it allow firms to access more capital for expansion than may be available on the domestic market, it also allows overseas partners that can act as distributors in export markets or that possess useful technologies that will lead to closer cooperation and help overcome growth hurdles (Simmons 2005). This is particularly important for small and medium enterprises, since it lowers the entry barriers to overseas markets.
3.4.1 FDI restrictions
New Zealand has seen a rise in foreign investment; both inward and outward in the last decade (see Figure 2). At the end of the 2005 fiscal year, foreign investment in New Zealand was $224.1 billion, up $21.9 billion or 10.8 per cent from the previous year. (Statistics NZ 2005). Of that, about $77.2 million was foreign direct investment (FDI). According to Haigh (2005) it “reflects the objective by an entity resident in one economy of obtaining a lasting interest in an enterprise resident in another economy. This implies the existence of a long-term relationship between the two parties, and the ability to exercise a significant degree of control by the investor on the management of the enterprise”. He identifies four different types of investment: direct investment, portfolio investment, other investment, and financial derivatives.
When comparing New Zealand to other countries capital markets, a distinction between forms of investment emerges. While comparisons of single year figures might be misleading due to the high volatility of New Zealand FDI flows, the numbers indicate that with respect to FDI, New Zealand is attracting more direct investment than the world average and about as much as other developed
4 Although Mattoo et al (2003) suggests the best approach is to examine each industry in turn.
NZIERPerspectives on the internationalisation of the New Zealand labour market 10

countries. This is in contrast to Plater and Claridge, who judge that New Zealand barely reaches world levels of FDI.
Figure 2: Foreign Direct Investment FDI as percent of GDP, World, New Zealand and developed countries
0
1
2
3
4
5
6
7
1970
1971
1972
1973
1974
1975
1976
1977
1978
1979
1980
1981
1982
1983
1984
1985
1986
1987
1988
1989
1990
1991
1992
1993
1994
1995
1996
1997
1998
1999
2000
2001
2002
2003
World FDI inflows as percent of gdp
New Zealand FDI inflows as percent of gdp
Developed countries
Source: NZIER
With regard to FDI restrictions, the result of average inflows is somewhat surprising, given that the in an OECD study, (Golub 2003) ranks New Zealand 19th out of 28 countries, with a restrictiveness indicator well above the OECD average. One possible reason for high FDI levels is that the high restrictiveness index comes largely from the weight given to screening requirements (OECD 2005). While they imply an amount of compliance cost, it might be true that the U.S. State Department’s assessment is correct, that “[i]n practice, the OIC [Overseas Investment Commission] approval requirements have not been an obstacle for U.S. investors.” (US Dep. 2005). When disregarding the screening requirements, New Zealand improves its rank to 8th, based on restrictions of obtaining equity, movement of people, management and board requirements and input and operational restrictions.
3.4.2 FDI source countries
Two thirds of New Zealand’s FDI come from five countries. The biggest contributor is Australia, with $35.2 billion out of a $77.2 billion total in 20055, followed by the US with $9.2 billion, the Netherlands with $6.3 billion and the United Kingdom with $4.3 billion. Further large investment came from Japan ($1.6 billion), Germany ($1.3 billion), Singapore ($1.25 billion) and Canada ($1.1 billion) (Statistics New Zealand 2005b). Major investors are also major trading partners, suggesting strong bilateral links and as with trade, the spectrum of countries is reasonably diverse, which is important to lessen the impact of downturns in overseas economic cycles.
5 Year ending 31 March.
NZIERPerspectives on the internationalisation of the New Zealand labour market 11
4. Integration of the labour market
Labour market integration can also serve as a springboard for other factor flows. Migration between countries can lead to the “thickening” of other trade links, because business links rely on or are facilitated by personal contact (Benson-Rae & Rawlinson 2003). Migrants are not only “vessels” for labour, but they also have skills and contacts that can be put to the advantage of the receiving country, e.g. by creating “knowledge spill-overs” where some of the migrants’ skills will be picked up by the workers in the receiving country. On the other hand, the impact of migration on the host economy is difficult to establish (let alone measure) and there is concern that immigration will have adverse effects on the host population. This makes immigration highly politically contested as migrants are seen as direct competitors for jobs. There is also fear of crime, and more recently terrorism.
Plater and Claridge (2000) estimate the 1996 foreign born labour population as 18.8 per cent of the workforce. The data provided in Figure 3 refers to all foreign born residents. While not strictly comparable to the Plater and Claridge data it is still a good indicator of the foreign work force if we assume that no systematic difference in labour participation of foreign born residents and native New Zealanders exist. The high level of foreign residents is unusual. Considering the geographical isolation and the wage level, being close to the top of the OECD in terms of foreign population, suggests New Zealand is well connected to the world. However, it also raises the question why such an internationalised population does not translate into very high trade flows and suggests that there might be further potential of using that internationality as an asset.
NZIERPerspectives on the internationalisation of the New Zealand labour market 12

Figure 3: Foreign born residents Percentage of the population born in another country, selected countries
0 10 20 30 40
Luxembourg
Australia
Sw itzerland
New Zealand
Canada
Germany
Sw eden
United States
Austria
Belgium
Netherlands
Ireland
Greece
OECD
France(1)
United Kingdom
Norw ay
Portugal
Denmark
Spain
Czech Republic
Hungary
Finland
Slovak Republic
Poland
Turkey
Mexico
Percentage of total population2001/02
Foreign-born Residents
Source: Statistics New Zealand
4.1 Economic impact of migration
Immigrants tend to be more educated than New Zealanders and on average work in skilled professions. What is the impact of these immigrants on the economy? Migrants have diverse impacts on a receiving country; social, economic, environmental and cultural, and there is a large body of literature on each of these aspects. The most up-to-date New Zealand review on the impact of immigration is by Poot and Cochrane (2005), who summarise the international and New Zealand
NZIERPerspectives on the internationalisation of the New Zealand labour market 13

specific literature on immigration impact. We will use their classification of economic impacts and summarise the main points.
4.1.1 Labour market: wage levels and unemployment
One frequent concern is that immigration drives down wages and/or causes unemployment. The basic reasoning is that for a fixed demand for labour, increasing the supply will drive wages down and natives will be displaced by cheaper or better skilled immigrants. There is little New Zealand specific research to suggest this is occurring. Internationally, the broad consensus appears to be that “immigration is not detrimental to the host labour market or the economy generally”, Poot et al 2005, OECD (2003), Longhi et al (2004).
Borjas (2003) is one of the most fervent critics of this result and blames inappropriate econometric techniques for the findings. Borjas (2003) infers that there is a strong negative relationship between immigration and native workers earnings when making distinctions between different cohorts of immigrants. He argues that most researchers (particularly in the US) put too much stress on the examination of wage differences between cities with high and low levels of immigrants. As these cities are not closed economies, migration will have an impact on national wages. This complicates the issue, because then it is not clear what the appropriate comparison, should be. This is an on-going debate and no side has been able to make a completely convincing case yet. There are however, some points from the debate that shed light on the issue. One main area of disagreement stems from whether immigrant workers are complements or substitutes for native labour. “A key lesson of economic theory is that the labour market impact of immigration hinges crucially on how the skills of immigrants ought to be complemented to those of natives in the host country” (Borjas 1999).
In an economy which largely consists of low skilled workers, allowing the immigration of some skilled professionals potentially increases the productivity of the workers and may well increase their wages. Immigration of more unskilled human capital on the other hand will put pressure on wages, although the impact appears to be small. One of the challenges for an economically motivated immigration policy is therefore, to find ways to identify which skills complement the native human capital. Either a country can try and attract talent in general, on the assumption that educated or skilled people tend to do well in a competitive environment, are creative, and will add value in ways that cannot be foreseen or planned. Alternatively, policy makers can try and identify occupations where there is a short or long term labour shortage.
4.2 Short and long term skill shortages
Some occupations are temporarily in undersupply, but supply can be generated with relatively little opportunity cost and time. It would be surprising to find a country with a shortage of hairdressers or salesmen that lasted over years, because once identified, the price mechanism can remedy such shortages in the short term,
NZIERPerspectives on the internationalisation of the New Zealand labour market 14

attracting human capital to that occupation. The qualification to that is an outflow of specific professions where earning opportunities are higher overseas. This is especially acute in developing countries, where wages will not increase enough to keep employees in the country.
On the other extreme, training a brain surgeon can take about decade. Even when there is not an apparent shortage, having an adequate supply or being able to obtain the services of a suitably skilled person is a prudent policy.
Immigration policy is one of the main tools used to address the underlying problems of long and short term shortages. Short term shortages can be filled by temporary migration, such as seasonal workers schemes, while the imbalances of domestic labour demand and supply adjust. For occupations that require intensive training and heavy investment into human capital, migrants are often the only solution to overcome a shortage quickly. In these cases, the specific industry dictates which policies are appropriate. Some projects that require professionals are themselves temporary, such as building sites or film projects. Positions for medical staff, on the other hand, usually require more long term planning to fill. Immigrants can fill these positions without the receiving country having invested resources in training. This can be an important strategy when shortages appear to be strongly cyclical. Despite the difficulties in identifying occupations that face strongly cyclical demand, temporary work visas, in principle, allow countries to meet labour demand during expansion without over-investment in training and higher than necessary unemployment in the downturn, filling temporary gaps with foreign trained labour (DOL 2005).
The international competition for talent (Cervantes and Dominique 2002) does not only make recruitment of suitable migrants difficult, it can also worsen the problem because skilled New Zealanders leave the country. This “brain drain” has been widely discussed and mostly in a negative light.
Recent research highlights the positive aspects of the migration of the highly skilled. It is seldom permanent, so, in certain circumstances these people can be enticed to return. As with all skilled people, the skills and networks they have developed can be useful for the home country upon return, and, to a lesser extent, even while they are overseas, acting as examples for the sending countries’ skills and disseminating knowledge about possible trading partners. This leads to the realisation that there are dynamic forces which preclude us from knowing which qualifications will be beneficial in the medium term. Therefore, a policy that largely focuses on general skill levels, instead of selecting particular professions, is more likely to be more useful to policy makers. People who have gone through a demanding professional training program can be expected to do well in a new economic environment, not necessarily because the training they received is fully transferable to the new environment, but because they have a set of general skills and have proved that they are capable of picking up more specialised ones. This becomes especially important when the policy goal is improving entrepreneurial ability of the population, which is hard to define and encompasses a wide range of
NZIERPerspectives on the internationalisation of the New Zealand labour market 15

skills. The ability to pick up skills is possibly a good proxy in the absence of better indicators.
4.2.1 Trade links and migration
Many studies show that migration flows have an effect on trade (Girma and Yu 2000; Gould 1994; Head and Ries 1988; Ley and Tutchener 2001; Piperakis et al 2003; Rauch 1999; Rauch and Trindale 1999; Wagner et al. 2002). Generally, immigrants tend to increase imports from their sending country and exports to the sending country from the receiving country. The channels through which exports are increased are not clearly identified yet, as there are two possible ways immigrants can reduce transaction costs for trades. Firstly, by having a personal network of acquaintances and business contacts which can be used to build up trust and get importers and exporters directly into contact with each other. Secondly, immigrants have more general knowledge about their home market institutions, the language, initiating contact with trading partners, consumer tastes, and trade restrictions.
The two channels are not mutually exclusive, but will lead to different predictions about the marginal benefit of immigrants from diverse or similar countries. If personal networks are the primary channel, then we can expect that migration between countries with similar a cultural background will still lead to increases in trade and efficiency because appropriate contacts are facilitated. If cultural knowledge and language are of primary importance, then migration among similar countries will not lead to increases in the stock of knowledge about the other country and trade effects will be small.
Girma and Yu (2000) test this by comparing the impact of immigration on trade between the United Kingdom and Commonwealth as against non-Commonwealth countries. They find that a 10 per cent increase in the immigrant stock will increase exports to that country by 1.6 per cent in the short run and 5 per cent in the long run. Effects of immigration from Commonwealth countries, on the other hand, were not statistically significant. Therefore, they conclude that it is knowledge about culture and institutions that is important, not personal networks. When culture is sufficiently similar, migration has supposedly little effect on trade relations. However, a study by Combes, Lafourcade and Mayer (2003) found that there was a link between internal trade and internal migration for French regions, suggesting that personal relations and firm networks do have an impact, even where culture is not different.
For New Zealand, a recent study by Law et al (2004) examines links between trade and migration. They also survey the studies that examine immigrant activities in New Zealand and find that “migrants to New Zealand also use their backgrounds to facilitate international trade”. They confirm that immigration increases trade but remain cautious about the intensity of the effect.
NZIERPerspectives on the internationalisation of the New Zealand labour market 16

4.2.2 Fiscal impact
Another concern for policy makers and the public is the fiscal impact of immigration. Whether contributions to public finances of immigrants are positive or negative depends on the taxes they pay, the benefits, pensions and insurance payments they receive and the cost of public services they use, such as schooling. The contributions they make and the payment they receive are therefore related to their wages, labour participation, age, skill and length of stay. Because contributions might be positive at one stage, when migrants are in the labour force, and then turn negative after retirement, it is necessary to take a “lifestyle perspective” (Poot and Cochrane 2005) when estimating the fiscal impact migrants will have in the long term.
For New Zealand, migrants’ fiscal impacts have not been assessed on that basis. Instead, Nana et al (2003) have examined the impact of migrants for a given fiscal year. While, Nana et al’s findings have limits in the long term, they show that for the fiscal year 2002 not only did migrants have a positive net fiscal impact; their per capita impact was higher than that of a non migrant. Of all the sub groups examined, the only negative net impact was for the newly arrived Asian and Pacific Island migrants. However, this changes as migrants stay longer, and the aggregate economic impacts for migrants from all destinations are positive.
While life cycle estimations are not available for New Zealand, studies for Sweden (e.g. Gustafsson and Oesterberg 2001 and Storesletten 2002) show that, unsurprisingly, contributions are negative in early years, become positive during the working life, and revert to negative when pensions and increasing health benefits are received in old age. Net contribution remains positive, its size depending on the age of the immigrant. The groups of 20-30 year olds make the greatest contributions, because they have large parts of their working age still in front of them, but do not receive schooling and health services from the host country while younger.
a) Labour market outcomes of skilled migrants
An immigration policy that aims at letting in people who have good chances in the labour market and have a large part of their working life in front of them can be expected to make considerable contributions to the public purse. The contribution is higher the more effectively the skills of the migrants are utilised, avoiding unemployment and underemployment, for example, the archetypical taxi-driving PhD. In New Zealand, while unemployment for skilled migrants was about 9.2 per cent, for skilled migrants in 2001, the underemployment rate was 37.7 per cent, thus leaving considerable room for improvement. (Work and Income 2003).
b) Temporary vs permanent migration
Most studies concentrate on migrants that settle down in New Zealand. This might not be appropriate in the current environment where the economic significance of temporary migrants is increasing. Temporary migrants who come to New Zealand
NZIERPerspectives on the internationalisation of the New Zealand labour market 17

for a limited time, completing a project, doing seasonal work, switching between offices of international companies or taking limited contracts in various countries will have a much higher positive fiscal impact. Because their working permits require job offers, they are not unemployed, are usually highly skilled (but not always), and are unlikely to require medical care. They also do not receive pensions, therefore paying taxes while making very little demands in return.
4.2.3 Social cohesion
Residents and short term visitors to New Zealand with a wide range of languages and cultural backgrounds are an asset to the economy and add to the diversity of economic activity, widen cultural perspectives, and vibrancy.
Attached to that benefit is a cost. Cultural difference always entails a chance not only for learning and widening horizons, but also for conflict and misunderstanding. We have argued above that cultural differences make trade more difficult by increasing transaction costs. A similar argument applies to interactions that take place within a society that is made up of different cultures. Variations in past experiences and expectations can lead to subtle misunderstandings, but lack of integration and acceptance could ultimately lead to outbreaks of racial violence.
One of the policy goals and prerequisites of immigration is the achievement of social cohesion or integration. Spoonley et al. (2005) deal with the conceptual and measurement problems of both concepts. They stress that cohesion requires demanding adjustments from both the host community and the immigrants. The degree to which both are expected to adopt can range from the Germanic “Leitkultur” (the leading/guiding culture) to a multicultural conception of society where different backgrounds co-exist.
Safeguarding the inclusion of immigrants requires deciding who and how many immigrants are allowed into the country. That decision is not only constrained by New Zealanders’ attitudes, these attitudes themselves will depend on sound and beneficial migration policy. Recent surveys indicate that the attitude towards migration is positive (Gendall 2004 and Ward & Masgoret 2004). However, other studies indicate that there is still discrimination against immigrants and ethnic minorities in the labour market, which is both a symptom and a possible cause for tension, as well as bad for businesses that overlook talent because of prejudice (Wilson et al. 2005).
4.3 Migration in New Zealand: policy development and current practices
Before the mid 1960s the majority of immigrants to New Zealand were of British and Irish origin, for whom a free entry policy and assisted migration programs existed. Lower transport costs and low unemployment led to a diversification of source countries during the 1970s and 1980s, during which occupational
NZIERPerspectives on the internationalisation of the New Zealand labour market 18

migration was opened for “non-traditional” source countries, especially the Pacific Islands. But a source country based immigration policy remained in place until the Immigration Act 1987 (Winkelmann 1999). The Act introduced a skills and business stream for immigrants with qualifications on an national priority occupations list, along with a family and a humanitarian stream. The first version of the points based system that is currently in place to regulate immigration was introduced by the Immigration Amendment Act 1991. The Act presented a major shift away from a preferred source country scheme and allowed for more diverse flows of immigrants both in terms of country of origin and qualification. Up to that point, immigration had been linked to occupations that were perceived to be in short supply on the labour market. The new system was geared at opening the country to persons with formal qualifications of any kind or “proven entrepreneurial ability” (Trlin and Kang 1992). Underlying the change of immigration policy was the “New Zealand experiment”. The transition from a highly regulated to a market orientated economy created the policy environment that was much more optimistic about the impact of skilled migrants. They were seen less as competition to native workers but more as complementary human capital that would foster growth.
The consequence was a surge in the inflow from the countries of Northeast Asia, who outnumbered the immigrants from the traditional source countries (Northern and Western Europe, the Pacific and North America) by nearly 3:2 (Bedford C 2003).
The optimism was short lived. Just four years after the introduction of the point system, public pressure had mounted to reduce immigration and the English language requirements were changed in October 1995. There are two possible reasons for the public’s discontent with immigration policy in the mid nineties. Firstly, a possible lack of consensus towards a more open immigration policy; as Parr (2000) writes “[T]he views of New Zealanders are not conducive to the population of New Zealanders becoming more diversified globally.”
Secondly, the public’s rejection of the increase in immigration may be a reaction to the shortcomings of the policy with regard to its intended goal. Winkelman and Winkelman (1998) found the positive impact of immigrants on the economy to be not as large as had been hoped for. Morrison (2003), concluded that the lack of sufficient information about the New Zealand labour market and “the protective practices of existing professional groups” were a major contributing factor to this response.
As a result, the net immigration target was set at 10,000 permanent and long term migrants (PLT) per annum, although net migration as a policy goal seems difficult to attain because of the unpredictability of immigration numbers. In 1999, the pendulum had swung back again towards increased levels of migration. This time, under the Growth and Innovation Framework (GIF), immigration was on the rise again. However, by 2003 most arrivals were not PLTs, but temporary workers (66,827) or students (87,838), compared to only 48,538 residence approvals. This
NZIERPerspectives on the internationalisation of the New Zealand labour market 19

reflects a change in wider range of available immigration policy instruments, the introduction of new visa categories for non permanent immigrants, such as working holiday schemes and increasing efforts to work with business and local authorities to attract migrants to fill skill shortages. Bedford (2006) identifies this shift as a move from targeted to outcome oriented policy.
Despite the positive impact or migration on several industries (e.g. the booming Auckland building industry) the public mood slowly turned against migration again. When trying to evaluate the impact of migration policy, the reluctance of New Zealanders to accept large surges of immigrants has to be kept in mind at least as a short term constraint on migration. In the medium term, it would be worth to consider strategies of tackling that constraint to realise the full potential of migrants and or devising strategies that reduce the wave affect by eliminating the peaks and troughs associated with public discontent.
The current policy allows for a number of short term working permits for special events, students who wish to work in New Zealand as part of their overseas degree, or for migrants with offers of employment. Exempted from the need to produce an offer of employment are those with skills that are perceived to be in very short supply, for example, at the time of writing this included Japanese interpreters and Thai chefs. Migrants with needed skills also have better chances in gaining residency under the skilled employment branch. This centrepiece of the regulation of labour migration uses the points system. Points are awarded for age, skill level, work experience or offer of employment and family ties. Bonus points are awarded if the skills pertain to an area that is deemed especially relevant, for example, if the offer of employment is outside of Auckland or if work experience is in a “growth sector”. For a detailed description see Department of Labour (2005)6.
5. Economic analysis of migration
5.1 Modelling migrant behaviour
What do we expect New Zealand’s labour market to look like in 20 years? From 1981 to 2001 the foreign born population of New Zealand increased from 452,000 to 727,000, from 14.4 per cent to 19.4 per cent of the population. Has foreign population peaked or will the upwards trend continue? If so, what are the consequences and policy responses? Given the increasing global economic links, it is reasonable to expect that numbers of migrants will increase. It is hard to say how fast and what the magnitude of the increase will be, but given the impact of migration on host countries, and especially on New Zealand as a relatively small and open country, shedding even a little light on this issue is certainly extremely valuable. If workers were perfectly mobile, formed no ties in their countries of residence, and language and culture were not an entry barrier, populations would
2 http://www.immigration.govt.nz/NR/rdonlyres/4DAD508D-CC26-425A-A57B-D2AF557C8510/0/1003June8.pdf
NZIERPerspectives on the internationalisation of the New Zealand labour market 20

mix and we could expect that each country would have large proportions of foreign populations, as natives disperse around the globe and foreigners from all over the globe come to replace them. That would lead to a projection of a share of foreign born New Zealand residents of
WnzF −= 1 (1)
where: F is the share of the foreign born population; nz is the population of New Zealand; and W the world population.
Such a simplistic model is incomplete and leads to unrealistic conclusions. Migration does not take place in a frictionless world. Even with reduction in the cost of migration there are considerable barriers to migration that induce most people to stay in the country where they are born. For example, only 10 per cent of citizens born in New Zealand speak more than one language (Bryant and Law 2004), limiting the potential for migration significantly.
Hatton and Williamson (2003) have put forward a simple migration model where the decision to migrate from country h to country f is modelled as:
0,, >−−−= czwwd iihifi (2)
where:
di is the individuals decision to migrate. wf,i and Wh,i are the earnings rate in the foreign and the home country, respectively,
zi is a vector of factors in favour of the home country not related to earnings, such as family ties and c is the direct cost of migration.
If di is positive, then there is something to be gained from migrating, i.e. expected earnings are higher than opportunity costs. The model treats the migration decision like any other factor employment decision. Labour moves where returns are highest. Wages can be defined as a function of the individual’s skill level, and country characteristics introduced to further specify the decision function (Borjas 1987).
The second strand of the literature developed out of the gravity model in physics:
221
dmmGF = (3)
where:
G is a constant,
M1 the mass of object 1 and d the distance between the objects.
NZIERPerspectives on the internationalisation of the New Zealand labour market 21
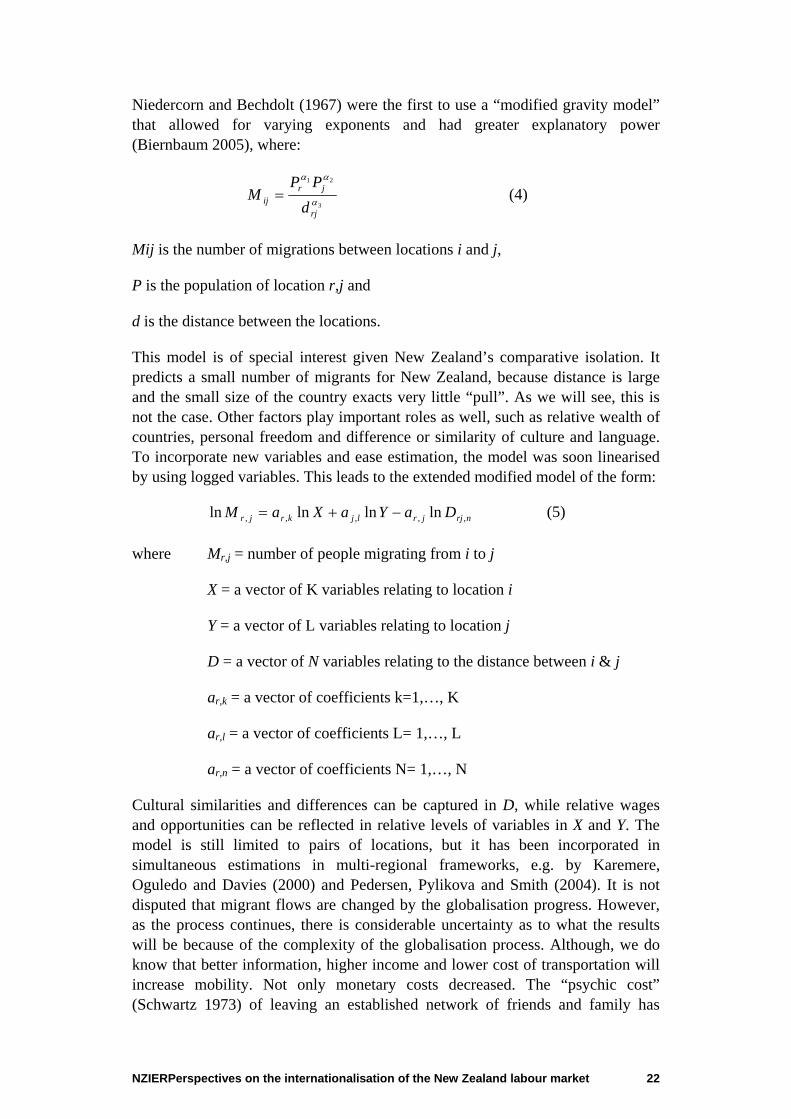
Niedercorn and Bechdolt (1967) were the first to use a “modified gravity model” that allowed for varying exponents and had greater explanatory power (Biernbaum 2005), where:
3
21
α
αα
rj
jrij d
PPM = (4)
Mij is the number of migrations between locations i and j,
P is the population of location r,j and
d is the distance between the locations.
This model is of special interest given New Zealand’s comparative isolation. It predicts a small number of migrants for New Zealand, because distance is large and the small size of the country exacts very little “pull”. As we will see, this is not the case. Other factors play important roles as well, such as relative wealth of countries, personal freedom and difference or similarity of culture and language. To incorporate new variables and ease estimation, the model was soon linearised by using logged variables. This leads to the extended modified model of the form:
nrjjrljkrjr DaYaXaM ,,,,, lnlnlnln −+= (5)
where Mr,j = number of people migrating from i to j
X = a vector of K variables relating to location i
Y = a vector of L variables relating to location j
D = a vector of N variables relating to the distance between i & j
ar,k = a vector of coefficients k=1,…, K
ar,l = a vector of coefficients L= 1,…, L
ar,n = a vector of coefficients N= 1,…, N
Cultural similarities and differences can be captured in D, while relative wages and opportunities can be reflected in relative levels of variables in X and Y. The model is still limited to pairs of locations, but it has been incorporated in simultaneous estimations in multi-regional frameworks, e.g. by Karemere, Oguledo and Davies (2000) and Pedersen, Pylikova and Smith (2004). It is not disputed that migrant flows are changed by the globalisation progress. However, as the process continues, there is considerable uncertainty as to what the results will be because of the complexity of the globalisation process. Although, we do know that better information, higher income and lower cost of transportation will increase mobility. Not only monetary costs decreased. The “psychic cost” (Schwartz 1973) of leaving an established network of friends and family has
NZIERPerspectives on the internationalisation of the New Zealand labour market 22

certainly been reduced first by cheap phone lines, but even more by email, instant messaging and even widely available video conferences. People can keep in touch, and temporary and permanent movement can be predicted to rise. This will influence the stock of migrants in countries, but also the flows, both inward and outward.
5.2 Brain drain, networks and return migration
Higher mobility increases choices and opportunities for the migrant. Talent will be able to go where the rewards are highest, and as a result economic efficiency will increase. The downside is that whenever a country receives talented people another loses them. This has caused concern for a long time, that poor countries with low wages will be drained of their most educated people, who present a rare and valuable resource (Bhagwati and Hamada, 1974).
This impact is not occurring in developing countries, e.g., in Canada, a net importer of migrants, there is concern about people moving to better paying jobs in the United States (De Voretz 1999). Similar concern has been voiced in New Zealand, (Sceats 1987 in Inkson et al 2004). While it is true that more New Zealanders leave the country than enter, it is more than compensated by the inflow from foreigners, whose qualifications are even higher than those who leave (Chow and Glass 2002). Two other important factors are also seldom acknowledged. The first is the incentive effect of possible immigration, and the second is the asset a foreign based population might be, especially if immigration is not permanent.
5.2.1 Incentive effect of emigration
There is a relatively new but growing literature on the “beneficial brain drain” (Beine et al 2001). If people make decisions about investment in their human capital in order to maximise wellbeing (usually closely related to income) they will invest more in their skills and education if they expect higher income from it. If other countries offer high wages then the possibility of immigration will increase expected wages, and lead to a higher skilled labour force. As only a fraction of such workers will emigrate, especially if jobs in the overseas country are highly competitive, the outflow of talent could be smaller that the skills increase due to the possibility of leaving. The result is a new equilibrium at a higher skill level. While it is not clear whether this is the case for New Zealand, the incentive effect is worth further consideration.
5.2.2 The kiwi diaspora and return migration
The majority of New Zealanders who leave the country do not plan to leave permanently (Inkson et al. 2004). Strong ties are maintained even if the length of stay overseas is considerable. Mostly, it is family ties and the perception of New Zealand for lifestyle reasons that exert a “pull” to remain/return, just as salaries and career opportunities keep them away (push).
NZIERPerspectives on the internationalisation of the New Zealand labour market 23

An overseas based population has positive aspects. Saxenian (2002) gives the example of Asian migrants in the Silicon Valley, who link the host and receiving country, increasing trade, investment and creating new opportunities for both sides (see section 4). Migration in this context is not a zero sum game. A country will lose some of its workers to other countries, but that also creates links and associated opportunities for both countries, if close links with the foreign based population can be maintained.
5.2.3 The “New Paradigm” and temporary migrants
Immigrants are not always permanently “lost” to the source country, just as immigrants will not always become permanent residents. The decision to migrate is not a life and death decision anymore. When people left Europe for America in the 19th century, and earlier, it was often a permanent decision – a one way ticket. Travel cost, time taken, political upheaval, and danger associated with travel were major obstacles to returning. Today, the real cost of travel is cheap and people can fly from Europe to New Zealand in under two days. Communication technology makes it easy to maintain links with friends, family, and colleagues in many different places, which is important for finding out about job opportunities. (Calvo-Armengol and Jackson 2004).
As trade in goods, services, and investment increase the role of business migration becomes more important. The nature of business migration is often temporary from a matter of days for attending a conference, to several years for a university education. Hugo (1999) argues, the drivers of migration have changed, even if we still have a limited understanding of how. Nixon (2005) points out, official data shows no significant increase in the number of temporary migrants, and effects vary for regions and industries. Further understanding of the impact of temporary migration on New Zealand requires looking beyond the official statistics and examining each industry in detail.
As an example, we have examined the academic labour. We hypothesise that migrant flows differ with respect to professions, and that some professions are more international. As more and more professions, especially those in the service sector, have access to international labour pools, we expect that institutions will evolve that help mobility along and reduce transaction costs further. As a result, we expect that there will be substantial temporary migration in sectors that have had continued exposure to international labour markets.
The links within academia have always been strong and the field can be regarded as “globalised” almost since the first academic expeditions from Athens to Constantinople. The necessary academic skills are easily transferable from one country to another and universities are used to visitors and staff from different backgrounds and have developed institutions to accommodate them. Understanding these institutions and the dynamics of the academic labour market will be helpful in anticipating and helping along internationalisation of other
NZIERPerspectives on the internationalisation of the New Zealand labour market 24

segments of the labour market, the degree to which foreign labour is employed, and the magnitude of temporary migration.
6. Case study: The academic labour market. The hypothesis is that the market for full university professors is an international one, both in terms of demand and supply.
The academic sector has a long tradition of international mobility. Skills are transferable and transparency is very high due to both formally accepted qualifications and highly developed information networks that signal quality.
Some of the characteristics of the internationalisation of the academic labour market are transferable to other labour markets (e.g. information networks) and can give useful recommendations for policy or business initiatives (Siow 1995). However, other demand side characteristics that shape the academic labour market and make it more international are unique and only adaptable to other areas to a limited degree. One such area is transferability of skills, which is more limited in other professions, where knowledge of local markets is usually more important.
Supply side issues may also be important. High level academics might differ from other employees in respect to what motivates them. While wage levels are an issue, most research suggests that it is not a driving force. Research environment and freedom might matter, as should quality of life and other non-monetary benefits of moving to New Zealand, such as lifestyle or the education system.
Specific requirements of professions are one constraint on internationalisation. Others include:
• the information constraint. Most support institutions that have arisen in academia are the result of learning curves. It will take time and a share of failures to find out which institutions are suited to fulfil that function in other professions; and
• public acceptance. Migration policy is even more contentious than trade policy. While foreign university professors tend to create little social tension, the existence of a social consensus for a certain level of foreign workers comparable to that in academic life is highly doubtful.
6.1 The demand for professors
To examine the demand for professors, we need to understand what a university does. James (1978, 1990) characterises the university as a multi-product firm, with teaching and research as its products.7 As in other industries, there is a trend towards specialisation, exemplified by the trend to distinguish between ‘research’ and ‘teaching’ universities.
7 We will ignore the sorting role of the university which consists in screening applicants for the labour market
which is valuable even if nothing is added to human capital of students, Weiss (1995).
NZIERPerspectives on the internationalisation of the New Zealand labour market 25

New Zealand, where education is one of the major exports, we tend to think of universities primarily as places where knowledge is sold to students, with research playing an auxiliary role. Clark (1997) points to the joint nature of the two products, where the quality of research improves the learning experience for the students. While this seems to be plausible at the doctorate level, a trade-off between research and teaching activity of professors must exist, at some point, which will plausibly negatively affect undergraduate teaching at low levels of research.
Professors will differ in both their research and their teaching ability. However, when hiring new professors, universities tend to concentrate on their research credentials, usually being satisfied with a minimum of teaching ability. (Burke, 1988. p. 74)
One reason for the reliance on research credentials, apart from a preference for research activity on the side of hiring faculty members, is that the institutions for reviewing and evaluating research quality and activity are much more developed than those for teaching assessment. Universities have to rely on these assessments as signalling devices, because of the nature of the good they sell. Students are usually not in a position to evaluate the quality of their university education and compare it with other programmes. This can change in time, making university education an “experience good” (Ackerberg 2003). To signal quality to prospective students and donators, they rely on the quality of their inputs instead (Rothschild and White 2003).
If a university wants to sell academic knowledge, the research record of its professors is a good selling point. As academic knowledge is international, as is the review system of refereed journals (with English as the main academic language), we expect there to be an international labour market for high level academics. Their qualifications come with a high level of comparability, with the doctorate being a perquisite for nearly all professors.
While there is a marked difference between a PhD awarded by Harvard and one awarded by a less known European university, the more reputed training institutions are universally recognised and there is usually a good estimation of the status of a less well known one. The top ranked universities are currently in the US and the UK, which produce more PhDs than they hire, so we expect a lot of the academics in the international market to come from these countries.
Two other reasons point to a large number of professors from English speaking countries in New Zealand. The first is the history of New Zealand as a Commonwealth country and member of the Association of Commonwealth Universities. Given the importance of reputation, and by extension, informal networks, there might be tendency to recruit from countries with a common institutional background. While some features of the organisation of universities, such as structures of seminars and lectures, sabbaticals and tenure are to a large degree international, some institutional arrangements differ. Franck and Opitz
NZIERPerspectives on the internationalisation of the New Zealand labour market 26

(2005) show for the US and Germany that the incentives for academic staff are very unequal, with the US system being a lot more competitive signalling quality more in terms of departments and universities than, as in the German system, at the level of the individual chair or professor.
6.1.1 Professorial salaries
While base salaries for professors in New Zealand are publicly available (http://www.aus.ac.nz/pay_conditions/academicsalaries.htm), comparisons with international salaries are difficult. A number of studies exist (see Metcalf et al. 2005 for an overview), but data is available only for a small subset of countries and very few private institutions, and differences in purchasing power and taxes provide a challenge (see Table 3). Metcalf et al’s own study puts New Zealand at the bottom of the list with gross salaries converted at official exchange rates as the basis of comparison.
Table 3: Comparison of academic salaries Average of academic salaries in 9 countries
Nominal Real
Gross salary
Wa/We
US 31,640 31,959 1.30
UK 29,183 29,183 1.60
Denmark 34,518 29,123 1.20
Canada1 24,458 28,860 1.22
Japan 34,358 25,079 1.31
Sweden 25,015 22,756 1.13
Australia 18,068 24,751 1.44
New Zealand 17,925 22,777 1.32
Net Salary
United Kingdom 19,605 19,605 1.59
France 16,749 19,475 1.44 Notes: (1) Nominal salaries are converted using the current exchange rate
(2) Data for Canada, France, UK, and US relate to both teaching and research staff in higher education. In other countries they refer to university lecturers and teaching staff only. (3) Real salaries are converted using PPP rates from OECD Main Economic indicators.
(4) Final column (Wa/We ) refers to wages of academics relative to the rest of the economy.
Source: Metcalf et al. (2005) p71.
NZIERPerspectives on the internationalisation of the New Zealand labour market 27

Once exchange rates at purchasing power parity is taken into account, New Zealand overtakes Sweden and catches up to the UK, while losing ground to Canada.
There are large differences in the salary level of academics in different countries. Three possible interpretations are available to make sense of this. The first is differences in quality of life and taxation that might level the differences in compensation between the countries. Ong and Mitchell (2000) use the Economist’s ‘Places to live’ index and find that there is no inverse relation between quality of life and salary. The second explanation is that market imperfections allow wage differentials to persist. Universities in one country could form ‘internal labour markets’ where they are free to a certain degree to set wages because competition takes place only from within that pool. The data however, shows great international mobility of academics, so while some internal markets based on personal knowledge and proximity might exist, they are highly unlikely to explain the wage differentials. The third explanation is segmentation of the academic market. The high paying countries are also those with highly ranked universities. So it might be plausible that differences in reputation of universities, those who can attract highly talented individuals, explain wage differences.
6.2 The supply of professors
As noted, the most highly sought after professors will come from the highly prestigious graduate schools in the US and the UK. With the exception of the US, previous employment at an overseas university is universally regarded as an asset. As opposed to other professions, being somewhere else and taking part in another research environment is thought to open new horizons and provide a new angle to one’s research. Knowledge of the local market, on the other hand, is not as important, provided the overseas institution is of good enough repute. However, teaching at a university that has a low reputation, while simultaneously losing one’s touch with the “home base” might harm an academic’s career prospects (Siow 1995).
Attempts to signal the quality of an institution and the development of ties between departments and faculties are all instances of low transaction cost mechanisms. Personal knowledge of colleagues and the standards of refereed journals make assessing the quality of a potential addition to a faculty comparatively easy. The relevant formal qualifications for a senior position are clearly defined and international. This process, although in place a very long time, has been augmented by technological change. We therefore expect that some of the patterns that have evolved in the academic labour market to be transferable to the labour market as a whole.
NZIERPerspectives on the internationalisation of the New Zealand labour market 28

7. The data To obtain a consistent data set over time we have used the list of full university professors in the seven New Zealand universities that existed prior to 1960: University of Auckland, Canterbury University, Lincoln University (formerly Lincoln College), Otago University, Victoria University, Waikato University, and Massey University as they are listed in the Commonwealth Universities Yearbooks of the years 1960, 1965, 1970, 1975, 1980, 1985, 1990, 1995 and 2005. For the year 2000, the same information comes from the university calendars. This gives us a total of 3,600 observations.
Professors are listed by name and information includes the name of the subject or the academic unit they belong to, the year of their first employment with the university where this data is available (it is only provided in the calendars of Lincoln, Auckland, Otago and Massey) and the name of the New Zealand university they have been a professor at for each of the five observed years. Further, the country where the person has obtained their first university degree is identified where possible, with the data provided by the university yearbooks (disclosure is dependent on the professor, and some choose not to list their bachelor’s degrees, especially if they have more than one Masters’ degree, PhD or other Doctorates).
One problem is that we are examining the university records in five year intervals, a significant range of possible worlds can be represented by our data. A person identified as holding a position in one of the observed years could have held them for only one year or for up to nine years, e.g. from 1991 to 1999, while someone in the two observation groups could have held a position for only six years, e. g. 1990 to 1995.
Also, the data gives some impression of the time span professorial positions are held, the observation period of 45 years means that there is a bias toward classifying positions as more temporary than they really are, because positions that have been held before 1980 and have left shortly after, will be recorded as short time as well as positions that have been newly filled in 2000 or 2005 which will be held perhaps for a long period are grouped with positions that have only been held in 2005.
We are looking for two things from this data:
• the degree of mobility of researchers, which is reflected in the way positions are held for a short time only. Therefore, we will refer to the persons which have been observed as holding a professorial position exactly once as “transients”; and
• the pattern of “local” professors versus “foreigners”. For our purpose, locals are those who have completed their first degree at a New Zealand university, while everyone else is classified as a “foreigner.” While
NZIERPerspectives on the internationalisation of the New Zealand labour market 29

choosing the first completed degree as the relevant distinction appears somewhat arbitrary, it is defensible on the grounds that academics enter the labour market for academics in the country where they complete their degree and that the global labour market is segmented into these markets.
Still, it remains important to keep in mind that the distinction is not between New Zealand citizens and others. The group of “locals” will contain citizens of overseas countries. Similarly, New Zealand citizens educated in overseas universities will be in the “foreigners” group. In any case, the moment of mobility will be captured by the data, which is why we feel justified in using the distinctions made until better data is available.
The number of full professors has risen from 100 in 1960 to 383 in 1980 and reached 629 in 2005 (see Figure 4). New positions have been filled with more locals than foreigners between 1960 and 1980, resulting in 226 locals compared to 157 foreigners. That trend reversed after 1980.
The gap between locals and foreigner is narrowing with just 24 more locals than foreigners holding a position. The share of foreigners in the group of professors increased from 40 per cent in 1980 to 48 per cent in 2005. This compares to only 24 per cent of foreigners in the UK university sector8 (Metcalf et al 2005) and a New Zealand foreign born labour force of about 18 per cent (Statistics NZ).
8 Foreigners in Metcalf et al (2005) are classified by citizenship, as against our use of university degrees,
making comparisons of results difficult.
NZIERPerspectives on the internationalisation of the New Zealand labour market 30

Figure 4: Full professors in New Zealand Professorial positions held between 1960 and 2005
0
50
100
150
200
250
300
350
1960 1965 1970 1975 1980 1985 1990 1995 2000 2005
foreigners locals
Source: NZIER
Figure 5 shows the number of positions in each year that are filled with “transients”, both the absolute number and as a percentage of the positions that have been filled in the year. As expected, the numbers are especially high for the years 1960 and 2005, because of the edge effects. The especially high number for 2005 is due to the additional effect of an expanding university sector, i.e. over a hundred newly created positions. If these 119 are taken out, the number of transients is reduced from 263 to 144 or 28.2 per cent. If the data had not extended past 1980, the proportion of transients would have been 27.4 per cent.
NZIERPerspectives on the internationalisation of the New Zealand labour market 31

Figure 5: Short term positions Positions held for less than 5 years, 1960 to 2005
0
0.05
0.1
0.15
0.2
0.25
0.3
0.35
0.4
0.45
1960 1965 1970 1975 1980 1985 1990 1995 2000 2005
transient distribution
Source: NZIER
When we disaggregate the transients into locals and foreigners, we see that there is not a large difference between the two groups, with foreigners in the majority, but not overwhelmingly so (see Figure 6).
Figure 6: Transients by origin Positions held for less than 5 years, 1960 to 2005 by foreigners and locals
0
20
40
60
80
100
120
140
160
1960 1965 1970 1975 1980 1985 1990 1995 2000 2005
local transients
foreign transients
Source: NZIER
To compare mobility rates, we group professors by how often they are recorded in our dataset, distinguishing between locals and foreigners. The “one observation” group is the only one where there is a foreign majority. Partly, this could be explained by the recent inflow of foreigners during the expansion of the sector. Figure 7 shows that this effect is rather limited so there seems to be an underlying difference in behaviour, quite possibly due to higher mobility. To rule out other
NZIERPerspectives on the internationalisation of the New Zealand labour market 32

causes, more data would be needed, especially on age and on reasons for exiting the market. The phenomenon is certainly worthy of further attention.
Figure 7: Professors by times of observation
0
50
100
150
200
250
300
350
1 2 3 4 5 6 7 8 9 10
locals foreign
Source: NZIER
As for further indicators of mobility, Figures Figure 8 and Figure 9 show the hazard curves of the professors that have held posts in 1980 and 1990 respectively. They indicate that the yearly turnover rate for professors in New Zealand is about 9 per cent.
NZIERPerspectives on the internationalisation of the New Zealand labour market 33

Figure 8: Hazard curve I Professors at New Zealand universities that held positions in 1980
0
50
100
150
200
250
300
350
400
450
1980 1985 1990 1995 2000 2005
locals
foreigners
total
Source: NZIER
Figure 9: Hazard curve II Professors at New Zealand universities that held positions in 1990
0
50
100
150
200
250
300
350
400
450
1990 1995 2000 2005
LOCALS
FOREIGN
COMBINED
Source: NZIER
As to the make-up of the “foreign” group, Figure 10 shows that it is still dominated by researchers with their first degrees from UK universities, but their share, while still the largest, has been decreasing from 66 per cent of foreigners to 47 per cent over the last 25 years and largely been replaced by graduates from other English-speaking countries, especially the US. In 1980, professors in New Zealand held first degrees from 12 foreign countries. This number increased to 13 in 1985 and in 1990 to 17; in 1995 it surged to 22 in 2000 and peaked at 29 in 2005.
NZIERPerspectives on the internationalisation of the New Zealand labour market 34

Figure 10: Origin of first degree of NZ professors Percent of total professors with first degree from selected countries that year
-0.04
0.01
0.06
0.11
0.16
0.21
0.26
0.31
0.36
1960 1965 1970 1975 1980 1985 1990 1995 2000 2005
Australia
Canada
China
Germany
South Africa
UK
US
Source: NZIER
While their share has fallen from 92 per cent in 1980, English speaking countries still provided 88 per cent of the foreign graduates that were New Zealand professors in 2005, which is different from the makeup of the foreign born population in general (Law 2004b). One possible explanation is the prestige system which means that most candidates will come from the top world wide universities. Or, there is a preference for native English speakers even in academia, possibly because they are more appealing to native and non-native “consumers” of education services.
8. Concluding remarks The overall trend in the figures confirms our hypothesis. The share of foreigners is rising with the expansion of the New Zealand education sector, and there are a substantial number who do not stay on, even if we do not have enough data to track where they are going. The growth of education both as a way of forming human capital and as a major export commodity has been sustained by foreign trained academics. While, for reasons of transferability of human capital, this represents an extreme case of an internationally integrated labour market, it illustrates that a very high level of integration is achievable in principle and that the results can be very positive.
In other industries, inadequate English skills, a lack of local work experience and employers being unsure of foreign qualifications are major barriers for entry into the job market for foreigners (Benson Rea 1998). While it would be misleading to suggest that the same system of monitoring and networking that characterises the academic profession will emerge in the short term for a majority of other professions, it provides hints to the usefulness of these institutions. There might well be a comparative advantage in identifying these closely integrated sectors
NZIERPerspectives on the internationalisation of the New Zealand labour market 35

and use the institutions they have developed to reap the greatest benefit of the connections and human capital flows that are associated with these industries. A case in point would be the movie industry, where reputation networks and flexibility are on a comparable level to that with can be found in the academic sectors. Medicine would be another area, where the Cuban and Costa Rican experience shows how a small country can benefit greatly by exporting transferable skills. Further examples include insurance services in Mexico and audiovisual services in Thailand (Stephenson & Ballingall 2004).
Apart from identifying the existing sectors that show these characteristics, furthering the integration of New Zealand businesses by other means would seem to hold benefits. This means shifting the debate about immigration from a “brain drain” focus, that appears to be largely unproductive to a brain circulation (Saxenian 2002) focus, i.e. maximizing the benefits of both emigrants and immigrants.
Research needs to be focused on changes in migrants’ behaviour. University professors are usually on a permanent contract. Yet even in this profession, we identified roughly 7 per cent as temporary migrants. Faster moving professions, such as the film industry will display much less permanence, so the regulation of temporary migration and the needs of various priority industries should receive more attention.
While there is strong evidence that opening up the economy, including the labour market, will bring benefits, especially by enabling businesses to access specialised human capital and new markets, there are political constraints to opening the labour market, more so than in other markets.
Immigration can be perceived as a threat to social cohesion and harmful to labour market competition. Utilising the potential of migrants rests on a public consensus. We argue that much of what migrants have to offer is complementary to New Zealand human capital, not a substitute. Taking that offer up requires ways of regulating the flow of migrants to stop surges in migrants arriving. This will help with their acceptance by New Zealand society.
Also, the limits of what New Zealand can achieve with the tool of migration policy have to be kept in mind. Even with a relatively high standard of living, New Zealand faces strong competition for skilled labour. Incomes in New Zealand are typically much lower than those of possible competitors. If the desirability of skilled immigration, temporary or permanent should be accepted, policy cannot assume that New Zealand can take its pick of highly skilled, mobile and sought after migrants. It will have to develop strategies to attract them. Simplicity of migration regulation, especially for short term migrants, could be an essential part of such a strategy.
NZIERPerspectives on the internationalisation of the New Zealand labour market 36

9. References Ackerberg, Daniel A. 2003. Advertising, learning, and consumer choice in experience good markets: an empirical examination. International Economic Review 44, no.3: 1007-1040.
Baier, Scott L. & Jeffrey H. Bergstrand. 2001. The growth of world trade: Tariffs, transport costs, and income similarity. Journal of International Economics, 53(February): 1-27.
Bhagwati, Jagdish N., & Koichi Hamada. 1974. The brain drain, international Integration of markets for professionals and unemployment: A theoretical analysis. Journal of Development Economics 1, no.1 (June): 19-24.
Beardsley, Scott C., James M. Manyika, & Roger P. Roberts. 2005. The next revolution in interactions. McKinsey Quarterly Number 4.
Bedford, Charlotte. 2003. Skill shortages in New Zealand: Public and private sector responses. New Zealand Population Review 29 (2): 63-88.
Bedford, Richard. 2006. International migration and globalization: The transformation of New Zealand’s migration system in the mid-1980s. In Patman, Robert (ed.): Sovereignty under Siege: New Zealand and Globalization, (forthcoming).
Beine M., F. Docquier & H. Rapoport. 2001. Brain drain and economic growth: theory and evidence. Journal of Development Economics, 64, no. 1 (February): 275-289.
Benson-Rea, Maureen, Nigel Haworth & Stephen Rawlinson. 1998. The integration of highly skilled migrants into the labour market: Implications for New Zealand Business. Wellington: New Zealand Immigration Service.
Benson-Rea, Maureen & Stephen Rawlinson. 2003. Highly skilled and business migrants: Information processes and settlement outcomes. International Migration 2:59-79.
Biernbaum, Lee. 2005. Toward a common market in residency: International migration and regional integration. Final Proposal, University of Missouri, accessed from http://www.missouri.edu/~econprm/ec413f04/biernbaum_fp.pdf
Borjas, G.J. 1999a. The economic analysis of immigration. In Handbook of Labour Economics, Vol. 3A, O. Ashenfelter and D. Card (eds.), North Holland.
Borjas G.J. 2003. The Labor Demand Curve is Downward Sloping?" Quarterly Journal of Economics, 116, no. 4.
NZIERPerspectives on the internationalisation of the New Zealand labour market 37

Bryant J. & D. Law 2004. New Zealand’s Diaspora and Overseas-born Population. Treasury Working paper No. 04/13.
Burke, D. 1988. The New Academic Marketplace. New York: Greenwood.
Busse, M. 2003. Tariffs, transport costs and the WTO Doha round: The case of developing countries. Hamburg Institute of International Economics. Accessed January 2006 from: http://www.hwwa.de/PersHome/Busse_M/Tariffs,TransportCosts.pdf
Cave, W. 2002. Measuring international trade in services and new demands on the Family of Classifications. Paper prepared for the International Association of Official Statistics meeting, London, August. http://www.insee.fr/en/nom_def_met/colloques/voorburg/pdf/PWC_oecd.pdf
Calvo-Armengol, Antoni & Matthew O. Jackson. 2004. The Effects of social networks on employment and inequality. American Economic Review, 94, no.3 (June): 426-454.
Chow, W. K & H. Glass. 2002. Brain drain in New Zealand: Issues, evidence and implications. Agenda, 9 no.1: 65-82.
Cervantes, M & G. Dominique. 2002. The brain drain: old myths, new realities. OECD Observer (www.oecdobserver.com)
Clark, B.R. 1997. The modern integration of research activities with teaching and learning. Journal of Higher Education, 68(3): 241-255.
Combes, Pierre-Philippe, Miren Lafourcade & Thierry Mayer. 2004. The trade creating effects of business and social networks: Evidence from France. Accessed from http://www.univ-evry.fr/PagesHtml/laboratoires/Epee/EPEE/colloques/MirenLafourcade.pdf
Department of Labour. 2005. Briefing for incoming ministers. Wellington. Accessed from http://www.dol.govt.nz/publications/general/gen-incoming-ministers.asp
______________ 2005a. Overview of the findings from ten professional skill shortage assessment reports. Accessed from http://www.dol.govt.nz/PDFs/professional-report-overview.pdf
Deutsche Bank. 2003. The New Zealand economy and the growth debate. Accessed from http://www.knowledgewave.org.nz/forum_2003/background_reading/Knowledgewave2003.pdf
De Voretz, D. J. 1999. The brain drain is real and it costs us. Policy Options 20, no.7 (September):18–24.
NZIERPerspectives on the internationalisation of the New Zealand labour market 38
Education New Zealand. 2005. International Education Foreign Exchange Earnings 2004. Accessed from http://www.educationnz.org.nz/facts_stats/key_facts.html
Falvey, R. E. 1976. Transport costs in the pure theory of international trade. The Economic Journal 86(343):536-551.
Franck, E., & C. Opitz. 2003. Incentive structures for professors – A comparison of basic mechanisms in US and German Higher Education. University of Zurich Working Paper No. 16. Accessed from http://www.isu.unizh.ch/fuehrung/Dokumente/WorkingPaper/16full.pdf
Gendall, P. 2004. Attitudes to immigration in New Zealand. In New Directions, New Settlers, New Challenges – Building and Enhancing Communities. End-users Seminar. Wellington.
Girard, L. 1966. Transport. In H. J. Habbakuk & M. M. Postan (eds.), The Cambridge Economic History of Europe, Vol. 6: The Industrial Revolution and After: Incomes, Population and Technological Change. Cambridge: Cambridge University Press.
Girma, S. & Z. Yu. 2000. The link between immigration and trade: Evidence from the UK. Centre for Research on Globalization and Labour Markets, School of Economics, University of Nottingham.
Graham, E. M & P. R. Krugman. 1995. Foreign direct investment in the United States. Washington: Institute for International Economics.
Golub, S. 2003. Measures of restrictions on inward foreign direct investment in OECD countries. OECD Economics Department Working Papers, No. 357.
Gould, D. 1994. Immigration links to the home country: Empirical implications for U.S. bilateral trade flow. The Review of Economics and Statistics 76: 302-316.
Gustafsson, B. & T. Oesterberg. 2001. Immigrants and the public sector budget-accounting. Journal of Population Economics 14: 689-708.
Hatton, Timothy J. & Jeffrey G. Williamson. 2002. What fundamentals drive world migration? NBER Working Paper No. 9159.
Haigh, Matthey. 2005. Ultimate sources and destinations of New Zealand’s direct investment. Statistics New Zealand. Accessed from http://www.stats.govt.nz/NR/rdonlyres/DD17C599-5840-4FD4-A697-33FC69EF6F49/0/UltimateInvestorpaper.pdf
Head, K & J. Ries. 1998. Immigration and trade creation: Economic evidence from Canada. Canadian Journal of Economics 31: 47-62.
NZIERPerspectives on the internationalisation of the New Zealand labour market 39

Hugo, Graeme. 1999. A new paradigm of international migration in Australia. New Zealand Population Review 25:1-39.
IMF. 2005. Review of the IMF’s trade restrictiveness index (Background Paper to the Review of Fund Work on Trade) Prepared by the Policy Development and Review Department, http://www.imf.org/external/np/pp/eng/2005/021405r.pdf
Inkson, Kerr, Stuart Carr, Margot Edwards et al. 2004. From brain drain to talent flow: Views of kiwi expatriates. University of Auckland Business Review 6 (2).
James, E. 1978. Product mix and cost disaggregating: A reinterpretation of the economics of higher education. Journal of Human Resources 13: 157-186.
------------- 1990. Decision processes and priorities in higher education “In S. Honeack & E Collins (eds) The Economics of American Universities. Albany: SUNY Press
Karemera D., V. Oguledo & B. Davies. 2000. A gravity model analysis of international migration to North America. Applied Economics 32:1745-1755.
Law, David, John Bryant & Murat Genc. 2004. Trade and migration to New Zealand. New Zealand Treasury Working Paper 04/18. Accessed from http://www.treasury.govt.nz/workingpapers/2004/twp04-18.pdf
Ley, David & Judith Tutchener. 2001. Immigration, globalisation and house prices in Canada’s gateway cities. Housing Studies 16:199-223.
Lloyd P.J. & Lynne S Williams. (eds) 1996. International trade and migration in the APEC region. Australia: Oxford University Press.
Longhi S., P. Nijkamp & J. Poot. 2005. A Meta-Analytic Assessment of the Effect of Immigration on Wages. Journal of Economic Surveys 19(3): 451-477.
Mattoo, Aaditya, Randeep Tathindran & Arvind Subramanian. 2001. Measuring services trade liberalization and its impact on economic growth: An illustration. World Bank Policy Research Working Paper No. 2655.
Metcalf, Hilary, Heather Rolfe, Philip Stevens & Martin Weale. 2005. Recruitment and retention of academic staff in higher education. National Institute of Economic and Social Research, Research Report 658. Accessed from http://www.dfes.gov.uk/research/data/uploadfiles/RR658.pdf
Morrison, P. 2003, Globalisation and the New Zealand Labour market. The State, Economic Development and Ethnic co-existence in Malaysia and New Zealand. Proceedings from a Symposium on Economic Development Ethnicity. Victoria University of Wellington 7th and 8th February 2002. Published by CEDER, University of Malaysia.
NZIERPerspectives on the internationalisation of the New Zealand labour market 40

Mussa, M. 2000. Factors Driving Global Economic Integration. Presented in Jackson Hole Wyoming at a symposium sponsored by the Federal Reserve of Kansas City on “Global Opportunities and Challenges”, August 25 2000. Accessed from: http://www.imf.org/external/np/speeches/2000/082500.htm
Nana, Ganesh, Kel Sanderson & Mark Goodchild. 2003. The Fiscal Impact of Migrants to New Zealand. Wellington: New Zealand Immigration Service.
Nixon, Chris & John Yeablsey. 2002. New Zealand’s Trade Policy Odyssey. NZIER Research Monograph 68. Wellington: NZIER.
Nixon, C. 2005. Should I stay or should I go now? Temporary migration: a survey and questions for New Zealand. NZ Trade Consortium Working Paper NZTC No. 38.
Nees, C. & Nixon C. 2005. Trade, growth, and global connectivity in the New Zealand context. NZ Trade Consortium Working Paper NZTC No. 34.
New Zealand Herald. 2005. Second night of racial violence in Sydney http://www.nzherald.co.nz/location/story.cfm?l_id=15&objectid=10359743
OECD. 2003. Trends in International Migration, SOPEMI 2002. Paris, OECD.
_____ 2005. Structural Analysis Database. www.oecd.org
_____ 2005a. The benefits of liberalising product markets and reducing barriers to international trade and investment in the OECD. OECD Economics Department Working Papers, No. 463.
Ong, L.L. & J. D. Mitchell. 2000. Professors and Hamburgers: An international comparison of real academic salaries. Applied Economics 32: 869-76.
O’Rourke, H. Kein & Jeffrey G. Williamson. 2000. Globalization and History: The Evolution of a Nineteenth-Century Atlantic Economy. Cambridge, MA: MIT Press.
Parr, A. 2000. Immigration and New Zealand: from localism to globalism? New Zealand Sociology 15 no.2: 304-335.
Pedersen, Peder J., Mariola Pylikova & Nina Smith. 2004. Selection of network effects? Migration flows into 27 OECD countries 1989-2000. IZA Discussion Paper Number 1104.
Piperakis, Andromachi S., Chris Milner & Peter W. Wright. 2003. Immigration, trade costs and trade: Gravity evidence for Greece. Journal of Economic Integration 18: 750-62.
NZIERPerspectives on the internationalisation of the New Zealand labour market 41

Plater V. & M. Claridge. 2000. Facts about Economic Integration: How Integrated is New Zealand with the Rest of the World?, Treasury Working Paper 00/21.
Poot, Jacques & Bill Cochrane. 2005. Measuring the Economic Impact of Immigration: A Scoping Paper. Population Study Centre, Waikato University. Accessed from http://www.waikato.ac.nz/wfass/populationstudiescentre/docs/dp-48.pdf
Rauch, J. E. 1999. Networks versus markets in international trade. Journal of International Economics 48: 7-35.
Rauch, James & Vitor Trindale. 1999. Ethnic Chinese Networks in International Trade. NBER Working Paper No. 7189.
Rothshild, M. & L.J. White. 1995. The analytics of the pricing of higher education and other services in which the customers are inputs. Journal of Political Economics 103: 573-586.
Saxenian, Anna Lee. 2002. Brain circulation: How high skill immigration makes everyone better off. The Brookings Review 2 no.1: 28-31.
Schwartz, Aba. 1973. Interpreting the effect of distance on migration. Journal of Political Economy 81 no. 5:1153-1169.
Skilling, David. 2001. The Importance of Being Enormous: Towards and Understanding of the New Zealand Economy. New Zealand Treasury draft paper. Accessed from http://www.treasury.govt.nz/et/et-enorm-jul01.pdf
2005. Dancing with the stars? The international performance of the New Zealand Economy. The New Zealand Institute. Accessed from http://www.nzinstitute.org/Images/uploads/Dancing%20with%20the%20stars%20Full%20Report%20December%202005.pdf
Simmons, Geoff. 2002. Growing pains: New Zealand qualitative evidence on hurdles to exporting growth. New Zealand Treasury Working Paper 02/10.
Siow A. 1995. The organization of the market for professors. Working paper Department of Economics and Institute for Policy Analysis. University of Toronto.
Spoonley, Paul, Robin Peace, Andrew Butcher & Damian O’Neill. 2005. Social cohesion: A policy and indicator framework for assessing immigrant and host outcomes. Social Policy Journal of New Zealand 24: 85-110. .http://www.mosp.govt.nz/documents/publications/msd/journal/issue24/24-pages85-110.pdf
Statistics New Zealand. 2005a. Balance of Payments and International Investment Position (Additional Information on International Investment) (Year ended 31
NZIERPerspectives on the internationalisation of the New Zealand labour market 42

March 2005). Media Release, accessed from http://www2.stats.govt.nz/domino/external/pasfull/pasfull.nsf/e17092639373f80b4c2567ed0009410e/4c2567ef00247c6acc25708900105371?OpenDocument
______________2005b. Balance of Payments Data. Accessed from http://www.stats.govt.nz/NR/rdonlyres/F26E28C8-561A-4228-B3E0-73C37E841928/0/Countrybystocktable.xls
Stephenson, John & John Ballingall. 2004. International trade in services: A scoping study of services trade and estimates of benefits from services trade liberalization. Report to the Ministry of Foreign Affairs and Trade. Wellington: NZIER.
Stigler, George J. 1951. The division of labour is limited by the extent of the Market. Journal of Political Economy 59: 185-193.
Storesletten, Kjetil. 2002. Fiscal implication of immigration – A net present value calculation. Institute for International Economics Seminar Paper, Stockholm University. Accessed from http://www.iies.su.se/publications/seminarpapers/701.pdf
The Economist. 2000. Can the kiwi economy fly? Nov 30th 2000. Accessed from http://www.economist.com/displaystory.cfm?story_id=436371
Trlin, A.D. and J. Kang. 1992. The Business Immigration Policy and the Characteristics of Approved Hong Kong and Taiwanese Applicants, 1986-1988. In Trlin, A.D. and Spoonley, P. (eds) New Zealand and International Migration: A Digest and Bibliography Number 2, Palmerston North: Department of Sociology Massey University, 48-64.
United Nations Statistics Division. 2002. United Nations manual on statistics on international trade in services. Accessed from http://unstats.un.org/unsd/tradeserv/Papers/m86_english.pdf
U.S. Department of State. 2005. 2005 Investment Climate Statement – New Zealand. Accessed from http://www.state.gov/e/eb/ifd/2005/42095.htm
Van Welsum, Desiree. 2003. International trade in services: Issues and concepts. Economics Working Paper 04/03, Birkbeck College, London School of Economics, Mathematics and Statistics.
http://www.econ.bbk.ac.uk/wp/ewp/DvWTradeinservices.pdf
Wagner, Don, Keith Head & John Ries. 2002. Immigration and the trade of provinces. Scottish Journal of Political Economy 49: 507-27.
Ward, Colleen & Anne-Marie Masgoret. 2004. New Zealanders attitudes toward immigration and immigrants. In New Directions, New Settlers, New Challenges –
NZIERPerspectives on the internationalisation of the New Zealand labour market 43

Building and Enhancing Communities End-users Seminar. Wellington New Zealand.
Winkelmann, Rainer. 1999. Immigration: The New Zealand experience. IZA Discussion Paper No. 61 www.iza.org
Winkelman, Rainer and L. Winkelman. 1998. Immigrants in the New Zealand Labour Market: A study of their Outcomes. Wellington: Department of Labour.
Weiss, A. 1995. Human capital vs signalling explanations of wages. Journal of Economic Perspectives 9 no. 4: 133-154.
Work and Income New Zealand. 2003. Census 2001 Analysis. Auckland Central Regional Office.
NZIERPerspectives on the internationalisation of the New Zealand labour market 44

Appendix A : Trade indices
Table 4: Trade Restrictiveness indices for selected countries IMF-TRI1 Av. MFN Tariff1 Cline TTE WB-OTRI
New Zealand 1 3.2 14.8
Australia 1 4.2 12.7
Chile 1 5.9 14.2
Honduras 1 6.1 5.8
Papua New Guinea 1 8.3 11
Uruguay 2 11.4 27.9
Colombia 2 11.7 27.1 25.3
Iceland 4 3.1 6.3
Philippines 4 4.2 34.5
United States 4 5.1 10.3 10.7
Saudi Arabia 4 6 18.3
European Union 4 6.5 11 167
Canada 4 6.8 7.3 8.4
Japan 4 6.9 7 15.8
Norway 4 7.2 13.5
Russian Federation 5 11.1 23.8
South Africa 5 11.4 11.5
Sri Lanka 5 12 9.9
Turkey 5 12.7 15.1
China, PR of 5 12.7 15.1
Mexico 6 17.3 18 32
India 7 22.2 46.
Vietnam 9 16.5 48.2 Notes: (1) Most current year available
Source: NZIER, IMF 2005
NZIERPerspectives on the internationalisation of the New Zealand labour market 45