perspectives on the global crisis and opportunities for … consulting group... · 2009-09-29 ·...
TRANSCRIPT

Perspectives on the global crisis and opportunities for pulp in EuropeKirsten Lange, The Boston Consulting Group
17 September 2009

1Presentation Europulp-Utipulp-17Sep09-KL-if-MUN.ppt
Disclaimer
This document has been prepared for a presentation to Europulp and Utipulp on September 17 2009
Analyses have been based on public information and hypotheses fit at system level, but no access has been provided to entities' reserved information.
This deck has been prepared for an oral presentation. Therefore, it will be incomplete without the appropriate supplementary comments
This document contains The Boston Consulting Group's intellectual property resulting from the investments made in concept development and from the experience accumulated throughout other similar projects
The Intellectual Property Act bans any third party from accessing this document or mentioning it in the media without the relevant express authorization by BCG

2Presentation Europulp-Utipulp-17Sep09-KL-if-MUN.ppt
Agenda
The situation pre-crisis: dark clouds ahead
The crisis explained: in the middle of the storm
The implications for pulp players: mixed weather
New strategies for value creation: here comes the sun

3Presentation Europulp-Utipulp-17Sep09-KL-if-MUN.ppt
0,80,9
11,11,2
1,31,41,51,61,7
US-$/EUR
Europe under pressure – industry structure changing?
European supply (M tons)
Demand
Cost(€)
Price
Cost increases• Competition for raw
materials• Russian wood tariffs• Additional environmental
requirements
1 Low demand growth in coremarkets• Stagnant or declining in
some grades in WE• Despite improving operating
rates in some grades still over-capacities
2
Low-cost pulp supply (M tons)
"Natural" shifts incompetitiveness• Strong capacity growth of
low-cost fiber
Cost(€)
3 "Financial" shifts incompetitiveness• P&L effects• Trade flows
4
'99 '00 '01 '02 '03 '04 '05 '06 '07 0
50
100
150
200
250 Share index
Jan 04 Jan 06Jan 02 Jan 08
Sappi Stora Enso M-Real
UPM Holmen Norske Skog
MSCI WorldMSCIWorld Materials
Loss of financial flexibility formany players• Share price developments• Ratings• Debt/equity
5
4Presentation Europulp-Utipulp-17Sep09-KL-if-MUN.ppt
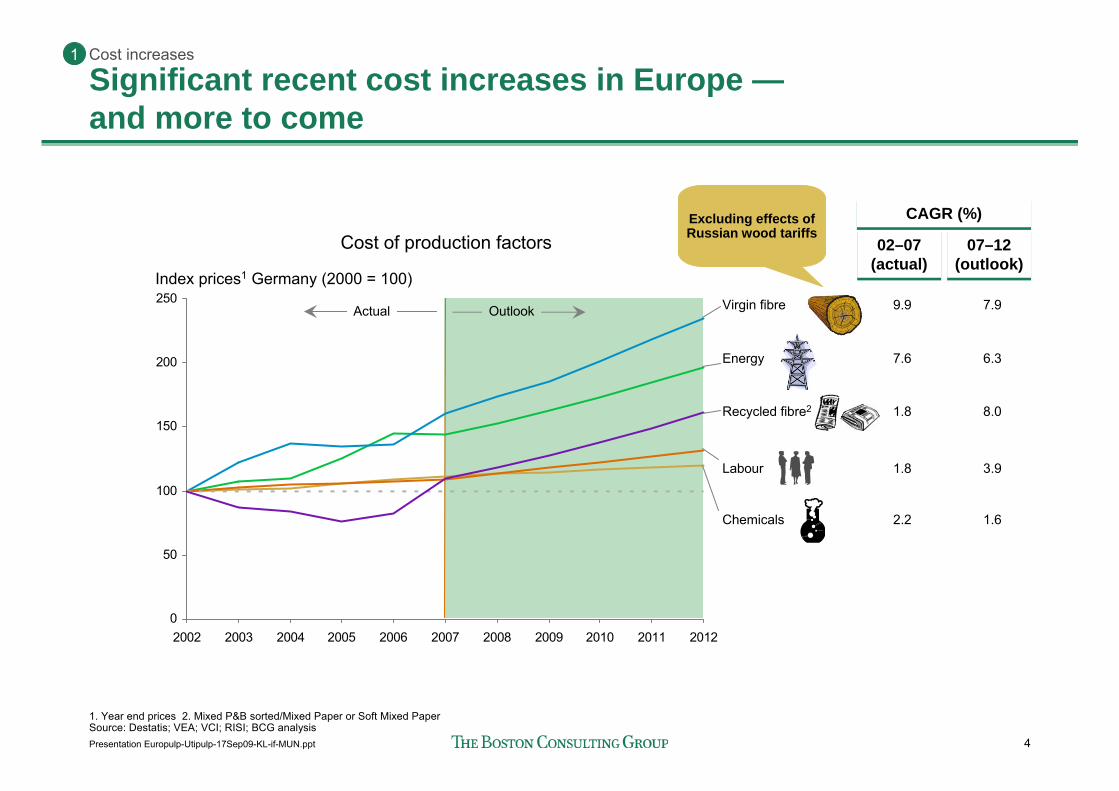
Index prices1 Germany (2000 = 100)
Significant recent cost increases in Europe —and more to come
Cost increases1
Cost of production factors
Actual Outlook
Energy
Virgin fibre
Labour
Recycled fibre2
Chemicals
0
50
100
150
200
250
2002 2003 2004 2005 2006 2007 2008 2009 2010 2011 2012
1. Year end prices 2. Mixed P&B sorted/Mixed Paper or Soft Mixed PaperSource: Destatis; VEA; VCI; RISI; BCG analysis
07–12 (outlook)
07–12 (outlook)
02–07 (actual)02–07
(actual)
7.6
9.9
1.8
1.8
2.2
6.3
7.9
3.9
8.0
1.6
CAGR (%)CAGR (%)Excluding effects of Russian wood tariffs
5Presentation Europulp-Utipulp-17Sep09-KL-if-MUN.ppt
1123
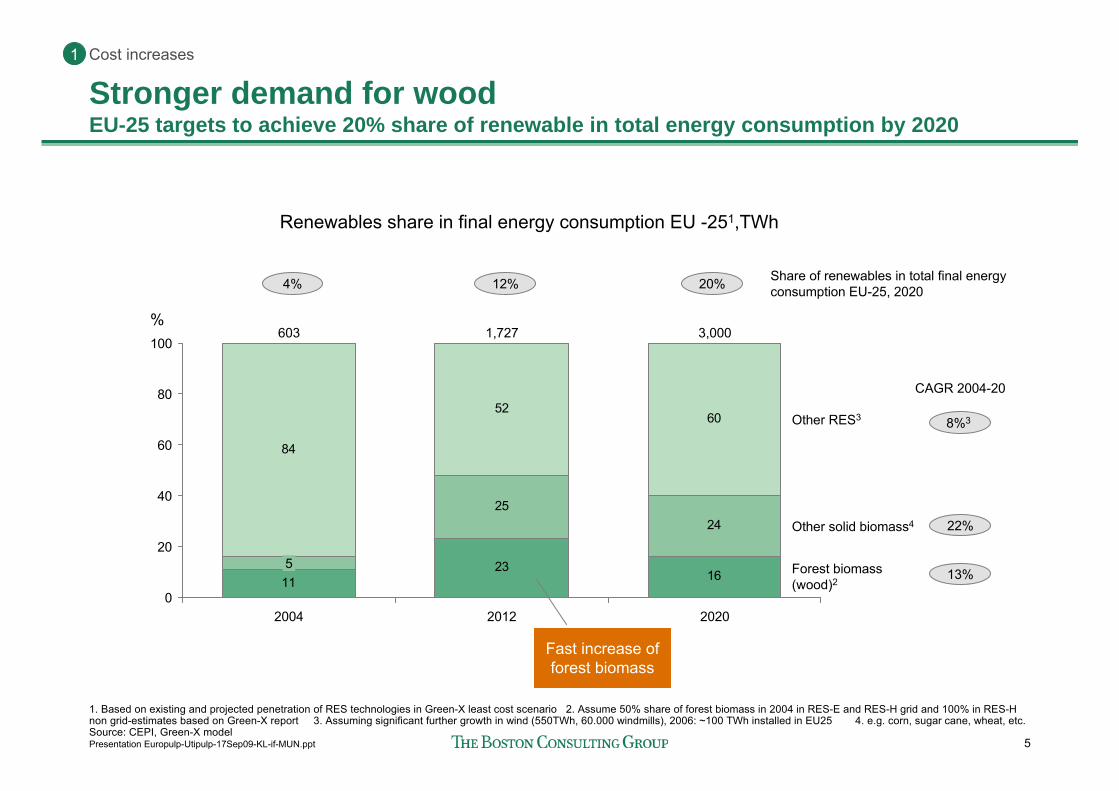
16
2524
84
5260
5
603
2004
1,727
2012
3,000
2020
Other RES3
Other solid biomass4
Forest biomass(wood)2
0
100
20
40
60
80
%
1. Based on existing and projected penetration of RES technologies in Green-X least cost scenario 2. Assume 50% share of forest biomass in 2004 in RES-E and RES-H grid and 100% in RES-H non grid-estimates based on Green-X report 3. Assuming significant further growth in wind (550TWh, 60.000 windmills), 2006: ~100 TWh installed in EU25 4. e.g. corn, sugar cane, wheat, etc.Source: CEPI, Green-X model
4% 12%
8%3
Share of renewables in total final energy consumption EU-25, 2020
Renewables share in final energy consumption EU -251,TWh
22%
13%
CAGR 2004-20
20%
Stronger demand for wood EU-25 targets to achieve 20% share of renewable in total energy consumption by 2020
Fast increase of forest biomass
Cost increases1
6Presentation Europulp-Utipulp-17Sep09-KL-if-MUN.ppt
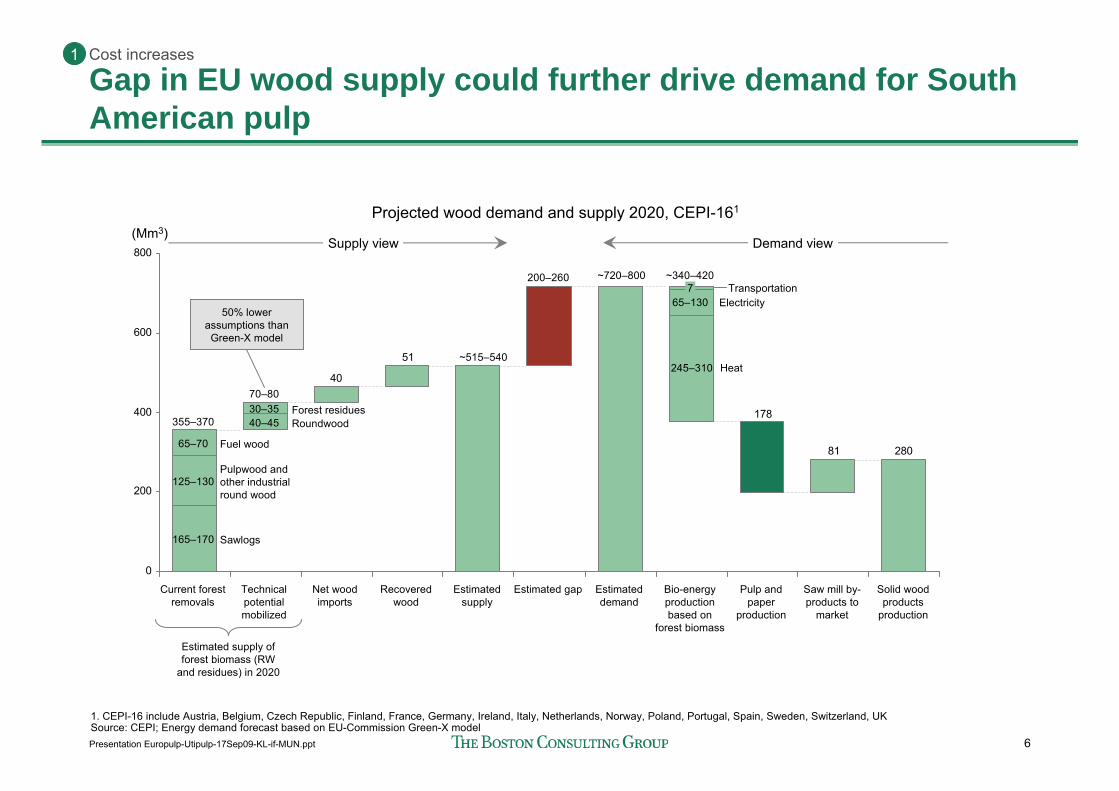
28081
178
51
40
0
200
400
600
800
Recovered wood
Estimated supply
200–260
Estimated gap Estimated demand
765–130
Bio-energy production based on
forest biomass
Pulp and paper
production
Saw mill by-products to
market
65–70
125–130
165–170
355–370
Current forest removals
30–3540–45
70–80
Technical potential mobilized
Net wood imports
Solid wood products
production
(Mm3)
Sawlogs
Pulpwood andother industrialround wood
Fuel wood
Roundwood
TransportationElectricity
Heat
Projected wood demand and supply 2020, CEPI-161
50% lower assumptions than Green-X model
Supply view Demand view
Gap in EU wood supply could further drive demand for South American pulp
1. CEPI-16 include Austria, Belgium, Czech Republic, Finland, France, Germany, Ireland, Italy, Netherlands, Norway, Poland, Portugal, Spain, Sweden, Switzerland, UKSource: CEPI; Energy demand forecast based on EU-Commission Green-X model
Forest residues
245–310
~720–800 ~340–420
Estimated supply of forest biomass (RW
and residues) in 2020
~515–540
Cost increases1

7Presentation Europulp-Utipulp-17Sep09-KL-if-MUN.ppt
Paper demand growth fuelled by Asia while WE/NA stagnates
2 Low demand growth
-4
0
4
8
12
16
CAGR 2004–15 (%)
China Eastern Europe
Other Asia
Latin America
Western Europe
NAFTA Japan Rest of theWorld
New China1
Ø4.8%Ø5.1%
Ø4.2%
Ø3.3%
Ø1.0%
Ø0.4%Ø0.2%
Ø3.4%
Ø9.0%
Carton boardTissue CoatedWoodfreeCorrugated Coated
MechanicalUncoatedWoodfree
UncoatedMechanicalNewsprint 10 M t Demand
2004
1. Mills with capacity > 50k tSource: Pöyry; BCG analysis
Are existing forecasts even too optimistic?Independent BCG research suggests even lower growth for WE/NA

8Presentation Europulp-Utipulp-17Sep09-KL-if-MUN.ppt
Pulp supply shifts significantly to low-cost countries and cost differential increases
3 Natural shifts
1. Portugal, Spain, France, Belgium, Sweden, Finland, Canada, USA 2. Brazil, Indonesia, South Africa, Russia, Chile (countries below global average production cost 2015) 3. Canada, USA, Germany, Sweden, Finland 4. Chile, Russia (countries below global average production cost 2015) 5. BHKP: 2006: Brazil versus Canada East — 2015: S Africa versus Spain; BSKP: 2006: Chile versus Canada East; 2015: Chile versus SwedenSource: Hawkins Wright; Pöyry; Valois Vision; BCG analysis
Low/high cost country capacity shareLow/high cost country capacity share Low/high cost country cost differentialLow/high cost country cost differential
61 81
39 19
0
50
100
2006 2015
High cost countries1
Low cost countries2
(%)
19 37
81 63
0
50
100
2006 2015
High cost countries3
Low cost countries4
(%)
308 250
612 499
0
400
800
2006 2015
+249+304
($/ton)
432 329
706 577
0
400
800 ($/ton)
2006 2015
+248+274
High cost country5Low cost country5
High cost country5Low cost country5
23 33
22 25
Globalcapacity (Mt)
Globalcapacity (Mt)
BHKP
BSKP
Shift more critical for integrated playersfrom high cost countries

9Presentation Europulp-Utipulp-17Sep09-KL-if-MUN.ppt
The impact of this might go beyond market pulp
BHKP market pulp supply scenarios (2015)BHKP market pulp supply scenarios (2015)
Base case:+10Mt
capacity2006-2015
High case:+17Mt
capacity 2006-2015
Brazil
800
0
400
13Mt
800
0Brazil
400
20MtLow cost capacities increase due to additional announced but unconfirmed capacity
Demand
49
Demand
40Mt
33Mt
US$
US$
Announced and confirmed capacityaccording to Hawkins Wright plus necessary extrapolations
Potential impactPotential impact
European (integrated) mills become uncompetitive
South American players currently with superior profitability and low cost fibre access
Some risk of flattening BHKP supply curve endangers margins (in high case) – depending on development of integrated European mills
Other growth option could be in paper: integrated mills to serve overseas market
Increasing commoditization and low transport costsmight facilitate process
Highest likelihood in fine paper (CWF, UCWF), less in packaging/tissue (which are more local)
Impact could go far beyond market pulp
Note: Prices including 10% rebatesSource: Hawkins Wright, Pöyry, RISI; BCG analysis
262
WENA
WENA
3 Natural shifts

10Presentation Europulp-Utipulp-17Sep09-KL-if-MUN.ppt
High value of Euro puts profit under pressure directly and indirectly
4 Financial shifts Backup
1. According to Stora Enso Annual Report 2007 2. Calculation before currency hedgesSource: BCG analysis, Stora Enso Annual Report 2007
0,8
0,9
1
1,1
1,2
1,3
1,4
1,5
1,6
1,7
31.1
2.19
99
31.1
2.20
00
31.1
2.20
01
31.1
2.20
02
31.1
2.20
03
31.1
2.20
04
31.1
2.20
05
31.1
2.20
06
31.1
2.20
07
US-$ / Euro
Ongoing strong Euro affects European players
Ongoing strong Euro affects European players
Direct P&L effects
Indirect effects on trade flows and competitiveness

11Presentation Europulp-Utipulp-17Sep09-KL-if-MUN.ppt
European share prices under pressure
5 Limited financial flexibility
1. Indexed since January 2005Source: Thomson Reuters; Broker reports; BCG analysis
Falling share pricesFalling share prices Polarization of European industryPolarization of European industry
0
50
100
150
200
250 Share index
Jan 04 Jan 06Jan 02 Jan 08
Sappi Stora Enso M-Real
UPM Holmen Norske Skog
MSCI WorldMSCIWorld Materials
Few strong players• Low D/E ratio• Recent restructurings/divestitures• Investors confidence• Waiting for best timing to buy
Many weak players• High D/E ratio• Mixed assets• Deteriorating debt rating• Hoping for fast consolidation
Backup

12Presentation Europulp-Utipulp-17Sep09-KL-if-MUN.ppt
-20
-15
-10
-5
0
5
10
15
20
1995 1996 1997 1998 1999 2000 2001 2002 2003 2004 2005 2006 2007 2008
SappiHolmen
Grupo Empr. Ence
UPM
Portucel
Iberpapel
Stora Enso
M-Real
Rottneros
ROIC (%)
As a result, many established companies have unsatisfactory profitability – they need to act
ROIC1 development
1. ROIC = (Net Income * (1-Tax Rate)) / Average of Last Year's and Current Year’s (Total Capital + Last Year's Short Term Debt & Current Portion of Long Term Debt) * 100Source: Thomson Reuters Datastream, BCG analysis
WACC range

13Presentation Europulp-Utipulp-17Sep09-KL-if-MUN.ppt
Potential impact: Changing market environmentOne scenario for 2015/2020
Pulp is mostly being supplied from South America and Russia• Many European integrated mills have shut down and pulp prices increase before they decrease again
The basics of competitive advantage have shifted from assets to resources• Access to low-cost fibre• Access to the right people/management skills
Players have restructered and consolidated significantly• Players have much clearer competitive advantage and are more focused on certain (customer) segments
(e.g. print vs. packaging or paper vs. conversion)• Market is clearly divided in commodity paper products (with no complexity) and speciality products
New (global) alliances have been built, but on a different logic than previous acquisitions• Not synergy-based• But on raw material access...• ... and new value chain splits
– between pulp production and paper production and marketing/sales– also between supplier and customers (as paper industry understood limited potential for passing on
price increases without further accelerating substitution)
But in between came the crisis ...

14Presentation Europulp-Utipulp-17Sep09-KL-if-MUN.ppt
Agenda
The situation pre-crisis: dark clouds ahead
The crisis explained: in the middle of the storm
The implications for pulp players: mixed weather
New strategies for value creation: here comes the sun
15Presentation Europulp-Utipulp-17Sep09-KL-if-MUN.ppt
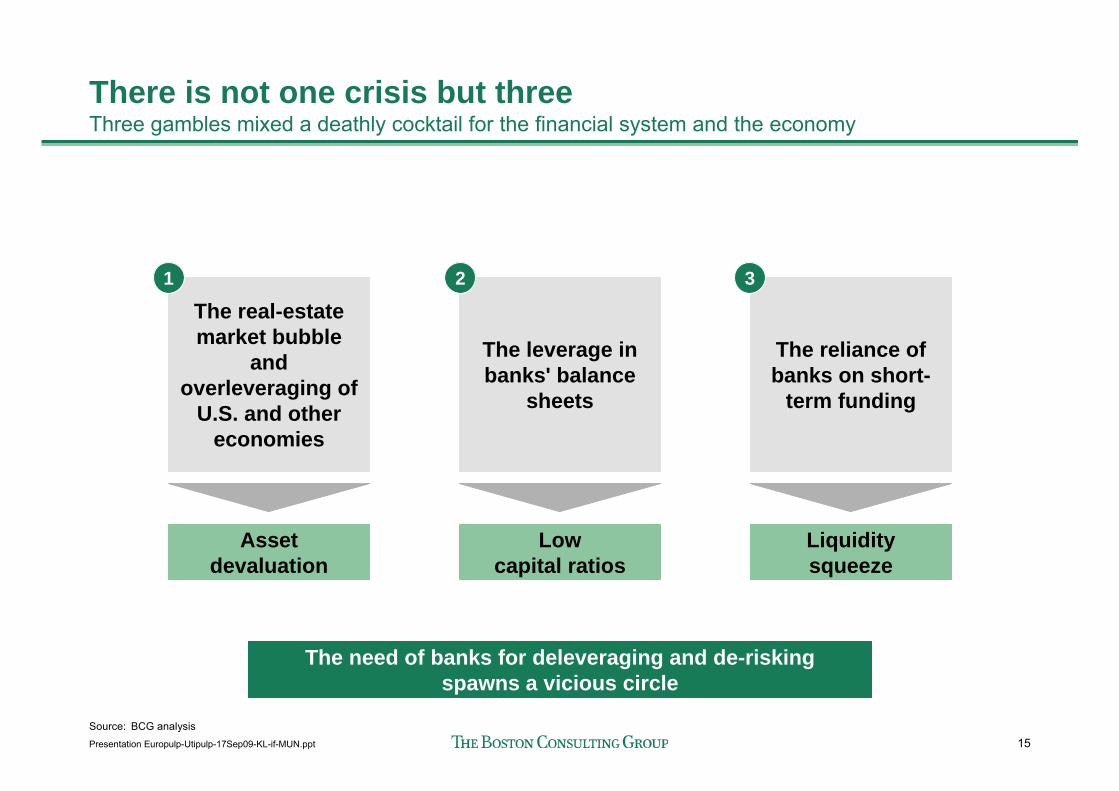
There is not one crisis but threeThree gambles mixed a deathly cocktail for the financial system and the economy
The need of banks for deleveraging and de-risking spawns a vicious circle
The real-estate market bubble
and overleveraging of
U.S. and other economies
Asset devaluation
The leverage in banks' balance
sheets
Low capital ratios
The reliance of banks on short-
term funding
Liquidity squeeze
1 2 3
Source: BCG analysis
16Presentation Europulp-Utipulp-17Sep09-KL-if-MUN.ppt
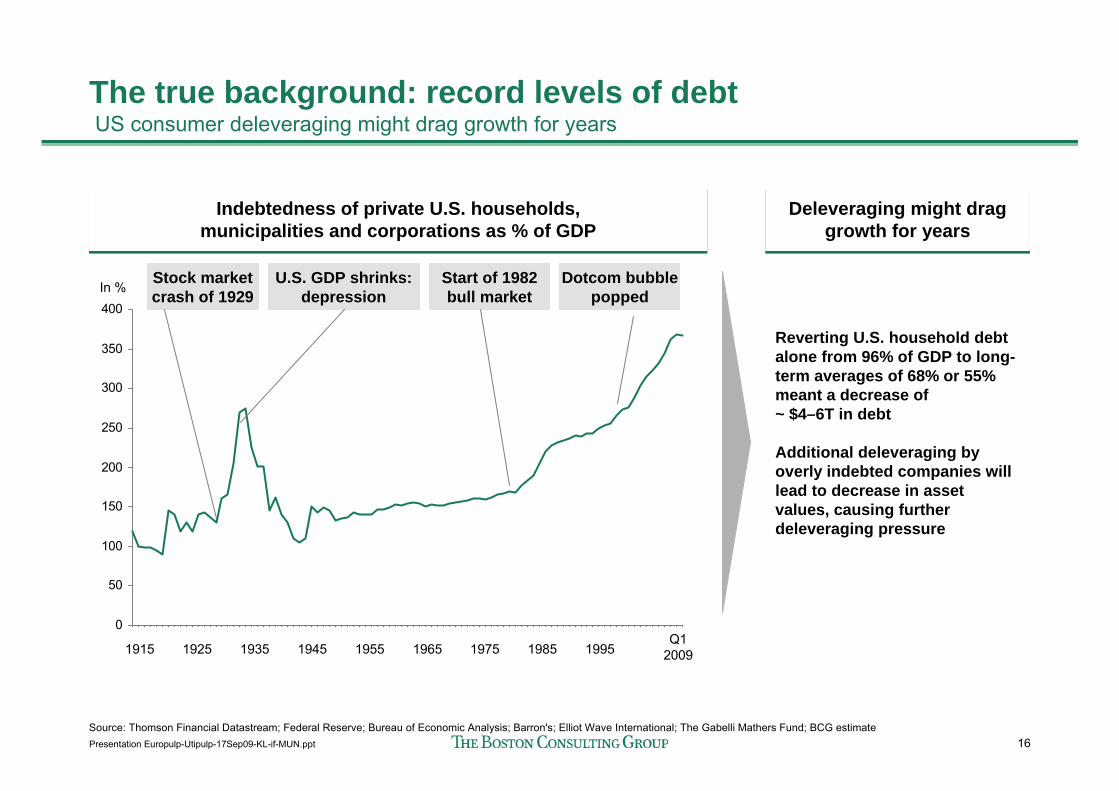
Source: Thomson Financial Datastream; Federal Reserve; Bureau of Economic Analysis; Barron's; Elliot Wave International; The Gabelli Mathers Fund; BCG estimate
The true background: record levels of debtUS consumer deleveraging might drag growth for years
Indebtedness of private U.S. households, municipalities and corporations as % of GDP
Indebtedness of private U.S. households, municipalities and corporations as % of GDP
0
50
100
150
200
250
300
350
400In %
1915Q1
20091925 1935 1945 1955 1965 1975 1985 1995
Stock marketcrash of 1929
U.S. GDP shrinks: depression
Start of 1982 bull market
Dotcom bubble popped
Reverting U.S. household debt alone from 96% of GDP to long-term averages of 68% or 55% meant a decrease of ~ $4–6T in debt
Additional deleveraging by overly indebted companies will lead to decrease in asset values, causing further deleveraging pressure
Deleveraging might drag growth for years
Deleveraging might drag growth for years
17Presentation Europulp-Utipulp-17Sep09-KL-if-MUN.ppt
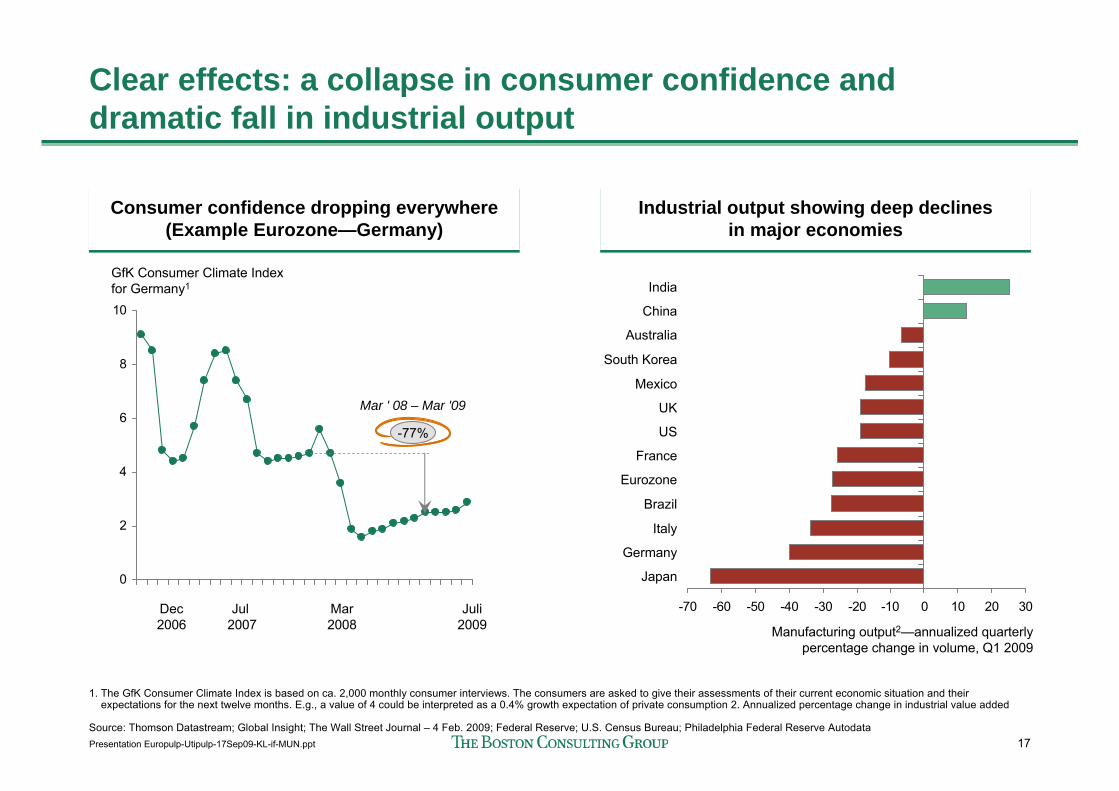
Clear effects: a collapse in consumer confidence and dramatic fall in industrial output
1. The GfK Consumer Climate Index is based on ca. 2,000 monthly consumer interviews. The consumers are asked to give their assessments of their current economic situation and theirexpectations for the next twelve months. E.g., a value of 4 could be interpreted as a 0.4% growth expectation of private consumption 2. Annualized percentage change in industrial value added
Source: Thomson Datastream; Global Insight; The Wall Street Journal – 4 Feb. 2009; Federal Reserve; U.S. Census Bureau; Philadelphia Federal Reserve Autodata
Consumer confidence dropping everywhere(Example Eurozone—Germany)
Consumer confidence dropping everywhere(Example Eurozone—Germany)
Industrial output showing deep declinesin major economies
Industrial output showing deep declinesin major economies
-70 -60 -50 -40 -30 -20 -10 0 10 20 30
Japan
Germany
Italy
Brazil
Eurozone
France
US
UK
Mexico
South Korea
Australia
China
India
Manufacturing output2—annualized quarterlypercentage change in volume, Q1 2009
0
2
4
6
8
10
GfK Consumer Climate Indexfor Germany1
-77%
Mar ' 08 – Mar '09
Dec 2006
Juli2009
Jul 2007
Mar2008

18Presentation Europulp-Utipulp-17Sep09-KL-if-MUN.ppt
Enough macroeconomic talk …If interested, please read BCG's "Collateral Damage" series
Source: www.bcg.com

19Presentation Europulp-Utipulp-17Sep09-KL-if-MUN.ppt
Agenda
The situation pre-crisis: dark clouds ahead
The crisis explained: in the middle of the storm
The implications for pulp players: mixed weather
New strategies for value creation: here comes the sun

20Presentation Europulp-Utipulp-17Sep09-KL-if-MUN.ppt
For P&P, we expect the impact of the downturn to be significant and longlasting
0
20
40
60
22.2
9.2
7.5
9.1
3.0
14.0
65.0
2005
23.0
9.6
8.9
9.4
3.1
14.5
68.4
2006
23.6
9.4
8.7
9.5
3.0
14.6
68.7
2007
22.9
9.3
8.4
9.3
2.9
14.5
67.3
2008
20.6
7.8
7.0
7.6
2.3
11.6
56.9
2009
21.0
7.9
7.1
7.8
2.4
11.8
58.0
2010
21.5
8.1
7.2
8.0
2.5
12.2
59.5
2011
22.0
8.3
7.2
-17%
2.6
12.7
61.2
2012
22.6
8.7
7.3
8.5
2.6
8.3
62.8
2013
Containerboard
Newsprint
UCWF
CWFMechanical uncoated
Mechanical coated
M t
13.1
Change 2007–2013Change 2007–2013
Level of confidence
-7%
-16%
-10%-12%
-10%
-4%
Additionally, economic slowdown accelerates shift in usage/buying behavior
Base case scenario• Growth between previous paper growth and GDP growth• Consumers partly change to electronic media

21Presentation Europulp-Utipulp-17Sep09-KL-if-MUN.ppt
1. Data from Jan 1, 2008–July 31, 2009Note: Total shareholder return (TSR) based on calendar year data (MSCI world industry indices and Dow Jones Total Market World Iron and Steel Index)Source: Thomson Financial Datastream; BCG analysis
Industry TSR performance 2002–2007 p.a.Industry TSR performance 2002–2007 p.a. Industry TSR performance 2008–20091 p.a. Industry TSR performance 2008–20091 p.a.
39.0%Steel
24.5%Metals & mining
15.1%Chemicals
11.9%Construction materials
7.5%Containers & packaging
1.4%Paper & forest products
∅ 16.5%
Change p.a.
Metals & mining
Paper & forest products
-24.2% Steel
-28.0%
-18.4% Chemicals
∅ -21.5%
-19.7%
-24.7% Construction materials
Containers & packaging-13.7%
Change p.a.
Investor confidence and financial performance (again) low

22Presentation Europulp-Utipulp-17Sep09-KL-if-MUN.ppt
No better picture for pulp this time
-60
-40
-20
0
20
40200701.01.08-15.09.0815.09.08-28.02.09
TSR(%)
Median TSR performance by industryMedian TSR performance by industry
Note: All TSR values based on median per industry.Source: Thomson Reuters, Datastream, Bloomberg, BCG analysis
2008 saw the worst stock market drop since the Great Depression
Utilities
Retail
Technology and Telecom
Pharmaceuticals
Media and Publishing
ConsumerGoods
Chemicals
Transportationand Logistics
Travel and Tourism
Machinery and Construction
Multibusiness
Paper
Mining andMaterials
PulpAutomotive and Supply
Banking

23Presentation Europulp-Utipulp-17Sep09-KL-if-MUN.ppt
European P&P companies on average lost about 35% of their market cap since 12/2007
Stora Enso Sappi
Portucel
Rottneros AltriENCE
Holmen
SCA
UPMIberpapel
M-RealMondi
31.12.200714.09.2009
Source: Bloomberg; BCG analysis
Market capitalization in M€ as of
-74% -42% -59% -40% -57%
-23% -42% -73% -13%
-4% -38% -36% -26%
Billerud
Lost market capitalization

24Presentation Europulp-Utipulp-17Sep09-KL-if-MUN.ppt
As a result, the industry faces different challengesPost-crisis world will be different
How to cope with all these challenges?
Industryconsolidation
New mindsets: individuals
New mindsets: investors
Governmentsget more involved
Companies restructure
Post-crisis world
Reduced cashflows
New globalmarket order
Changing business models
25Presentation Europulp-Utipulp-17Sep09-KL-if-MUN.ppt
Agenda
The situation pre-crisis: dark clouds ahead
The crisis explained: in the middle of the storm
The implications for pulp players: mixed weather
New strategies for value creation: here comes the sun

26Presentation Europulp-Utipulp-17Sep09-KL-if-MUN.ppt
The current situation is not entirely new Disturbing similarities to Great Depression (but governments have acted quickly this time)
World industrial outputWorld industrial output World stock marketsWorld stock markets World tradeWorld trade
Source: Barry Eichengreen and Kevin H O'Rourke, "A Tale of Two Depressions", April 6, 2009, http://www.voxeu.org/index.php?q=node/3421; League of nations monthly bulletin of statistics, http://www.cpb.nl/eng/research/sector2/data/trademonitor.html
60
70
80
90
100
1 11 21 31 41 51
Months
30
50
70
90
110
1 11 21 31 41 51
Months
60
70
80
90
100
110
1 11 21 31 41 51
Months
June 1929 = 100
April 2008 = 100What can we learn from the Great Depression?
% % %

27Presentation Europulp-Utipulp-17Sep09-KL-if-MUN.ppt
1. 1929 peak to 1932 trough cumulative total return 2. 1929 peak to 1936 peak cumulative total returnSource: Calculated based on data from CRSP US Stock Database 052009 Center for Research in Security Prices (CRSP), The University of Chicago Booth School of Business; BCG analysis
Some companies outperformed in 1929 through 1936
Company performance (total return) relative to industry
Underperformers
Allied Chemical
Du PontComm. Solvents
Union CarbideGE
RCA
Westinghouse
Eastman-Kodak
Lambert Co
Gillette
P&G
Colgate-Palmolive
J. I. Case
Int. Harvester
Deere & Co
Coca-Cola
National Dairy
National Biscuit
Standard Brands
United Fruits
Wm Wrigley Jr
Sears Roebuck
General Foods
Borden
General Mills
Alaska Juneau Gold
American SmeltingAnaconda Copper
Homestake Mining
International Nickel
Kennecott Copper
National Lead
Texas Gulf Sulphur
PhelpsDodgeParamount-Publix
Loew’s
Fox Warner Bros.
Inland SteelU.S. Steel
Youngstown Sheet & Tube
GoodrichGoodyear
Firestone
American Tobacco
Liggett & Myers
Reynolds Tobacco
0
Burroughs
80 940-100 -40
Peak-to-peak2 difference to industry average in %, 1932–1936
0
10
IBM
Remington RandNCR Atlantic Refining
Sandard Oil NJ
Phillips Petroleum
Shell Union Oil
Sinclair--Consol.
Sandard Oil CA
Texas Corp
Socony-Vacuum
Sandard Oil IN
American can
AT&T
Alleghany Corp Transamerica
Crown ZellerbachInt. Paper
20
At. Top. & Sta Fe
Canadian Pacific
Chesap. and Ohio
NY Central
Norfolk & Western
Pennsylvania
Southern Pacific
Union Pacific
Baltimore and OhioAs. Dry Goods
Gimbel Brothers
S. S. Kresge
Macy
Montgomery Ward
Woolworth
J. C. Penney
Bethlehem Steel
Pillsbury
Nash Motors
ChryslerHudson Motors Car
Packard Motor Car
150
-10
-30
Peak-to-trough1 difference to industry average in %, 1929–1932
Badly hit, but out-performed in the upturn
Industry average
Industry averageOut-performers
GM

28Presentation Europulp-Utipulp-17Sep09-KL-if-MUN.ppt
Outperformer followed clear "roadmap to success"Stringent program management key to succeed—bold and quick actions required
Strong leadership and focus Bold moves and decisive program management
Protect revenues
1. Protect cash
2. Strengthen the core
3. Increase flexibility
4. Cut cost/capacity quickly and strongly
Invest in the future
5. Adapt product offering in line with changing preferences
6. Review sales/marketing opportunity carefully
7. Accelerate promising product launches
8. Invest selectively in R&D
9. Reprioritize portfolio (biomass, etc.)
10. Keep an eye out for value-adding M&A
11. Retain the best talent
Control cost
Value-oriented culture and balance actions
Conflicting at first glance,complementing at second look
29Presentation Europulp-Utipulp-17Sep09-KL-if-MUN.ppt
1. Protect cash: optimize working capital

30Presentation Europulp-Utipulp-17Sep09-KL-if-MUN.ppt
Working Capital management is an important lever to protect cash during crisis
Liquidity management is key in actual context• Difficult access to financing
– it is necessary to ensure enough liquidity to cover company's operations• Uncertainty about market scenarios
– when uncertainty is higher, you need to have more liquidity for caution• Having cash strengthens negotiating power and allows taking advantage of opportunities. For
e.g.– negotiation with suppliers or clients– opportunistic M&A
Working capital management is an important lever to improve liquidity• Working capital reduction is an attractive source of cash in a moment that is more difficult to
access the traditional sources such as banks and capital markets

31Presentation Europulp-Utipulp-17Sep09-KL-if-MUN.ppt
0.10.2
0.3
2.0
1.4
Actual WCR Potential Target
In B€
- 30%
Receivables and prepayments receivedInventories
Payables and prepayments made
Example for typical industrial goods company Example for typical industrial goods company
Note: Working capital figures indexed to 100; including prepayments Source: BCG analysis
Most relevant improvement levers Most relevant improvement levers
50% of potential often realized already in the first year
Typical impact of improved working capital management: Reduction of NWC by 20 to 40 percent
• Reduce cycle times and idle times
• Improve stockholding• Review supply concepts
Inventories
• Improve invoicing and dunning process to customers
• Re-negotiate payment schedules and conditions
Receivables
• Improve payment process to suppliers
• Re-negotiate terms and conditions in purchasing
Payables
≈ 20% of potential
≈ 50% of potential
≈ 30% of potential
32Presentation Europulp-Utipulp-17Sep09-KL-if-MUN.ppt
4./10. Capacity management/M&A

33Presentation Europulp-Utipulp-17Sep09-KL-if-MUN.ppt
Downturn acquirers perform cumulatively 14.5% better in terms of Relative Total Shareholder Return than boom acquirers
Downturn M&A creates value
Boom M&A destroys value
Downturn acquisitions create more valueOutperformance of boom time sample by +14.5 percent RTSR in the longer term
Note: Sample size = 277, values based on averagesSource: VM research system; SDC; BCG analysis
5.9% 10.4%
14.5%
104.5
94.1
108.3
93.8
0
110
90
95
100
105
Cumulative relativeTSR performance
(Announcementdate of deal = 100)
100.0100.0
97.8
97.4
101.4
95.5
T-5 T+5 End of announce-ment year
Year 1 Year 2Announce-ment effect
Looking at announcement alone proves short-sighted

34Presentation Europulp-Utipulp-17Sep09-KL-if-MUN.ppt
Low profitability results from rising cost and weak prices
Profitability
ROCE below WACC for eight years
Cost
Cost increasing
Price
Prices stagnating for most grades
2002 2004 2006 2008
100
120
80
Cost index1 (2002=100)
2002 2004 2006 2008
SC
UCWF
Cartonboard
Kraftliner
CWF
Newsprint
LWC
100
120
80
Index prices Germany (2002=100)
CostCost PricePriceProfitabilityProfitability
1. Nominal prices for Germany – representative for Western EuropeSource: RISI; BCG analysis
1
2
1 2
fMin-max
cost range (depending on grade)

35Presentation Europulp-Utipulp-17Sep09-KL-if-MUN.ppt
Operating rate is key driver for ability to influence price
Source: BCG analysis
Overcapacity further analyzed
Likely secondary driversLikely secondary drivers
Market and buyer concentrationMarket and buyer concentration
• Relative number and market share of competitors
• Historical consolidation• Level of integration• Relative distribution and volume of
customers and segments
Price corridorPrice corridor
• Price is dependent on prices of final product and costs of raw materials
Technological innovationTechnological innovation
• Relative rate of technological innovation
• Patent protection
Price outlook
OvercapacityOvercapacity
• Δ capacity — Δ demand– Growth expectations
Product substitutionProduct substitution
Likely primary driversLikely primary drivers
• Cost factors• Differentials
Supply costSupply cost
• Relative value (price, quality)– Within industry (across grades)
Driver evaluated
f
2
36Presentation Europulp-Utipulp-17Sep09-KL-if-MUN.ppt
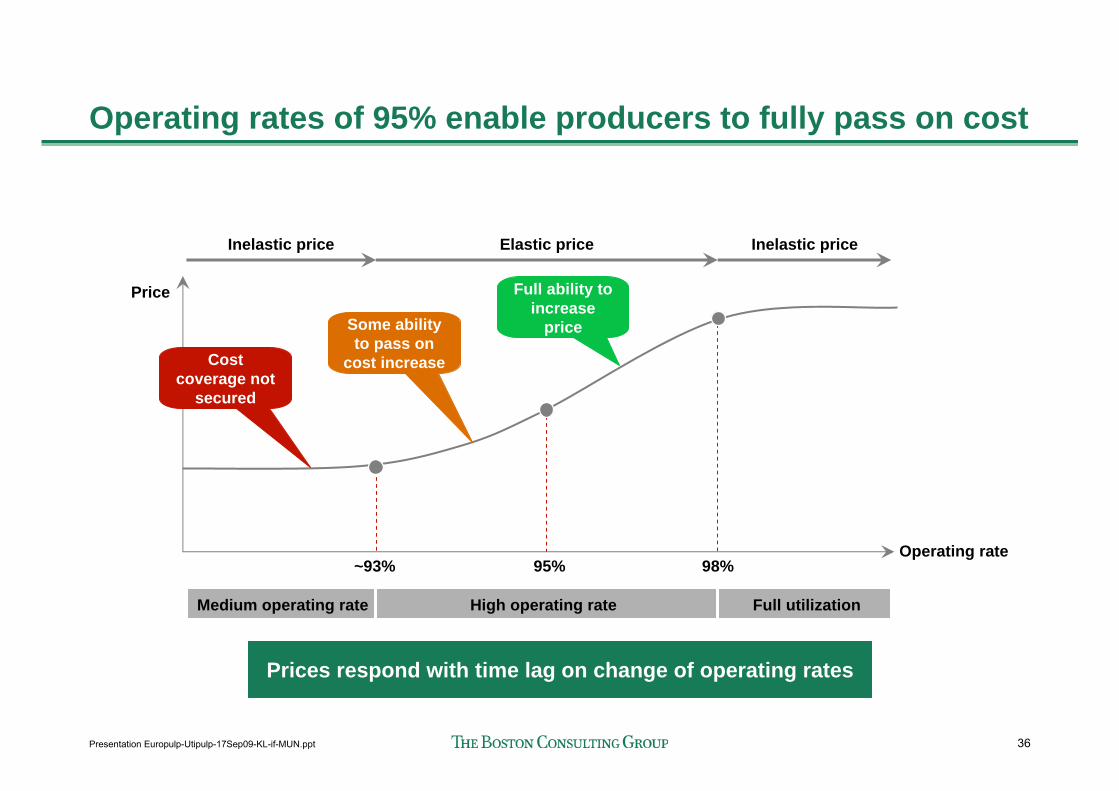
Operating rates of 95% enable producers to fully pass on cost
Operating rate
Medium operating rate High operating rate Full utilization
Price
Inelastic price Elastic price Inelastic price
~93% 98%
Cost coverage not
secured
95%
Full ability to increase
priceSome ability to pass on
cost increase
Prices respond with time lag on change of operating rates

37Presentation Europulp-Utipulp-17Sep09-KL-if-MUN.ppt
2003 2004 2005 2006 2007 2008 200970
75
80
85
90
95
100
300
400
500
700
Price € Operating rate %
90
100
110
120
2003 2004 2005 2006 2007 2008
Cost index
Immediate price response above 95%-threshold
Example containerboardExample containerboard
Source: BCG analysis
Price Testliner
Price Kraftliner
Operating rate
Cost increase fullyand quicklypassed on
Two thresholds existTwo thresholds exist
Operating rate of 95% gives ability to fully and quickly pass on cost increase
Ability to partly pass on cost increase starts at 92% – 94%
• Depending on grade– 93% for containerboard
• Price increase follows operating rate with time lag, depending on
– Duration of contracts– Expectations on future
overcapacity

38Presentation Europulp-Utipulp-17Sep09-KL-if-MUN.ppt
Source: BCG analysis
Weakened demand leads to overcapacity in all grades Closures of 1.2M – 3.8M t per grade required to reach 95% operating rate
Fine paperFine paperMechanical paperMechanical paper ContainerboardContainerboardNewsprintNewsprint
0
2
4
0.9
2007
0.9
2008
0.9
2.7
2009
0.9
2.5
2010
Additional overcapacity compared to 100% operating rateOvercapacity compared to 95% operating rate
M t
0
2
4
0.50.2
2007
0.50.2
2008
0.5
1.2
2009
0.51.3
2010
M t
0
2
4
0.9
2009
1.3
0.8
2008
1.3
3.8
2009
1.3
M t
4.1
2010
95100
80
0
90
%
2010
81
2009
93
2007
95
2008
8087
2009
86
2010
93 95100
80
0
90
%
2007 2008
93
2007
92
2008
80
2009
90
0
80
10095
96
2010
%
80
2007 2008
76
2009
75
2010
91 95
%
100
0
80
9190
Ove
rcap
acity
Ope
ratin
g ra
te
0
2
4
1.00.7
3.5 3.7
2009
0.8
2007
0.9
2008
1.0
0.9
2010
M t
Capacity to be closed to get 95% operating rate
Close 2.7M t (15%) to get 95%
operating rate
Close 3.5M t (18%) to get 95%
operating rate
Close 1.2M t (12%) to get 95%
operating rate
Close 3.8M t (15%) to get 95%
operating rate

39Presentation Europulp-Utipulp-17Sep09-KL-if-MUN.ppt
What is the best way for restructuring the industry?
Single company Centrally facilitated
Actions:
Standalone capacity closure
Acquire competitor
Merger with competitor
"Allow" restructuring
• Govern-ments
• Banks
Public-private funded capacity management
Strategic alliances
Chances for successful reduction of overcapacityDegrees of freedom in implementation
Buying of overcapa-cities"Bad bank"
1 2 3 4

40Presentation Europulp-Utipulp-17Sep09-KL-if-MUN.ppt
Only selective players in a position to take on further debt
Equals €1.5B market cap
Note: Reported data as of 31.12.2008; except: Mayr-Melnhof (2008 Q3), M-Real, Sappi und StoraEnso (2009 Q1), DS Smith (2009 S1)Source: Thomson Reuters Datastream; Thomson Reuters Worldscope; Bloomberg; company disclosures; BCG analysis
Question marks• Low net debt• Low EBITDA
compared to interest expense
Restructuring case?• High net debt• Low EBITDA
compared to interest expense
Predator?• Low net debt and high EBITDA
compared to interest expense
100
40
Liquidity: EBITDA/Interest Expense
0
Median
0 255
Portucel
InternationalPaper
MondiSappi
SCA
Billerud
Current capital structure:Net Debt in % of EV
Mayr-Melnhof
60StoraEnso
UPM
Ahlstrom
SequanaM-Real
Smurfit KappaNorske Skog
Holmen
80
DS Smith
Question marks• High net debt and
EBITDA to interest expense rate

41Presentation Europulp-Utipulp-17Sep09-KL-if-MUN.ppt
No big player in a position to acquire competitorsMayr-Melnhof, DS Smith, Portucel and Mondi are potential predators
1. Includes pension accruals and capitalized leases 2. Defined as an post-tax return on average gross assets Note: Data as of 27.04.2009 or reported data as of 31.12.2008; except: Mayr-Melnhof (2008 Q3), M-Real, Sappi und StoraEnso (2009 Q1), DS Smith (2009 S1)Source: Thomson Reuters Datastream; Thomson Reuters Worldscope; Bloomberg; company disclosures; BCG analysis
Who is in a position to act?Who is in a position to act? Some companies need to fulfill value expectationSome companies need to fulfill value expectation
Equals €1.5B market cap
Restructuring case?• High debt burden• Low earnings
Predator?• Low debt burden• High earnings
On the sidelines?• Low debt burden• Low earnings
Downturn target?• High debt burden• High earnings
Predator?• High valuation• Low value creation
Safe position?• Expansive• Value creator
Prey?• Cheap• Value
creator
Restructuring case?• Cheap • Low value creation
-8
-6
-4
-2
0
2
4
6
8
Smurfit Kappa
Norske Skog
2 14 16 18
Holmen
Svenska Cellulosa
Billerud Ahlstrom
MondiSappi
PortucelAltri
0 10 12
Mayr-Melnhof
Rottneros
Median
Current RoA2
3324 6 8-72
Latest Debt1/EBITDA
Ence
M-Real Stora Enso
UPM
SequanaDS Smith
330
-70
-60
-50
-40
-30
-20
-10
0
10
20
30
Int. Paper
BillerudMondi
Sappi
Portucel
15100
M-Real
Stora EnsoUPM
Ahlstrom
Sequana
DS Smith
Smurfit Kappa
5
Rottneros
56025-60
1yr Ø TSR (Apr08–Apr09)
Current EV1/EBITDA
20
Altri
Norske Skog
Mayr-Melnhof
Ence
Median
Svenska Cellulosa
Holmen
30

42Presentation Europulp-Utipulp-17Sep09-KL-if-MUN.ppt
How will the future landscape look like?
"Believe me! We are just about to make a huge breakthrough ..."

43Presentation Europulp-Utipulp-17Sep09-KL-if-MUN.ppt
Summary
Sector has been in crisis for years
Demand declines for all grades in 2009, leading to even larger overcapacities
Competitiveness of many European players significantly weakened
Rigorous capacity management needed – industry restructuring required• Most likely, merger/alliance and central facilitation successful ways to restructure industry
European P&P industry can be profitable in 2015 if• Operating rate of at least 95% are reached
– likely pre-requisite for above: more consolidation• They have established/found new revenue pools• You have secured access to energy and cheaper wood resources
Prepare for the worstMake the best out of it

44Presentation Europulp-Utipulp-17Sep09-KL-if-MUN.ppt
Please contact me in case of questions/need for furtherdiscussions
Kirsten LangePartner & Managing Director, Worldwide Sector Leader Pulp&Paper
The Boston Consulting Group
Tel. -49-170-33 44 375Email: [email protected]