perspectives on sustainable development from - … - 20 sep... · perspectives on sustainable...
TRANSCRIPT
1
Perspectives on sustainable
development from
India’s cement industry
CSI Forum 2011
Caroline Twigg
WBCSD India Coordinator
2
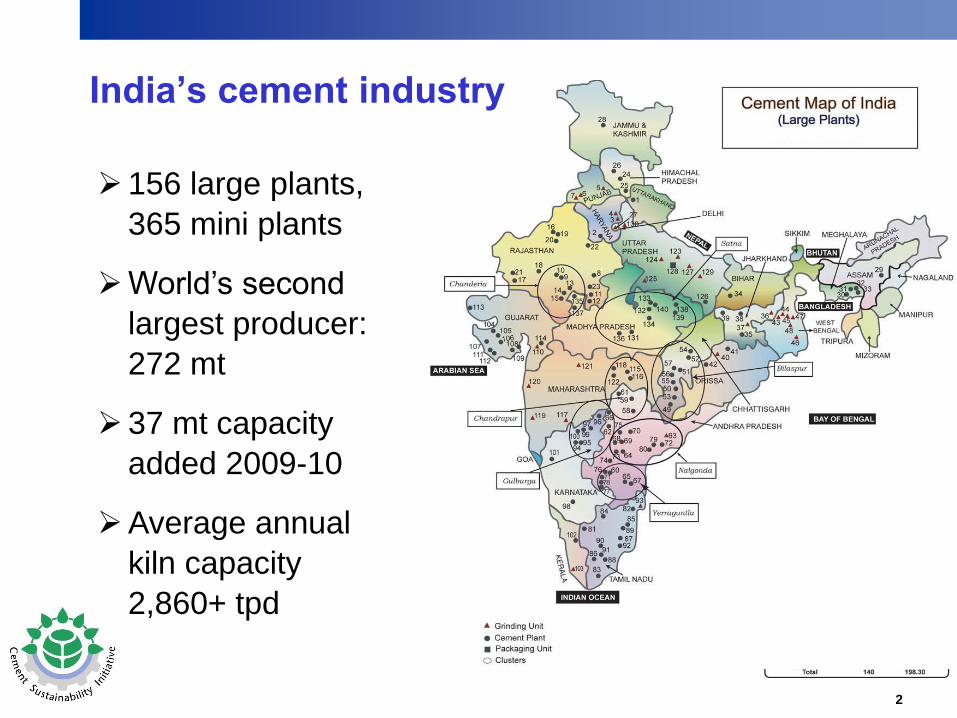
156 large plants,
365 mini plants
World’s second
largest producer:
272 mt
37 mt capacity
added 2009-10
Average annual
kiln capacity
2,860+ tpd
India’s cement industry
3
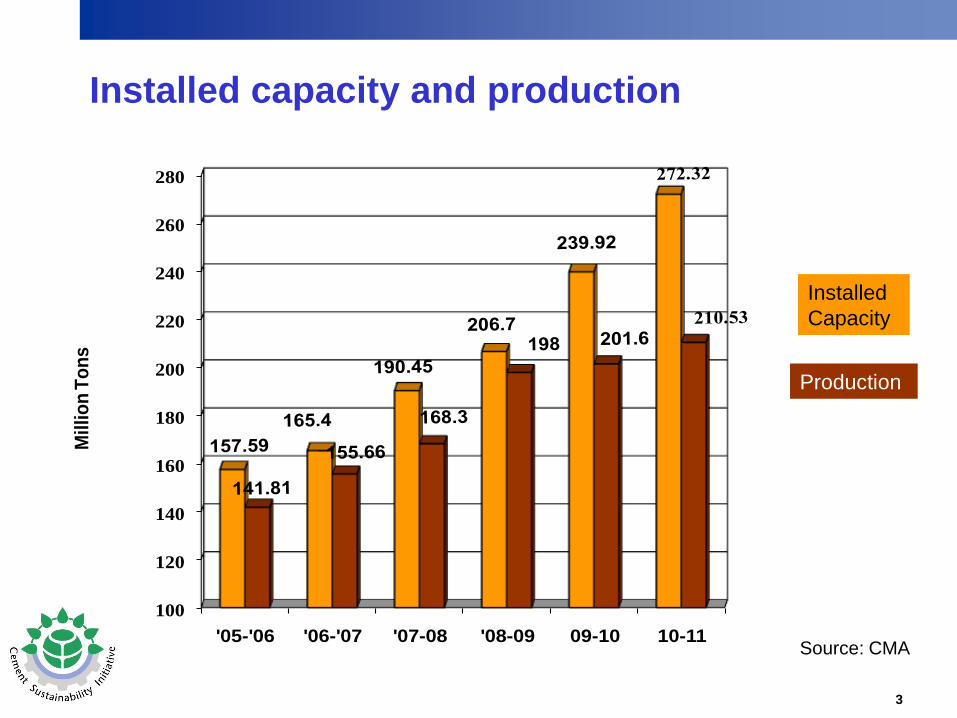
Installed capacity and production
Installed
Capacity
Production
100
120
140
160
180
200
220
240
260
280
'05-'06 '06-'07 '07-08 '08-09 09-10 10-11
Mil
lio
n T
on
s
Source: CMA

4
Cement industry v economic development
Source: CMA
5
5
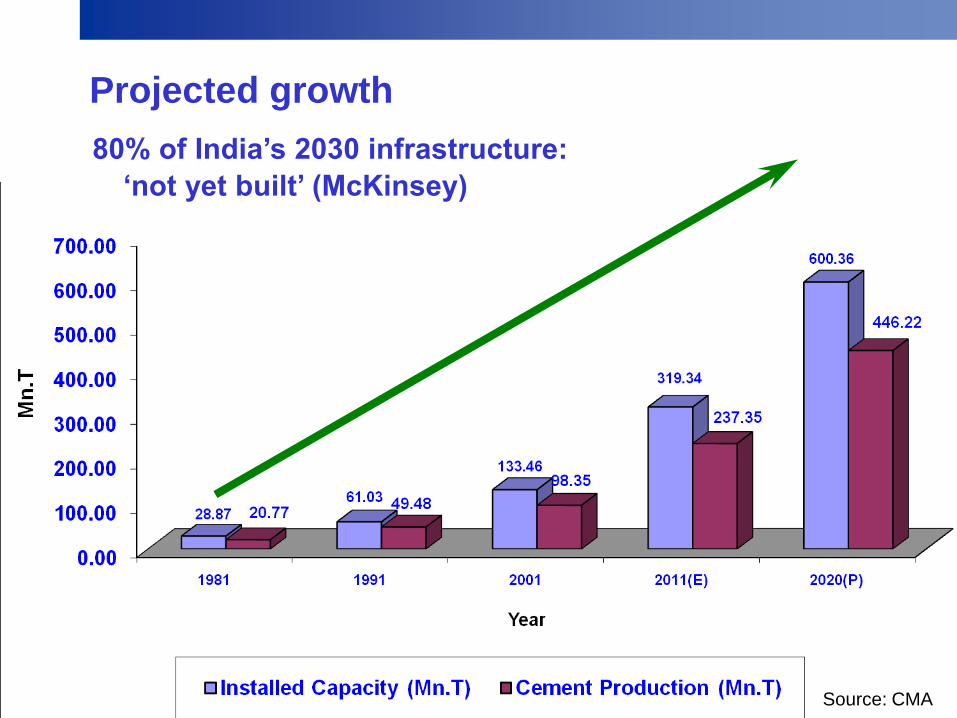
Projected growth
80% of India’s 2030 infrastructure:
‘not yet built’ (McKinsey)
Source: CMA
6
6
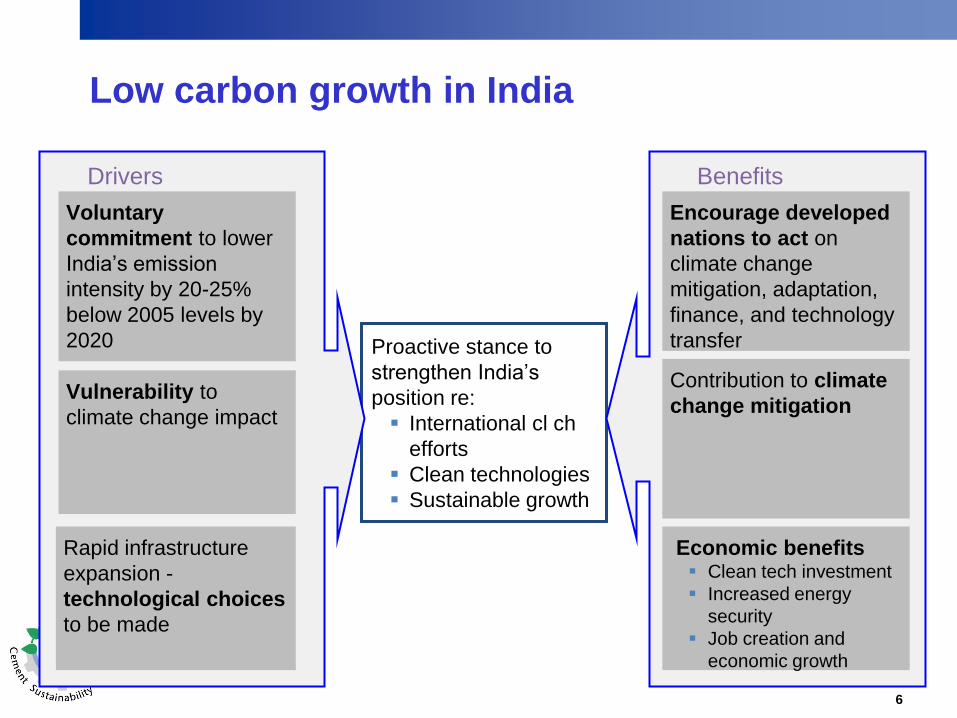
Proactive stance to
strengthen India’s
position re:
International cl ch
efforts
Clean technologies
Sustainable growth
BenefitsDrivers
Vulnerability to
climate change impact
Voluntary
commitment to lower
India’s emission
intensity by 20-25%
below 2005 levels by
2020
Rapid infrastructure
expansion -
technological choices
to be made
Encourage developed
nations to act on
climate change
mitigation, adaptation,
finance, and technology
transfer
Contribution to climate
change mitigation
Economic benefits Clean tech investment
Increased energy
security
Job creation and
economic growth
Low carbon growth in India

7
Aims:
• Ensure low-emission growth trajectory
• Ensure developmental issues fully integrated into
climate change framework
• Become global hub for energy efficiency in industry,
buildings, residential and commercial sectors
• Play key role in identification, development and
utilization of new and renewable energy sources
India’s response to climate change
8
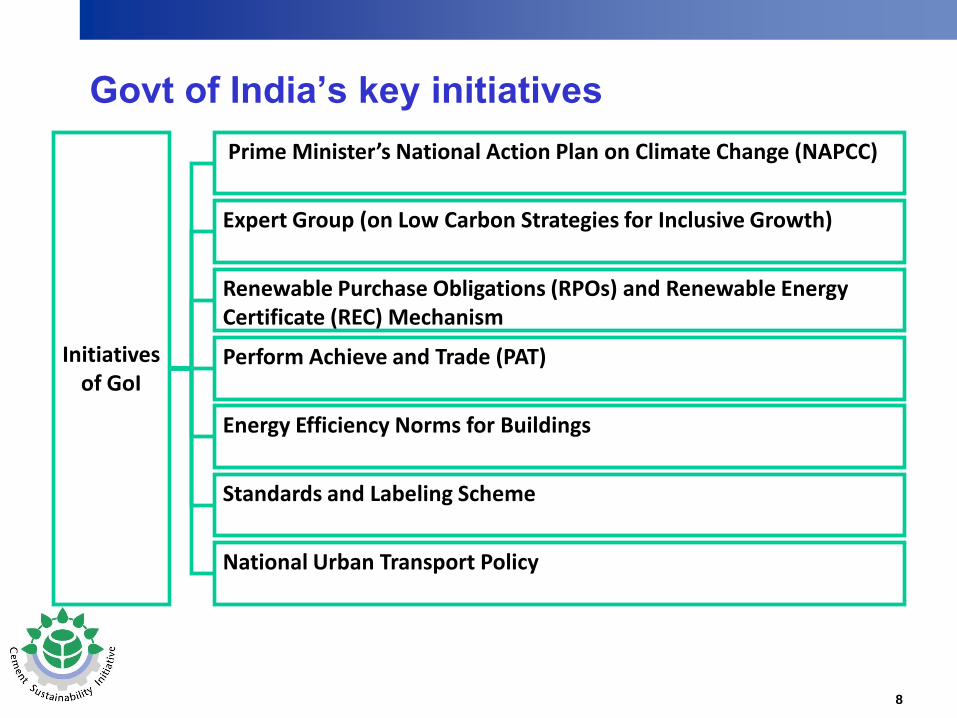
Initiativesof GoI
Expert Group (on Low Carbon Strategies for Inclusive Growth)
Prime Minister’s National Action Plan on Climate Change (NAPCC)
Perform Achieve and Trade (PAT)
Renewable Purchase Obligations (RPOs) and Renewable Energy Certificate (REC) Mechanism
Energy Efficiency Norms for Buildings
Standards and Labeling Scheme
National Urban Transport Policy
Govt of India’s key initiatives

9
Energy Intensive
Sectors
• Market-based mechanism
• Enhance cost effectiveness of en eff improvements
• Certification of tradable energy savings
‘Perform, Achieve, Trade’ (PAT scheme)

10
10
1. 41 CDM projects (27 registered) = 29.55m Certified
Emission Reduction (CERs)
2. Increasing focus on AFR use
3. R&D on carbon capture eg algal growth
4. Increased RE use
5. Indian Cement Industry Low Carbon Technology
Roadmap (WBCSD/IEA + IFC support)
6. Continuous ambient air quality monitoring stations
installed in all plants: Dec 2011
Cement industry’s response to climate change
11
11
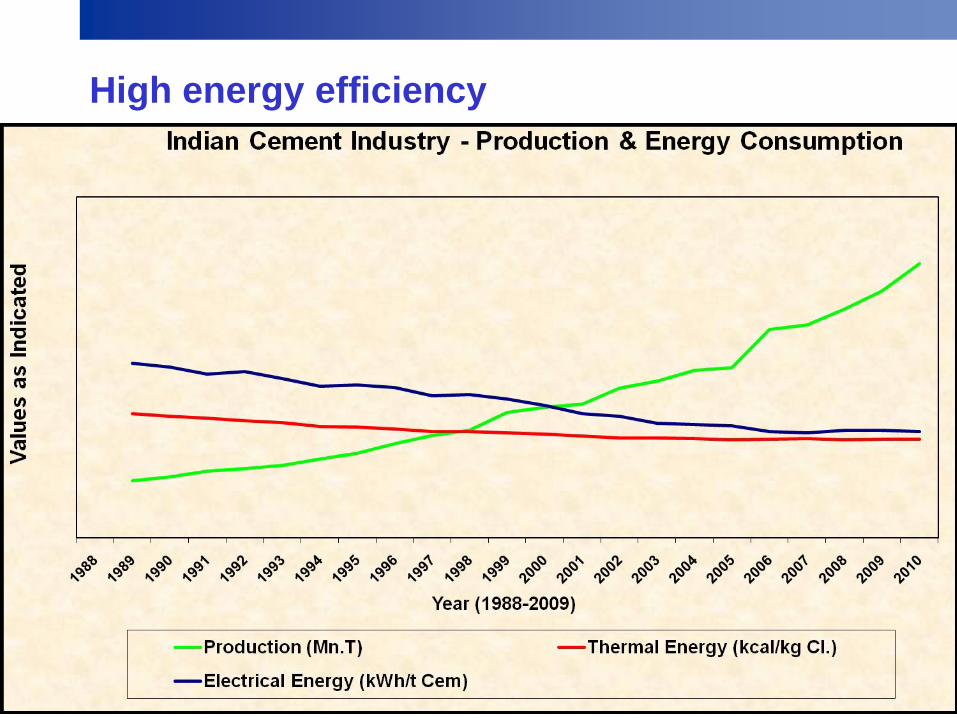
High energy efficiency
12
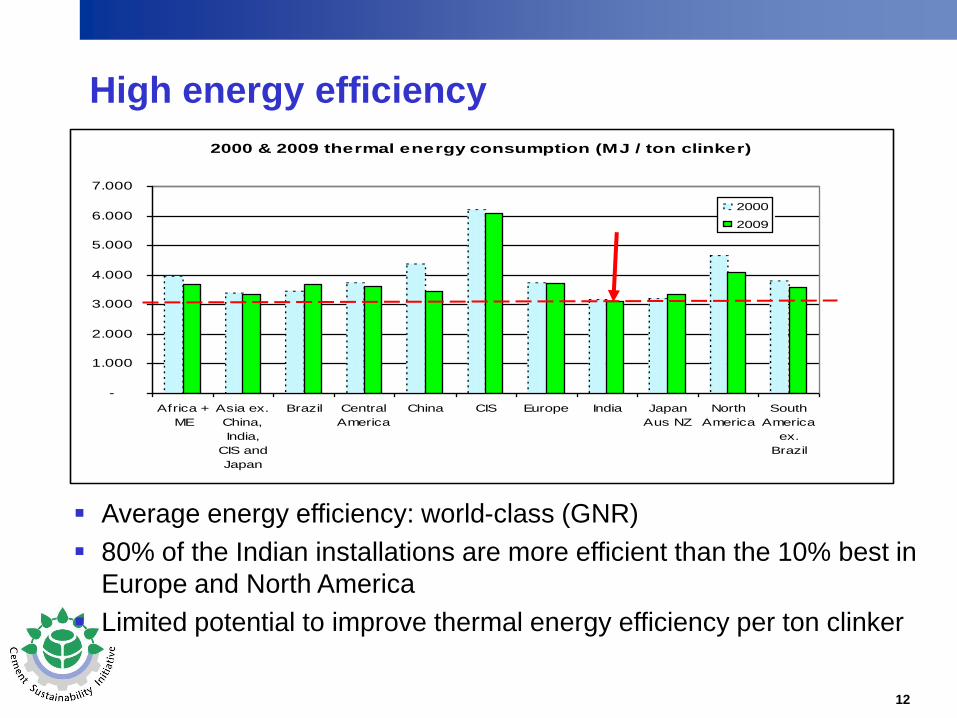
2000 & 2009 thermal energy consumption (MJ / ton clinker)
-
1.000
2.000
3.000
4.000
5.000
6.000
7.000
Africa +
ME
Asia ex.
China,
India,
CIS and
Japan
Brazil Central
America
China CIS Europe India Japan
Aus NZ
North
America
South
America
ex.
Brazil
2000
2009
Average energy efficiency: world-class (GNR)
80% of the Indian installations are more efficient than the 10% best in
Europe and North America
Limited potential to improve thermal energy efficiency per ton clinker
High energy efficiency
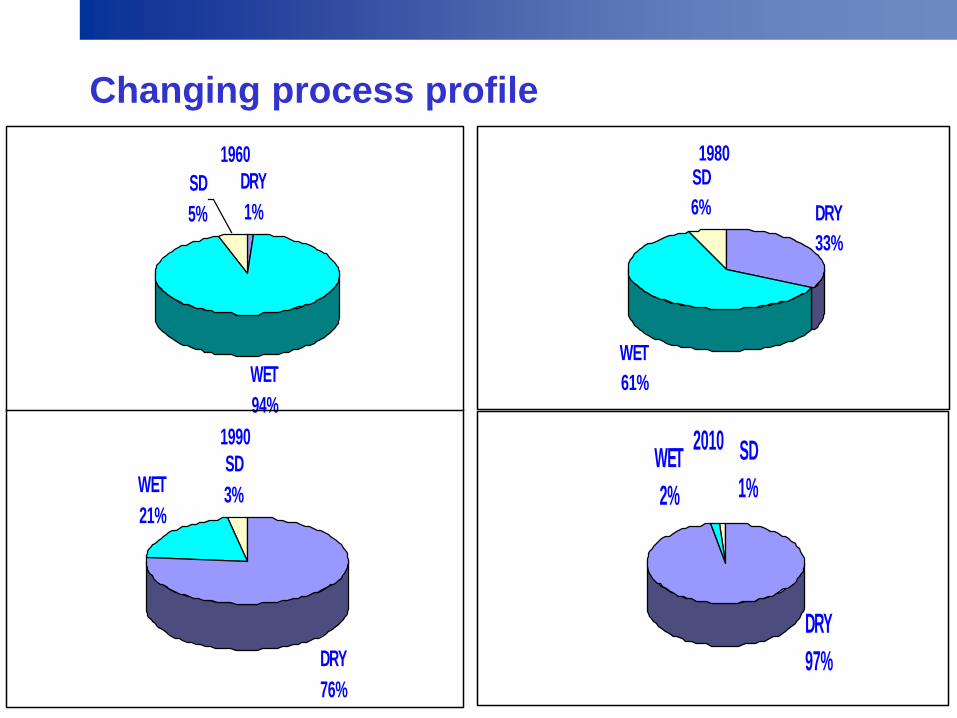
13
13
1980
DRY
33%
WET
61%
SD
6%
2010
DRY
97%
WET
2%
SD
1%
1990
DRY
76%
WET
21%
SD
3%
1960
DRY
1%
WET
94%
SD
5%
Changing process profile
14
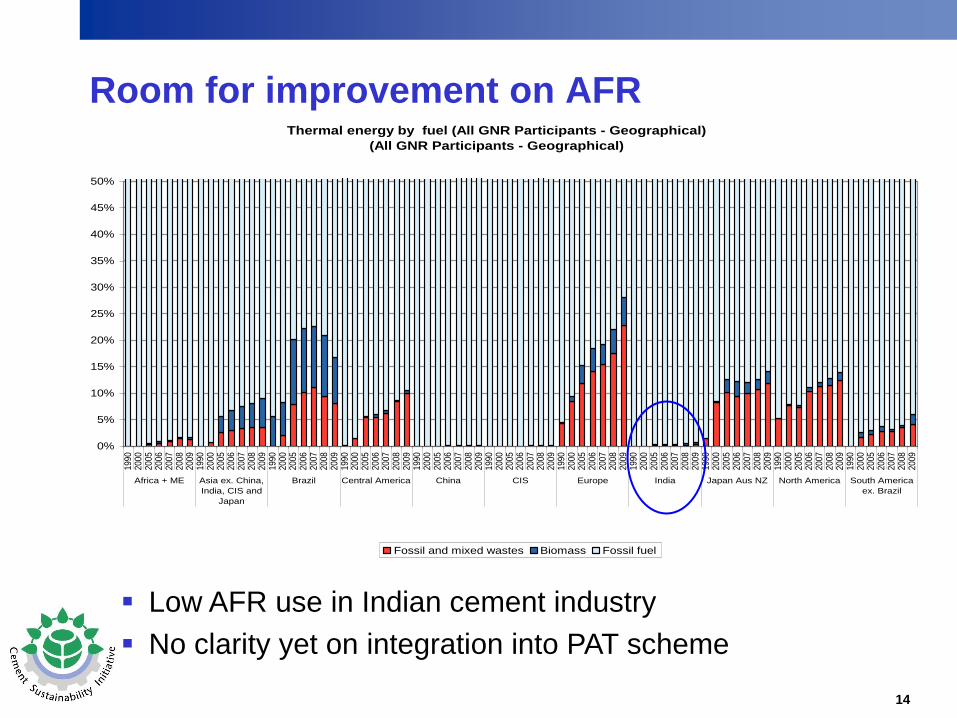
Low AFR use in Indian cement industry
No clarity yet on integration into PAT scheme
Thermal energy by fuel (All GNR Participants - Geographical)
(All GNR Participants - Geographical)
0%
5%
10%
15%
20%
25%
30%
35%
40%
45%
50%
1990
2000
2005
2006
2007
2008
2009
1990
2000
2005
2006
2007
2008
2009
1990
2000
2005
2006
2007
2008
2009
1990
2000
2005
2006
2007
2008
2009
1990
2000
2005
2006
2007
2008
2009
1990
2000
2005
2006
2007
2008
2009
1990
2000
2005
2006
2007
2008
2009
1990
2000
2005
2006
2007
2008
2009
1990
2000
2005
2006
2007
2008
2009
1990
2000
2005
2006
2007
2008
2009
1990
2000
2005
2006
2007
2008
2009
Africa + ME Asia ex. China,
India, CIS and
Japan
Brazil Central America China CIS Europe India Japan Aus NZ North America South America
ex. Brazil
Fossil and mixed wastes Biomass Fossil fuel
Room for improvement on AFR
15
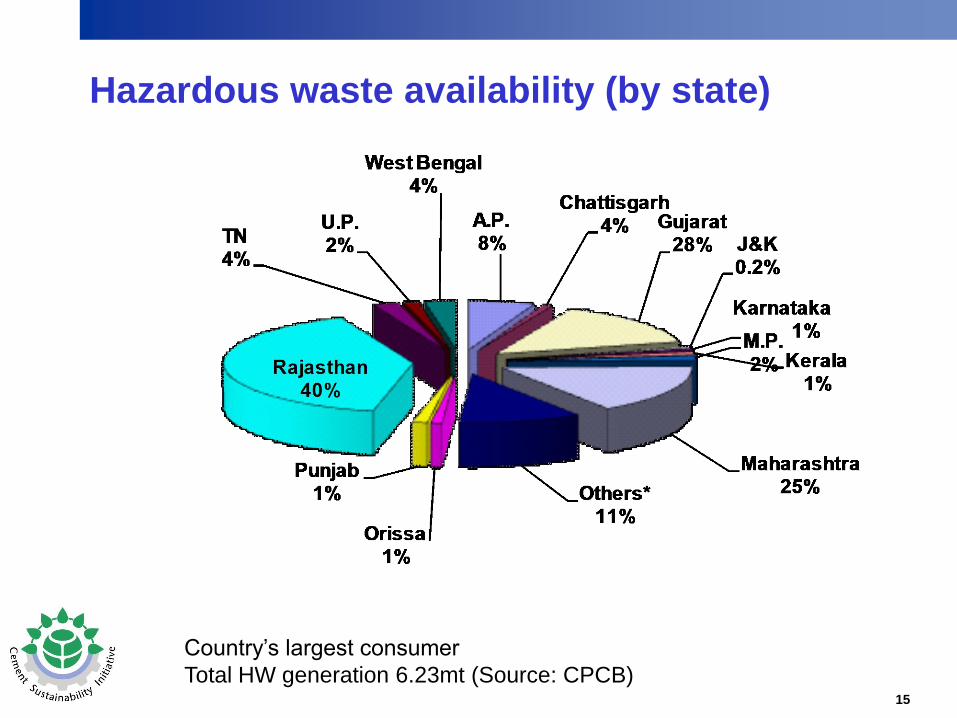
Hazardous waste availability - State wise
Country’s largest consumer
Total HW generation 6.23mt (Source: CPCB)
Hazardous waste availability (by state)
16
Room for improvement on AFR
Barriers
• Considered ‘fairly new’ process = fear of:
• Loss of production
• Quality impact
• Equipment corrosion
• Safety issues
• ‘Lack of cheap technology’
• Lack of policy and regulatory incentives
• Unclear cost/payment structures with waste
providers
• Cross-state transport problematic
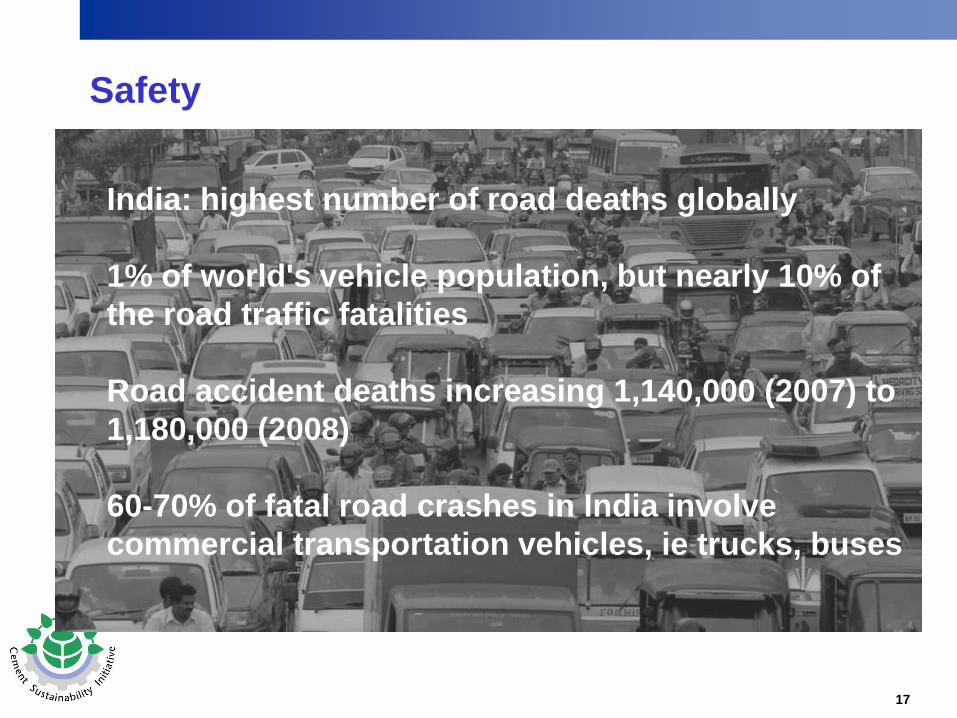
17
India: highest number of road deaths globally
1% of world's vehicle population, but nearly 10% of
the road traffic fatalities
Road accident deaths increasing 1,140,000 (2007) to
1,180,000 (2008)
60-70% of fatal road crashes in India involve
commercial transportation vehicles, ie trucks, buses
Safety
18
Challenges
• 3.3m km ‘roads’: 71,000km highways …
20,000km single lane, small % concrete
• Industry growth = increased transport
• Safety standards not implemented … corruption
+ poor regulation
• Vehicles often not roadworthy
• Driving training not adequate
• Majority of transport = contracted
19
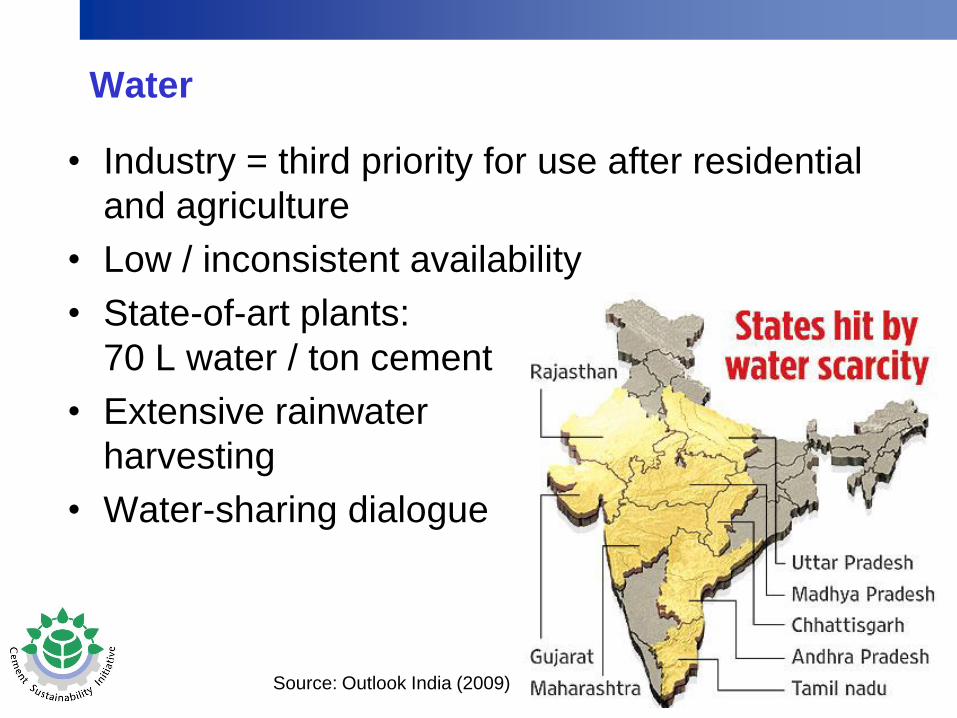
Water
• Industry = third priority for use after residential
and agriculture
• Low / inconsistent availability
• State-of-art plants:
70 L water / ton cement
• Extensive rainwater
harvesting
• Water-sharing dialogue
Source: Outlook India (2009)
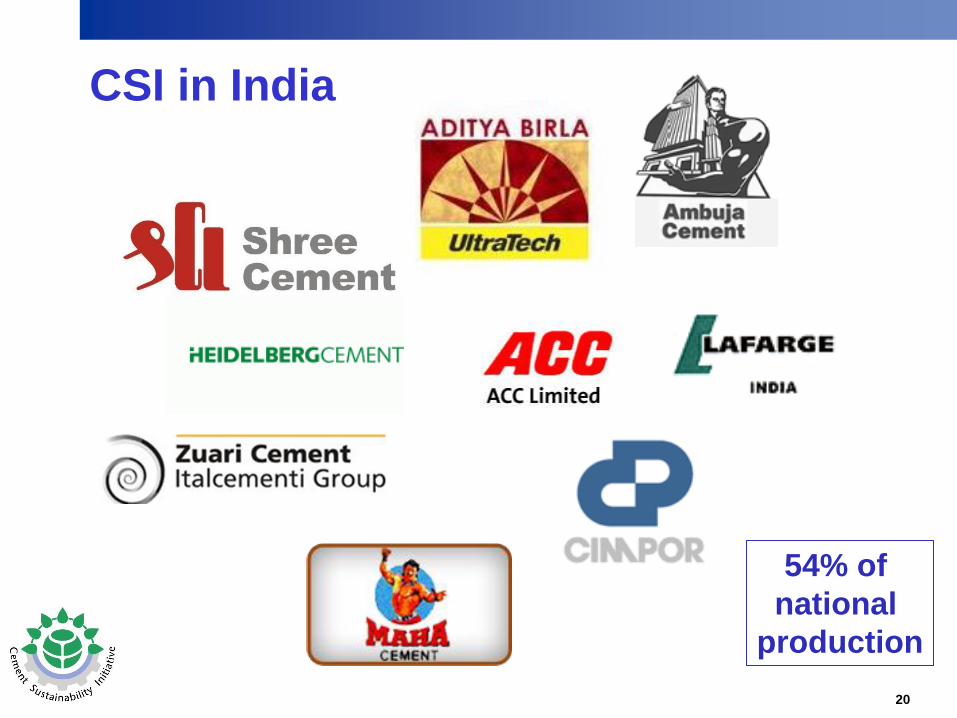
20
CSI in India
54% of
national
production
21
Activities
• CEO-led
• Driving safety project (safety breakout Tues pm)
• India Cement Industry Low Carbon Technology
Roadmap (LbS Wedn am)
• Growing relationship with Trade Association
(CMA)
22
Thank you