personality traits in predicting interior design students - citeseer
TRANSCRIPT

Personality Traits in Predicting Interior Design Students’ Academic Success and Persistence
by
Rosemary E. Peggram, B.I.D., M.S.
A Dissertation
In
HIGHER EDUCATION
Submitted to the Graduate Faculty of Texas Tech University in
Partial Fulfillment of the Requirements for
the Degree of
DOCTOR OF EDUCATION
Approved
Dr. John Murray, Co-chair
Dr. Zane Curry, Co-chair
Dr. Diane Oliver
Fred Hartmeister Dean of the Graduate School
December, 2007

Copyright 2007, Rosemary Peggram

Texas Tech University, Rosemary Peggram, December 2007
ACKNOWLEDGEMENTS
There is no greater honor than the sacrifice one makes for another. I wish to thank all
those who gave their support, encouragement, wisdom, and love throughout the completion of my
dissertation project. To my committee who worked so beautifully together and provided
excellent critique and support of the project, I extend my sincere appreciation. I would like to
thank Dr. John Murray, co-chair of my dissertation committee, for his wisdom, guidance,
encouragement and most of all, patience. He was my educator and role model. To Dr. Zane
Curry, co-chair, I extend a deep gratitude for his encouragement in times when I grew weak, his
wisdom and experience, and above all, his friendship. You always had faith in me and I am truly
grateful. I express my gratitude to Dr. Diane Oliver for her excellent editing and APA knowledge
and for providing new insights.
A special appreciation is extended to Dr. Du Feng, who endured many long hours over
statistical analyses and interpretation with me. You were a life-saver. Also, a special thanks goes
to Dr. Alice Sherrod who provided me with access to the MBTI. I admire your vast knowledge of
the MBTI and its implications. With sincere appreciation, I would like to thank the Interior
Design Educators Council (IDEC) Foundation for the generous scholarship. Without your
financial support, the scope of this study would not have been possible.
I wish to acknowledge the sacrifice and encouragement given me by my family. Your
love and commitment to my success have carried me through many rough times. I thank my
children for their understanding and patience. I especially thank my loving husband, Michael, for
his support, understanding, and confidence in me. A final and essential acknowledgement goes
to God, who planted the seed and cleared the path. He is the author and finisher of all good
things.
ii

Texas Tech University, Rosemary Peggram, December 2007
TABLE OF CONTENTS
ACKNOWLEDGMENTS…………………………………………………………. ii
ABSTRACT……………………………………………………………................... vi
LIST OF TABLES…………………………………………………………………. viii
CHAPTER
I. INTRODUCTION………………………………………………………. 1
Statement of the Problem………………………………………… 3
Justification of the Problem……………………….………...............5
Purpose and Objectives…………………………………………….. 6
Theoretical Framework…………………………………………….. 7
Importance of the Study……………………………………………. 8
Definition of Terms…………………………………………………10
Assumptions………………………………………………………...11
Limitations and Delimitations………………………………………12
II. LITERATURE REVIEW………………………………………………..14
Cognitive Measures for Prediction of Academic Performance……. 15
Standardized Aptitude Tests……………………………….. 15
High School Average or Rank……………………………... 18
Standardized tests and High School Rank……...……….…. 20
Non-intellective Measures of Success………………….…………...22
Sex…………………………………….…………………….22
Socio-economic Status……………………………………... 24
Personality…………………………………………………………..25
Theoretical Basis-Jungian Theory…………………………………. 28
Personality Traits as Indicated by the Myers-Briggs Type Indicator 31
MBTI and Prediction of College Performance and Persistence…… 36
Personality Traits and Occupations………………………………... 38
Personality Types in Fields of Art and Design…………………….. 40
Summary…………………………………………………………… 43
iii

Texas Tech University, Rosemary Peggram, December 2007
III. METHODOLOGY……………………………………………… ……. 46
Sample Selection…………………………………………………… 46
Instrumentation…………………………………….………………..48
Procedures for Data Collection…………………………………….. 50
Research Design……………………………………………………. 52
Research Questions………………………………………………… 54
Data Analysis………………………………………………………. 54
Anticipated Findings……………………………………………….. 57
Summary…………………………………………………………... 58
IV. RESULTS……………………………………………………………… 59
Sample Participants………………………………………………… 59
Sample Demographics……………………………………………... 61
Descriptive Statistics for Dependent and Independent Variables….. 68
Analysis of the Research Questions………………………………... 70
V. SUMMARY, CONCLUSIONS, AND RECOMMENDATIONS……... 80
Summary of the Study……………………….……………………...80
Findings and Conclusions………………………………………… 81
Recommendations………………….………………………………. 84
Further Research…………………………………………….………85
Summary…………………………………………………………….86
REFERENCES……………………………………………………………….……..87
APPENDICES…..…………………………………………………………………..96
A. APPROVAL FOR PROTECTION OF HUMAN SUBJECTS…………97
B. E-MAIL TO GATEKEEPERS …………………………………………98
C. LETTER TO INSTRUCTORS TO SOLICIT ASSISTANCE………… 99
D. COVER LETTER TO INSTRUCTORS………………………………. 100
E. DIRECTIONS FOR ADMINISTRATING INSTRUMENTS………… 101
F. STUDENT COVER LETTER…………………………………………. 102
G. CONSENT AND RELEASE……………………………………………103
iv

Texas Tech University, Rosemary Peggram, December 2007
H. DEMOGRAPHIC SURVEY……………………………………………104
I. MBTI FORM-G………………………………………………………… 105
J. MYERS-BRIGGS TYPE INDICATOR DETAILED SCORING
INFORMATION……………………………………………………… 106
K. THANK YOU NOTE TO PARTICIPANTS……………………………107
L. SAMPLE MBTI REPORT……………………….………………………108
M. EFFECTS OF THE COMBINATIONS OF ALL FOUR
PREFERENCES…………………………………………………… 111
v
Texas Tech University, Rosemary Peggram, December 2007
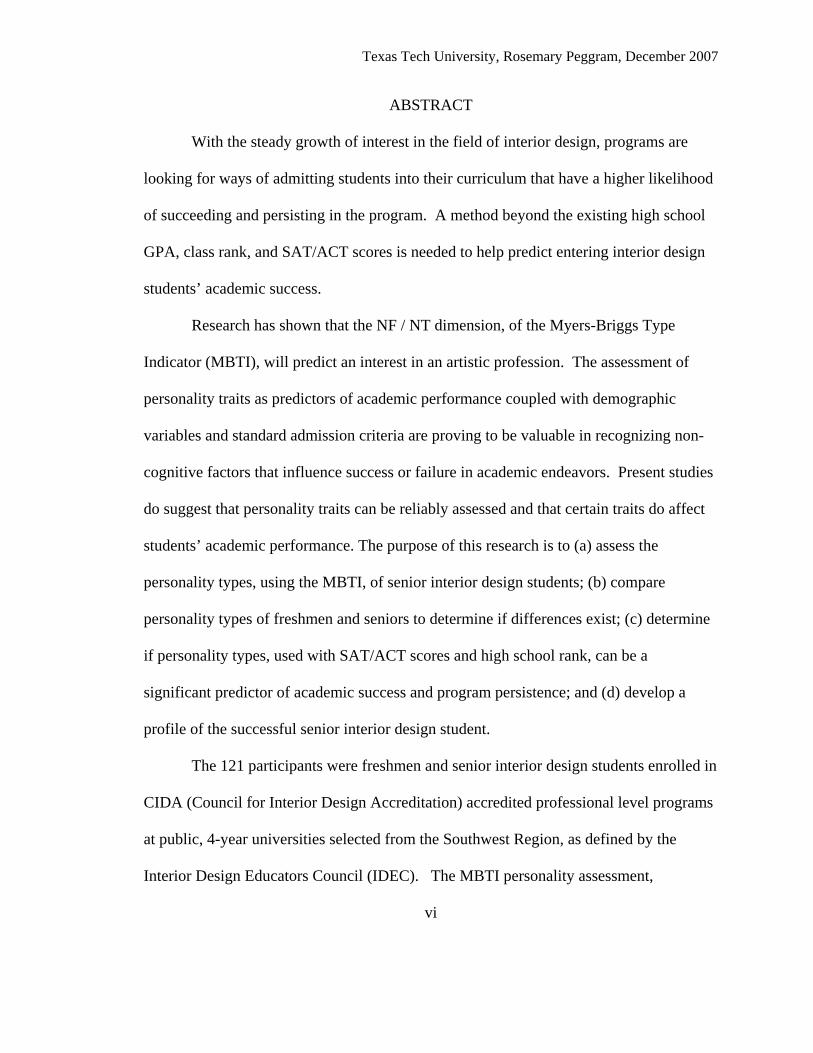
ABSTRACT
With the steady growth of interest in the field of interior design, programs are
looking for ways of admitting students into their curriculum that have a higher likelihood
of succeeding and persisting in the program. A method beyond the existing high school
GPA, class rank, and SAT/ACT scores is needed to help predict entering interior design
students’ academic success.
Research has shown that the NF / NT dimension, of the Myers-Briggs Type
Indicator (MBTI), will predict an interest in an artistic profession. The assessment of
personality traits as predictors of academic performance coupled with demographic
variables and standard admission criteria are proving to be valuable in recognizing non-
cognitive factors that influence success or failure in academic endeavors. Present studies
do suggest that personality traits can be reliably assessed and that certain traits do affect
students’ academic performance. The purpose of this research is to (a) assess the
personality types, using the MBTI, of senior interior design students; (b) compare
personality types of freshmen and seniors to determine if differences exist; (c) determine
if personality types, used with SAT/ACT scores and high school rank, can be a
significant predictor of academic success and program persistence; and (d) develop a
profile of the successful senior interior design student.
The 121 participants were freshmen and senior interior design students enrolled in
CIDA (Council for Interior Design Accreditation) accredited professional level programs
at public, 4-year universities selected from the Southwest Region, as defined by the
Interior Design Educators Council (IDEC). The MBTI personality assessment,
vi

Texas Tech University, Rosemary Peggram, December 2007
demographic questionnaires, descriptive statistics, standard multiple linear regression and
Pearson chi-square were utilized to answer the research questions. The findings indicate
that all 16 types of the MBTI are represented in the seniors with 71% falling into 7 types.
The top 4 MBTI types for freshmen were ENFP, ISTJ, ISFJ and ESFP. The top 4 MBTI
types for seniors were ISFJ, ESTJ, ENFP and ENTJ. To predict success in interior
design, significance was found between the Judging dimension of the MBTI, senior
classification, older age, higher ACT score, and higher high school rank with higher
cumulative GPA.
vii
Texas Tech University, Rosemary Peggram, December 2007
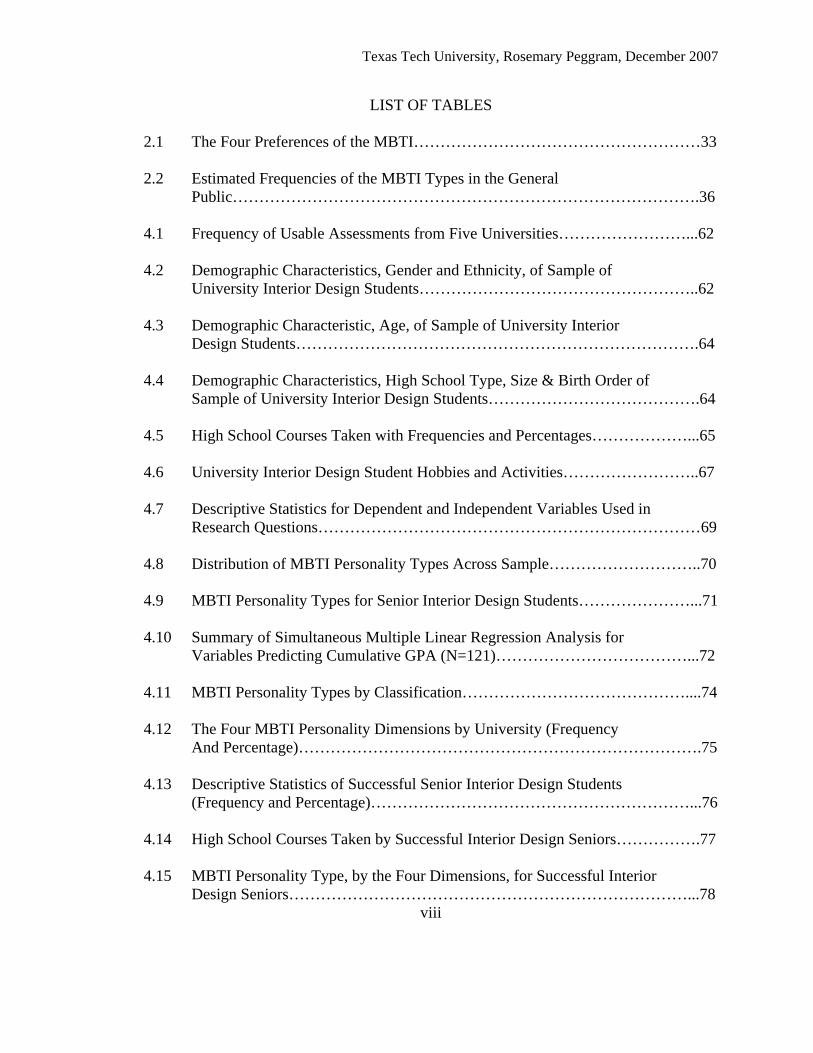
LIST OF TABLES
2.1 The Four Preferences of the MBTI………………………………………………33 2.2 Estimated Frequencies of the MBTI Types in the General Public…………………………………………………………………………….36 4.1 Frequency of Usable Assessments from Five Universities……………………...62 4.2 Demographic Characteristics, Gender and Ethnicity, of Sample of University Interior Design Students……………………………………………..62 4.3 Demographic Characteristic, Age, of Sample of University Interior
Design Students………………………………………………………………….64 4.4 Demographic Characteristics, High School Type, Size & Birth Order of
Sample of University Interior Design Students………………………………….64 4.5 High School Courses Taken with Frequencies and Percentages………………...65 4.6 University Interior Design Student Hobbies and Activities……………………..67
4.7 Descriptive Statistics for Dependent and Independent Variables Used in
Research Questions………………………………………………………………69 4.8 Distribution of MBTI Personality Types Across Sample………………………..70 4.9 MBTI Personality Types for Senior Interior Design Students…………………...71
4.10 Summary of Simultaneous Multiple Linear Regression Analysis for
Variables Predicting Cumulative GPA (N=121)………………………………...72 4.11 MBTI Personality Types by Classification……………………………………....74 4.12 The Four MBTI Personality Dimensions by University (Frequency
And Percentage)………………………………………………………………….75 4.13 Descriptive Statistics of Successful Senior Interior Design Students
(Frequency and Percentage)……………………………………………………...76 4.14 High School Courses Taken by Successful Interior Design Seniors…………….77 4.15 MBTI Personality Type, by the Four Dimensions, for Successful Interior
Design Seniors…………………………………………………………………...78 viii

Texas Tech University, Rosemary Peggram, December 2007
4.16 MBTI Personality Type, by the 16 Types, for Successful Interior Design
Students…………………………………………………………………………..78 4.17 Descriptive Statistics of Successful Interior Design Students in Terms of
ACT, High School Rank, Current Credits Taking and Job Hours per Week……79
ix
Texas Tech University, Rosemary Peggram, December 2007
1
CHAPTER 1
INTRODUCTION
The question of predicting success has been studied at all levels of academic
activity. We use many types of evaluative instruments in our schools from the very
earliest grades on. In elementary and secondary grades many different measures such as
achievement, aptitude, interest, and personality tests are administered to students and
used for different purposes including the prediction of future academic success. Post-
secondary education is no different. Students typically are required to take achievement
tests so admissions counselors can predict subsequent success at the baccalaureate level.
For over 30 years, most colleges and universities have relied heavily on the scores of
scholastic aptitude tests to predict a student’s academic prowess (Bontekoe, 1992).
Two of the most widely used aptitude tests are the Academic Competence Test
(ACT) and the Scholastic Achievement Test (SAT). Other indicators that admission
counselors often refer to when evaluating an admissions application are the student’s high
school grade point average and class rank. These factors, along with the results of the
ACT or SAT, constitute the bulk of the prediction methods for success in public colleges
and universities.
The validity of the SAT and high school grades – the correlation between these
variables and college grades – has long been a concern of users of the SAT, the College
Board and Educational Testing Service, and critics of standardized testing (Baird, 1983).
Admissions offices that are the primary users of the SAT and grade records are concerned
with the validity of the test and grades at their own campus. The College Board and
Educational Testing Service look at the validity of the SAT as one of the criteria of the
Texas Tech University, Rosemary Peggram, December 2007
2
quality of the instrument. Finally, one of the criticisms of the test is that the SAT does
not accurately predict college grades. The validity of the SAT in predicting college
grades will be further investigated in Chapter 2.
Early research on academic achievement prediction focused almost exclusively on
intellectual and ability variables. Common measures of ability, however, do not
completely account for the variance in academic performance. Studies indicate that the
amount of variance in grade point average explained by the SAT, for instance, ranges
from a modest 10% to 20% (Goldman & Slaughter, 1976). This tells us that the large
majority of variance in academic performance is left unexplained. High school grades
and class rank have often been used in conjunction with the SAT to strengthen predictive
accuracy, but even taken together, only account for approximately 25% of the variance in
academic performance (Wolfe and Johnson, 1995). This coupled with the fact that some
students perform better and some worse than predicted by ability tests, has prompted a
recent shift in the conceptualization of the prediction problem. The search for causes of
achievement differences has led investigators to begin focusing on “nonintellectual” or
personality characteristics that could possibly contribute to academic success, or lack
thereof (Owen-Killar, 1996). It is reasonable to postulate that if both intellective and
non-intellective variables are combined as predictors the accuracy should be enhanced.
With the vast array of programs and specializations available at the university
level today, students are often admitted into programs in which they flounder and
occasionally fail. This situation can be detrimental to a student’s confidence and
motivation; much less the fact that time and money have been lost. Although aptitude
and skills tests are also available to college students, they are more commonly used
Texas Tech University, Rosemary Peggram, December 2007
3
voluntarily when a student is unsure of a direction to take for post-secondary study.
These tests evaluate a person’s natural skills, strengths and tendencies and direct them
toward fields where, based on those strengths, they might be the most successful. Many
students bypass these tests and directly enroll in programs of study in which they have an
interest and feel they could be successful.
Statement of the Problem Each year approximately 55 freshmen in the College of Human Sciences at Texas
Tech University elect to major in Interior Design. In addition, there are students who
elect to transfer into the Interior Design major in their sophomore year or later. A
popular career choice because of current building and construction trends, interior design
would seem to hold a reasonable opportunity for employment for students upon
graduation.
The popularity of interior design, a nationwide phenomenon that began in 2000,
extends beyond Texas Tech University. Waxman and Clemons (2005) state that since the
year 2000, the number of students selecting interior design as a major has steadily risen,
with many universities recording increases of 200-400%. For example, historically,
Florida State University has had 45-50 freshmen declaring interior design as their major,
with only the top 40 being admitted to the program. However, freshmen enrollment in
interior design for fall 2005 climbed to more than 120, while the number accepted to
advance to the sophomore year remained at 40. Interior design students at many
universities are rejected through a competitive portfolio review. Colorado State
University now has more than 175 freshmen declaring interior design as their major, with
a similar selective advancement process that allows only 40 students to move on to the
Texas Tech University, Rosemary Peggram, December 2007
4
sophomore level (Waxman & Clemons, 2005). The number of candidates taking the
National Council for Interior Design Qualifications (NCIDQ) Examination in 1984 was
approximately 1,800; in 2005 alone, candidates taking the exam reached over 3,500
(Phone conversation with NCIDQ, April 10, 2005).
A variety of abilities and competencies are required to succeed in completing a
program of study in the area of interior design. As schools with limited resources and
faculty try to accommodate higher numbers of students and maintain efficient class sizes,
many are turning to enrollment management techniques to admit only the best-qualified
students into the program. Other interior design programs are admitting all interested
students and doing their best to handle enrollment. However, most have developed some
way to assess students’ design skills, thereby limiting enrollment. Institutions across the
nation have been establishing formal methods for screening out lower-ability students to
control the quantity and quality of students in interior design (Whiteside, Rothgeb, &
Congleton, 1986).
Many interior design programs have a sophomore portfolio review in the third or
fourth semester of the program that eliminates some students because they lack the skills
and concepts needed to succeed in the upper level courses. The largest attrition from
interior design programs commonly takes place during the first two years (i.e. the first
four semesters) of the degree program. For example, the attrition rate in the Interior
Design program at Texas Tech University has been approximately 10-12% each semester
until the junior year (TTU Institutional Research, 2006). Some students, because of their
high scores on college admission tests and high school rank, are automatically accepted
into the program, but lack the abilities and competencies to successfully complete the
Texas Tech University, Rosemary Peggram, December 2007
5
program. Approximately 25% of all students at 4-year colleges and universities do not
persist beyond their freshmen year (U.S. Department of Education, 2000). These high
attrition rates have been identified as one of the most momentous challenges facing
institutions of higher education (Brawer, 1996; McGrath & Braunstein, 1997).
Overall, retention may be more cost effective than recruitment (Astin, 1975). In
addition to the economic benefits of reducing attrition, educators and administrators have
a professional responsibility to increase the probability of academic success for students.
One means of increasing retention is to improve selection and admission procedures (Ott,
1978).
Importance of the Problem There is a great need for better predictors of academic performance. Personality
variables may be able to fill this role. Much research has been done on predicting student
success in college using the traditional methods of evaluating SAT/ACT scores, high
school grade point average, and high school class rank. These common methods of
ability, however, do not completely account for the variance in academic performance.
Many more studies have incorporated personality, some using the Myers-Briggs Type
Indicator (MBTI) to attempt to predict student success in a variety of college subject
areas. However, very little research predicts student’s success in subject areas focused in
the art and design fields. With the steady growth of interest in the field of interior design,
programs of interior design are looking for ways of admitting those students into their
curriculum that have a high likelihood of succeeding and persisting in the program. The
MBTI information could provide insight into understanding the student Types who tend
to choose the major and stay with it after other Types have dropped out. Therefore, a
Texas Tech University, Rosemary Peggram, December 2007
6
method beyond the existing high school GPA, class rank, and SAT/ACT scores is needed
to help predict entering interior design students’ academic success and persistence.
Because admission into interior design is limited, a method of predicting future success
and persistence is important to making the best admission choices.
Purpose and Objectives
It is the intention of this research to determine if non-cognitive factors used in
admitting new students can be useful in predicting academic success for interior design
students. Myers (1980) shows that different disciplines attract specific MBTI types. The
MBTI might provide insight into understanding the student personality types who tend to
choose the major and stay with it. Personality traits, as measured by the MBTI, may be
useful predictors of academic performance when used in combination with other
commonly used predictors. This study’s purpose is to provide useful criteria, through the
use of the MBTI, that may supplement the admission techniques already in place thus
helping to more accurately identify students who will be successful in the interior design
programs at universities throughout the Interior Design Educators Council (IDEC)
Southwest Region.
It was believed that certain personality types will be attracted to interior design as
a major because the requirements of the discipline coincide with their personality
preferences, and that these personality types will be more prevalent in the senior year of
the program than in the freshmen year. Additionally, it was believed that, despite the
attraction of certain personality types to interior design as a major, there will be a
considerable mix of personality types in each of the academic levels studied, but
especially at the freshman level. Bonner (1989) found that students of all personality
Texas Tech University, Rosemary Peggram, December 2007
7
types chose interior design as a major, and student personality types at the junior and
senior years were more homogeneous.
This researcher hopes that knowledge gained from the study can help lower the
attrition rate in the first two years of study in interior design, add to the predictive power
of the SAT/ACT and high school class rank, aid in more efficient enrollment
management techniques, and minimize time and money lost due to student/program
incompatibility. The objectives of this study were:
1. To assess the personality types, using the MBTI, of senior interior design
students.
2. To compare personality types of interior design students in their first year of
college with those in their last year of college to determine if differences
exist between entering students who have been admitted into an interior
design program and those who have persisted to the senior year.
3. To analyze the ability of current college admission practices (SAT/ACT
scores and high school class rank) to predict academic success and program
persistence of interior design students.
4. To develop a profile of students most likely to persist and succeed in interior
design using cognitive and non-cognitive measures.
Theoretical Framework The MBTI is based on Jung’s (1923) theory of psychological types. It is only one
part of his personality theory and is concerned mainly with conscious elements of the
personality. Jung’s theory assumes that to function well an individual must have a well-
developed system for perception and a well-developed system for making decisions or
Texas Tech University, Rosemary Peggram, December 2007
8
judgments; there must be a way to perceive the stimulus and to make an adequate
response.
The theory postulates that there are four basic mental processes (sensing,
intuition, thinking, and feeling) used by everyone but not equally preferred or developed.
Every person, regardless of type, uses all four processes, but persons of each type are
distinguished by their relative preferences for each of the four, and by the attitude
(extraversion or introversion) in which they use them. In normal development, members
of each type are motivated to use the processes they are disposed to prefer; through
practice they develop expertise in the activities for which their preferred processes are
particularly useful. Skills and increased interests grow from “specializing” in preferred
functions and lead to characteristic habits, attitudes, and traits associated with the type
(Jung, 1923). Types are described as being dynamic, not static. Further discussion of
Jung’s’ theories and the MBTI are included in Chapter 2.
Importance of the Study Admission to many colleges and universities is determined by the applicant’s
scholastic record in high school and performance on the SAT or ACT. During the
1980’s, there was a drop in the predictive validity of the SAT (Willingham, Lewis,
Morgan, & Ramist, 1990). With the SAT beginning to show signs of weakness as a
selection device, one can anticipate a demand for better predictors of college GPA.
Research suggests that personality traits may contribute to the prediction of academic
performance by revealing non-cognitive variables affecting academic success or failure.
Very little prediction research has been completed using design related areas of
study, but even less has focused on interior design specifically as a pre-selected major for
Texas Tech University, Rosemary Peggram, December 2007
9
students at the university level. One study by Volpe (2000) compared lower and upper-
level interior design students with non-interior design students on learning styles and
personality type. Volpe’s sample was small but results indicated a significant difference
in the personality types of interior design students versus non-interior design students.
The MBTI was used in conjunction with a career aspiration assessment in Russ and
Weber’s (1995) research on Oklahoma State University interior design students. While
the results of this research did not show a significant correlation between personality and
career goals, it did indicate that the variety of career possibilities interior design has to
offer would suggest personality assessments have merit.
It is the goal of this researcher to add to the body of knowledge by assessing
personality types of interior design students in the hope of improving the prediction of
academic success over currently used measures. This study seeks to provide meaningful
data with predictive potential for student persistence in an academic interior design
program. This study also will serve to inform the formulation of student profiles that
facilitate student admissions into interior design programs. Therefore, the research
questions are:
1. What are the most common personality types of senior interior design
students as described by the Myers-Briggs Type Indicator?
2. Is personality type a significant predictor of interior design student
success and persistence when controlling for ACT/SAT scores and high
school rank?
3. Do personality type differences exist between senior and freshmen
interior design students at each university surveyed?

Texas Tech University, Rosemary Peggram, December 2007
10
4. What is the profile of successful senior interior design students?
Definition of Terms The following definitions help to clarify some terms used in this research:
Academic success – success as determined by a cumulative grade point average
(GPA) of 3.0 or higher.
Anglo - also known as Caucasian or White/non-Hispanic ethnicity.
Program persistence – a student’s choice to remain in a chosen program through
graduation.
Sophomore Portfolio Review – a review process commonly found within the first
three semesters in an interior design program where student work is evaluated by faculty
or design professionals for quality and demonstrated understanding of concepts, skill, and
competence. When students successfully pass this review, they are free to enroll in upper
level coursework. In some programs, students are now officially matriculated into
Interior Design.
Interior Design Educators Council (IDEC) – a nationwide professional
organization for interior design educators. The Southwest Region is a regional
component of IDEC that includes all colleges and universities that offer interior design
programs in Arkansas, Louisiana, Oklahoma, Colorado, Texas and New Mexico.
Council for Interior Design Accreditation (CIDA) – provides the foundation for
excellence in the interior design profession by setting standards for education and
accrediting academic programs that meet those standards.
The following eight operational definitions apply to the attitudes and mental
powers used in the MBTI as defined by McCaulley (1990).
Texas Tech University, Rosemary Peggram, December 2007
11
Extraversion Attitude (E) – refers to a person who seeks engagement with the
environment and gives weight to events in the world around them.
Introversion Attitude (I) – refers to a person who seeks engagement with their
inner world and gives weight to concepts and ideas to understand events.
Sensing Perception (S) – these people are interested in what is real, immediate,
practical, and observable by the senses.
Intuitive Perception (N) – these people are interested in future possibilities,
implicit meanings, and symbolic or theoretical patterns suggested by insight.
Thinking Judgment (T) – thinking persons rationally decide through a process of
logical analysis of causes and effects.
Feeling Judgment (F) – these people rationally decide by weighing the relative
importance or value of competing alternatives.
Judgment (J) – a person who enjoys moving quickly toward decisions and enjoys
organizing, planning, and structuring.
Perception (P) – a person who enjoys being curious and open to changes,
preferring to keep options open in case something better turns up.
Assumptions The following assumptions were included in the study:
1. The respondents understood and answered the questionnaire accurately and
truthfully.
2. The respondents were not influenced by extraneous variables.
3. The sample is truly representative of the population of interior design students
in the IDEC Southwest Region.
Texas Tech University, Rosemary Peggram, December 2007
12
4. The researcher would have reasonable access to student participants at
universities in the IDEC Southwest Region.
5. The sample chosen would provide an adequate number of interior design
student participants to enable comparisons, regressions, survey studies, and
creation of a profile.
6. The instruments selected to provide data to meet the objectives of this study
were appropriate.
7. The sample was random because no procedures systematically eliminated
students from the study.
Limitations
The limitations affecting this study were:
1. Personality type was identified through the use of a self-report instrument
(MBTI). Student participants’ self-report of their personality types may be far
different than their actual practices.
2. Inherent in this study were the imperfections of survey research, such as
obtaining a reasonable number of responses and length of time taken in
mailing and waiting for survey responses.
Delimitations
This study has four delimitations. First, the study used convenience and cluster
sampling. Because the participants were not systematically or randomly selected, the
researcher cannot say with confidence that they are representative of the population.
Second, the findings of this study only provide information about interior design students.
Generalizations to other related fields such as architecture cannot be made, nor can

Texas Tech University, Rosemary Peggram, December 2007
13
generalizations to interior design professionals be made. Third, participant interior
design students may not be representative of interior design students in other geographic
regions. The last delimitation could be the use of the MBTI instrument for prediction
purposes; another instrument might yield different results.

Texas Tech University, Rosemary Peggram, December 2007
14
CHAPTER II
LITERATURE REVIEW
Extensive research has been conducted over past decades to identify predictors of
college academic success. Mouw and Khanna (1993) indicate that the prediction of
academic success in college has become “a large scale operation.” Psychologists have
developed a wide range of intellectual, motivational, aptitude, achievement, and
personality measurements that have been used to predict college performance. There is a
considerable amount of data on academic predictors of student potential for success in the
college setting both at two-year and four-year institutions. This review focuses on four-
year universities.
Attempts have been made to predict success in the area of education for many
years. These attempts have not been limited to any one academic level nor has there been
just one subject area or profession treated. Prediction studies have been completed in
almost every discipline. This review found research related to predicting student success
in business (Rothstein, Paunonem, Rush & King, 1994), medicine (Hoschl & Kozeny,
1997; Lievens, Coetsier, De Fruyt, & De Maeseneer, 2002), psychology (Busato, Prins,
Elshout, & Hamaker, 2000; Ridgell & Lounsbury, 2004; Wolfe & Johnson, 1995),
engineering (Brown, 1994; Levin & Wyckoff, 1995; Lievens, Coetsier, De Fruyt & De
Maeseneer, 2002), accounting (Oswick & Barber, 1998), education (McClelland, 1966),
and economics (Lievens, et al., 2002).
Literature predicting student persistence and success in the field of art and design
was very limited. A study by Guazzo (1954) that was undertaken to determine which
factors were related to academic success in architecture students was found to be very

Texas Tech University, Rosemary Peggram, December 2007
15
dated, lacked personality factors, and eliminated females from the sample. The latter two
factors are a primary interest of this research project. No research was found in interior
design related to predictions of academic success and persistence.
This review of the literature is organized around the following areas of academic
prediction. First, cognitive measures used for prediction of academic performance are
discussed. Standardized aptitude tests and high school average or rank are each discussed
separately and then in combination regarding their success in predicting college academic
performance. Second, non-cognitive measures for prediction of academic performance
are discussed. Sex, socio-economic status, and personality are each discussed separately
concerning their success in the prediction equation. The remainder of the literature
review focuses on personality. A report on Carl Jung’s theory of psychological types is
followed by an examination of an instrument founded on Jung’s theory, the Myers-Briggs
Type Indicator (MBTI). The next section reports on research examining the MBTI, along
with SAT/ACT scores and high school GPA/rank, in predicting college performance and
persistence. The last several sections focus on personality and its relationship to
occupations or disciplines of study, such as the field of art and design. All of these areas
are discussed in depth and assessed for relationship to this investigation.
Cognitive Measures for Prediction of Academic Performance Standardized Aptitude Tests.
The influx of discharged military personnel after World War II and the
subsequent GI Bill of Rights provided unprecedented access to higher education for
Americans and created a need for colleges and universities to be more selective in the
students they admitted. One method of selectivity was to try to determine which
Texas Tech University, Rosemary Peggram, December 2007
16
applicants were most likely to be successful in their chosen academic program. To this
end, the Educational Testing Service was founded in 1947 (What is ETS, 2005), and
colleges and universities began to routinely use the ETS’s Scholastic Aptitude Test
(SAT) as an admissions tool. Likewise, the American College Testing Program, which
administers the ACT test, was founded in 1959. Both the SAT and the ACT were
designed to help students make better decisions about which colleges to attend and which
programs to study, and to provide information helpful to colleges both in the process of
admitting students and in ensuring their success after enrollment (History of ACT, 2005).
Since these two tests have been routinely administered, literally thousands of
articles reporting on their validity and predictive ability have been published. In an
exhaustive study, Alexander Astin (1971) examined the SAT and ACT scores of 36,581
students for 180 schools who entered college in the fall of 1966 and determined the
relationship between these tests and the students’ freshman grade point averages. He
noted that the primary purpose of these tests was to predict academic success in college
and to estimate the chances of a student’s academic survival. In addition to the
standardized tests, Astin also examined the role of high school grades, gender, family
background, career interests, and other factors in predicting success in college and found
significant correlations. Some of these aspects will be discussed later in this review.
Cronbach (1949) in an earlier review reported that on the college level ability
tests correlate about .50 to .55 with college grade point averages. More recent research
indicates that the correlations average about .28, with a range of about .16 to .50
(Aleamoni & Oboler, 1978; Mouw & Khanna, 1993; Willingham, Lewis, Morgan, &
Ramist, 1990; Edwards, 1998; Astin, 1971; Goldman & Slaughter, 1976). Typically, the
Texas Tech University, Rosemary Peggram, December 2007
17
correlation range is higher for the ACT (.40 - .50) than for the SAT (.27 - .42) (Noble,
1991).
All of this research recognizes that tests of ability alone are probably not the best
instrument for the prediction of scholastic success at the university level. Prior academic
achievement, intelligence tests, and subject matter retention examinations as predictors of
student performance often do not include non-cognitive variables, which may influence
performance. The College Admission Testing Program has examined test offerings in
regard to assessing a wider range of talent than previously measured. One increasingly
important purpose of testing, in addition to selecting an academically qualified freshman
class, is to help in the guidance and course placement of admitted students. It is in the
more traditional academic courses with apparently rigorous grading that SAT scores tend
to show the strongest relationship with academic performance in college (Willingham et
al., 1990).
Clifford and Fishman (1963), in the National Society of Education Yearbook,
assessed the impact of college selection testing programs and cautioned that testing data
generally put to test only those aspects of behavior that are most responsive to objective
measurement and quantification, thus academic aptitude, developed mental ability, or
academic achievement. Other kinds of important information should supplement the data
yielded by college selection testing programs. Relatively high scores on admission tests
do not guarantee success in academic performance. Investigations of actual individual
performance have shown that over 30% of the students whose ACT scores predicted
strong academic performance left college without graduating, and almost 50% of the
Texas Tech University, Rosemary Peggram, December 2007
18
students whose ACT scores predicted poor academic performance succeeded in
graduating (Mouw & Khanna, 1993).
Attacks on standardized tests are not new, but it is hard to match recent critiques
for detail and depth of feeling. Two basic criticisms are made. First, the tests are said to
be poor predictors of later academic performance, and later academic performance is said
to be a poor predictor of success in life; so, in the language of the testers, the tests lack
predictive validity. Second, the use of current tests is alleged to discriminate against
applicants from minority groups and lower-class backgrounds (Klitgaard, 1985). In other
words, tests are said to add little and take away a lot. The issues are in urgent need of
clarification, and the use of test scores in admissions requires fundamental re-
examination.
Another index of ability involves measures of prior scholastic performance as predictors of future performance. A common example is the use of high school average or rank to predict college grades. High School Average or Rank.
Of all the measures used in prediction batteries, the one that consistently emerges
as the best single predictor is the high school grade point average (HSGPA) or high
school rank (HSR) (Lavin, 1965; DuBois, 1972). Swensen (1957) found that students in
the upper two-fifths of their graduating class in high school received significantly higher
grades at the end of the first semester of college than students who graduated in the lower
three-fifths of their high school class, even though these two groups did not differ on a
standard aptitude test. Cattell (1968) noted that high school record was a better predictor
of college achievement than SAT scores, except when predicting success in engineering.

Texas Tech University, Rosemary Peggram, December 2007
19
More recent research also notes HSGPA is a powerful predictor of college success.
Geiser & Santelices (2007) found that high school grades are better predictors of success
in college than are SAT scores. They report that high school grades are at least as strong
a predictor of cumulative four-year college grades as they are of first-year college grades.
Astin (1971), analyzing the relationship between HSGPA and college GPA in the
freshmen year for 16,000 students, found that HSGPA was a slightly better predictor than
ability test scores. An ACT (1997) study showed that HSGPA was a slightly better
predictor of first-year college GPA’s of 2.00 or higher than were ACT scores. However,
for predicting whether students earn a 3.00 or higher college GPA, ACT scores and
HSGPA had the same accuracy. Consistent with prior research, Noble and Sawyer
(2002) found HSGPA predictions of first-year GPA’s of 2.5 and 3.00 were somewhat
more accurate than those based on ACT scores.
After conducting an extensive review, DuBois (1972) estimated .55 as an
“average” validity coefficient for this predictor. Passons (1967) reported results that
established high school grades as the best single predictor of academic prowess, yielding
a validity of .41. In a similar study, Mancott (1968) reported a validity coefficient of .589
between HSGPA and first semester college grades. Lins, Abell, and Hutchins (1966)
conducted research on predicting college GPA with HSR and extended their criterion
measure from one-semester to one-year. The observed correlations rose from .507 to
.513 for males and from .501 to .508 for females. The data here may suggest that as the
criterion becomes more stable, by providing more grades (information) representing the
students’ academic abilities, the task of prediction is somewhat facilitated. Wately and
Merwin (1964) dichotomized their criterion (finished first year/did not finish first year)

Texas Tech University, Rosemary Peggram, December 2007
20
and attempted to predict it with HSGPA. Again, the reported validity coefficient of .57
substantiates this predictor’s role in estimating college performance. In a rare study
correlating HSGPA with a cumulative record of college success collected over a four
year period, Irvine (1966) reported a validity of .343 in estimating the dichotomous
criterion of graduation/non-graduation. These findings support a commonly held belief
that the best predictor of future behavior is past behavior.
Apart from test scores, grades have also been criticized for being unreliable as a
prediction criterion. A student’s previous grades in school are also widely used by
admissions committees to gauge both aptitude and academic preparation. But the late
1960’s and 1970’s witnessed an unprecedented inflation in college and high school
grades. Moreover, grades are notoriously inexact and unreliable, even within the same
course (Klitgaard, 1985). Add the problems of comparing grades across courses, fields,
and schools, and it is not surprising that grades are problematic both as predictors and as
measures of academic success. In summary, high school grades have great value, but
they are subject to variability from place to place. And although HSGPA has been used
conventionally as an ability measure for predicting college performance, it should be
noted that ability is not the only factor determining the high school record. Numerous
personality and social factors are involved.
Standardized Tests and High School Rank
Literally thousands of studies have found that the combination of high school
grades plus college admissions tests is a more effective predictor of the student’s
readiness than either one alone (Chemers, Hu & Garcia, 2001; Dyer, 1987; Mathiasen,
1984; Stricker, Schiffman & Ross, 1965; What is ETS? 2005, Mouw & Khanna, 1993;

Texas Tech University, Rosemary Peggram, December 2007
21
Ramist, Lewis & McCamley-Jenkins, 1993). The Educational Testing Service says this
about the SAT,
We know that there are a small number of students whose standardized test scores are inconsistent with their school grades. Such disparities are one of the reasons why we believe that no single factor should be used as the sole criterion for any important educational decision. No single test can give a complete picture of an individual, and we urge score users to view a test score as simply one of the many pieces of information available about a student. (What is ETS?, 2005, p.3)
When used in conjunction with high school rank, test scores provide an objective
alternate admissions credential, a standard measure on all students regardless of school
background, and a means of identifying exceptional students whose records may not
reflect their abilities. Interestingly, Willingham et al. (1990) found that the SAT was a
better predictor of grades for less able students than were high school grades.
Willingham et al. (1990) also examined trends over two decades and concluded that from
the mid-1960’s to the mid-1970’s SAT correlations with college freshmen grade point
average tended to go up while HSR correlations tended to go down, but there was little
change in overall predictability of freshmen GPA. From the mid-1970’s to the mid-
1980’s there was a gradual decline in predictability of freshmen GPA, reflected
somewhat more in SAT scores than in HSR. Using individual course grades as the
criterion presents a very different picture of predictive validity and a substantially larger
contribution by the SAT than when freshmen GPA is the criterion.
Evidence shows that measures of ability, using aptitude tests and HSGPA, most
often range from 25% to 50% of the variation in academic performance. McCausland
and Stewart (1974) found that high school grades and ACT scores accounted for 50% and
44%, respectively, of the variance among the students in first year GPA. Wolfe and
Johnson (1995) report that the two variables together usually account for about 25% of

Texas Tech University, Rosemary Peggram, December 2007
22
the variance in grade point average. Ramist, Lewis, and McCamley-Jenkins (1993)
reported findings that the SAT adds substantially to the prediction, representing an
increment of almost .10 beyond HSGPA to the total correlation. When using both the
SAT and HSGPA the correlation is an unusually high significance at about .70.
Nevertheless, while no other single type of factor accounts for this much variation, more
than half still remains unexplained. Thus, attention turns to other factors of a non-
intellective nature which may be pertinent.
Non-intellective Measures of Success
Three factors emerge as basic correlates of academic performance. These are
ability, sex, and socioeconomic status (SES). Lavin (1965) called these “basic”
correlates, not because they are theoretically more significant than other variables, but
because they are related to performance more consistently. Thus, ability is directly
related to school performance; females have higher levels of academic achievement than
males; and students of higher SES perform at higher levels than students of lower SES.
Ability has already been discussed thus, the two other factors, sex and SES, remain to be
examined.
Sex
It has long been observed that women earn higher college grades than expected on
the basis of their scores on ability or achievement tests (Wagner & Strabel, 1935; Astin,
1971; Stricker, Rock, & Burton, 1993; Keller, Crouse, & Trusheim, 1993; Young, 1991).
This implies that the grade predictions by the standardized tests are unfair to women,
because the predicted college grades of women are consistently lower than those of men
who earn equal grades (Stricker, Rock, & Burton, 1993). The fact that women

Texas Tech University, Rosemary Peggram, December 2007
23
consistently get better grades in school than men raises the issue that the relation between
college course grades and predictors such as aptitude test scores is different for men and
women. Hundreds of studies have found that females obtain higher grades than males at
the high-school level (Astin, 1971). Among high-school graduates headed to college,
women have the higher HSGPA (College Entrance Examination Board, 1985) and
continue to earn the higher GPA at the college freshman level (Astin & Panos, 1969). In
brief, research suggests that ability and school performance are more highly correlated
for females. This is particularly interesting research for the current study because interior
design as a discipline tends to be female dominated.
Clark and Gandy (1988), who controlled for differences in academic program,
found that sex differences in over-predicting and under-predicting college freshmen GPA
were decreased when the SAT and HSGPA were used for students in specific curricular
areas (engineering, business, etc.) in 12 institutions. Sex differences in over-and under-
prediction of GPA by the SAT at four University of California campuses were reduced by
about two-thirds when college major was controlled (Hewitt & Goldman, 1975).
Stricker, Rock, and Burton (1993) found that with a raw GPA of 2.61, women in their
study would have a predicted GPA of 2.51, meaning that the SAT-based prediction
method under-estimates what women are actually able to receive by at least .10. This
level of under prediction is very close to that reported in previous studies of the SAT and
ACT. Women could be adversely affected if decisions about admissions, scholarships,
and similar academic matters were made solely on the basis of grade predictions from a
single equation, such as the SAT (Young, 1991). Rather than condemn the use of
standardized tests as summarily handicapping different segments of the population, we

Texas Tech University, Rosemary Peggram, December 2007
24
might do better to concern ourselves with issues such as group differences in
nonintellectual variables such as personality traits.
All the prior discussion basically means that when males and females are not
separated in analysis, the magnitude of correlations between ability and school
performance will not accurately reflect the true level for the sexes separately. Also, the
variables that predict performance for males may be different from the variables that are
predictive for females, and even if the same variables are involved for both sexes, the
direction of the relationship might differ (it might be positive for males and negative for
females). For these reasons, it is important to perform separate analyses for each sex.
Socio-economic Status
Astin (1971) found that the “over-achiever” was more likely than was the “under-
achiever” to have graduated from a private high school. He also reported that students
whose parents are highly educated obtain better-than-average freshmen GPAs. These
differences are attributable only in part to the somewhat greater average ability of these
students. Possibly this reflects a greater degree of continuous pressure for high
achievement, which characterizes highly educated parents. Astin found the income of the
students’ parents has no relationship to freshmen GPA.
After conducting an extensive longitudinal study of over one million college
students, Holmstrom (1975) concluded that such factors as demographic attributes,
socioeconomic background, academic ability, self-image, and values influence such
outcomes as one’s probable major, actual major, career choice, and academic success.
Socioeconomic status exhibits a positive association with academic performance.
The most likely interpretation is that SES is a variable that summarizes a variety of

Texas Tech University, Rosemary Peggram, December 2007
25
personality characteristics. These findings suggest that the social classes differ in terms
of behavioral patterns such as child-rearing practices. These patterns, in turn, may be
determinants of personality characteristics and values that are related to academic
achievement. Thus, the observation of differences in academic performance according to
SES should sensitize us to the kinds of personality variables that are relevant.
Personality
Psychologists interested in the development of students increasingly are in the
position to illuminate individual differences and their implications for education. One of
the problems confronting those engaged in psychological research in higher education is
the need to sort out, among the great array of individual difference, the differences
attributable to various levels of maturity, and the differences attributable to variations in
temperament. Where a student stands in regard to temperament and level of development
is reflected in characteristic patterns of behavior: that is, in his or her personality.
One’s personality represents the individual characteristics of his behaviors, habits,
attitudes, and value systems. Kaiser and Bostrom (1982) state, “either the skills required
in a particular setting may attract individuals with particular personality characteristics, or
the tasks that are performed in a user area or in a specific environment may cause these
characteristics to be developed or reinforced” (p. 44).
Although no one particular definition of personality is universally agreed upon by
psychologists, there are certain components of personality that are widely accepted.
Personality is described as all the characteristics of each individual that identify him as
being unique from other persons: “The combination of all the traits, sentiments,
aptitudes, prejudices, emotions, attitudes, moods, self-perceptions, abilities, interests,
Texas Tech University, Rosemary Peggram, December 2007
26
skills, recollections, desires, ambitions and manners which make up the individual”
(Heim, 1970, p. 53).
School achievement has long been known to be partially predictable by tests of
ability, and particularly by tests of general intelligence. It also has been shown that
personality factors can be used to predict achievement (Cattell, 1968; Dyer, 1987).
Academic success predictors usually consist of cognitive measures pertaining to mental
ability or intelligence; and non-cognitive measures, especially personality traits. Results,
while occasionally varied, have continued to support the conclusion that both cognitive
ability factors and certain personality traits consistently predict academic performance
(Barrick & Mount, 1991; Dyer, 1987; Hoschl & Kozeny, 1997; Mouw & Khanna, 1993;
Rau & Durand, 2000; Rothstein, Paunonem, Rush, & King, 1994; Wolfe & Johnson,
1995).
Mathiasen (1984) reviewed over 60 studies that investigated the predictors of
college academic achievement. His findings indicate that, in general, successful college
students excelled in high school, obtained high scores on college entrance exams, possess
good study habits, and appear to be more introverted, more responsible, more
academically motivated, and more achievement oriented than most college students.
Research continues in these areas and appears to focus on the following factors: high
school performance, college entrance examinations, and personality traits, including
study behaviors and attitudes.
Personality, interest, and cognitive variables combined to account for the major
portion of the variance in predicting first-semester GPA in a study by Brown (1994).
Brown (1994) states that it may be, at this level, cognitive variables are not as important
Texas Tech University, Rosemary Peggram, December 2007
27
in predicting because students have already been screened and admitted on the basis of
cognitive variables. This could indicate that all the students are able to perform
academically and thus other variables, such as personality, play a larger role in their
actual achievements. A much older study (Stone, 1958), which used more than 20
measures of ability, interests, personality, and temperament, reported that for male
college seniors majoring in the physical sciences, the battery that best predicted academic
performance included measures of general intelligence, mechanical interest, morale,
stability, and activity level. The addition of personality factors to this study more than
doubled the efficiency of prediction when compared to using ability measures alone.
Volpe (2000) said “learning and personality style assessments make sense in
order to assess major and minor strengths and weaknesses in students.” Kahn, Nauta,
Gailbreath, Tipps, and Chartrand (2002) examined the ability of four career and
personality assessment inventories to predict students’ first-year college performance and
persistence. Subscales from the Myers-Briggs Type Indicator, Strong Interest Inventory,
Social Skills Inventory, and the Career Factors Inventory uniquely predicted first-year
college GPA and contributed to the prediction of freshmen-to-sophomore persistence,
each after controlling for ACT/SAT scores. Their findings suggest that college
counseling and career center staff may provide valuable support to retention-promotion
efforts by helping to identify students at risk for poor academic performance or attrition
on the basis of commonly used career and personality assessment inventories.
However, not all studies have drawn the same conclusion. Oswick and Barber
(1998) concluded that, in terms of performance on an introductory level accounting
course, personality type does not appear to have a bearing upon the level of achievement,

Texas Tech University, Rosemary Peggram, December 2007
28
and furthermore the personality type distributions for top performers and poor performers
were not substantially different.
Given the variety of occupations available, the identification of a career in an area
of interior design could have implications for differing personality types. Studies have
shown that when there is a mismatch between personality type and occupation, an
individual reports feeling tired and inadequate (Myers & McCaulley, 1985). According
to personality type theory, the individuals experience fatigue because they are using the
less-preferred processes of their personality type. This mismatch can also cause
discouragement because greater expenditure of effort is required and the work product is
likely to be of lesser quality than if the preferred processes had been utilized (Myers &
McCaulley, 1985; Williams, Armstrong, & Malcolm, 1985).
The variety of personality variables is interesting and vast. Some variables seem
to refer to motivational states (e.g., anxiety, achievement motivation, and level of interest
in different content areas). A second type involves what might be termed personality
“style.” Illustrative are factors such as degree of independence, impulse control, and
introversion. A third factor, which involves the cognitive level, is self-concept. Still
other factors, such as measures of study habits, seem to point more directly to the
behavioral level. Finally, some studies focus upon manifestations of pathology to
account for achievement. A student’s personality style and how that might affect
academic performance and success is of major interest in the present study.
Theoretical Basis – Jungian Theory
Individual styles of thinking and the approach one takes in solving a problem are
dependent on one’s personality. Styles of personality and temperament theories are as

Texas Tech University, Rosemary Peggram, December 2007
29
numerous and diverse as academic assessments. Much of the current research on
temperaments and personality stems from the research of Carl Jung, a psychiatrist from
the early 1920’s. He said that people are different in fundamental ways even though they
all have the same multitude of instincts (archetypes) to drive them from within. One
instinct is no more important than another. What is important is our preference for how
we “function.” Our preference for a given “function” is characteristic, and so we may be
“typed” by this preference. Thus Jung invented the “function types” or “psychological
types” (Keirsey & Bates, 1984).
Jung’s (1923) model of psychological types describes four mental powers and
four attitudes. The four mental powers are (a) sensing, (b) intuition, (c) thinking, and (d)
feeling. The four attitudes are (a) extraversion, (b) introversion, (c) judgment, and (d)
perception. Jung described three different dimensions of personality in his
“psychological types”:
1. “the way people relate to the world,
2. the way information is taken in, and
3. the way information is processed, i.e., decision making style” (Kaiser &
Bostrom, 1982, p. 45).
The first dimension, the way people relate to the world, looks at the continuum
from those who are drawn to the inner world of ideas (introverts), to those who are drawn
to the outer world of people and things (extroverts). Extroversion and introversion are
the two attitudes or orientations that most obviously describe our personality. Jung
(1923) regarded extraversion and introversion as “mutually complementary” attitudes;
their differences “generate the tension that both the individual and society need for the

Texas Tech University, Rosemary Peggram, December 2007
30
maintenance of life” (p. 160). Jung thus saw both extraversion and introversion as
necessary for psychological adaptation. Secondly, Jung believed that people differ in the
ways they take in information (perception). This is done by both using the five senses
and relying on facts and data (sensing) or by conceptualizing with the “sixth sense” and
little data (intuition). A sensing person focuses on immediate experiences and what
exists. On the other hand, an intuitive person refers to the perception of possibilities.
Intuitive perception is more closely related to creative discovery; whereas sensing
perception is related to practicality and realism. The last dimension is judgmental. The
ways people make decisions or how information is processed is judgment. People
primarily draw conclusions about the information they process either by using logic and
analysis – thinking - or by using emotion and value judgments – feeling. A thinking
person makes logical decisions, whereas a feeling person bases their decisions on a more
subjective aspect of personal and group values. Literature suggests that a feeling person
would have more creative tendencies (as discussed later in this chapter).
Jung theorized that people could possess aspects of all traits but they would not be
equally preferred or developed. Every “type” uses all four processes, but persons of each
type are distinguished by their relative preferences for each of the four, and by the
attitude in which they use them. In normal development, members of each type are
motivated to use the processes they are disposed to prefer; through practice they develop
expertise in the activities for which their preferred processes are particularly useful.
Skills and increased interests grow from “specializing” in preferred functions and lead to
characteristic habits, attitudes, and traits associated with the type. These traits will
Texas Tech University, Rosemary Peggram, December 2007
31
identify how, in most cases, that person approaches problems, interacts with people, and
makes decisions.
The Jungian typology does not set down as a rule that one type of temperament is
superior to any of the others but rather points out that each type contains major strengths
as well as weaknesses. Jung’s theory assumes that to function well an individual must
have a well-developed system for perception, and for making judgment decisions; there
must be a way to perceive the stimulus and to make an adequate response.
Personality Traits as Indicated by the Myers-Briggs Type Indicator
The Myers-Briggs Type Indicator (MBTI) is the most widely used personality
inventory in the world and provides an accurate picture of a person’s personality type
(Myers & Briggs Foundation, 2005). McCaulley (1985) states that the MBTI is “one of
the most widely used tools for working with normal populations (p.181).” The
instrument has been used in a variety of settings including business, medicine, career
counseling, and education. It also has been used in the field of interior design (Bonner,
1989; Diehl, 1992; Lim, 1991; Russ & Weber, 1995) which is of interest in this study.
The MBTI has been widely studied, producing extensive data and literature bases.
Additionally, the test is easy to administer and inexpensive to score. Jung’s model was
used as the theoretical base for the MBTI. Isabel Briggs Myers and Katharine Cook
Briggs developed the MBTI, which was published in 1962. Research suggests that
personality type is associated with learning styles (Volpe, 2000) and career choice
(Martin & Bartol, 1986; Pinkney, 1983; Hammer & Macdaid, 1992) and therefore
provides moderate predictors of academic performance in a college setting.
It is important, however, to recognize that

Texas Tech University, Rosemary Peggram, December 2007
32
the Myers-Briggs Type Indicator measures only preference toward a certain type. If one has a high score on one dimension, the other dimension on the continuum is viewed as complementary. MBTI does not necessarily indicate that one is deficient with regard to a particular dimension if one receives a low score; it only indicates a preference for the complementary score. (Kaiser & Bostrom, 1982, p. 46)
The MBTI instrument is a self-report inventory that determines preferences on
four dichotomies:
• Extraversion (E) – Introversion (I): describes where people prefer to focus
their attention and get their energy – from the outer world of people, things and
activity or their inner world of ideas, concepts, and experiences.
• Sensing (S) – Intuition (N): describes how people prefer to take in information –
focused on what is real and actual by using the five senses or on patterns and
meanings of data obtained indirectly via the unconscious.
• Thinking (T) – Feeling (F): describes how people prefer to make decisions or
evaluate phenomena – based on logical analysis, rational and impersonal or
subjectively, guided by concern for their impact on others.
• Judging (J) – Perceiving (P): describes how people prefer to deal with the outer
world – in a planned orderly way with tendencies to reach conclusions or
becoming aware of them in a flexible, spontaneous way. (Myers & McCaulley,
1985)
Combinations of these preferences result in 16 distinct personality types. These 16 types
stem from a combination of four mental powers and four attitudes discussed earlier. To
fully understand these temperament types, there are several points that should be realized
about Jung’s theory. First, Jung did not segregate four pairs of temperament types to be
either one or the other. It should be noted that an individual could be one type in some

Texas Tech University, Rosemary Peggram, December 2007
33
degree and at the same time be the opposite in some degree. Second, while an individual
prefers to be one or another of the four different types, Jung admits that as time passes,
changes may occur in an individual’s preference that may strengthen or weaken it. Third,
disagreements remain unsettled regarding whether these preferences are “inborn” or
chosen later through time and under given environments (Keirsey & Bates, 1984).
Myers and McCaulley (1985) refer to the MBTI as an instrument that is
concerned with the valuable differences in people that result from the way they like to
perceive and to judge. Succeeding takes both perception and judgment. The problem or
situation is first identified, then various things that can be done about it are assessed, and
finally a decision is necessary to determine what to do. Finding out is an exercise of
perception; deciding is an exercise of judgment.
According to Myers (1962), opposite ways of finding out are sensing and
intuition. The opposite ways of deciding are thinking and feeling. Extraverted thinkers
Table 2.1 The Four Preferences of the MBTI ________________________________________________________________________ Index Preferences between Affects Choices as to EI (E) Extraversion or Whether to direct perception judgment mainly on (I) Introversion the outer world (E) or mainly on the world of ideas (I) SN (S) Sensing perception or Which kind of perception is preferred when one (N) Intuitive perception needs or wishes to perceive TF (T) Thinking judgment or Which kind of judgment to trust when one needs or (F) Feeling judgment wishes to make a decision JP (J) Judgment or Whether to deal with the outer world in the judging (P) Perception (J) attitude (using T or F) or in the perceptive (P) attitude (using S or N) Myers & McCaulley, 1985, p.2

Texas Tech University, Rosemary Peggram, December 2007
34
are logical, analytical, often critical, impersonal, and unlikely to be anything but
reasoning. Introverted thinkers are quiet, reserved, detachedly curious, and quite
adaptable until their ruling principles are violated. Extraverted feeling types are friendly,
tactful, and sympathetic. The introverted feeling types seldom express their deepest
feelings. The extraverted sensing types are adaptable realists where the introverted
sensing types are factual, painstaking, and systematic. The extraverted intuitive types are
characterized by showing imagination and instigation for originating ideas and the
intuitive introvert is stimulated rather than being discouraged by problems.
In describing the perceptive function, Myers (1962) states that sensing is the term
used for perception of the observable by way of the senses. Intuition is the term for
perception of meanings, relationships, and possibilities by way of insight. With good
type development, the expertise in sensing can lead to a differentiated awareness of
present experience, acute powers of observation, a memory for facts and detail, and a
capacity for realism. Myers and McCaulley (1985) state that development of intuition
can lead to insight into complexity, an ability to see abstract, symbolic and theoretical
relationships, and a capacity to see future possibilities that are often creative ones.
The judgment functions of thinking and feeling are characterized by logical
decision-making. Those who prefer the thinking process include characteristics of
objectivity, impartiality, a sense of fairness and justice, and skill in applying logical
analysis. Feeling leads to development of values and standards, and knowledge of what
matters most to themselves and others.
Texas Tech University, Rosemary Peggram, December 2007
35
Two basic orientations to life, extraversion and introversion, are fundamentally
different attitudes toward the world as suggested by Jung. Myers and McCaulley (1985)
describe the extraverted attitude as one in which attention flows out to the objects and
people of the environment. With the introverted attitude, energy is abstracted from the
environment and conserved by consolidating it within one’s own position. Women have
been found to have higher scores than men on introversion. It is also possible that the
relation between introversion and school achievement shows a sex difference (Cattell,
1968) which relates back to the earlier discussion of sex differences and achievement.
Mathiasen (1984) reported that the best predictor of GPA was the introversion-
extroversion scale score – the higher the introversion score, the higher the GPA.
The MBTI types are not evenly distributed in the general population. Myers
(1962) made the following estimate of Type frequency in the general population in the
United States.
• About 75% prefer extraversion (E)
• About 75% prefer sensing (S)
• About 60% of males prefer thinking (T)
• About 65% of females prefer feeling (F)
• About 55% to 60% prefer judging (J)

Texas Tech University, Rosemary Peggram, December 2007
36
Table 2.2 Estimated Frequencies of the MBTI Types in the General Population
ISTJ 6%
ISFJ 6%
INFJ 1%
INTJ 1%
ISTP 5%
ISFP 5%
INFP 1%
INTP 1%
ESTP 13%
ESFP 15%
ENFP 5%
ENTP 5%
ESTJ 13%
ESFJ 13%
ENFJ 5%
ENTJ 5%
(Kiersey & Bates, 1984; Myers & McCaulley, 1985).
Understanding characteristics unique to each personality type provides insight on how
they influence an individual’s way of communicating and interacting with others.
According to Myers (1962), much apparently random variation in human behavior is
actually quite orderly and consistent because the variations are due to certain basic
differences in the way people prefer to use perception and judgment. Myers and Myers
(1980) shows that different disciplines attract specific MBTI types. Utilization of the
MBTI would provide new insights into the advanced interior design student profile,
descriptions of students who choose interior design as a major, and personality Type
information.
MBTI and Prediction of College Performance and Persistence
The MBTI model and instrument allow educators to gather information about the
way students approach and handle the rigor of college level courses and provide
personality indices that may be relevant to the prediction of performance and persistence.
By adding the MBTI’s continuous scores to the SAT scores and high school rank,
Texas Tech University, Rosemary Peggram, December 2007
37
Stricker, Schiffman, and Ross (1965) were able to produce a slight but significant
improvement in prediction of grades and dropout likelihood in a Wesleyan freshmen
class and again by using estimates, for a Caltech applicant group. Myers, McCaulley,
Quenck, and Hammer (1998) reported that a preference for intuition, which involves
perceiving patterns and relationships in information, is associated with higher scores on
many standardized tests of academic aptitude and achievement. Likewise, students
whose enduring preferences are to be organized and responsive to deadlines
(characteristic of Judging) generally obtain higher grades than students who prefer
flexibility and spontaneity (characteristic of Perceiving). Kalsbeek (1987) reported that 3
of the 4 MBTI preferences were predictive of first-term college GPA, even after
controlling for SAT scores.
Bonner (1989) predicted that an analysis of the MBTI data from different interior
design classes would show considerable heterogeneity in the lower level courses, with a
narrowing of MBTI types becoming apparent in the junior and senior years as students
who are not suited to the field drop out. While statistical calculations on the MBTI data
for the interior design students did show considerable heterogeneity in the lower level
courses, a reliable pattern of selection was not seen in the upper level courses. A small
sample (n= 80) of interior design students might explain the lack of sorting in the upper
level courses.
Because of the apparent value of MBTI preferences in predicting academic
progress, the vast amount of data available on the MBTI, and the popularity of its use,
this researcher explored the MBTI as a predictor of interior design achievement and
freshmen-to-junior persistence.
Texas Tech University, Rosemary Peggram, December 2007
38
Personality Traits and Occupations
Previous research suggests individual profiles may correspond to certain career
fields (Martin & Bartol, 1986; Pinkney, 1983). The kind of person you are and how you
prefer to interact with people, data, and ideas are components of a person’s personality
and psychological profile. Careers involve dealing with these same issues. The extent to
which one will enjoy various careers and settings is determined to some degree by the
type of person one is (Pinkney, 1983).
Keirsey and Bates (1974) discuss the MBTI in detail. They reviewed the 16
personality types and grouped them into four categories according to 2 of the 4
preferences. These four categories are Traditionalist (SJ), Troubleshooter (SP), Catalyst
(NF), and Visionary (NT). Each category has certain characteristics that may impact the
choice of a profession.
The Traditionalist (SJ) is often found in professions such as teaching, religion,
accounting, banking, medical rehabilitation, insurance, and management. In all of these
areas, the Traditionalist is known for being nurturing, conserving, and an historian. A
high percentage of educators/teachers, administrators, and librarians are SJs. SJs also
gravitate toward those occupational settings that require nurturing, such as hospitals.
Institutions that care for the sick and the poor attract the SJs.
The Troubleshooter (SP) gravitates toward jobs where action is involved. Of all
the categories, the SPs are the most capable of long hours of continuous action. These
professions include not only the performing arts, but construction work and related areas
where heavy machinery is involved. The SP is often found pitting human force against

Texas Tech University, Rosemary Peggram, December 2007
39
the forces of nature. An SP will generally be found to work against pressure. Also, the
SP usually works best in a crisis situation.
The Catalyst (NF) is often a writer who wishes to inspire and persuade. Most
writers come from this category, including novelists, television writers, playwrights, and
journalists. NFs also heavily populate the professions of psychiatry, clinical and
counseling psychology, teaching, and the ministry. The NFs feel a need to better the
conditions of people in the world. For this reason, many NFs are found in ministry,
missionary work, and the Peace Corps.
The Visionary (NT) is always striving to find out the why of the universe. They
usually enjoy developing models, exploring ideas, and building systems. NTs are drawn
to fields that require the formation and application of scientific principles. These fields
include science, philosophy, mathematics, logic, and engineering. Areas such as sales
and customer relations hold no appeal for the NT, nor those of clerical work, repair, or
maintenance.
McCaulley (1974), when discussing the teaching-learning process, stated that in a
college sample, the subject-matter preferences attracting 60% of extraverts in the study
were childhood education, business administration, and psychology. Sixty percent or
more of introverts in the sample were attracted to electrical engineering, art, zoology,
philosophy, and forestry. McCaulley reports subjects with thinking preferences to be
interested in building construction, electrical engineering, political science, and business.
McCaulley further identified areas of interest for feeling types preferences to be
education, health related occupations, English, art, and sociology. McCaulley predicts
also that in education, thinking types will score higher on tests of mathematics and
Texas Tech University, Rosemary Peggram, December 2007
40
sciences, and that feeling types will score higher on tests of social sensitivity. Systematic
judging types prefer subjects such as accounting, nursing, physical therapy, engineering,
and childhood education. The more flexible perceptive types prefer subjects such as
forestry, psychology, history, journalism, English, art, and occupational therapy.
In the general population there are approximately three Extraverts (E) for every
Introvert (I), and three Sensing (S) types for every Intuitive (N) type (Myers, 1962).
Myers (1980) found that the thinking-feeling preference is the only one of the personality
trait preferences that shows a marked sex difference. The proportion of feeling types
appears to be substantially higher among women than among men.
Personality Types in Fields of Art and Design
The identification of a career in an area of interior design could have implications
for differing personality types. Personality has consistently been studied in relationship
to creativity (Freud, 1910; Kris, 1952; Jung, 1933, 1966; MacKinnon, 1962; Woodman,
1981). Certain personality traits are recognized as predictors of creative persons. Studies
indicate that artistic interests and the intuition preference are related (Holland, 1985). The
literature supports a relationship between artistic interests and an intuitive personality
orientation for women and men. In contrast to an estimated 25% of the general
population who are intuitive, 90% of the creative writers, 92% of the mathematicians,
93% of the research scientists, and 100% of the architects are intuitive as measured by the
MBTI (MacKinnon, 1962).
An experiment by Martin and Bartol (1986) compared the MBTI to the
Vocational Preference Inventory (VPI) and found that a higher score on the artistic sub-
scale of the VPI was likely to be correlated with a higher intuitive score on the MBTI
Texas Tech University, Rosemary Peggram, December 2007
41
sensing-intuition scale (Myers & McCaulley, 1985). The literature shows some
disagreement over the traits of sensing and intuition. Child (1965) notes that sensing and
intuition are related to art; for example, people who have great esthetic sensitivity prefer
sensing over intuition. However, several studies cited by Myers and McCaulley (1985)
show that artists and creative people in general prefer intuition over sensing.
That a relationship between personality and artistic performance does exist is well
established in analyses by numerous writers; however, what exactly that relationship is
has not become a matter of consensus. The literature on MBTI research findings infers
an unequal distribution of personality types in relation to occupational choice. The MBTI
Career Report Manual (Hammer & Macdaid, 1992) reports that five of the most common
personality types for a designer are ESTJ, ISFJ, INTP, ESFJ and ISTP, although there
were individuals who fell under every type.
MacKinnon (1962) studied 115 “creative men” and found frequency distributions as follows: 63% Introverts (I) to 37% Extraverts (E); 55% Perceptives (P) to 45% Judging (J); 59% Thinking (T) to 41% Feeling (F); 97% Intuitives (N) to 3% Sensing (S).
In a study of American architects identified as creative, MacKinnon refers to the MBTI
and the inclusion of Jungian typological functions and creativity. He proposes that
outstanding creative architects tend to be perceptive types with a high percentage of those
studied preferring perception to judgment. Those architects preferring perception tended
to be intuitive rather than sensing which indicates an indirect perception of the deeper
meaning and possibilities inherent in things and situations. MacKinnon (1962) also states
that in general artists show a preference for feeling and engineers a preference for
thinking. The MBTI dimension of Thinking (T) or Feeling (F) appeared to be less related

Texas Tech University, Rosemary Peggram, December 2007
42
to creativity, in this case, and more related to subject matter. In the final Jungian
preference, Extraversion (E) and Introversion (I), architects prefer introversion, which
provides for aloneness and time for contemplative thought and creative activity.
Myers reports in the Manual (1962) that Intuition (N) (.37) and Introversion (I)
(.26) are the two highest correlations of type on Strong Vocational Interest Blank for
artist category. The study was performed with 727 male freshmen at Stanford University.
The Manual (1962) cites evidence of preference for Thinking (T) and Feeling (F) from
236 male freshmen at Wesleyan University, which relate to three areas of art study.
These findings suggest that MBTI preferences relate to vocational choice between areas
of art study. Stephens (1973) found commonalities of type among various related
professions and more definitive types were found within facets of the professions.
McFee and Degge (1977) found a relationship similar to MacKinnon’s (1962)
statement that architects require both scientific and artistic creativity. They state further
that there may be a parallel with the experience of academically successful students going
into a creative design class when an art preference was low on the list of desired subjects.
The parallels between the MacKinnon (1962) study of architects and the McFee and
Degge (1977) study of creativity supports the belief that creativity can be developed in
line with the traits found among creative people generally, not just in the arts.
In Russ and Webers (1995) study of 234 junior and senior interior design
students, 40.2% were in the catalyst type (NF). The troubleshooter type (SP) comprised
21.4%, the traditional type (NT) had 16.2%, and the visionary type (NT) had 22.1%.
These results differed from the aforementioned studies on creative types. Although
62.3% of the sample was intuitive, the researchers expected a much larger percentage to

Texas Tech University, Rosemary Peggram, December 2007
43
fall within the visionary category. Previous studies (Portillo & Dohr, 1994) found a large
percentage of the visionary (NT) type involved in the creative professions.
Lim (1991) used the Keirsey Temperament Sorter, a shorter version of the MBTI,
to determine the personality types compared with performance level and attitudes of
interior design students towards a computer-aided design course. The frequency
distribution indicated interior design students’ stronger preference for Extravert,
Intuition, Feeling, and Judging (ENFJ) types. However, the results are questionable due
to the small sample size of 56, and the whole package of the MBTI was not used. The
previously mentioned Russ and Weber (1995) study regarding interior design students
reported 40.2% were in the catalyst type (NF) while only 16.2% fell in the Extroverted,
Intuitive, Feeling, Perceiving (ENFP) type. Diehl (1992) reported a relationship between
personality type and creativity in interior design students. Gender and age had no impact
on personality types. Findings indicate that interior design students occupy all
personality types (Bonner, 1989; Diehl, 1992) according to the MBTI, with a large
percentage being NF’s and NT’s, which is interesting because those two categories are a
smaller percentage of the general population. These studies are in line with previously
discussed research involving creative types in other related professions. The current
research will add to this body of knowledge.
Summary
The literature that has been reviewed indicates that there are many studies
involving students in the first two years of college in four-year universities in a variety of
subjects. These studies focused primarily on predicting academic success using some
combination of standardized tests, high school grades and/or rank, and a variety of

Texas Tech University, Rosemary Peggram, December 2007
44
personality or other non-cognitive factors. There is a scarcity of studies dealing with
college student personalities in the field of design, specifically interior design.
In the assessment of predictors of academic performance, the traditional measures
of subject-matter retention such as the ACT/SAT continue to show signs of weakness as a
selection device. Promising alternatives should be tested. The additional assessment of
personality trait preferences as predictors of academic performance in concert with
demographic variables are proving to be valuable in recognizing non-cognitive factors,
which influence success or failure in academic endeavors. Studies do suggest that
personality traits can be reliably assessed at the beginning of the academic study and that
certain traits do affect students’ academic performance.
Trout (1987) found in her study of interior design students that interests of a large
portion of the students were not parallel with aspects of the interior design profession.
The majority of the freshmen and sophomore interior design majors were not in
congruence with the major chosen for their academic career; therefore, they were at risk
for low self-esteem, dissatisfaction with their major, and withdrawal from the program of
study. The results of a study by Todd and Roberts (1981) would indicate that while
certain demographic and interest factors appear to give a homogeneous character to
groups of music and art education students, the degree of commitment to either art or
music would depend on certain personality factors which would indicate how that student
perceives and processes information. Research has shown that the NF or NT will predict
an interest in an artistic profession (MacKinnon, 1962). MacKinnon conjectured that
most students with creative potential have personality structures congruent with, though
possibly less sharply delineated than, those of mature creatives.

Texas Tech University, Rosemary Peggram, December 2007
45
Interior design is growing as an appealing option for a university degree. Interior
design students need creativity because they must be able to adequately solve problems
related to interior space and client needs. Many students who enter an interior design
program do not persist to graduation. Russ and Weber (1995) stated “career counseling
may be needed to assist students in selecting an area that will fully utilize their abilities
and personality characteristics. Students drawn to interior design could be tested and
directed towards that area they may be best suited for” (p. 37). The nature of the MBTI
assessment information is directly relevant to the goal of eventual satisfaction within a
career. For students, their “career” is being a student in a particular area. Therefore,
personality assessment may be a useful tool to aid in selecting student applicants into a
program of interior design and for student guidance and counseling throughout the
academic career to reduce attrition. Additional research in this area will strengthen the
theoretical base of college admission procedures and policies, and will provide insights
for prospective college students into the characteristics of the successful interior design
student.
Texas Tech University, Rosemary Peggram, December 2007
46
CHAPTER III
METHODOLOGY
Faculty and administrators of interior design programs have the difficult task of
sorting through all the applicants to identify and admit the best suited students for their
program. Not only should these students be creative and design inclined, but equally
important, if given a highly competitive admission into the program, will persist to the
senior year and graduation. Therefore, it was the purpose of this study to investigate the
probability of predicting academic success and persistence in interior design using
standard cognitive measures (SAT/ACT, high school rank and cumulative GPA) and
personality type as measured by the MBTI, in freshmen and senior students at five IDEC
Southwest Region universities. The explanation of study components is divided into
eight sections: (a) selection of the sample, (b) research instrumentation, (c) procedure, (d)
research design, (e) research questions, (f) statistical analysis of data, (g) anticipated
findings, and (h) summary.
Sample Selection The target population for this study was freshmen and senior interior design
students enrolled in CIDA (Council of Interior Design Accreditation) accredited interior
design programs at public, 4-year universities. The population selected was the
Southwest Region, as defined by Interior Design Educators Council (IDEC regions,
2005) that included six states. These states were Arkansas, Colorado, Louisiana, New
Mexico, Oklahoma, and Texas. Within the Southwest Region, 24 universities met this
criterion and provided professional level programs in Interior Design (CIDA accredited
programs, 2005): University of Arkansas at Fayetteville, Art Institute of Colorado,

Texas Tech University, Rosemary Peggram, December 2007
47
Colorado State University, Rocky Mountain College of Art and Design (CO), Louisiana
State University, Louisiana Tech University, University of Louisiana at Lafayette,
Oklahoma State University, University of Central Oklahoma, University of Oklahoma,
Abilene Christian University, The Art Institute of Dallas (TX), The Art Institute of
Houston (TX), Baylor University (TX), El Centro College (TX), Stephen F. Austin State
University (TX), Texas Christian University, Texas State University, Texas Tech
University, University of the Incarnate Word (TX), University of North Texas, University
of Texas at Arlington, University of Texas at Austin, and University of Texas at San
Antonio. New Mexico does not currently have any CIDA-accredited interior design
programs so it was not included in this study.
The researcher was an instructor at one of the above mentioned universities at the
time of the study, which made the Southwest Region of greater interest and importance.
The sample selected was one university with a CIDA accredited interior design program
from each of the five states, based on personal contacts the researcher had with interior
design faculty and/or administrators at those schools. These “gatekeepers” are
individuals who have an official or unofficial role at the site, provide entrance to a site,
help the researcher locate people, and assist in the identification of places to study. This
individual usually has “insider” status at the site the researcher plans to study (Creswell,
2002, p. 192). The resulting convenience sample made data collection more readily
available and could help increase response rates. Therefore, data was collected from the
following universities: Texas Tech University, University of Arkansas-Fayetteville,
Oklahoma State University, Colorado State University, and University of Louisiana at
Lafayette. This method could also be described as cluster sampling because all students

Texas Tech University, Rosemary Peggram, December 2007
48
enrolled in freshmen and senior interior design studios at each of the five universities
selected were surveyed.
The total interior design student population at these five universities at the time of
the study was approximately 900. Of this number, approximately 480 were classified at
the freshmen and senior levels in the interior design programs. It is important that the
sample size in correlational research be large enough to detect statistically significant
differences between the variables being examined. As a rule of thumb, the larger the
sample size the more likely one is to uncover small differences. Correlational studies in
general should have a minimum sample size of 30 while survey studies should have a
minimum of 350 (Creswell, 2002).
Instrumentation The Myers-Briggs Type Indicator (MBTI) was an attractive instrument of choice
for several reasons. The MBTI is widely used and studied, and these studies have
produced extensive data and literature bases. The test is easy to administer and
inexpensive to score. The MBTI Form G (see Appendix H) was used to assess
personality type and consisted of 94 questions in paper and pencil format. The MBTI
survey forms were purchased by the researcher from the Center for Applications of
Psychological Type, Inc. (CAPT) and then returned to them for coding and report
compilation.
The MBTI aims to ascertain from self-report of easily reported reactions, people’s
basic preferences in regard to perception and judgment. The Indicator contains separate
indices for determining each of four basic preferences, which under Jung’s (1923) theory,
structure the individual’s personality. The four preferences are (a) Extraversion or
Texas Tech University, Rosemary Peggram, December 2007
49
Introversion (EI), (b) Sensing or Intuition (SN), (c) Thinking or Feeling (TF), and (d)
Judgment or Perception (JP). The EI index is designed to reflect whether the person is an
extravert who is oriented primarily to the outer world, or an introvert who tends to focus
his attention and judgment on concepts and ideas, the inner world. The SN index is
designed to reflect a person’s preference in perceiving through one or another of the five
senses or by intuition which is understood to be perception by the way of the unconscious
with emphasis on ideas or associations. The TF index is designed to reflect a person’s
preferences between two opposite ways of judging: through thinking which discriminates
impersonally between true and false, or primarily through feeling which discriminates
between valued and not-valued. The JP index is designed to reflect whether the person
relies primarily upon a judging process (T or F) or upon a perceptive process (S or N) in
his dealing with the outer world, that is, in the extraverted part of his life.
Test-retest reliability among college students, expressed as the percentages of
agreement for the four dichotomies over a 4-week period, ranged from 84% (T-F) to 88%
(J-P) (Myers et al., 1998). A wealth of validity data exists for the MBTI-Form G,
including confirmatory factor analyses supporting the four-factor structure and expected
relationships between MBTI-Form G scores and other self-report personality inventories
(Myers et al., 1998).
In addition to the MBTI, a short self-report questionnaire requesting demographic
information from each of the subjects was administered (see Appendix G). Demographic
variables of age, ethnicity, and gender were collected as well as information related to
type and size of high school, types of courses taken in high school, and questions about
their choice of interior design as a program of study.
Texas Tech University, Rosemary Peggram, December 2007
50
At each university, the surveys were administered to all freshmen and senior
interior design studio courses during regular scheduled class times by the instructor of
that course. Only freshmen and seniors enrolled in studio courses in the Spring 2007
semester were surveyed. So that all surveys were administered in the same format, a
script was provided to each instructor to read to the students for purposes of explaining
the study and survey procedures.
ACT/SAT scores, cumulative college GPA, and high school class rank were
obtained from each university’s official records by permission of the student for purposes
of predictive research. GPA was recorded on a 4-point scale and high school class rank
(HSR) was recorded using percentile rank. These variables were specifically selected for
several reasons. ACT/SAT scores, along with high school class rank, are the current
measures used in the admission of students into most interior design programs. Also,
because it would prove beneficial to be able to identify potential students at-risk of
dropping out of a interior design program prior to their matriculation, it is important to
use pieces of information that would be readily available from the students’ applications.
Procedures for Data Collection Before data collection began, permission to conduct the study was obtained from
the Human Subjects Committee of Texas Tech University (see Appendix A). For each
university, contact was made via e-mail with interior design faculty and/or administrators
to obtain the names of instructors of the freshmen and senior studio courses (see
Appendix B for a sample e-mail letter). This pre-contact was useful in garnering support
for and understanding of the upcoming data collection. Creswell (2002) states that pre-
contact can dramatically increase response rates. A short time later, an e-mail requesting

Texas Tech University, Rosemary Peggram, December 2007
51
permission to administer the assessments during class time was sent to the faculty
previously identified as teaching a freshmen or senior design studio course (see Appendix
C for sample letter).
The Myers-Briggs Type Indicator and demographic questionnaire were
administered by cooperating interior design faculty to students who voluntarily
participated in the study. The researcher mailed packets to the instructor that included (a)
a cover letter explaining the study, (b) directions for administering the surveys, (c)
demographic surveys, (d) MBTI personality assessments, (e) consent and release forms
for accessing student records, (f) a form for students to indicate their desire for a results
explanation from the MBTI, and (g) a pre-addressed, stamped envelope for the purpose
of returning all the materials to the researcher (see Appendix for examples of all above
items). In addition, each packet contained a token of appreciation, a $2.00 bill, given to
the instructor for helping to administer the surveys and allowing access to his or her class.
Research on response rates has shown that token gifts increase response rates (Creswell,
2002). A reminder e-mail was sent if a response was not received after 3 weeks.
A thank you note and MBTI personality type results explanation (see Appendix K
& L), for the students that requested it, was mailed to the corresponding faculty member
to return to the student within a few weeks after receiving the surveys. The students
were assured confidentiality of these results. Students were identified by number only on
the database containing the student information thereby eliminating the risk of individual
student identification and preserving confidentiality. All identifying and personal
information was destroyed when it was no longer needed for the study.
Texas Tech University, Rosemary Peggram, December 2007
52
Research Design This research is a combination of descriptive statistics and multiple regression
analysis. The multiple regression statistical method was chosen for use in this study
because this method allows investigators to use a statistical procedure for examining the
combined relationship of multiple independent variables with a single dependent
variable. In regression, the variation in the dependent variable is explained by the
variance of each independent variable (the relative importance of each predictor), as well
as the combined effect of all independent variables (Creswell, 2002). In this type of
design, researchers do not attempt to control or manipulate the variables, but attempt to
discover the significance of two or more variables.
Multiple regression is used in this study to help predict an outcome. In a
prediction design researchers seek to anticipate outcomes by using certain known
variables as predictors. Prediction studies are useful because they help anticipate or
forecast future behavior. The purpose of a prediction research design is to identify
variables that will positively predict an outcome or criterion (Creswell, 2002). One of the
underlying purposes of this study was to determine if personality type predicted which
students were likely to persist and succeed academically in an interior design degree
program.
Creswell (2002) notes two potential problems associated with correlational
research involving a large number of variables. First, it may be difficult to interpret
results unless the researcher makes certain that the variables used were chosen on the
basis of sound theory or rationale. Second, when large numbers of variables are used,
some will correlate by chance. However, if the correlation coefficient is sufficiently
Texas Tech University, Rosemary Peggram, December 2007
53
large and is shown to be statistically significant, the researcher can be fairly confident
that the correlations are real. The correlational coefficient that is produced whenever
variables are correlated describes both the direction and the magnitude of the
relationship. This coefficient will be somewhere between 0.00 and –1.00 or +1.00. The
closer the coefficient correlation is to 1.00 or –1.00, the stronger the relationship between
the variables analyzed (Creswell, 2002).
Multiple regression research is less rigorous than experimental research because
the researcher can only control statistically for variables rather than physically
manipulate variables. Regression studies do not “prove” a relationship, rather, they
indicate a statistical significance when observed values (relationship between two
variables or co-efficients) provide a statistical value (p-value) that exceeds the pre-
determined alpha level set by the researcher (Creswell, 2002). The p-value is the
probability that the test statistic could have been produced by chance if the relationship
was real.
The significance of any given correlation is dependent on the context in which it
is used. According to Creswell (2002), correlation coefficients less than 0.35 represent
only a slight relationship between the variables and thus have almost no predictive value.
However, this relationship may be slightly statistically significant for 100 or more
participants. When correlations are above .35, they are useful for limited prediction.
Correlations between 0.40 and 0.60 are frequently seen in educational research, but
correlations of at least 0.50 are necessary to establish any predictive value. When
correlations fall between .65 and .85, a good prediction can result from one variable to
the other and can have real predictive validity. Correlations of .86 or higher are typically

Texas Tech University, Rosemary Peggram, December 2007
54
achieved for studies of construct validity or test-retest reliability. When two or more
variables are related, correlations this high are seldom achieved, and, if they result, then
two variables actually measure the same underlying trait and should probably be
combined in data analysis.
Descriptive statistics describe what is. It involves the description, recording,
analysis, and interpretation of conditions that exist. It involves some type of comparison
or contrast and attempts to discover relationships between existing non-manipulated
variables (Creswell, 2002). The types of descriptive statistics used in this research were
mean, range, and percentile rank.
Research Questions
1. What are the most common personality types of senior interior design students as
described by the MBTI?
2. Is personality type a significant predictor of interior design student success and
persistence after controlling for the ACT/SAT scores and high school grades?
3. Do personality type differences exist between senior interior design students and
freshmen interior design students at each university surveyed?
4. What is the profile of successful senior interior design students?
Data Analyses
All data was analyzed using the Statistical Package for the Social Sciences (SPSS)
version 15.0. SPSS was used for descriptive, multiple regression, and chi-square
statistics. The students’ classification, university attending, reported major, age, gender,
ACT/SAT score, high school rank, MBTI personality type, and other responses from the
demographic questionnaire were coded into the database. If students had taken the ACT
Texas Tech University, Rosemary Peggram, December 2007
55
or SAT more than once, the highest score was used. The dependant variable was
persisting successfully in interior design to the senior year, which was defined and
quantified through the use of cumulative GPA, taken at the senior year from student
transcripts. The independent variables were ACT/SAT score (ACT/SAT), high school
rank (HSR) taken from student transcripts, and personality type (ISTJ, ISFJ, INFJ, INTJ,
ISTP, ISFP, INFP, INTP, ESTP, ESFP, ENFP, ENTP, ESTJ, ESFJ, ENFJ or ENTJ) as
determined by the MBTI. Age and classification were also used as independent variables
in the regression analysis.
To answer Research Question #1 - What are the most common personality types
of senior interior design students as described by the MBTI? – descriptive statistics,
distribution and percentages of subjects by personality type were performed. Descriptive
statistics present information that helps a researcher describe responses to each question
in a database and determine both overall trends and the distribution of the data (Creswell,
2002). The Center for Applications of Psychological Type, Inc. (CAPT) performed the
coding of the surveys and descriptive statistical analysis for the personality types. These
reports were returned to the researcher for further analysis with the other independent
variables.
To answer Research Question #2 - Is personality type a significant predictor of
interior design student performance when used alone or in combination with the
ACT/SAT scores and high school grades? - this study employed multivariate
correlational statistics, specifically multiple linear regression on the senior student data
only. The multiple regression technique analyzes the collective and separate effects of
two or more independent variables on a dependent variable (Creswell, 2002). This type
Texas Tech University, Rosemary Peggram, December 2007
56
of analysis was chosen to determine the significance of the criterion variable, college
performance defined here as cumulative GPA and continued enrollment, and the best
combination of two or more of the predictor variables, ACT/SAT, high school rank, and
personality type. A predictor variable is the variable used to make a forecast about an
outcome in correlational research, whereas the outcome being predicted is the criterion
variable (Creswell, 2002). The researcher attempted to explore the relationships to the
non-cognitive variable, personality type, first through a step-wise procedure before
combining with ACT/SAT and high school rank. Discriminate analysis was conducted to
predict interior design student performance.
The level of significance for all regression analyses was set at 0.05. Personality
traits as shown by the MBTI were correlated using regression statistics with cumulative
GPA, which were used to determine success, to determine if there are particular
personality trait characteristics common to students who are academically successful.
To answer Research Question #3 - Do personality type differences exist between
senior interior design students and freshmen interior design students at each university
surveyed? – the descriptive statistical results of Research Question #1 were compared
with the descriptive statistics of personality type of the freshmen students, provided by
the CAPT reports. These correlational comparisons were completed for all students
together as well as by individual universities to determine what similarities and/or
differences exist between freshmen and senior interior design student personalities and to
determine if differences exist or if personalities cluster in various areas of the sampled
region.

Texas Tech University, Rosemary Peggram, December 2007
57
To answer Research Question #4 - What is the profile of successful senior interior
design students? – results from the other three research questions were combined to list
the personality types, the ACT/SAT scores, high school rank, and cumulative GPA of the
senior interior design students in the sample. It was the intent of the researcher to use the
data to compile a profile that included personality type and would describe the senior
students - those that had persisted in the program to the fourth year and were much more
likely to graduate from interior design.
Anticipated Findings
It was anticipated that the personality profiles, as determined by the MBTI, would
be more diverse in the freshmen sample than in the senior sample. Because there exists
an increased awareness of interior design among the general public due to the home
improvement and design reality shows (Waxman & Clemons, 2005) and the fact that
admission to many interior design programs is open to any freshmen who meets the
universities’ ACT/SAT and high school GPA/rank requirements, it was hypothesized that
a diverse group of students, concerning their personality profiles, would exist at the
freshmen level. However, as these students experience the courses, try to develop the
necessary skills, realize the time commitment for each course and project, pass or fail
Portfolio Review (often around the end of the Sophomore year, and in some cases every
year) and leave the interior design program for one reason or another, the senior students
become more homogeneous. This researcher anticipated that the senior sample would
have less diversity in the range of personality profiles. The possible personality profiles
have been discussed in length in Chapter 2 based on related prior research.

Texas Tech University, Rosemary Peggram, December 2007
58
Chapter Summary
Multiple regression analysis is a commonly employed method for examining the
magnitude and direction of the relationships between two or more variables. The
majority of the studies detailed in Chapter 2 used multiple regression analysis to derive
the correlational coefficients for the predictor variables examined. The variables were
correlated to determine the factors that could develop a profile, for use with entering
interior design prospects, that would most likely predict interior design persistence and
success.

Texas Tech University, Rosemary Peggram, December 2007
59
CHAPTER IV
RESULTS
The purpose of this study was to determine if personality characteristics used in
addition to SAT/ACT and high school rank in admission considerations can be useful in
predicting academic success in Interior Design students. Cumulative GPA was the
dependent variable, while personality type, as described by the Myers-Briggs Type
Indicator (MBTI), standardized test scores, high school rank, and demographic variables,
were the independent variables examined. The MBTI assessment and demographic
questionnaire was administered to interior design students at five universities throughout
the Interior Design Educators Council (IDEC) Southwest Region. This chapter is divided
into four sections: (a) sample participants, (b) demographics of the sample, (c)
descriptive statistics for dependent and independent variables, and (d) analyses of the
research questions.
Sample Participants
The data for the study were collected from students enrolled in freshmen and
senior interior design studios at each of five universities selected for this study. The
universities were: Texas Tech University, Oklahoma State University, Colorado State
University, University of Arkansas - Fayetteville and University of Louisiana - Lafayette.
The MBTI assessments and demographic questionnaires were mailed to freshmen and
senior interior design studio instructors in April 2007 (See Appendix D - I for instructor
cover letter, instructions for administering the assessment, student cover letter,
demographic questionnaire, and student consent form). The first round of responses was
received in May 2007. E-mail reminders were sent which resulted in several more
Texas Tech University, Rosemary Peggram, December 2007
60
responses in late May and June 2007. Due to the nature of the data collected, responses
did not appear to be biased. Freshmen and senior data were collected from Texas Tech
University, Oklahoma State University and University of Arkansas - Fayetteville. Only
freshmen were assessed at Colorado State University. The senior studio instructor
declined to participate due to time constraints. Only senior data was collected at the
University of Louisiana - Lafayette because the freshmen assessments were never
returned, even after several e-mail reminders. Completed MBTI assessments were mailed
to CAPT, Inc. in June, July and August 2007 for analysis and interpretation. Results
were returned to the researcher within two weeks of each mailing (See Appendix J for an
example of a CAPT, Inc. MBTI detailed scoring sheet). These results were organized by
classification (senior and freshmen) and by school.
Students who participated in the study were given the option to receive a
personalized MBTI personality type profile. For students who wished to receive their
MBTI personality profile, a mass mailing was made in late July 2007, either to a
permanent address (if provided) or through the instructor of record. See Appendix K - M
for an example of the MBTI personality type profile, thank you letter to the student, and
MBTI personality type explanation page.
A total of 145 students completed the MBTI assessment and demographic
questionnaire. However, 24 were eliminated from the analysis because they met at least
one or more of the following: (a) did not complete the MBTI assessment (N=2), (b)
reported classification other than freshmen or senior (N=9), (c) reported major other than
interior design (N=11), or (d) an age over 30 years (N=5). The age distribution was
severely skewed due to the non-traditional student’s ages, and therefore were considered
Texas Tech University, Rosemary Peggram, December 2007
61
to be outliers. All statistics used in this study assumed an even distribution of mean and
standard deviation. Including the higher age range violated this assumption. Also every
student with an age over 30 was missing critical pieces of data, such as cumulative GPA,
SAT/ACT score(s), or high school rank. Therefore, a total of 121 usable assessments and
questionnaires were obtained. Table 4.1 lists the frequency of usable assessments and
questionnaires from each of the five universities. Texas Tech University had the majority
of the respondents with 53 or approximately 44%, University of Arkansas - Fayetteville
followed with 23 (19%), Oklahoma State University provided 20 (16.5%), and University
of Louisiana - Lafayette and Colorado State University had 14 (11.6%) and 11 (9.1%)
respondents, respectively.
Sample Demographics
Demographic and behavioral variables were analyzed to help determine the
characteristics of the sample. The descriptive statistics, such as frequency and
percentage, of each of these variables for participants who completed usable
questionnaires is summarized in Tables 2 thru 6.
Seven percent of the total sample was male, and 93% were female. Sixty-five
(53.7%) were freshmen and 56 (46.3%) were seniors. In regards to ethnicity, 84.3% of
the total sample was Anglo, 4.1% were African American, 3.3% were Hispanic, and
1.7% each were Native American and Asian. Five percent reported ‘other’ for ethnicity
(See Table 4.2). These percentages follow the interior design enrollment trends at Texas
Tech University, one of the universities in the Southwest Region. For example, at Texas
Tech University, Interior Design tends to be an Anglo, female dominated university
major with an average of 91.1% female and 77.9% Anglo enrollment over a 15 semester.

Texas Tech University, Rosemary Peggram, December 2007
62
Table 4.1 Frequency of usable assessments from five universities
University Number of Usable Frequency Assessments
Texas Tech University 53 43.8% University of Arkansas-Fayetteville 23 19.0% Oklahoma State University 20 16.5% University of Louisiana-Lafayette 14 11.6% Colorado State University 11 9.1% Total 121 100%
Table 4.2 Demographic characteristics, gender, classification and ethnicity, of sample of university interior design students (frequency and percentage) (N=121) Characteristic Frequency Percentage Gender Female 113 93.4% Male 8 6.6% Classification Freshmen 65 53.7% Senior 56 46.3% Ethnicity Anglo 102 84.3% African American 5 4.1% Hispanic 4 3.3% Native American 2 1.7% Asian 2 1.7% Other 6 5.0% ________________________________________________________________________
Texas Tech University, Rosemary Peggram, December 2007
63
time period from Spring 2000 through Spring 2007 (Office of Institutional Research and
Information Management, TTU, Sept. 2007). With ages ranging from 18 to 30 years old,
the mean age for the sample was 20.9 years, with 91.8% of respondents 24 years of age
or under (see Table 4.3).
Other information was gathered about these freshmen and senior interior design
students that helped to describe the sample (see Table 4.4). When asked about the type of
high school attended, 86.8% reported attending a public high school, 10.7% a private
high school, and 2.5% were home schooled. To describe the size of that high school,
20% reported their high school had 100 or fewer students, 41.7% reported the size to be
101 to 500 students, 28.3% reported 501-1000 students, and 10% reported their high
school had 1000 or more students. One respondent did not answer this question about
high school size.
Interior design students were asked to report their birth order, or the order they
were born into their family. Studies show a relationship between earlier birth order and
school achievement (Sputa & Paulson, 1995; Mathiasen, 1984) and was associated with a
significantly greater number of years of education (Ferguson, Horwood & Boden, 2006;
Black, Devereux, & Salvanes, 2005). This study found that 38% were the oldest child in
the family, 24% were the middle child, 30.6% were the youngest, and 7.4% were the only
child. Students were asked to select from a short list which courses (as many as
applicable) had been taken in high school. The listed courses were either related to
interior design or correlated with creativity or college achievement. Research shows that
there is a positive correlation between music, certain levels of math, and creativity or
higher college achievement (Weinberger, 1998; ACT Research, 2002). The largest
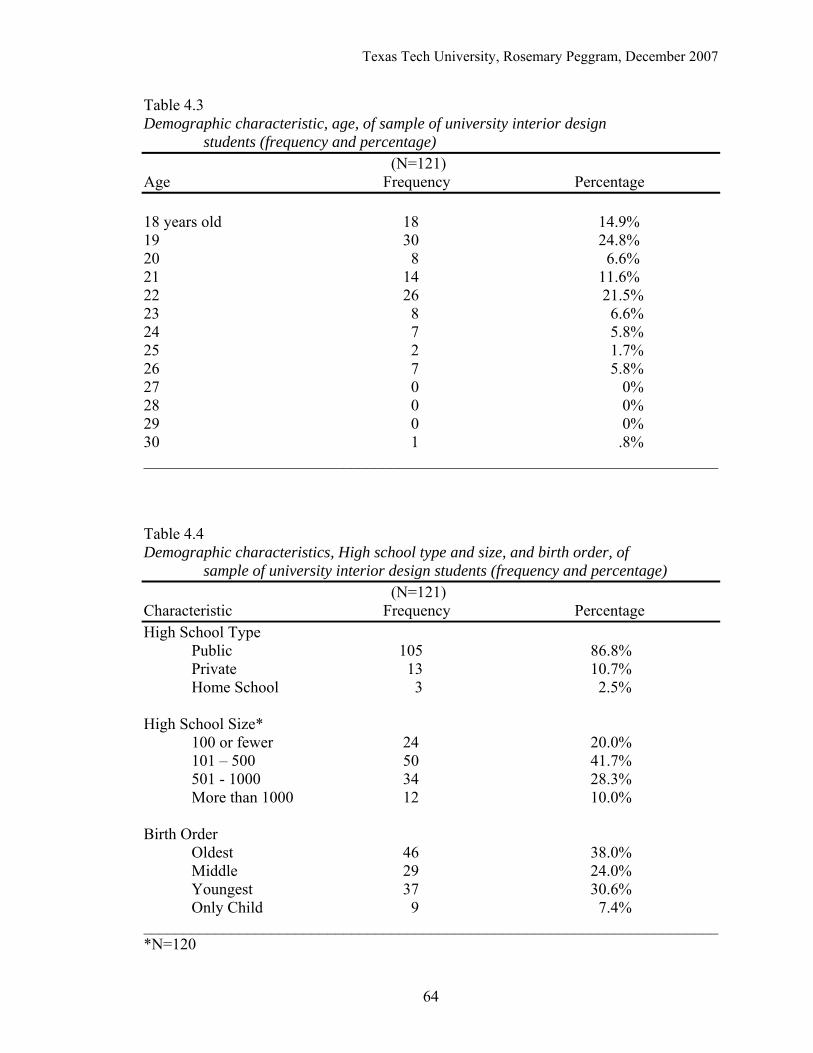
Texas Tech University, Rosemary Peggram, December 2007
64
Table 4.3 Demographic characteristic, age, of sample of university interior design students (frequency and percentage) (N=121) Age Frequency Percentage 18 years old 18 14.9% 19 30 24.8% 20 8 6.6% 21 14 11.6% 22 26 21.5% 23 8 6.6% 24 7 5.8% 25 2 1.7% 26 7 5.8% 27 0 0% 28 0 0% 29 0 0% 30 1 .8% ________________________________________________________________________
Table 4.4 Demographic characteristics, High school type and size, and birth order, of sample of university interior design students (frequency and percentage) (N=121) Characteristic Frequency Percentage High School Type Public 105 86.8% Private 13 10.7% Home School 3 2.5% High School Size* 100 or fewer 24 20.0% 101 – 500 50 41.7% 501 - 1000 34 28.3% More than 1000 12 10.0% Birth Order Oldest 46 38.0% Middle 29 24.0% Youngest 37 30.6% Only Child 9 7.4% ________________________________________________________________________ *N=120

Texas Tech University, Rosemary Peggram, December 2007
65
Table 4.5 High school courses taken with frequencies and percentages. Course Frequency* Percentage Geometry/Algebra 113 93.4% Art 88 72.7% Music/Band 57 47.1% Interior Design 24 19.8% Computer-aided design 18 14.9% Drafting 14 11.6% * Respondents were asked to indicate all courses that applied. group, 113 (93.4%) of the respondents had taken a geometry and/or algebra course in
high school (see Table 4.5). Algebra and geometry are required courses, in most high
schools, for graduation and were the only required courses listed. The second most
frequently indicated course taken was Art, with 88 students (72.7%). Fifty-seven
students (47.1%) had taken music or band in high school. The remaining courses on the
list were less frequently taken. Twenty-four students (19.8%) had taken an interior
design course, 18 students (14.9%) had taken a computer-aided design course, and 14
students (11.6%) had taken a manual drafting course in high school.
Students were also asked why they chose the major of interior design. Several
popular reasons were listed on the demographic questionnaire and more than one answer
could be selected. Six students did not respond to this question. The most popular (62%
or 75 students) reason for choosing interior design as a major was because they enjoyed
designing as a hobby. Twenty-seven students (22.3%) were influenced by HGTV and
other design shows. Clemmons and Waxman’s (2005) study stated that many interior
design programs have grown 200-400% since the start of HGTV design programs in the
year 2000. Twenty-one respondents (17.4%) said that a family member is a designer or
architect and this influenced their decision to choose interior design.

Texas Tech University, Rosemary Peggram, December 2007
66
The second most selected response (40.5% or 49 students) was ‘other’. Several
(11) students chose interior design because it allowed them to be creative and artistic.
Nine students noted that they enjoy or were good at design, art, drawing, understanding
spatial relationships, and arranging things in a structural manner. Four students did not
like or want Architecture as a major. Four students completed a project in grade school
or high school that sparked their interest. Four students had family members in related
careers, such as costume designer, home builder, kitchen and bath business that got them
interested in interior design. Four students responded that they chose interior design
because they didn’t know what else to do. Three students said that by choosing interior
design they were able to combine other interests, such as art and architecture. Three
students responded that they were interested in what the career had to offer. Three
students helped parents or grandparents build or remodel a house. Three students had an
advisor or family member suggest interior design because of their talents in related skills.
Two students responded that they chose interior design because it was a challenge. One
student reported choosing interior design because architecture was not offered at the
school.
For the Spring 2007 semester, the reported current credit hours that were being
taken by the seniors and freshmen ranged from 3 to 16 hours with a mean of 13.4. The
number of hours a week working at a job ranged from 0 to 31-40 hours a week with the
mean hours working at a job being 1-10 hours a week.
Students were asked to list their top three hobbies or activities in an attempt to
learn more about the characteristics of interior design students. Table 4.6 lists the
responses and corresponding frequency. The top hobbies or activities were reading with

Texas Tech University, Rosemary Peggram, December 2007
67
Table 4.6 University interior design student hobbies and activities. Hobby or Activity Frequency*
Reading 34 Exercising 31 Drawing 26 Watching/playing Sports 23 Shopping 22 Listening to/playing music 21 Socializing with friends 20 Designing/decorating 18 Watching movies/TV 18 Painting 10 Art 10 Dancing 10 Scrap booking 10 Photography 10 Traveling 9 Crafts 9 Being outdoors 9 Cooking 8 Sorority/organizations 8 Singing 7 Family 7 Riding horses/playing with dogs 7 Cleaning/organizing 6 Snowboarding 5 Climbing/hiking 5 Sleeping 5 Church Activities 4 Sewing 4 Playing games/puzzles 3 Writing 3 Skiing 3 Fishing 2 Woodworking 2 Babysitting 2 Boating/kayaking 2 Acting 2 Working 2 Eating out 2 Event planning 2 Gardening 2 Furniture refinishing 1 Camping 1 Collecting stamps 1 Talking 1
Respondents (121) were encouraged to give more than one response.

Texas Tech University, Rosemary Peggram, December 2007
68
34 responses, exercising with 31, drawing with 26, watching or playing sports with 23,
shopping with 22, listening to or playing music with 21, and socializing with friends with
20 responses. Designing and decorating, and watching movies or TV both had 18
responses. Painting, art, dancing, scrap booking, and photography all had 10 responses
each. Traveling, doing crafts, and being outdoors all had 9 responses each. Cooking and
time spent with sorority or other organizations each received 8 responses. Singing, time
with family, and time riding horses or playing with dogs received 7 responses each.
Cleaning and organizing received 6 responses. Snowboarding, climbing or hiking, and
sleeping each had 5 responses. Church activities and sewing each received 4 responses.
Playing games or doing puzzles, writing and skiing received 3 responses each. Activities
such as fishing, woodworking, babysitting, boating and kayaking, acting, working, eating
out, event planning, and gardening each received 2 responses. Furniture refinishing,
camping, collecting stamps and talking each received 1 response.
Descriptive Statistics for Dependent and Independent Variables
The dependent variable, college cumulative GPA was available for 107 students (86% of
the sample) and had a range of 1.35 to a 4.0. The mean cumulative GPA was a 3.15.
Table 4.7 outlines the descriptive statistics for the dependent and independent variables
used in the research questions. One of the independent variables, SAT/ACT score, was
not available for all students. There were 19 students (19% of the sample) that had
neither SAT nor ACT scores available. These students were transfer students from
another school or their current university would not release the score for this study’s
purposes. Of the students who did have scores available, some had the SAT, some had
the ACT, and some had both scores available. However, it was discovered that many
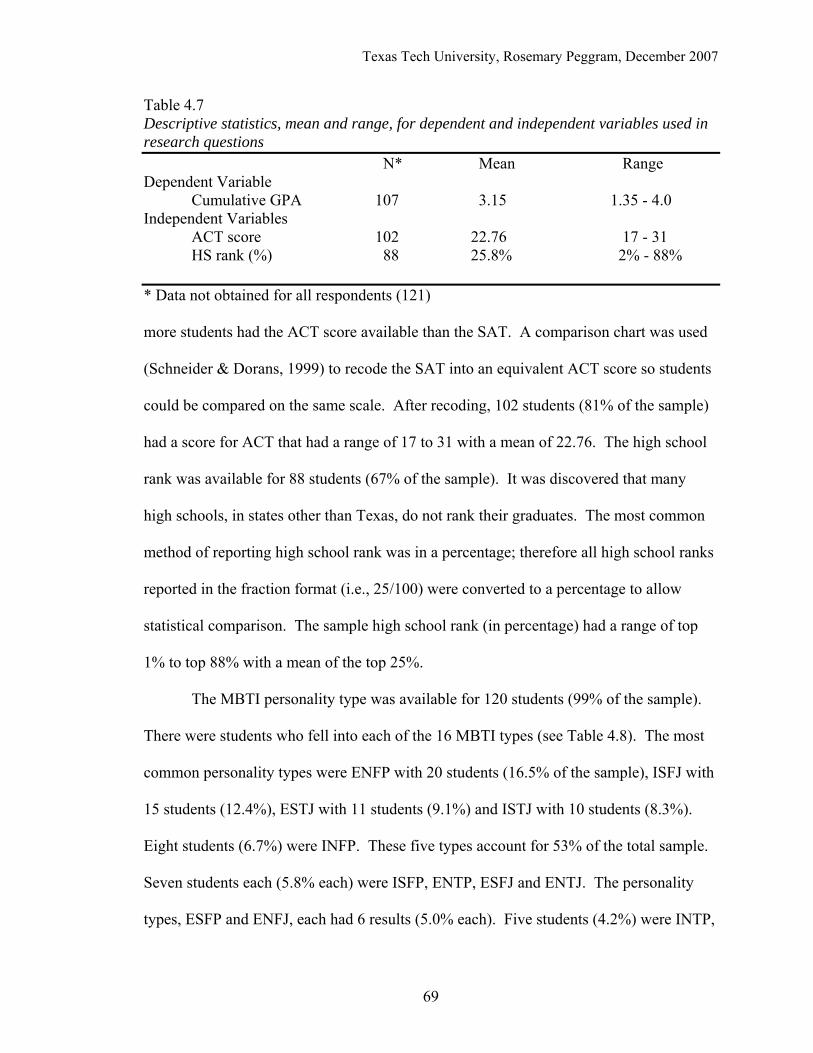
Texas Tech University, Rosemary Peggram, December 2007
69
Table 4.7 Descriptive statistics, mean and range, for dependent and independent variables used in research questions N* Mean Range Dependent Variable Cumulative GPA 107 3.15 1.35 - 4.0 Independent Variables ACT score 102 22.76 17 - 31 HS rank (%) 88 25.8% 2% - 88% * Data not obtained for all respondents (121) more students had the ACT score available than the SAT. A comparison chart was used
(Schneider & Dorans, 1999) to recode the SAT into an equivalent ACT score so students
could be compared on the same scale. After recoding, 102 students (81% of the sample)
had a score for ACT that had a range of 17 to 31 with a mean of 22.76. The high school
rank was available for 88 students (67% of the sample). It was discovered that many
high schools, in states other than Texas, do not rank their graduates. The most common
method of reporting high school rank was in a percentage; therefore all high school ranks
reported in the fraction format (i.e., 25/100) were converted to a percentage to allow
statistical comparison. The sample high school rank (in percentage) had a range of top
1% to top 88% with a mean of the top 25%.
The MBTI personality type was available for 120 students (99% of the sample).
There were students who fell into each of the 16 MBTI types (see Table 4.8). The most
common personality types were ENFP with 20 students (16.5% of the sample), ISFJ with
15 students (12.4%), ESTJ with 11 students (9.1%) and ISTJ with 10 students (8.3%).
Eight students (6.7%) were INFP. These five types account for 53% of the total sample.
Seven students each (5.8% each) were ISFP, ENTP, ESFJ and ENTJ. The personality
types, ESFP and ENFJ, each had 6 results (5.0% each). Five students (4.2%) were INTP,

Texas Tech University, Rosemary Peggram, December 2007
70
Table 4.8 Distribution of MBTI personality types across sample MBTI Personality Type Frequency Percentage (N = 120)* ENFP 20 16.7% ISFJ 15 12.5% ESTJ 11 9.2% ISTJ 10 8.3% INFP 8 6.7% ISFP 7 5.8% ENTP 7 5.8% ESFJ 7 5.8% ENTJ 7 5.8% ESFP 6 5.0% ENFJ 6 5.0% INTP 5 4.2% ISTP 4 3.3% ESTP 3 2.5% INFJ 2 1.7% INTJ 2 1.7% *Missing one respondent.
4 students (3.3%) were ISTP, and 3 students (2.5%) were ESTP. Two students each
(1.7% each) were INFJ and INTJ.
Analysis of the Research Questions
Research Question 1: What are the most common personality types of senior
interior design students as described by the Myers-Briggs Type Indicator? The sample
included 56 senior interior design students. One senior student did not complete the
entire MBTI assessment, and therefore did not receive a personality profile. The
remaining 55 senior interior design student MBTI personality types are outlined in Table
4.9. All 16 types of the MBTI are represented in the senior interior design student group;
however, over half of the senior interior design students (39 students or 71%) fall into 7
personality types. These are ISFJ with 9 (16.4%), ESTJ with 8 (14.5%), ENFP and ENTJ
with 5 each (9.1% each), INFP, ENTP and ESFJ with 4 each (7.3% each).
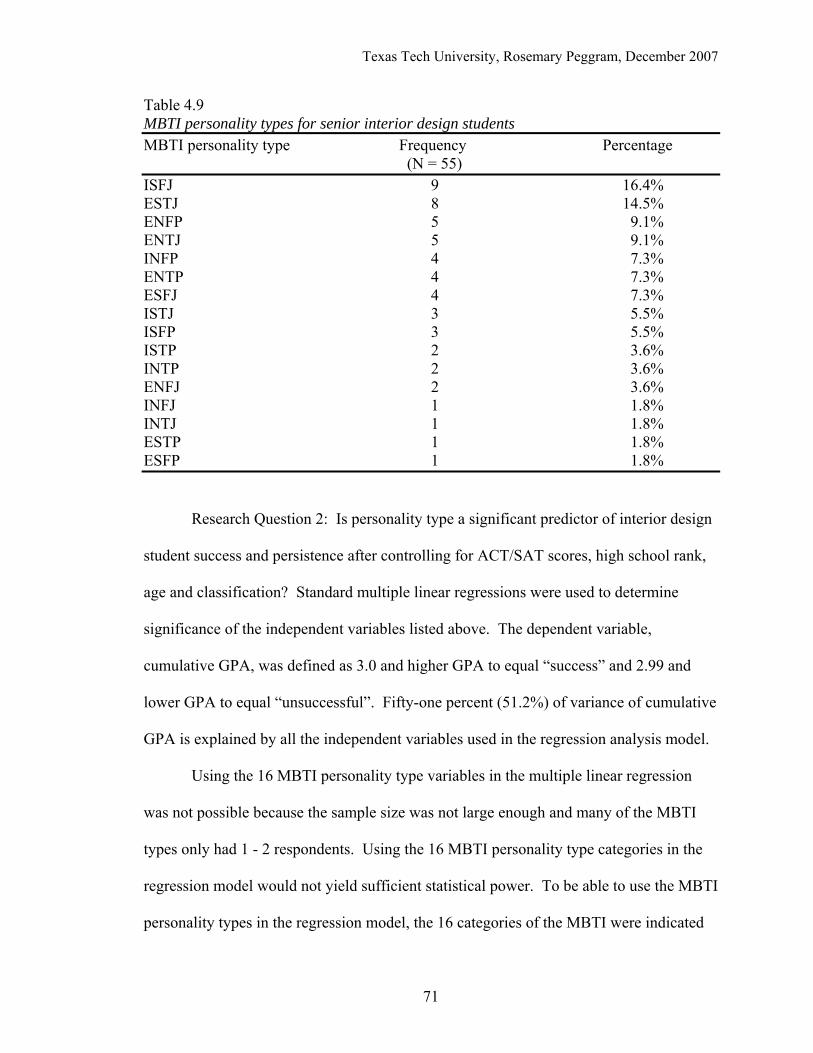
Texas Tech University, Rosemary Peggram, December 2007
71
Table 4.9 MBTI personality types for senior interior design students MBTI personality type Frequency Percentage (N = 55) ISFJ 9 16.4% ESTJ 8 14.5% ENFP 5 9.1% ENTJ 5 9.1% INFP 4 7.3% ENTP 4 7.3% ESFJ 4 7.3% ISTJ 3 5.5% ISFP 3 5.5% ISTP 2 3.6% INTP 2 3.6% ENFJ 2 3.6% INFJ 1 1.8% INTJ 1 1.8% ESTP 1 1.8% ESFP 1 1.8%
Research Question 2: Is personality type a significant predictor of interior design
student success and persistence after controlling for ACT/SAT scores, high school rank,
age and classification? Standard multiple linear regressions were used to determine
significance of the independent variables listed above. The dependent variable,
cumulative GPA, was defined as 3.0 and higher GPA to equal “success” and 2.99 and
lower GPA to equal “unsuccessful”. Fifty-one percent (51.2%) of variance of cumulative
GPA is explained by all the independent variables used in the regression analysis model.
Using the 16 MBTI personality type variables in the multiple linear regression
was not possible because the sample size was not large enough and many of the MBTI
types only had 1 - 2 respondents. Using the 16 MBTI personality type categories in the
regression model would not yield sufficient statistical power. To be able to use the MBTI
personality types in the regression model, the 16 categories of the MBTI were indicated
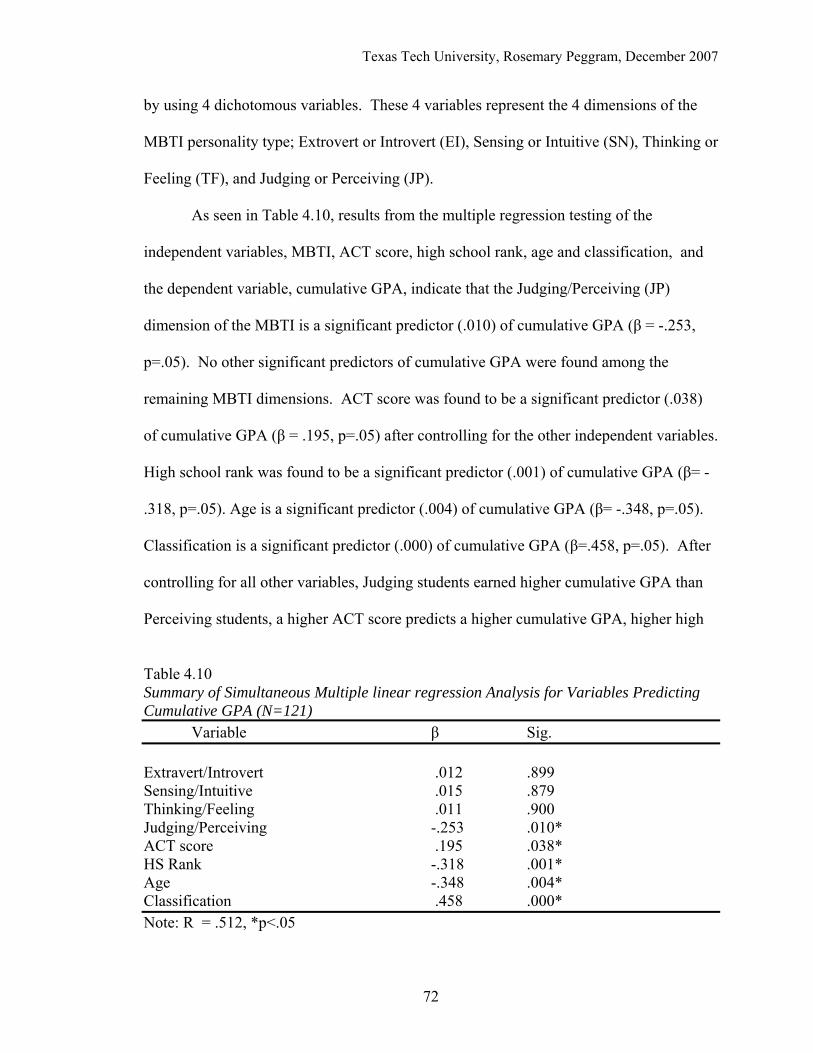
Texas Tech University, Rosemary Peggram, December 2007
72
by using 4 dichotomous variables. These 4 variables represent the 4 dimensions of the
MBTI personality type; Extrovert or Introvert (EI), Sensing or Intuitive (SN), Thinking or
Feeling (TF), and Judging or Perceiving (JP).
As seen in Table 4.10, results from the multiple regression testing of the
independent variables, MBTI, ACT score, high school rank, age and classification, and
the dependent variable, cumulative GPA, indicate that the Judging/Perceiving (JP)
dimension of the MBTI is a significant predictor (.010) of cumulative GPA (β = -.253,
p=.05). No other significant predictors of cumulative GPA were found among the
remaining MBTI dimensions. ACT score was found to be a significant predictor (.038)
of cumulative GPA (β = .195, p=.05) after controlling for the other independent variables.
High school rank was found to be a significant predictor (.001) of cumulative GPA (β= -
.318, p=.05). Age is a significant predictor (.004) of cumulative GPA (β= -.348, p=.05).
Classification is a significant predictor (.000) of cumulative GPA (β=.458, p=.05). After
controlling for all other variables, Judging students earned higher cumulative GPA than
Perceiving students, a higher ACT score predicts a higher cumulative GPA, higher high
Table 4.10 Summary of Simultaneous Multiple linear regression Analysis for Variables Predicting Cumulative GPA (N=121) Variable β Sig. Extravert/Introvert .012 .899 Sensing/Intuitive .015 .879 Thinking/Feeling .011 .900 Judging/Perceiving -.253 .010* ACT score .195 .038* HS Rank -.318 .001* Age -.348 .004* Classification .458 .000* Note: R = .512, *p<.05

Texas Tech University, Rosemary Peggram, December 2007
73
school rank (lower percentage) predicts a higher cumulative GPA, an older age predicts a
lower cumulative GPA, and the higher the classification (or in this study, seniors), the
higher the cumulative GPA.
Research Question 3: Do personality type differences exist between senior
interior design students and freshmen interior design students at each university
surveyed? This study was unable to obtain both freshmen and senior classification data
from every university surveyed; therefore, differences could only be described between
freshmen and seniors of the whole sample, not divided by university. A frequency table
showing the number of total freshmen and seniors in each of the 16 MBTI types is
outlined in Table 4.11.
For freshmen interior design students, the MBTI personality types with the
highest number of students are ENFP with 15 (23%), ISTJ with 7 students (10.8%), ISFJ
with 6 students (9.2%), and ESFP with 5 students (7.7%). These 4 MBTI personality
types represent half, 50.8% (33 students) of the total freshmen sample. The remaining 32
students (49.2%) are divided among the remaining 12 MBTI personality types as
described in Table 4.11.
For senior interior design students, the MBTI personality types with the highest
number of students are ISFJ with 9 (16.4%), ESTJ with 8 students (14.5%), and ENFP
and ENTJ each with 5 students (9.0% each). These 4 MBTI personality types represent
almost half, 49% (27 students) of the total senior sample. The remaining 28 students
(50.9%) are divided among the remaining 12 MBTI personality types (see Table 4.11).
The chi-Square test for contingency tables was used to determine if personality
differences existed by university. The 16 MBTI personality types created too many cells
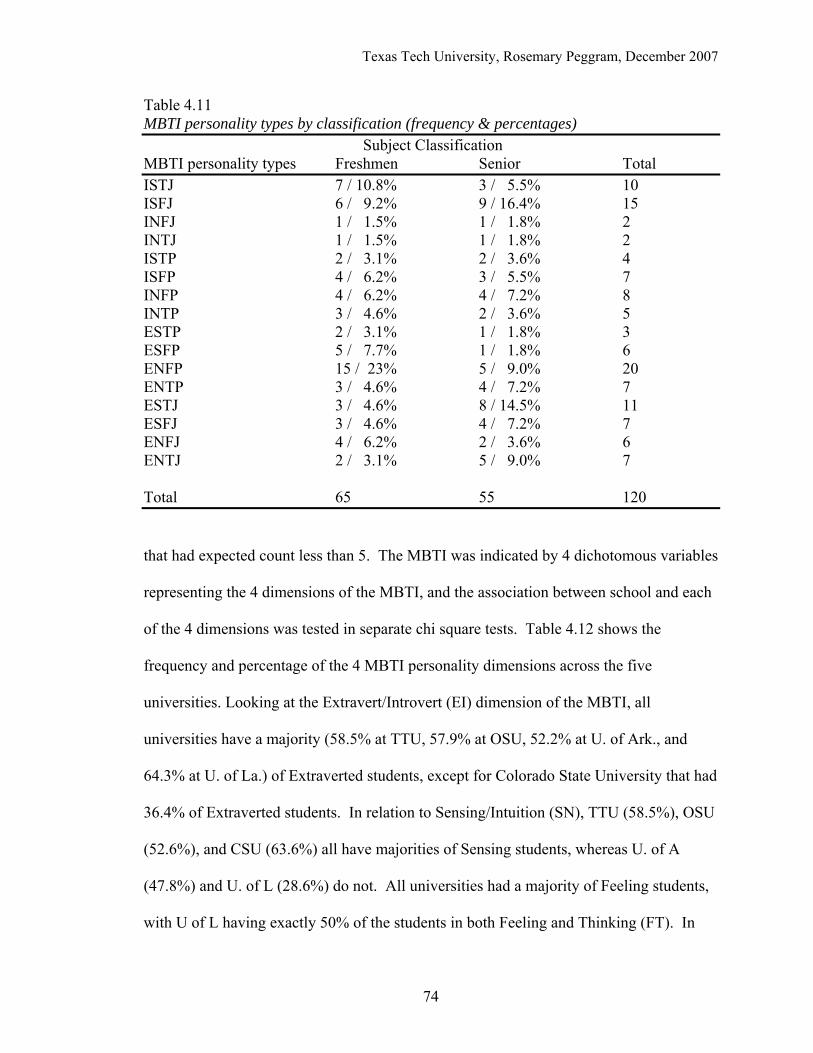
Texas Tech University, Rosemary Peggram, December 2007
74
Table 4.11 MBTI personality types by classification (frequency & percentages) Subject Classification MBTI personality types Freshmen Senior Total ISTJ 7 / 10.8% 3 / 5.5% 10 ISFJ 6 / 9.2% 9 / 16.4% 15 INFJ 1 / 1.5% 1 / 1.8% 2 INTJ 1 / 1.5% 1 / 1.8% 2 ISTP 2 / 3.1% 2 / 3.6% 4 ISFP 4 / 6.2% 3 / 5.5% 7 INFP 4 / 6.2% 4 / 7.2% 8 INTP 3 / 4.6% 2 / 3.6% 5 ESTP 2 / 3.1% 1 / 1.8% 3 ESFP 5 / 7.7% 1 / 1.8% 6 ENFP 15 / 23% 5 / 9.0% 20 ENTP 3 / 4.6% 4 / 7.2% 7 ESTJ 3 / 4.6% 8 / 14.5% 11 ESFJ 3 / 4.6% 4 / 7.2% 7 ENFJ 4 / 6.2% 2 / 3.6% 6 ENTJ 2 / 3.1% 5 / 9.0% 7 Total 65 55 120 that had expected count less than 5. The MBTI was indicated by 4 dichotomous variables
representing the 4 dimensions of the MBTI, and the association between school and each
of the 4 dimensions was tested in separate chi square tests. Table 4.12 shows the
frequency and percentage of the 4 MBTI personality dimensions across the five
universities. Looking at the Extravert/Introvert (EI) dimension of the MBTI, all
universities have a majority (58.5% at TTU, 57.9% at OSU, 52.2% at U. of Ark., and
64.3% at U. of La.) of Extraverted students, except for Colorado State University that had
36.4% of Extraverted students. In relation to Sensing/Intuition (SN), TTU (58.5%), OSU
(52.6%), and CSU (63.6%) all have majorities of Sensing students, whereas U. of A
(47.8%) and U. of L (28.6%) do not. All universities had a majority of Feeling students,
with U of L having exactly 50% of the students in both Feeling and Thinking (FT). In
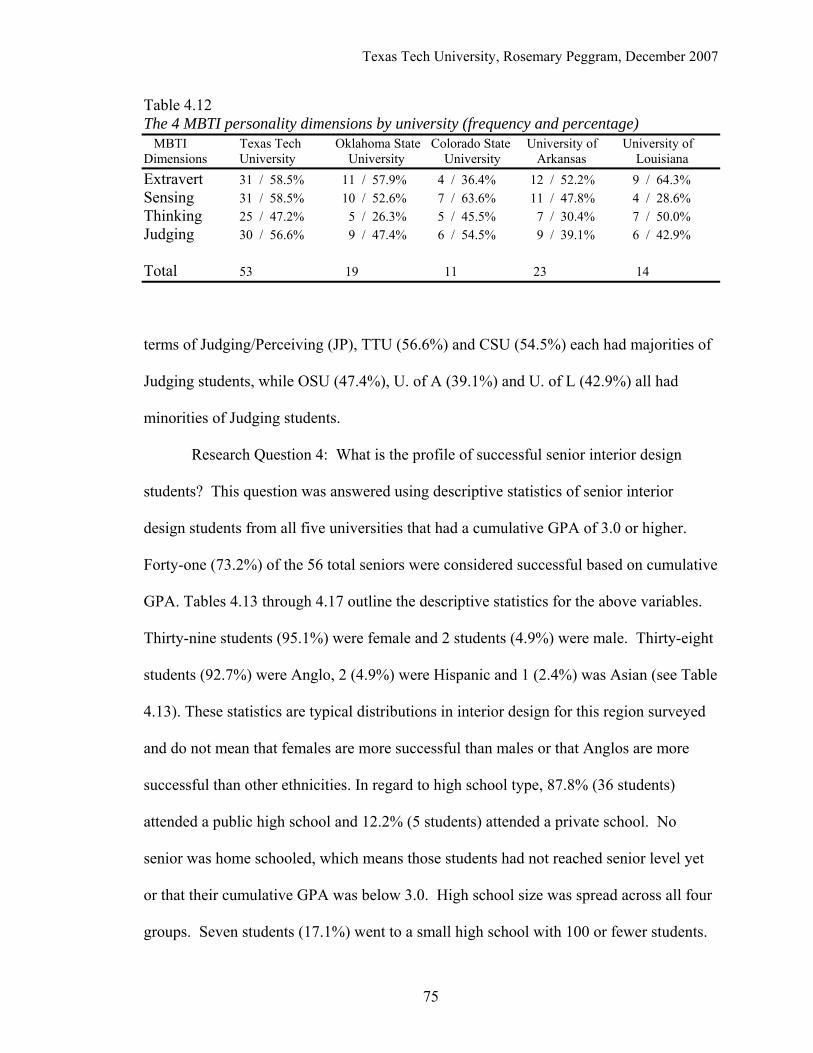
Texas Tech University, Rosemary Peggram, December 2007
75
Table 4.12 The 4 MBTI personality dimensions by university (frequency and percentage) MBTI Texas Tech Oklahoma State Colorado State University of University of Dimensions University University University Arkansas Louisiana Extravert 31 / 58.5% 11 / 57.9% 4 / 36.4% 12 / 52.2% 9 / 64.3% Sensing 31 / 58.5% 10 / 52.6% 7 / 63.6% 11 / 47.8% 4 / 28.6% Thinking 25 / 47.2% 5 / 26.3% 5 / 45.5% 7 / 30.4% 7 / 50.0% Judging 30 / 56.6% 9 / 47.4% 6 / 54.5% 9 / 39.1% 6 / 42.9% Total 53 19 11 23 14
terms of Judging/Perceiving (JP), TTU (56.6%) and CSU (54.5%) each had majorities of
Judging students, while OSU (47.4%), U. of A (39.1%) and U. of L (42.9%) all had
minorities of Judging students.
Research Question 4: What is the profile of successful senior interior design
students? This question was answered using descriptive statistics of senior interior
design students from all five universities that had a cumulative GPA of 3.0 or higher.
Forty-one (73.2%) of the 56 total seniors were considered successful based on cumulative
GPA. Tables 4.13 through 4.17 outline the descriptive statistics for the above variables.
Thirty-nine students (95.1%) were female and 2 students (4.9%) were male. Thirty-eight
students (92.7%) were Anglo, 2 (4.9%) were Hispanic and 1 (2.4%) was Asian (see Table
4.13). These statistics are typical distributions in interior design for this region surveyed
and do not mean that females are more successful than males or that Anglos are more
successful than other ethnicities. In regard to high school type, 87.8% (36 students)
attended a public high school and 12.2% (5 students) attended a private school. No
senior was home schooled, which means those students had not reached senior level yet
or that their cumulative GPA was below 3.0. High school size was spread across all four
groups. Seven students (17.1%) went to a small high school with 100 or fewer students.
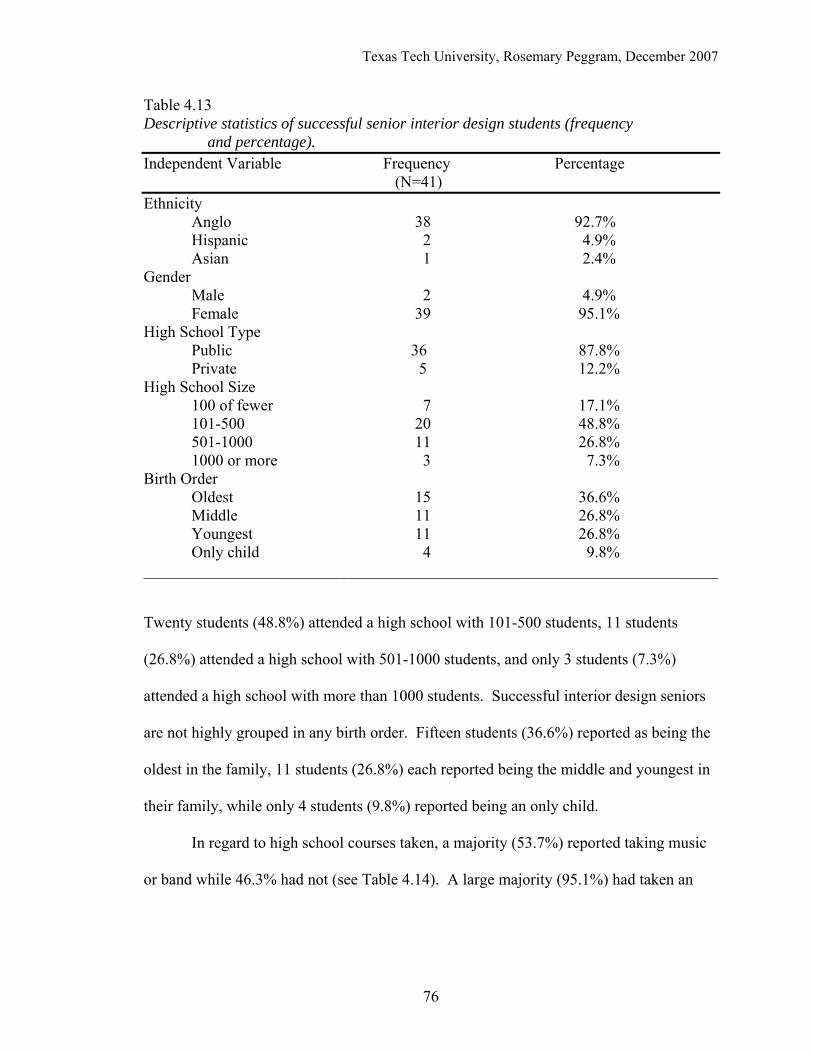
Texas Tech University, Rosemary Peggram, December 2007
76
Table 4.13 Descriptive statistics of successful senior interior design students (frequency and percentage). Independent Variable Frequency Percentage (N=41) Ethnicity Anglo 38 92.7% Hispanic 2 4.9% Asian 1 2.4% Gender Male 2 4.9% Female 39 95.1% High School Type Public 36 87.8% Private 5 12.2% High School Size 100 of fewer 7 17.1% 101-500 20 48.8% 501-1000 11 26.8% 1000 or more 3 7.3% Birth Order Oldest 15 36.6% Middle 11 26.8% Youngest 11 26.8% Only child 4 9.8% ________________________________________________________________________ Twenty students (48.8%) attended a high school with 101-500 students, 11 students
(26.8%) attended a high school with 501-1000 students, and only 3 students (7.3%)
attended a high school with more than 1000 students. Successful interior design seniors
are not highly grouped in any birth order. Fifteen students (36.6%) reported as being the
oldest in the family, 11 students (26.8%) each reported being the middle and youngest in
their family, while only 4 students (9.8%) reported being an only child.
In regard to high school courses taken, a majority (53.7%) reported taking music
or band while 46.3% had not (see Table 4.14). A large majority (95.1%) had taken an
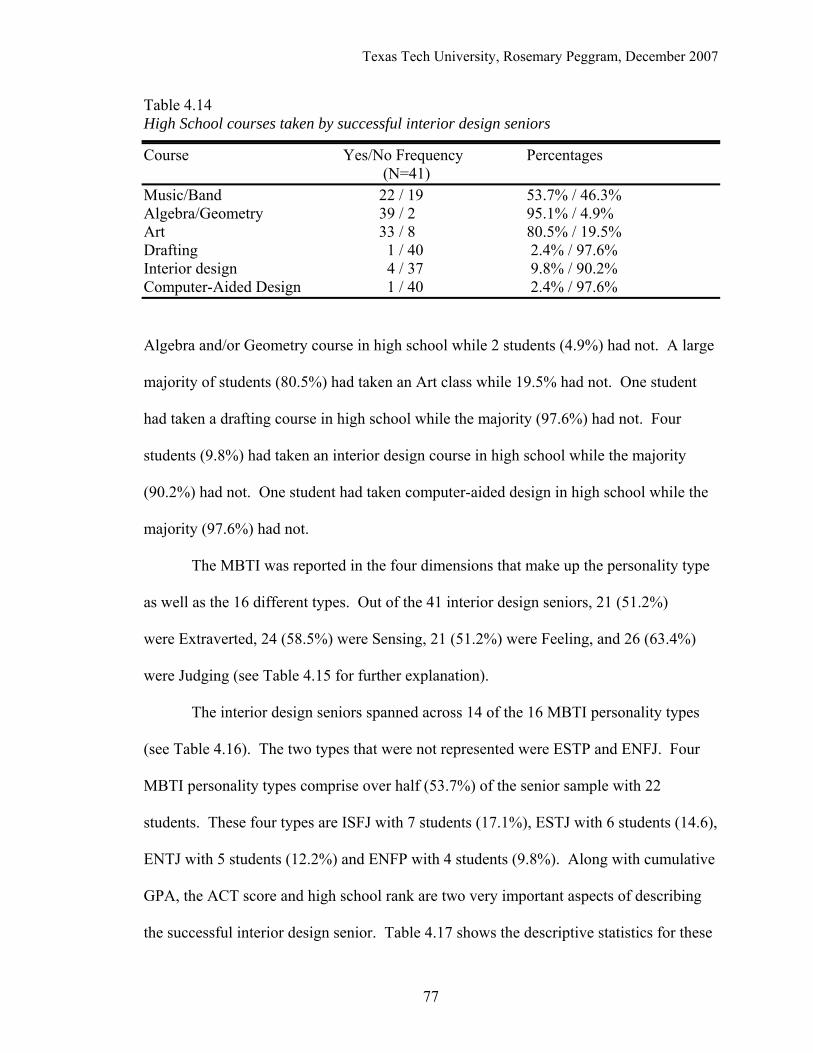
Texas Tech University, Rosemary Peggram, December 2007
77
Table 4.14 High School courses taken by successful interior design seniors
Course Yes/No Frequency Percentages (N=41) Music/Band 22 / 19 53.7% / 46.3% Algebra/Geometry 39 / 2 95.1% / 4.9% Art 33 / 8 80.5% / 19.5% Drafting 1 / 40 2.4% / 97.6% Interior design 4 / 37 9.8% / 90.2% Computer-Aided Design 1 / 40 2.4% / 97.6%
Algebra and/or Geometry course in high school while 2 students (4.9%) had not. A large
majority of students (80.5%) had taken an Art class while 19.5% had not. One student
had taken a drafting course in high school while the majority (97.6%) had not. Four
students (9.8%) had taken an interior design course in high school while the majority
(90.2%) had not. One student had taken computer-aided design in high school while the
majority (97.6%) had not.
The MBTI was reported in the four dimensions that make up the personality type
as well as the 16 different types. Out of the 41 interior design seniors, 21 (51.2%)
were Extraverted, 24 (58.5%) were Sensing, 21 (51.2%) were Feeling, and 26 (63.4%)
were Judging (see Table 4.15 for further explanation).
The interior design seniors spanned across 14 of the 16 MBTI personality types
(see Table 4.16). The two types that were not represented were ESTP and ENFJ. Four
MBTI personality types comprise over half (53.7%) of the senior sample with 22
students. These four types are ISFJ with 7 students (17.1%), ESTJ with 6 students (14.6),
ENTJ with 5 students (12.2%) and ENFP with 4 students (9.8%). Along with cumulative
GPA, the ACT score and high school rank are two very important aspects of describing
the successful interior design senior. Table 4.17 shows the descriptive statistics for these

Texas Tech University, Rosemary Peggram, December 2007
78
Table 4.15 MBTI personality type by the four dimensions 4 Dimensions Frequency Percentage (N=41) Extravert / Introvert 21 / 20 51.2% / 48.8% Sensing / Intuition 24 / 17 58.5% / 41.5% Thinking / Feeling 20 / 21 48.8% / 51.2% Judging / Perceiving 26 / 15 63.4% / 36.6% Table 4.16 MBTI personality type by the 16 types MBTI* Frequency Percentage (N=41) ISFJ 7 17.1% ESTJ 6 14.6% ENTJ 5 12.2% ENFP 4 9.8% ISTJ 3 7.3% INFP 3 7.3% ESFJ 3 7.3% ISTP 2 4.9% ISFP 2 4.9% ENTP 2 4.9% INFJ 1 2.4% INTJ 1 2.4% INTP 1 2.4% ESFP 1 2.4% * Not all 16 types are represented. variables. Twenty-six students had the ACT test score data. The range in scores was
from 17 to 30 with a mean of 22.54 and a standard deviation of 3.301. Thirty-one
students had high school rank data available. The range in rank was from .03 (top 3%) to
.88 (top 88%) with a mean of .2231 (top 22%) and a standard deviation of .19576.
Student credit hours (N=41) ranged from 6 hours to 17 hours with a mean of 12.56 hours
and standard deviation of 2.864. Hours worked at a job (N=41) ranged from 0 to 31-40
hours a week. The mean hours a week at a job was 1-10 (see Table 4.17).
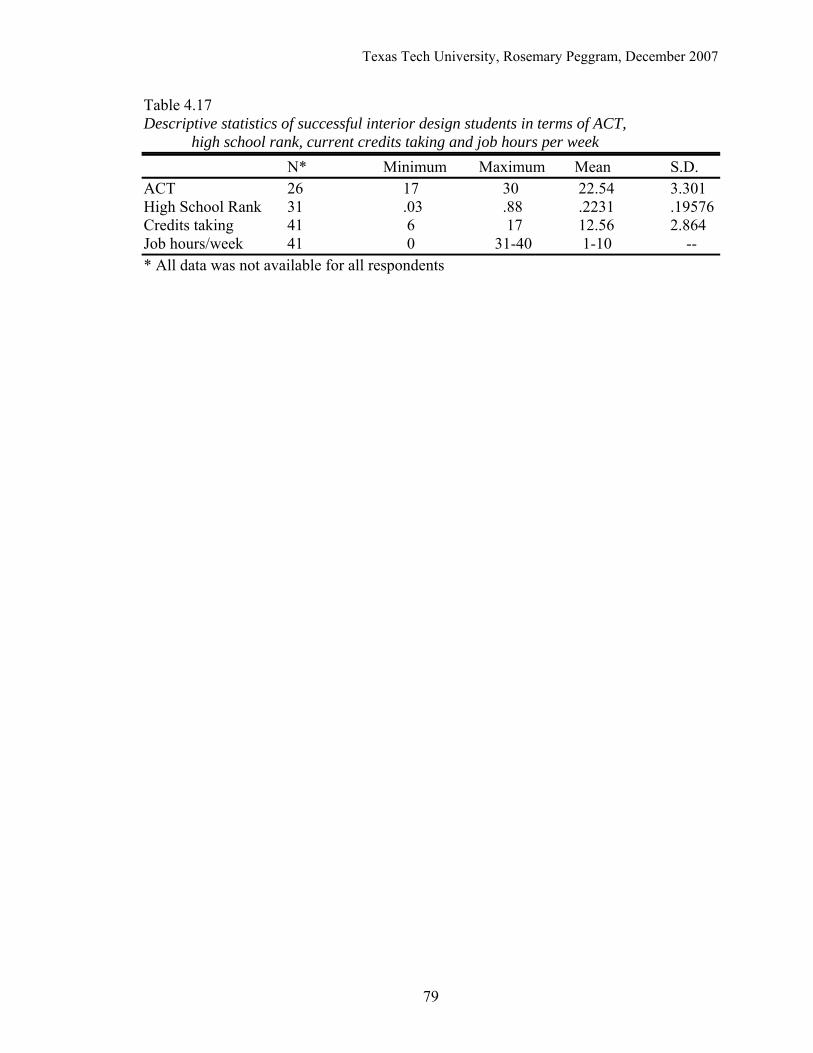
Texas Tech University, Rosemary Peggram, December 2007
79
Table 4.17 Descriptive statistics of successful interior design students in terms of ACT, high school rank, current credits taking and job hours per week N* Minimum Maximum Mean S.D. ACT 26 17 30 22.54 3.301 High School Rank 31 .03 .88 .2231 .19576 Credits taking 41 6 17 12.56 2.864 Job hours/week 41 0 31-40 1-10 -- * All data was not available for all respondents

Texas Tech University, Rosemary Peggram, December 2007
80
CHAPTERV
SUMMARY, CONCLUSIONS, AND RECOMMENDATIONS
Summary of the Study
The purpose of this research was to (a) assess the personality types, as described
by the Myers-Briggs Type Indicator, of interior design freshmen and senior students, (b)
determine if there were differences between freshmen and seniors with respect to
personality type, and (c) determine if personality type could be a useful predictor of
success for students in interior design programs after controlling for ACT score and high
school rank.
For this study, five universities were selected from the membership of the Interior
Design Educators Council (IDEC) Southwest Region that had similar interior design
programs accredited by CIDA at the bachelor’s professional degree level. All freshmen
and senior interior design studio courses at the five universities were targeted. MBTI
assessments and demographic questionnaires were sent to each participating course and
the faculty member of record administered the assessments and returned them to the
researcher. The use of a small incentive (a $2 bill) helped this process, and encouraged
the faculty to return as many completed assessments and questionnaires as possible from
their students. A total of 145 completed responses were obtained. Twenty-four
questionnaires were eliminated because substantial portions were incomplete or the data
obtained was inappropriate for the study, such as the student’s major was not interior
design. The resulting sample size used for statistical purposes was 121. The data
obtained from the freshmen and seniors were compared to determine if differences
existed between the classifications. Senior data on personality type was correlated, using
Texas Tech University, Rosemary Peggram, December 2007
81
multiple linear regression, with cumulative GPA, to determine if personality type can be
useful in predicting academic success of interior design students.
Findings and Conclusions
The sample of interior design students was found to be a relatively homogeneous
group with respect to some basic demographic data. Females (93%) of Anglo ethnicity
(84.3%), between the typical college ages of 18-24 (91.8%) were the majority. Only
7.4% were an only child. Over 86% were from public high schools between 100 and
1000 students in size (75%). Over 64% had a cumulative GPA of 3.0 or higher on an
average of 13 college credits and were working an average of 1-10 hours a week at a job.
ACT scores and high school rank, however, indicate less homogeneity. ACT
scores for all students ranged from 17 to 31 and high school rank ranged from the top 1%
to the top 88% in the graduating class. With this much range variation in the standard
admission criteria for admitted students, other variables are needed to assist in narrowing
the gap for future admission selections.
When looking at the MBTI types of the general population, interior design student
personality types are somewhat different. According to Kiersey and Bates, (1984) and
Myers & McCaulley (1985), 75% of the general population prefers Extraversion (E).
Slightly more than 55% of the interior design sample was Extraverted (E). This confirms
other research that states that creative people tend to be introverted (I) (MacKinnon,
1962; Myers, 1962). Seventy-five percent of the general population prefers Sensing (S),
while 52.4% of the interior design sample was sensing (S). Again, research shows that
creative people are more likely to be intuitive (N) rather than sensing (S) (Holland, 1985;
MacKinnon, 1962; Myers & McCaulley, 1985). Sixty-five percent of females prefer

Texas Tech University, Rosemary Peggram, December 2007
82
Feeling (F) in the general population and this was confirmed among interior design
female students as well. Fifty-five to 60% of the population prefers Judging and again
this was confirmed among the interior design sample in this research. When looking at
specific MBTI types among the general population, 15% are ESFP. Only 5% of the
interior design student sample was this MBTI type. Thirteen percent of the population is
ESTP, ESTJ or ESFJ. Only 2.5% of the interior design students were ESTP and 5.8%
were ESFJ. However, a larger percentage (9.2%) were ESTJ in the interior design
sample. This seems to indicate that interior design students are of different personality
types than the general population. This possibly could be because of the specialized
nature of the field or the specific skills and abilities that are needed to succeed in design.
It could also be due to the education interior design students receive or to various other
reasons.
The MBTI personality types for the total sample indicated ENFP, ISFJ, ESTJ,
ISTJ and INFP were a majority (53%) of the students. Two of these types, ESTJ and
ISFJ, are reported in the MBTI Career Report Manual (Hammer & Macdaid, 1992) as
two of the most common personality types for a designer. MacKinnon’s (1962) study on
creative architects found a high percentage of Introverts (63%). In the current research,
three of the five personality types for all interior design students were Introverted (60%)
which confirms MacKinnon’s study.
When looking at the personality types of the senior interior design group, a large
majority (71%) of the seniors fell into 7 personality types, ISFJ, ESTJ, ENFP, ENTJ,
INFP, ENTP and ESFJ (see Table 4-9). For the senior interior design students, there
were three of the most common personality types for designers, according to MacKinnon
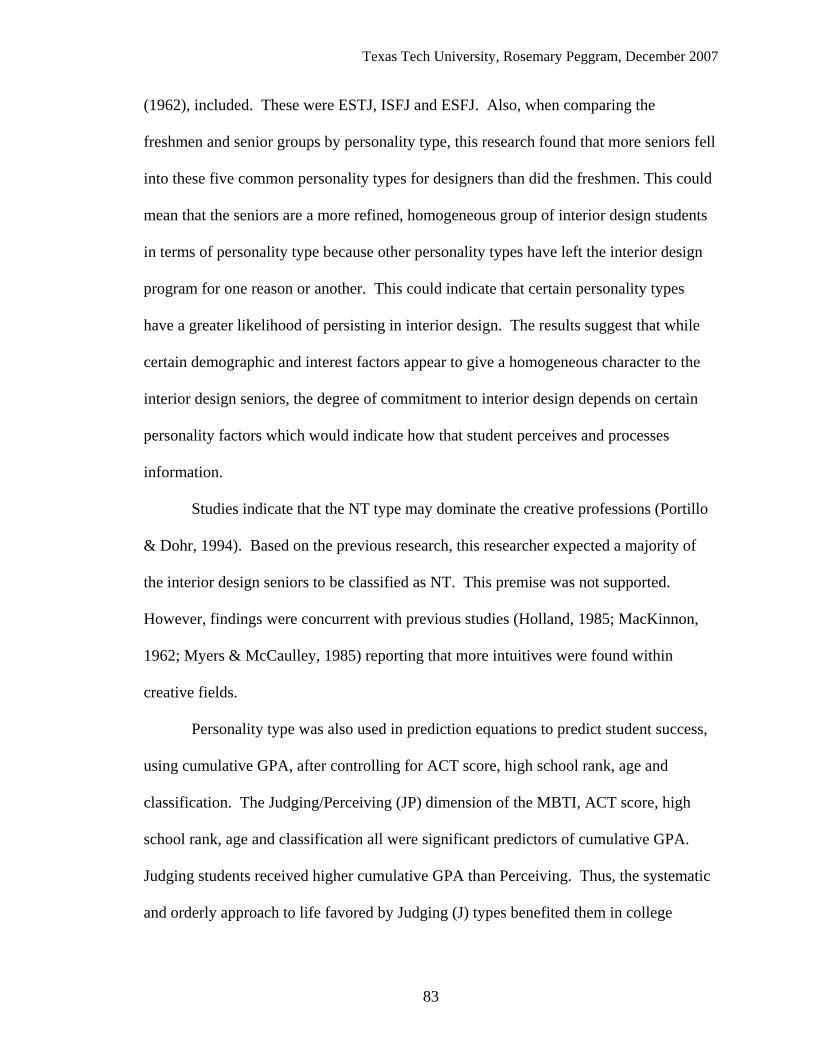
Texas Tech University, Rosemary Peggram, December 2007
83
(1962), included. These were ESTJ, ISFJ and ESFJ. Also, when comparing the
freshmen and senior groups by personality type, this research found that more seniors fell
into these five common personality types for designers than did the freshmen. This could
mean that the seniors are a more refined, homogeneous group of interior design students
in terms of personality type because other personality types have left the interior design
program for one reason or another. This could indicate that certain personality types
have a greater likelihood of persisting in interior design. The results suggest that while
certain demographic and interest factors appear to give a homogeneous character to the
interior design seniors, the degree of commitment to interior design depends on certain
personality factors which would indicate how that student perceives and processes
information.
Studies indicate that the NT type may dominate the creative professions (Portillo
& Dohr, 1994). Based on the previous research, this researcher expected a majority of
the interior design seniors to be classified as NT. This premise was not supported.
However, findings were concurrent with previous studies (Holland, 1985; MacKinnon,
1962; Myers & McCaulley, 1985) reporting that more intuitives were found within
creative fields.
Personality type was also used in prediction equations to predict student success,
using cumulative GPA, after controlling for ACT score, high school rank, age and
classification. The Judging/Perceiving (JP) dimension of the MBTI, ACT score, high
school rank, age and classification all were significant predictors of cumulative GPA.
Judging students received higher cumulative GPA than Perceiving. Thus, the systematic
and orderly approach to life favored by Judging (J) types benefited them in college
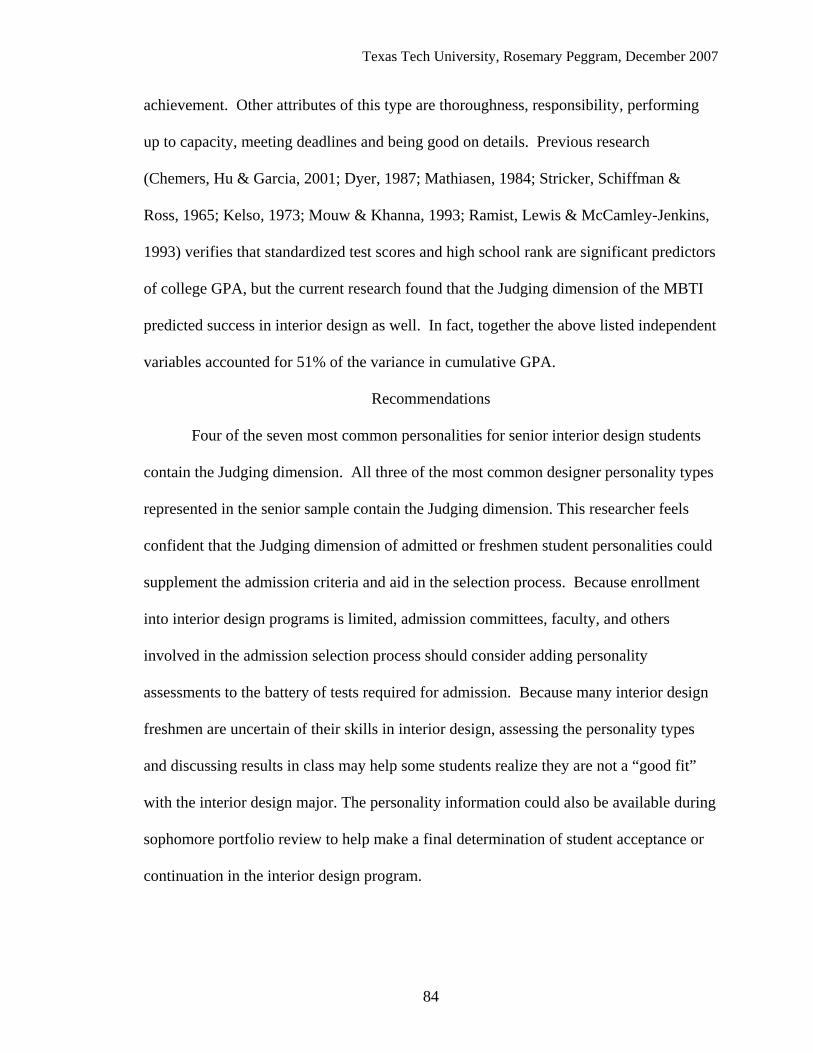
Texas Tech University, Rosemary Peggram, December 2007
84
achievement. Other attributes of this type are thoroughness, responsibility, performing
up to capacity, meeting deadlines and being good on details. Previous research
(Chemers, Hu & Garcia, 2001; Dyer, 1987; Mathiasen, 1984; Stricker, Schiffman &
Ross, 1965; Kelso, 1973; Mouw & Khanna, 1993; Ramist, Lewis & McCamley-Jenkins,
1993) verifies that standardized test scores and high school rank are significant predictors
of college GPA, but the current research found that the Judging dimension of the MBTI
predicted success in interior design as well. In fact, together the above listed independent
variables accounted for 51% of the variance in cumulative GPA.
Recommendations
Four of the seven most common personalities for senior interior design students
contain the Judging dimension. All three of the most common designer personality types
represented in the senior sample contain the Judging dimension. This researcher feels
confident that the Judging dimension of admitted or freshmen student personalities could
supplement the admission criteria and aid in the selection process. Because enrollment
into interior design programs is limited, admission committees, faculty, and others
involved in the admission selection process should consider adding personality
assessments to the battery of tests required for admission. Because many interior design
freshmen are uncertain of their skills in interior design, assessing the personality types
and discussing results in class may help some students realize they are not a “good fit”
with the interior design major. The personality information could also be available during
sophomore portfolio review to help make a final determination of student acceptance or
continuation in the interior design program.

Texas Tech University, Rosemary Peggram, December 2007
85
Further Research
The study of personality types in interior design and its use in prediction studies
has revealed the need for further research. Recommendations for further research
include:
(1) Replicate the study within a different region of the United States, for example
the Pacific West or East regions as described by IDEC, to determine if
personality types for interior design students are consistent with major or vary
by region.
(2) Replicate the study over a longitudinal time period of four years at multiple
universities. Track the freshmen from admission to graduation, document
drop-outs, and MBTI test both at the freshmen and senior levels, to gain more
awareness into incongruence between student and chosen major of design.
(3) Use the MBTI types of those seniors labeled as successful in this study and
track them after graduation. For example, assess whether they were
successful in the field, levels of job satisfaction, and length of time in the field
to determine if successful interior design seniors become successful interior
design professionals.
(4) Interior design is a field that requires many diverse skills and abilities to
succeed in the field. This researcher is interested in continuing the MBTI
personality research to determine those types that show creative tendencies,
spatial visualization abilities, three dimensional abilities, etc. at the freshmen
level. This information could help faculty when counseling or advising
freshmen or other interested students about the field of interior design.
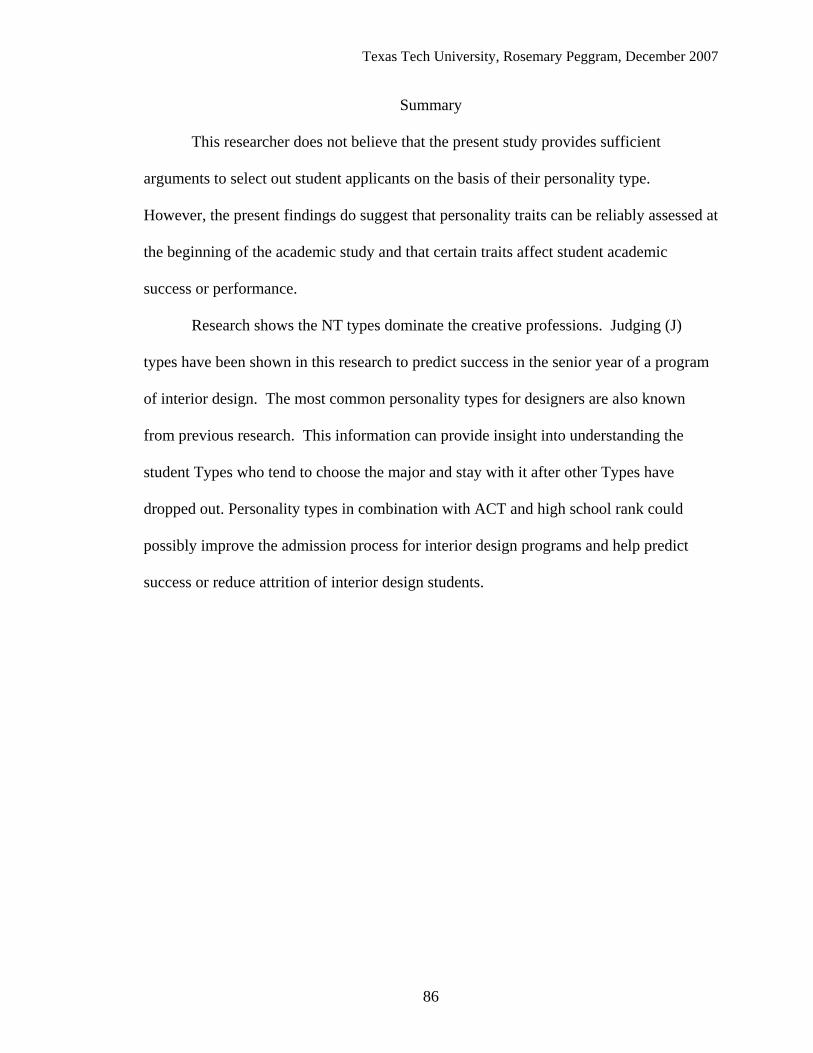
Texas Tech University, Rosemary Peggram, December 2007
86
Summary
This researcher does not believe that the present study provides sufficient
arguments to select out student applicants on the basis of their personality type.
However, the present findings do suggest that personality traits can be reliably assessed at
the beginning of the academic study and that certain traits affect student academic
success or performance.
Research shows the NT types dominate the creative professions. Judging (J)
types have been shown in this research to predict success in the senior year of a program
of interior design. The most common personality types for designers are also known
from previous research. This information can provide insight into understanding the
student Types who tend to choose the major and stay with it after other Types have
dropped out. Personality types in combination with ACT and high school rank could
possibly improve the admission process for interior design programs and help predict
success or reduce attrition of interior design students.
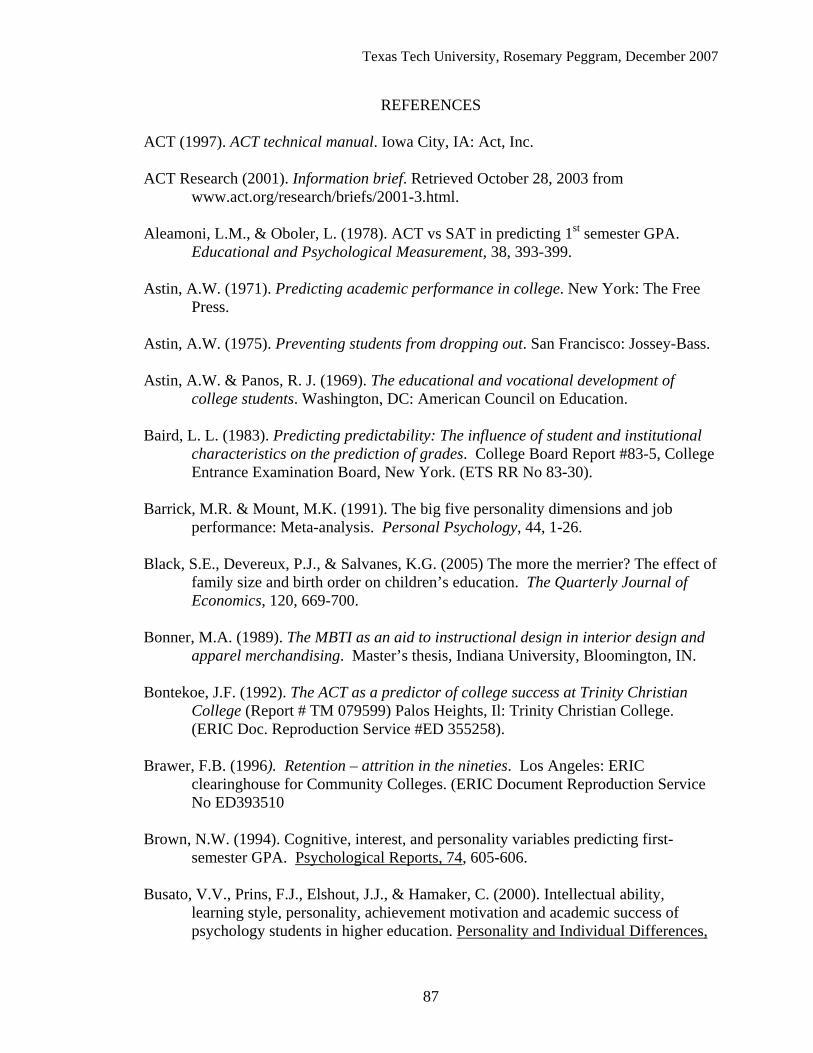
Texas Tech University, Rosemary Peggram, December 2007
87
REFERENCES
ACT (1997). ACT technical manual. Iowa City, IA: Act, Inc. ACT Research (2001). Information brief. Retrieved October 28, 2003 from www.act.org/research/briefs/2001-3.html. Aleamoni, L.M., & Oboler, L. (1978). ACT vs SAT in predicting 1st semester GPA. Educational and Psychological Measurement, 38, 393-399. Astin, A.W. (1971). Predicting academic performance in college. New York: The Free
Press. Astin, A.W. (1975). Preventing students from dropping out. San Francisco: Jossey-Bass. Astin, A.W. & Panos, R. J. (1969). The educational and vocational development of college students. Washington, DC: American Council on Education. Baird, L. L. (1983). Predicting predictability: The influence of student and institutional characteristics on the prediction of grades. College Board Report #83-5, College Entrance Examination Board, New York. (ETS RR No 83-30). Barrick, M.R. & Mount, M.K. (1991). The big five personality dimensions and job
performance: Meta-analysis. Personal Psychology, 44, 1-26. Black, S.E., Devereux, P.J., & Salvanes, K.G. (2005) The more the merrier? The effect of family size and birth order on children’s education. The Quarterly Journal of Economics, 120, 669-700. Bonner, M.A. (1989). The MBTI as an aid to instructional design in interior design and apparel merchandising. Master’s thesis, Indiana University, Bloomington, IN. Bontekoe, J.F. (1992). The ACT as a predictor of college success at Trinity Christian College (Report # TM 079599) Palos Heights, Il: Trinity Christian College. (ERIC Doc. Reproduction Service #ED 355258). Brawer, F.B. (1996). Retention – attrition in the nineties. Los Angeles: ERIC clearinghouse for Community Colleges. (ERIC Document Reproduction Service No ED393510 Brown, N.W. (1994). Cognitive, interest, and personality variables predicting first-
semester GPA. Psychological Reports, 74, 605-606. Busato, V.V., Prins, F.J., Elshout, J.J., & Hamaker, C. (2000). Intellectual ability, learning style, personality, achievement motivation and academic success of psychology students in higher education. Personality and Individual Differences,

Texas Tech University, Rosemary Peggram, December 2007
88
29(6), 1057-1068. Cattell, R.B. (1968). The prediction of achievement and creativity. Indianapolis, IN: Bobbs-Merrill Chemers, M.M., Hu, L., & Garcia, B.F. (2001). Academic self-efficacy and first-year
college student performance and adjustment. Journal of Educational Psychology, 93(1), 55-64.
Child, L. (1965). Personality correlates in esthetic judgment in college students. Journal of Personality, 33, 476-511. CIDA accredited programs. (2005). Retrieved April 2006 from http://www.cida.org /direc.html Clark, M.J & Grandy, J. (1984). Sex differences in the academic performance of SAT- test takers. (Rep. # 84-43). New York: College Entrance Examination Board. Clifford, P.I & Fishman, J.A. (1963). The impact of testing programs on college preparation and attendance. National Society of Education Yearbook, The impact and improvement of school testing programs. College Examination Board. (1985). National college bound seniors 1985. New York: Author. Creswell, J.W. (2002). Educational research: planning, conducting, and evaluating
quantitative and qualitative research. New Jersey: Merrill – Prentice Hall. Cronbach, L.J. (1949). Essentials of psychological testing. New York: Harper & Brothers. Diehl, J.L. (1992). The relationship between creativity, imagery, and personality types in
interior design students. Dissertation, Oklahoma State University. Stillwater, OK. DuBois, P.H. (1972). Review of the SAT. In Buros, 7th mental measurements yearbook, 646-648. Dyer, E. D. (1987). Can university success and first-year job performance be predicted
from academic achievement, vocational interest, personality and biographical measures? Psychological Reports, 61(2), 655-671.
Edwards, J.F. (1998). Several non-intellective variables and the “Big 5” personality factors as predictors of academic performance by 1st year college students. Master’s thesis, Mississippi State University. Ferguson, D. M., Horwood, L. J., & Boden, J. M. (2006). Birth order and educational

Texas Tech University, Rosemary Peggram, December 2007
89
achievement in adolescence and young adulthood. The Australian Journal of Education, 50 (2), 122-140. Freud, S. (1910). Three contributions to the theory of sex. New York: Nervous and Mental Disease. Geiser, S and Santelices, M.V., (2007). Validity of high school grades in predicting student success beyond the freshman year: High school record vs. standardized tests as indicators of four-year college outcomes. Center for Studies in Higher Education, Research & Occasional Paper Series: CSHE.6.07, University of Calif., Berkeley. Goldman, R.D. & Slaughter, R.E. (1976). Why college GPA is difficult to predict. Journal of Educational Psychology, 68, 9-14. Guazzo, Jr., E.J. (1954). Predicting academic success of architecture students. Master’s thesis, Alabama Polytechnic Institute, Auburn, AL. Hammer, A.L., & Macdaid, G.P. (1992). MBTI career report manual. Palo Alto, CA: Consulting Psychologists Press. Heim, A. (1970). Intelligence and personality: Their assessment and relationship. Middlesex, England: Penguin Books Ltd. Hewitt, B.N. & Goldman, R.D. (1975). Occam’s razor slices through the myth that college women overachieve. Journal of Educational Psychology, 67, 325-330. History of ACT. (2005). Retrieved July 26, 2005, from http://www.act.org /aoutact/history.html. Holland, J.S. (1985). Making vocational choices: A theory of vocational personalities and work environments. Englewood Cliffs, NJ: Prentice-Hall. Holmstrom, E. I. (1975). Changing characteristics of students in health fields. Journal of Allied Health, 4, 9-18. Hoschl, C. & Kozeny, J. (1997). Predicting academic performance of medical students:
The first three years. The American Journal of Psychiatry, 154(6), 86-92.
IDEC Regions (2005). Retrieved October 7, 2005 from http://www.idec.org. Irvine, D.W. (1966). Multiple prediction of college graduation from pre-admission data. Journal of Experimental Education, 35(1), 84-89. Jung, C.G. (1923). Psychological types. Princeton, N.J.: Princeton University Press.

Texas Tech University, Rosemary Peggram, December 2007
90
Jung, C.G. (1933). Psychological types. London: Routledge & Kegan Paul. Jung, C.G. (1966). On the relation of analytical psychology to poetry in the Spirit in Man, Art & Literature, 15, The Collected Works of C.G. Jung. New York City: Bollinger Foundations. Kahn, J.H., Nauta, M.M., Gailbreath, R.D., Tipps, J., & Chartrand, J.M. (2002). The utility of career and personality assessment in predicting academic progress. Journal of Career Assessment, 10(1), 3-23. Kaiser, K. & Bostrom, R. (1982). Personality characteristics of MIS project teams: An
empirical study and action-research design. MIS Quarterly, 6, 43-60. Kalsbeek, D. (1987). Campus retention: The MBTI in institutional self-studies. In J.A. Provost & S. Anchors (Eds.), Application of the Myers-Briggs Type Indicator in higher education (pp.31-63). Palo Alto, CA: Consulting Psychologists Press. Keirsey, D. & Bates, M. (1984). Please understand me: Character & temperament types.
Del Mar, CA: Prometheus Nemesis. Keller, D., Crouse, J., & Trusheim, D. (1993). Relationships among gender differences in freshman course grades and course characteristics. Journal of Educational Psychology, 85(4), 702-709. Klitgaard, R. (1985). Choosing elites. New York: Basic Books, Inc. Kris, E. (1952). Psychoanalytic explanations in art. New York: International Universities Press. Lavin, D.E. (1965). The prediction of academic performance. New York: Russell Sage Foundation Levin, J. & Wyckoff, J.H. (1995). Predictors of persistence and success in an engineering program. NACADA Journal, 15(1), 15-21. Lievens, F., Coetsier, P., De Fruyt, F., & De Maeseneer, J. (2002). Medical students’
personality characteristics and academic performance: A five-factor model perspective. Medical Education, 36, 1050-1056.
Lim, Y. (1991). Relationship between aptitudes and attitudes toward computer-aided
design and personality types of interior design students. Masters Thesis, Virginia Polytechnic Institute and State University, Blacksburg, VA.
Lins, J.L., Abell, A.P., & Hutchins, H.C. (1966). Relative usefulness in predicting academic success of the ACT, the SAT, & some other variables. Journal of Experimental Education, 35(2), 1-29.
Texas Tech University, Rosemary Peggram, December 2007
91
MacKinnon, D.W. (1962). The nature and nurture of creative talent. American Psychologist, 17, 484-495. Mancott, A. (1968). Prediction of academic achievement in a first semester college chemistry course for medical laboratory technologists. Educational and Psychological Measurement, 28, 945-946. Martin, D.C. & Bartol, K.M. (1986). Holland’s Vocational Preference Inventory and the
Myers-Briggs Type Indicator as predictors of vocational choice among masters of business administration. Journal of Vocational Behavior, 29, 51-65.
Mathiasen, R.E. (1984). Predicting college academic achievement: A research review.
College Student Journal, 18, 380-386. McCaulley, M.H. (1974). The Myers-Briggs Type Indicator and the teaching-learning process. Paper presented at the annual meeting of the American Educational Research Association, Chicago, IL. McCaulley, M.H. (1985). The selection ratio type table: A research strategy for comparing type distributions. Journal of Psychological Type, 10, 46-56. McCaulley, M.H. (1990). The Myers-Briggs Type Indicator: A measure for individuals and groups. Measurement and Evaluation in Counseling and Development, 22(4), 181-195. McCausland, D.F. & Stewart, N.E. (1974). Academic aptitude, study skills, and attitudes and college GPA. The journal of Educational Research, 67(8), 354-357. McClelland, W.F. (1966). Correlation matrix of GPA and personality test scores for
predicting academic success in graduate studies of educational administration. A Masters Thesis, College of Education, Wichita State University.
McFee, J.K. & Degge, R. (1977). Art, culture, and environment. Belmont, CA:
Wadsworth Publishing Co., Inc. McGrath, M & Braunstein, A (1997). The prediction of freshmen attrition: An examination of the importance of certain demographic, academic, financial & social factors. College Student Journal, 31, 396-408. Mouw, J.T. & Khanna, R.K. (1993). Prediction of academic success: A review of the
literature and some recommendations. College Student Journal, 27(3), 328-336. Myers, I. B. (1962). The Myers-Briggs Type Indicator Manual. New Jersey: Education
Testing Service.

Texas Tech University, Rosemary Peggram, December 2007
92
Myers, I.B. (1980). Gifts differing. Palo Alto, CA: Consulting Psychologists Press, Inc. Myers & Briggs Foundation (2005). Retrieved September 2, 2005, from
http://www.myersbriggs.org Myers, I.B. & McCaulley, M.H. (1985, 1990). Manual: A guide to the development and use of the Myers-Briggs type indicator. Palo Alto, CA: Consulting Psychologists Press, Inc. Myers, I.B., McCaulley, M.H., Quenck, N.L., & Hammer, A.L. (1998). MBTI manual: A guide to the development and use of the MBTI (3rd ed.) Palo Alto, CA: CPP, Inc. Noble, J. (1991). Predicting college grades from ACT assessment scores and high school course work and grade information. Research Report No. ACT-RR-91-3. American College Testing Program, Iowa City, IA. Noble, J. & Sawyer, R. (2002). Accuracy of high school grades and college admissions test scores for predicting different levels of academic achievement in college. Paper presented at the Annual Meeting of the Association for Institutional Research, Toronto, Ontario, Canada. Oswick, C. & Barber, P. (1998). Personality type and performance in an introductory level accounting course: A research note. Accounting Education, 7(3), 249-254. Ott, L.S. (1978). Admissions management with the focus on retention. In L. Noel (Ed.),
Reducing the drop-out rate (pp. 55-73). San Francisco: Jossey-Bass. Owen-Killar, A.M. (1996). Intellectual and nonintellectual predictors of academic performance in college. Masters thesis, University of North Carolina, Charlotte, North Carolina. Passons, E.R. (1967). Predictive validities of the ACT, SAT & high school grades for 1st semester GPA and freshmen courses. Educational and Psychological Measurement, 27, 1143-1144. Pinkney, J.W. (1983). The Myers-Briggs Type Indicator as an alternative in career
counseling. Personnel and Guidance Journal, 62, 173-177. Portillo, M. & Dohr, J.H. (1994). Bridging process and structure through criteria. Design
Studies, 15, 403-416. Ramist, L., Lewis, C., & McCamley-Jenkins, L. (1993). Student group differences in Predicting college grades: Sex, language & ethnic groups. College Board Research Report 93-1. New York: College Entrance Examination Board Rau, W. & Durand, A. (2000). The academic ethic and college grades: Does hard work
Texas Tech University, Rosemary Peggram, December 2007
93
help students “to make the grade”? Sociology of Education, 73(1), 19-38. Ridgell, S.D. & Lounsbury, J.W. (2004). Predicting academic success: General
intelligence, “Big Five” personality traits, and work drive. College Student Journal, 38(4), 607-618.
Rothstein, M.G., Paunonem, S.V., Rush, J.C., & King, G.A. (1994). Personality and
cognitive ability predictors of performance in graduate business school. Journal of Educational Psychology, 86(4), 516-530. Russ, R.R. & Weber, M.J. (1995). Personality types of interior design students:
Implications for education. Journal of Interior Design, 21(1), 30-38. Schneider, D. & Dorans, N.J. (1999) Concordance between SAT and ACT scores for individual students, Research Notes (RN-07). New York: College Entrance Examination Board,. Taken from website on Sept. 14, 2007 www.collegeboard.com/prod_downloads/highered/ra/sat/satACT_concordance.pdf Sputa, C.L., & Paulson, S.E. (1995) Birth order and family size: Influences on adolescents’ achievement and related parenting behaviors. Psychological Reports, 76 (1), 43-51. Stephens, W.B. (1973). Relationship between selected personality characteristics of
senior art students and their area of art study. Studies in Art Education, 14(3), 54- 67.
Stone, S. (1958).The contribution of intelligence, interests, temperament and certain personality variables to academic achievement in a physical sciences and mathematics curriculum. Dissertation Abstracts, 18, 669-670. Stricker, L.J., Rock, D.A., & Burton, N.W. (1993).Sex differences in predictions of college graduates from SAT scores. Journal of Educational Psychology, 85(4), 710-718. Stricker, L.J., Schiffman, H.,& Ross, J. (1965). Prediction of college performance with the MBTI. Educational and Psychological Measurement, 25(4), 1081-1095. Swensen Jr., C.H. (1957).College performance of students with high and low high school grade when academic aptitude is controlled. Journal of Educational Research, 50,597-603. Texas Tech University (TTU) Institutional Research and Information Management (2006). Report on interior design student tracking. Todd, M., & Roberts, D. (1981). A comparative study of Jungian psychological traits of Art education and music education majors. Research in Psychological Type, 3, 73-77.
Texas Tech University, Rosemary Peggram, December 2007
94
Trout, B.L. (1987). Heterogeneity of lower level interior design students with respect to occupational choice, personality constructs and abilities. Dissertation, University of Nebraska, Lincoln, Nebraska. U.S. Department of Education, National Center for Education Statistics. (2000). Descriptive summary of 1995-96 beginning postsecondary students: Three years later. (NCES 2000- 154) Washington, DC: Author. Volpe, S.K. (2000). Parallel journey: Learning styles and personality types of interior
design students. Masters thesis, California State University, Northridge. Wagner, M.E. & Strabel, E. (1935).Homogeneous groupings as a means of improving the prediction of academic performance. Journal of Educational Psychology, 19, 426-446. Wately, D. & Merwin, J.C. (1964).The effectiveness of variables for predicting academic achievement for business students. Journal of Experimental Education, 33(2), 189-192. Waxman, L., & Clemons, S. (July/August, 2005). For better or for worse, Interiors &
Sources, Weinberger, N.M. (November 1998). The music in our minds. Educational Leadership, 56 (3), 36-40. What is ETS? (2000). Retrieved July 26, 2005, from http://www.ets.org /aboutets.visitors.html Whiteside, A., Rothgeb, T., & Congleton, C. (1986).Quality control: A challenge to interior design educators, Journal of Interior Design Education and Research, 12(1), 3-8. Williams, C., Armstrong, D., & Malcolm, C. (1985). The negotiable environment: People, white- collar work & the office. Facility Management Institute, Ann Arbor, MI. Willingham, W.W., Lewis, C., Morgan, R., & Ramist, L. (1990). Predicting college
grades: An analysis of institutional trends over two decades. Princeton, NJ: Educational Testing Service.
Wolfe, R.N. & Johnson, S.D. (1995). Personality as a predictor of college performance.
Educational and Psychological Measurement, 55(2), 177-185. Woodman, R.W. (1981).Creativity as a construct in personality theory. Journal of Creative Behavior, 15, 43-66.

Texas Tech University, Rosemary Peggram, December 2007
95
Young, J.W. (1991). Gender bias in predicting college academic performance: A new approach using item-response theory. Journal of Educational Measurement, 28(1), 37-47.

APPENDIX
Texas Tech University, Rosemary Peggram, December 2007

APPENDIX A
APPROVAL FOR PROTECTION OF HUMAN SUBJECTS
97
Texas Tech University, Rosemary Peggram, December 2007
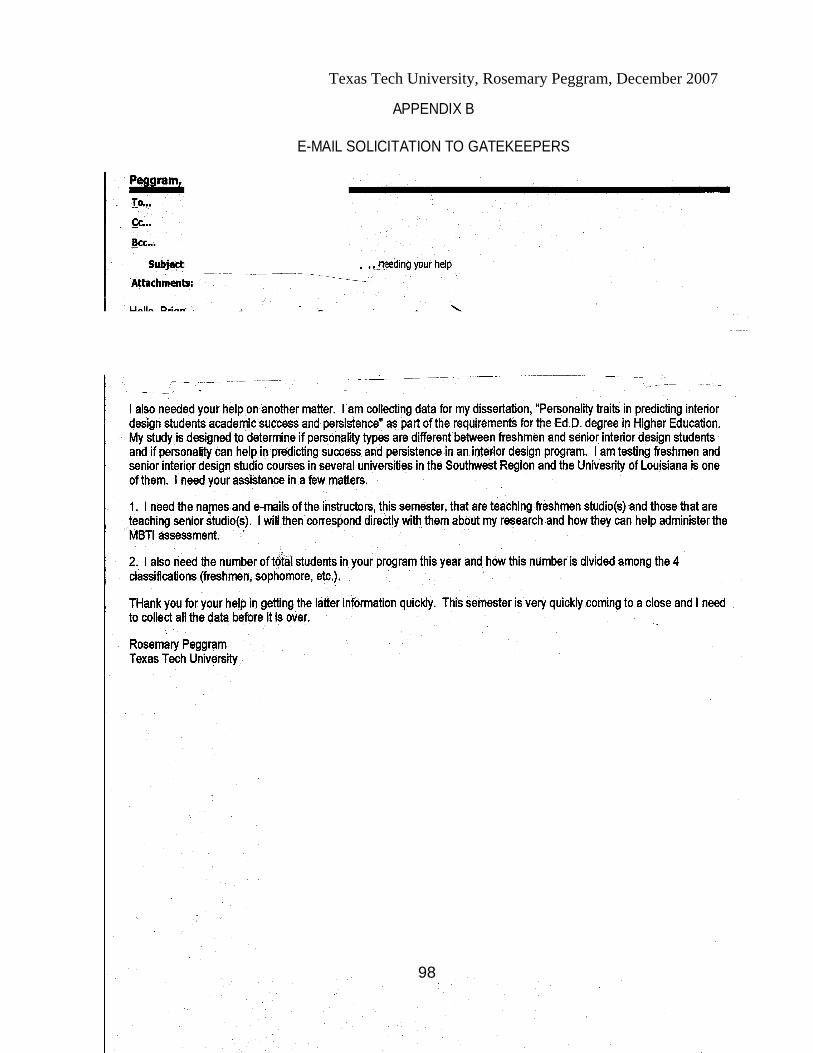
APPENDIX B
E-MAIL SOLICITATION TO GATEKEEPERS
98
Texas Tech University, Rosemary Peggram, December 2007
March 1, 2007 Ms. Kristi Gaines ID 1382 Instructor Dept. of Design Re: Assistance in collecting data from your students I am collecting data for my dissertation, “Personality traits in predicting interior design students academic success and persistence,” as part of the requirements for the Ed.D. degree in Higher Education. My study is designed to determine if personality types are different between freshmen and senior interior design students and if MBTI personality type can help in predicting success and persistence in an interior design program. I am surveying freshmen and senior interior design studio courses at your university. I have already spoken with Dr. Zane Curry about my research and he gave me your name. I am asking for your assistance in collecting data from students in your class. The survey and other forms take 30-45 minutes to complete. I would send you a packet that includes 1) a cover letter further explaining the study, 2) directions for administering, 3) the demographic survey, 4) the Myers-Briggs Type Indicator personality tests, 5) consent and release forms, and 6) a pre-addressed, stamped envelope in which to return all paperwork. I am asking that this take place during a regularly scheduled class time to reach as many students as possible and to monitor the usage of the instrument. Thank you for your help. If you have any questions, please feel free to contact me at (806)742-3050 phone, (806)742-1849 fax, Email: [email protected] or my advisor, Dr. John Murray at (806)742-1997 phone, Email: [email protected]. Sincerely, Rosemary Peggram Ed.D doctoral candidate Cc: Dr. John Murray, Chair Cc: Dr. Diane Oliver, Committee member Cc: Dr. Zane Curry, Committee member
APPENDIX C
LETTER TO INSTRUCTORS TO SOLICIT ASSISTANCE
99
Texas Tech University, Rosemary Peggram, December 2007
April 6, 2007 Mr. Bill Beitz Fr. Studio Instructor Oklahoma State University Re: “Personality traits in predicting interior design students’ academic success and persistence” research study Thank you for being willing to help me with my research on interior design students. I am collecting data for my dissertation, “Personality traits in predicting interior design students’ academic success and persistence,” as part of the requirements for the Ed.D. degree in Higher Education. My study is designed to determine if personality preferences are different between freshmen and senior interior design students and if these preferences can help in predicting success and persistence in an interior design program. I am surveying freshmen and senior interior design studio courses at your university in the hopes of developing a profile of characteristics, including personality preferences that define successful and persistent students in an interior design program. I want to make this as easy as possible for you so included you will find directions for administering the Myers-Briggs Type Indicator (MBTI) and a token of appreciation for you. The student packets are paper-clipped together. I have also enclosed a pre-addressed, stamped envelope in which to return all paperwork to me. I am asking that the MBTI be administered during a regularly scheduled class time to reach as many students as possible and to monitor the usage of the instrument. Please do not let the booklets leave the classroom. The MBTI self-test inventory is copyrighted so I must receive every one of them back. Participation is voluntary for the students. Those that participate can elect to receive an explanation of their MBTI personality profile. I am collecting data from several universities in five states. Your assistance and access to your class is greatly appreciated. Should you have questions about this research, contact me at (806)742-3050 phone, Email [email protected] or my faculty advisor, Dr. John Murray, at (806)742-1997 phone, Email: [email protected]. Sincerely,
APPENDIX D
COVER LETTER TO INSTRUCTORS
100
Texas Tech University, Rosemary Peggram, December 2007
Directions for administering the personality test and demographic survey: Packets have been clipped together for each student. Each packet includes (1) a cover letter to the student, (2) a MBTI self-test instrument, (3) a demographic survey, (4) a consent and release form, and (5) a blank, letter size envelope. Please give each student in your class a packet. The cover letter on top of each packet explains the research and the procedure. Please ask the students to read it first. It will take 30-45 minutes to complete the inventories and forms. Also, please emphasize to students that there are no right or wrong answers and that it is best to mark the first answer that comes to mind. Students should not stop to analyze or think about an answer, as this can skew results. Collect all the information, including the MBTI, from the students when they are finished. If students have completed the MBTI for this study in another course, they DO NOT need to repeat it again. After putting all of the collected forms, inventories and envelopes in the included, postage paid envelope, please mail it back to me. It is very important that I get back all the MBTI booklets due to the ethical issue of licensure. Students are given the option of receiving their MBTI personality profile. These profiles will be sent to you by the end of the semester to disseminate to the appropriate students. Thank you for your time and assistance in helping me in my research on interior design students. Please accept my small token of appreciation. Rosemary Peggram Ed.D doctoral candidate
APPENDIX E
DIRECTIONS FOR ADMINISTERING INSTRUMENT
101
Texas Tech University, Rosemary Peggram, December 2007
Dear Student: The dissertation research, “Personality Traits in Predicting Interior Design Students Academic Success and Persistence,” conducted by Rosemary Peggram as part of the requirements for her Ed.D. degree in Higher Education is designed to determine if personality preferences used in addition to cognitive measures in admission considerations can be useful in predicting academic success and persistence in Interior Design students. Description of research: This research will add to the limited literature about the personality traits of interior design students. The researcher is also using personality profiles in addition to SAT/ACT scores and high school GPA/rank in predicting success and persistence in interior design. These personality preferences will additionally be compared between freshmen and senior interior design students. This information will be of assistance to interior design students and faculty. Subject information: Each student who chooses to participate in the study will spend approximately 30-45 minutes filling out a 95-question self-test and demographic survey. There are no risks for this study that are known to the researcher at this time. If you have already completed a Myers-Briggs Type Inventory (MBTI) for this study in another course, please stop now and return everything to the instructor. Confidentiality & final disposition of data: All information that is collected in this study will remain confidential. The results of this study will be published only in aggregate form and the names or identities of subjects will not be known. The consent form will be kept separate from the inventories. All sensitive data and documentation collected, as part of this research, will be destroyed at the conclusion of the study by the researcher. This consent form is not valid after December 2007. Benefit of participation: You will not receive monetary compensation for participation in this study. However, you may receive an explanation of your personality profile, as revealed by the MBTI, if you choose. Would you like to receive your Myers-Briggs Type Inventory personality profile? Yes_____ No_____ If you checked yes, please indicate your name and class on the attached envelope on the back of this packet. The profile will be returned to your instructor in this envelope by the end of the semester. Concerns: If you have specific questions about the study, you may contact Professor John Murray, faculty advisor, Box 41071, COE, Texas Tech University, Lubbock, TX 79409, or phone (806)742-1997 ext. 271. For questions about your rights as a subject, contact the Texas Tech University Institutional Review Board for the Protection of Human Subjects, Office of Research Services, TTU, Lubbock, TX 79409. Or you can call (806)742-3884. You should understand that your participation in this study is completely voluntary, and you may decline to participate or withdraw from the study at any time without jeopardizing your standing in this class.
APPENDIX F
STUDENT COVER LETTER
102
Texas Tech University, Rosemary Peggram, December 2007
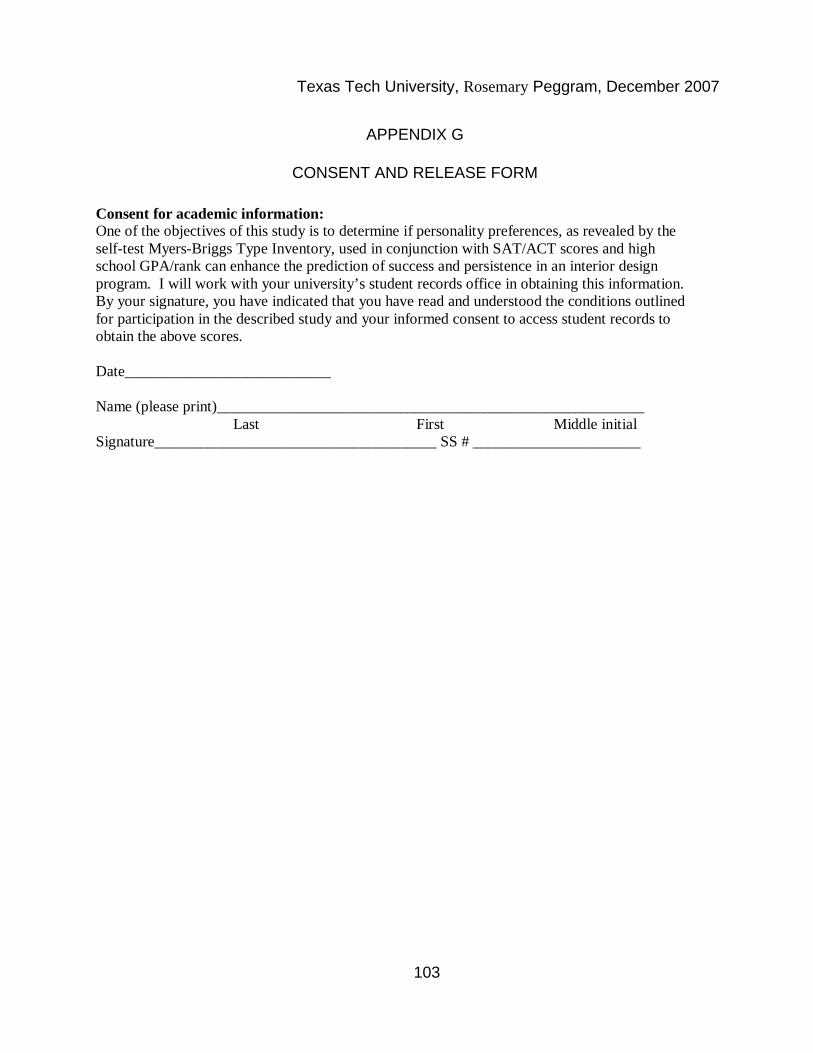
Consent for academic information: One of the objectives of this study is to determine if personality preferences, as revealed by the self-test Myers-Briggs Type Inventory, used in conjunction with SAT/ACT scores and high school GPA/rank can enhance the prediction of success and persistence in an interior design program. I will work with your university’s student records office in obtaining this information. By your signature, you have indicated that you have read and understood the conditions outlined for participation in the described study and your informed consent to access student records to obtain the above scores. Date___________________________ Name (please print)________________________________________________________ Last First Middle initial Signature_____________________________________ SS # ______________________
APPENDIX G
CONSENT AND RELEASE FORM
103
Texas Tech University, Rosemary Peggram, December 2007
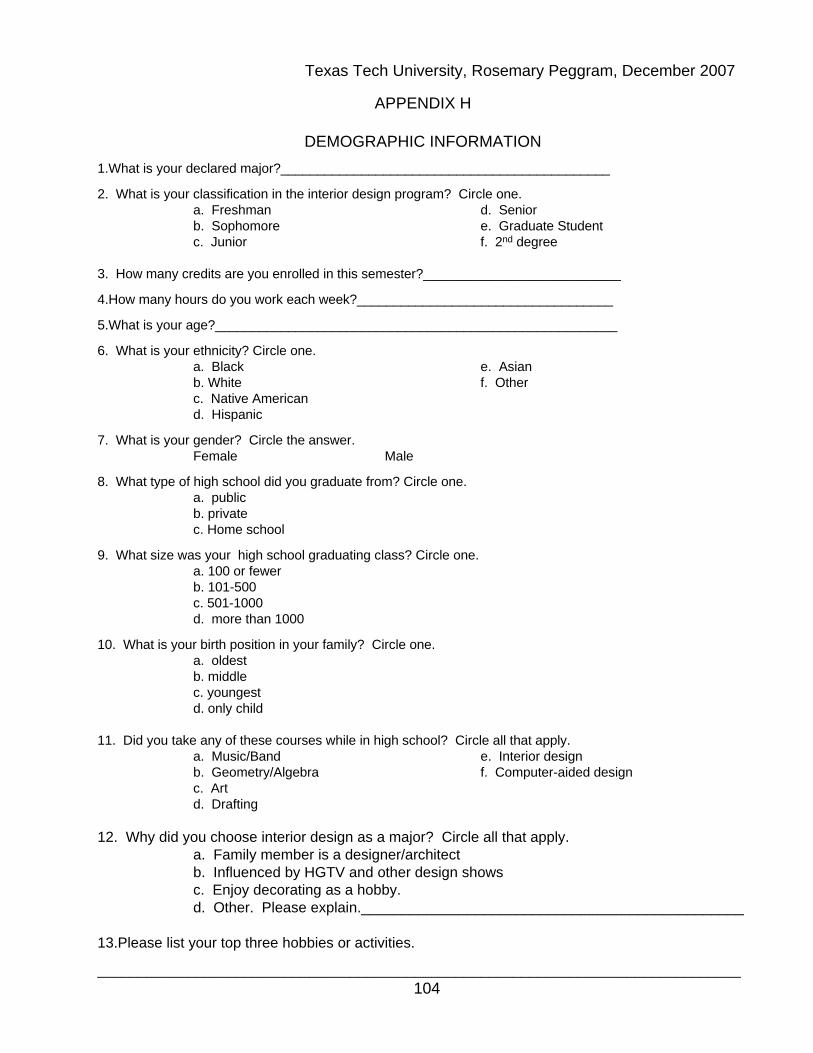
APPENDIX H
DEMOGRAPHIC INFORMATION1.What is your declared major?_____________________________________________
2. What is your classification in the interior design program? Circle one.a. Freshman d. Seniorb. Sophomore e. Graduate Studentc. Junior f. 2nd degree
3. How many credits are you enrolled in this semester?___________________________
4.How many hours do you work each week?___________________________________
5.What is your age?_______________________________________________________
6. What is your ethnicity? Circle one.a. Black e. Asianb. White f. Otherc. Native Americand. Hispanic
7. What is your gender? Circle the answer.Female Male
8. What type of high school did you graduate from? Circle one.a. publicb. privatec. Home school
9. What size was your high school graduating class? Circle one.a. 100 or fewerb. 101-500c. 501-1000d. more than 1000
10. What is your birth position in your family? Circle one.a. oldestb. middlec. youngestd. only child
11. Did you take any of these courses while in high school? Circle all that apply.a. Music/Band e. Interior designb. Geometry/Algebra f. Computer-aided designc. Artd. Drafting
12. Why did you choose interior design as a major? Circle all that apply.a. Family member is a designer/architectb. Influenced by HGTV and other design showsc. Enjoy decorating as a hobby.d. Other. Please explain._______________________________________________
13.Please list your top three hobbies or activities.
_______________________________________________________________________________104
Texas Tech University, Rosemary Peggram, December 2007
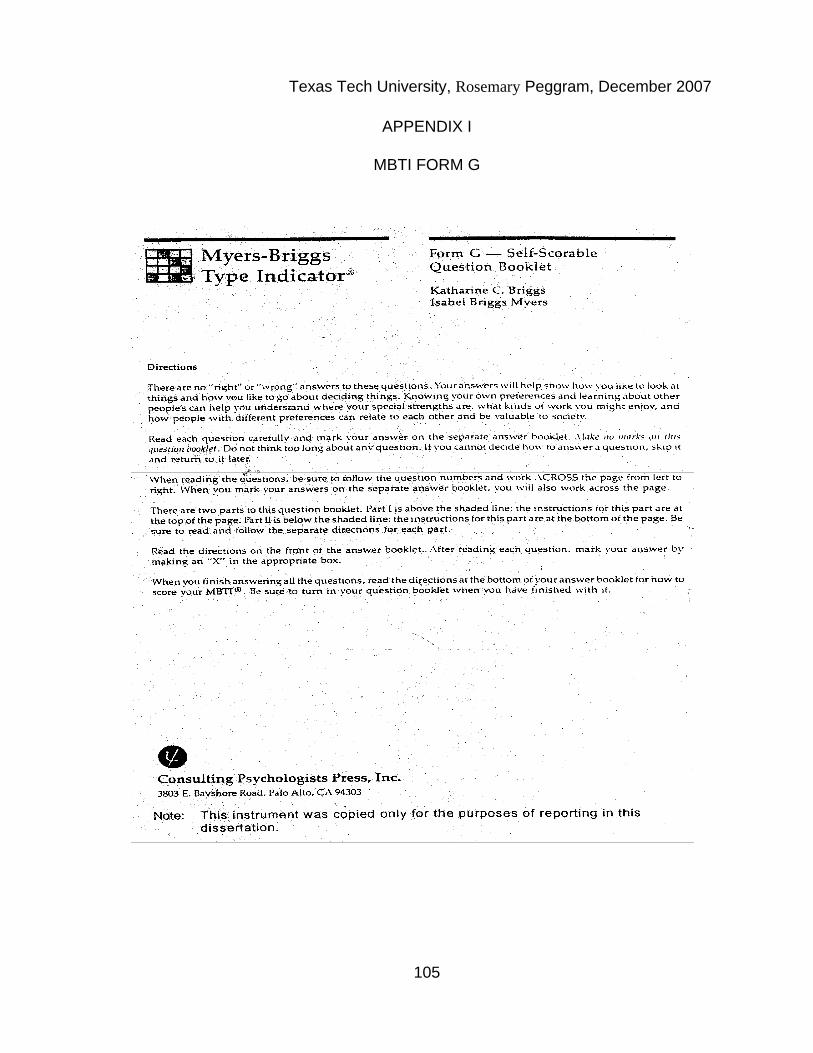
APPENDIX I
MBTI FORM G
105
Texas Tech University, Rosemary Peggram, December 2007
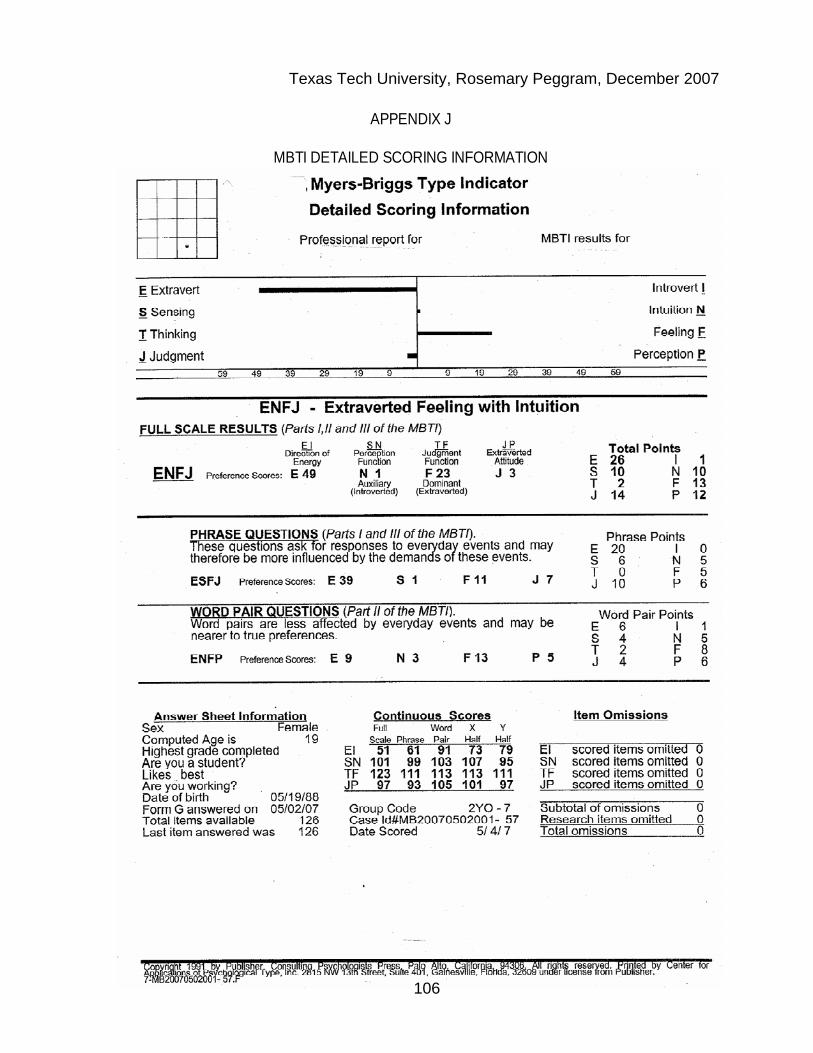
APPENDIX J
MBTI DETAILED SCORING INFORMATION
106
Texas Tech University, Rosemary Peggram, December 2007

APPENDIX K
THANK YOU NOTE TO PARTICIPANTS
107
Texas Tech University, Rosemary Peggram, December 2007

APPENDIX L
MBTI REPORT
108
Texas Tech University, Rosemary Peggram, December 2007

109
Texas Tech University, Rosemary Peggram, December 2007
110
Texas Tech University, Rosemary Peggram, December 2007

APPENDIX M
EFFECTS OF THE COMBINATIONS OF ALL FOUR PREFERENCES
Taken from People Types and Tiger Stripes, 3rd ed., by Gordon Lawrence
111
Texas Tech University, Rosemary Peggram, December 2007