personal software process sm for engineers: part i introduction to the psp sm defect removal...
Post on 19-Dec-2015
228 views
TRANSCRIPT
Personal Software ProcessSM
for Engineers: Part I Introduction to the PSPSM
Defect Removal Estimation of Project Size Microsoft Project Design Quality AssuranceQualtity

READING FOR THIS LECTURE
A Discipline for Software Engineering, Watts Humphrey, SEI Series in Software Engineering, Addison-Wesley, 1995.
Software Project Estimation. A workbook for Macro-Estimation of Software Development Effort and Duration, Produced by the International Software Benchmarking Standards Group.
Modern Structured Analysis by Edward Yourdon
Personal Software Process
• Originally COMP3710 was PSP
• The process can be applied to all levels of organisation

PSP Principles As computing professionals you should know your own performance.
You should measure, track, and analyse your work.
You should learn from your performance variations.
You should incorporate these lessons in your personal practices.
You should be able to predict your performance in future for your planning and self-management.

What is a PSP?
A PSP is a personal process for developing software. However principles apply to projects.•defined steps •forms •standards
A PSP is a measurement and analysis framework to help you characterize and estimate your process.
It is also a defined procedure to help you to improve your performance.
The CMMI and the PSP
The CMMI was developed by the SEI with the help of leading software groups.
The SW-CMM characterizes the most effective large-scale software practices.
The SW-CMM has been integrated into the larger CMMI model.
The PSP•applies the SW-CMM • is for individual work
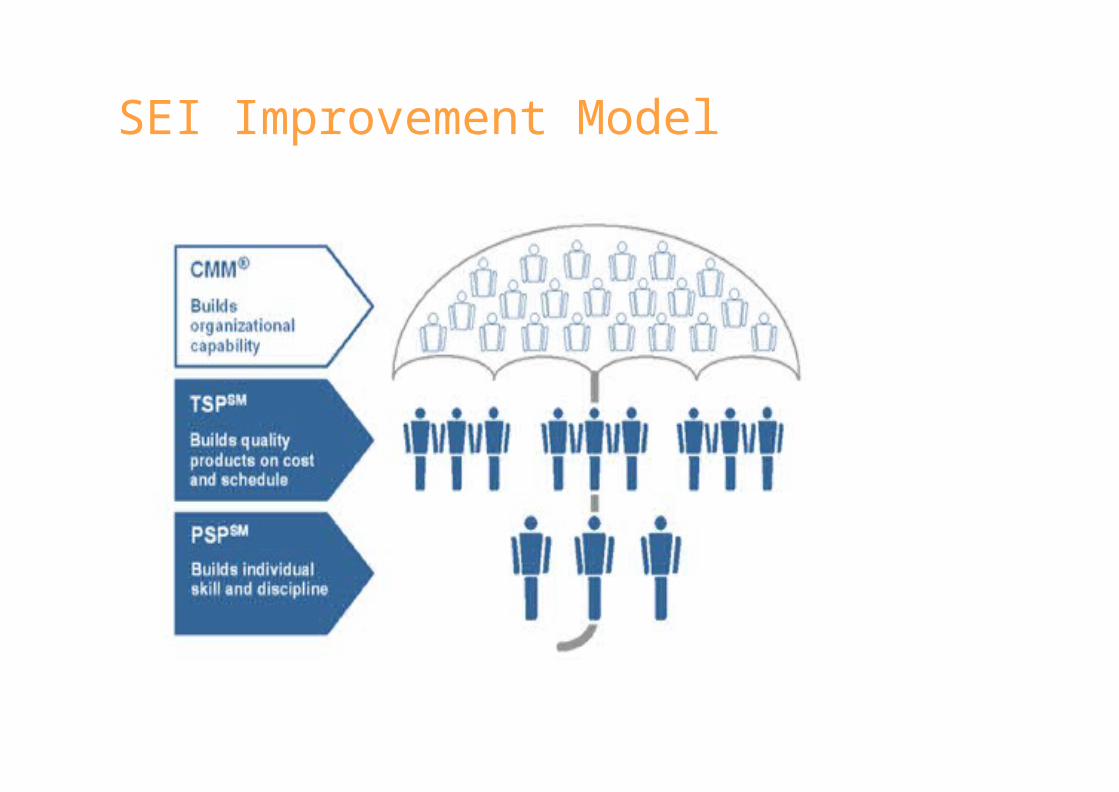
SEI Improvement Model

Capability Maturity Model® (SW-CMM®) for Software
The Capability Maturity Model for Software (SW-CMM) is a model for judging the maturity of the software processes of an organization and for identifying the key practices that are required to increase the maturity of these processes.
The Software CMM has become a de facto standard for assessing and improving software processes. Through the SW-CMM, the SEI and community have put in place an effective means for modeling, defining, and measuring the maturity of the processes used by software professionals.
Ref: http://www.sei.cmu.edu/cmm/cmm.html
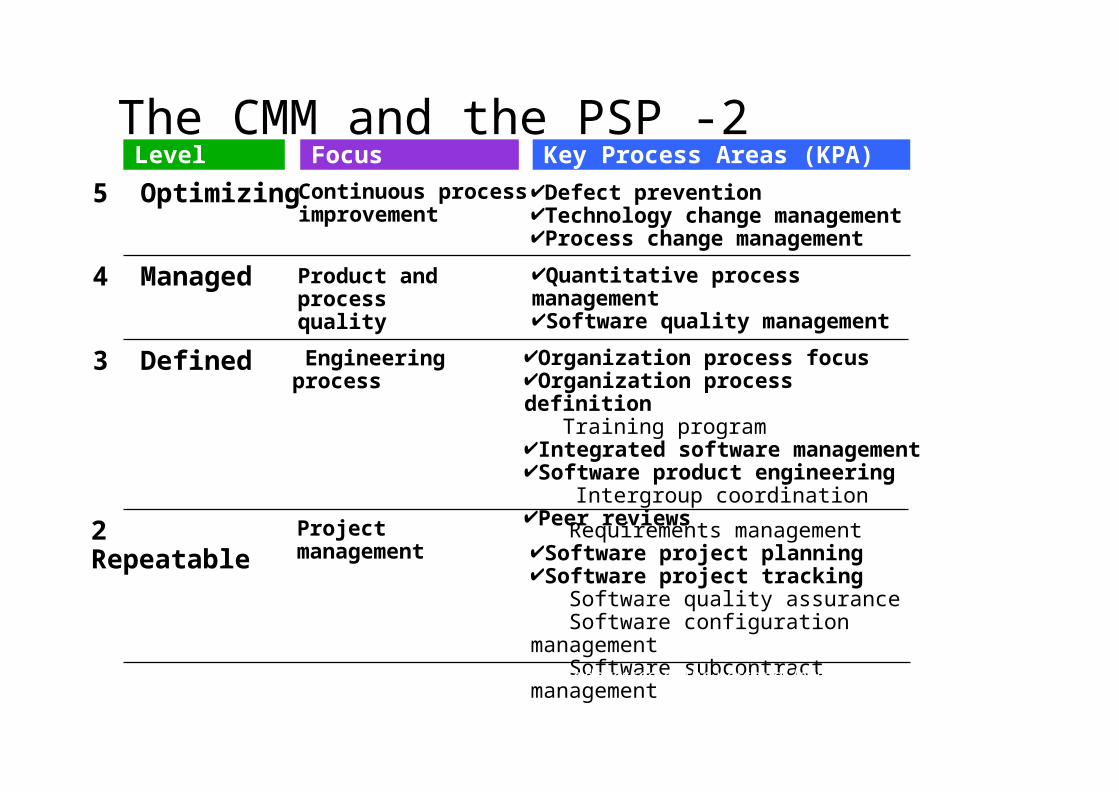
The CMM and the PSP -25 Optimizing
4 Managed
3 Defined
2 Repeatable
Continuous processimprovement
Product and processquality
Engineering process
Project management
Defect preventionTechnology change managementProcess change management
Quantitative process managementSoftware quality management
Requirements managementSoftware project planningSoftware project tracking Software quality assurance Software configuration management Software subcontract management
Level Focus Key Process Areas (KPA)
Organization process focusOrganization process definition Training programIntegrated software managementSoftware product engineering Intergroup coordinationPeer reviews
indicates the CMM Key Process Areas that are fully or partially addressed at the personal level in the PSP

Estimate Lines of Code (LOC)Time to code each segmentLOC/hr
Measure programming by phasesLines of Code (LOC)Time taken in each phaseDefects injected and removed by phase
AnalyseAccuracy of estimatesDefects injectedDefects found by compilerDefect fix times
Develop design and code review checklists to find most frequent defects in these stages.
The PSP Process

•Higher quality - PSP enables engineers to remove more defects early, at the source. On average, engineers inject 58% fewer defects after PSP training than before. PSP and TSP technology can also enable organizations to establish numerical quality requirements (or measures) for software-intensive products (e.g., defect density limits, percent defect free by phase, and component quality profiles).
• Improved Planning - PSP provides measures from which to develop resource planning. Cost and schedule problems often begin when engineers make commitments based on inaccurate size and resource estimates. PSP methods provide more accurate size and resource estimates using statistical techniques and historical data. Engineers' schedule estimating errors before PSP training averaged 39.4%, and after training they averaged 10.4% ahead of schedule.
The PSP Main Benefits

Defect Detection
•Recognise defects•Prevent defects

PSP Defect Removal - Ch8 Humphrey
•Code Reviews. -Review before compile-Set up review measures, such as efficiency and detection rates
-Review against a standard - either CMMI or specific requirements.
-Set up process such as: setting scope, group interaction, roles, measures, etc
-Separate Design and Code reviews• Reduce review material• Remove design defects and simplify• Smaller scope of review
-Use checklists

PSP Defect Removal - 2
•Design Reviews. -Develop your design with a review in mind. You should explain all terms used
-The designs you develop must have a clear purpose and function
-Have a design review process-Review in stages
• Complete: all elements present• Verify structure and flow• Check logical constructs
-Verify design against client Requirements and Quality Assurance documents.
-Develop Quality Plan for review

Planning
• Make plans based on estimates
• Measure progress to develop better plans
•To make commitments you can meet
•To provide a basis for agreeing to take on a job
•To guide your work
•To help track your progress
•To complete project on time and on budget
PSP helps you plan. Why make Plans?
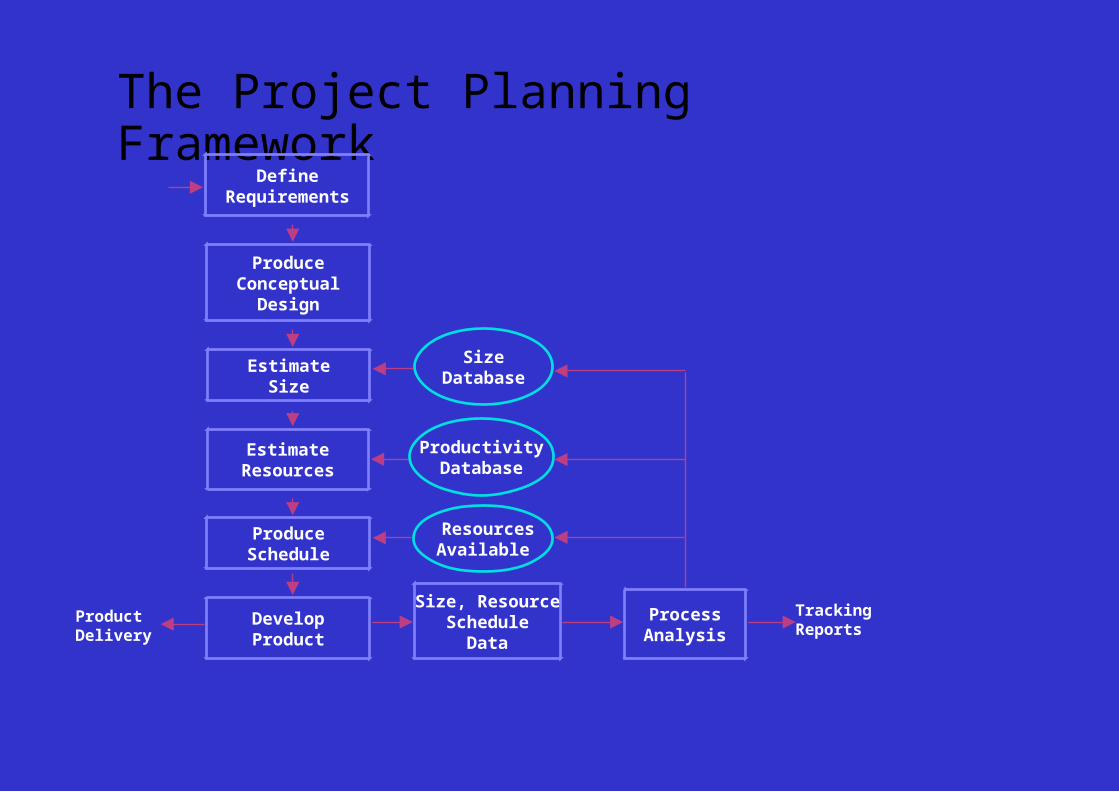
The Project Planning Framework
ProductDelivery
TrackingReports
DefineRequirements
ProduceConceptual
Design
EstimateSize
EstimateResources
ProduceSchedule
DevelopProduct
Size, ResourceSchedule
Data
ProcessAnalysis
ResourcesAvailable
SizeDatabase
ProductivityDatabase
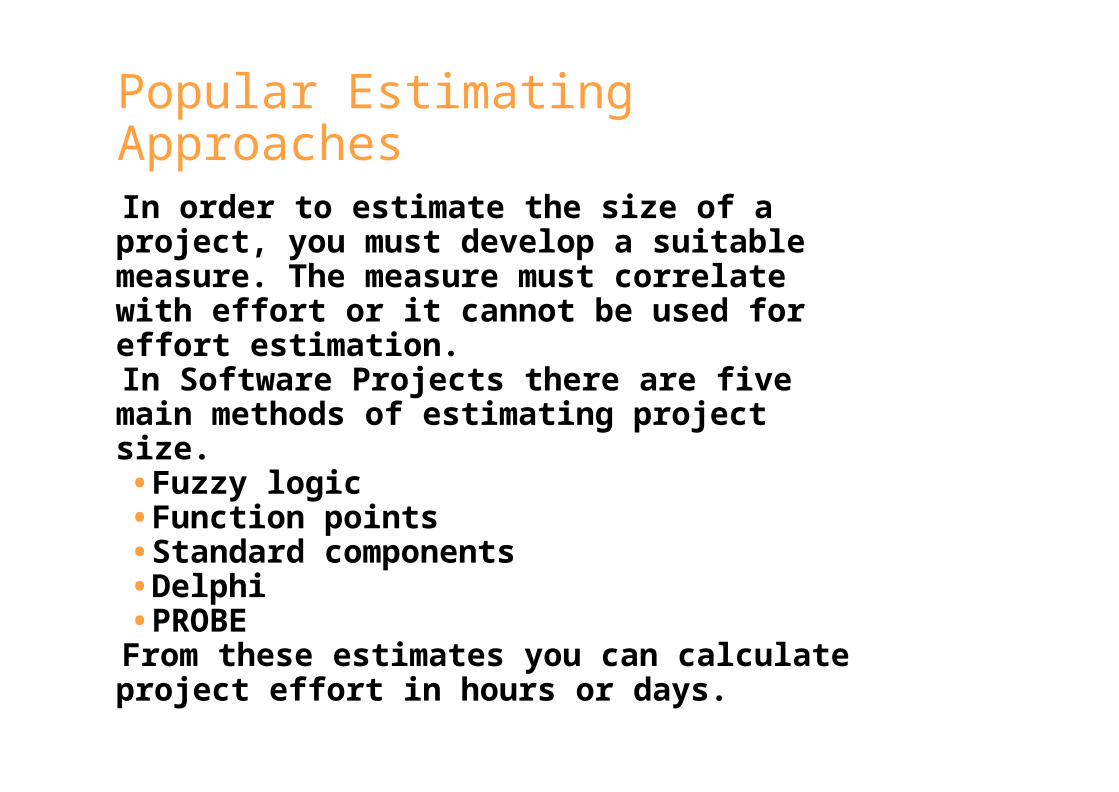
Popular Estimating Approaches
In order to estimate the size of a project, you must develop a suitable measure. The measure must correlate with effort or it cannot be used for effort estimation.
In Software Projects there are five main methods of estimating project size.•Fuzzy logic•Function points•Standard components•Delphi•PROBE
From these estimates you can calculate project effort in hours or days.

Fuzzy Logic Size Estimating - 1
Gather size data on previously developed programs
Subdivide these data into size categories and subcategories
Subrange Very Small Small Medium Large Very
Large
Gross RangeVery Small 1,148 1,514 2,000 2,630 3,467Small 4,570 6,025 8,000 10,471 13,804Medium 18,197 23,988 32,000 41,687 54,954Large 72,444 95,499 128,000 165,958 218,776Very Large 288,403 380,189 512,000 660,693 870,964

Fuzzy Logic Size Estimating - 2
When estimating a new program, compare the planned program with prior programs and select the most appropriate size category.
Subrange Very Small Small Medium Large Very
Large
Gross RangeVery Small 1,148 1,514 2,000 2,630 3,467Small 4,570 6,025 8,000 10,471 13,804Medium 18,197 23,988 32,000 41,687 54,954Large 72,444 95,499 128,000 165,958 218,776Very Large 288,403 380,189 512,000 660,693 870,964
For a Medium-Small, estimated LOC = 23988

Fuzzy Logic Advantages
Fuzzy logic estimating • is based on relevant historical data• is easy to use•requires no special tools or training•provides reasonably good estimates where new work is like prior experience
Fuzzy Logic Disadvantages
The disadvantages of fuzzy logic are• it requires a lot of data•the estimators must be familiar with the historically developed programs
• it only provides a crude sizing• it is not useful for new program types• it is not useful for programs much larger or smaller than the historical data
Function Point Estimating -1 A function point is a unit
•based on application functions (inputs, outputs, data files, inquiries, interface files)
•This has been refined to input data, entity types and output data in the Mark II formulation.
•scaled or weighted by simple, average, complex
For job complexity such as data communication, transaction rate etc, some companies use Adjusted Function Point estimates, adjusting a further +/- 35%. However this has been found to increase the error in the calculations.

Function Point Estimating -2
Procedure•Determine numbers of each function type in the application.
•Judge the scale and complexity of each function.
•Calculate function point total.•Use historical data on development rate per function point to make the estimate of delivery rate
•Multiply function points times estimated delivery rate to get the estimate of work effort.

Function Point Advantages
The advantages of function points are the following:•They are usable in the earliest requirements phases.
•They are independent of programming language, product design, or development style.
•There exists a large body of historical data.• It is a well-documented method.•There is an active users’ group.
See http://www.asma.org.au/
Function Point Disadvantages
The disadvantages of function points are the following:•You cannot directly count an existing product’s function point content.
•Without historical data, it is difficult to improve estimating skill.
•Function points do not reflect language, design, or style differences.
•Function points are designed for estimating commercial data processing applications.

Standard Component Sizing - 1
Establish the principal product size levels.•Components, modules, screens, etc.•Determine typical sizes of each level.
For a new product•Determine the component level at which estimation is practical.
•Estimate how many of those components will likely be in the product.
•Determine the maximum and minimum numbers possible.

Standard Component Sizing - 2
Calculate the size as the•number of components of each type times typical sizes of each type
•total to give size
Calculate for the maximum, minimum, and likely numbers of components.
Calculate size as•{maximum+4*(likely)+minimum}/6
Standard Component Sizing - Advantages and Disadvantages
Advantages•based on relevant historical data•easy to use•requires no special tools or training•provides a rough estimate range
Disadvantages•must use large components early in a project• limited data on large components
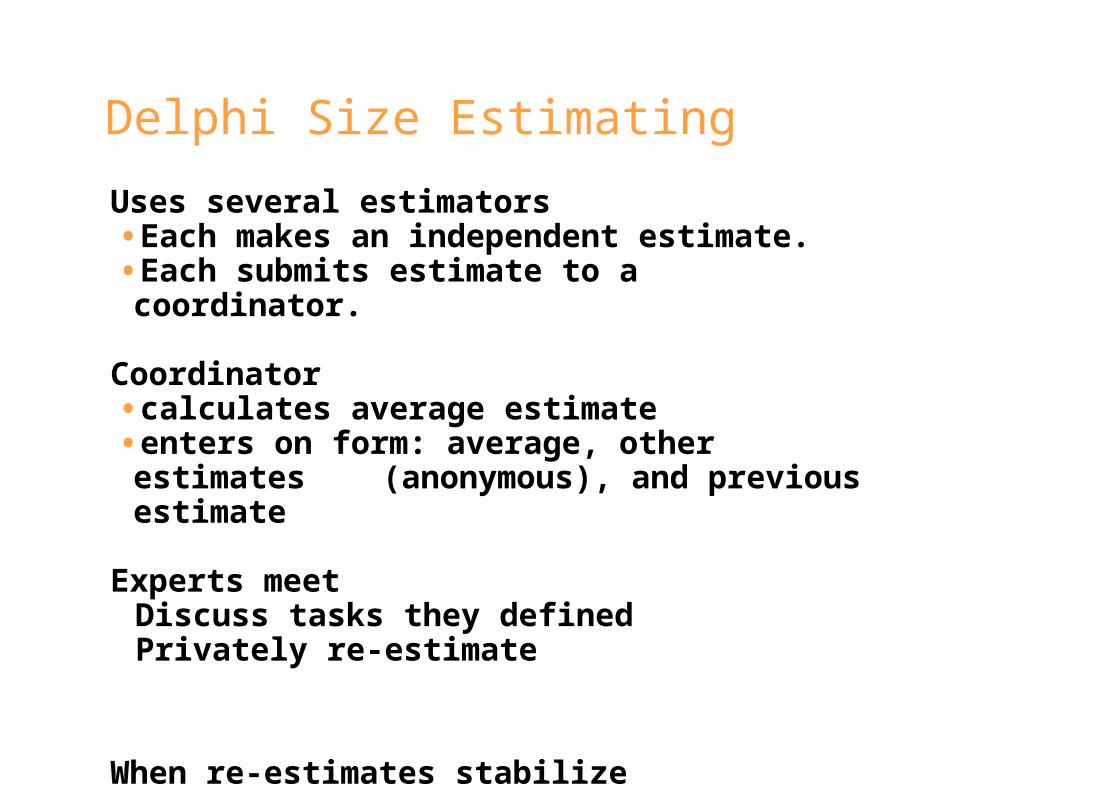
Delphi Size Estimating
Uses several estimators•Each makes an independent estimate.•Each submits estimate to a coordinator.
Coordinator
•calculates average estimate•enters on form: average, other estimates (anonymous), and previous estimate
Experts meet• Discuss tasks they defined• Privately re-estimate
When re-estimates stabilize•average is the estimate•range is range of original estimates
Delphi Size Estimating - Advantages and Disadvantages
Advantages•can produce very accurate results•utilizes organization’s skills•can work for any sized product
Disadvantages•relies on a few experts• is time consuming• is subject to common biases

PROBE - Size Estimating by Proxies
The basic issue•Good size measures are detailed.•Early estimators rarely can think in detail.
Alternatives•Wait to estimate until you have the detail. •Make your best guess.• Identify a suitable proxy.
Size Estimating Proxies - 2
A good proxy should correlate closely to development costs.
A good proxy would be easy to visualize early in development.
It should also be a physical entity that can be counted.
Example Proxies
Function points Objects Product elements
•components•screens, reports, scripts, files•book chapters
Function Points as Proxies -1
Data show that function point counts correlate well with development time.
Function points can be visualized early in development.
To use function points properly, trained estimators are required.

Function Points as Proxies -2
Function points cannot directly be counted.
Conversion factors are available for counting LOC and calculating function points from the LOC value.
The function point users group (IFPUG) is refining the function point method.
Standard Components as Proxies
Component count correlation with development depends on the components.
A lot of development data is required.
Component counts are hard to visualize early in development.
Components are machine countable.

Objects as Proxies -1
Correlation with development hours•Numbers of objects correlate reasonably well.•Object LOC correlate very closely.•Object LOC can be estimated using the standard component estimating method.
•Then calculate LOC estimate from historical relationship between object LOC and program LOC.

Objects as Proxies -2
When objects are selected as application entities, they can be visualized early in development.
Functions and procedures can often be estimated in the same way.
Objects, functions, procedures, and their LOC can be automatically counted.

CostEstimation
ProductivityAssessment
SizeEstimate
Software Cost
Development Time
Phase Distribution
Activity Distribution
Development mode or technology
Project Attributes
Personnel Attributes
Platform Attributes
Product Attributes
Product Spec
Lines of Code
Estimation and Assessment of Effort
Learning - Effort Drivers

The Measurement Process
NumericalRelation System
Empirical
Relation System(Set of softwareapplications)
ab
f(a)f(b)
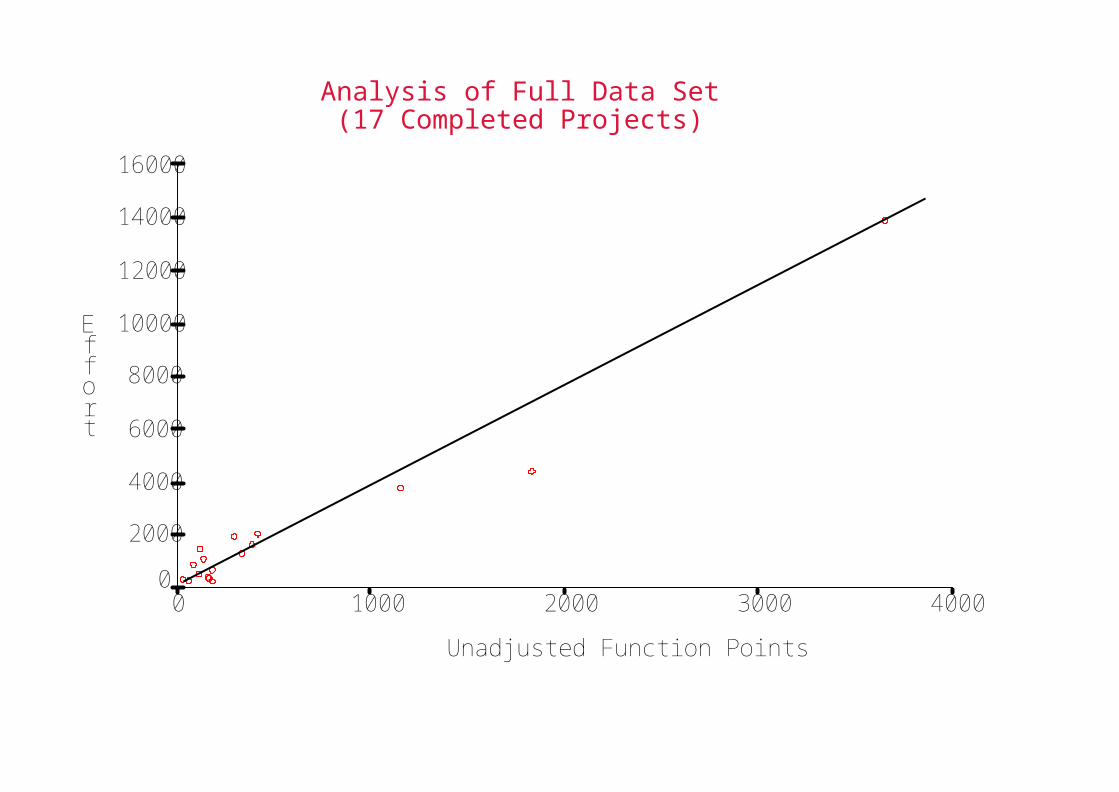
Analysis of Full Data Set(17 Completed Projects)
Unadjusted Function Points
40003000200010000
Effort
16000
14000
12000
10000
8000
6000
4000
2000
0
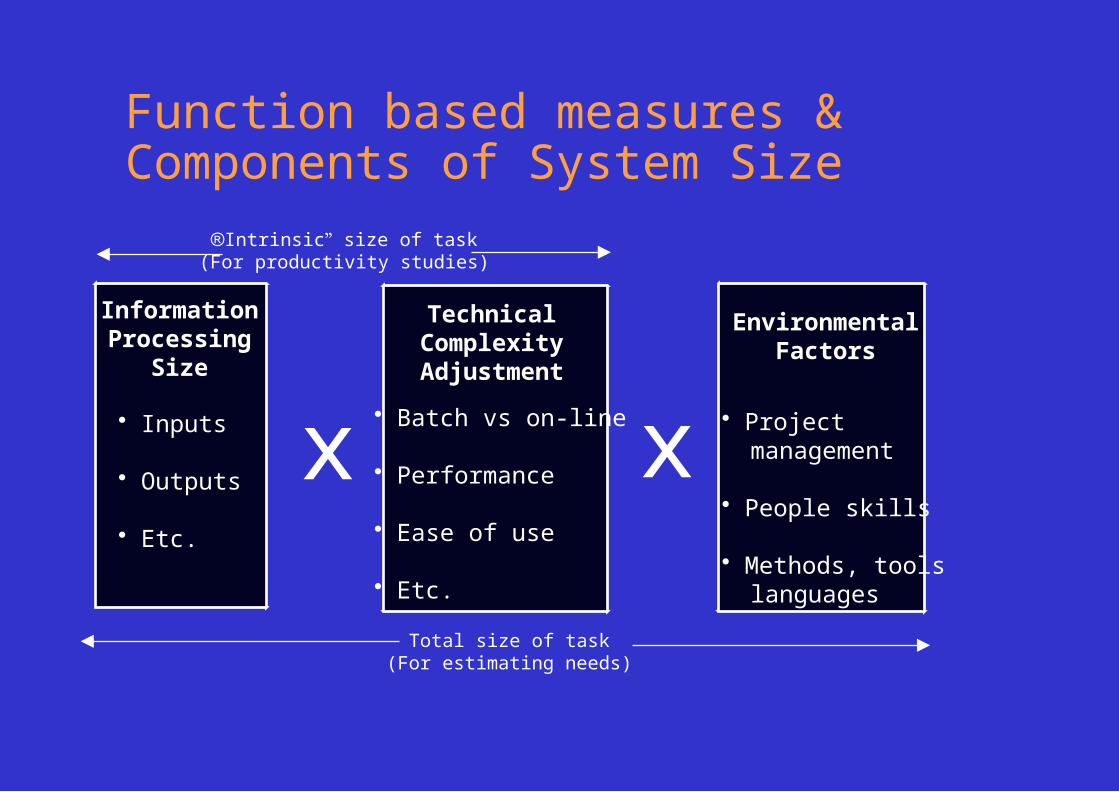
Function based measures &Components of System Size
InformationProcessing
Size
TechnicalComplexityAdjustment
EnvironmentalFactors
Inputs
Outputs
Etc.
Batch vs on-line
Performance
Ease of use
Etc.
Project management
People skills
Methods, tools languages
x x
Intrinsic” size of task(For productivity studies)
Total size of task(For estimating needs)
The PSP Proxy Based MethodPSP uses PROBE method with objects as proxies.The process used is: Set up standard code counting method Divide project into modules or objects Estimate the size of each object by its type using historical
data.Then use
Estimated object LOC and actual development time Calculate correlation (r) between data. Need r2>0.5 Do a regression calculation Est Obj LOC to Development
Hours Calculate prediction interval considering size estimation
error and productivity variations.
Terminology
• You need to apply these not calculate them
• Understand what they are for

What is.... Appendix A Humphrey
•Correlation of Data- You can measure the lines of codes and the time it takes to write them
- If you could estimate the lines of code, can you calculate an estimated time from that data?
-Is LOC and time correlated?-Graph LOC and time and put a line of best fit between the points-The correlation is a measure of how close the numbers pair up, and is related to the sungof the squares minus the square of the sums.
•Regression Coefficent. This straight line has an equationxy
These are the regression coefficients•Prediction Interval is a measure of the likely error of your estimate if it can deviate from the line by one variance in a percentage of cases.

Object LOC Correlation With Development Hours
0
20
40
60
80
100
120
140
160
180
0 200 400 600 800 1000 1200 1400 1600 1800
Object LOC
Ho
urs
Estimation as G Q M
• What are your goals
• What questions does this raise
• What do you measure to get this

What are your Goals, Questions, Measures.•You want to reduce your defects in designIs the Quality Assurance of design metQA must be measurable
•You want to develop a design review processWhat are the Requirements of a design Requirements must be measurable
•You want to improve your estimates of your time to design a systemMake some estimates eg time/product or time/Use Case(input) that you want to reach and see if you can reach themMeasure your rate and compare to actuals
Using Function Point Estimation
You will be using a simple Function Point estimation in Tutorial based on the Function points estimated from the E-R diagram (30 per entity).
When you have completed your Concept Design as the end of this course, you can made a more accurate estimate of the Function Points of the system and update your estimates for the remainder of the Project (post Concept Design).
Include this in Your Plan Review Report.

Tutorials
• What you are doing
• Why you are doing it

Project Management
Project DeliverablesPP02 - establish a measured performance baseline.PP02 - make changes to effort, resource, and duration or re-scheduling plans.PSR - review your practice in change and yield management. Analyse your project management by measurements.
What sort of measures are there for Project management?
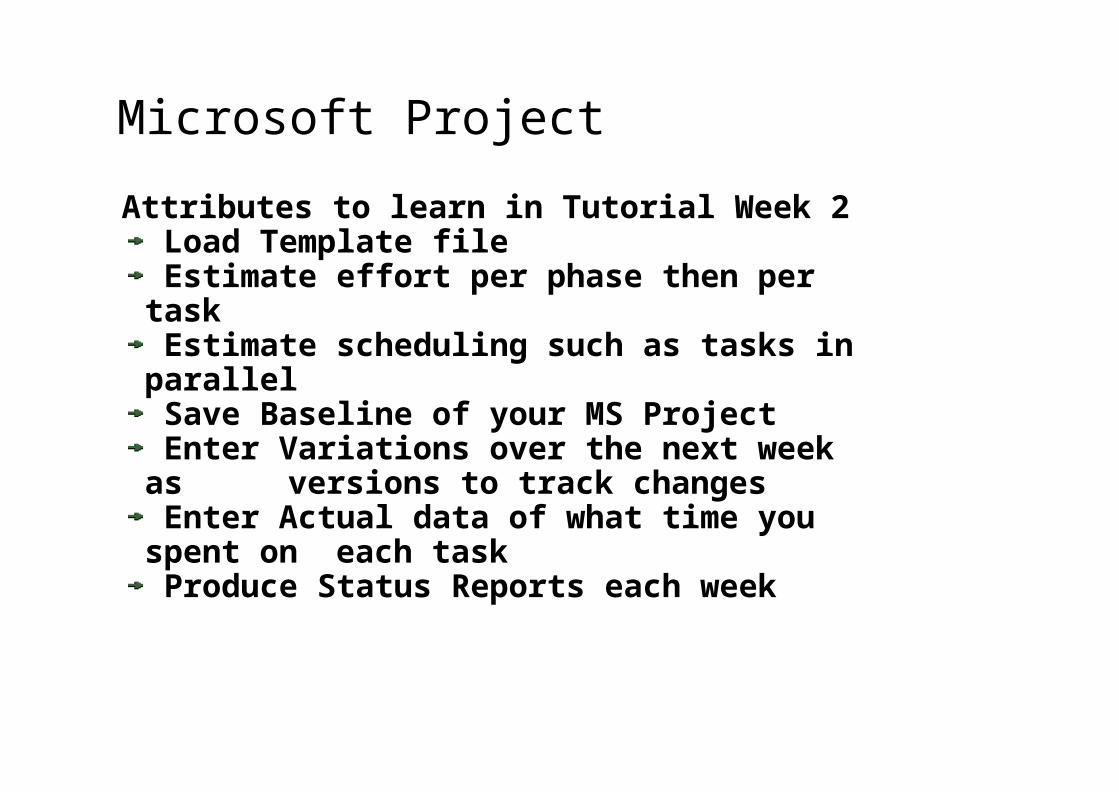
Microsoft Project
Attributes to learn in Tutorial Week 2 Load Template file Estimate effort per phase then per task Estimate scheduling such as tasks in parallel Save Baseline of your MS Project Enter Variations over the next week as versions to track changes Enter Actual data of what time you spent on each task Produce Status Reports each week
Design Process - See Humphrey Ch 10
Design is learningRequirements UncertaintyConceptual DesignDesign Quality must be maintained at all levels
Completeness Accurate Precise

Design Process -2
Design templates Notation compatible with implementation Design should include:
Internal dynamic representation, eg DFDInternal static such as Data TableExternal static eg Interface or inheritance heirarchyExternal dynamic such as Reports and Forms or call return behaviour of methods
Design strategy Start with a critical module and design and implement related elements from that level up or Top down design that starts with top level objects that use lower level abstractions that must be specified then designed.

Design Process -Tutorial - See Yourdon
Requirements Client's List E-R diagrams Use Cases 1&2
Design strategy Top down DFD to level 1 from E-R Expand Data Dictionary to include DFD processes and flows Expand DFD to level 2-3 for Use Cases Design Data Table for DFD Design Interface for Use Cases Verify against Client's List

Design Project Deliverables
PSR03 - to include Quality Assurance Plan PPM - Planning Module DFD, Data Table and Interface
PTM - Tracking Module DFD, Data Table and Interface
PDC01 - Design Change on a given design
Pair Work Guidelines - see paper on web
Use ‘we’ when you discuss the project Share work as the driver and observer
switch on 10 mins or task completion• Stay focused on the task respect your
team mate• Do not be negative, give it a go• Detect defects as you go observer• Do not fight over design debate
differences• Share the work space and the contributions• Review any individual work between
tutorials• Have regular planned breaks time them
Quality Assurance
• This is set by SIP
• You have to satisfy it in your designs
• You have to plan how you will check you are satisfying it
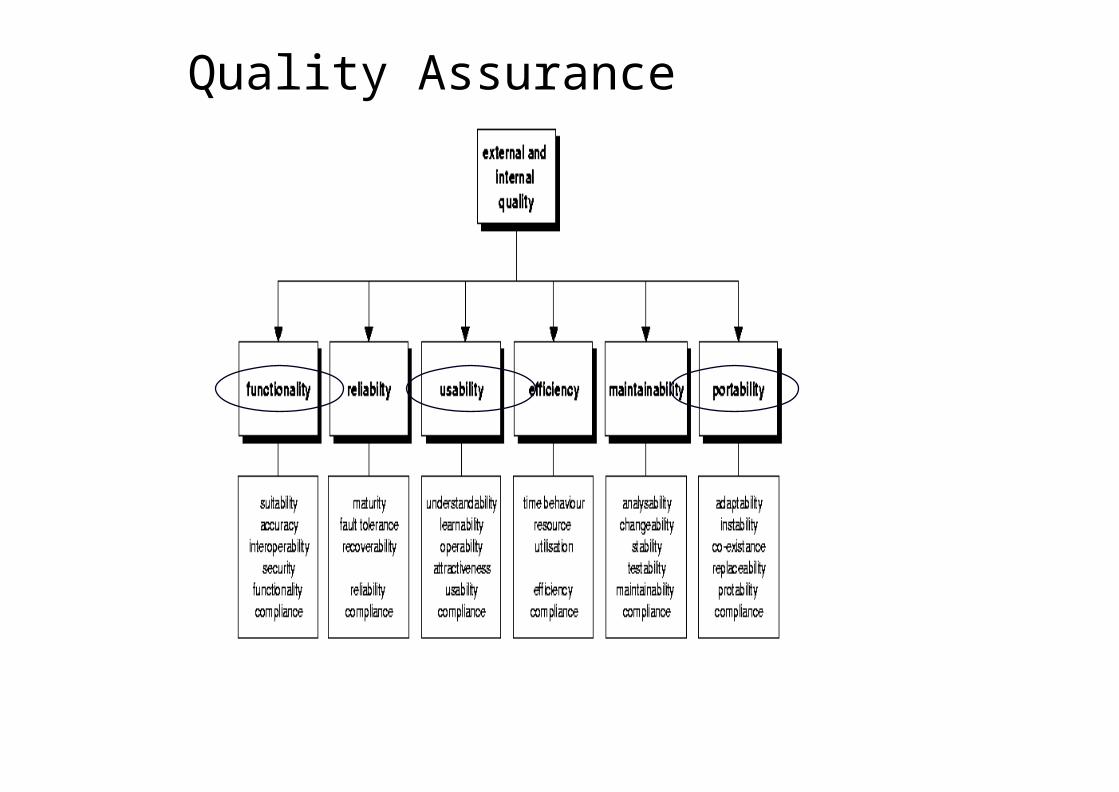
Quality Assurance

QA for Project
Metrics for sub characteristics will be given
Your role is to evaluate the metrics of your particular design
The metrics may apply to only one part of the design or all of your design•Eg Suitability is a functionality sub-metric that applies to the completeness of your design products as a how.