personal genome sequencing with complete genomics technology · process yielded diploid reference,...
TRANSCRIPT

Personal Genome Sequencing with Complete Genomics
Technology
Maido Remm
11th Oct 2010

1. Describing the “Complete Genomics” technologyDrmanac et al., Science 1 January 2010: Vol. 327. no. 5961, pp. 78 - 81
Human Genome Sequencing Using Unchained Base Reads on Self-Assembling DNA Nanoarrays
http://www.sciencemag.org/cgi/content/abstract/327/5961/78
2. Sequencing of one family with 2 parents and 2 childrenRoach et al., Science 30 April 2010: Vol. 328. no. 5978, pp. 636 - 639
Analysis of Genetic Inheritance in a Family Quartet by Whole-Genome Sequencing
http://www.sciencemag.org/cgi/content/abstract/328/5978/636
3. Sequencing of 2 tissues (lung cancer and adjacent normal lung tissue) from the same individual
Lee et al., Nature. 2010 May 27;465(7297):473-7.
The mutation spectrum revealed by paired genome sequences from a lung cancer patient
http://www.nature.com/nature/journal/v465/n7297/full/nature09004.html
Three related papers

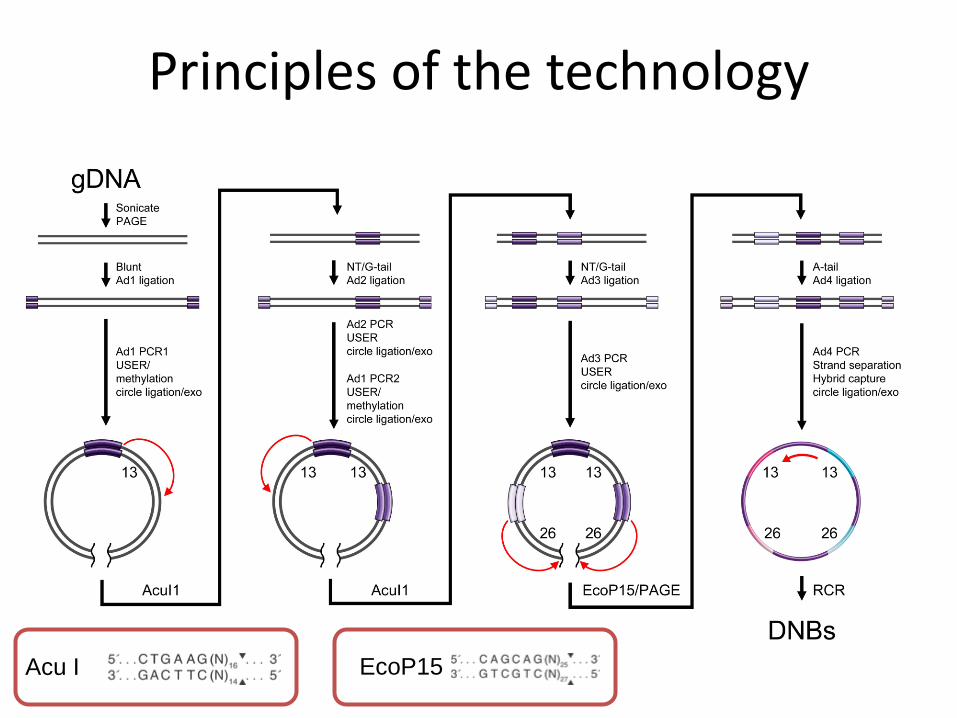
Fragmentation of the genome. We generated sequencing substrates by means of genomic DNA (gDNA) fragmentation and recursive cutting with type IIS restriction enzymes (AcuI and EcoP15) and directional adapter insertion.
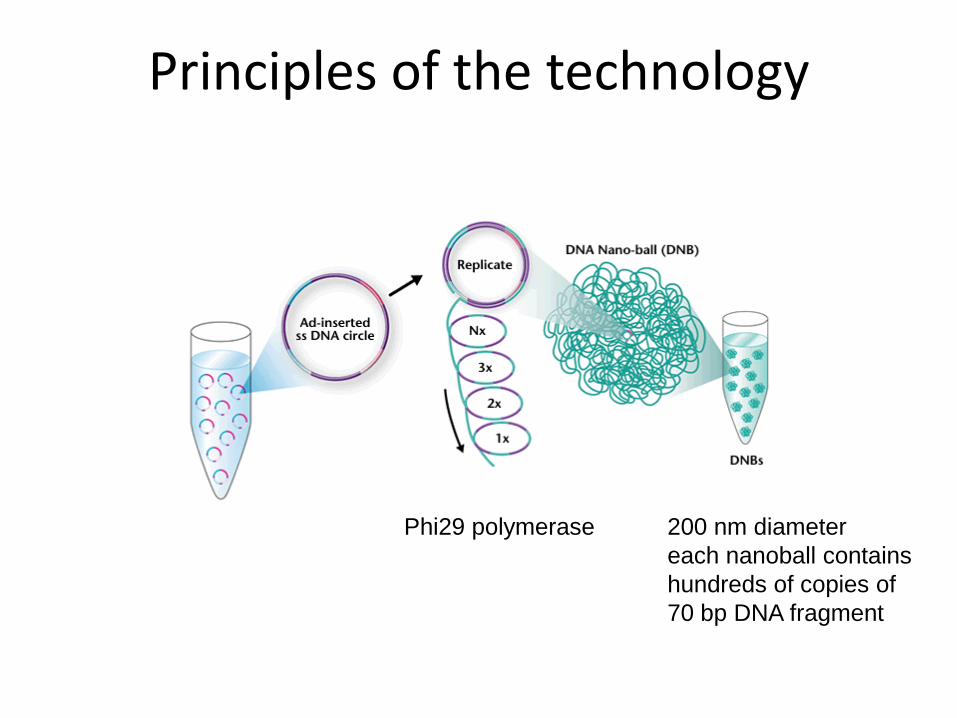
Amplification of fragments. The resulting circles were then replicated with Phi29 polymerase. Using a controlled, synchronized synthesis, we obtained hundreds of tandem copies of the sequencing substrate in palindrome-promoted coils of single-stranded DNA, referred to as DNA nanoballs (DNBs).
Attachment of fragments. DNBs were adsorbed onto photo-lithographically etched, surface- modified 25- by 75-mm silicon substrates with grid-patterned arrays of ~300-nm spots for DNB binding.
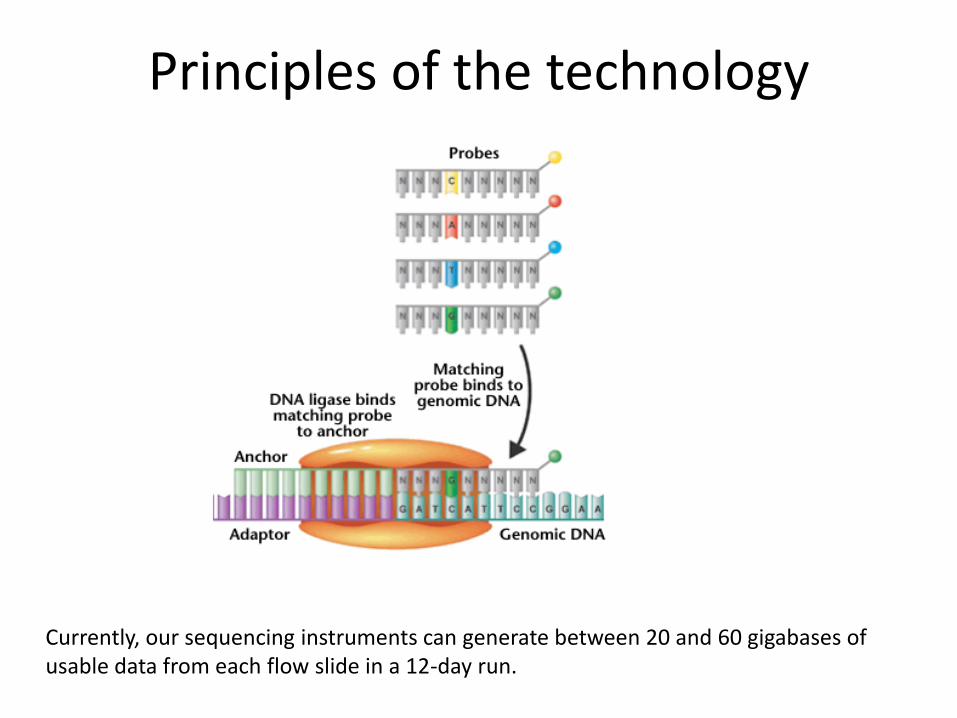
Sequencing by ligation. High- accuracy combinatorial probe anchor ligation (cPAL) sequencing chemistry was then used to independently read up to 10 bases adjacent to each of eight anchor sites, resulting in a total of 31- to 35-base mate-paired reads (62 to 70 bases per DNB).
Principles of the technology

Principles of the technology

Initial idea of polony (polymerasecolony) sequencing was developed
by George Church• Accurate Multiplex Polony Sequencing of an Evolved Bacterial Genome• Jay Shendure, Gregory J. Porreca, Nikos B. Reppas, Xiaoxia Lin, John P. McCutcheon, Abraham M.
Rosenbaum, Michael D. Wang, Kun Zhang, Robi D. Mitra, George M. Church
9 SEPTEMBER 2005 VOL 309 SCIENCEhttp://www.sciencemag.org/cgi/reprint/309/5741/1728.pdf
Principles of the technology
Acu I EcoP15
Principles of the technology
Phi29 polymerase 200 nm diameter
each nanoball contains
hundreds of copies of
70 bp DNA fragment

Principles of the technology
Spots 300 nm diameter
2.8 billion spots per slide
Principles of the technology
Spots 300 nm diameter
2.8 billion spots per slide
Currently, our sequencing instruments can generate between 20 and 60 gigabases of usable data from each flow slide in a 12-day run.

Principles of the technology
Our patterned arrays include high-occupancy and high-density nanoarrays self-assembled on photolithography-patterned, solid-phase substrates through electrostatic adsorption of solution-phase DNBs and yield a high proportion of informative pixels (site occupancies >95%) compared with random-position DNA arrays.
Figure S12: Composite 4‐color image of a scanned array showing high occupancy of patterned array positions.
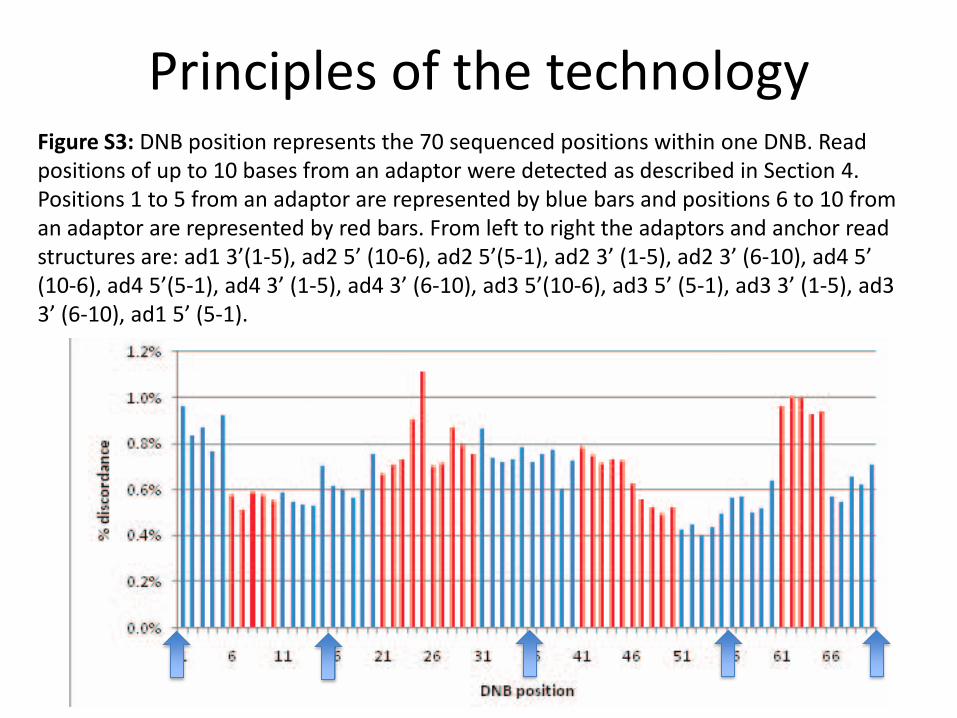
Principles of the technologyFigure S3: DNB position represents the 70 sequenced positions within one DNB. Read positions of up to 10 bases from an adaptor were detected as described in Section 4. Positions 1 to 5 from an adaptor are represented by blue bars and positions 6 to 10 from an adaptor are represented by red bars. From left to right the adaptors and anchor read structures are: ad1 3’(1‐5), ad2 5’ (10‐6), ad2 5’(5‐1), ad2 3’ (1‐5), ad2 3’ (6‐10), ad4 5’ (10‐6), ad4 5’(5‐1), ad4 3’ (1‐5), ad4 3’ (6‐10), ad3 5’(10‐6), ad3 5’ (5‐1), ad3 3’ (1‐5), ad3 3’ (6‐10), ad1 5’ (5‐1).

Testing the technology
Cell lines derived from two individuals previously characterized by the HapMap Project, a Caucasian male of European descent (NA07022) and a Yoruban female (NA19240), were sequenced. NA19240 was selected to allow for a comparison of our sequence to the sequence of the same genome currently being assembled by the 1000 Genome Project. In addition, lymphoblast DNA from a Personal Genome ProjectCaucasian male sample, PGP1 (NA20431) was sequenced because substantial data are available for biological comparisons (35–37).

Mapping the reads
We mapped these sequence reads to the human genome reference assembly with a custom alignment algorithm that accommodates our read structure (fig. S4), resulting in between 124 and 241 Gb mapped and an overall genome coverage of 45- to 87-fold per genome.
(6) ILLUMINA/SOLEXA(9) ABI SOLID(3) SANGER(4) ROCHE/454

AssemblyMapped reads were assembled into a best-fit, diploid sequence with a custom software suite employing both Bayesian and de Bruijn graph techniques (SOM). This process yielded diploid reference, variant, or no-calls at each genomic location with associated variant quality scores.Confident diploid calls were made for 86% to 95% of the reference genome (Table 1), approaching the 98% that can be reconstructed in simulations. The 2% that is not reconstructed in simulations is composed of repeats that are longer than the ~400 base inserts used here and of high enough identity to prevent attribution of mappings to specific repeat copies. Longer mate-pair inserts minimize this limitation (6, 9). Similar limitations affect other short-read technologies.

Coverage bias
To assess representational biases during circle construction, we assayed genomic DNA and intermediate steps in the library construction process by quantitative polymerase chain reaction (QPCR) (fig. S2). This and mapped coverage showed a substantial deviation from Poisson expectation with excesses of both high and low coverage regions (fig. S5), but only a few percent of bases have coverage insufficient for assembly (Table 1).

Coverage bias
Much of this coverage bias is accounted for by local GC content in NA07022, a bias that was significantly reduced by improved adapter ligation and PCR conditions in NA19240; the fraction of the genome with less than 15-fold coverage was accordingly reduced from 11% in NA07022 to 6.4% in NA19240, despite the latter having 25% less total coverage (Table 1).

Coverage bias
Much of this coverage bias is accounted for by local GC content in NA07022, a bias that was significantly reduced by improved adapter ligation and PCR conditions in NA19240 (fig. S5); the fraction of the genome with less than 15-fold coverage was accordingly reduced from 11% in NA07022 to 6.4% in NA19240, despite the latter having 25% less total coverage (Table 1).

Table S7: Concordance with genotypes generated by the HapMap Project (release 24) and the highest quality Infinium assay subset of the HapMap genotypes or from genotyping on Affy 500k (genotypes were assayed in duplicate, only SNPs with identical calls are considered).
Concordance with microarray data

Table S8: Sanger sequencing of variants in NA07022. Non‐HapMap variation call accuracy was assessed for 291 loci with Sanger sequencing on a random subset of variants that were novel (with respect to dbSNP build 129) non‐synonymous (with respect to the NM_* set of NCBI Build 36.3 annotated transcripts; all indels are treated as non‐synonymous changes irrespective of frame change) heterozygous and homozygous (not hemizygous, of unknown zygosity, or part of more complex events). This category of variants is enriched for errors, thus error rates can be extrapolated from a modest amount of targeted sequencing. The extrapolation of errors assumes that error modes are similar within coding sequence and genome‐wide as indicated by similar variant quality score distributions. A 95% confidence interval was computed for the resulting novel non‐synonymous false discovery rate (FDR), and projected onto the entire set of variants as described above (SOM text). The testing of additional non‐coding variants would increase accuracy of the genome‐wide FDR estimates.
Validation of detected changes

Figure S8: Some applications of complete genome sequencing may benefit from maximal discovery rates, even at the cost of additional false positives, whereas for others, a lower discovery rate and lower false-positive rate may be preferable. We used the variant quality score to tune call rate and accuracy (fig. S8).
Validation of detected changes

Figure S7: Aberrant mate-pair gaps may indicate the presence of length-altering structural variants and rearrangements with respect to the reference genome. A total of 2,126 clusters of such anomalous mate-pairs were identified in NA07022.More than half of the clusters are consistent in size with the addition or deletion of a single Alu repeat element. We performed PCR-based confirmation of one such heterozygous 1500-base deletion (fig. S7).
Detection of long deletions

Both sequencing by synthesis (SBS) and sequencing by ligation (SBL) use chained reads, wherein the substrate for cycle N + 1 is dependent on the product of cycle N; consequently, errors may accumulate over multiple cycles and data quality may be affected by errors (especiallyincomplete extensions) occurring in previous cycles.
Thus, [in other technologies] reactions need to be driven to near completion with high concentrations of expensive high-purity labeled substrate molecules and enzymes.
The independent, unchained nature of cPAL avoids error accumulation and tolerates low-quality bases in otherwise high quality reads, thereby decreasing reagent costs. The average sequencing consumables cost for these three genomes was under $4400 (table S5). The raw base and variant call accuracy achieved compares favorably with other reported humangenome sequences (2–12).
Advantages: independent reading of bases

Table S5: Historical human genome sequencing costs that have improved after these genomes (including this work) were sequenced. JDW costs may include more than consumable costs. Our costs were calculated from the amount and purchase prices of reagents (including labware and sequencing substrates) used in generating all raw reads resulting in the reported number of mapped reads.
Advantages: cost of genome sequencing

Figure S10: Schematic of six‐adaptor read structure that increases read length from 70 to 104 bases per DNB. Each arm of the DNB has two inserted adaptors (Ad2+Ad3 and Ad4+Ad5) that support assaying 13+13+26 bases per arm. All inserted adaptors (Ad2‐Ad5, in the order of insertion) are introduced with the same IIS enzyme (e.g. AcuI. The alternative use of MmeI increases the number of assayable bases per arm to 18+18+26 or per DNB to 124) with the following steps recursively on an automated instrument: IIS cutting of DNA circles, directional adaptor ligation, PCR, USER digestion, selective methylation, and DNA circularization. The reaction time per adaptor can be as low as 10 hr per batch of 96 libraries in an automated system, yielding sufficient throughput to support multiple advanced sequencing instruments. Each directionally inserted adaptor substantially extends the read length of SBS or SBL in addition to cPAL.
Advantages: read lengths extendable to 124 bp
Current technology: 35+35 bp

Figure S4: The iterative adaptor insertion and sequencing strategy yields 8 distinct blocks of contiguous genomic reads. Four blocks comprise each arm of a mate pair. The spacing of the blocks is governed by read lengths and the distances between the restriction endonuclease recognition sites and cut sites. While each enzyme used has a preferred cut distance, digestion is seen at lengths slightly greater and lesser (generally +/‐1 of the preferred distance; ~1% of observations outside this range). Rare gaps between r2‐r3 and r6‐r7 are presumably created by AcuI double cutting (e.g. first cut at base 13 and second cut at base 12), as these gaps correlate with rare ‐3 gaps between r1‐r2 and r7‐r8. The exact length distribution for each library is determined by aligning a sample of reads to reference with permissive mapping settings, and examining only high‐quality hits. These distributions are then used as parameters to guide mapping of the bulk of the data, to reduce both computational cost and frequency of spurious alignments, as well as to indicate likelihood of a DNB deriving from a hypothesized sequence.
DisAdvantages: unknown gap length within reads???

DisAdvantages: unknown gap length within reads???

DisAdvantages: unknown gap length within reads???

Data storage and handling
High-Performance Computing InfrastructureWe have built a genomics data processing facility that consists of approximately 5,000 core processors and 1,500 terabytes of high-speed disk storage. Our sequencing instruments are connected to our data center by a fiber-optic network connection that transfers data at a rate of 30 gigabits per second.
Service Delivery TechnologyOur cloud-based data delivery system is based on our partnership with Amazon Web Services (AWS). We upload our customers’ finished genomic data to AWS. Our customers can then either (1) download the genomic data from AWS onto their computers, have AWS copy their data to hard disks and ship them the hard disks or (2) pay AWS to store their data on an ongoing basis. As we develop our analysis tools, we plan to host them on AWS so that customers can rapidly analyze their genomic data as soon as it is available. We are also developing a web-based customer portal to enable customers to track their projects real-time throughout the sequencing process.

Data storage and handling
Analysis ToolsWe are developing a suite of analysis tools that will enable our customers to rapidly analyze the data we generate from their samples. Examples of analysis tools under development include a tumor-normal comparison tool that will allow cancer researchers to compare a cancer genome to the normal genome from which it was derived, a family analysis tool that will enable researchers to compare parental genomes with the genomes of their children, and a large-scale genome browser that will allow researchers to compare the hundreds of genomes sequenced in a large-scale study.
Data formatsWell described at http://media.completegenomics.com/documents/DataFileFormats+190.pdf

Genome Sequencing Service• 40X average coverage and ~120 Gigabases (GB) of mapped reads per sample
• Highly-accurate sequence variant detection on both alleles (SNPs and small Indels) on over 90% of the genome
• Main deliverable: Sequence variants (SNPs and small indels), functional annotations and data summary reports
• Other deliverables: Full set of supporting data for these results (reads, scores and mappings)
• Data delivery follows within approximately three to four months after sample quality is confirmed (actual timelines for data delivery can vary based on the number of genomes in a project)

Genome Sequencing Service