perkiomen creek headwaters · 3 perkiomen creek headwaters - act 167 – stormwater management plan...
TRANSCRIPT

1
PERKIOMEN CREEK HEADWATERS
ACT 167 –-
STORMWATER MANAGEMENT PLAN
October 2009
Lehigh Valley Planning Commission

2

3
PERKIOMEN CREEK HEADWATERS
ACT 167 –-
STORMWATER MANAGEMENT PLAN
This is the text prepared by the Lehigh Valley Planning Commission (LVPC) staff on behalf of Lehigh County. It contains revisions, as necessary, based on comments received from the Perkiomen Creek Headwaters Watershed Plan Advisory Committee, the municipalities within the watershed, the LVPC, the general public, Lehigh County and the Department of Environmental Protection.
The preparation of this report was financed through the Pennsylvania Stormwater Management Grant Assistance Program administered by the Department of Environmental Protection. This grant program provides for seventy-five percent (75%) State funding with a twenty-five percent (25%) local match provided by Lehigh County.
Final Plan October 2009Adopted by Lehigh County January 27, 2010
Approved by DEP June 22, 2010
4
LEHIGH VALLEY PLANNING COMMISSION
Terry J. Lee, Chair Steven L. Glickman, Vice Chair
Robert A. Lammi, Treasurer Ron Angle Norman E. Blatt, Jr., Esq. Becky Bradley (Alternate) John B. Callahan Bruce Cameron Donald Cunningham Michael D. D’Amore John N. Diacogiannis Percy H. Dougherty Liesel Dreisbach Cindy Feinberg (Alternate) Charles L. Fraust George F. Gemmel Matthew Glennon Armand V. Greco Michael C. Hefele (Alternate) Darlene Heller (Alternate) Kent Herman Nils Hovik
Benjamin F. Howells, Jr. Edward Hozza, Jr. William Leiner, Jr. Ronald W. Lutes Earl B. Lynn Ross Marcus (Alternate) Joyce K. Marin Thomas J. Nolan Salvatore J. Panto, Jr. Edward Pawlowski Stephen Repasch Michael Reph Ronald E. Stahley John Stoffa Glenn M. Taggart Andrew Twiggar Sandra Vulcano Donna Wright Deana Zosky
LEHIGH VALLEY PLANNING COMMISSION STAFF
Michael N. Kaiser, AICP Executive Director ** Geoffrey A. Reese, P.E. Assistant Director Olev Taremäe, AICP Chief Planner Joseph L. Gurinko, AICP Chief Transportation Planner Thomas K. Edinger, AICP GIS Manager * Lynette E. Romig Senior GIS Analyst * Susan L. Rockwell Senior Environmental Planner Michael S. Donchez Senior Transportation Planner David P. Berryman Senior Planner Teresa Mackey Senior Planner David J. Totten, MPA Senior Planner * Travis I. Bartholomew, EIT Stormwater Planner * Cara N. PurcellI Wilmer R. Hunsicker, Jr. Senior Planning Technician Bonnie D. Sankovsky GIS Technician Anne L. Esser, MBA Administrative Assistant * Alice J. Lipe Planning Technician Kathleen M. Sauerzopf Secretary
**Project Planner
*Staff for this report INo Longer on staff
ENGINEERING CONSULTANTS
David Kibler, Ph.D., P.E. Allen R. O’Dell, P.E.
October 2009

i
TABLE OF CONTENTS
Page
List of Tables ...................................................................................................................................iv
List of Figures ..................................................................................................................................v
Chapter
1. Introduction ................................................................................................................1-1
2. Study Area Characteristics and Hydrologic Response ...............................................2-1 A. General Characteristics .....................................................................................2-1 B. Hydrologic Response ........................................................................................2-4
3. Perkiomen Creek Headwaters Land Development and Runoff Impacts....................3-1 A. General Land Development Impacts on Storm Runoff .....................................3-1 B. Historical Perkiomen Creek Headwaters Development ....................................3-5 C. Future Perkiomen Creek Headwaters Development .........................................3-9
4. Perkiomen Creek Headwaters Floodplain Information .............................................4-1 A. Floodplain Delineation ......................................................................................4-1 B. Detailed Versus Non-Detailed Floodplain Delineation by Stream Segment .............................................................................................................4-1 C. Existing and Future Floodplain Development ..................................................4-3
5. Perkiomen Creek Headwaters Existing Storm Drainage Problem Areas and Significant Obstructions ......................................................................................5-1 A. Existing Storm Drainage Problem Areas ..........................................................5-1 B. Significant Obstructions ....................................................................................5-1 6. Stormwater Runoff Control Techniques ....................................................................6-1 A. Volume Controls ...............................................................................................6-2 1. Pervious Pavement ...................................................................................6-2 2. Infiltration Basin ......................................................................................6-4 3. Subsurface Infiltration Bed, Infiltration Trench, and Dry Well/Seepage Pit ......................................................................................6-5 4. Rain Garden or Bioretention ....................................................................6-6 5. Vegetated Roofs .......................................................................................6-7 6. Landscape Restoration .............................................................................6-9 7. Soil Amendment and Restoration ..........................................................6-10 8. Runoff Capture and Re-use ....................................................................6-11 9. Vegetated Swales, Vegetated Filter Strips, and Seepage Areas ..............6-12
ii
TABLE OF CONTENTS (cont’d)
Chapter Page
6. (cont’d)
B. Rate Controls ..................................................................................................6-14 1. Detention Basins ....................................................................................6-14 2. Parking Lot and Roof Detention ............................................................6-16 3. Constructed Wetlands .............................................................................6-17
C. Water Quality Treatment Controls ..................................................................6-18 1. Constructed Filter ...................................................................................6-18 2. Water Quality Inlets and Hydrodynamic Devices ..................................6-20 3. Riparian Buffer Restoration ...................................................................6-21 4. Floodplain Restoration ...........................................................................6-22 D. Nonstructural Stormwater Management Techniques ......................................6-23 1. Protect Sensitive/Special Value Resources ............................................6-23 2. Protect/Conserve/Enhance Riparian Areas ............................................6-24 3. Protect/Utilize Natural Flow Pathways ..................................................6-25 4. Clustering Development ........................................................................6-26 5. Concentrate Uses Area Wide Through Smart Growth Practices ............6-26 6. Minimize Total Disturbed Area – Grading ............................................6-27 7. Minimize Soil Compaction in Disturbed Areas .....................................6-28 8. Re-vegetate and Re-forest Disturbed Areas with Native Species ..........6-29 9. Reduce Street and Parking Imperviousness ...........................................6-29 10. Disconnection of Impervious Areas from Storm Sewers .......................6-30 11. Streetsweeping .......................................................................................6-30
7. Review of Stormwater Collection Systems and Their Impacts..................................7-1
A. Existing Stormwater Collection Systems and Their Impacts ............................7-1 B. Future Stormwater Collection Systems ............................................................7-1 C. Existing and Proposed Flood Control Projects .................................................7-2
8. Watershed-Level Runoff Control Philosophy and Performance Standards for the Control of Stormwater Runoff from New Development ................................8-1
A. Existing Water Balance Preservation Philosophy .............................................8-1 1. Determining the Water Quality Volume ...................................................8-1 2. Determining the Existing Water Balance .................................................8-3
B. Watershed-Level Runoff Control Philosophy ...................................................8-9 1. Watersheds Modeled using HEC-HMS ...................................................8-9 a. Release Rate Concept ...................................................................8-14

iii
TABLE OF CONTENTS (cont’d)
Chapter Page
8. (cont’d)
b. Runoff Control Strategy Categorization .......................................8-17 c. Point of Interest Selection .............................................................8-26 d. Return Periods to be Controlled ....................................................8-28
C. Performance Standards ...................................................................................8-30 1. Description of Performance Standard Districts .....................................8-30 2. Performance Standard Implementation Provisions ................................8-30 a. “New Development” Subject to the Performance Standards ........8-31 b. Storm Runoff Calculation Methodology.......................................8-31 c. Regional Detention Alternatives ...................................................8-32
9. Municipal Ordinance to Implement the Perkiomen Creek Headwaters Stormwater Management Plan ...................................................................................9-1
10. Priorities for Implementation of the Plan .................................................................10-1 A. DEP Approval of the Plan ...............................................................................10-1 B. Publishing the Plan .........................................................................................10-1 C. Development of a Local Program to Coordinate with DEP Regarding Chapter 105 and Chapter 106 Permit Application Reviews............................10-2 D. Municipal Adoption of Ordinance Provisions to Implement the Plan ............10-2 E. Development of a Systematic Approach for Correction of Existing Storm Drainage Problem Areas ......................................................................10-2
11. Plan Review, Adoption, and Updating Procedures ..................................................11-1 A. Plan Review and Adoption ..............................................................................11-1 B. Procedure for Updating the Plan .....................................................................11-2
Plate 1 Perkiomen Creek Headwaters Release Rate Map ................................... following 11-4
Engineer and Solicitor Certifications .................................................................... following Plate 1

iv
LIST OF TABLES
Table Page
1 Perkiomen Creek Headwaters Watershed Plan Advisory Committee ........................1-4
2 Perkiomen Creek Headwaters Square Mileage ..........................................................2-1
3 Peak Flow Estimates by Various Techniques at the Bottom of the Hosensack Creek Study Area .....................................................................................2-8
4 Calibrated HEC-HMS Hosensack Creek Values Versus LP3 and FIS Flow Targets .............................................................................................................2-10
5 Calibrated HEC-HMS Peak Flow Values for Remaining Drainage Areas in Perkiomen Creek Headwaters ..............................................................................2-12
6 “Typical” Percent Imperviousness by Land Use ........................................................3-1
7 Runoff Curve Numbers by Land Use Category .........................................................3-4
8 Perkiomen Creek Headwaters Study Area Historical Land Development ................3-5
9 Perkiomen Creek Headwaters Study Area Projected Land Development 2008-2018 ..........................................................................................3-10
10 Perkiomen Creek Headwaters Storm Drainage Problem Areas .................................5-3
11 Perkiomen Creek Headwaters Significant Obstructions ............................................5-7
12 Minimum Municipal Ordinance Requirements .........................................................9-3

v
LIST OF FIGURES
Figure Page
1 Perkiomen Creek Headwaters Study Area Location Map .........................................2-2
2 Perkiomen Creek Headwaters Subwatersheds ...........................................................2-3
3 Perkiomen Creek Headwaters Geology .....................................................................2-5
4 Perkiomen Creek Headwaters Hydrologic Soil Groups ............................................2-6
5 Hosensack Creek Flood Frequency at Lehigh County Boundary from Calibrated HEC-HMS and Log-Pearson 3 Correlation ...........................................2-11
6 Impact of Impervious Cover on Storm Runoff ..........................................................3-3
7 Perkiomen Creek Headwaters Existing Land Use .....................................................3-7
8 Perkiomen Creek Headwaters Future Land Use ......................................................3-12
9 Perkiomen Creek Headwaters Floodplain Mapping ..................................................4-2
10 Perkiomen Creek Headwaters Storm Drainage Problem Area Map ..........................5-2
11 Perkiomen Creek Headwaters Significant Obstructions ............................................5-6
12 Percent Annual Rainfall versus Rainfall Capture Depth ............................................8-4
13 Percent Direct Recharge (D-RE) per Fraction Impervious versus Storage ...............8-8
14 Typical “At-Site” Runoff Control Philosophy .........................................................8-11
15 Existing Runoff Condition – Pre-development ........................................................8-12
16 “Controlled” Runoff Condition – Post-development ...............................................8-13
17 “Point of Interest” Hydrograph Analysis Example ..................................................8-15
18 Hydrograph Analysis for Example Subarea 4 ..........................................................8-16
19 Release Rate Runoff Control for Example Subarea 4 ..............................................8-18
20 Case I Analysis Category and Runoff Control Strategy ...........................................8-20
21 Case II Analysis Category and Runoff Control Strategy .........................................8-22

vi
LIST OF FIGURES (cont’d)
Figure Page
22 Case III Analysis Category and Runoff Control Strategy ........................................8-23
23 Case IV Analysis Category and Runoff Control Strategy ........................................8-24
24 Case V Analysis Category and Runoff Control Strategy .........................................8-25

1-1
CHAPTER 1. INTRODUCTION
The Pennsylvania Stormwater Management Act of 1978, Act 167, provides the framework for the improved management of the storm runoff impacts associated with the development of land by encouraging the sound planning management of storm runoff, coordinating the stormwater management efforts within each watershed, and encouraging the local adminis-tration and management of a coordinated stormwater program. Until now, stormwater man-agement decisions have been made at the municipal level through enforcement of local or-dinances based upon whatever runoff control philosophy the municipality opted to use. For the Perkiomen Creek Headwaters, four Lehigh County municipalities have a stake in how stormwater runoff is managed in the watershed. Without an effort to coordinate their efforts through watershed analyses, the four municipalities would establish a fragmented system of stormwater management based on municipal boundaries with uncertain results. At best, the fragmented system results in an inefficient process of runoff control management, whereby conservative engineering design would dictate “over-control” of runoff. At worst, the frag-mented approach could result in the creation of additional storm drainage problems and as-sociated costs and hazards, which could occur even though all of the municipalities are dili-gently administering and enforcing their ordinances. The existing ordinances do not require any analysis of impacts beyond municipal boundaries, and a watershed-wide data base has not been available to quantify downstream impacts.
The difference between an at-site runoff control philosophy and the Act 167 watershed-level philosophy is the consideration of downstream impacts. Whereas the objective of typical at-site design would be to control the post-development peak rate of runoff to the pre-de-velopment peak rate for a given storm event, a watershed-level design would be focused on maintaining the peak rate of the entire watershed. The watershed-level design assumes that runoff volume will increase with development for the highest intensity events, and requires an analysis of how each site relates to the watershed in terms of the timing of the peak flow, the contribution of peak flows at various downstream locations, and the impact of the additional runoff volume generated by development. The plan is intended to “manage” the increase in runoff volume such that the peak rates throughout the watershed are not increased.
On a watershed-level, Act 167 stormwater management will provide a significant step for-ward in the sound management of the storm runoff impacts of new development. The storm runoff control strategy established by an Act 167 plan provides for new development to oc-cur, while ensuring that existing drainage problems are not aggravated and that new drainage problems are not created. However, the storm runoff control strategy will not eliminate exist-ing problem areas, nor will it prevent flooding. To effectively implement an Act 167 program, it is necessary to understand the following strengths and limitations:
• AnAct167planisnotanengineeringdesigndocument,butitprovidesanengineer-ing framework for individual site evaluation and design.
• Stormrunoffcriteriaarebasedoncontrolling“design”stormeventsapplieduniform-ly over the entire watershed. Natural storms, which may vary in duration, intensity, and total depth of rainfall throughout the watershed, may create runoff events which cannot be effectively controlled.
1-2
• TherunoffcontrolcriteriadevelopedaspartofanAct167planwillnotcorrectexist-ing drainage problems.
• AnAct167planwillnotpreventtheinundationoffloodplainareas.Theseareasareintended to carry storm runoff by nature.
It is also important to understand that an Act 167 plan is not a land use plan. Although some control techniques discussed in Chapter 6 deal with controlling runoff through creative land use practices, runoff controls developed in this plan are not based upon controlling the loca-tion, type, density, or rate of development in the watershed. The performance standards are based on the assumption that development will occur.
The most important aspect of an Act 167 plan is that it establishes a process for decision-making. It defines the existing relationships between the various parts of a watershed in terms of the “timing” of peak flows from multiple sources, which provides for the development of the watershed-wide runoff control philosophy for controlling runoff impacts.
Act 167 is essentially a three-step process of runoff control which proceeds as follows:
1. Documentation of the existing state of stormwater runoff in the watershed. This in-cludes the documentation of existing physical characteristics of the watershed (e.g. land use, soils, slopes, storm sewers, etc.), existing storm drainage problems, and the peak flow and timing relationships. The existing condition establishes the baseline against which all runoff control measures will be judged.
2. Preparation of the plan to control stormwater runoff from new development. The plan includes runoff control performance standards for new development and a process for site specific analysis and design. The performance standards do not dictate the control methods required, but rather indicate the necessary end product. The runoff control philosophy is intended to ensure that peak runoff rates through the watershed will not increase with development. Successful implementation of the control philosophy would mean the continuation of the “status quo” runoff situation: existing problem areas will not be fixed, but they will not be exacerbated, and new problem areas will not be created.
3. Development of priorities for implementation. This involves developing a prioritized list of actions aimed at improving the current state of stormwater runoff in the water-shed, essentially preparing a strategy for dealing with the existing drainage problem areas within each municipality.
One especially important aspect of the Act 167 process is the need to periodically update the plan. Act 167 specifies that a plan must be updated every five years. This guarantees a dynamic system of stormwater control sensitive to changing watershed characteristics.
The Perkiomen Creek Headwaters – Act 167 – Stormwater Management Plan has been pre-pared for Lehigh County by the Lehigh Valley Planning Commission (LVPC). The County has designated the LVPC to prepare the watershed plans for all watersheds on its behalf.

1-3
The LVPC has used two engineering consultants for the preparation of the Perkiomen Creek Headwaters Plan. Dr. David F. Kibler, P.E., is recently retired as a civil engineering professor from Virginia Tech. Dr. Kibler was formerly a professor of civil engineering at Pennsylvania State University. He has served as a consultant to the LVPC since the inception of Act 167 planning in the mid-1980s. Dr. Kibler was primarily involved in the hydrologic model devel-opment and calibration associated with the Perkiomen Creek Headwaters Plan. He provided further assistance regarding technical aspects of the model ordinance. Allen R. O’Dell, P.E., has served as a consultant to the LVPC since the early 1990s reviewing the engineering as-pects of subdivision and land development plans versus the criteria contained in various Act 167 ordinances. For the Perkiomen Creek Headwaters Plan, Mr. O’Dell assisted with model ordinance development.
To ensure the involvement of the municipalities and agencies which will be impacted by the Stormwater Management Plan, Act 167 requires that a Watershed Plan Advisory Commit-tee be formed to assist in the development of the Plan, and to familiarize the municipalities involved with the stormwater management concepts evolving from the plan process. Each municipality in the watershed, plus the County Conservation District, is required to be rep-resented on the Committee. Representation by additional agencies and interest groups is allowed at the discretion of the County. Listed in Table 1 on page 1-4 are the names and agencies of the persons who participated on the Perkiomen Creek Headwaters Watershed Plan Advisory Committee.
The general framework for the Perkiomen Creek Headwaters Act 167 Plan has been devel-oped from three sources, namely Act 167 itself, the Department of Environmental Protec-tion’s (DEP) Stormwater Management Guidelines, which represent the Department’s inter-pretation of the Act, and the previous watershed stormwater management plans prepared by the LVPC.
As part of the development of the Perkiomen Creek Headwaters Plan, the LVPC has used a Geographic Information System (GIS) and ArcGIS software. The existing land use data for municipalities in Lehigh County was downloaded from Lehigh County’s GIS. Land use data for areas outside of Lehigh County was obtained from Berks and Montgomery counties. Land use, soils, and zoning coverages were used in the watershed modeling process.

1-4
TABLE 1PERKIOMEN CREEK HEADWATERS WATERSHED PLAN ADVISORY COMMITTEE
Municipality/Organization Name Lehigh County Lehigh County Jan CreedonLower Macungie Township Douglas BrownLower Milford Township Donna WrightUpper Milford Township Daniel DeLongUpper Saucon Township Sharyn Heater Lehigh County Conservation District Rebecca Kennedy John Bohman Jeff ZehrLehigh Valley Builders Association John Howard Jack CalahanWildlands Conservancy Kristie Fach Berks County Berks County Planning Commission Ashley MazurekHereford Township No representative designatedLongswamp Township Katherine Harms Bucks County Bucks County Planning Commission Dennis Livrone Alice WaltersMilford Township No representative designated Montgomery County Montgomery County Planning Commission Drew Shaw Alexis MeluskyUpper Hanover Township No representative designated Other PA Department of Environmental Protection Jennifer KehlerPA Department of Transportation Jeff SmallmanPA Turnpike Commission Donald SteelePA Fish & Boat Commission Lee CreyerPerkiomen Watershed Conservancy Crystal GilchristUS Department of Agriculture - Natural Resources Conservation Service Peter Zakanycz

2-1
CHAPTER 2. STUDY AREA CHARACTERISTICS AND HYDROLOGIC RESPONSE
A. General Characteristics
The Perkiomen Creek Headwaters study area is located in the southwestern part of Lehigh County, with some upstream areas extending into small areas of Berks, Mont-gomery, and Bucks counties. The various subwatersheds that comprise the headwaters generally flow south out of Lehigh County into the surrounding counties noted above. The subwatersheds that begin in Lehigh County will all combine below the Green Lane Reservoir at the confluence of the Perkiomen and Unami creeks, as shown in Figure 1. Note that only the gray areas of Figure 1 were included in the study area of this Act 167 Plan. The remaining areas are shown simply to illustrate how these subwatersheds combine downstream.
The Perkiomen Creek Headwaters consist of four main drainage areas tributary to mul-tiple drainage channels in Lehigh County. The Perkiomen Creek has a tributary area of 5.5 square miles and flows to the southwest into Berks County. The Hosensack Creek (which includes flow tributary to Indian Creek) has a tributary area of 17.7 square miles and flows to the southwest into Montgomery County. The Hosensack Creek flows into the Perkiomen Creek north of East Greenville, upstream of the Green Lane Reservoir. The Macoby Creek has a tributary area of 2.4 square miles and also flows to the south-west into Montgomery County. It flows into the southeast end of the Green Lane Reser-voir, where it joins with the Perkiomen Creek. The Unami Creek (which includes flow tributary to Licking, Molasses, and Schmoutz creeks) has a tributary area of 3.7 square miles and flows to the southeast into Bucks County at multiple locations. Schmoutz, Molasses, and Licking creeks will all flow into the Unami Creek in Bucks County, which meets the Perkiomen below the Green Lane Reservoir. The subwatersheds are shown in Figure 2 with the municipal boundaries highlighted. Table 2 lists each subwa-tershed and its respective drainage area in square miles.
TABLE 2PERKIOMEN CREEK HEADWATERS SQUARE MILEAGE
SubwatershedArea
(Square Miles)Perkiomen Creek MainstemHosensack CreekMacoby CreekUnami Creek
5.5017.652.443.73
Total Study Area 29.32
The area of the Perkiomen Creek Headwaters is underlain by two geologic formations. These formations are gneiss in the Reading Prong in the Perkiomen mainstem and the upstream areas of the Hosensack subwatershed, and Triassic shale and conglomerates in the lower part of the Hosensack and the entire Macoby, and Unami Creek subwater-sheds. Figure 3 is a map of the geology of the Perkiomen Creek Headwaters.

2-2
BERKS
LEHIGH
NORTHAMPTON
MONTGOMERY
BUCKS
CARBON
SCHUYLKILL
FIGURE 1PERKIOMEN CREEK HEADWATERS
STUDY AREALOCATION MAP
N.J.
Unam
i Creek
Perk iom en Cree k
Macoby Creek
Ho sen sack
Cre
ek
Deep Creek
Schmoutz Creek
Ind ian Cre ek
Butter Creek
Lick ing Creek
Stony
Run
Molasses Cr e ek
Haz elbac h Creek
Ridge
V
alle
y
Cre
ek
We s
t Branch Perk iomen C
reek
Per k iomen CreekLOWER MILFORD
TWP.
UPPER MILFORD TWP.
LOWER MACUNGIE TWP.
UPPER SAUCON TWP.
HEREFORDTWP.
LONGSWAMPTWP.
UPPERHANOVER
TWP.
MONTGOMERY
COUNTY
BERKSCOUNTY
BUCKS
COUNTY
MILFORDTWP.
Washington
Bally
District
New Hanover
Douglass
Marlborough
Red Hill
Pennsburg
East Greenville
Salford
Upper Salford
Green Lane
West Rockhill
Richland
Perkiomen Creek Headwaters Study Area
Other Perkiomen Creek Drainage Areas
Green Lane Reservoir
Municipality Boundaries
County Boundaries
Streams0 1 2 3
Miles
USGS Stream Gage

2-3
MAC
UN
GIE
ALB
UR
TIS
UP
PE
RSA
UC
ON
LOW
ER
MA
CU
NG
IE
LOW
ERM
ILFO
RD
UPP
ERM
ILFO
RD
CH
UR
CH
GUN CLUB RD
LOCUST VALLEY
KIN
GS
RD
BUC
KEYE
BLUE
LIMEPORT
ST
RD
HWY
HWY
LIM
EP
ORT
PIKE
RD
PIKE
RD
RD
PALM
MAI
N
R
D
PO
WDER
SPIN
NERS T OWN RD
LON
GS
WAMP RD
VERA CRUZ RD
FRA
NK
LIN
ST
WE
ST
STA
TE S
T
RD
KINGS
RD
CH
UR
CH
LINDEN ST
LEH
IGH
ST
PETE
RS
RDVALLEY
VIE
W
BRUN
NER RD
ALB
UR
TIS
R
D
CH
UR
CH
SWEETWOOD D
RBELL GATE
LIM
EP
OR
T
BE
VE
RL
Y
HIL
LS
RD
RD
ZIO
NS
VILL
E R
D
MAIN
RD
MILL R
D
SA
INT
V ERA CRUZ
RD
S P R IN G C R E E K RD
ST
SEISHOLT
ZVILLE
RD
SIG
MUND R
D
GU
N
C
LUB
RD
476
BERKS
COUNTY
COUN
TY
MONTG
OMER
Y
BUCKS
COUNTY
Sigm
und
Lim
epor
t
Vera
Cru
z
Kras
sdal
e
Hos
ensa
ck
Zion
svill
e
Shim
ervi
lle
Milf
ord
Park Po
wde
rVa
lley
Locu
stVa
lley
Dilli
nger
ville
Cen
trevi
lle
Cor
ning
Old
Zio
nsvi
lle
Car
lH
ill
Hos
ensa
ckSt
atio
n
Dilli
nger
Stat
ion
Tunn
elH
ill
Furn
ace
Hill
Mill
Hill
Beve
rlyH
ills
Seis
holtz
ville
Har
lem
HE
RE
FOR
D
LON
GS
WA
MP
UP
PE
RH
AN
OV
ER
MIL
FOR
D
Perk
iom
en C
reek
Hos
ensa
ck C
reek
Mac
oby
Cre
ek
Una
mi C
reek
2
1
36
4
5
179
34
32
7
4524
10
33
42
19
27
12
48
3025
14
49
21
16
47
13
51
2026
36
815
23 39
54
28
38
29
43
18
50 52
11
31
40
35
44
37
46
53
22
41
Subw
ater
shed
Bou
ndar
ies
Suba
rea
Boun
darie
s
Maj
or R
oads
Min
or R
oads
Oth
er R
oads
Rai
lroad
s
Mun
icip
ality
Bou
ndar
ies
Cou
nty
Boun
darie
s
Stre
ams
FIG
UR
E 2
P ER
KIO
MEN
CR
EEK
HEA
DW
ATER
SSU
BW
ATER
SHED
S
LEH
IGH
VA
LLEY
PLA
NN
ING
CO
MM
ISSI
ON
961
Mar
con
Boul
evar
d, S
uite
310
Alle
ntow
n, P
A 1
8109
-936
8(6
10) 2
64-4
544
LVPC0
3,00
06,
000
9,00
0 Feet
Sour
ce: L
ehig
h Va
lley
Pla
nnin
g C
omm
issi
on

2-4
The predominant soils found in the Perkiomen Creek Headwaters are classified as Hy-drologic Soils Group B. Hydrologic Soil Groups (HSGs) are classifications which in-dicate the relative runoff potential of soils based on infiltration rates for various soil types. Runoff potential increases with decreasing infiltration rates as you progress from HSG A to HSG D soils. HSG A soils are sandy soils with high infiltration rates and low runoff potential. There are no HSG A soils in the Perkiomen Creek Headwaters. Group B soils have moderate infiltration rates and consist mostly of moderately deep, well-drained soils. Group C soils have low infiltration rates. This group consists mostly of soils which impede the downward movement of water. Group D soils have very low infiltration rates and therefore high runoff potential. This group consists mostly of soils with a clay layer and a permanent high water table. Hydrologic Soil Groups are one element used in determining runoff curve numbers and Rational ‘c’ values. Within the Perkiomen Creek Headwaters, Gladstone Gravelly Silt Loam is the most common soil type. These soils are classified as HSG B, and are commonly found on upland divides and in rolling foothills. Other common soil types in the study area include Arendtsville Gravelly Silt Loam (HSG B), Penn Channery Silt Loam (HSG C), and Towhee Silt Loam (HSG D). Figure 4 is a map of the study area soils by HSG.
Land use within the study area is predominantly residential in the upstream areas of the subwatersheds and agricultural in the lower parts of the study area. There are no urban areas in the study area, but there is a PPL generator station in the Hosensack Creek watershed.
The Pennsylvania Department of Environmental Protection (DEP) has designated the Perkiomen mainstem as High Quality Waters - Cold Water Fishes (HQ-CWF) above SR 1010 (Seisholtzville Road), and Trout Stocking Fishes (TSF) between SR 1010 and the Green Lane Reservoir. The CWF water quality criterion is designed for protec-tion of aquatic life (fish species and flora and fauna) which are native to a cold water environment. Specific criteria include levels of ammonia, nitrogen, bacteria, pH, total dissolved solids, dissolved oxygen, and temperature, among others. The TSF criterion is designed to protect native trout populations from February 15 through July 31. The Hosensack Creek has been classified as CWF by DEP. The Macoby Creek has been classified as TSF. The Unami Creek has been designated as High Quality Waters-Trout Stocking Fishes (HQ-TSF). Those watersheds that have been designated as High Qual-ity Waters (HQ) must meet standards to preserve the chemistry and biology of the receiving stream. These designations are current as of the preparation of this Act 167 Plan, but changes to these designations have been recently proposed.
B. Hydrologic Response
There are no United States Geologic Survey (USGS) formal stream gages or miscel-laneous measurement sites within the study area. However, there are two active stream gages further downstream on the Perkiomen Creek: at East Greenville and Graterford. The East Greenville gage is approximately 3 miles downstream of the Lehigh County boundary at the bottom of the Hosensack Creek subwatershed, as noted on Figure 1. This gage records flows from the Perkiomen and Hosensack study areas, as well as

2-5

2-6
MAC
UN
GIE
ALB
UR
TIS
UP
PE
RSA
UC
ON
LOW
ER
MA
CU
NG
IE
LOW
ERM
ILFO
RD
UPP
ERM
ILFO
RD
CH
UR
CH
LOCUST VALLEY
KIN
GS
RD
BUC
KEYE
BLUE
LIMEPORT
ST
RD
HWY
HWY
LIM
EP
OR
T
PIKE
RD
PIKE
RD
RD
PALM
MAI
N
R
D
PO
WD
ER
SPIN
NERS T OWN RD
LON
GS
WAMP RD
VERA CRUZ RD
FRA
NKL
IN
ST
RD
KINGS
RD
CH
UR
CH
LEH
IGH
ST
PETE
RS
RDVALLEY
VIE
W
BRUN
NER RD
ALB
UR
TIS
R
D
CH
UR
CH
SWEETWOOD D
R
BELL GATE
LIM
EP
OR
T
BE
VE
RL
Y
HIL
LS
RD
RD
ZIO
NSV
ILLE
RD
MAIN
RD
SA
INT
V ERA CRUZ
RD
S P R IN G C R E E K RD
ST
SEISHOLT
ZVILLE
RD
SIG
MUND R
D
GU
N
C
LUB
RD
476
BERKS
COUNTY
COUNTY
MONTG
OMER
Y
BUCKS
COUNTY
Sigm
und
Lim
epor
t
Vera
Cru
z
Kras
sdal
e
Hos
ensa
ck
Zion
svill
e
Shim
ervi
lle
Milf
ord
Park Po
wde
rVa
lley
Locu
stVa
lley
Dilli
nger
ville
Cen
trevi
lle
Cor
ning
Old
Zio
nsvi
lle
Car
lH
ill
Hos
ensa
ckSt
atio
n
Dilli
nger
Stat
ion
Tunn
elH
ill
Furn
ace
Hill
Mill
Hill
Beve
rlyH
ills
Seis
holtz
ville
Har
lem
HE
RE
FOR
D
LON
GS
WA
MP
UP
PE
RH
AN
OV
ER
MIL
FOR
D
FIG
UR
E 4
P ER
KIO
MEN
CR
EEK
HEA
DW
ATER
SH
YDR
OLO
GIC
SO
IL G
RO
UPS
LEH
IGH
VA
LLEY
PLA
NN
ING
CO
MM
ISSI
ON
961
Mar
con
Boul
evar
d, S
uite
310
Alle
ntow
n, P
A 1
8109
-936
8(6
10) 2
64-4
544
LVPC
03,
000
6,00
09,
000 Fe
et
Sour
ce: L
ehig
h Va
lley
Pla
nnin
g C
omm
issi
on; N
RC
S S
SU
RG
O
D
atab
ase,
Dec
embe
r 200
7
B So
ils
C S
oils
D S
oils
Stud
y Ar
ea B
ound
ary
Maj
or R
oads
Min
or R
oads
Oth
er R
oads
Rai
lroad
s
Mun
icip
ality
Bou
ndar
ies
Cou
nty
Boun
darie
s
*Hyd
rolo
gic
Soil
Gro
ups
are
clas
sific
atio
ns w
hich
indi
cate
the
rela
tive
runo
ff po
tent
ial o
f soi
ls b
ased
on
infil
tratio
n ra
tes
for v
ario
us s
oil t
ypes
.O
n th
is m
ap, t
he c
lass
ifica
tions
rang
e fro
m G
roup
B h
avin
g a
mod
erat
ein
filtra
tion
rate
and
low
er ru
noff
pote
ntia
l to
Gro
up D
, hav
ing
a ve
ry lo
win
filtra
tion
rate
and
hig
h ru
noff
pote
ntia
l.

2-7
15.1 square miles below the study areas and has a period of record from 1982 to the present. The Graterford gage is approximately 15 miles downstream of the bottom of the Hosensack Creek subwatershed. All of the runoff from the Perkiomen Creek Head-waters is recorded by this gage, as well as 249.7 square miles downstream of the study area. This gage has records from 1915 to the present.
Since the gages monitor areas greatly in excess of the study area, the peak flows from the subwatersheds needed to be estimated. There are several ways for this to be accomplished. One such method is the PSU IV procedure for estimating flood peaks in ungaged watersheds developed by Penn State in 1981. This method provides a relatively simple means of estimating peak flows from general watershed characteristics and the watershed’s location within Pennsylvania. Estimation of peak flows for a watershed using data from previously calibrated watersheds is also possible. Flow data from all previously modeled watersheds from Act 167 plans in the Lehigh Valley was used to develop peak flow estimates. This correlation technique is based on the relative drainage areas of two watersheds and known peak flows from previous studies. Also, since USGS gage data is available at East Greenville and Graterford, it is possible to perform a flood frequency analysis to determine the flood peaks for each gage by return period and relate to Perkiomen Creek Headwaters subwatersheds. The Log Pearson 3 (LP3) analysis flood peaks were used to calibrate a correlation between the gage area and each of the areas of the modeled subwatersheds in the Perkiomen Creek Headwaters. Dr. David Kibler performed this analysis using both the East Greenville and Graterford stream gages. Specifically, the calculated peak flows by return period for the East Greenville and Graterford gages were used to calibrate the exponents needed for a correlation procedure. The calibrated exponents were applied to a correlation procedure between the East Greenville gage peak flows and the Perkiomen Creek Headwaters subwatersheds. Last, Flood Insurance Study (FIS) data is available for the Hosensack Creek in Lehigh County. This data included flood peak flows at the county boundary. Table 3 presents the data associated with the Hosensack Creek, representing a 17.371 square mile area. A reference for each of the techniques applied is presented as part of the table. Note that not all techniques provide peak flow estimates for all return periods.
1 The 17.37 square mile area of the Hosensack Creek refers to the area that was used for calibration of the watershed model. There is one 0.28 square mile subarea of the Hosensack watershed that drains over the county boundary before entering the creek, and this was not included in the area used for the initial calibration.

2-8
TABLE 3PEAK FLOW ESTIMATES BY VARIOUS TECHNIQUES AT THE BOTTOM
OF THE HOSENSACK CREEK STUDY AREA
Method/Source
Peak Flow Estimates in Cubic Feet Per Second (cfs) for Return Period of:
2 Years 10 Years 25 Years 100 YearsPSU IVa 1,100 2,561 3,588 5,546Correlation withb: Little Lehigh Creek Jordan Creek Jacoby Creek
396906542
6612,3092,210
1,4633,2263,993
3,1505,4528,817
Log Pearson 3c 1,381 3,377 4,850 7,940
Flood Insurance Studyd ------- 3,000 ------- 8,700aField Manual of Procedure PSU IV for Estimating Design Flood Peaks on Ungaged Penn-sylvania Watersheds, Pennsylvania State University, April 1981.
bCorrelation based on the ratio of drainage areas between the listed watershed and the Hosen-sack Creek study area, raised to the 0.75 power, multiplied by the calibrated peak flow val-ues of the listed watershed developed in previous Act 167 Plans.
cRecommendation for Flood Frequency Analysis in Perkiomen Creek Watershed. Memoran-dum from Dr. David Kibler to LVPC revised August 21, 2008. East Greenville data used for flow comparison.
dFederal Emergency Management Agency Flood Insurance Study for Lehigh County, Vol-ume 1 of 2. Flow values are given at the county boundary.
As Table 3 shows, there is a good variance in the peak flows for a given return period, depending on the estimation method. For example, the 100-year peak flow estimates vary from a low of 3,150 cfs from the correlation with the Little Lehigh Creek Wa-tershed to a high of 8,817 from the correlation with the Jacoby Creek Watershed. Of this data, the Flood Insurance Data is probably the most accurate representation of the actual conditions, since it is based on a detailed flood study by the Federal Emergency Management Agency (FEMA). Also, since the LP3 correlation is based on the East Greenville USGS gage data downstream of the study area, it should also be considered to be fairly representative of the actual flood peaks. Since the Hosensack Creek study area is entirely in areas without carbonate bedrock, it is unlikely that flow correlations with previously calibrated, partially carbonate bedrock watersheds would be suitable for use in calibrating the Perkiomen model. Finally, compared with the LP3 and FIS data, it seems apparent that PSU IV is underestimating the size of the large flood events. Therefore, the LVPC has opted to calibrate the model to the best fit of both the FIS (where applicable) and LP3 flow values.
The Hydrologic Engineering Center’s Hydrologic Modeling System (HEC-HMS) was selected to create the hydrologic model for the watershed in the Perkiomen Creek Head-waters. HEC-HMS was selected for several reasons, including its ease of use, flexibility in modeling techniques, and cost (free). HEC-HMS is able to replicate the performance of the Penn State Runoff Model (PSRM) methodology fairly well, which the LVPC had used for the development of all previous Act 167 Plans.
2-9
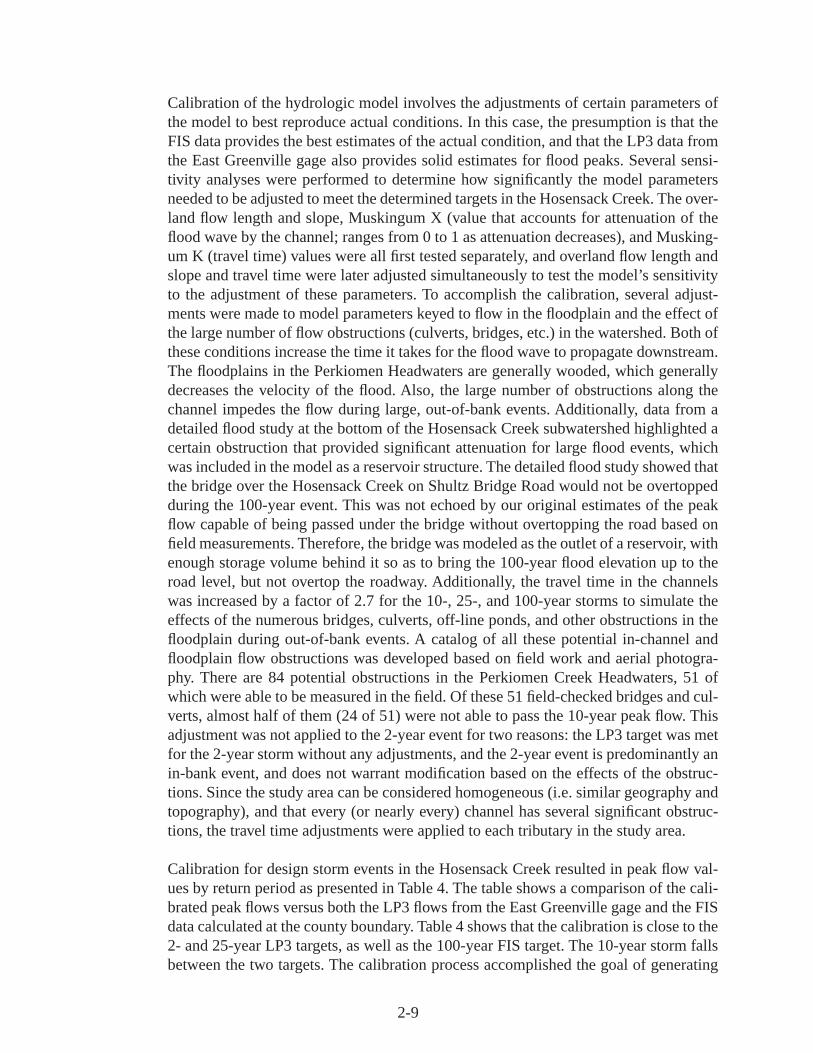
Calibration of the hydrologic model involves the adjustments of certain parameters of the model to best reproduce actual conditions. In this case, the presumption is that the FIS data provides the best estimates of the actual condition, and that the LP3 data from the East Greenville gage also provides solid estimates for flood peaks. Several sensi-tivity analyses were performed to determine how significantly the model parameters needed to be adjusted to meet the determined targets in the Hosensack Creek. The over-land flow length and slope, Muskingum X (value that accounts for attenuation of the flood wave by the channel; ranges from 0 to 1 as attenuation decreases), and Musking-um K (travel time) values were all first tested separately, and overland flow length and slope and travel time were later adjusted simultaneously to test the model’s sensitivity to the adjustment of these parameters. To accomplish the calibration, several adjust-ments were made to model parameters keyed to flow in the floodplain and the effect of the large number of flow obstructions (culverts, bridges, etc.) in the watershed. Both of these conditions increase the time it takes for the flood wave to propagate downstream. The floodplains in the Perkiomen Headwaters are generally wooded, which generally decreases the velocity of the flood. Also, the large number of obstructions along the channel impedes the flow during large, out-of-bank events. Additionally, data from a detailed flood study at the bottom of the Hosensack Creek subwatershed highlighted a certain obstruction that provided significant attenuation for large flood events, which was included in the model as a reservoir structure. The detailed flood study showed that the bridge over the Hosensack Creek on Shultz Bridge Road would not be overtopped during the 100-year event. This was not echoed by our original estimates of the peak flow capable of being passed under the bridge without overtopping the road based on field measurements. Therefore, the bridge was modeled as the outlet of a reservoir, with enough storage volume behind it so as to bring the 100-year flood elevation up to the road level, but not overtop the roadway. Additionally, the travel time in the channels was increased by a factor of 2.7 for the 10-, 25-, and 100-year storms to simulate the effects of the numerous bridges, culverts, off-line ponds, and other obstructions in the floodplain during out-of-bank events. A catalog of all these potential in-channel and floodplain flow obstructions was developed based on field work and aerial photogra-phy. There are 84 potential obstructions in the Perkiomen Creek Headwaters, 51 of which were able to be measured in the field. Of these 51 field-checked bridges and cul-verts, almost half of them (24 of 51) were not able to pass the 10-year peak flow. This adjustment was not applied to the 2-year event for two reasons: the LP3 target was met for the 2-year storm without any adjustments, and the 2-year event is predominantly an in-bank event, and does not warrant modification based on the effects of the obstruc-tions. Since the study area can be considered homogeneous (i.e. similar geography and topography), and that every (or nearly every) channel has several significant obstruc-tions, the travel time adjustments were applied to each tributary in the study area.
Calibration for design storm events in the Hosensack Creek resulted in peak flow val-ues by return period as presented in Table 4. The table shows a comparison of the cali-brated peak flows versus both the LP3 flows from the East Greenville gage and the FIS data calculated at the county boundary. Table 4 shows that the calibration is close to the 2- and 25-year LP3 targets, as well as the 100-year FIS target. The 10-year storm falls between the two targets. The calibration process accomplished the goal of generating

2-10
peak flows which approximate the FIS and LP3 values while maintaining hydrograph volume since no curve number adjustments were necessary.
TABLE 4CALIBRATED HEC-HMS HOSENSACK CREEK VALUES VERSUS LP3 AND
FIS FLOW TARGETS*ReturnPeriod
Peak Flow HEC-HMS % Difference**HEC-HMS FIS LP3
125
102550
100
6781,3872,4133,2884,9636,8048,801
------------
3,000----
6,4008,700
6721,3812,4273,3774,8506,2587,940
0.90.4
-0.6-2.62.36.31.2
*Data is associated with the entire drainage area to the bottom of the Hosensack Creek study area.
**HEC-HMS percent difference calculated as the HEC-HMS peak flow minus the closer of the two flow targets (FIS or LP3) divided by the same flow target.
The calibrated HEC-HMS data from the Hosensack Creek study area from Table 4 is also presented graphically in Figure 5. The plot of peak flow versus return period is called a “frequency curve” for the study area. The frequency curve is also shown for the Log Pearson 3 analysis.
The remainder of the study area is divided into eleven separate drainage areas for the purpose of modeling. These drainage areas are: the Perkiomen Creek, an unnamed tributary to the Hosensack Creek, the Unami Creek, two unnamed tributaries to the Unami Creek, Licking Creek, Molasses Creek, Schmoutz Creek, the Macoby Creek Branch, an unnamed tributary to the Macoby Creek Branch, and the Macoby Creek. With the exception of the Hosensack Creek, the drainage areas were considered too small to warrant individual calibration of peak flows. Calibration targets derived from correlation to gaged watersheds would be considered less reliable as watershed size decreases. Since these drainage areas have the same basic characteristics of soil, slope, geology, and land use, it was decided that the largest drainage area, in this case the Hosensack Creek, would be calibrated, and the calibration adjustments would be ap-plied to the remaining drainage areas. Therefore, the same travel time adjustments that were applied to the Hosensack Creek were applied to each of these drainage areas. However, there are no detailed flood studies in these drainage areas, and no individual obstructions were included in the model. Table 5 contains the peak flow values at the bottom of each study area.

2-11
FIG
UR
E 5
HO
SEN
SAC
K C
REE
K F
LOO
D F
REQ
UEN
CY
AT
LEH
IGH
CO
UN
TY B
OU
ND
AR
YFR
OM
CA
LIB
RA
TED
HEC
-HM
S A
ND
LO
G-P
EAR
SON
3 C
OR
REL
ATI
ON
0
1,00
0
2,00
0
3,00
0
4,00
0
5,00
0
6,00
0
7,00
0
8,00
0
9,00
0
10,0
00
0.01
0.1
1
Prob
abili
ty o
f Occ
uran
ce o
r Exc
eede
nce
in A
ny Y
ear
Peak Flow (cfs)
Cal
ibra
ted
HE
C-H
MS
LP3
Cor
rela
tion
to E
ast G
reen
ville
US
GS
Gag
e
0.04
0.07
0.02
0.2
0.5
0.7
0.3
12
510
2550
100
Ret
urn
Perio
d, in
Yea
rs:

2-12
TABLE 5CALIBRATED HEC-HMS PEAK FLOW VALUES FOR REMAINING
DRAINAGE AREAS IN PERKIOMEN CREEK HEADWATERSPeak Flow (cfs)
Drainage Areas and Subareas (refer to Plate I inside back cover):
Return Period
Perkiomen Subareas
1-8
Unnamed Tributary
to Hosensack
Subarea 40
UnamiSubarea
41
Unnamed Tributary to Unami Subareas
42-43
Unnamed Tributary to Unami Subarea
44
LickingSubareas
45-46
125
102550
100
148312562967
1,5352,1852,894
6153174
139228336
14274691
152229316
87172291556897
1,2961,738
163461
124210314435
61125217424698
1,0291,407
Return Period
Molasses Subarea
47
Schmoutz Subarea
48
Macoby Branch
Subareas 49-52
Unnamed Tributary
to Macoby Branch Subarea
53
Macoby Subarea
54
125
102550
100
183869
143247380538
2557
105219377575804
84174304490806
1,1971,642
18345194
142200265
143468
150268419597

3-1
CHAPTER 3. PERKIOMEN CREEK HEADWATERS LAND DEVELOPMENT AND RUNOFF IMPACTS
A. General Land Development Impacts on Storm Runoff
The necessity for the preparation of a stormwater management plan is created by the fact that land development will, in general, cause a higher percentage of a given rainfall to become runoff. The primary reason for this is the increase in the amount of imper-vious cover on the land surface (e.g. roof areas, driveway, parking lots, roads, etc.). Impervious cover does not allow rainfall to infiltrate into the ground, instead, it pre-dominantly becomes surface runoff. The exception to this would be when impervious areas drain to pervious areas which would allow for some infiltration. The percentage of impervious cover for a given development varies by the type of development, as shown in Table 6 below.
TABLE 6“TYPICAL” PERCENT IMPERVIOUSNESS BY LAND USE
Land UsePercent
ImperviousnessWoods1. Open Space2. Agriculture3. Low Density Residential4. Medium Density Residential5. High Density Residential6. Industrial7. Commercial8. Institutional9. Large Impervious Areas10. Water Bodies11. Transportation Uses12. Mining13.
000
203865728540
100100300
The above typical percent imperviousness figures have been developed from standard Natural Resources Conservation Service2 (NRCS) methodology. The breakdown be-tween the three residential densities is as follows: low density – less than or equal to 2 units per acre; medium density – between 2 and 5 units per acre; high density – greater than or equal to 5 units per acre.
From Table 6, it is clear that the development of land which currently is in woods, open space, or agriculture could have a dramatic impact on the percentage of impervi-ous cover. It is also clear that the cumulative impact of this type of development for a rural area could be severe without implementation of the proper runoff management controls.
2 On November 30, 1995, the Soil Conservation Service changed its name to the Natural Resources Conservation Service. When researching methodology or publications generated prior to this date, the author may still be listed as the Soil Conservation Service.

3-2
An example of the impacts that increases in impervious cover have on a given water-shed area are illustrated in Figure 6. The series of curves, or hydrographs, present the runoff response of the watershed area versus time for percent imperviousness ranging from 5% to 25%, as generated by HEC-HMS (the hydrologic computer model selected for analysis by the LVPC in the Perkiomen Creek Headwaters Act 167 Plan). The wa-tershed area used for this analysis represents a subarea size of 300 acres. The rainfall event used to produce the hydrographs was the NRCS 2-year design storm (24-hour duration, type II distribution, and a 3.0 inch rainfall depth).
From Figure 6, the peak runoff from the watershed area for 5% impervious cover is ap-proximately 18 cfs (cubic feet per second). Further, each 5% increment in impervious cover produces an additional 8 to 11 cfs to the peak runoff such that 25% impervious-ness produces 56 cfs runoff peak. If the 5% impervious cover hydrograph represented the “existing” condition of a watershed area, then each 5% increment of impervious cover would increase the surface runoff by about 50% of the pre-development peak flow. In the Perkiomen Creek Headwaters, 33% (18 out of 54) of the watershed subar-eas have existing impervious cover of 5% or less, and 82% (44 out of 56) have existing impervious cover of 10% or less. It is clear that the runoff impacts of development of the headwaters could be significant.
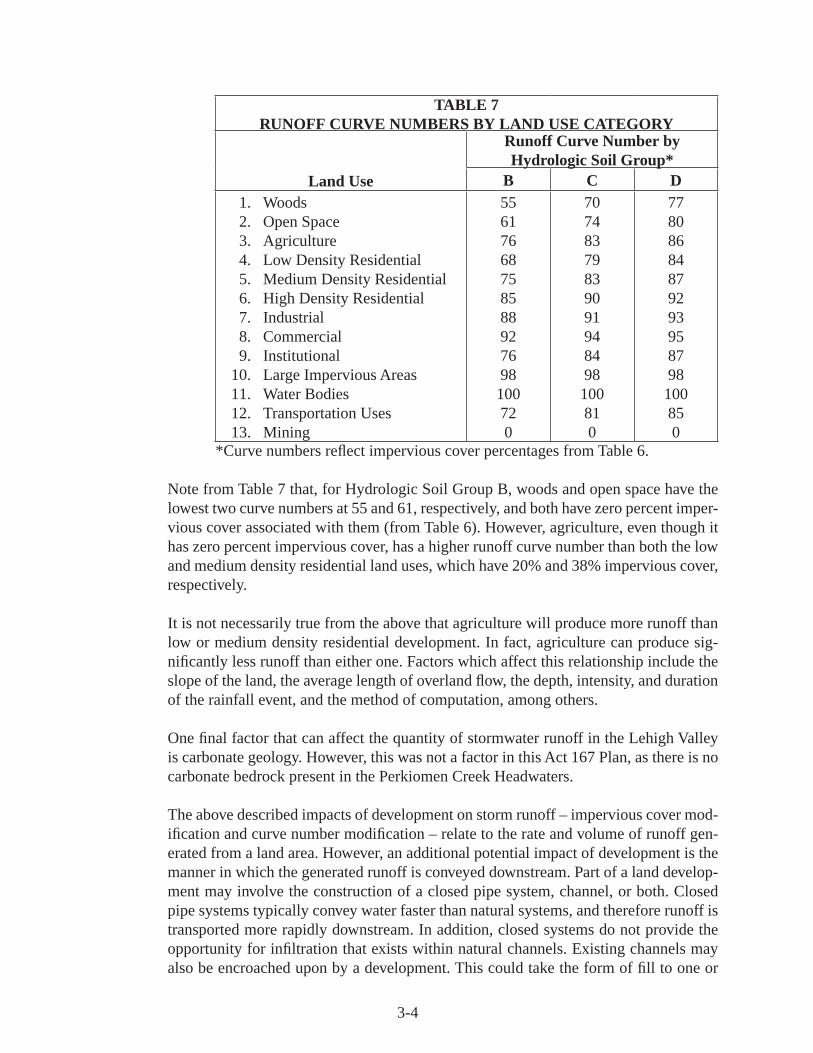
The amount of impervious cover is not the only factor affecting the amount of runoff produced by a given land area. Irrespective of impervious cover, certain land uses pro-duce more runoff than others for the same rainfall. The NRCS has researched the runoff response for various types of land uses, or land cover, and translated the results into a parameter called the runoff curve number. Simply described, the runoff curve number system is a ranking of the relative ability of various land use/cover types to produce runoff. Presented in Table 7 are the runoff curve numbers derived from NRCS which have been used in the Perkiomen Creek Headwaters planning process. Higher curve numbers reflect a greater potential for producing runoff.

3-3
FIG
UR
E 6
IMPA
CT
OF
IMPE
RVI
OU
S C
OVE
R O
N S
TOR
M R
UN
OFF
0102030405060
010
020
030
040
050
060
070
080
090
010
00
Tim
e (m
in.)
Runoff (cfs)
25%
Impe
rvio
us C
over
20%
Impe
rvio
us C
over
15%
Impe
rvio
us C
over
10%
Impe
rvio
us C
over
5% Im
perv
ious
Cov
er
3-4
TABLE 7RUNOFF CURVE NUMBERS BY LAND USE CATEGORY
Land Use
Runoff Curve Number by Hydrologic Soil Group*
B C DWoods1. Open Space2. Agriculture3. Low Density Residential4. Medium Density Residential5. High Density Residential6. Industrial7. Commercial8. Institutional9. Large Impervious Areas10. Water Bodies11. Transportation Uses12. Mining13.
55617668758588927698100720
70748379839091948498100810
77808684879293958798100850
*Curve numbers reflect impervious cover percentages from Table 6.
Note from Table 7 that, for Hydrologic Soil Group B, woods and open space have the lowest two curve numbers at 55 and 61, respectively, and both have zero percent imper-vious cover associated with them (from Table 6). However, agriculture, even though it has zero percent impervious cover, has a higher runoff curve number than both the low and medium density residential land uses, which have 20% and 38% impervious cover, respectively.
It is not necessarily true from the above that agriculture will produce more runoff than low or medium density residential development. In fact, agriculture can produce sig-nificantly less runoff than either one. Factors which affect this relationship include the slope of the land, the average length of overland flow, the depth, intensity, and duration of the rainfall event, and the method of computation, among others.
One final factor that can affect the quantity of stormwater runoff in the Lehigh Valley is carbonate geology. However, this was not a factor in this Act 167 Plan, as there is no carbonate bedrock present in the Perkiomen Creek Headwaters.
The above described impacts of development on storm runoff – impervious cover mod-ification and curve number modification – relate to the rate and volume of runoff gen-erated from a land area. However, an additional potential impact of development is the manner in which the generated runoff is conveyed downstream. Part of a land develop-ment may involve the construction of a closed pipe system, channel, or both. Closed pipe systems typically convey water faster than natural systems, and therefore runoff is transported more rapidly downstream. In addition, closed systems do not provide the opportunity for infiltration that exists within natural channels. Existing channels may also be encroached upon by a development. This could take the form of fill to one or

3-5
both sides of a channel, placement of structures within the channel, or any other modi-fications of the natural cross-section of the channel. The exact impact on the convey-ance characteristics (i.e. depth, width, capacity, velocity) of the channel would depend on the type and extent of the encroachment. A key aspect of the watershed plan is the ability of the conveyance facilities to maintain (or attain) adequacy for transporting anticipated runoff. Any modifications to the conveyance network associated with de-velopment should be accomplished in such a way as to provide for continuing transport of the upstream flows in a safe and efficient manner.
B. Historical Perkiomen Creek Headwaters Development
During the past quarter-century, land development within the Perkiomen Creek Head-waters Study Area has predominately consisted of low density residential development. This residential development has been scattered throughout the study area, with Upper Milford Township experiencing the greatest development pressure. Table 8 provides a summary of historical land development within the Perkiomen Creek Headwaters Study Area by municipality and type of development. Data for the table was estimated by the LVPC based upon LVPC land use records, a study area field survey and aerial photograph analysis.
TABLE 8PERKIOMEN CREEK HEADWATERS STUDY AREA
HISTORICAL LAND DEVELOPMENT*(Acres)
County / MunicipalityAcres Developed over Studied Period ** Average Number of
Acres Developed per YearResidential Commercial Industrial Total
Lehigh County
Lower Macungie Twp. 0.0 0.0 0.0 0.0 0.0
Lower Milford Twp. 698.9 0.0 0.0 698.9 31.8
Upper Milford Twp. 759.1 8.1 0.0 767.2 34.9
Upper Saucon Twp. 33.7 0.0 0.0 33.7 1.5
Berks County ***
Hereford Twp. n/a n/a n/a 305.3 11.3
Longswamp Twp. n/a n/a n/a 0.0 0.0
Bucks County ***
Milford Twp. n/a n/a n/a 17.7 0.7
Montgomery County ***
Upper Hanover Twp. n/a n/a n/a 15.6 0.6 * Source: LVPC land use records, Perkiomen Creek Headwaters Study Area field survey and aerial photograph
analysis. ** Land development estimates for Lehigh County were estimated for the period from 1980 through 2002. Land
development estimates for Berks, Bucks and Montgomery counties were estimated for the period from 1980 through 2007.
*** A breakdown of land development by land use was not available for this county.

3-6
For the portions of the watershed within Lehigh County, LVPC land use records were used to estimate land development for the period from 1980 through 2002. Since none of the Lehigh County municipalities are completely within the study area, land devel-opment figures for the study area portion of each municipality were estimated from the corresponding data for the entire municipality. Although land use data for Lehigh County is available for more recent years, the 2002 data was used because it provides the most meaningful comparison to the 1980 data. The land use data for both 1980 and 2002 was estimated using the LVPC’s original land use database. For the years follow-ing 2002, land use data was estimated using a new LVPC database developed in 2005. Because the two databases classify and estimate land use differently, data from the two databases is not completely comparable. Therefore, an accurate comparison cannot be made between the 1980 land use data and the land use data for any year after 2002.
Because the LVPC land use records only include data for municipalities within the Le-high Valley, the LVPC employed a different method of measuring development to de-termine watershed land development outside of Lehigh County. For the portions of the watershed in Berks, Bucks and Montgomery counties, the LVPC used 1981 aerial pho-tographs to estimate the land area that had been developed by the end of 1980. This data was then compared to current land use data gathered by the LVPC during a field survey of the study area performed in early 2008. Comparing the development data from these two sources allowed the LVPC to estimate land development within the portions of the watershed outside of Lehigh County for the period from 1980 through 2007.
As shown in Table 8, approximately 1,500 acres were developed within the Lehigh County portion of the study area over the 22 year period from 1980 through 2002. Ap-proximately 340 acres of the study area were developed outside of Lehigh County dur-ing the 27 year period from 1980 through 2007. For residential development, the acre-ages can be somewhat misleading in that the density of development may vary signifi-cantly between municipalities. The number of units constructed in a given municipality could be disproportionate to the acreage when compared with another municipality.
Development in place as of March 2008 represents the “existing” situation for the preparation of the Perkiomen Creek Headwaters Stormwater Management Plan. The existing land use condition was generated using Lehigh County land use records and field surveys. A map of the existing land use is provided as Figure 7. Stormwater runoff calculated based on the existing land use condition defines the goal of the watershed plan (i.e. no increase in existing peak flows throughout the study area). The “stress” ap-plied to the system is the increase in impervious cover in the study area associated with new land development. Quantification of the stress requires an assumption of future land use condition. Future land use condition assumptions used in the development of the watershed plan are discussed in the following section.

3-7


3-9
C. Future Perkiomen Creek Headwaters Development
Projection of a future land use condition for the purpose of determining the runoff impacts of new development is an essential part of the plan preparation process. Only through an understanding of the increase in both volume of runoff and peak rate of runoff associated with development of a watershed can a sound control strategy be devised. Typically, a future land use condition is identified for a given “design year.” The design year would be selected based upon the intended design life of the control strategy. Prudent stormwater management would appear to dictate a design life consis-tent with full development of the watershed. Otherwise, the stormwater management controls put in place today might quickly become outdated should development exceed expectations. Conversely, designing a runoff control strategy based upon the “ultimate” land use condition when that level of development may not occur for 10, 20 or even 40 years or more might appear somewhat impractical.
In an effort to help establish the merits of each approach, two future land use condi-tions, or scenarios, were investigated. The first is a design life-type scenario of estimat-ing the anticipated development for a ten-year period (2008 to 2018). The second is a form of “ultimate” future land use based upon current zoning. Each of the scenarios is described below.
Land development projected over the period 2008 to 2018 based upon a continuation of historical development trends, and constrained by existing zoning and the availability of undeveloped land, is presented in Table 9. Using the historical trend assumption, ap-proximately 805 acres of additional land development would occur within the Perkio-men Creek watershed by the year 2018.
Table 9 may provide a very reasonable estimate of the study area’s growth over the next decade. For stormwater runoff purposes, however, it is missing a critical element. That is, the table does not help identify where the projected growth may occur within a given municipality (except for Upper Saucon Township). As will be discussed in greater de-tail in subsequent chapters, the runoff control criteria will be developed for small indi-vidual watershed subareas of approximately 300 acres average size. Obviously, when considering watershed areas this small, the “where” question becomes important. An exaggerated example would be that the 349 acres of residential development projected for Upper Milford Township could occur in a scattered fashion throughout residential-ly-zoned areas (i.e. scattered watershed subareas) or could be concentrated in one or two of the 300-acre areas. The runoff control strategy devised to deal with these two situations could be very different.

3-10
TABLE 9PERKIOMEN CREEK HEADWATERS STUDY AREA
PROJECTED LAND DEVELOPMENT 2008-2018*(Acres)
County / Municipality Residential Commercial Industrial TotalLehigh County
Lower Macungie Twp. 0 0 0 0Lower Milford Twp. 318 0 0 318Upper Milford Twp. 345 4 0 349Upper Saucon Twp. ** 13 0 0 13
Berks County *** Hereford Twp. n/a n/a n/a 113Longswamp Twp. n/a n/a n/a 0
Bucks County *** Milford Twp. n/a n/a n/a 7
Montgomery County *** Upper Hanover Twp. n/a n/a n/a 6
TOTAL n/a n/a n/a 806 * Source: Projected based upon historical land development estimates from Table 8. ** Based upon the historical development estimates in Table 8, 15 acres would be developed within the
Upper Saucon Township portion of the watershed during the period 2008-2018. However, only 13 acres of this portion of the Township are currently undeveloped.
*** A breakdown of land development by land use was not available for this county.
The second future land use scenario is a full built-out scenario in which the currently undeveloped areas of the watershed (including cultivated areas) are developed accord-ing to current zoning regulations. Municipal zoning districts throughout the Perkiomen Creek Headwaters Study Area can be categorized as industrial, commercial, agricul-tural or residential at various densities. For the purpose of evaluating the future zoned condition land use, a composite zoning map of the study area was prepared. Each of the zoning districts was placed into one of the above categories. The density criteria for residential development is as follows: low density equals two or less units per acre; medium density equals between two and five units per acre; high density equals five or more units per acre. Since the allowable density of residential development can vary widely within a given zoning district, an “average” allowable density was determined from the district description and the district was placed into a low, medium or high density classification.
The future condition land use map represents an “average ultimate” development sce-nario. It is an ultimate condition because all of the study area that is not protected by either agricultural zoning or an agricultural preservation easement is assumed to be developed. With the exception of one site, areas covered by agricultural zoning or an agricultural preservation easement are assumed to remain in agricultural use and not to be developed. The mentioned exception was made for a Lower Milford Township site that currently contains a nursery and is covered by an agricultural preservation ease-ment. While the nursery use can be considered agricultural, the commercial aspect of the use has required the site to be developed more intensely than agricultural lands are

3-11
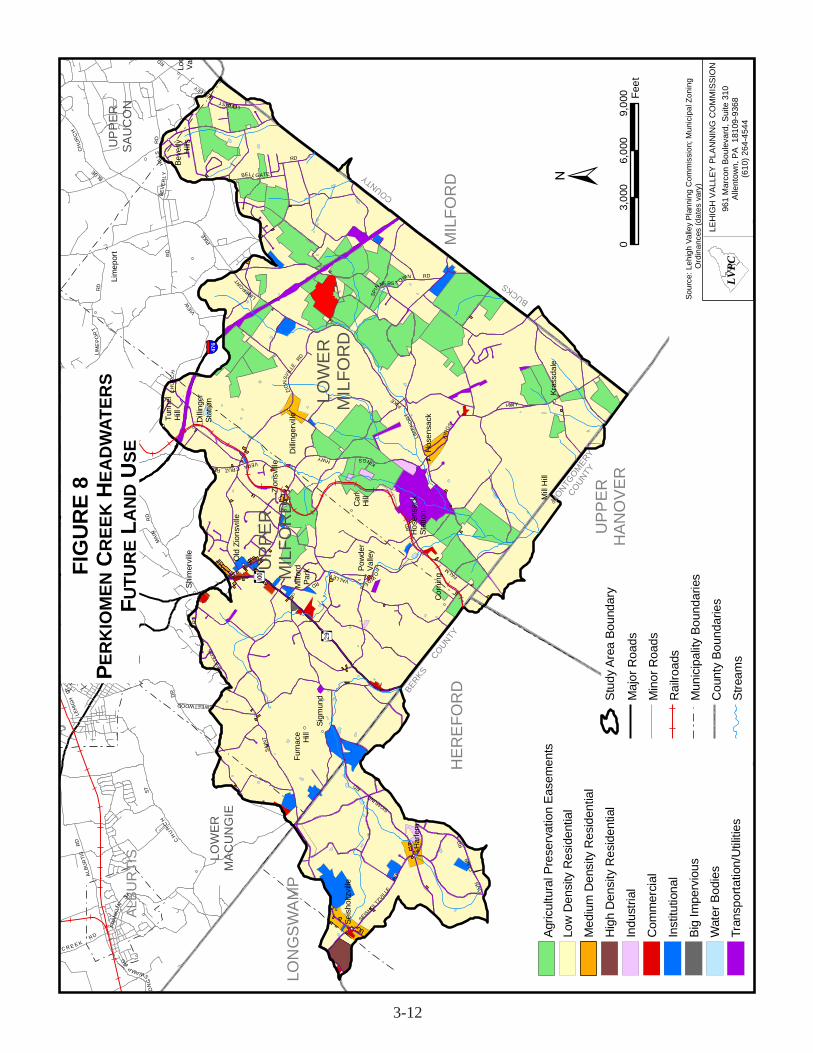
traditionally developed. To ensure that the stormwater management plan accurately ac-counts for the existing development on this site, this site is classified as commercial in both the existing and future land use maps. The future zoned condition land use map also represents an average condition because, within a zoning district and consistent with the district description, development could occur at a higher or lower density than that assumed. The future land use map is provided as Figure 8.
The decision regarding which of the two future land use conditions to use in structuring the runoff control philosophy can be made fairly readily when considering the structure of Act 167. The Act is based on the assumption that land development will continue to occur and that the stormwater runoff impacts associated with that development are to be controlled. Using the 10-year design period development data would require as-sumptions as to the distribution of the development within the municipalities. The as-sumed distributions could be based upon concentrated development or based upon uni-form scattered development. In either case, the accuracy of the development location assumptions for small watershed areas could suffer dramatically with unanticipated development in a very short period of time. Conversely, the future zoned condition land use would remain valid until either the zoning changed or major exception uses were allowed. Therefore, the future zoned condition land use will be used as the design land use for formulation of the runoff control plan. Thus, Figure 8 displays the future land use condition as used in the development of the runoff control strategy.
3-12
MAC
UN
GIE
ALBU
RTI
SU
PPE
RSA
UC
ON
LOW
ERM
AC
UN
GIE
LOW
ER
MIL
FOR
D
UP
PER
MIL
FOR
D
CH
UR
CH
GUN CLUB RD
LOCUST VALLEY
KIN
GS
RD
BUC
KEYE
BLUE
LIMEPORT
ST
RD
HWY
HWY
LIM
EP
OR
T
PIKE
RD
PIKE
RD
RD
PALM
MAI
N
R
D
PO
WDER
SPIN
NERS T OWN RD
LON
GS
WAMP RD
VERA CRUZ RD
FRA
NK
LIN
ST
WE
ST
STA
T E S
T
RD
KINGS
RD
CH
UR
CH
LINDEN ST
LEHI
GH
ST
PETE
RS
RD VALLEY
VIE
W
BRUN
NER R
D
ALB
UR
TIS
R
D
CH
UR
CH
SWEETWOOD D
RBELL GATE
LIM
EP
OR
T
BEV
ER
LY
H
ILLS
R
D
RD
ZIO
NSV
ILLE
RD
MAIN
RD
MILL R
D
SAIN
T
V ERA CRUZ
RD
S P R IN G C R E E K RD
ST
SEISHOLTZVIL
LE
RD
SIGMUND
RD
GU
N
C
LUB
RD
476
BERKS
COUNTY
COUNTY
MONTG
OMER
Y
BUCKS
COUNTY
Sigm
und
Lim
epor
t
Vera
Cru
z
Kras
sdal
e
Hos
ensa
ck
Zion
svill
e
Shim
ervi
lle
Milf
ord
Park Po
wde
rVa
lley
Locu
stVa
lley
Dill
inge
rville
Cen
trevi
lle
Cor
ning
Old
Zio
nsvi
lle
Car
lH
ill
Hos
ensa
ckSt
atio
n
Dill
inge
rSt
atio
n
Tunn
elH
ill
Furn
ace
Hill
Mill
Hill
Beve
rlyH
ills
Seis
holtz
ville
Har
lem
HER
EFO
RD
LON
GS
WA
MP
UPP
ERH
ANO
VER
MIL
FOR
D
FIG
UR
E 8
P ER
KIO
MEN
CR
EEK
HEA
DW
ATER
SFU
TUR
E LA
ND
USE
LEH
IGH
VA
LLEY
PLA
NN
ING
CO
MM
ISSI
ON
961
Mar
con
Boul
evar
d, S
uite
310
Alle
ntow
n, P
A 1
8109
-936
8(6
10) 2
64-4
544
LVPC
03,
000
6,00
09,
000 Fe
et
Sour
ce: L
ehig
h Va
lley
Pla
nnin
g C
omm
issi
on; M
unic
ipal
Zon
ing
Ord
inan
ces
(dat
es v
ary)
Stud
y Ar
ea B
ound
ary
Maj
or R
oads
Min
or R
oads
Rai
lroad
s
Mun
icip
ality
Bou
ndar
ies
Cou
nty
Boun
darie
s
Stre
ams
Agric
ultu
ral P
rese
rvat
ion
Ease
men
tsLo
w D
ensi
ty R
esid
entia
l
Med
ium
Den
sity
Res
iden
tial
Hig
h D
ensi
ty R
esid
entia
l
Indu
stria
l
Com
mer
cial
Inst
itutio
nal
Big
Impe
rvio
us
Wat
er B
odie
s
Tran
spor
tatio
n/U
tiliti
es

4-1
CHAPTER 4. PERKIOMEN CREEK HEADWATERS FLOODPLAIN INFORMATION
A. Floodplain Delineation
The Federal Emergency Management Agency (FEMA) has prepared Flood Insurance Studies and floodplain mapping by county that include all municipalities in the Perkio-men Creek Headwaters. However, not all of the municipalities have a delineated 100-year floodplain within the headwaters. Of the eight municipalities located within the headwaters, only four have delineated floodplains. They include Upper Milford and Lower Milford townships in Lehigh County, Hereford Township in Berks County and Upper Hanover Township in Montgomery County. The county flood studies that in-clude these four municipalities document the 100-year floodplains within the Perkio-men Creek Headwaters. The Lehigh County Flood Insurance Study that includes Upper Milford and Lower Milford townships is available for inspection at the Lehigh Valley Planning Commission office as well as the respective municipal offices and is not re-produced here. The publication date for the Lehigh County Flood Insurance Study is July 16, 2004. The Berks County Flood Insurance Study (publication date of May 21, 2001) that includes Hereford Township and the Montgomery County Flood Insurance Study (publication date of October 19, 2001) that includes Upper Hanover Township are available at their respective county planning agency offices and municipal offices as well.
FEMA’s Community Rating System uses a system of credits whereby communities that exceed the minimum requirements of the National Flood Insurance Program secure reductions in the flood insurance premiums for their residents. Regulating development through a stormwater management plan which has been approved by a state agency, such as an Act 167 Plan, qualifies for additional credits. Erosion and sediment control regulations can also qualify for additional credits. Communities that require new de-velopments to include in their design of stormwater management facilities appropriate Best Management Practices (BMPs) that will improve surface water quality can qualify for additional credits as well.
B. Detailed Versus Non-Detailed Floodplain Delineation by Stream Segment
The 100-year floodplains for the stream segments in Hereford Township and Upper Ha-nover Township have been determined only by approximate methods. Detailed hydrau-lic analyses were not performed for these areas and, therefore, base flood elevations have not been determined. For Upper Milford Township and Lower Milford Township in the Perkiomen Creek Headwaters, the 100-year floodplains for some stream seg-ments were determined by non-detailed methods, while others were determined by detailed methods. Detailed investigations include documented flow values at selected floodplain cross-sections, flood profiles along the stream length and base flood eleva-tions. Presented in Figure 9 is a map of the Perkiomen Creek Headwaters with the de-lineation of detailed versus non-detailed flood mapping by stream segment.
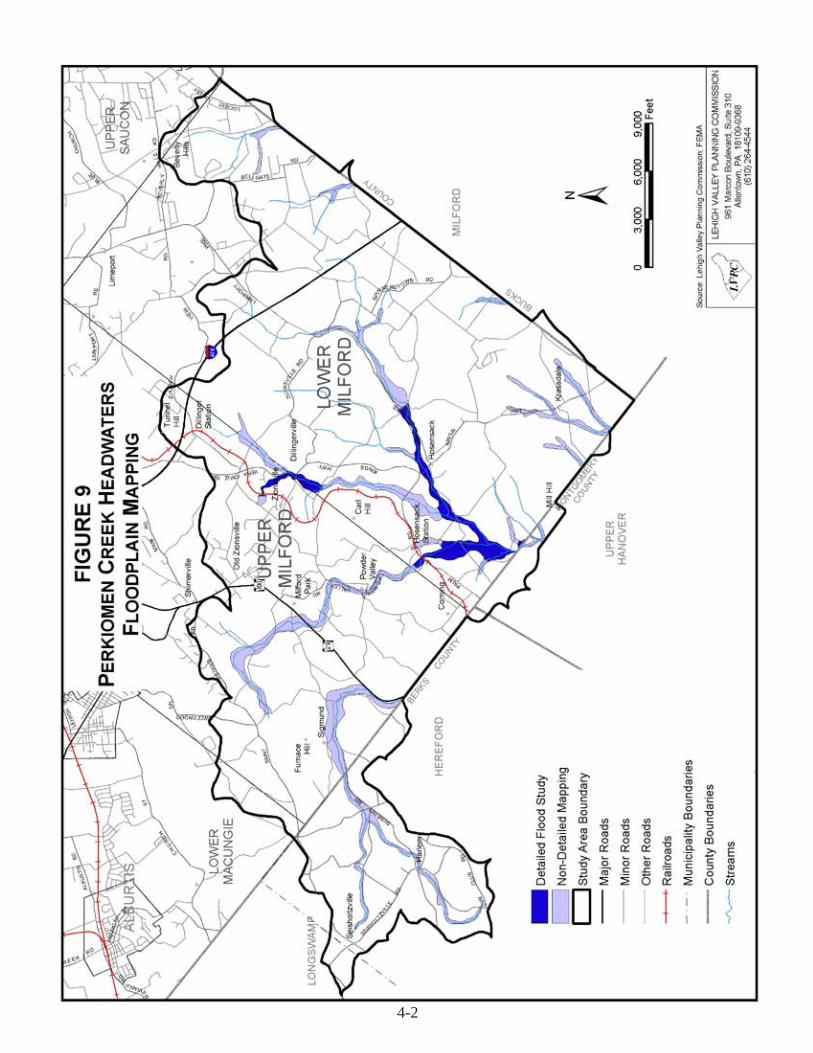
4-2
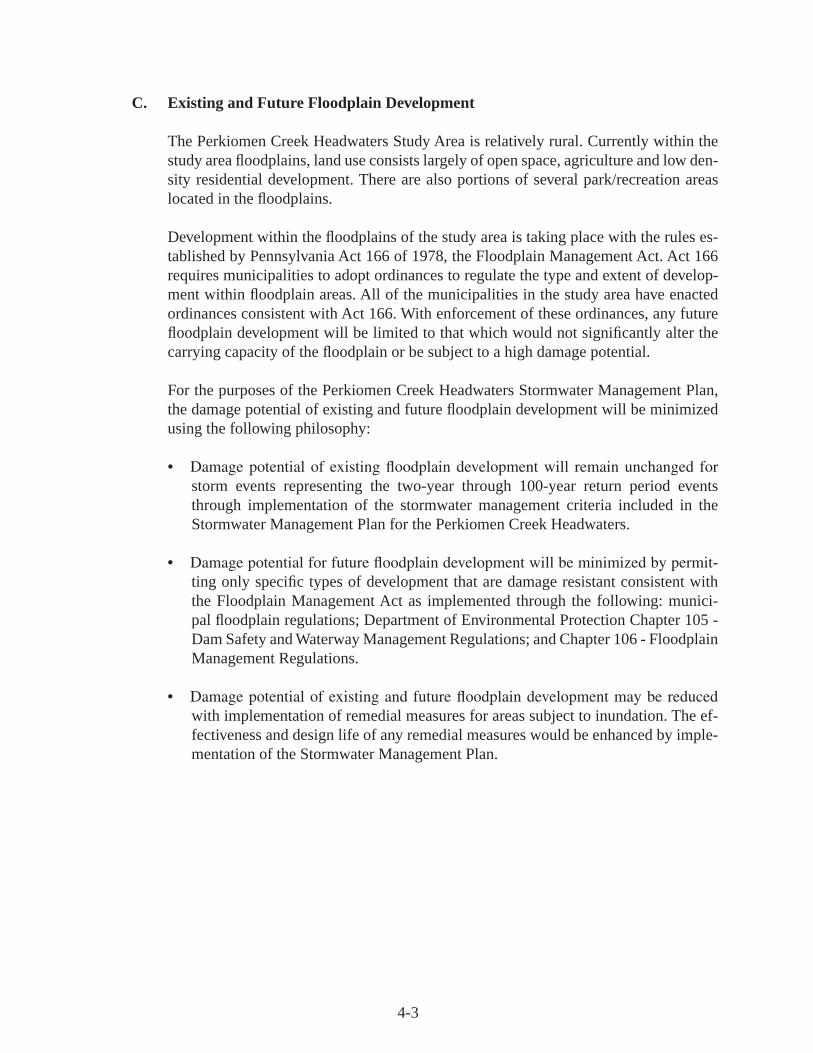
4-3
C. Existing and Future Floodplain Development
The Perkiomen Creek Headwaters Study Area is relatively rural. Currently within the study area floodplains, land use consists largely of open space, agriculture and low den-sity residential development. There are also portions of several park/recreation areas located in the floodplains.
Development within the floodplains of the study area is taking place with the rules es-tablished by Pennsylvania Act 166 of 1978, the Floodplain Management Act. Act 166 requires municipalities to adopt ordinances to regulate the type and extent of develop-ment within floodplain areas. All of the municipalities in the study area have enacted ordinances consistent with Act 166. With enforcement of these ordinances, any future floodplain development will be limited to that which would not significantly alter the carrying capacity of the floodplain or be subject to a high damage potential.
For the purposes of the Perkiomen Creek Headwaters Stormwater Management Plan, the damage potential of existing and future floodplain development will be minimized using the following philosophy: • Damagepotentialofexistingfloodplaindevelopmentwill remainunchanged for
storm events representing the two-year through 100-year return period events through implementation of the stormwater management criteria included in the Stormwater Management Plan for the Perkiomen Creek Headwaters.
• Damagepotentialforfuturefloodplaindevelopmentwillbeminimizedbypermit-
ting only specific types of development that are damage resistant consistent with the Floodplain Management Act as implemented through the following: munici-pal floodplain regulations; Department of Environmental Protection Chapter 105 - Dam Safety and Waterway Management Regulations; and Chapter 106 - Floodplain Management Regulations.
• Damagepotentialofexistingandfuturefloodplaindevelopmentmaybereducedwith implementation of remedial measures for areas subject to inundation. The ef-fectiveness and design life of any remedial measures would be enhanced by imple-mentation of the Stormwater Management Plan.

4-4

5-1
CHAPTER 5. PERKIOMEN CREEK HEADWATERS EXISTING STORM DRAINAGE PROBLEM AREAS AND SIGNIFICANT OBSTRUCTIONS
A. Existing Storm Drainage Problem Areas
An important goal of Act 167 is to prevent any existing storm drainage problem areas from getting worse. The first step toward that goal is to identify the existing problem areas. Each municipality in the Perkiomen Creek Headwaters was provided an oppor-tunity to document the existing drainage problems within its borders. This yielded the documentation of a total of 23 existing drainage problems in the study area. The type of problem identified was typically street and/or property flooding. Figure 10 is a map of the Perkiomen Creek Headwaters indicating the storm drainage problem areas identi-fied as part of the Stormwater Management Plan. The problem areas on Figure 10 are number coded and keyed to the problem area descriptions presented in Table 10. The “Subarea” and “Reach” columns in Table 10 refer to the location of the problem areas relative to the study area breakdown for modeling purposes. A subarea is the smallest unit of a watershed for which runoff values have been calculated. A reach is the swale, channel, or stream segment which drains a particular subarea. Note that 16 of the drain-age problems are on identified reaches indicating that peak runoff values are readily available from the modeling process for these problem areas. These runoff values could be used as input for design of remedial facilities.
The final column in Table 10 was provided to list generalized solutions suggested by municipal representatives. Proposed solutions listed generally include ideas which are readily apparent to the municipal representatives for the less complicated problem ar-eas. For certain other problem areas, the solutions are not quite so apparent and may require detailed engineering evaluations to determine the most cost-effective solution.
B. Significant Obstructions
An obstruction in a watercourse can be defined borrowing from Chapter 105 of DEP’s Rules and Regulations as follows:
“Any dike, bridge, culvert, wall, wingwall, fill, pier, wharf, embankment, abut-ment, or other structure located in, along, or across or projecting into any…chan-nel or conveyance of surface water having defined bed and banks, whether natural or artificial, with perennial or intermittent flow.”
Using the above definition, 82 obstructions have been observed within the Perkiomen Creek Headwaters. Of these obstructions, 51 were located within the public right-of-way and were able to be measured in the field. For each of these, an estimated flow capacity has been calculated. For the purposes of Act 167, it is necessary to refine the list of obstructions to include only those obstructions which are “significant” on a wa-tershed basis. For the Perkiomen Creek Headwaters Stormwater Management Plan, the following distinction has been used:

5-2
MAC
UN
GIE
ALB
UR
TIS
UP
PE
RSA
UC
ON
LOW
ER
MA
CU
NG
IE
LOW
ERM
ILFO
RD
UPP
ERM
ILFO
RD
CH
UR
CH
GUN CLUB RD
LIMEPORT
LOCUST VALLEY
KIN
GS
IND
IAN
C
REEK
RD
BUC
KEYE
BLUE
LIMEPORT
ST
RD
HWY
HWY
LIM
EP
OR
T
PIKE
RD
PIKE
RD
RD
PALM
MAI
N
R
D
PO
WD
ER
SPIN
NERS T OWN RD
LON
GS
WAMP RD
VERA CRUZ RD
FRA
NK
LIN
ST
WE
ST S
TA
T E S
T
RD
KINGS
RD
CH
UR
CH
LEH
IGH
ST
PETE
RS
RDVALLEY
VIE
W
BRUN
NER RD
ALB
UR
TIS
R
D
CH
UR
CH
SWEETWOOD D
R
BELL GATE
LIM
EP
OR
T
BE
VE
RL
Y
HIL
LS
RD
RD
ZIO
NSV
ILLE
RD
MAIN
RD
MILL R
D
SA
INT
V ERA CRUZ
RD
S P R IN G C R E E K RD
ST
SEISHOLT
ZVILLE
R
D
SIG
MUND R
D
GU
N
C
LUB
RD
476
Sigm
und
Lim
epor
t
Vera
Cru
z
Kras
sdal
e
Hos
ensa
ck
Zion
svill
e
Shim
ervi
lle
Milf
ord
Park Po
wde
rVa
lley
Locu
stVa
lley
Dilli
nger
ville
Cen
trevi
lle
Cor
ning
Old
Zio
nsvi
lle
Car
lH
ill
Hos
ensa
ckSt
atio
n
Dilli
nger
Stat
ion
Tunn
elH
ill
Furn
ace
Hill
Mill
Hill
Beve
rlyH
ills
Seis
holtz
ville
Har
lem
HE
RE
FOR
D
LON
GS
WA
MP
UP
PE
RH
AN
OV
ER
MIL
FOR
D
63
79
8
542
1
22
1719
23
18
21
2016
15
14
1312
1110
LEH
IGH
VA
LLEY
PLA
NN
ING
CO
MM
ISSI
ON
961
Mar
con
Boul
evar
d, S
uite
310
Alle
ntow
n, P
A 1
8109
-936
8(6
10) 2
64-4
544
LVPC
03,
000
6,00
09,
000 Fe
et
Sour
ce: L
ehig
h Va
lley
Pla
nnin
g C
omm
issi
on
*See
Tab
le 1
0 fo
r inf
orm
atio
n ab
out e
ach
prob
lem
are
a.
FIG
UR
E 10
P ER
KIO
MEN
CR
EEK
HEA
DW
ATER
SST
OR
M D
RA
INA
GE
PRO
BLE
M A
REA
MA
P
Dra
inag
e Pr
oble
m L
ocat
ion
Stud
y Ar
ea B
ound
ary
Maj
or R
oads
Min
or R
oads
Oth
er R
oads
Rai
lroad
sM
unic
ipal
ity B
ound
arie
sC
ount
y Bo
unda
ries
Stre
ams

5-3
TA
BL
E 1
0P
ER
KIO
ME
N C
RE
EK
HE
AD
WA
TE
RS
STO
RM
DR
AIN
AG
E P
RO
BL
EM
AR
EA
S
No.
Loc
atio
nM
unic
ipal
ity
Pro
blem
Des
crip
tion
Suba
rea
No.
Rea
ch N
o.P
ropo
sed
Solu
tion
1Sa
lem
Bib
le C
hurc
h R
oad
near
Si
gmun
d R
oad
Upp
er M
ilfor
d T
wp.
Roa
dway
flo
odin
g5
4U
pgra
de d
rain
age
faci
lity
2Si
gmun
d R
oad
near
Sal
em B
ible
C
hurc
h R
oad
Upp
er M
ilfor
d T
wp.
Roa
dway
flo
odin
g5
4U
pgra
de d
rain
age
faci
lity
3Si
gmun
d R
oad
near
Yea
kels
Mill
R
oad
Upp
er M
ilfor
d T
wp.
Roa
dway
flo
odin
g5
-U
pgra
de d
rain
age
faci
lity
4Y
eake
ls M
ill R
oad
near
Sig
mun
d R
oad
Upp
er M
ilfor
d T
wp.
Roa
dway
flo
odin
g5
4U
pgra
de d
rain
age
faci
lity
5Y
eake
ls M
ill R
oad
near
Che
stnu
t St
reet
Upp
er M
ilfor
d T
wp.
Roa
dway
flo
odin
g7
6U
pgra
de d
rain
age
faci
lity
678
01 C
hest
nut S
tree
tU
pper
Milf
ord
Tw
p.R
oadw
ay f
lood
ing
8-
Mai
nten
ance
and
pos
sibl
e up
slop
e st
orm
wat
er B
MP
772
73 S
aint
Pet
ers
Roa
dU
pper
Milf
ord
Tw
p.R
oadw
ay f
lood
ing
109
Upg
rade
dra
inag
e fa
cilit
y
8Fu
rnac
e H
ill R
oad
near
Ind
ian
Cre
ek
Roa
dU
pper
Milf
ord
Tw
p.R
oadw
ay f
lood
ing
109
Upg
rade
dra
inag
e fa
cilit
y
9In
dian
Cre
ek R
oad
near
Fur
nanc
e H
ill
Roa
dU
pper
Milf
ord
Tw
p.R
oadw
ay f
lood
ing
1110
Upg
rade
dra
inag
e fa
cilit
y
10Sh
antz
Roa
d ne
ar I
ndia
n C
reek
Roa
dU
pper
Milf
ord
Tw
p.R
oadw
ay f
lood
ing
1312
Add
ition
al c
ulve
rt p
ipes
and
up
grad
e dr
aina
ge f
acili
ties
11T
ollg
ate
Roa
d ea
st o
f Sw
amp
Roa
dU
pper
Milf
ord
Tw
p.R
oadw
ay f
lood
ing
1413
Upg
rade
dra
inag
e fa
cilit
y
1265
74 C
hest
nut S
tree
tU
pper
Milf
ord
Tw
p.R
epet
itive
flo
od d
amag
e to
pro
pert
y14
-N
one
prop
osed
13Po
wde
r V
alle
y R
oad
near
Bat
man
R
oad
Upp
er M
ilfor
d T
wp.
Roa
dway
flo
odin
g14
13U
pgra
de d
rain
age
faci
lity
1447
90 K
ohle
r R
oad
Upp
er M
ilfor
d T
wp.
Roa
dway
flo
odin
g20
17U
pgra
de d
rain
age
faci
lity
15R
ock
Roa
d ne
ar S
cout
Roa
dU
pper
Milf
ord
Tw
p.R
oadw
ay f
lood
ing
2221
Inst
all a
dditi
onal
cul
vert
pip
es

5-4
TA
BL
E 1
0P
ER
KIO
ME
N C
RE
EK
HE
AD
WA
TE
RS
STO
RM
DR
AIN
AG
E P
RO
BL
EM
AR
EA
S
No.
Loc
atio
nM
unic
ipal
ity
Pro
blem
Des
crip
tion
Suba
rea
No.
Rea
ch N
o.P
ropo
sed
Solu
tion
16Sc
out R
oad
wes
t of
Kin
g's
Hig
hway
S
Low
er M
ilfor
d T
wp.
Roa
dway
flo
odin
g22
20, 2
1N
one
prop
osed
17Sp
inne
rsto
wn
Roa
d ne
ar S
choo
l H
ouse
Lan
eL
ower
Milf
ord
Tw
p.Fl
oodi
ng d
urin
g m
inor
st
orm
eve
nts
29-
Penn
DO
T c
oord
inat
ion
and
impr
oved
dra
inag
e fa
cilti
es18
Scho
ol H
ouse
Lan
e ne
ar S
prin
g R
oad
Low
er M
ilfor
d T
wp.
Roa
dway
flo
odin
g33
32N
one
prop
osed
19L
imep
ort P
ike
bew
een
Spri
ng R
oad
and
Milk
y W
ayL
ower
Milf
ord
Tw
p.R
oadw
ay f
lood
ing
33-
Penn
DO
T c
oord
inat
ion
and
impr
oved
dra
inag
e fa
cilti
es20
Schu
ltz B
ridg
e R
oad
near
Buh
man
R
oad
Low
er M
ilfor
d T
wp.
Roa
dway
flo
odin
g35
34N
one
prop
osed
21W
est M
ill H
ill R
oad
near
Yea
kel
Roa
dL
ower
Milf
ord
Tw
p.R
oadw
ay f
lood
ing
38-
Non
e pr
opos
ed
22C
orni
ng R
oad
belo
w C
row
n L
ane
Upp
er M
ilfor
d T
wp.
Seve
re e
rosi
on40
-A
dditi
onal
fac
ilitie
s an
d po
ssib
le
upsl
ope
BM
Ps23
Kin
g's
Hig
hway
S a
bove
Kra
ussd
ale
Roa
dL
ower
Milf
ord
Tw
p.R
oadw
ay f
lood
ing
5049
Penn
DO
T c
oord
inat
ion
and
impr
oved
dra
inag
e fa
cilti
es

5-5
An obstruction in a stream or channel shall be deemed “significant” if it has an estimated flow capacity which is less than the 10-year return period peak flow from the calibrated hydrologic model prepared as part of the Act 167 Plan.
Using the refined definition, 24 significant obstructions have been identified within the Perkiomen Creek Headwaters and are shown in Figure 11. A list of the significant ob-structions is presented in Table 11 which indicates the obstruction number, description, municipality, and approximate flow capacity. Obstruction capacities have been esti-mated based on their upstream geometry as measured, bed slope and roughness factors (where applicable) consistent with the calibrated HEC-HMS models for the watershed in the Perkiomen Creek Headwaters. The estimates reflect reasonable flow capacities of the obstructions for “open channel” flow conditions (i.e. where the obstructions are not submerged). These estimated capacities are for illustration only and shall not be used as absolute capacities for stormwater management decisions. The capacity of any ob-struction when used to meet the requirements of this Plan shall be based upon a detailed hydraulic investigation including possible headwater and tailwater conditions, obstruc-tion configuration (abutments, wingwalls, piers, etc.), field measured slopes, and other conditions that may affect the capacity for design flows.
There are 10 areas where identified significant obstructions coincide with documented storm drainage problem areas as noted in Table 11. The importance of the identified significant obstructions and problem areas as part of the development of a runoff con-trol strategy is discussed in Chapter 8.

5-6
MAC
UN
GIE
ALB
UR
TIS
UP
PE
RSA
UC
ON
LOW
ER
MA
CU
NG
IE
LOW
ERM
ILFO
RD
UPP
ERM
ILFO
RD
CH
UR
CH
RD
GUN CLUB RD
LIMEPORT
LOCUST VALLEY
KIN
GS
IND
IAN
CREEK
RD
BUC
KEYE
BLUE
LIMEPORT
ST
RD
HWY
HWY
LIM
EP
ORT
PIKE
RD
PIKE
RD
RD
PALM
MAI
N
R
D
PO
WDER
SPI
NNERS T OWN RD
LON
GS
WAMP RD
VERA CRUZ RD
FRAN
KLI
N
ST
WE
ST
ST A
TE S
T
MERTZTO
WN
RD
KINGS
RD
CH
UR
CH
LEH
IGH
ST
PETE
RS
RD VALLEY
VIE
W
BRUN
NER RD
ALB
UR
TIS
R
D
CH
UR
CH
SWEETWOOD D
R
BELL GATE
LIM
EP
OR
T
BE
VE
RL
Y
HIL
LS
RD
RD
ZIO
NS
VILL
E RD
MAIN
R
D
MILL R
D
SA
INT
V ERA CRUZ
RD
S P R IN G C R E E K R D
ST
SEISHOLTZVILL
E
RD
SIG
MUND R
D
GU
N
C
LUB
RD
476
Sigm
und
Lim
epor
t
Vera
Cru
z
Kras
sdal
e
Hos
ensa
ck
Zion
svill
e
Shim
ervi
lle
Milf
ord
Park Po
wde
rVa
lley
Locu
stVa
lley
Dilli
nger
ville
Cen
trevi
lle
Cor
ning
Old
Zio
nsvi
lle
Car
lH
ill
Hos
ensa
ckSt
atio
n
Dilli
nger
Stat
ion
Tunn
elH
ill
Furn
ace
Hill
Mill
Hill
Beve
rlyH
ills
Seis
holtz
ville
Har
lem
HE
RE
FOR
D
LON
GS
WA
MP
UP
PE
RH
AN
OV
ER
MIL
FOR
D
69
87
54
32
1
2316
17 1918
242015
21
22
1314
10
1112
LEH
IGH
VA
LLEY
PLA
NN
ING
CO
MM
ISSI
ON
961
Mar
con
Boul
evar
d, S
uite
310
Alle
ntow
n, P
A 1
8109
-936
8(6
10) 2
64-4
544
LVPC
03,
000
6,00
09,
000 Fe
et
Sour
ce: L
ehig
h Va
lley
Pla
nnin
g C
omm
issi
on
*See
Tab
le 11
for i
nfor
mat
ion
abou
t eac
h ob
stru
ctio
n.
Sign
ifica
nt O
bstru
ctio
n Lo
catio
n
Stud
y Ar
ea B
ound
ary
Maj
or R
oads
Min
or R
oads
Oth
er R
oads
Rai
lroad
sM
unic
ipal
ity B
ound
arie
sC
ount
y Bo
unda
ries
Stre
ams
FIG
UR
E 11
P ER
KIO
MEN
CR
EEK
HEA
DW
ATER
SSI
GN
IFIC
AN
T O
BST
RU
CTI
ON
S
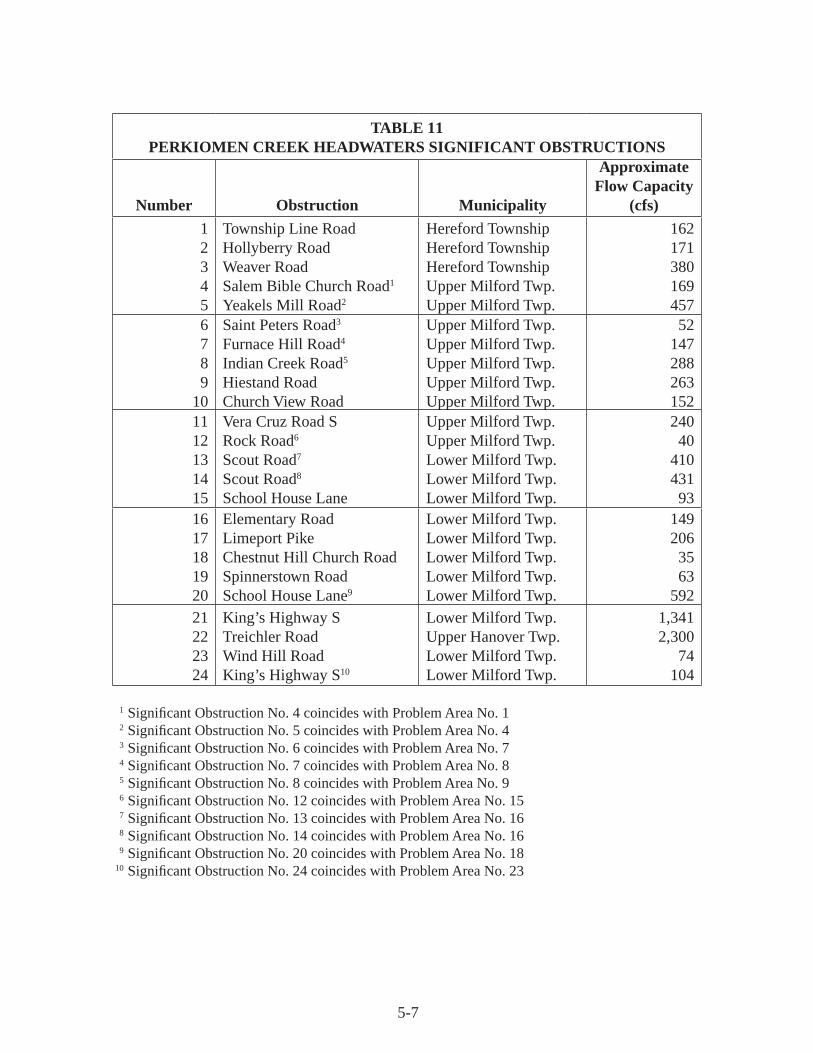
5-7
TABLE 11PERKIOMEN CREEK HEADWATERS SIGNIFICANT OBSTRUCTIONS
Number Obstruction Municipality
Approximate Flow Capacity
(cfs)
12345
Township Line RoadHollyberry RoadWeaver RoadSalem Bible Church Road1
Yeakels Mill Road2
Hereford TownshipHereford TownshipHereford TownshipUpper Milford Twp.Upper Milford Twp.
162171380169457
6789
10
Saint Peters Road3
Furnace Hill Road4
Indian Creek Road5
Hiestand RoadChurch View Road
Upper Milford Twp.Upper Milford Twp.Upper Milford Twp.Upper Milford Twp.Upper Milford Twp.
52147288263152
1112131415
Vera Cruz Road SRock Road6
Scout Road7
Scout Road8
School House Lane
Upper Milford Twp.Upper Milford Twp.Lower Milford Twp.Lower Milford Twp.Lower Milford Twp.
24040
41043193
1617181920
Elementary RoadLimeport PikeChestnut Hill Church RoadSpinnerstown RoadSchool House Lane9
Lower Milford Twp.Lower Milford Twp.Lower Milford Twp.Lower Milford Twp.Lower Milford Twp.
1492063563
59221222324
King’s Highway STreichler RoadWind Hill RoadKing’s Highway S10
Lower Milford Twp.Upper Hanover Twp.Lower Milford Twp.Lower Milford Twp.
1,3412,300
74104
1 Significant Obstruction No. 4 coincides with Problem Area No. 1 2 Significant Obstruction No. 5 coincides with Problem Area No. 4 3 Significant Obstruction No. 6 coincides with Problem Area No. 7 4 Significant Obstruction No. 7 coincides with Problem Area No. 8 5 Significant Obstruction No. 8 coincides with Problem Area No. 9 6 Significant Obstruction No. 12 coincides with Problem Area No. 15 7 Significant Obstruction No. 13 coincides with Problem Area No. 16 8 Significant Obstruction No. 14 coincides with Problem Area No. 16 9 Significant Obstruction No. 20 coincides with Problem Area No. 18 10 Significant Obstruction No. 24 coincides with Problem Area No. 23

5-8

6-1
CHAPTER 6. STORMWATER RUNOFF CONTROL TECHNIQUES
Chapter 3 identified the impacts of land development on stormwater runoff and documented the need to control those impacts with sound stormwater management techniques. Chapter 8 presents the performance standards for runoff control for new development applicable to the various watershed areas necessary to achieve the sound runoff management from a watershed perspective. Therefore, Chapter 3 defines the problem and Chapter 8 identifies the necessary end product. This chapter will identify the runoff control techniques available as the “means” to create the desired end product to mitigate the runoff impacts of new development.
The runoff control techniques presented in Sections A, B and C are “structural” stormwater management controls, meaning that they are physical facilities for runoff abatement. “Non-structural” controls, described in Section D, refer to land use management techniques geared towards minimizing storm runoff impacts through control of the type and extent of new development. The Perkiomen Creek Headwaters Stormwater Management Plan is based on the assumption that new development of various types will occur throughout the study area (except as regulated by floodplain regulations) and that structural controls will be required to minimize the runoff implications of the new development.
Structural controls for managing storm runoff can be categorized as volume controls, rate controls, or water quality controls. Volume controls are designed to allow a certain amount of the total rainfall to infiltrate into the ground. Greater opportunity for infiltration can be pro-vided by minimizing the amount of impervious cover associated with development, by drain-ing impervious areas over lawns and other pervious cover or into specific infiltration devices, and by using grassed swales or channels to convey runoff in lieu of storm sewer systems. Rate controls are designed to regulate the peak discharge of runoff by providing temporary storage of runoff which otherwise would leave the site at an unacceptable peak value. Rate controls, much more so than volume controls, are adaptable to regional considerations for controlling much larger watershed areas than one development site. Water quality controls are designed primarily to reduce the impact of high sediment, pollutant, and/or nutrient loads on receiving water bodies. In some cases, water quality controls can provide some peak rate attenuation, but it is unlikely that they would be able to act as the sole control for a site; other rate and/or volume controls would still be required.
Presented in Sections A, B, and C is a discussion of the various volume and rate controls available for implementation on a development site (or region). The discussion includes a physical description of the control, the applicability of the particular control, and its advan-tages, disadvantages, and maintenance requirements. The runoff control(s) most applicable to a development site may vary widely depending upon site characteristics such as topogra-phy, soils, geology, water table, etc., the type of development proposed and the applicable performance standard which the controls must meet. The developer should consider all these factors in designing the control philosophy.
The runoff control technique information presented herein has been derived primarily from three sources: namely, (1) New Jersey Stormwater Quantity/Quality Management Manual, February 1981, prepared for the New Jersey Department of Environmental Protection by the

6-2
Delaware Valley Regional Planning Commission; (2) Allegheny County Act 167 Pilot Storm-water Management Plans – Girty’s Run, Pine Creek, Deer Creek, and Squaw Run, January 1982, prepared for the Allegheny County Department of Planning by Green International, Inc. and Walter B. Satterthwaite, Inc.; and (3) Pennsylvania Stormwater Best Practices Man-ual, December 2006, by the Pennsylvania Department of Environmental Protection.
A. Volume Controls
The increase in runoff volume with development, and the management of that increased volume, is a key element in sound runoff management at the watershed level. Any vol-ume controls implemented on-site for a development would help achieve the goals of the watershed plan. As stated above, the basis for volume control is the provision of a greater opportunity for infiltration of rainfall/runoff into the ground. This opportunity may be provided in a passive sense by simply draining impervious areas over pervious areas and relying on the natural infiltrative capabilities of the pervious areas. Con-versely, the opportunity for infiltration could be provided in an active sense by directing runoff into infiltration structures designed to remove a given volume of runoff. A dif-ferent type of runoff control is based upon the substitution of porous or semi-pervious materials in place of conventional impervious surfaces. Other controls may be based on storing runoff for later use (irrigation, janitorial work, etc.). Also, there are controls that focus on restoring the natural infiltration capacity of soils that have been previ-ously impacted by development. Any or all of these approaches may be applicable to a particular development site.
Volume controls may be used in conjunction with rate controls since volume controls alone would generally not provide complete runoff abatement. The volume controls would, however, provide the benefit of decreasing the size and cost of the rate control facility and would be used to minimize the total cost of on-site runoff control.
1. Pervious Pavement
a.) Description
Pervious pavement consists of a permeable surface course underlain by a uniformly-graded stone bed which provides temporary storage for peak rate control and promotes infiltration. The surface course may consist of porous asphalt, porous concrete, or various porous structural pavers laid on uncompacted soil.
b.) Applicability
Pervious pavement systems can be used in areas such as parking lots, walkways, playgrounds, alleyways, plazas, tennis courts, and other similar uses.

6-3
c.) Advantages and Disadvantages
ADVANTAGES
• Doesnotrequireadditionallandspace.
• Can reduce size, or possibly eliminate, other drainage facilities viavolume control.
• Groundwaterrecharge.
• Improvedpreservationofroadsidevegetation.
• Flexible measure to provide stormwater detention in both new andexisting development.
• Safetyimprovementssuchassuperiorskidresistanceduringwetcon-ditions, accelerated snow melting and a reduced risk of the formation of “black ice”, and enhanced visibility of pavement markings.
• Providespavementdrainagewithouttheneedforacrownslope,thusreducing costs and puddling.
• Lessnoisythanconventionalpavements.
• Lesscostlyovertimethanconventionalpavementsformostapplica-tions, due to lower maintenance costs.
DISADVANTAGES
• Open-graded mixtures may be more prone to water-stripping thanconventional dense aggregate mixtures.
• Increased pressure head on pavement from subsurface drainage onsteep slopes.
• Cloggingmaybeaproblem.
• Waterthatfreezeswithintheperviouspavementtakeslongertothawand offsets infiltration.
• Motoroildrippingsandgasolinemaypollutegroundwater.
• Costsmoretoinstallthantraditionalpavement.
• Locationslimitedbysiteslope,soilpermeability,andunderlyingbed-rock.

6-4
d.) Maintenance Requirements
Maintenance involves removing debris too coarse to be washed through the pavement system; vacuuming to remove particles that could clog the void space; and patching the surface as needed. Since porous pavements require no more repairs than conventional pavements, maintenance problems can be generally confined to better “housekeeping” and “preventive maintenance” practices and more efficient and effective street cleaning procedures.
2. Infiltration Basin
a.) Description
An infiltration basin is a shallow impoundment that stores and infiltrates runoff over a level, uncompacted, (preferably undisturbed) area with rela-tively permeable soils.
b.) Applicability
This control may be used where the subsoil is sufficiently permeable to al-low a reasonable rate of infiltration and where the water table and bedrock are sufficiently lower than the design depth of the facility. It is not appli-cable where high concentrations of suspended materials are contained in the runoff without some type of filtering mechanism.
c.) Advantages and Disadvantages
ADVANTAGES
• Can reduce size, or possibly eliminate, other drainage facilities viavolume control.
• Groundwaterrecharge.
• Runoffwaterqualityisimprovedbytheexistingnaturalprocessesinthe soil mantle.
• Mayhelpreducelocalfloodpeaks.
DISADVANTAGES
• Locationslimitedbysoilpermeabilityandunderlyingbedrock.
• Vulnerabletocloggingfromsedimentdeposition.

6-5
d.) Maintenance Requirements
Catch basins and inlets (upgradient of infiltration basin) should be inspected and cleaned at least two times per year and after runoff events. The vegeta-tion along the surface of the infiltration basin should be maintained in good condition, and any bare spots re-vegetated as soon as possible. Inspect the basin after runoff events and make sure that runoff drains down within 72 hours. Also inspect for accumulation of sediment, damage to outlet control structures, erosion control measures, signs of water contamination/spills, and slope stability in the berms. The original cross-section should be re-stored when necessary. Accumulated sediment should be removed as neces-sary.
3. Subsurface Infiltration Bed, Infiltration Trench, and Dry Well/Seepage Pit
a.) Description
Subsurface infiltration beds provide temporary storage and infiltration of stormwater runoff by placing storage media of varying types beneath the proposed surface grade.
An infiltration trench is a perforated pipe in a stone filled trench with a level bottom. An infiltration trench may be used as part of a larger storm sewer system, such as a relatively flat section of storm sewer, or it may serve as a portion of a stormwater system for a small area, such as a portion of a roof or a single catch basin.
A dry well, or seepage pit, is a variation on an infiltration system that is designed to temporarily store and infiltrate rooftop runoff.
b.) Applicability
As with infiltration basins, these controls may be used where the subsoil is sufficiently permeable to allow a reasonable rate of infiltration and where the water table and bedrock are sufficiently lower than the design depth of the facility. It is not applicable where high concentrations of suspended materials are contained in the runoff without some type of filtering mecha-nism.
c.) Advantages and Disadvantages
ADVANTAGES
• Mayhelpreducelocalfloodpeaks.
• Groundwaterrecharge.

6-6
• Createsusableopenspaceon-site.
• Usuallyunaffectedbycoldweather.
• Largesubsurfaceinfiltrationbedscouldbecapableofreducingpeakand volume of runoff without additional rate controls.
• Infiltrationtrenchescancombinetheconveyancesystemwithastorm-water management control by increasing travel time and infiltrating runoff.
DISADVANTAGES
• Locationslimitedbysoilpermeabilityandunderlyingbedrock.
• Vulnerabletocloggingfromsedimentdeposition.
• Maintenanceisdifficultifthefacilitybecomesclogged.
d.) Maintenance Requirements
All catch basins and inlets should be inspected and cleaned at least 2 times per year. The overlying vegetation should be maintained in good condition, and any bare spots re-vegetated as soon as possible. Vehicular access on infiltration areas should be prohibited, and care should be taken to avoid excessive compaction by mowers. If access is needed, use of permeable, turf reinforcement should be considered.
4. Rain Garden or Bioretention
a.) Description
A rain garden (also called bioretention) is an excavated shallow surface depression planted with specially selected native vegetation to capture and treat runoff. Properly designed bioretention techniques mimic natural eco-systems through species diversity, density and distribution of vegetation, and the use of native species, resulting in a system that is resistant to insects, disease, pollution, and climatic stresses.
b.) Applicability
Rain gardens are extremely flexible and can be used in almost any location on any site. If soils are not sufficiently permeable to allow adequate drain-age, an underdrain can be used to control overflow.

6-7
c.) Advantages and Disadvantages
ADVANTAGES
• Canbemorecosteffectivethantraditionallandscaping.
• Canbalancenicelywithotherstructuralmanagementsystems,includ-ing porous asphalt parking lots, infiltration trenches, as well as non-structural stormwater controls.
• Plantrootsystemscanincreaseinfiltrationofrunoff.
• Groundwaterrecharge.
• Reducesstormwatertemperatureimpacts.
• Filters pollutants through soil particles (which trap pollutants) andplant material (which takes up pollutants).
• Enhancessiteaesthetics.
DISADVANTAGES
• Generally small in surface area and depth, and are not practical tocontrol more frequent (greater than the 2-year) storm events.
• Mayrequiremanualwateringindryperiods.
d.) Maintenance Requirements
While vegetation is being established, pruning and weeding may be required. Detritus may also need to be removed every year. Perennial plantings may be cut down at the end of the growing season. Mulch should be re-spread when erosion is evident and replenished as needed. Once every 2 to 3 years the entire area may require mulch replacement. They should be inspected at least 2 times a year for sediment buildup, erosion, vegetative conditions, etc. Trees and shrubs should be inspected twice per year to evaluate health. During periods of drought, bioretention areas may require watering.
5. Vegetated Roofs
a.) Description
A vegetated roof cover is a veneer of vegetation that is grown on and com-pletely covers an otherwise conventional flat or pitched roof, endowing the roof with hydrologic characteristics that more closely match surface veg-

6-8
etation than the roof. The overall thickness of the veneer may range from 2 to 6 inches and may contain multiple layers, consisting of waterproofing, synthetic insulation, non-soil engineered growth media, fabrics, and syn-thetic components. Vegetated roof covers can be optimized to achieve water quantity and water quality benefits. Through the appropriate selection of materials, even thin vegetated covers can provide significant rainfall reten-tion and detention functions. Since the purpose of most vegetated roofs is runoff mitigation, they are usually not irrigated. Plants should be selected which will create a vigorous, drought-tolerant ground cover.
b.) Applicability
Vegetated roofs can be installed on any flat roof, or a pitched roof with a slope of less than 30 degrees. The dead load bearing capacity of the roof must also be analyzed to assure that the structure can support the weight of a saturated vegetated roof.
c.) Advantages and Disadvantages
ADVANTAGES
• Doesnotrequireadditionallandspace.
• Canmimicpre-developmenthydrologicalconditions,particularlyforsmall storms.
• Enhancessiteaesthetics.
• Improvestheefficiencyofdownstreaminfiltrationfacilities.
DISADVANTAGES
• Requiresconsiderationofthebuilding’sstructuralcapacitytosupportthe facility.
• Providesnoopportunityforgroundwaterrecharge.
• Pitchedroofsarelessdesirableandrequireadditionalmeasuresagainstsliding.
• Couldincreasetheriskofroofleaksifnotproperlyinstalled.
d.) Maintenance Requirements
During the plant establishment period, periodic irrigation may be required, and three to four visits to conduct basic weeding, fertilization, and in-fill

6-9
planting are recommended. Thereafter, only two annual visits for inspection and light weeding should be needed.
6. Landscape Restoration
a.) Description
Landscape restoration is the general term used for actively sustainable land-scaping practices that are implemented outside of riparian (or other spe-cially protected) buffer areas. Landscape restoration includes the restoration of forest (i.e. re-forestation) and/or meadow and the conversion of turf to meadow.
b.) Applicability
Landscape restoration can be used in any open area. Landscape restoration works to restore land to its original cover (or possibly more pervious cover if meadow is converted to forest), and to restore the infiltration capacity of the area. This control is most applicable for retrofitting projects.
c.) Advantages and Disadvantages
ADVANTAGES
• Meadow areas require little maintenance compared to conventionalturf lawns.
• Meadowandforestareasrequirelesslong-termfinancialinvestmentthan conventional lawns, due to reduced or non-existent mowing and fertilizer costs.
• Groundwaterrecharge.
DISADVANTAGES
• Nativegrassesandflowersestablishmoreslowlythanweedsandturfgrass, so establishing a meadow condition can be difficult and mainte-nance-intensive.
• Higherinstallationcoststhanconventionalturflawns.
• Cantakeseveralyearsbeforeadequatecoverisestablished.

6-10
d.) Maintenance Requirements
Forest restoration areas planted with a cover crop can be expected to require annual mowing and herbicide applicant to control invasives in the first 2-5 years, or until the tree canopy begins to form. Meadow areas should be care-fully monitored for weed growth in the first few years. Afterwards, seasonal mowing or burning may be required.
7. Soil Amendment and Restoration
a.) Description
Soil amendment and restoration is the process of improving disturbed soils and low organic soils by restoring soil porosity and/or adding a soil amend-ment, such as compost, for the purpose of reestablishing the soil’s long-term capacity for infiltration and pollutant removal.
b.) Applicability
This control can be used on any part of a construction site that will become compacted during the land development process due to material storage or heavy construction vehicle traffic.
c.) Advantages and Disadvantages
ADVANTAGES
• Decreasesrunoffvolumeoverextensivelygradedorotherwiseheavilytrafficked areas of the site through restoration of the soil’s porosity.
• Soilamendmentsincreasethenutrientlevelofthesoil,whichbenefitsvegetative growth.
• Groundwaterrecharge.
DISADVANTAGES
• Long-termmaintenanceofamendedsoilsislargelyunknown.Com-post-amended soils may need to be re-composted on a regular basis.
• Tillingisexpensive.
• Wetsoilsarenot suitable for tilling,as theyare incapableofbeingbroken up by the tines on the tilling equipment.

6-11
• Soil restoration is not suitable for sites with very steep slopes(30%+).
d.) Maintenance Requirements
The soil restoration process may need to be repeated over time, due to com-paction by use and/or settling.
8. Runoff Capture and Re-use
a.) Description
Capture and re-use encompasses a wide variety of water storage techniques designed to “capture” precipitation or runoff, hold it for a period of time, and re-use the water. The facility may also be designed as a detention facil-ity with a slow release over time.
b.) Applicability
Since cisterns, rain barrels, and storage media are not dependent on physi-ological conditions and their sizes can vary as necessary, they are applicable practically everywhere. Cisterns can be installed beneath paved areas or other structural facilities, within a building, or above the ground.
c.) Advantages and Disadvantages
ADVANTAGES
• Minimalspacerequiredforimplementation,andminimalinterferencewith traffic or people.
• Canbeusedinexistingaswellasnewlydevelopedareas.
• Potentialformultipleusesofstoredrunoff.
• Keepsrunoffon-site,whichwillaffectlocalfloodpeaksinamannersimilar to infiltration.
DISADVANTAGES
• Lesseffectiveincoldweather,sincesystemsmustbeflushedtopre-vent damage resulting from freezing.
• Tohaveanimpactonrunoff,cisternsmusthaveavailablevolumeatthe beginning of a storm event; full cisterns provide no attenuation.

6-12
d.) Maintenance Requirements
Periodic removal of sediment and debris will be necessary to assure maxi-mum operating efficiency. If cistern pumps are employed, routine mainte-nance and inspections will be necessary to minimize failure. Do not allow water to freeze in the storage devices.
9. Vegetated Swales, Vegetated Filter Strips, and Seepage Areas
a.) Description
These controls utilize grassed areas for managing stormwater runoff by us-ing their natural capacity for reducing runoff velocities, enhancing infiltra-tion, and filtering runoff contaminants.
A vegetated swale (or grassed waterway) is a broad, shallow, trapezoidal or parabolic channel, densely planted with a variety of trees, shrubs, and/or grasses. It is designed to attenuate and in some cases infiltrate runoff vol-ume from adjacent impervious surfaces, allowing some pollutants to settle out in the process. Whenever possible, grasses native to the site should be selected for use to ensure acclimation.
Vegetated filter strips are grass buffer areas that sheet flows or surface run-off are directed across to reduce the flow velocity and cause the heavier particles to settle out of the water. This simultaneously enhances the infil-tration of the runoff by passing it over the pervious grass filter. These strips of close growing grasses can be established at the perimeter of disturbed or impervious areas.
Seepage areas are small, grass-covered depressions that surface runoff is directed into to infiltrate the water and filter out particulate contaminants. Seepage areas are constructed by excavating shallow depressions in the land surface or by constructing a system of dikes or berms to temporarily pond water over permeable soils.
b.) Applicability
Mostly applicable in new developments of low to moderate density where the percentage of impervious cover is relatively small. These practices also require that subdivision and site designs respect natural drainage patterns so that they can be modified to accommodate post-development runoff vol-umes. Successful application is dependent upon such factors as steepness of slopes, anticipated runoff volumes, soil conditions, selection of proper grass cover, and proper long-term maintenance.
6-13
c.) Advantages and Disadvantages
ADVANTAGES
• Vegetative swales are less expensive to install than curb and guttersystems.
• Roadsideditcheskeepflowawayfromthestreettherebyreducingthepotential for vehicle hydroplaning.
• Increasedrunofftraveltimeandgroundwaterrecharge.
• Effectivepre-treatmentmethodsforotherfacilities,especiallyinfiltra-tion facilities which are vulnerable to sediments.
DISADVANTAGES
• Mustbelocatedonsufficientlypermeablesoils.
• Vegetativechannelsmayrequiremoremaintenancethancurbandgut-ter systems.
• Streetswithswalesmayrequiremoreright-of-wayandbelesscom-patible with sidewalk systems.
• Roadsideditchesbecomelessfeasibleasthenumberofdrivewayen-trances requiring culverts increases.
• Localsubdivisionordinancesmayrequirecurbsandgutters,somu-nicipalities may have to amend their regulations to allow this prac-tice.
• Swalesandfilterstripscanbeprone toerosion,especiallyonsteepslopes.
• Onlyeffectivewhentreatingsmallareas.
d.) Maintenance Requirements
Vegetated swales require periodic inspections, especially after large storms, to evaluate whether erosion controls are needed, to remove accumulated debris, and to check the condition of the vegetation. Filter strips also re-quire periodic inspection, but it is particularly important to maintain soil porosity. This can be accomplished by periodically removing thatch and/or mechanically aerating the area when necessary. Seepage areas require similar maintenance to vegetated swales and filter strips. Mowing should be

6-14
performed with low ground-pressure equipment and a high blade setting (4 to 6 inches), and only when the area is dry.
B. Rate Controls
The performance standard criteria presented in Chapter 8 are geared towards control-ling the peak rate of runoff after development to a given percentage of the pre-devel-opment peak runoff rate. The bases for establishing the performance standards are the pre-development peak rate, the timing of the pre-development peak with respect to the other watershed areas, and the anticipated increase in volume associated with devel-opment. The volume controls described in Section A will remove a portion of the in-creased volume of runoff and may also help to reduce the peak rate of runoff. However, it is primarily the rate controls which provide the major peak attenuation by storing a large volume of runoff and releasing it at a predetermined slower rate. The various op-tions available for rate control differ only in the location of the runoff storage provided as described below.
1. Detention Basins
a.) Description
Detention basins are impoundments which are designed to store “excess rate” stormwater runoff during a rainfall event and release the stored runoff more slowly. “Excess rate” can be defined as the difference between the un-controlled post-development hydrograph and the design post-development hydrograph as dictated by the performance standard criteria. Detention ba-sins may be designed as either dry or wet impoundments. Dry impound-ments are designed to completely drain after storm events. These include dry detention and extended dry detention facilities. Wet impoundments, or wet ponds, are designed to maintain a permanent pool.
The storage volume required for a detention basin is a function of the change in runoff volume and the pre- and post-development peaks, the performance standard applicable to the site, the extent to which volume controls are used, the outlet structure configuration, and the design storm(s) used.
b.) Applicability
Detention ponds are applicable to any site where rate control is required and sufficient land area exists. Detention basins can be designed for individual site control, or to control runoff from multiple development sites or water-shed areas. A DEP dam permit may be required for a stormwater detention facility.
6-15
c.) Advantages and Disadvantages
ADVANTAGES
• Offersdesignflexibilityforadaptingtoavarietyofuses.
• Pondconstructionisrelativelysimple.
• Mayallowsignificantreductioninthesizeofdownstreamstormdrain-age structures.
• Mayenhancegroundwaterrechargetosomeextent.
• Reducesdownstreamlitteranddebris.
• Wetponds(and,toalesserextent,extendeddrydetentionponds)im-prove runoff quality through settling, filtration, uptake, chemical and biological decomposition, volatilization, and adsorption.
• Wetpondscanprovideaestheticandwildlifebenefits.
DISADVANTAGES
• Duetothepotentialtodischargewarmwater,wetpondsandextendeddry detention basins should be used with caution near temperature sensitive water bodies.
• Consumeslandareathatcannotbedeveloped.
• Possiblesafetyconcerns.
• Site hydrology must be considered to determine if a wet pond canreceive and retain enough flow from rain, runoff, and groundwater to ensure long-term viability. Modifications to the pond in Hydrologic Soil Group (HSG) A and B soils may be required.
• Incarbonatebedrockareas,soildepthandtypemustbeconsideredinthe design to minimize the possibility of sinkhole occurrence.
• Detentionbasinswithimperviousliningdonotprovidegroundwaterrecharge.
d.) Maintenance Requirements
To maintain the design efficiencies of a detention basin, maintenance of the structures and the impoundment areas are essential. Detention basins

6-16
should be inspected at least four times per year and after major storms. Wet ponds should also be inspected after rapid ice breakup. Inspections should assess the vegetation, erosion, flow channelization, bank stability, inlet/out-let conditions, embankment, and sediment/debris accumulation. Pipe inlets and outlets should be inspected for accumulated sediment and debris. Sedi-ment should be removed from the forebay (if applicable) before it occupies 50 percent of the forebay, typically every five to 10 years. The pond drain (if applicable) should also be inspected and tested four times per year. Mea-sures to offset the production of fast-breeding insects should be taken as necessary.
2. Parking Lot and Roof Detention
a.) Description
Areas such as parking lots, rooftops, or other areas that are primarily in-tended for other uses can be designed to temporarily detain stormwater for peak rate mitigation. Generally, detention is achieved through the use of a flow control structure that allows runoff to temporarily pond. In most cases ponding depths are kept less than one foot. In rooftop detention, the control structures should be designed so that no water is ponded for small storms.
b.) Applicability
Portions of large, gently sloped parking lots that can be temporarily used for stormwater storage without significantly interfering with normal vehicle and pedestrian traffic are candidates for parking lot storage. New structures with flat rooftops are most applicable for rooftop storage, although retrofits are possible if specific design requirements are met. Areas such as recessed plazas and athletic fields can be used in a similar fashion.
c.) Advantages and Disadvantages
ADVANTAGES
• Noadditionallandrequirements.
• Cancontributetomaintainingadequatecapacityofdownstreamdrain-age facilities.
• Adaptabletobothnewandoldfacilities.
• Parking lot storage isgenerallyeasy to incorporate intoparking lotdesign and construction.

6-17
• Waterstoredonrooftopshashighpotentialforre-use.
• Rooftopstoragedoesnotcauseanyaestheticorsafetyconcernsandcauses minimal interference with traffic and people.
• Lowcostandlowmaintenance.
DISADVANTAGES
• Provideslittlevolumecontrolandnegligiblewaterqualitybenefits.
• Pondingareasarepronetoicingincoldweather.
• Parkinglotstoragemaybeapublicinconvenience.
• Rooftopstoragebenefitstotheownermayoutweighthecosts,sinceleaks can cause damage to buildings and their contents.
• Modifications to the building code may be required before rooftopstorage can be used.
d.) Maintenance Requirements
Maintenance activities should include semiannual inspection and cleaning of flow control structures, clearing debris/sediment from detention areas (as necessary), and inspecting the waterproofing in rooftop storage areas.
3. Constructed Wetlands
a.) Description
Constructed wetlands are shallow marsh systems planted with emergent vegetation that are designed to treat stormwater runoff. While they are one of the best methods for pollutant removal, constructed wetlands can also mitigate peak rates and even reduce runoff volume to a certain degree. They also can provide considerable aesthetic and wildlife benefits.
b.) Applicability
Constructed wetlands are applicable in any marshy area, usually underlain by HSG C or D soils with a high water table, on sites that have sufficient hydrologic conditions to maintain a permanent pool in the pond.

6-18
c.) Advantages and Disadvantages
ADVANTAGES
• Improve runoff quality through settling,filtration, uptake, chemicaland biological decomposition, volatilization, and adsorption.
• Effectiveatremovingmanycommonstormwaterpollutantsincludingsuspended solids, heavy metals, total phosphorus, total nitrogen, toxic organics, and petroleum products.
• Capable of providing some peak rate control above the permanentpool elevation.
DISADVANTAGES
• Applicationlimitedbysitehydrology.
• Consumeslargeamountsoflandareathatcannotbedeveloped.
d.) Maintenance Requirements
During the first growing season, vegetation should be inspected every two to three weeks. Constructed wetlands should be inspected several times per year and after major storms and rapid ice melt to assess vegetation cover, erosion, flow channelization, bank stability, inlet/outlet conditions, and sed-iment/debris accumulation. Sediment should be removed from the forebay (if applicable) before it occupies 50 percent of the forebay, typically every three to seven years.
C. Water Quality Treatment Controls
New development in a watershed can introduce large amounts of new sediments, exces-sive levels of nutrients (such as nitrogen and phosphorus), and other pollutants into the receiving waters. To prevent these contaminants from impacting the watershed, certain measures should be taken to mitigate the potential impact of development on the water quality in the watershed. These controls are designed primarily to reduce the pollutant load from the site by natural, physical, and/or biological processes. These controls do not provide significant peak rate or volume control.
1. Constructed Filter
a.) Description
Filters are structures or excavated areas containing a layer of sand, compost, organic material, peat, or other filter media that reduce pollutant levels in

6-19
stormwater runoff by filtering sediments, metals, hydrocarbons, and other pollutants. The runoff passes through the filter media and is collected in an under-drain and returned to the conveyance system, receiving waters, or infiltrated into the soil mantle.
b.) Applicability
Filters are applicable in urbanized areas having high pollutant loads and are especially applicable where there is limited area for construction of other water quality BMPs. Filters may be used as a pretreatment method for run-off before it reaches other facilities, especially infiltration systems. Filters may be used in Hot Spot areas for water quality treatment, and spill contain-ment capabilities may be incorporated into a filter.
c.) Advantages and Disadvantages
ADVANTAGES
• Effectivepre-treatmenttoreducesedimentandpollutantloadsonoth-er facilities.
• Flexibilityofdesign tomeetvaryingdegreesofwaterquality stan-dards.
• Sand filters can be used to “throttle” unacceptably high infiltrationrates.
• If effluent is allowed to infiltrate into the soilmantle, thefilter canreduce some runoff volume and increase groundwater recharge.
DISADVANTAGES
• Maintenancecanbeexpensiveifthefiltermediabecomesclogged.
• Poorperformanceincoldweather.
d.) Maintenance Requirements
The filter should be inspected at least four times per year for evidence of standing water and any film or discoloration of surface filter material. Trash and debris should be removed as necessary. Also, scraping the silt with rakes, tilling or aerating the filter area, and/or replacing the filter medium may be required.

6-20
2. Water Quality Inlets & Hydrodynamic Devices
a.) Description
Water quality inlets are stormwater inlets that have been fitted with a propri-etary product (or the proprietary product replaces the catch basin itself) de-signed to remove water quality contaminants. They are designed to receive large sediment, suspended solids, oil and grease, and other pollutant loads.
Hydrodynamic devices are on-line structures that separate sediment and pol-lutants from the flow stream via physical methods. These methods include baffle plate design, vortex design, tube settler design, inclined plate settler design or a combination of these. Ideally, the flow through device should remove litter, oil, sediment, heavy metals, dissolved solids and nutrients.
b.) Applicability
These controls can be used at any existing or proposed inlet where contrib-uting runoff may contain significant levels of sediment and debris: parking lots, gas stations, golf courses, streets, driveways, industrial or commercial facilities, etc.
c.) Advantages and Disadvantages
ADVANTAGES
• Effectivepre-treatmenttoreducesedimentandpollutantloadsonoth-er facilities.
• Noadditionallandrequirements.
DISADVANTAGES
• Potentiallyadverselyimpactedbycoldweather.
• Requiresrigorousmaintenancetobeeffective.
d.) Maintenance Requirements
Maintenance is crucial for pollutant removal effectiveness. The more fre-quent a water quality insert is cleaned, the more effective it will be. Follow the manufacturer’s guidelines for maintenance, also taking into account ex-pected pollutant load and site conditions. Inlets should be inspected weekly during construction. Post construction, they should be emptied when over half full of sediment (and trash) and cleaned at least twice a year. They should also be inspected after large runoff events.
6-21
3. Riparian Buffer Restoration
a.) Description
A riparian buffer is a permanent area of trees and shrubs located adjacent to streams, lakes, ponds, and wetlands. Riparian forests are the most beneficial type of buffer for they provide ecological and water quality benefits. Res-toration of this ecologically sensitive habitat is a responsive action to past activities that may have eliminated any vegetation.
b.) Applicability
Riparian buffer restoration is applicable for sites traversed by, or adjacent to, a stream with a degraded or previously developed riparian buffer.
c.) Advantages and Disadvantages
ADVANTAGES
• Restores the natural pollutant and nutrient removal capacity of thestream bank.
• Enhancessiteaesthetics.
• Improvesbiodiversity.
DISADVANTAGES
• Consumeslargeamountsoflandthatcannotbedeveloped.
• Considerablefinancialcost.
• Establishmentofthevegetationcantakeupwardsoffiveyears.
d.) Maintenance Requirements
Riparian buffers require diligent maintenance efforts, with inspections at least four times per year, particularly in the first three to five years while veg-etation is being established. Buffers need to be regularly watered, mulched, and weeded. Weeds and other invasive species may be controlled with her-bicides (only in the first two to three years), mowing (or other mechanical methods), or weed mats. Plants should be inspected for any damage from deer grazing. If tree shelters are employed to protect vegetation, they should be inspected regularly and repaired as needed.

6-22
4. Floodplain Restoration
a.) Description
Floodplain restoration aims to mimic the pre-settlement (pre-1600’s) condi-tions of the interaction of groundwater, stream base flow, and root systems in a stream bed. The interaction among the stream’s base flow, groundwater, permeable floodplain soils, and riparian root zones provides multiple ben-efits, including the filtering of sediments and nutrients through retention of frequent high flows onto the floodplain, removal of nitrates from ground-water, reduction of peak flow rates, groundwater recharge/infiltration, and increase of storage and reduction of flood elevation during higher flows.
b.) Applicability
Floodplain restoration can be performed on any location where stream net-works have little interaction among the groundwater, stream base flow, and the root systems. This can be done on-site as part of the on-site stormwater management plan, or on projects that do not have a stream on or adjacent to the site, floodplain restoration may be implemented downstream in the watershed.
c.) Advantages and Disadvantages
ADVANTAGES
• Restorespre-settlementstreamhydrology.
• Enhances the sediment andnutrient load attenuation capabilities ofthe stream bank.
• Impactsfloodcontrolonthewatershedlevel.
DISADVANTAGES
• Consumeslargeamountsoflandthatcannotbedeveloped.
• Considerablefinancialcost.
• Maynotbesuitablenearexistingwetlandsandmatureforests.
d.) Maintenance Requirements
Floodplain areas should be inspected regularly to monitor the vegetative cover. Weeds and other invasive species should be controlled with herbi-cides (only within the first two to three years), mowing (or other mechanical methods), or weed mats.

6-23
D. Nonstructural Stormwater Management Techniques
Nonstructural stormwater management techniques refer to land use management tech-niques geared toward minimizing storm runoff impacts through control of the type, lo-cation, layout, and density of new development. These techniques can be incorporated in the development design process through alternative zoning ordinance and subdivi-sion and land development ordinance (SALDO) provisions, or through creative site planning. These alternative provisions in a zoning ordinance and SALDO can minimize impervious surfaces for a given zoning district. These zoning ordinance and SALDO provisions would aim to move development away from areas that are desirable to pre-serve, and towards areas that are suitable for development (such as near existing urban and suburban areas, etc.). This can be done either on a per parcel basis, or on a munic-ipality-wide basis. Areas that are desirable for preservation can include any areas that the municipality sees fit to protect, but usually include mature woodlands, wetlands, existing natural drainage systems, riparian areas, and other areas that are important for natural runoff control. Other non-structural controls involve minimizing the impacts of a land development on areas that will be pervious post-development or passing flow from impervious areas over pervious areas to allow it to be partially filtered and pos-sibly infiltrated.
Presented here is a discussion of the various nonstructural practices and controls avail-able for implementation on a development site (or region). The discussion includes a physical description of the control, its advantages and disadvantages, and maintenance requirements (if any). The practices that do not have disadvantages noted can be as-sumed to be hindered by existing zoning ordinances and SALDOs that limit the extent that the control can be implemented in certain areas. This does not include those con-trols that only seek to preserve existing features, in which the only disadvantage is a possible loss of profitability from the reduced development area.
1. Protect Sensitive/Special Value Resources
a.) Description
To minimize stormwater impacts, land development should avoid affect-ing and encroaching upon areas with important natural stormwater func-tional values (floodplains, wetlands, riparian areas, drainageways, others), and with stormwater impact sensitivities (steep slopes, adjoining properties, others) wherever practicable. This avoidance should occur site-by-site and on an area wide basis. Development should not occur in areas where sensi-tive and/or special value resources exist so that their valuable natural func-tions are not lost, thereby doubling or tripling stormwater impacts. Sensitive resources also include those resources of special value (such as designated habitat of threatened and endangered species that are known to exist and have been identified through the Pennsylvania Natural Diversity Inventory or PNDI).

6-24
b.) Advantages
• Reducesthepollutantloadbypreventingexistinghydrologicfeaturesfrom being converted to impervious, which would increase the impact of the impervious several times over.
• Reducesthepollutantloadbyminimizingmaintainedlandscapeareas(lawns, etc.).
• Preservessiteaestheticsandwildlifehabitat.
• Preserves the site’sability to reduce runoff throughevapotranspira-tion.
c.) Maintenance Requirements
Typically, the designated open space may be conveyed to the municipality, although most municipalities prefer not to receive these open space por-tions, including all of the maintenance and other legal responsibilities as-sociated with open space ownership. If the open space will not be received by the municipality, a homeowner’s association is the ideal party to own the open space.
2. Protect/Conserve/Enhance Riparian Areas
a.) Description
This control serves to protect the existing natural vegetative buffers protect-ing streams. The Executive Council of the Chesapeake Bay Program defines a riparian forest buffer as “an area of trees, usually accompanied by shrubs and other vegetation, that is adjacent to a body of water and which is man-aged to maintain the integrity of stream channels and shorelines, to reduce the impact of upland sources of pollution by trapping, filtering and convert-ing sediments, nutrients, and other chemicals, and to supply food, cover, and thermal protection to fish and other wildlife.” Also, it is important to note that riparian buffer areas are not the same as floodplains. While most riparian buffers are within the floodplain, there can be areas where ripar-ian buffers extend beyond the floodplain (such as banks with steep slopes, etc.).
b.) Advantages
• Vegetation provides water quality filtering for sediments, nutrients,and other pollutants.
• Increasesthebankstabilityofthestream.

6-25
• Improvesgroundwaterrecharge.
• Preserves the existingpeak rate andvolumecontrolof thewoodedarea.
• Controls the temperature of the stream shaded by the existing treecanopy.
• Preservessiteaestheticsandwildlifehabitat.
c.) Maintenance Requirements
Since the purpose of this control is to preserve existing wooded areas, post-development maintenance requirements are not significant.
3. Protect/Utilize Natural Flow Pathways
a.) Description
Most sites have identifiable drainage features such as swales, depressions, watercourses, ephemeral streams, etc. which serve to effectively manage any stormwater that is generated on the site. By identifying, protecting, and utilizing these features a development can minimize its stormwater impacts. Instead of ignoring or replacing natural drainage features with engineered systems that rapidly convey runoff downstream, designers can use these features to reduce or eliminate the need for structural drainage systems.
b.) Advantages
• Naturaldrainagefeaturescanbeusedasaguideforsitedesignandlayout.
• Usingnaturalswalesanddepressionscandecreasethecostassociatedwith engineered controls.
• Preserves the site’sability to reduce runoff throughevapotranspira-tion.
• Canimprovewaterqualitythroughfiltration,infiltration,sedimenta-tion, and thermal mitigation.
• Preservessiteaestheticsandwildlifehabitat.

6-26
c.) Maintenance Requirements
Natural drainage features should be protected from upstream increases in peak and volume so as to reduce the risk of channel erosion. Periodic in-spections and maintenance actions (if necessary) are important. Inspections should assess erosion, bank stability, sediment/debris accumulation, and vegetative conditions including the presence of invasive species. Problems should be corrected in a timely manner. Protected drainage features should be placed in an easement or other legal measure to protect against future damage and/or neglect.
4. Clustering Development
a.) Description
Clustering is the practice of decreasing lot size while keeping density con-stant. Development should be concentrated in areas that will allow for the preservation of natural features in other areas of the site. Clustering is bene-ficial to stormwater management, since it decreases the disturbed area asso-ciated with development, and also increases the amount of open space that is preserved. Clustering proposals will require cooperation with the munici-pality, since clustering techniques are likely to go against the minimum lot size provisions in most municipal ordinances.
b.) Advantages
• Reducestheareaimpactedbydevelopment.
• Preserves the site’sability to reduce runoff throughevapotranspira-tion.
• Preservessiteaestheticsandwildlifehabitat.
• Reducestotalimperviouscoverbylimitingstreetlengthsandreduc-ing the size of other impervious areas (driveways, sidewalks, etc.).
c.) Maintenance Requirements
Ownership of the open space should be established in the same fashion as in the Protect Sensitive/Special Value Resources control.
5. Concentrate Uses Area Wide Through Smart Growth Practices
a.) Description
This control involves using practices that direct growth to areas or groups of parcels in the municipality that are most desirable and away from areas

6-27
or groups of parcels that are undesirable. This can be thought of as “Super Clustering;” rather than clustering on individual parcels, which will pre-serve open space in a piecemeal manner across the municipality, using prac-tices such as transfer of development rights, urban growth boundaries, ef-fective agricultural zoning, purchase of development rights, etc. allows for preservation of large amounts of connected, desirable open space across the municipality. “Desirability” is defined in terms of environmental, historical and archaeological, scenic and aesthetic, “sense of place,” and quality of life sensitivities and values.
b.) Advantages
• Preservesthenaturalinfiltrativeandhydrologicpropertiesofthesoiland vegetation on a potentially watershed-impacting level.
• Reducestotalimperviouscoverinthewatershedbylimitingdevelop-ment to certain areas.
c.) Maintenance Requirements
Ownership of the open space should be established in the same fashion as in the Protect Sensitive/Special Value Resources control.
6. Minimize Total Disturbed Area – Grading
a.) Description
This control involves reducing site grading, removal of existing vegetation (clearing and grubbing), and total soil disturbance. This eliminates the need for reestablishment of a new maintained landscape for the site and lot-by-lot. This can be accomplished by modifying the proposed road system and other relevant infrastructure as well as the building location and elevations to better fit the existing topography. The requirements of grading for road-way alignment (curvature) and roadway slope (grade) frequently increase site disturbance throughout a land development site and on individual lots. In some cases, if the minimum standards for road slope and alignment make it difficult or impossible to implement this control, developers may wish to work with the municipality to possibly deviate from the ordinance stan-dards, without sacrificing public safety standards (regarding sight distance, winter icing, etc.).
b.) Advantages
• Reducestheareaimpactedbydevelopment.
• Preserves the site’sability to reduce runoff throughevapotranspira-tion.

6-28
• Reducesthecostofdevelopmentbyminimizingtheamountofearth-work required.
• Preservessiteaestheticsandwildlifehabitat.
c.) Maintenance Requirements
Since this control only involves better site planning techniques, there is no maintenance associated with it. However, if large amounts of open space are to be created as part of the development, ownership of the open space should be established in the same fashion as in the Protect Sensitive/Special Value Resources control.
7. Minimize Soil Compaction in Disturbed Areas
a.) Description
Minimizing soil compaction is the practice of protecting and minimizing damage to soil quality caused by land development. Healthy, native soil will provide significant benefits, including effectively cycling nutrients, minimizing runoff and erosion, maximizing water-holding capacity, reduc-ing storm runoff surges, absorbing and filtering excess nutrients, sediments, and pollutants to protect surface and groundwater, providing a healthy root environment and creating habitat for microbes, plants, and animals, and reducing the resources needed to care for turf and landscape plantings. Compacted soils can never be returned to a perfectly native state (although techniques described in Section A.7: Soil Amendment and Restoration will restore some of the original infiltrative capacity), so it is desirable to protect areas that will be pervious post-development from vehicular traffic, material stockpiling, and other methods of compaction during the land development process.
b.) Advantages
• Preservesthenaturalinfiltrativecapacityofthesoilson-site.
• Preservesthenaturalabilityofthesoilson-sitetofilternutrientsandpollutants.
• Reducestheneedforpesticidesandfertilizerstomaintainlawnspost-development.
c.) Maintenance Requirements
Sites that have minimized soil compaction properly during the development process should require considerably less maintenance than sites that have

6-29
not. Landscape vegetation will likely be healthier, have a higher survival rate, require less irrigation and fertilizer, and even look better. Some main-tenance activities such as frequent lawn mowing can cause considerable soil compaction after construction and should be avoided whenever possible. Planting low-maintenance native vegetation is the best way to avoid damage due to maintenance.
8. Re-vegetate and Re-forest Disturbed Areas with Native Species
a.) Description
This control involves selecting vegetation (i.e., native species) that does not require significant chemical maintenance by fertilizers, herbicides, and pes-ticides on sites that require landscaping and re-vegetation. This is based on the assumption that native species have the greatest tolerance and resistance to pests and require less fertilization and chemical application than non-native species.
b.) Advantages
• Reducescostsassociatedwithpesticidesandfertilizersforvegetatedareas.
• Reductioninuseofpesticidesandfertilizersimproveswaterquality.
c.) Maintenance Requirements
Re-vegetated areas need to be monitored in the first three to five years while vegetation is being established. Woodland areas planted with a proper cover crop can be expected to require annual mowing to control invasives. Appli-cation of a carefully selected herbicide around the protective tree shelters/tubes may be necessary, reinforced by selective cutting/manual removal, if necessary. Meadow areas may require a seasonal mowing.
9. Reduce Street and Parking Imperviousness
a.) Description
This control involves reducing impervious street areas, usually by minimiz-ing street widths and lengths, and by minimizing imperviousness associ-ated with parking areas. Street impervious reduction can also be achieved by other methods, such as using pervious pavement (see Section A.1) for parking lanes, or including a landscaped island in the middle of cul-de-sacs. Parking impervious reduction can be accomplished by reducing parking ra-tios and including pervious overflow parking areas or by having a more ef-ficient parking lot layout (with one-way aisles and angled stalls).

6-30
b.) Advantages
• Decreasespost-developmentrunoffvolumeandincreasesamountofpervious area available for infiltration.
• Improves water quality by decreasing the pollutant load associatedwith impervious areas.
• Decreasestheconcentrationandenergyofstormwater.
c.) Maintenance Requirements
There are no maintenance requirements associated with reducing street and parking imperviousness.
10. Disconnection of Impervious Areas from Storm Sewers
a.) Description
Disconnection of impervious area involves minimizing stormwater volume by directing runoff from roof leaders and impervious roads and driveways to vegetated areas to infiltrate. Impervious areas are directed over a grassed area to an infiltration basin or other volume or water quality control facil-ity. Curb cuts can be used to convey runoff from road and driveway areas if curbs cannot be eliminated from the design.
b.) Advantages
• Increasesrunofftraveltime.
• Promotesinfiltrationoftheroofareas.
• Improveswaterqualitybyallowingrunofftobefilteredon-site,ratherthan allowing pollutants to concentrate in a storm sewer.
c.) Maintenance Requirements
There are no maintenance requirements for disconnected impervious areas directly, but downstream controls treating the roof runoff must be main-tained for this control to be effective.
11. Streetsweeping
a.) Description
Streetsweeping involves the use of one of several modes of sweeping equip-ment (such as mechanical, regenerative air, or vacuum filter sweepers) on a

6-31
programmed basis to remove larger debris material and smaller particulate pollutants, preventing this material from clogging the stormwater manage-ment system and washing into receiving waterways.
b.) Advantages and Disadvantages
ADVANTAGES
• Cansignificantlyreducepollutantloadsfromhighlytraffickedroadsand parking lots.
DISADVANTAGES
• Winterroadconditionscaninterruptthesweepingschedule.
• Providesnocontrolforpollutantsgeneratedduringarainfallevent.
• Modernstreetsweepingequipmentcomesatacost.
c.) Maintenance Requirements
Other than potential vehicle maintenance to the equipment, there are no maintenance requirements for this control.

6-32

7-1
CHAPTER 7. REVIEW OF STORMWATER COLLECTION SYSTEMS AND THEIR IMPACTS
A. Existing Stormwater Collection Systems and Their Impacts
As part of an Act 167 plan, existing stormwater collection and conveyance systems throughout the study area are to be documented through correspondence with the mu-nicipalities and field surveys. Information on existing storm sewer systems can be im-portant for the hydrologic model, as some systems may be extensive enough to act as the main drainage course for a subarea. These systems would then need to be measured (or have their geometry and dimensions estimated) and input into the model. However, there are no existing stormwater collection and conveyance systems in the Perkiomen Creek Headwaters, so it was not necessary to model them in any way.
B. Future Stormwater Collection Systems
Typically, storm drainage improvements would be constructed either as part of land de-velopments (by the developer) or as remedial measures as part of the municipal capital or maintenance programs on an as-needed basis. As-needed refers to both the severity of the drainage problems and the public support for an improvement. In this manner, projects are constructed as money becomes available in the capital maintenance budget. The effect of this approach in most cases is a piecemeal process of storm drainage im-provements rather than one based on a comprehensive program keyed to future needs.
The Perkiomen Creek Headwaters Stormwater Management Plan can impact this situ-ation in three ways. First, implementation of the performance standards specified in Chapter 8 would prevent the formation of new storm drainage problems, or the aggra-vation of existing problems, by maintaining peak flow values throughout the study area at existing levels. This would allow for the development of a comprehensive remedial strategy based on the assurance that solutions would not eventually be obsolete with ad-ditional development. Second, the storm drainage problem area inventory in Chapter 5 provides an excellent basis for development of a storm drainage capital improvements inventory. Actual improvements required would be determined from engineering anal-yses of the problems. Third, any engineering studies conducted for correcting problem areas could benefit from the flow values generated from the computer modeling of the study area as part of this Plan.
Even without the development of a comprehensive remedial strategy, the Stormwater Management Plan will improve the current situation by specifying a consistent design philosophy for all future storm drainage facilities. This design philosophy will relate to both facilities associated with new development and remedial projects.
Except as facilities may be provided through development activities, there are no known future stormwater collection and control systems to be provided within the Perkiomen Creek Headwaters study area within the next ten years.

7-2
C. Existing and Proposed Flood Control Projects
There are no existing or proposed flood control projects located within the Perkiomen Creek Headwaters based on State Water Plan data.

8-1
CHAPTER 8. WATERSHED-LEVEL RUNOFF CONTROL PHILOSOPHY AND PERFORMANCE STANDARDS FOR THE CONTROL OF STORMWATER RUNOFF FROM NEW DEVELOPMENT
Earlier chapters identified the impacts of new development on stormwater runoff and the techniques available to control those impacts either on-site or with regional facilities. This chapter will identify the performance standards or goals which need to be met for the water-sheds to minimize the adverse stormwater impacts of new development. The method used to determine the performance standards was two-fold. A statistical analysis of annual rainfall and the existing water balance was used to determine criteria for water quality and maximum direct groundwater recharge. Additionally, a detailed hydrologic model was developed to “stress” the watershed under various design conditions to evaluate peak rate control options. The specific computer model used was the Hydrologic Engineering Center’s Hydrologic Modeling System (HEC-HMS) because it provides acceptable hydraulic and hydrologic ac-curacy, can utilize multiple computational methodologies, produces total runoff hydrographs rather than individual peaks, and can be programmed on a personal computer.
A. Existing Water Balance Preservation Philosophy
1. Determining the Water Quality Volume
In previous Act 167 Plans prepared by the LVPC, we have used two different methods to calculate the water quality volume (WQv): the incremental 2-year runoff volume, based on the 24-hour, 2-year return period storm, and a rational method-based formula using the post-development runoff coefficient and a rain-fall depth of 1.25 inches. The greater of these two volumes was used, however, it was capped at a maximum volume equal to 1.25 inches of runoff over the entire site. The 1.25 inches represents the rainfall depth associated with 90% of annual rainfall in the Lehigh Valley. Stated otherwise, if all rainfall up to and including a 1.25 inch storm plus the first 1.25 inch of larger storms is counted, it represents 90% of all annual rainfall. As documented in the Little Lehigh Creek Water Qual-ity Update, May 2004 and the “Global” Water Quality Update, April 2006, this water quality volume was intended as the maximum volume that required capture and treatment to remove water quality contaminants. DEP uses a standard that requires the entire incremental 2-year runoff volume to be controlled such that the volume leaving the site does not increase for the 2-year storm with development. From a rainfall capture perspective, a 2-year, 24-hour storm of 3.0 inches repre-sents about 99% of annual rainfall. This is a rather strict water quality volume control. One reason for its strictness is that it is not simply intended as a volume that needs to be treated to remove contaminants. It is apparently based on a con-cern that increased runoff volume with development, even if managed through a release rate approach, still may cause increases in flooding downstream. It is also in part based on concern for erosion of downstream channels. Bankfull conditions for natural channels are typically based on about a 2-year return period. This re-turn period, therefore, is key to defining erosion for receiving channels. If 2-year runoff volumes do not increase and release rates ensure peak flow rates don’t

8-2
increase with development, downstream channels would presumably be protected from erosion. The current LVPC model Act 167 ordinance uses a 30% 2-year release rate as a channel protection standard. From an annual water balance per-spective, the difference between a water quality volume based on a 3.0 inch rain-fall versus a 1.25 inch rainfall is only about 9% (99% - 90%). However, from a BMP volume perspective, a 3.0 inch rainfall standard would produce about twice the needed volume as a 1.25 inch rainfall standard. At first, this would seem to create higher runoff control costs for a developer. This would be true if the only requirements for runoff control were for water quality purposes. The basic Act 167 ordinance, however, requires runoff control for the 2-year through 100-year return period runoff events. This means that the more strict (i.e. 3.0 inch event) requirement for water quality purposes may not have any bearing on the control cost to a developer that needs to manage runoff up through the 100-year return pe-riod (i.e. 7.5 inch event). In fact, a design example created by the LVPC found no appreciable difference in the amount of stormwater management storage volume required for the 100-year control whether 1.25 inches or 3.0 inches was used for determining the water quality volume. Since one of our goals with updating the water quality standards is to achieve greater consistency with DEP standards and since it appears this will not add any significant cost to the developer, this Plan includes the 2-year incremental runoff volume as the WQv.
There are multiple methods to calculate the 2-year incremental volume, all of which produce slightly different results. There are two ways to use the soil-cover-complex method (discussed in more detail below in Section C.2.b) to calculate the WQv. The first is the correct application of the method: to calculate runoff from pervious and impervious areas separately. The other method is to use a single weighted runoff curve number (CN) based on land cover. These two implementa-tions of the same method produce significantly different results: nearly 50% dif-ferent for lower values of CN (65-70). The only places the two volumes converge are at CN values of 61 and 98: 0% and 100% impervious, respectively. DEP will only accept the “split” approach under the NPDES post-construction permit pro-cess, so there is not a compelling reason to allow the less conservative weighted CN approach for calculating the WQv. Another method would be to use the Ra-tional Method with a 3 inch rainfall depth applied to pre- and post-development conditions. At larger values of CN, this volume ends up being much less than the split CN volume. However, at lower values of CN (<80), the Rational Method volume is more than 80% of the TR-55 volumes, and that difference goes to zero as impervious cover goes to zero. In this Plan and Ordinance, both a curve number methodology and the Rational Method are available to designers, so both methods of water quality volume calculation are allowed. If using the CN method, calculating pervious and impervious areas separately is required to implement the method correctly to calculate the WQv and BMP tributary area volumes.

8-3
2. Determining the Existing Water Balance
As stated above, control of the water quality volume will require a development plan to severely restrict the runoff leaving the site for storms up to and including the 2-year return period event. On an annual water balance basis, the 3 inch rain-fall depth for the 2-year event represents a rainfall capture of more than 99% of annual rainfall based on LVPC analysis of rainfall records from Allentown, Penn-sylvania. The end result of the standard is to very significantly reduce runoff on an annual basis. Post-development runoff then must either be recharged or returned to the atmosphere through evapotranspiration. If ordinances don’t place limits on recharge, virtually the entire annual rainfall could result in direct recharge to groundwater. This is specifically problematic in carbonate bedrock areas, but can be problematic in any geologic setting in terms of upsetting the natural water bal-ance.
A key to preventing situations where groundwater recharge would be greatly in-creased due to development, possibly with detrimental side effects, is to attempt to quantify the eventual fate of rainfall in the pre-development condition, be it run-off, recharge, or evapotranspiration. Pre-development or natural or existing water balance can be inferred from various sources, including the Technical Best Man-agement Practice Manual & Infiltration Feasibility Report: Infiltration of Storm-water in Areas Underlain By Carbonate Bedrock within the Little Lehigh Creek Watershed, LVPC 2002, as well as data prepared by the LVPC for the Monocacy and Jordan creeks based on stream gage analyses. Consistently through these sources, groundwater recharge is about 30% of annual rainfall while runoff rang-es from approximately 10-20%. Based on this data, we can make the following generalization about the fate of rainfall in the “natural” condition:
Runoff – 10% of annual rainfallRecharge – 30% of annual rainfallET – 60% of annual rainfall
As stated above, over 99% of all annual rainfall is included if you capture the 3.0 inches of rainfall associated with a 2-year, 24-hour storm. Figure 12 shows the non-linear relationship between rainfall capture depth and percent annual rainfall. This graph is based on capturing all the rainfall in storms up to and including the listed depth plus the listed depth of larger storms. From the graph, a 0.1 inch cap-ture depth translates into 22% of annual rainfall. A 0.5 inch capture depth includes 65% of annual rainfall. A 3 inch capture depth (2-year storm) is slightly greater than 99% of annual rainfall. The key idea from the chart is that very small rainfall capture volumes will have a very large influence on annual water balance.
The most critical aspect for determining post-development water balance is the fate of runoff produced by impervious surfaces as passed through various BMPs. Impervious surfaces produce a well understood “transform” of rainfall to runoff such that most rainfall will become runoff. The change from pervious cover to

8-4
FIG
UR
E 12
PER
CEN
T A
NN
UA
L R
AIN
FALL
VER
SUS
RA
INFA
LL C
APT
UR
E D
EPTH
0102030405060708090100
00.
51
1.5
22.
53
Rai
nfal
l Cap
ture
Dep
th (i
n)
% Annual Rainfall
8-5
impervious cover with development can dramatically alter peak runoff rate and runoff volume. BMPs can be employed to manage rate and volume impacts, but the annual water balance implications of those choices may not be considered. There is very little available data on BMP water balance. We can begin, however, with some very simple rules to classify BMPs by the predominant fate of runoff. BMPs that primarily provide an opportunity for evapotranspiration (ET) through a vegetative layer are ET BMPs. BMPs that initially direct runoff to an under-ground infiltration surface are direct recharge (D-RE) BMPs. BMPs that mainly pass runoff volume through such that the volume leaves the BMP as runoff are runoff (RO) BMPs. BMPs can then be classified as evapotranspiration (ET), di-rect recharge (D-RE), or runoff (RO) BMPs on the basis of the predominant fate of runoff.
Again, we have a relatively clear understanding of the rainfall/runoff response of impervious areas. Pervious areas are also important for annual water balance purposes, but our level of understanding is not as clear. In the pre-development condition, pervious areas probably have an annual water balance representative of the stream gage data presented above, where 60% of annual rainfall becomes ET, 30% becomes recharge, and 10% becomes runoff. However, in the post-de-velopment condition soil compaction by heavy equipment probably changes the annual water balance even for proposed pervious areas (i.e. lawns). For purposes of this Plan, the following assessment has been made of pervious areas pre- and post-development. If the natural landscape produces ET, RE and RO in portions of 60%, 30% and 10% of the annual water balance, this translates from Figure 12 into a capture volume of 1.25 inches of annual rainfall since at this point 90% is captured and 10% is runoff. In the post-development case, with the assumption that compacted soil areas would be covered with at least a few inches of topsoil and seeded with grass, the grass and topsoil combination should at least be able to capture the first 0.5 inches of precipitation, thereby producing a 70% rainfall capture with 30% left as runoff. In this simple illustration, runoff would triple from pre- to post-development conditions for these pervious areas on an annual water balance basis. This will be the operating rule for this Plan for water bal-ance purposes. Note that we’re not making any judgment how this reflects design storm events of 2- through 100-year return period. These are more severe events than the storms of 3.0 inches or less that are important for annual water balance.
The first step in BMP deployment for a site can be based on what areas don’t need BMP controls to meet annual water balance objectives. To preserve the existing water balance, part of the site could be allowed to bypass the BMPs to attempt to maintain existing runoff levels. Additionally, moving toward the goal of having 10% of annual rainfall leave the site as runoff, a significant portion of the site as lawn area can bypass the BMPs. Simply stated, if the whole site was lawn post-development and if lawn was considered equal to pre-development meadow, no BMPs would be needed and 100% of the site could be “bypass” flow to meet pre-development runoff volume. Owing to soil compaction on the site with devel-

8-6
opment and our operating rule regarding water balance characteristics, it is con-servatively estimated that only one-third of the site could be discharged as lawn bypassing BMPs. It would still be possible to control the WQv without needing to retain the entire site runoff volume, so this bypass standard should not conflict with the water quality volume requirements of the ordinance.
For an assessment of the fate of runoff directed to BMPs, we need operating rules for how each type of BMP translates runoff received into ET, RE and/or RO. Two of the rules are quite simple. For RO BMPs, all water directed to them will be assumed to be eventually released as runoff. For D-RE BMPs, all water directed to them will be assumed to be released as recharge. ET BMPs are different. Wa-ter directed to ET BMPs clearly will have some fraction of the water become evapotranspiration. Some fraction of the water directed to them is also intended to be recharged. Again, our operating rule is the simplest we can make. ET BMPs are assumed to distribute water directed to them in a way that mimics the natural landscape. That is, the natural landscape produces 60% ET, 30% RE and 10% RO. The 10% RO is, in effect, uncaptured by the natural landscape and runs off. The captured rainfall is split two-thirds to ET and one-third to RE. Therefore, all runoff that is intended to be captured by an ET BMP will be assumed to be distributed as 2/3 ET and 1/3 RE. With this in mind, impervious areas of a site directed to ET BMPs should closely reproduce a natural water balance. Runoff volume released from a site is restricted by the incremental 2-year return period water quality volume standard such that only about 10% of proposed impervious could be directed solely to RO BMPs. Since almost all runoff directed to D-RE BMPs becomes recharge, only about one-third of proposed impervious (owing to some ET off pavement) could be discharged to D-RE BMPs to preserve annual water balance.
Referring back to the proposed water quality volume, the change in 2-year runoff volume with development may not leave the site as runoff and must therefore be directed to some combination of ET and/or D-RE BMPs. Since the water quality volume will mostly reflect the creation of impervious surfaces, this means that most proposed impervious cover will need to be directed to ET and/or D-RE BMPs. For a 2-year return period storm, the runoff produced from impervious surfaces is about 90% of rainfall based on curve number or rational method ap-proaches. If we use this for water balance purposes also and we ignore runoff because it’s less than 10% of annual rainfall, the range of ET and RE we get from impervious areas directed to ET and/or D-RE BMPs is about 70% ET/30% RE if using exclusively ET BMPs, to 10% ET/90% RE if using exclusively D-RE BMPs. Again, ET BMPs mimic natural conditions and D-RE BMPs create higher than natural recharge. It seems clear some restriction of the use of D-RE BMPs is appropriate to maintain annual water balance near natural conditions. The chal-lenge is to use an appropriate standard that takes advantage of the most sound technical justification possible and properly manages the uncertainties involved in the process toward a reasonable design goal.

8-7
The best data we seem to have is: natural recharge is about 30% of annual rainfall, the understanding that BMPs that employ an underground infiltration surface will recharge almost all runoff directed to them, and the rainfall to runoff response for impervious areas is much better understood than for pervious areas. We further know that any pervious areas directed to D-RE BMPs will increase annual water balance recharge above that of the impervious areas being recharged. With the water quality volume standard as the 2-year change in runoff volume, we also believe that capturing that volume with ET BMPs exclusively will about match natural RE, and any use of D-RE BMPs will increase RE above the natural con-ditions. The standard proposed in this Plan is that direct recharge of runoff from impervious areas by employing D-RE BMPs shall be limited to 30% of the site’s annual rainfall. This translates into a maximum of one third of the site as impervi-ous being directed to D-RE BMPs when designed to capture the full 2-year event. Any sites with less than 33% impervious cover proposed would be exempt from this water balance standard. D-RE BMPs designed to capture less than the full 2-year event can direct more site impervious to these BMPs. Figure 13 shows the design curves for implementing this standard from a rainfall capture perspective for capture volumes of 0.0 to 3.0 inches. Since the BMP design storage is a func-tion of percent annual rainfall and the RO fraction, we can create a curve to solve for the maximum storage volume allowable for a given percent impervious and percent D-RE. However, this assumes that runoff will first flow into a D-RE BMP, and then flow into an ET BMP downstream when the storage volume is exceeded. Of course, this is not always the case. Sites may be designed to drain to an ET BMP first and overflow downstream into a D-RE facility. Based on the design storage volume of the ET BMP, we can calculate the amount of D-RE that occurs from the overflow into the downstream D-RE BMP. These curves, along with in-structions for their application, are included in Appendix C of the ordinance.
Given this data, the proposed water quality standards are as follows:
a.) The entire water quality volume shall be captured and treated by either D-RE or ET BMPs.
b.) Lawn area up to a maximum of 33% of the entire site area may be allowed to bypass water quality BMPs. As much proposed impervious area as prac-tical shall be directed to water quality BMPs.
c.) Existing impervious area that is not proposed to be treated by D-RE BMPs should be excluded from all water balance calculations.
d.) A maximum of 30% of the total annual rainfall for a site may be directly recharged to groundwater using direct recharge (D-RE) BMPs for runoff from impervious areas.
i.) For development sites with greater than 33% proposed impervious cover:

8-8
FIG
UR
E 13
PER
CEN
T D
IREC
T R
ECH
AR
GE
(D-R
E) P
ER F
RA
CTI
ON
IMPE
RVI
OU
SVE
RSU
S ST
OR
AG
E
0.00
10.0
0
20.0
0
30.0
0
40.0
0
50.0
0
60.0
0
70.0
0
80.0
0
90.0
0
100.
00
00.
51
1.5
22.
53
Stor
age
(inch
es o
ver i
mpe
rvio
us)
%D-RE/fraction I
1st S
tage
D-R
E1s
t Sta
ge E
T

8-9
(1) If all impervious cover is directed to ET BMPs to capture the full 2-year event, the D-RE standard is met.
(2) Up to 33% of the site as impervious cover may be directed to D-RE BMPs designed to capture the full 2-year event. All re-maining impervious cover shall be directed to ET BMPs de-signed to capture the remainder of the WQv.
(3) For ET and/or D-RE BMPs designed for runoff from impervious areas designed to capture less than the full 2-year event, Appen-dix C shall be used to assure that the maximum D-RE standard is met.
ii.) For development sites with less than 33% proposed impervious cover, all proposed impervious and the entire WQv may be directed to D-RE BMPs.
iii.) The maximum 30% D-RE standard applies on an overall site basis, rather than in each individual drainage direction.
B. Watershed-Level Runoff Control Philosophy
1. Watersheds Modeled Using HEC-HMS
Within the Perkiomen Creek Headwaters, there are 12 drainage areas which were modeled using HEC-HMS. The 12 drainage areas are: the Perkiomen Creek, Hosensack Creek, Unami Creek, Licking Creek, Molasses Creek, Schmoutz Creek, Macoby Creek, Macoby Creek Branch and 4 unnamed tributaries to the Hosensack (1), Unami (2), and Macoby Creek Branch (1). The following text refers to the process and the data used in modeling the 12 drainage areas.
Historically, stormwater management decisions for new development have pre-dominantly been made using an “at-site” philosophy. This has been the case for two reasons. First, not all of the four municipalities in the study area in Lehigh County currently require consideration of the downstream impacts of storm runoff from new development in their subdivision ordinances for the Perkiomen Creek Headwaters areas. Second, the municipal engineers do not have a study area data-base to rely on to quantify any downstream impacts. Therefore, the bottom line is that at-site considerations would typically dictate the recommended controls.
The difference between at-site runoff control philosophy and the Act 167 water-shed-level philosophy is the consideration of downstream impacts. Whereas the objective of typical at-site design would only be to control the post-development peak runoff rates to pre-development level from the site itself, a watershed-level design would be geared towards maintaining existing peak flow rates in the entire drainage system. The latter requires knowledge of how the site relates to the en-

8-10
tire watershed in terms of the timing of peak flows, contribution to peak flows at various downstream locations, and the impact of the additional volume generated by development of the site. The proposed watershed-level runoff control philoso-phy is based on the assumption that runoff volumes will increase somewhat with development. This will be partially mitigated by the proposed water quality stan-dards, which would eliminate the potential increase in runoff volume associated with the 2-year event with development. However, larger events would still cre-ate additional runoff volume post-development. The watershed-level philosophy, rather than necessarily attempting to reduce post-development volume across all return periods, seeks to “manage” the increase in volume such that peak rates of runoff throughout a watershed are not increased for any storm event. Note that although Act 167 would permit standards to be created to reduce overall peak flows with development, the standards of this plan are created to maintain exist-ing peak flows.
The basic goal of both the at-site and watershed-level philosophies is the same — no increase in the peak rate of runoff. However, the end products can be very different as illustrated in the following simplified example.
Presented in Figure 14 is a typical at-site runoff control strategy for dealing with the increase in peak rate of runoff with development. The “Existing Conditions” curve represents the pre-development runoff hydrograph. The “Developed Con-dition” hydrograph portrays three important changes in the site runoff response with development: a higher peak rate, a shorter time until the peak occurs, and an increase in total runoff volume. The “Controlled Developed Condition” hydro-graph is based on limiting the post-development runoff peak to the pre-develop-ment level through the use of detention facilities. The impact of “squashing” the post-development runoff to the pre-development peak is that the peak rate occurs over a much longer period of time. The instantaneous pre-development peak has become an extended peak (approximately two hours long in this example) under the Controlled Developed Condition.
At-site, the maintenance of the pre-development peak rate of runoff is an effective management approach. However, the potential detrimental impact of the approach is illustrated in Figures 15 and 16. Figure 15 represents the existing hydrograph at the point of confluence of Watershed A and Watershed B. The timing relation-ship of the watersheds is such that Watershed A peaks more quickly (at time t
PA),
while Watershed B peaks more slowly (at time tPB
). Watershed A is an area of significant development pressure and all new development proposals are met with the at-site runoff control philosophy as depicted in Figure 14. The eventual end product of Watershed A development under the “Controlled” Runoff Condition is an extended peak rate of runoff as shown in Figure 16. The extended Watershed A peak occurs long enough so that it coincides with the peak of Watershed B. Since the total hydrograph at the confluence is the sum of A and B, the total hydrograph peak must increase under these conditions to the “Controlled” Total Hydrograph. The conclusion from the above example is that simply controlling peak rates of

8-11

8-12

8-13
8-14
runoff at-site does not guarantee an effective watershed-level control because of the increase in total runoff volume.
a.) Release Rate Concept
The previous example indicated that in certain circumstances it is not quite enough to control post-development runoff peaks to pre-development levels if the overall goal is no increase in peak runoff at any point in the watershed. The reasons for this are how the various parts of the watershed interact in time with one another and the increased volume of runoff from develop-ment. The critical runoff control criteria for a given site or watershed area is not necessarily its own pre-development peak rate or runoff, but rather the pre-development contribution of the site or watershed area to the peak flow at a given point of interest. The concept is best explained through the use of a few simplified charts.
Figure 17 indicates how the individual runoff contributions from a number of sites or watersheds create the total hydrograph to a particular point. Areas 1 through 5 each have a particular runoff response to a given rainfall event (i.e. each will generate a characteristic hydrograph). Note that the configu-ration of the watershed is such that all areas will contribute runoff to the point of interest at the downstream end of area 5. However, the five areas do not contribute at the same time. Flows from area 1 have the farthest to travel to get to the point of interest. Area 5 flows contribute immediately to the point of interest flows. Therefore, the contribution of each area to the hydrograph at the point of interest is the individual area hydrograph lagged in time by an amount equal to the travel time from the area to the point of interest. The total hydrograph at the point of interest and the individual con-tributions from areas 1 through 5 are shown in Figure 17.
The release rate concept is perhaps best described by looking at how area 4 contributes to the hydrograph at the point of interest. Figure 18 shows the total hydrograph from Figure 17 and the area 4 contribution only. Notewor-thy facts regarding the two hydrographs are that area 4 itself peaks before the peak of the total hydrograph (40 minutes versus 50 minutes), the peak flow from area 4 is 100 cfs, and the contribution of area 4 to the peak flow at the point of interest is 75 cfs. Also shown on Figure 18 are the possible outcomes of development occurring in area 4. Specifically, the possible area 4 hydrograph assuming development occurs with no stormwater controls and the resultant hydrograph if all new development uses the at-site philoso-phy of controlling to pre-development peak levels are shown. Note that in both cases the flow contribution of area 4 to the peak at the point of interest increases (85 cfs for the no control option and 100 cfs for the at-site phi-losophy option). Therefore, the total peak flow at the point of interest from areas 1 through 5 must increase for both options and neither is an acceptable control strategy. The only acceptable control strategy would be to ensure that the contribution of area 4 to the peak flow at the point of interest does

8-15

8-16

8-17
not exceed 75 cfs. Note that the 75 cfs represents 75% of the 100 cfs peak flow from area 4. This is the basis for the release rate concept.
Conventional at-site detention philosophy would control post-development peak runoff flows to 100% of pre-development level. The release rate con-cept would dictate a more stringent level of control. For area 4, the release rate would be 75%, meaning that each individual development within area 4 would have to control post-development peak runoff rates to 75% of the pre-development levels as illustrated in Figure 19. Only through this in-creased level of control for area 4 would the point of interest peak flows not be exceeded. The conclusion is that in exchange for increased runoff volume with development, the peak rate of runoff will actually need to be reduced relative to pre-development conditions for certain parts of the wa-tershed. The release rate for those watershed areas, or subareas, is defined in equation form as follows:
Release Rate = Subarea Contribution to Point of Interest Peak Subarea Peak Flow
Note that the release rate concept has been developed using area 4 from Figure 17 as an example. The characteristics of area 4 are that it peaks prior to the point of interest peak and it contributes flow to the point of interest peak flow. None of the other areas in the example (1, 2, 3, or 5) exhibit both of these characteristics. As such, the proper method of runoff control appli-cable to these areas may differ from the basic release rate control strategy as discussed in the following section.
b.) Runoff Control Strategy Categorization
The five drainage areas of the previous example, beginning with Figure 17, each contribute to the runoff at the point of interest in a different manner as outlined below:
Area 1: Due to its very long travel time, area 1 peaks later than the point of interest peak and does not contribute any runoff to the point of interest peak.
Area 2: Due to its long travel time, area 2 peaks later than the point of inter-est peak but does contribute to the point of interest peak.
Area 3: Area 3 peaks at exactly the same time as the point of interest peak due to its location in the middle of the watershed. Therefore, 100% of the area 3 peak contributes to the point of interest peak.
Area 4: Area 4 peaks prior to the point of interest peak and contributes run-off to the point of interest peak.
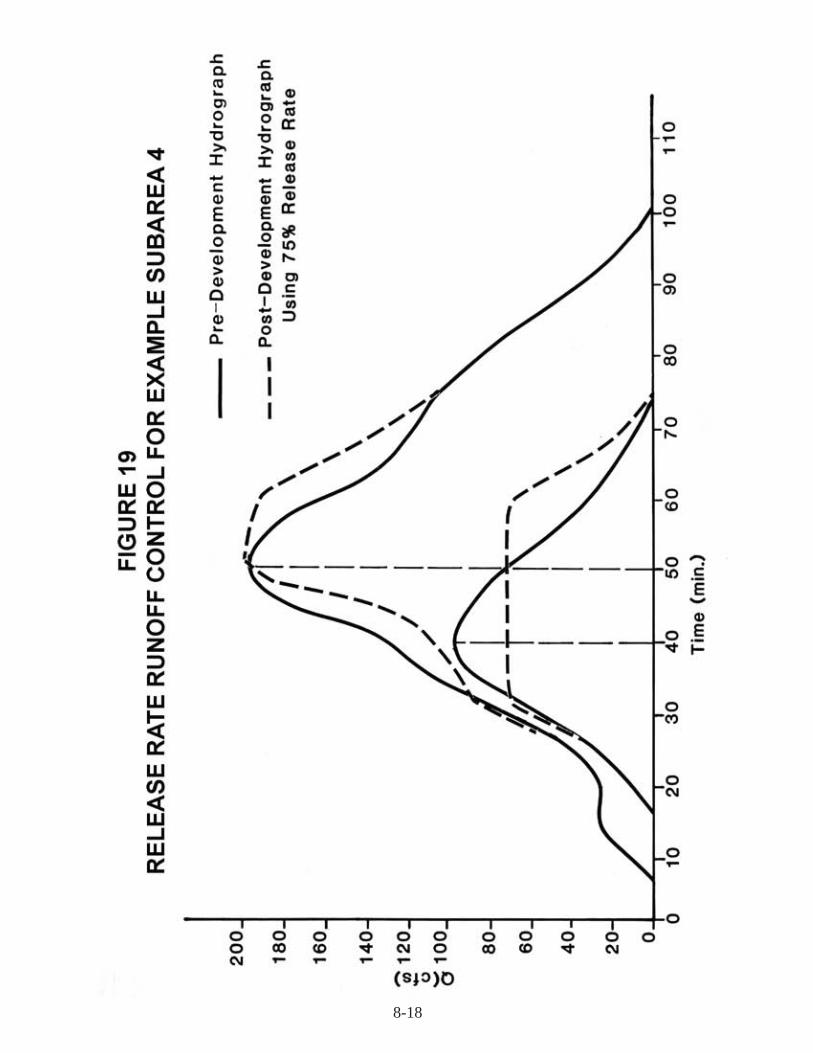
8-18

8-19
Area 5: Due to its proximity to the point of interest, area 5 peaks very early (before the point of interest peak) and does not contribute runoff to the point of interest peak.
Each of the above situations presents a different stormwater runoff analysis problem. In fact, each of the five areas define the five different runoff cat-egories which need to be examined in the preparation of a watershed-level runoff control plan. The five categories, or cases, are described in the sec-tions below.
(i) Case I (Equivalent to area 5) – Figure 20 portrays the Case I example of a drainage area which peaks prior to the point of interest peak and does not contribute to the peak flow of interest. From Figure 20, q
p and
tp are the peak flow and time to peak, respectively, of the individual
drainage area, and Qp and T
p are the peak flow and time to peak of the
hydrograph at the point of interest. In addition, the value of the indi-vidual drainage area hydrograph at any point in time is specified as q @ t, where t is the time in question (e.g. q @ 0, q @ t
p, Q @ T
p = 0).
Therefore, notationally, Case I is described as follows:
tp < T
p and q @ T
p = 0
Application of the basic release rate concept to Case I would dictate a release rate of 0% corresponding to the contribution of the drainage area to the point of interest peak. Taken literally, a 0% release rate would mean that no runoff would be allowed to leave the site post-development. Obviously, this would not be a workable control, and in fact, not a necessary one. The reason is that a release rate does not have to be associated with a detention facility geared to pass a certain percentage of the pre-development peak flows. The release rate appli-cable to Case I is that, whatever the storm runoff control philosophy used, the contribution of the individual drainage area to the point of interest peak should be zero. The most appropriate control in this in-stance is no control as shown in Figure 20. Any form of detention may extend the peak flow such that the drainage area begins to contribute to the point of interest peak. Simply allowing the drainage hydrograph to peak higher and recede in an uncontrolled fashion results in a more effective approach at the point of interest. Note that the impact of the no control approach for the subarea on the point of interest hydro-graph is limited to the rising portion of the hydrograph and not the peak. Therefore, the Case I runoff control philosophy would be no control at all, provided that the unrestricted runoff can be safely trans-ported to the stream channel from each development site.

8-20
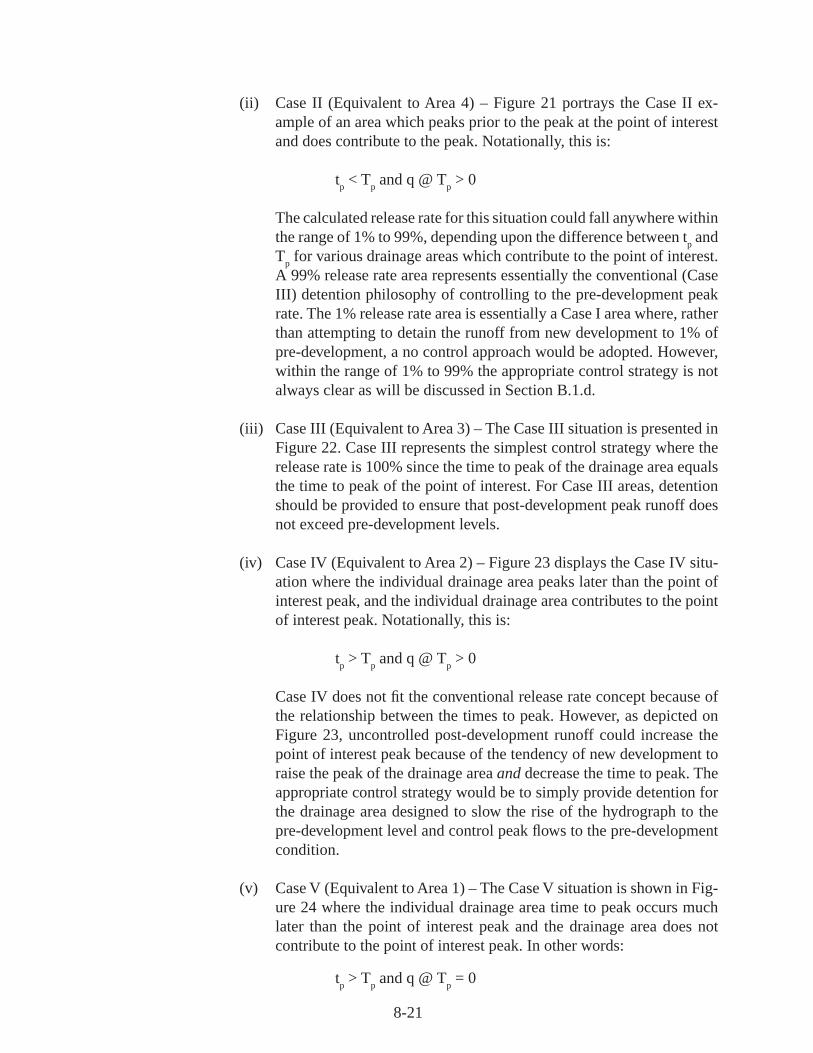
8-21
(ii) Case II (Equivalent to Area 4) – Figure 21 portrays the Case II ex-ample of an area which peaks prior to the peak at the point of interest and does contribute to the peak. Notationally, this is:
tp < T
p and q @ T
p > 0
The calculated release rate for this situation could fall anywhere within the range of 1% to 99%, depending upon the difference between t
p and
Tp for various drainage areas which contribute to the point of interest.
A 99% release rate area represents essentially the conventional (Case III) detention philosophy of controlling to the pre-development peak rate. The 1% release rate area is essentially a Case I area where, rather than attempting to detain the runoff from new development to 1% of pre-development, a no control approach would be adopted. However, within the range of 1% to 99% the appropriate control strategy is not always clear as will be discussed in Section B.1.d.
(iii) Case III (Equivalent to Area 3) – The Case III situation is presented in Figure 22. Case III represents the simplest control strategy where the release rate is 100% since the time to peak of the drainage area equals the time to peak of the point of interest. For Case III areas, detention should be provided to ensure that post-development peak runoff does not exceed pre-development levels.
(iv) Case IV (Equivalent to Area 2) – Figure 23 displays the Case IV situ-ation where the individual drainage area peaks later than the point of interest peak, and the individual drainage area contributes to the point of interest peak. Notationally, this is:
tp > T
p and q @ T
p > 0
Case IV does not fit the conventional release rate concept because of the relationship between the times to peak. However, as depicted on Figure 23, uncontrolled post-development runoff could increase the point of interest peak because of the tendency of new development to raise the peak of the drainage area and decrease the time to peak. The appropriate control strategy would be to simply provide detention for the drainage area designed to slow the rise of the hydrograph to the pre-development level and control peak flows to the pre-development condition.
(v) Case V (Equivalent to Area 1) – The Case V situation is shown in Fig-ure 24 where the individual drainage area time to peak occurs much later than the point of interest peak and the drainage area does not contribute to the point of interest peak. In other words:
tp > T
p and q @ T
p = 0

8-22

8-23

8-24

8-25

8-26
The runoff control strategy adopted for Case V areas is very nearly inconsequential at the point of interest. Neither uncontrolled post-de-velopment runoff nor extended-detention-achieved peaks would have the effect of increasing the point of interest peak flow. However, the analysis performed at Area 5 would need to be also performed at Ar-eas 1 through 4 as will be described below. For this reason a 100% release rate is required for Area 1.
c.) Point of Interest Selection
The five runoff control strategies, Cases I through V, developed above were determined based on a single point of interest at the downstream end of area 5. This was done simply for ease of illustration. In actuality, a point of in-terest could occur at any location in the watershed, such as the downstream end of area 1, 2, 3, or 4. Given that the relationships between the point of interest hydrograph and a single drainage area hydrograph (as defined by Cases I through V) are determined by travel time between the drainage and the point of interest, selection of the point of interest has a bearing on the runoff control category applicable to each drainage area. Further, the selec-tion of multiple points of interest could mean that each drainage area would fit into multiple control categories. Therefore, selection of the points of in-terest is a critical element in the development of the watershed-level runoff control strategy. The following items have been considered in the selection of the points of interest:
(i) Existing storm drainage problem areas (23) – identified through the Watershed Plan Advisory Committee municipal representatives.
(ii) Significant obstructions (24) – identified from comparisons of esti-mated capacity and 10-year return period peak flow.
(iii) All subarea boundaries (54) – identified by breakdown of the subwa-tersheds for modeling purposes.
(iv) Municipal boundaries.
The overall goals of Act 167 are to prevent the aggravation of existing drain-age problems and to prevent the formation of new problems through the co-ordination of stormwater runoff decisions throughout the watershed. There-fore, at minimum, existing storm drainage problem areas must be used as points of interest for hydrograph analysis. Of the 23 identified problem ar-eas, 20 are located on main reaches of the runoff model and 3 are located within individual drainage areas. The main reach problem areas can be ana-lyzed using the model directly. The remaining 3 problem areas would re-quire a more localized analysis of the impact of potential new development sites which drain through these “off-line” problem areas.

8-27
Prevention of any new storm drainage problems is by far the more difficult Act 167 goal. Ensuring that no new problems are created requires that either (1) peak runoff values are not increased at any point in the watershed, or (2) peak flow values are only increased to the point that the existing drain-age system can safely convey the increased flows. Option 2 would require knowledge of the capacity of the drainage system at every point in the wa-tershed, which is not available in this case. For modeling purposes, the aver-age capacities of the major drainage elements have been determined using simplified methods. Actual capacities may differ significantly depending upon the accuracy of the assumptions used in the simplified approach. In addition, even calibration of the runoff models does not guarantee accurate runoff values at every point in the watershed. The conclusion is that even though it may be possible to increase peak flow in values at various points in the watershed without creating new drainage problems, the ability to ac-curately define those areas and identify the allowable increase in peak flow does not exist within the Act 167 planning effort. Therefore, a conservative engineering approach and practicality dictate using the philosophy of main-taining existing peak flow rates.
With the control philosophy decided, it is still necessary to determine at what points in the watershed the philosophy will be applied. Strict adher-ence to the philosophy would mean using the most detailed level of wa-tershed breakdown available as the control points. Justification for use of significant obstructions as control points would be that ponding currently occurs at these locations, indicating a lack of adequate conveyance capac-ity under existing conditions. Increased peak flows at these points would aggravate the current ponding conditions and possibly create a hazard to property or safety.
Municipal boundaries as possible control points have their justification in the goals of Act 167 itself, namely to coordinate the runoff control efforts of all the municipalities in the watershed. Municipal coordination could mean, at minimum, that the stormwater management decisions made for a devel-opment in one municipality do not have an adverse impact on any other downstream municipality. Therefore, using municipal boundaries as points of interest could ensure the minimum acceptable coordination consistent with Act 167.
Each of the individual control point categories (existing drainage problem areas, significant obstructions, and municipal boundaries) are valid control points for formulation of a runoff management plan. Since using the 54 subarea boundaries effectively incorporates all the other control strategies, the 54 subarea boundaries have been used as the critical drainage points for runoff analysis. Therefore, the runoff from a particular subarea has been analyzed at every other downstream subarea and the appropriate control

8-28
philosophy devised based on not increasing the peak flow at any of the downstream subarea boundaries.
Devising a runoff control strategy based upon 54 critical points means that each subarea in the watershed will fit into multiple control strategy cat-egories (Cases I through V). The control strategy selected for a particular subarea is based on the most critical category applicable to the subarea. One impact of this is that there are no subareas for which the Case V situa-tion is most critical, since evaluation of upland-most subareas at their own downstream points yields a 100% release rate. Further, only in very isolated instances would a Case IV situation be most critical. Therefore, the con-trol strategy developed is based essentially on runoff control categories I through III.
d.) Return Periods to be Controlled
The performance criteria developed as part of this Plan will be used to con-trol the 2-, 10-, 25-, and 100-year return period events. These four events represent a full range of design frequency events. The 2-year storm event is included because, on a percentage basis, the increase in runoff volume be-tween pre- and post-development conditions is greater for the 2-year event than for any of the other return periods analyzed. This is true because the depth of rainfall is least for the 2-year event, and the pervious areas (lawns, etc.) do not significantly contribute to peak flows or runoff volume. As total rainfall depth increases with return period, pervious areas become saturated and nearly all rainfall becomes runoff – resembling the response of imper-vious areas. Therefore, the change in imperviousness with development is more difficult to control from a runoff perspective for the more frequent (e.g. 2-year) storms. However, the proposed water quality standards will maintain the existing runoff volume in the watershed, meaning that post-development peak rates from new development only need be controlled to the existing peak flows on-site. The 100-year event was included because many existing municipal ordinances already require analysis of the 100-year storm. Finally the 10- and 25-year storms were included to ensure con-trol of intermediate frequency storm events between the 2- and 100-year extremes.
The preceding sections described the theory behind release rate determination. Section C outlines the actual procedure used to implement the theory. Steps to determine the most appropriate control strategy for each subarea in each subwatershed are as fol-lows:
(i) Run the HEC-HMS model for the “existing” land use condition in each subwater-shed for the 2-, 10-, 25- and 100-year storms.
(ii) Beginning with the uppermost subarea, develop each subarea to future land use and assign the highest release rate that does not create a peak flow of greater

8-29
than 100% of pre-development, if possible. Test the release rate chosen by run-ning HEC-HMS for the 10-year storm, only with the WQv removed from the discharged volume of each subarea to account for the water quality standards. Continue downstream until each subarea has a release rate.
Consistent with the analysis conducted per parts (i) and (ii) above, all subareas in the Perkiomen Creek Headwaters were able to be grouped into a 100% release rate cat-egory. In the modeling analysis, three subareas were determined to be “best” controlled (best being defined as having downstream flow increases closest to zero) by a 50% re-lease rate. However, the in-stream improvement of these 50% release rates compared to 100% release rates was very small. Further, inspection of these subareas yields two that have special circumstances that the model doesn’t handle well. One subarea is a small junction in the model where the release rate is more a function of the disproportionate size rather than hydrologic contribution. A second subarea actually has a runoff rate decrease with the future land use which shouldn’t require a release rate below 100%. The third subarea only reduced the flow by 0.6% using the 50% release rate compared to a 100% release rate. There was a fourth subarea that showed small increases at points downstream (less than 3%), but a more restrictive release rate only exacerbated this condition by extending the hydrograph and adding more volume to the affected down-stream peaks. Therefore, it was determined that the most effective release rate strategy, in terms of both cost and performance, was to apply a 100% release rate to every sub-area in the watershed.
As discussed earlier, the percentage increase in runoff from development for the 2-year return period storm is the most difficult to control. In previous Act 167 Plans developed by LVPC, a 30% release rate was applied to all areas not designated as no detention areas. This was done for reasons of rate control, as well as water quality and streambed erosion protection. However, with the proposed water quality standards in the Perkio-men Creek Headwaters, the 2-year runoff volume will not increase post-development. Since the release rate concept is based on the assumption that volume will increase post-development, the 2-year event will only need to control runoff to pre-development levels throughout the watershed. Additionally, since the increase in the 2-year volume is being retained post-development, this will also have an impact on the post-development runoff volume of the higher return periods as well. As noted above, when the release rates were tested with the 10-year storm, the WQv (which is equal to the increase in the 2-year runoff volume) was removed from the outflow hydrograph using retention ba-sins in the watershed model. This amount of runoff volume removed from the drainage areas was sufficient for every subarea to be classified as a 100% release rate district.
The final strategy for the Perkiomen Creek Headwaters was chosen to be a single cat-egory – 100% Release Rate. The strategy was selected for the reasons discussed above: the control of the increase in the 2-year post-development runoff volume reduces the volume of the 2-year event so that release rates do not apply and removes sufficient volume from the higher return period events such that they are all able to be classified as a 100% release rate district.

8-30
C. Performance Standards
1. Description of Performance Standard Districts
The main goal of the Act 167 Plan effort was to determine what levels of runoff control are needed throughout the watershed. With the increased focus on water quality and specification of a water quality volume, as well as the location of the study area (i.e. the study area terminus is based on the county boundary, as op-posed to the terminus being based on the confluence of the watershed with the Lehigh or Delaware rivers), no detention areas were deemed to be inappropriate for the Perkiomen Creek Headwaters. All of the factors described in Section B of this chapter have been incorporated into a control strategy for successfully deal-ing with the runoff impacts of new development. The runoff control district for the Perkiomen Creek Headwaters is described below:
a.) 100% Release Rate Districts – The anticipated post-development runoff from these areas can be controlled across the range of return periods from 2- through 100-years by meeting a 100% Release Rate (i.e. post-development discharge is 100% of pre-development) in each drainage district, and by retaining the increase in the 2-year runoff volume on-site.
A map of the Perkiomen Creek Headwaters Study Area drainage districts is included as Plate 1, located inside the back cover of the Plan.
2. Performance Standard Implementation Provisions
The performance standards specified above represent one-half of the stormwater runoff control strategy for the Perkiomen Creek Headwaters. The other half of the strategy is composed of the provisions necessary to implement the performance standards, including the types of new development to which the standards apply, runoff calculation methodology and provisions to implement regional detention alternatives. Each of these implementation provisions is addressed separately be-low.
One additional implementation provision is that the criteria and standards for controlling runoff from new development contained herein are minimum criteria necessary for management of runoff from a watershed perspective. Municipalities may implement more stringent criteria so long as the increased stringency does not conflict with the Plan. A more detailed explanation of this aspect of the Plan is presented in the introduction to the municipal ordinance in Chapter 9.
_<

8-31
a.) “New Development” Subject to the Performance Standards
“New development” to be regulated by the runoff control plan includes sub-divisions, land developments, construction of new or additional impervious surfaces (driveways, parking lots, etc.), construction of new buildings or additions to existing buildings, any earth disturbance or other activities that involve alteration or development of land in a manner that may affect storm-water runoff onto an adjacent property, diversion or piping of any natural or man-made stream channel, and the installation of any storm sewer system. The latter two items have been included because they may have the impact of significantly modifying the conveyance characteristics which have been built into the design of the Plan, and therefore impact the effectiveness of the Plan. An exemption will be provided in the Plan for new developments which are expected to have an insignificant impact on the watershed-level runoff characteristics. The exemption is that any development which cre-ates 10,000 square feet or less of additional impervious cover would not be required to meet the quantity standards of the Plan. The 10,000 square foot criterion is based on the amount of impervious cover which would generate 2 cfs or less additional peak runoff for a five-minute duration storm for a 100-year return period rainfall event. This waiver only applies to land devel-opments, subdivisions and creation of impervious cover or buildings. Also, as stated above, this waiver only applies to the rate control criteria, and not the water quality criteria discussed in Section A of this chapter.
b.) Storm Runoff Calculation Methodology
The performance standards will apply to the range of design storm condi-tions from a 2-year return period to a 100-year return period. This means that the volume control standard must be met for the 2-year and the appli-cable release rates must be met for the 10-, 25-, and 100-year return period storm events. In many instances this will mean that detention facilities are designed with multiple stage outlet structures to accommodate the range of return periods.
An important implementation provision is the specification of the runoff calculation methods to be used for development sites within the Perkiomen Creek Headwaters Study Area. Engineering evaluations of the applicability of various calculation methods were conducted as part of the Plan prepara-tion and supported by previous research. The conclusion from the research is that all development sites in the basin may use either the Rational Method or the soil-cover-complex method for determining pre- and post-develop-ment runoff peak rates. The soil-cover-complex method was developed by the Natural Resources Conservation Service (NRCS, formerly SCS), and its distinguishing characteristic is the use of a parameter called the Run-off Curve Number. NRCS has analyzed the runoff relationship between the various land cover and soil type combinations and has formulated a scale
8-32
of the relative ability of the various combinations to produce runoff from a given rainfall. Although the soil-cover-complex method was developed by NRCS, there are many calculation methods available which use the curve number methodology which are not associated with NRCS.
Regardless of the runoff calculation method used, the design of any deten-tion facility to meet the performance standards specified in the Plan must be verified by routing the calculated runoff through the basin. Routing refers to the calculation process of taking the post-development runoff and determin-ing if the detention facility’s storage-elevation-outflow characteristics are appropriate for meeting the performance standards.
Closed depressions are one factor which could affect the magnitude of the peak flows a development will produce. In the “existing” condition, closed depressions can prevent a significant amount of runoff from entering the stream channel. The removal of these depressions with development can increase the storm runoff received by the conveyance facilities beyond the available capacity. For this reason, any development proposal which will remove a significant closed depression must demonstrate adequate capacity in the “local” conveyance facilities from the site to the main channel. Proper analysis of channel capacity is outlined in the following section.
c.) Regional Detention Alternatives
One final aspect of the control philosophy is the provision for regional de-tention alternatives. The major advantage of a regional facility is the ability to control the runoff from large watershed areas with a single facility rather than one facility for each development site in the tributary area. A single facility may be more aesthetically acceptable than many smaller basins and would offer the benefit of much more efficient maintenance.
However, there are many disadvantages of regional detention facilities. First, regional detention facilities would require large land areas to control large tributary areas. Either the availability of appropriately located land areas, or the cost of the land, or both, could preclude the alternative. Second, the financial arrangements for regional facilities may be very cumbersome, involving municipal or multimunicipal financing up-front to be reimbursed by developers as the tributary area is developed, as one example. For a large tributary area, the payback time frame would be very uncertain. Third, the design of a regional facility outlet release would be keyed to protection of the watershed downstream of the regional control. Development upstream of the basin without implementation of on-site runoff controls could cre-ate problems between the development site(s) and the basin. This situation would be contradictory to the goals of Act 167.

8-33
The above-stated disadvantages of regional detention facilities aside, it may be feasible to implement regional detention alternatives within the Perkio-men Creek Headwaters. The most likely alternatives would involve rela-tively small tributary areas representing several development sites. For the purposes of this Plan, any regional detention alternatives would require the initiative of a developer or group of developers to propose a regional facility. The funding, design criteria, maintenance provisions, and other applicable considerations would be the product of developer-municipal discussions. There are no specific recommendations for locations of regional detention facilities incorporated in this Plan.

8-34
9-1
CHAPTER 9. MUNICIPAL ORDINANCE TO IMPLEMENT THE PERKIOMEN CREEK HEADWATERS STORMWATER MANAGEMENT PLAN
The implementation of the runoff control strategy for new development will be through mu-nicipal adoption of the appropriate ordinance provisions. As part of the preparation of the Perkiomen Creek Headwaters Stormwater Management Plan, a model Ordinance has been prepared which would implement the Plan provisions presented in Chapter 8. The Ordinance is a single purpose ordinance which could be adopted essentially as is by the municipalities. Tying provisions would also be required in the municipal Subdivision and Land Develop-ment Ordinance and the municipal Building Code to ensure that activities regulated by the Ordinance were appropriately referenced. The Perkiomen Creek Headwaters Act 167 Storm-water Management Ordinance will not completely replace the existing storm drainage ordi-nance provisions currently in effect in the Perkiomen Creek Headwaters municipalities. The reasons for this are as follows:
• NotallofthemunicipalitiesinthePerkiomenCreekHeadwatersarecompletelywithinthe watershed. For those portions of a municipality outside the Perkiomen Creek Head-waters, the existing ordinance provisions would still apply. If desired, a municipality may choose to apply these provisions across all watersheds in the municipality provided that consistency with each approved plan is maintained.
• Onlypermanentstormwatercontrol facilitiesareregulatedby theAct167Ordinance.Stormwater management and erosion and sedimentation control during construction would continue to be regulated by existing municipal ordinances and DEP criteria. The DEP criteria are provided in the Erosion and Sedimentation Pollution Control Program Manual (April, 1990). DEP standards regarding sediment basin design differ from those required by this Ordinance. An acceptable design would meet both criteria.
• TheAct167Ordinancecontainsonlythosestormwaterrunoffcontrolcriteriaandstan-dards which are necessary or desirable from a total watershed perspective. Additional stormwater management design criteria (e.g. inlet spacing, inlet type, collection system details, etc.) which should be based on sound engineering practice should be regulated under the current ordinance provisions.
• TheAct167Ordinancecontainscriteriaandstandardsforrunoffcontrolfromnewdevel-opment which are the minimum criteria from a watershed perspective. Individual munici-palities may adopt more stringent ordinance provisions so long as consistency with the Plan is maintained. Note that more stringent criteria will not always be consistent with the Plan. The minimum municipal ordinance requirements for each article are listed in Table 12 on page 9-3.
• TheAct167Ordinanceprovidesawaiverforcertainregulatedactivitieswhichcreateless than 10,000 square feet of new impervious cover. Development plans qualifying for this waiver would still be regulated by the current municipal ordinance and Section 13 of the Pennsylvania Stormwater Management Act.
9-2
The Act 167 Ordinance is composed of the basic ordinance body and a set of appendices. The body of the document is organized into eight articles including General Provisions, Defi-nitions, Stormwater Management Requirements, Drainage Plan Requirements, Inspections, Fees and Expenses, Maintenance Responsibilities, and Enforcement.
The Ordinance Appendices, to be made part of the municipal ordinances, should provide maps of the Perkiomen Creek Headwaters, stormwater management districts, and storm drainage problem areas, as well as technical data to be used in the calculation methodology. The Ordinance is intended to be separable from the Plan document itself. The maps in the Ordinance Appendices would be duplicative of those already included in the Plan and are not included in the Plan version of the Ordinance.
Although the actual stormwater control provisions may vary significantly from an existing municipal ordinance, the structure of the Ordinance itself is very similar to many ordinances. The actual ordinance adopted by a municipality to implement the Perkiomen Creek Head-waters Act 167 Plan may differ in form from the Ordinance provided herein so long as it includes, at minimum, all of the provisions of the suggested Ordinance. A municipality may tailor the Ordinance provisions to best fit into their current ordinance structure. It is noted that a “hardship waiver” procedure has been included as Section 407 within Article 4 – Drainage Plan Requirements. A municipality may wish to restructure the waiver procedure into a sepa-rate article, perhaps as a formal municipal hearing provision. The minimum requirement of the hardship waiver procedure as adopted by a municipality is that it includes all five of the “findings” included with the Plan version of the provision.
The Ordinance contains references to the National Pollutant Discharge Elimination System (NPDES) stormwater permit program. Each construction site (where applicable) must meet the NPDES requirements and obtain a proper NPDES permit from the Lehigh County Con-servation District or DEP, as applicable.

9-3
TABLE 12
MINIMUM MUNICIPAL ORDINANCE REQUIREMENTS
The Act 167 Ordinance contains criteria and standards for runoff control from new development which are the minimum criteria required. The model Ordinance contains the criteria that the LVPC will use to provide advisory engineering design reviews to the municipality. However, municipalities can adopt criteria which are more stringent, as long as consistency with the Plan is maintained. The chart below lists each article in the Ordinance with the minimum municipal ordinance requirement for the article.
ARTICLE TITLE MINIMUM REQUIREMENT1 General Provisions Include verbatim.2 Definitions Include verbatim.3 Stormwater Management
RequirementsInclude verbatim.
4 Drainage PlanRequirements
Sections 401, 402, 403, 405, and 406 – Include verbatim.Section 404 – Municipality and LVPC must receive plan submissions.Section 407 – Municipality must have process for reviewing waiver requests. The five findings must be included verbatim.
5 Inspections Municipality must have the right to inspect storm drainage facilities.
6 Fees and Expenses Municipality may collect fees to cover review costs.
7 Maintenance Responsibilities
Ordinance provision must indicate responsibility for long-term maintenance of storm drainage facilities.
8 Enforcement Must be included verbatim in a stand-alone ordinance. If stormwater provisions are to be incorporated into an existing SALDO which has enforcement provisions, these sections may not be necessary.
Appendices Include verbatim.
Presented as the remainder of this chapter is the Perkiomen Creek Headwaters Act 167 Stormwater Management Ordinance.

9-4

1
PERKIOMEN CREEK HEADWATERS ACT 167 STORMWATER MANAGEMENT ORDINANCE
ARTICLE 1GENERAL PROVISIONS
SECTION 101. SHORT TITLE
The Ordinance shall be known and may be cited as the “[Watershed name] Act 167 Storm-water Management Ordinance.”
SECTION 102. STATEMENT OF FINDINGS
The governing body of the municipality finds that:
A. Inadequate management of accelerated runoff of stormwater resulting from develop-ment throughout a watershed increases flood flows and velocities, contributes to erosion and sedimentation, changes the natural hydrologic patterns, destroys aquatic habitat, elevates aquatic pollutant concentrations and loadings, overtaxes the carrying capacity of streams and storm sewers, greatly increases the cost of public facilities to carry and control stormwater, undermines floodplain management and flood control efforts in downstream communities, reduces groundwater recharge, and threatens public health and safety.
B. A comprehensive program of stormwater management, including reasonable regula-tion of development and activities causing accelerated erosion and loss of natural in-filtration, is fundamental to public health, safety, and welfare and the protection of the people of the municipality and all of the people of the Commonwealth, their resources, and the environment.
C. Stormwater can be an important resource by providing groundwater recharge for water supplies and baseflow of streams, which also protects and maintains surface water qual-ity.
D. Public education on the control of pollution from stormwater is an essential component in successfully addressing stormwater.
E. Federal and State regulations require certain municipalities to implement a program for stormwater controls. These municipalities are required to obtain a permit for storm-water discharges from their separate storm sewer systems under the National Pollutant Discharge Elimination System (NPDES).

2
F. Non-stormwater discharges to municipal separate storm sewer systems can contribute to pollution of waters of the Commonwealth by the municipality.
SECTION 103. PURPOSE
The purpose of this Ordinance is to promote the public health, safety, and welfare within the [Watershed Name] Watershed by minimizing the damages and maximizing the benefits described in Section 102 of this Ordinance by provisions designed to:
A. Manage stormwater runoff impacts at their source by regulating activities which cause stormwater problems.
B. Utilize and preserve the desirable existing natural drainage systems.
C. Encourage infiltration of stormwater, where appropriate, to maintain groundwater re-charge, to prevent degradation of surface and groundwater quality, and to otherwise protect water resources.
D. Maintain the existing flows and quality of streams and watercourses in the municipality and the Commonwealth.
E. Preserve and restore the flood carrying capacity of streams.
F. Provide for proper maintenance of all permanent stormwater management BMPs that are implemented in the municipality.
G. Provide review procedures and performance standards for stormwater planning, design, and management.
H. Manage stormwater impacts close to the runoff source which requires a minimum of structures and relies on natural processes.
I. Meet legal water quality requirements under State law, including regulations at 25 Pa. Code Chapter 93.4a to protect and maintain “existing uses” and maintain the level of water quality to support those uses in all streams, and to protect and maintain water quality in “special protection” streams.
J. Prevent scour and erosion of streambanks and streambeds.
K. Provide standards to meet the NPDES permit requirements.

3
SECTION 104. STATUTORY AUTHORITY
The municipality is empowered to regulate these activities by the authority of the Act of October 4, 1978, P.L. 864 (Act 167). 32 P.S. Section 680.1, et seq., as amended, the “Stormwater Management Act”, Act 247, the Pennsylvania Municipalities Planning Code of July 31, 1968, P.L. 805; 53 P.S. §10101, as reenacted and amended, and the [appropriate municipal code].
SECTION 105. APPLICABILITY
This Ordinance shall only apply to those areas of the municipality which are located within the [Watershed name] Watershed(s) as delineated on an official map available for inspection at the municipal office. A map of the [Watershed name] Watershed(s) at a reduced scale is included in Appendix A for general reference.
The following activities are defined as Regulated Activities and shall be governed by this Ordinance:
A. Land development.
B. Subdivision.
C. Construction of new or additional impervious surfaces (driveways, parking lots, etc.).
D. Construction of new buildings or additions to existing buildings.
E. Diversion or piping of any natural or man-made stream or channel.
F. Installation of stormwater systems or appurtenances thereto.
G. Regulated Earth Disturbance Activities.
H. Other than that included in 105.A through G, any Earth Disturbance Activities or any activities that involve the alteration or development of land in a manner that may affect stormwater runoff onto adjacent property.
SECTION 106. EXEMPTIONS
A. Impervious Cover – Any proposed Regulated Activity, except those defined in Sec-tion 105.E through 105.H, which would create 10,000 square feet or less of additional impervious cover is exempt from the Drainage Plan preparation provisions of this Or-dinance. If a site has previously received an exemption and is proposing additional de-velopment such that the total impervious cover on the site exceeds 10,000 square feet,

4
the total impervious cover on the site proposed since the original ordinance date must meet the provisions of this Ordinance.
1. The date of the municipal Ordinance adoption of the original [Watershed Name] Act 167 Stormwater Management Ordinance [Watershed Plan Date]† shall be the starting point from which to consider tracts as “parent tracts” in which future subdivisions and respective impervious area computations shall be cumulatively considered.
2. For development taking place in stages, the entire development plan must be used in determining conformance with these criteria.
3. Additional impervious cover shall include, but not be limited to, additional indoor living spaces, decks, patios, garages, driveways, storage sheds and similar struc-tures, and roof, parking, or driveway areas, and any new streets and sidewalks constructed as part of or for the proposed Regulated Activity.
4. Any additional areas proposed initially to be gravel, crushed stone, porous pave-ment, etc., shall be assumed to be impervious for the purposes of comparison to the exemption criteria. Any existing gravel, crushed stone, or hard-packed soil areas on a site shall be considered as pervious cover for the purpose of exemption evaluation.
B. Prior Drainage Plan Approval – Any Regulated Activity for which a Drainage Plan was previously prepared as part of a subdivision or land development proposal that received preliminary plan approval from the municipality prior to the effective date of this Or-dinance is exempt from the Drainage Plan preparation provisions of this Ordinance, except as cited in Section 106.D, provided that the approved Drainage Plan included design of stormwater facilities to control runoff from the site currently proposed for Regulated Activities consistent with ordinance provisions in effect at the time of ap-proval, and the approval has not lapsed under the Municipalities Planning Code. If significant revisions are made to the Drainage Plan after both the preliminary plan approval and the effective date of this Ordinance, preparation of a new Drainage Plan, subject to the provisions of this Ordinance, shall be required. Significant revisions would include a change in control methods or techniques, relocation or redesign of con-trol measures, or changes necessary because soil or other conditions are not as stated on the original Drainage Plan.
C. Activities associated with 105.H shall be exempt from the Drainage Plan preparation requirements of the Ordinance unless the municipality determines that the activity could create a new or relocated concentrated drainage discharge onto adjacent property. Agricultural plowing and tilling as may be covered by Section 105.H are exempt from the Drainage Plan preparation requirements of the Ordinance.
†Note: This is the original Act 167 Plan for the Perkiomen Creek Headwaters such that the adoption date of this ordinance sets the regulatory date.

5
D. These exemptions shall not relieve the applicant from implementing such measures as are necessary to protect health, safety, property, and State Water Quality Requirements. These measures include adequate and safe conveyance of stormwater on the site and as it leaves the site. These exemptions do not relieve the applicant from the responsibil-ity to secure permits or approvals for activities regulated by any other applicable code, rule, act, or ordinance.
E. No exemptions shall be provided for Regulated Activities as defined in Sections 105.E through 105.G.
SECTION 107. REPEALER
Any ordinance of the municipality inconsistent with any of the provisions of this Ordinance is hereby repealed to the extent of the inconsistency only.
SECTION 108. SEVERABILITY
Should any section or provision of this Ordinance be declared invalid by a court of competent jurisdiction, such decision shall not affect the validity of any of the remaining provisions of this Ordinance.
SECTION 109. COMPATIBILITY WITH OTHER ORDINANCE REQUIREMENTS
Approvals issued pursuant to this Ordinance do not relieve the applicant of the responsibility to secure required permits or approvals for activities regulated by any other applicable code, rule, act, or ordinance.
SECTION 110. DUTY OF PERSONS ENGAGED IN THE DEVELOPMENT OF LAND
Notwithstanding any provisions of this Ordinance, including exemption and waiver provi-sions, any landowner and any person engaged in the alteration or development of land which may affect stormwater runoff characteristics shall implement such measures as are reasonably neces-sary to prevent injury to health, safety, or other property. Such measures shall include such actions as are required to manage the rate, volume, direction, and quality of resulting stormwater runoff in a manner which otherwise adequately protects health and property from possible injury.

6
ARTICLE 2DEFINITIONS
For the purposes of this Ordinance, certain terms and words used herein shall be interpreted as follows:
A. Words used in the present tense include the future tense; the singular number includes the plural, and the plural number includes the singular; words of masculine gender include feminine gender; and words of feminine gender include masculine gender.
B. The word “includes” or “including” shall not limit the term to the specific example but is intended to extend its meaning to all other instances of like kind and character.
C. The words “shall” and “must” are mandatory; the words “may” and “should” are per-missive.
Accelerated Erosion – The removal of the surface of the land through the combined action of human activities and natural processes, at a rate greater than would occur because of the natural processes alone.
Best Management Practice (BMP) – Activities, facilities, measures or procedures used to man-age stormwater quantity and quality impacts from the Regulated Activities listed in Section 105, to meet State Water Quality Requirements, to promote groundwater recharge and to otherwise meet the purposes of this Ordinance.
Best Management Practice Operations and Maintenance Plan – Documentation, included as part of a Drainage Plan, detailing the proposed BMPs, how they will be operated and maintained and who will be responsible.
Bioretention – Densely vegetated, depressed features that store stormwater and filter it through vegetation, mulch, planting soil, etc. Ultimately stormwater is evapotranspirated, infiltrated, or discharged. Optimal bioretention areas mimic natural forest ecosystems in terms of species diver-sity, density, distribution, use of native plants, etc.
Capture/Reuse – Stormwater management techniques such as cisterns and rain barrels which direct runoff into storage devices, surface or subsurface, for later reuse, such as for irrigation of gardens and other planted areas.
Cistern – An underground reservoir or tank for storing rainwater.
Closed Depression – A distinctive bowl-shaped depression in the land surface. It is characterized by internal drainage, varying magnitude, and an unbroken ground surface.
Concentrated Drainage Discharge – Stormwater runoff leaving a property via a point source.

7
Conservation District – The [county name] County Conservation District.
Constructed Wetlands – Constructed wetlands are similar to wet ponds (see below) and consist of a basin which provides for necessary stormwater storage as well as a permanent pool or water level, planted with wetland vegetation. To be successful, constructed wetlands must have adequate natural hydrology (both runoff inputs as well as soils and water table which allow for maintenance of a permanent pool of water). In these cases, the permanent pool must be designed carefully, usu-ally with shallow edge benches, so that water levels are appropriate to support carefully selected wetland vegetation.
Culvert – A pipe, conduit or similar structure including appurtenant works which carries surface water.
Dam – An artificial barrier, together with its appurtenant works, constructed for the purpose of impounding or storing water or another fluid or semifluid or a refuse bank, fill or structure for high-way, railroad or other purposes which does or may impound water or another fluid or semifluid.
DEP – The Pennsylvania Department of Environmental Protection.
Design Storm – The depth and time distribution of precipitation from a storm event measured in probability of occurrence (e.g., 100-yr. storm) and duration (e.g. 24-hour) and used in computing stormwater management control systems.
Detention Basin – A basin designed to retard stormwater runoff by temporarily storing the runoff and releasing it at a predetermined rate.
Developer – A person, partnership, association, corporation or other entity, or any responsible person therein or agent thereof, that undertakes any Regulated Activity of this Ordinance.
Development Site (Site) – The specific tract of land for which a Regulated Activity is proposed.
Diffused Drainage – See Sheet Flow.
Direct Recharge (D-RE) BMP – A BMP which directs runoff to an underground infiltration sur-face. Examples include infiltration trenches, seepage beds, and drywells such that nearly all runoff becomes recharge to groundwater.
Drainage Easement – A right granted by a land owner to a grantee, allowing the use of private land for stormwater management purposes.
Drainage Plan – The documentation of the proposed stormwater quantity and quality manage-ment controls to be used for a given development site, including a BMP Operations and Mainte-nance Plan, the contents of which are established in Section 403.
Earth Disturbance Activity – A construction or other human activity which disturbs the surface of the land, including, but not limited to, clearing and grubbing, grading, excavations, embank-

8
ments, land development, agricultural plowing or tilling, timber harvesting activities, road main-tenance activities, mineral extraction, and the moving, depositing, stockpiling, or storing of soil, rock or earth materials.
Erosion – The removal of soil particles by the action of water, wind, ice, or other geological agents.
Evapotranspiration (ET) BMP – A BMP which provides opportunity for runoff evaporation and transpiration by vegetation. Examples include bioretention and surface infiltration basins.
Existing Uses – Those uses actually attained in the water body on or after November 28, 1975, whether or not they are included in the water quality standards. (25 Pa. Code Chapter 93.1)
Fill – Man-made deposits of natural soils or rock products and waste materials.
Filter Strips – See Vegetated Buffers.
Freeboard – The incremental depth in a stormwater management structure, provided as a safety factor of design, above that required to convey the design runoff event.
Groundwater Recharge – Replenishment of existing natural underground water supplies.
Hardship Waiver Request – A written request for a waiver alleging that the provisions of this Or-dinance inflict unnecessary hardship upon the applicant. A Hardship Waiver does not apply to and is not available from the water quality provisions of this Ordinance and should not be granted.
Hydrologic Engineering Center - Hydrologic Modeling System (HEC-HMS) – The computer-based hydrologic modeling technique developed by the U.S. Army Corps of Engineers and adapted to the Perkiomen Creek Headwaters for the Act 167 Plan. The model was “calibrated” to reflect actual flow values by adjusting key model input parameters.
Hot Spot Land Uses – A land use or activity that generates higher concentrations of hydrocar-bons, trace metals or other toxic substances than typically found in stormwater runoff. These land uses are listed in Appendix F.
Hydrologic Soil Group (HSG) – Soils are classified into four HSG’s (A, B, C and D) to indicate the minimum infiltration rates, which are obtained for bare soil after prolonged wetting. The Natural Resources Conservation Service (NRCS) of the U.S. Department of Agriculture defines the four groups and provides a list of most of the soils in the United States and their group clas-sification. The soils in the area of the development site may be identified from a soil survey report that can be obtained from local NRCS offices or conservation district offices. Soils become less permeable as the HSG varies from A to D.
Impervious Surface (Impervious Cover) - A surface which prevents the percolation of water into the ground.

9
Infiltration Practice - A practice designed to allow runoff an opportunity to infiltrate into the ground, e.g. French drain, seepage pit, seepage trench, or bioretention area.
Land Development – Any of the following activities:(1) The improvement of one lot or two or more contiguous lots, tracts or parcels of land
for any purpose involving (i) a group of two or more residential or nonresidential buildings, whether proposed initially or cumulatively, or a single nonresidential build-ing on a lot or lots regardless of the number of occupants of tenure; or (ii) the division or allocation of land or space between or among two or more existing or prospective occupants by means of, or for the purpose of streets, common areas, leaseholds, con-dominiums, building groups or other features.
(2) A subdivision of land.(3) Development in accordance with Section 503 (1.1) of the Pennsylvania Municipali-
ties Planning Code.
Low Impact Development – A development approach that promotes practices that will minimize post-development runoff rates and volumes thereby minimizing needs for artificial conveyance and storage facilities. Site design practices include preserving natural drainage features, minimizing impervious surface area, reducing the hydraulic connectivity of impervious surfaces and protect-ing natural depression storage.
“Local” Runoff Conveyance Facilities – Any natural channel or man-made conveyance system which has the purpose of transporting runoff from the site to the Mainstem.
Mainstem (Main Channel) – Any stream segment or other conveyance used as a reach in the [Watershed Name] hydrologic model.
Manning Equation (Manning formula) – A method for calculation of velocity of flow (e.g. feet per second) and flow rate (e.g. cubic feet per second) in open channels based upon channel shape, roughness, depth of flow and slope. “Open channels” may include closed conduits so long as the flow is not under pressure.
Maryland Stormwater Design Manual – A stormwater design manual written by the Maryland Department of the Environment and the Center for Watershed Protection. As of January 2004, the Manual can be obtained through the following web site: www.mde.state.md.us.
Minimum Disturbance/Minimum Maintenance Practices (MD/MM) – Site design practices in which careful limits are placed on site clearance prior to development allowing for maximum retention of existing vegetation (woodlands and other), minimum disturbance and compaction of existing soil mantle and minimum site application of chemicals post-development. Typically, MD/MM includes disturbance setback criteria from buildings as well as related site improvements such as walkways, driveways, roadways, and any other improvements. These criteria may vary by com-munity context as well as by type of development being proposed. Additionally, MD/MM shall include provisions (e.g., deed restrictions, conservation easements) to protect these areas from future disturbance and from application of fertilizers, pesticides, and herbicides.

10
Municipality – [municipal name], [county name] County, Pennsylvania.
NPDES – National Pollutant Discharge Elimination System.
NRCS – Natural Resources Conservation Service - U.S. Department of Agriculture. (Formerly the Soil Conservation Service.)
Oil/Water Separator – A structural mechanism designed to remove free oil and grease (and pos-sibly solids) from stormwater runoff.
Outfall – “Point source” as described in 40 CFR § 122.2 at the point where the municipality’s storm sewer system discharges to surface waters of the Commonwealth.
Owner – One with an interest in and often dominion over a property.
Peak Discharge – The maximum rate of flow of stormwater runoff at a given location and time resulting from a specified storm event.
Person – An individual, partnership, public or private association or corporation, firm, trust, estate, municipality, governmental unit, public utility or any other legal entity whatsoever which is recog-nized by law as the subject of rights and duties.
Point Source – Any discernible, confined and discrete conveyance, including, but not limited to, any pipe, ditch, channel, tunnel or conduit from which stormwater is or may be discharged, as de-fined in State regulations at 25 Pa. Code § 92.1.
Public Water Supplier – A person who owns or operates a Public Water System.
Public Water System – A system which provides water to the public for human consumption which has at least 15 service connections or regularly serves an average of at least 25 individuals daily at least 60 days out of the year. (See 25 Pa. Code Chapter 109)
Rational Method – A method of runoff calculation using a standardized runoff coefficient (ratio-nal ‘c’), acreage of tract and rainfall intensity determined by return period and by the time neces-sary for the entire tract to contribute runoff. The rational method formula for peak rate calculation is stated as follows: Q = ciA, where “Q” is the calculated peak flow rate in cubic feet per second, “c” is the dimensionless runoff coefficient (see Appendix C), “i” is the rainfall intensity in inches per hour, and “A” is the area of the tract in acres. The Rational method formula for runoff volume calculation is as follows: V = cPA/12 where “c” and “A” are as noted above, “P” is the total depth of precipitation for the design event in inches, and “V” is the total runoff volume in acre-feet.
Reach – Any of the natural or man-made runoff conveyance channels used for watershed runoff modeling purposes to connect the subareas and transport flows downstream.
Regulated Activities – Any Earth Disturbance Activities or any activities that involve the altera-tion or development of land in a manner that may affect stormwater runoff and that are governed by this Ordinance as specified in Section 105.

11
Regulated Earth Disturbance Activity – Activity involving earth disturbance, other than agri-cultural plowing and tilling, subject to regulation under 25 Pa. Code 92, 25 Pa. Code 102, or the Clean Streams Law.
Release Rate – The percentage of the pre-development peak rate of runoff for a development site to which the post-development peak rate of runoff must be controlled to avoid peak flow increases throughout the watershed.
Return Period – The average interval in years over which an event of a given magnitude can be expected to recur. For example, the twenty-five (25) year return period rainfall or runoff event would be expected to recur on the average once every twenty-five years.
Road Maintenance – Earth disturbance activities within the existing road cross-section such as grading and repairing existing unpaved road surfaces, cutting road banks, cleaning or clearing drainage ditches and other similar activities.
Runoff – That part of precipitation which flows over the land.
Sediment Traps/Catch Basin Sumps – Chambers which provide storage below the outlet in a storm inlet to collect sediment, debris and associated pollutants, typically requiring periodic clean out.
Seepage Pit/Seepage Trench – An area of excavated earth filled with loose stone or similar mate-rial and into which surface water is directed for infiltration into the ground.
Separate Storm Sewer System – A conveyance or system of conveyances (including roads with drainage systems, municipal streets, catch basins, curbs, gutters, ditches, man-made channels or storm drains) primarily used for collecting and conveying stormwater runoff.
Sheet Flow – Stormwater runoff flowing in a thin layer over the ground surface.
Soil-Cover-Complex Method – A method of runoff computation developed by NRCS which is based upon relating soil type and land use/cover to a runoff parameter called a Curve Number.
Spill Prevention and Response Program – A program that identifies procedures for preventing and, as needed, cleaning up potential spills and makes such procedures known and the necessary equipment available to appropriate personnel.
State Water Quality Requirements – As defined under State regulations – protection of desig-nated and existing uses (See 25 Pa. Code Chapters 93 and 96) – including:
A. Each stream segment in Pennsylvania has a “designated use,” such as “cold water fish-es” or “potable water supply,” which is listed in Chapter 93. These uses must be pro-tected and maintained, under State regulations.

12
B. “Existing uses” are those attained as of November 1975, regardless whether they have been designated in Chapter 93. Regulated Earth Disturbance Activities must be de-signed to protect and maintain existing uses and maintain the level of water quality necessary to protect those uses in all streams, and to protect and maintain water quality in special protection streams.
C. Water quality involves the chemical, biological and physical characteristics of surface water bodies. After Regulated Earth Disturbance Activities are complete, these char-acteristics can be impacted by addition of pollutants such as sediment, and changes in habitat through increased flow volumes and/or rates as a result of changes in land surface area from those activities. Therefore, permanent discharges to surface waters must be managed to protect the stream bank, streambed and structural integrity of the waterway, to prevent these impacts.
Storage Indication Method – A method of routing or moving an inflow hydrograph through a reservoir or detention structure. The method solves the mass conservation equation to determine an outflow hydrograph as it leaves the storage facility.
Storm Drainage Problem Areas – Areas which lack adequate stormwater collection and/or con-veyance facilities and which present a hazard to persons or property. These areas are either docu-mented in Appendix B of this Ordinance or identified by the municipality or municipal engineer.
Storm Sewer – A system of pipes or other conduits which carries intercepted surface runoff, street water and other wash waters, or drainage, but excludes domestic sewage and industrial wastes.
Stormwater – The surface runoff generated by precipitation reaching the ground surface.
Stormwater Filters – Any number of structural mechanisms such as multi-chamber catch basins, sand/peat filters, sand filters, and so forth which are installed to intercept stormwater flow and remove pollutants prior to discharge. Typically, these systems require periodic maintenance and clean out.
Stormwater Management Plan - The plan for managing stormwater runoff adopted by [county name] County for the [Watershed Name] Watershed as required by the Act of October 4, 1978, P.L. 864, (Act 167), as amended, and known as the “Stormwater Management Act”.
Stream – A Watercourse.
Subarea – The smallest unit of watershed breakdown for hydrologic modeling purposes for which the runoff control criteria have been established in the Stormwater Management Plan.
Subdivision – The division or redivision of a lot, tract or parcel of land by any means into two or more lots, tracts, parcels or other divisions of land including changes in existing lot lines for the purpose, whether immediate or future, of lease, partition by the court for distribution to heirs or devisees, transfer of ownership or building or lot development: provided, however, that the subdi-vision by lease of land for agricultural purposes into parcels of more than ten acres, not involving and new street or easement of access or any residential dwelling, shall be exempted.

13
Surface Waters of the Commonwealth – Any and all rivers, streams, creeks, rivulets, impound-ments, ditches, watercourses, storm sewers, lakes, dammed water, wetlands, ponds, springs and all other bodies or channels of conveyance of surface water, or parts thereof, whether natural or artificial, within or on the boundaries of this Commonwealth.
Swale – A low-lying stretch of land which gathers or carries surface water runoff. See also Veg-etated Swale.
Trash/Debris Collectors – Racks, screens or other similar devices installed in a storm drainage system to capture coarse pollutants (trash, leaves, etc.).
Vegetated Buffers – Gently sloping areas that convey stormwater as sheet flow over a broad, densely vegetated earthen area, possibly coupled with the use of level spreading devices. As wa-ter quality BMPs, vegetated buffers serve to filter pollutants from runoff and promote infiltra-tion. Vegetated buffers should be situated on minimally disturbed soils, have low-flow velocities and extended residence times. Vegetated buffers may be, but are not restricted to, use in riparian (streamside) conditions.
Vegetated Roofs – Vegetated systems installed on roofs that generally consist of a waterproof layer, a root-barrier, drainage layer (optional), growth media, and suitable vegetation. Vegetated roofs store and eventually evapotranspirate the collected rooftop rainfall; overflows may be pro-vided for larger storms.
Vegetated Swales – Vegetated earthen channels designed to convey and possibly treat stormwater. As water quality BMPs, these are broad, shallow, densely vegetated, earthen channels designed to treat stormwater through infiltration, evapotranspiration, and sedimentation. Swales should be gently sloping with low flow velocities to prevent erosion. Check dams may be added to enhance performance.
Watercourse – Any channel of conveyance of surface water having defined bed and banks, wheth-er natural or artificial, with perennial or intermittent flow.
Water Quality Inserts – Any number of commercially available devices that are inserted into storm inlets to capture sediment, oil, grease, metals, trash, debris, etc.
Water Quality Volume (WQv) – The increase in volume on a development site associated with a 2-year, 24-hour storm event.
Watershed – The entire region or area drained by a river or other body of water, whether natural or artificial.
Wet Detention Ponds – Basins that provide for necessary stormwater storage as well as a perma-nent pool of water. To be successful, wet ponds must have adequate natural hydrology (both runoff inputs as well as soils and water table which allow for maintenance of a permanent pool of water) and must be able to support a healthy aquatic community so as to avoid creation of mosquito and other health and nuisance problems.

14
ARTICLE 3STORMWATER MANAGEMENT REQUIREMENTS
SECTION 301. GENERAL REQUIREMENTS
A. All Regulated Activities in the municipality shall be subject to the stormwater manage-ment requirements of this Ordinance.
B. Storm drainage systems shall be designed to preserve natural watercourses except as modified by stormwater detention facilities, recharge facilities, water quality facilities, pipe systems or open channels consistent with this Ordinance.
C. The existing locations of concentrated drainage discharge onto adjacent property shall not be altered without written approval of the affected property owner(s).
D. Areas of existing diffused drainage discharge onto adjacent property shall be managed such that, at minimum, the peak diffused flow does not increase in the general direc-tion of discharge, except as otherwise provided in this Ordinance. If diffused flow is proposed to be concentrated and discharged onto adjacent property, the developer must obtain the written approval of the affected property owner(s). Areas of existing diffused drainage discharge shall be subject to any applicable release rate criteria in the general direction of existing discharge whether they are proposed to be concentrated or main-tained as diffused drainage areas.
E. Where a site is traversed by watercourses other than those for which a 100-year flood-plain is defined by the municipality, there shall be provided drainage easements con-forming substantially with the line of such watercourses. The width of any easement shall be adequate to provide for unimpeded flow of storm runoff based on calculations made in conformance with Section 308 for the 100-year return period runoff and to pro-vide a freeboard allowance of one-half (0.5) foot above the design water surface level. The terms of the easement shall prohibit excavation, the placing of fill or structures, and any alterations which may adversely affect the flow of stormwater within any portion of the easement. Also, periodic maintenance of the easement to ensure proper runoff con-veyance shall be required. Watercourses for which the 100-year floodplain is formally defined are subject to the applicable municipal floodplain regulations.
F. Post construction BMPs shall be designed, installed, operated and maintained to meet the requirements of the Clean Streams Law and implementing regulations, including the established practices in 25 Pa. Code Chapter 102 and the specifications of this Or-dinance as to prevent accelerated erosion in watercourse channels and at all points of discharge.
G. No Earth Disturbance Activities associated with any Regulated Activities shall com-mence until approval by the municipality of a plan which demonstrates compliance with the requirements of this Ordinance.

15
H. Techniques described in Appendix E (Low Impact Development) of this Ordinance are encouraged because they reduce the costs of complying with the requirements of this Ordinance and the State Water Quality Requirements.
SECTION 302. PERMIT REQUIREMENTS BY OTHER GOVERNMENT ENTITIES
A. The following permit requirements apply to certain Regulated and Earth Disturbance Activities and must be met prior to commencement of Regulated and Earth Disturbance Activities, as applicable:
1. All Regulated and Earth Disturbance Activities subject to permit requirements by DEP under regulations at 25 Pa. Code Chapter 102.
2. Work within natural drainageways subject to permit by DEP under 25 Pa. Code Chapter 102 and Chapter 105.
3. Any stormwater management facility that would be located in or adjacent to sur-face waters of the Commonwealth, including wetlands, subject to permit by DEP under 25 Pa. Code Chapter 105.
4. Culverts, bridges, storm sewers or any other facilities which must pass or convey flows from the tributary area and any facility which may constitute a dam subject to permit by DEP under 25 Pa. Code Chapter 105.
SECTION 303. EROSION AND SEDIMENT CONTROL DURING REGULATED EARTH DISTURBANCE ACTIVITIES
No Regulated Earth Disturbance Activities within the municipality shall commence un-A. til approval by the municipality of an Erosion and Sediment Control Plan for construc-tion activities. Written approval by DEP or a delegated County Conservation District shall satisfy this requirement.
A written Erosion and Sediment Control Plan is required by DEP regulations for any B. Earth Disturbance Activity of 5,000 square feet or more under Pa. Code § 102.4(b).
A DEP NPDES Stormwater Discharges Associated with Construction Activities Permit C. is required for Regulated Earth Disturbance Activities of one acre or greater under Pa. Code Chapter 102.
Evidence of any necessary permit(s) for Regulated Earth Disturbance Activities from D. the appropriate DEP regional office or County Conservation District must be provided to the municipality before the commencement of an Earth Disturbance Activity.

16
A copy of the Erosion and Sediment Control Plan and any permit, as required by DEP E. regulations, shall be available at the project site at all times.
SECTION 304. POST CONSTRUCTION WATER QUALITY CRITERIA
A. No Regulated Earth Disturbance Activities within the municipality shall commence until approval by the municipality of a Drainage Plan which demonstrates compliance with this Ordinance.
B. The Water Quality Volume (WQv) shall be captured and treated with evapotranspiration and/or direct recharge BMPs. The WQv shall be calculated as the difference in runoff volume from pre-development to post-development for the 24-hour, 2-year return pe-riod storm. This may be calculated using either the Soil-Cover-Complex Method or Rational Method using the 2-year rainfall depth as noted in Section 308.H. The effect of closed depressions on the site shall be considered in this calculation. The WQv shall be captured and treated in a manner consistent with the standards outlined in Section 305 of the Ordinance.
C. The WQv shall be calculated for each post-development drainage direction on a site for sizing BMPs. Site areas having no impervious cover and no proposed disturbance during development may be excluded from the WQv calculations and do not require treatment.
D. For sites within watersheds with High Quality (HQ) or Exceptional Value (EV) waters as designated by DEP, if an applicant is proposing to use a BMP that ponds water on the land surface and may receive direct sunlight, the discharge from that BMP must be treated by infiltration, a vegetated buffer, filter strip, bioretention, vegetated swale or other BMP that provides a thermal benefit to protect the designated waters from ther-mal impacts.
E. Sites where applicants intend to use infiltration BMPs must meet the following crite-ria:
• DepthtobedrockbelowtheinvertoftheBMPgreaterthanorequalto2feet.• Depth to seasonalhighwater tablebelow the invertof theBMPgreater thanor
equal to 2 feet; except for infiltration of residential roof runoff where the seasonal high water table must be below the invert of the BMP.
• Soil permeability (as measured using the standards listed inAppendix C of thePennsylvania Stormwater Best Practices Manual) greater than or equal to 0.1 inch-es/hour and less than or equal to 10 inches per hour.
• Setbackdistancesorbuffersasfollows: – 100 feet from water supply wells, or 50 feet in residential development. – 10 feet downgradient or 100 feet upgradient from building foundations. – 50 feet from septic system drainfields.

17
F. Site areas proposed for infiltration shall be protected from disturbance and compaction except as necessary for construction of infiltration BMPs.
G. If infiltration of the entire WQv is not proposed, the remainder of the WQv shall be treated by acceptable BMPs for each discharge location. Acceptable BMPs are listed in Appendix F.
H. Stormwater runoff from Hot Spot land uses shall be pre-treated. Guidance regarding acceptable methods of pre-treatment is located in Appendix F.
I. The use of infiltration BMPs is prohibited on Hot Spot land use areas unless the ap-plicant can demonstrate that existing and proposed site conditions, including any pro-posed runoff pretreatment, create conditions suitable for runoff infiltration under this Ordinance.
J. Applicants shall request, in writing, Public Water Suppliers to provide the Zone I Well-head Protection radius, as calculated by the method outlined in the Pennsylvania De-partment of Environmental Protection Wellhead Protection regulations, for any public water supply well within 400 feet of the site. In addition to the setback distances speci-fied in Section 304.E, infiltration is prohibited in the Zone I radius as defined and sub-stantiated by the Public Water Supplier in writing. If the applicant does not receive a response from the Public Water Supplier, the Zone I radius is assumed to be 100 feet.
K. The municipality may, after consultation with DEP, approve alternative methods for meeting the State Water Quality Requirements other than those in this Ordinance, pro-vided that they meet the minimum requirements of, and do not conflict with, State law including but not limited to the Clean Streams Law.
SECTION 305. EXISTING WATER BALANCE PRESERVATION STANDARDS
A. The entire WQv as calculated in Section 304.B of this Ordinance shall be captured and treated by either direct recharge (D-RE) or evapotranspiration (ET) BMPs.
B. Lawn area up to a maximum of 33% of the entire site area may be allowed to bypass water quality BMPs. As much proposed impervious area as practical shall be directed to water quality BMPs.
C. Existing impervious area that is not proposed to be treated by D-RE BMPs should be excluded from all water balance calculations.
D. A maximum of 30% of the total annual rainfall for a site may be directly recharged to groundwater using direct recharge (D-RE) BMPs, for runoff from impervious areas.

18
1. For development sites with greater than 33% proposed impervious cover:
a. If all impervious cover is directed to ET BMPs to capture the entire 2 year, 24 hour event, the D-RE standard is met.
b. Up to 33% of the site as impervious cover may be directed to D-RE BMPs designed to capture the entire 2 year, 24 hour event. All remaining impervi-ous cover shall be directed to ET BMPs designed to capture the remainder of the WQv.
c. For ET and/or D-RE BMPs designed for runoff from impervious areas de-signed to capture less than entire 2 year, 24 hour event, Appendix C shall be used to assure that the maximum D-RE standard is met.
2. For development sites with less than 33% proposed impervious cover, all pro-posed impervious and the entire WQv may be directed to D-RE BMPs.
3. The maximum 30% D-RE standard applies on an overall site basis, rather than in each drainage direction.
SECTION 306. STORMWATER MANAGEMENT DISTRICTS
A. Mapping of Stormwater Management Districts - To implement the provisions of the [Watershed Name] Watershed Stormwater Management Plan, the municipality is hereby divided into Stormwater Management Districts consistent with the [Watershed Name] Release Rate Map presented in the Plan Update. The boundaries of the Stormwater Management Districts are shown on an official map which is available for inspection at the municipal office. A copy of the official map at a reduced scale is included in Ap-pendix A for general reference.
B. Description of Stormwater Management Districts – The 10-, 25-, and 100-year post-development peak runoff must be controlled to the stated percentage of the pre-devel-opment peak. Release Rates associated with the 10- through 100-year events vary from 50% to 100% depending upon location in the watershed.
SECTION 307. STORMWATER MANAGEMENT DISTRICT IMPLEMENTATION PROVISIONS
A. Applicants shall provide a comparative pre- and post construction stormwater manage-ment hydrograph analysis for each direction of discharge and for the site overall to demonstrate compliance with the provisions of this Ordinance.
B. Any stormwater management controls required by this Ordinance and subject to re-lease rate criteria shall meet the applicable release rate criteria for each of the 10-, 25-

19
and 100-year return period runoff events consistent with the calculation methodology specified in Section 308.
C. The exact location of the Stormwater Management District boundaries as they apply to a given development site shall be determined by mapping the boundaries using the two-foot topographic contours provided as part of the Drainage Plan. The District bound-aries as originally drawn coincide with topographic divides or, in certain instances, are drawn from the intersection of the watercourse and a physical feature such as the confluence with another watercourse or a potential flow obstruction (e.g. road, culvert, bridge, etc.). The physical feature is the downstream limit of the subarea and the sub-area boundary is drawn from that point up slope to each topographic divide along the path perpendicular to the contour lines.
D. Any capacity analysis conducted in accordance with this Ordinance shall use the fol-lowing criteria for determining adequacy for accepting peak flow rates:
1. Natural or man-made channels or swales must be able to convey the runoff asso-ciated with a 2-year return period event within their banks at velocities consistent with protection of the channels from erosion.
2. Natural or man-made channels or swales, culverts, bridges, storm sewers or any other facilities which must convey flows from the tributary area must be able to convey the 25-year return period runoff.
E. For a proposed development site located within one release rate category subarea, the total runoff from the site shall meet the applicable release rate criteria. For development sites with multiple directions of runoff discharge, individual drainage directions may be designed for up to a 100% release rate so long as the total runoff from the site is controlled to the applicable release rate.
F. For a proposed development site located within two or more release rate category sub-areas, the peak discharge rate from any subarea shall be the pre-development peak discharge for that subarea multiplied by the applicable release rate. The calculated peak discharges shall apply regardless of whether the grading plan changes the drainage area by subarea. An exception to the above may be granted if discharges from multiple sub-areas re-combine in proximity to the site. In this case, peak discharge in any direction may be a 100% release rate provided that the overall site discharge meets the weighted average release rate.
G. For sites straddling major watershed divides (i.e. Perkiomen and Saucon or Little Le-high), runoff volumes shall be managed to prevent diversion of runoff between water-sheds, as practicable.
H. Within a release rate category area, for a proposed development site which has areas which drain to a closed depression(s), the design release from the site will be the lesser of (a) the applicable release rate flow assuming no closed depression(s) or (b) the ex-

20
isting peak flow actually leaving the site. In cases where (b) would result in an unrea-sonably small design release, the design discharge of less than or equal to the release rate will be determined by the available downstream conveyance capacity to the main channel calculated using Section 307.D and the minimum orifice criteria.
I. Off-site areas which drain through a proposed development site are not subject to release rate criteria when determining allowable peak runoff rates. However, on-site drainage facilities shall be designed to safely convey off-site flows through the development site using the capacity criteria in Section 307.D and the detention criteria in Section 308. In addition to the criteria in section 307.D, on-site conveyance systems designed to carry runoff to a detention basin must be able to transport the basin’s 100-year tributary flow either in-system, in-gutter, or overland.
J. For development sites proposed to take place in phases, all detention ponds shall be designed to meet the applicable release rate(s) applied to all site areas tributary to the proposed pond discharge direction. All site tributary areas will be assumed as devel-oped, regardless of whether all site tributary areas are proposed for development at that time. An exception shall be sites with multiple detention ponds in series where only the downstream pond must be designed to the stated release rate.
K. Where the site area to be impacted by a proposed development activity differs signifi-cantly from the total site area, only the proposed impact area shall be subject to the release rate criteria. The impact area includes any proposed cover or grading changes.
L. Development proposals which, through groundwater recharge or other means, do not increase either the rate or volume of runoff discharged from the site compared to pre-development are not subject to the release rate provisions of this Ordinance.
M. Regional Detention Alternatives - For certain areas within the study area, it may be more cost-effective to provide one control facility for more than one development site than to provide an individual control facility for each development site. The initiative and funding for any regional runoff control alternatives are the responsibility of pro-spective developers. The design of any regional control basins must incorporate reason-able development of the entire upstream watershed. The peak outflow of a regional ba-sin would be determined based on the required release rate at the point of discharge.
SECTION 308. CALCULATION METHODOLOGY
A. Stormwater runoff from all development sites shall be calculated using either the Ra-tional Method or the Soil-Cover-Complex methodology.
B. The design of any detention basin intended to meet the requirements of this Ordi-nance shall be verified by routing the design storm hydrograph through the proposed basin using the storage indication method or other methodology demonstrated to be more appropriate. For basins designed using the Rational Method technique, the design

21
hydrograph for routing shall be either the Universal Rational Hydrograph or another Rational hydrograph that closely approximates the volume of the Universal Rational hydrograph.
C. BMPs designed to store or infiltrate runoff and discharge to surface runoff or pipe flow shall be routed using the storage indication method.
D. BMPs designed to store or infiltrate runoff and discharge to surface runoff or pipe flow shall provide storage volume for the full WQv below the lowest outlet invert.
E. Wet Detention Ponds designed to have a permanent pool for the WQv shall assume that the permanent pool volume below the primary outlet is full at the beginning of design event routing for the purposes of evaluating peak outflows.
F. All above-ground stormwater detention facilities shall provide a minimum 0.5 feet of freeboard above the maximum pool elevation associated with the 2- through 100-year runoff events, or an additional ten percent of the 100-year storage volume as freeboard volume, whichever is greater. All below-ground stormwater detention and infiltration facilities shall have an additional ten percent of the 100-year storage volume avail-able within the storage medium, as well as a minimum of 0.5 feet of freeboard. The freeboard shall be measured from the maximum pool elevation to the invert of the emergency spillway for above-ground facilities, and from the maximum pool elevation to the lowest overflow elevation for below-ground facilities. The 2- through 100-year storm events shall be controlled by the primary outlet structure. An emergency spillway for each above-ground basin shall be designed to pass the 100-year return frequency storm peak basin inflow rate with a minimum 0.5 foot freeboard measured to the top of basin. The freeboard criteria shall be met considering any off-site areas tributary to the basin as developed, as applicable. Exceptions to the freeboard requirements are as follows:
1. Bioretention BMPs with a ponded depth less than or equal to 0.5 feet are exempt from the freeboard requirements.
2. Small detention basins, with a ponded depth less than or equal to 1.5 feet or having a depth to the top of the berm less than or equal to 2.5 feet, may provide twenty percent additional storage volume measured from the maximum ponded depth to the invert of the emergency spillway in lieu of the above requirements. The depth of the emergency spillway must be sufficient to pass either two times the 100-year peak or the 100-year peak with 0.2’ of freeboard to the top of berm, whichever is greater.
3. Small infiltration basins, with a ponded depth less than or equal to 1.5 feet or having a depth to the top of the berm less than or equal to 2.5 feet, may provide twenty percent additional storage volume measured from the maximum ponded depth to the top of the berm in lieu of the above requirements. In this case, an emergency spillway is only necessary if runoff in excess of the basin volume
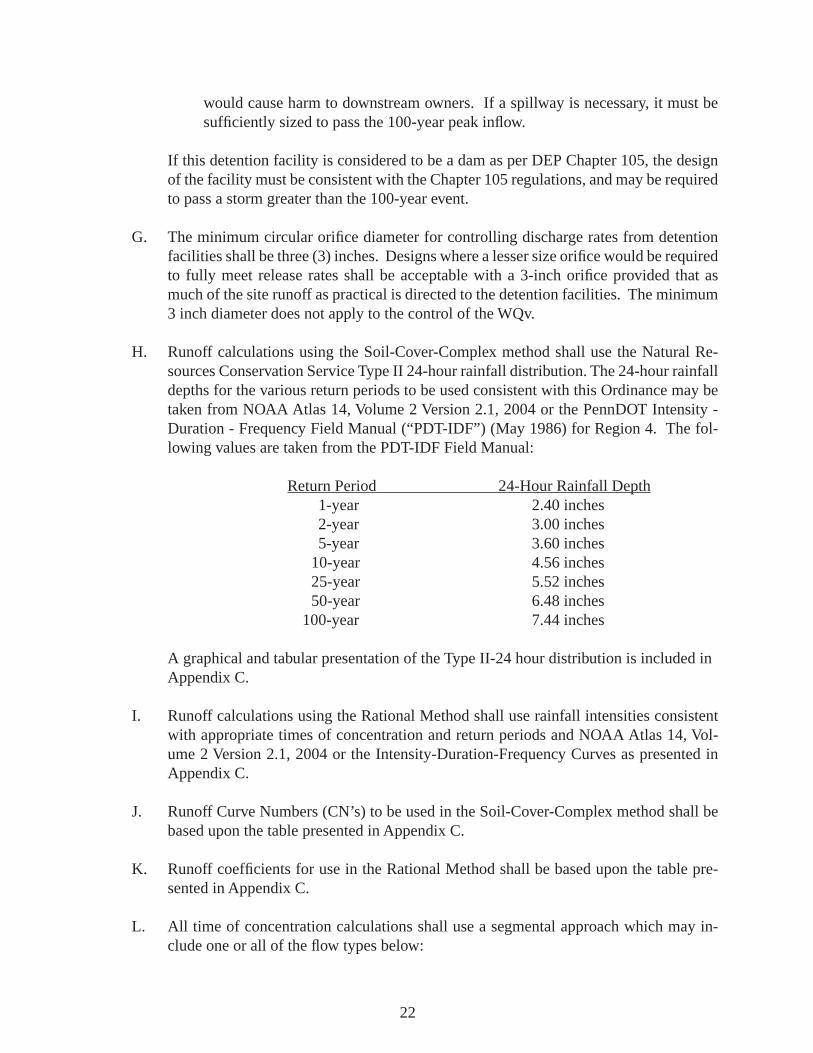
22
would cause harm to downstream owners. If a spillway is necessary, it must be sufficiently sized to pass the 100-year peak inflow.
If this detention facility is considered to be a dam as per DEP Chapter 105, the design of the facility must be consistent with the Chapter 105 regulations, and may be required to pass a storm greater than the 100-year event.
G. The minimum circular orifice diameter for controlling discharge rates from detention facilities shall be three (3) inches. Designs where a lesser size orifice would be required to fully meet release rates shall be acceptable with a 3-inch orifice provided that as much of the site runoff as practical is directed to the detention facilities. The minimum 3 inch diameter does not apply to the control of the WQv.
H. Runoff calculations using the Soil-Cover-Complex method shall use the Natural Re-sources Conservation Service Type II 24-hour rainfall distribution. The 24-hour rainfall depths for the various return periods to be used consistent with this Ordinance may be taken from NOAA Atlas 14, Volume 2 Version 2.1, 2004 or the PennDOT Intensity - Duration - Frequency Field Manual (“PDT-IDF”) (May 1986) for Region 4. The fol-lowing values are taken from the PDT-IDF Field Manual:
Return Period 24-Hour Rainfall Depth 1-year 2.40 inches 2-year 3.00 inches 5-year 3.60 inches 10-year 4.56 inches 25-year 5.52 inches 50-year 6.48 inches 100-year 7.44 inches
A graphical and tabular presentation of the Type II-24 hour distribution is included in Appendix C.
I. Runoff calculations using the Rational Method shall use rainfall intensities consistent with appropriate times of concentration and return periods and NOAA Atlas 14, Vol-ume 2 Version 2.1, 2004 or the Intensity-Duration-Frequency Curves as presented in Appendix C.
J. Runoff Curve Numbers (CN’s) to be used in the Soil-Cover-Complex method shall be based upon the table presented in Appendix C.
K. Runoff coefficients for use in the Rational Method shall be based upon the table pre-sented in Appendix C.
L. All time of concentration calculations shall use a segmental approach which may in-clude one or all of the flow types below:

23
1. Sheet Flow (overland flow) calculations shall use either the NRCS average ve-locity chart (Figure 3-1, Technical Release-55, 1975) or the modified kinematic wave travel time equation (equation 3-3, NRCS TR-55, June 1986). If using the modified kinematic wave travel time equation, the sheet flow length shall be lim-ited to 50 feet for designs using the Rational Method and limited to 150 feet for designs using the Soil-Cover-Complex method.
2. Shallow Concentrated Flow travel times shall be determined from the watercourse slope, type of surface and the velocity from Figure 3-1 of TR-55, June 1986.
3. Open Channel Flow travel times shall be determined from velocities calculated by the Manning Equation. Bankfull flows shall be used for determining veloci-ties. Manning ‘n’ values shall be based on the table presented in Appendix C.
4. Pipe Flow travel times shall be determined from velocities calculated using the Manning Equation assuming full flow and the Manning ‘n’ values from Appendix C.
M. If using the Rational Method, all pre-development calculations for a given discharge di-rection shall be based on a common time of concentration considering both on-site and any off-site drainage areas. If using the Rational Method, all post-development calcula-tions for a given discharge direction shall be based on a common time of concentration considering both on-site and any off-site drainage areas.
N. When conditions exist such that a proposed detention facility may experience a tailwa-ter effect, the basin shall be analyzed without any tailwater effect for all storm events for comparison against the required Release Rates. An additional routing of the 100-year storm with the full tailwater effect shall be performed to check that the basin has sufficient storage to contain the 100-year tributary flow with a tailwater.
O. The Manning Equation shall be used to calculate the capacity of watercourses. Man-ning ‘n’ values used in the calculations shall be consistent with the table presented in Appendix C or other appropriate standard engineering ‘n’ value resources. Pipe capaci-ties shall be determined by methods acceptable to the municipality.
P. The Pennsylvania DEP, Chapter 105, Rules and Regulations, apply to the construction, modification, operation or maintenance of both existing and proposed dams, water ob-structions and encroachments throughout the watershed. Criteria for design and con-struction of stormwater management facilities according to this Ordinance may differ from the criteria that are used in the permitting of dams under the Dam Safety Pro-gram.
24
ARTICLE 4DRAINAGE PLAN REQUIREMENTS
SECTION 401. GENERAL REQUIREMENTS
For any of the Regulated Activities of this Ordinance, prior to the final approval of subdivi-sion and/or land development plans, or the issuance of any permit, or the commencement of any Regulated Earth Disturbance Activity, the owner, subdivider, developer or his agent shall submit a Drainage Plan and receive municipal approval of the Plan.
SECTION 402. EXEMPTIONS
Exemptions from the Drainage Plan Requirements are as specified in Section 106.
SECTION 403. DRAINAGE PLAN CONTENTS
The following items shall be included in the Drainage Plan:
A. General
1. General description of project.
2. General description of proposed permanent stormwater controls.
3. The name and address of the project site, the name and address of the owner of the property and the name of the individual or firm preparing the Drainage Plan.
B. Map(s) of the Project Area Showing:
1. The location of the project relative to highways, municipalities or other identifi-able landmarks.
2. Existing contours at intervals of two (2) feet. In areas of steep slopes (greater than 15%), five-foot contour intervals may be used. Off-site drainage areas impacting the project including topographic detail.
3. Streams, lakes, ponds or other bodies of water within the project area.
4. Other features including flood hazard boundaries, existing drainage swales, wet-lands, closed depressions, sinkholes and areas of natural vegetation to be pre-served.

25
5. Locations of proposed underground utilities, sewers and water lines. The loca-tions of all existing and proposed utilities, sanitary sewers and water lines within 50 feet of property lines of the project site.
6. An overlay showing soil types and boundaries based on the county soil survey, as applicable, latest edition. Any hydric soils present on the site should be identified as such.
7. An overlay showing geologic types, boundaries and any special geologic features present on the site.
8. Proposed changes to land surface and vegetative cover.
9. Proposed structures, roads, paved areas and buildings.
10. Final contours at intervals of two (2) feet. In areas of steep slopes (greater than 15%), five-foot contour intervals may be used.
11. Stormwater Management District boundaries applicable to the site.
12. Clear identification of the location and nature of permanent stormwater BMPs.
13. An adequate access easement around all stormwater BMPs that would provide municipal ingress to and egress from a public right-of-way.
14. A schematic showing all tributaries contributing flow to the site and all existing man-made features beyond the property boundary that would be affected by the project.
15. The location of all public water supply wells within 400 feet of the project and all private water supply wells within 100 feet of the project.
C. Stormwater Management Controls and BMPs
1. All stormwater management controls and BMPs shall be shown on a map and described, including:
a. Groundwater recharge methods such as seepage pits, beds or trenches. When these structures are used, the locations of septic tank infiltration areas and wells shall be shown.
b. Other control devices or methods such as roof-top storage, semi-pervious paving materials, grass swales, parking lot ponding, vegetated strips, deten-tion or retention ponds, storm sewers, etc.

26
2. All calculations, assumptions and criteria used in the design of the BMPs shall be shown.
3. All site testing data used to determine the feasibility of infiltration on a site.
4. All details and specifications for the construction of the stormwater management controls and BMPs.
D. The BMP Operations and Maintenance Plan, as required in Article 7, describing how each permanent stormwater BMP will be operated and maintained and the identity of the person(s) responsible for operations and maintenance. A statement must be in-cluded, signed by the landowner, acknowledging that the stormwater BMPs are fixtures that cannot be altered or removed without approval by the municipality.
SECTION 404. PLAN SUBMISSION
A. For Regulated Activities specified in Sections 105.A. and 105.B.:
1. The Drainage Plan shall be submitted by the developer to the municipal secretary (or other appropriate person) as part of the Preliminary Plan submission for the subdivision or land development.
2. Four (4) copies of the Drainage Plan shall be submitted.
3. Distribution of the Drainage Plan will be as follows:
a. One (1) copy to the municipal governing body.
b. One (1) copy to the municipal engineer.
c. Two (2) copies to the Lehigh Valley Planning Commission (LVPC), except for Drainage Plans involving less than 10,000 square feet of additional im-pervious cover.
4. Drainage Plans involving more than 10,000 square feet of additional impervious
cover shall be submitted by the developer (possibly through the municipality) to the LVPC as part of the Preliminary Plan submission. The LVPC will conduct an advisory review of the Drainage Plan for consistency with the [Watershed Name] Watershed Stormwater Management Plan. The LVPC will not review details of the Erosion and Sedimentation Plan or the BMP Operations and Maintenance Plan.
a. Two (2) copies of the Drainage Plan shall be submitted.

27
b. The LVPC will provide written comments to the developer and the munici-pality, within a time frame consistent with established procedures under the Municipalities Planning Code, as to whether the Drainage Plan has been found to be consistent with the Stormwater Management Plan.
B. For Regulated Activities specified in Sections 105.C. and 105.D., the Drainage Plan shall be submitted by the developer to the municipal building permit officer as part of the building permit application.
C. For Regulated Activities specified in Sections 105.E., 105.F. and 105.G.:
1. The Drainage Plan shall be submitted by the developer to the Lehigh Valley Plan-ning Commission for coordination with the DEP permit application process under Chapter 105 (Dam Safety and Waterway Management), Chapter 106 (Flood Plain Management) of DEP’s Rules and Regulations and the NPDES regulations.
2. One (1) copy of the Drainage Plan shall be submitted.
D. Earthmoving for all Regulated Activities under Section 105 shall be conducted in ac-cordance with the current Federal and State regulations relative to the NPDES and DEP Chapter 102 regulations.
SECTION 405. DRAINAGE PLAN REVIEW
A. The municipality shall review the Drainage Plan, including the BMP Operations and Maintenance Plan, for consistency with this Ordinance. The municipality shall also review the Drainage Plan against any additional storm drainage provisions contained in the municipal subdivision and land development or zoning ordinance, as applicable.
B. The municipality shall notify the applicant in writing whether the Drainage Plan, in-cluding the BMP Operations and Maintenance Plan, is approved, consistent with time-frames as established by the current Pennsylvania Municipalities Planning Code.
C. The municipality shall not approve any subdivision or land development (Regulated Activities 105.A. and 105.B.) or building permit application (Regulated Activities 105.C. and 105.D.) if the Drainage Plan has been found to be inconsistent with this Ordinance.
D. The municipality may require an “As-Built Survey” of all stormwater BMPs and an explanation of any discrepancies with the Drainage Plan.
SECTION 406. MODIFICATION OF PLANS
A modification to a Drainage Plan for a proposed development site which involves a change in control methods or techniques, or which involves the relocation or redesign of control measures, or which is necessary because soil or other conditions are not as stated on the Drainage Plan (as

28
determined by the municipality) shall require a resubmission of the modified Drainage Plan con-sistent with Section 404 subject to review per Section 405 of this Ordinance.
SECTION 407. HARDSHIP WAIVER PROCEDURE
The municipality may hear requests for waivers where it is alleged that the provisions of this Ordinance inflict unnecessary hardship upon the applicant. The waiver request shall be in writing and accompanied by the requisite fee based upon a fee schedule adopted by the municipality. A copy of the waiver request shall be provided to each of the following: municipality, municipal en-gineer, municipal solicitor and Lehigh Valley Planning Commission. The request shall fully docu-ment the nature of the alleged hardship.
The municipality may grant a waiver provided that all of the following findings are made in a given case:
1. That there are unique physical circumstances or conditions, including irregular-ity of lot size or shape, or exceptional topographical or other physical conditions peculiar to the particular property, and that the unnecessary hardship is due to such conditions, and not the circumstances or conditions generally created by the provisions of this Ordinance in the Stormwater Management District in which the property is located;
2. That because of such physical circumstances or conditions, there is no possibility that the property can be developed in strict conformity with the provisions of this Ordinance and that the authorization of a waiver is therefore necessary to enable the reasonable use of the property;
3. That such unnecessary hardship has not been created by the applicant;
4. That the waiver, if authorized, will represent the minimum waiver that will afford relief and will represent the least modification possible of the regulation in issue; and
5. That financial hardship is not the criteria for granting of a hardship waiver.
In granting any waiver, the municipality may attach such conditions and safeguards as it may deem necessary to implement the purposes of this Ordinance. If a Hardship Waiver is granted, the applicant must still manage the quantity, velocity, direction and quality of result-ing storm runoff as is necessary to prevent injury to health, safety or other property.
A. For Regulated Activities described in Section 105.A. and B., the [municipal governing body] shall hear requests for and decide on hardship waiver requests on behalf of the municipality.
B. For Regulated Activities in Section 105.C., D., E., F. and G., the Zoning Hearing Board shall hear requests for and decide on hardship waiver requests on behalf of the munici-pality.

29
C. The municipality shall not waive the water quality provisions of this Ordinance.
ARTICLE 5INSPECTIONS
SECTION 501. SCHEDULE OF INSPECTIONS
A. DEP or its designees (e.g. County Conservation District) normally ensure compliance with any permits issued, including those for stormwater management. In addition to DEP compliance programs, the municipality or its designee may inspect all phases of the construction, operations, maintenance and any other implementation of stormwater BMPs.
B. During any stage of the Regulated Earth Disturbance Activities, if the municipality or its designee determines that any BMPs are not being implemented in accordance with permit conditions or this Ordinance, the municipality may suspend or revoke any exist-ing permits issued by the municipality or other approvals issued by the municipality until the deficiencies are corrected.
ARTICLE 6FEES AND EXPENSES
SECTION 601. GENERAL
The municipality may charge a reasonable fee for review of the Drainage Plan, including the BMP Operations and Maintenance Plan, to defray review costs incurred by the municipality. The applicant shall pay all such fees.
SECTION 602. EXPENSES COVERED BY FEES
The fees required by this Ordinance shall at a minimum cover:
A. The review of the Drainage Plan, including the BMP Operations and Maintenance Plan, by the municipality.
B. The site inspection.
C. The inspection of required controls and improvements during construction.
D. The final inspection upon completion of the controls and improvements required in the plan.

30
E. Any additional work required to monitor and enforce any permit provisions, regulated by this Ordinance, correct violations, and assure the completion of stipulated remedial actions.
F. Administrative and clerical costs.
ARTICLE 7STORMWATER BMP OPERATIONS AND MAINTENANCE PLAN REQUIREMENTS
SECTION 701. GENERAL REQUIREMENTS
A. No Regulated Earth Disturbance Activities within the municipality shall commence until approval by the municipality of the BMP Operations and Maintenance Plan which describes how the permanent (e.g. post construction) stormwater BMPs will be prop-erly operated and maintained.
SECTION 702. RESPONSIBILITIES FOR OPERATIONS AND MAINTENANCE OF BMPS
A. The BMP Operations and Maintenance Plan for the project site shall establish respon-sibilities for the continuing operation and maintenance of all permanent stormwater BMPs, as follows:
1. If a Plan includes structures or lots which are to be separately owned and in which streets, sewers and other public improvements are to be dedicated to the municipality, stormwater BMPs may also be dedicated to and maintained by the municipality.
2. If a Plan includes operations and maintenance by a single owner or if sewers and other public improvements are to be privately owned and maintained, then the operation and maintenance of stormwater BMPs shall be the responsibility of the owner or private management entity.
B. The municipality shall make the final determination on the continuing operations and maintenance responsibilities. The municipality reserves the right to accept or reject the operations and maintenance responsibility for any or all of the stormwater BMPs.
SECTION 703. ADHERENCE TO APPROVED BMP OPERATIONS AND MAINTENANCE PLAN
It shall be unlawful to alter or remove any permanent stormwater BMP required by an ap-proved BMP Operations and Maintenance Plan or to allow the property to remain in a condition which does not conform to an approved BMP Operations and Maintenance Plan unless an excep-tion is granted in writing by the municipality.

31
SECTION 704. OPERATIONS AND MAINTENANCE AGREEMENT FOR PRIVATELY OWNED STORMWATER BMPS
A. The property owner shall sign an operations and maintenance agreement with the mu-nicipality covering all stormwater BMPs that are to be privately owned. The agreement shall be substantially the same as the agreement in Appendix D of this Ordinance.
B. Other items may be included in the agreement where determined by the municipality to be reasonable or necessary to guarantee the satisfactory operation and maintenance of all permanent stormwater BMPs. The agreement shall be subject to the review and approval of the municipality.
SECTION 705. STORMWATER MANAGEMENT EASEMENTS
Stormwater management easements shall be provided by the property owner if necessary for access for inspections and maintenance or for preservation of stormwater conveyance, infiltration, detention areas and other BMPs by persons other than the property owner. The purpose of the easement shall be specified in any agreement under Section 704.
SECTION 706. RECORDING OF APPROVED BMP OPERATIONS AND MAINTENANCE PLAN AND RELATED AGREEMENTS
A. The owner of any land upon which permanent BMPs will be placed, constructed or implemented, as described in the BMP Operations and Maintenance Plan, shall record the following documents in the county Office of the Recorder of Deeds, as applicable, within 90 days of approval of the BMP Operations and Maintenance Plan by the mu-nicipality:
1. The Operations and Maintenance Plan or a summary thereof.
2. Operations and Maintenance Agreements under Section 704.
3. Easements under Section 705.
B. The municipality may suspend or revoke any approvals granted for the project site upon discovery of the failure of the owner to comply with this Section.
SECTION 707. MUNICIPAL STORMWATER BMP OPERATIONS AND MAINTENANCE FUND
A. Persons installing stormwater BMPs shall be required to pay a specified amount to the Municipal Stormwater BMP Operations and Maintenance Fund to help defray costs of operations and maintenance activities. The amount may be determined as follows:

32
1. If the BMP is to be privately owned and maintained, the amount shall cover the cost of periodic inspections by the municipality in perpetuity, as determined by the municipality.
2. If the BMP is to be owned and maintained by the municipality, the amount shall cover the estimated costs for operation and maintenance in perpetuity, as deter-mined by the municipality.
3. The amount shall then be converted to present worth of the annual series values.
B. If a BMP is proposed that also serves as a recreation facility (e.g. ball field, lake), the municipality may adjust the amount due accordingly.
ARTICLE 8PROHIBITIONS
SECTION 801. PROHIBITED DISCHARGES
A. No person in the municipality shall allow or cause to allow stormwater discharges into the municipality’s separate storm sewer system which are not composed entirely of stormwater except as provided in subsection B below or as allowed under a State or Federal permit.
B. The following discharges are authorized unless they are determined to be significant contributors to pollution to the waters of this Commonwealth.
1. Discharges from fire fighting activities.
2. Potable water sources including dechlorinated water line and fire hydrant flush-ings.
3. Irrigation drainage.
4. Routine external building washdown which does not use detergents or other com-pounds.
5. Air conditioning condensate.
6. Water from individual residential car washing.
7. Springs.
8. Water from crawl space pumps.
9. Uncontaminated water from foundation or footing drains.

33
10. Flows from riparian habitats and wetlands.
11. Lawn watering.
12. Pavement washwaters where spills or leaks of toxic or hazardous materials have not occurred (unless all spill material has been removed) and where detergents are not used.
13. Dechlorinated swimming pool discharges.
14. Uncontaminated groundwater.
C. In the event that the municipality determines that any of the discharges identified in Section 801.B. significantly contribute to pollution of waters of the Commonwealth or is so notified by DEP, the municipality will notify the responsible person to cease the discharge.
D. Upon notice provided by the municipality under Section 801.C., the discharger will have a reasonable time, as determined by the municipality, to cease the discharge con-sistent with the degree of pollution caused by the discharge.
E. Nothing in this Section shall affect a discharger’s responsibilities under State law.
SECTION 802. PROHIBITED CONNECTIONS
A. The following connections are prohibited, except as provided in Section 801.B. above:
1. Any drain or conveyance, whether on the surface or subsurface, which allows any non-stormwater discharge including sewage, process wastewater and wash water to enter the separate storm sewer system and any connections to the storm drain system from indoor drains and sinks.
2. Any drain or conveyance connected from a commercial or industrial land use to the separate storm sewer system which has not been documented in plans, maps or equivalent records and approved by the municipality.
SECTION 803. ROOF DRAINS
A. Roof drains shall discharge to infiltration areas or vegetative BMPs to the maximum extent practicable.

34
ARTICLE 9RIGHT OF ENTRY, NOTIFICATION AND ENFORCEMENT
SECTION 901. RIGHT OF ENTRY
A. Upon presentation of proper credentials and with the consent of the land owner, duly authorized representatives of the municipality may enter at reasonable times upon any property within the municipality to inspect the implementation, condition or operation and maintenance of the stormwater BMPs or to investigate or ascertain the condition of the subject property in regard to any aspect regulated by this Ordinance.
B. In the event that the land owner refuses admission to the property, duly authorized rep-resentatives of the municipality may seek an administrative search warrant issued by a district justice to gain access to the property.
SECTION 902. NOTIFICATION
A. Whenever the municipality finds that a person has violated a prohibition or failed to meet a requirement of this Ordinance, the municipality may order compliance by writ-ten notice to the responsible person. Such notice may require without limitation:
1. The name of the owner of record and any other person against whom the munici-pality intends to take action.
2. The location of the property in violation.
3. The performance of monitoring, analyses and reporting.
4. The elimination of prohibited connections or discharges.
5. Cessation of any violating discharges, practices or operations.
6. The abatement or remediation of stormwater pollution or contamination hazards and the restoration of any affected property.
7. Payment of a fine to cover administrative and remediation costs.
8. The implementation of stormwater BMPs.
9. Operation and maintenance of stormwater BMPs.
B. Such notification shall set forth the nature of the violation(s) and establish a time limit for correction of the violation(s). Said notice may further advise that should the viola-tor fail to take the required action within the established deadline, the work will be done by the municipality or designee and the expense thereof, together with all related lien and enforcement fees, charges and expenses, shall be charged to the violator.

35
C. Failure to comply within the time specified shall also subject such person to the penalty provisions of this Ordinance. All such penalties shall be deemed cumulative and shall not prevent the municipality from pursuing any and all other remedies available in law or equity.
SECTION 903. PUBLIC NUISANCE
A. The violation of any provision of this Ordinance is hereby deemed a Public Nuisance.
B. Each day that an offense continues shall constitute a separate violation.
SECTION 904. SUSPENSION AND REVOCATION OF PERMITS AND APPROVALS
A. Any building, land development or other permit or approval issued by the municipality may be suspended or revoked by the municipality for:
1. Non-compliance with or failure to implement any provision of the permit.
2. A violation of any provision of this Ordinance.
3. The creation of any condition or the commission of any act during construction or development which constitutes or creates a hazard or nuisance, pollution or which endangers the life or property of others.
B. A suspended permit or approval shall be reinstated by the municipality when:
1. The municipality or designee has inspected and approved the corrections to the stormwater BMPs or the elimination of the hazard or nuisance.
2. The municipality is satisfied that the violation of the ordinance, law or rule and regulation has been corrected.
3. Payment of all municipal fees, costs and expenses related to or arising from the violation has been made.
C. A permit or approval which has been revoked by the municipality cannot be reinstated. The applicant may apply for a new permit under the procedures outlined in this Ordi-nance.
SECTION 905. PENALTIES
A. Any person, partnership or corporation who or which has violated the provisions of this Ordinance shall, upon being found liable therefore in a civil enforcement proceed-

36
ing commenced by the municipality, pay a judgment of not more than Five Hundred ($500.00) Dollars plus all court costs, including reasonable attorney’s fees incurred by the municipality as a result thereof. No judgment shall commence or be imposed, lev-ied or payable until the date of the determination of a violation by the district justice. If the defendant neither pays nor timely appeals the judgment, the municipality may enforce the judgment pursuant to a separate violation, unless the district justice, deter-mining that there has been a violation, further determines that there was a good faith basis for the person, partnership, or corporation violating this Chapter to have believed that there was no such violation, in which event there shall be deemed to have been only one such violation until the fifth (5th) day following the date of the determination of a violation by the district justice and thereafter each day that a violation continues shall constitute a separate violation.
B. The court of common pleas, upon petition, may grant an order of stay upon cause shown, tolling the per diem judgment pending a final adjudication of the violation and judgment.
C. Nothing contained in this Section shall be construed or interpreted to grant to any per-son or entity other than the municipality the right to commence any action for enforce-ment pursuant to this Section.
D. District justices shall have initial jurisdiction in proceedings brought under this Sec-tion.
E. In addition, the municipality, through its solicitor, may institute injunctive, mandamus or any other appropriate action or proceeding at law or in equity for the enforcement of this Ordinance. Any court of competent jurisdiction shall have the right to issue re-straining orders, temporary or permanent injunctions, mandamus or other appropriate forms of remedy or relief.
SECTION 906. APPEALS
Any person aggrieved by any action of the municipality or its designee relevant to the provisions of this Ordinance may appeal using the appeal procedures established in the Pennsylvania Municipalities Planning Code.

37
APPENDIX A (Not Included in Plan Copy of Ordinance)
A-1 Map of [Watershed Name] Watershed
A-2 Municipal Map of Stormwater Management Districts
APPENDIX B (Not Included in Plan Copy Text)
B-1 Map of Storm Drainage Problem Areas
B-2 Description of Storm Drainage Problem Areas

38
APPENDIX C
C-1 NRCS Type II 24-Hour Rainfall Distribution (Graph-ic & Tabular)
C-2 Intensity-Duration-Frequency Curves
C-3 Runoff Curve Numbers and Percent Imperviousness Values
C-4 Runoff Coefficients for the Rational Method
C-5 Manning ‘n’ Values
C-6 Percent D-RE per Fraction Impervious versus Stor-age Curve
C-7 Percent D-RE per Fraction Impervious versus Stor-age Curve Usage Instructions

C-1

C-2

C-3
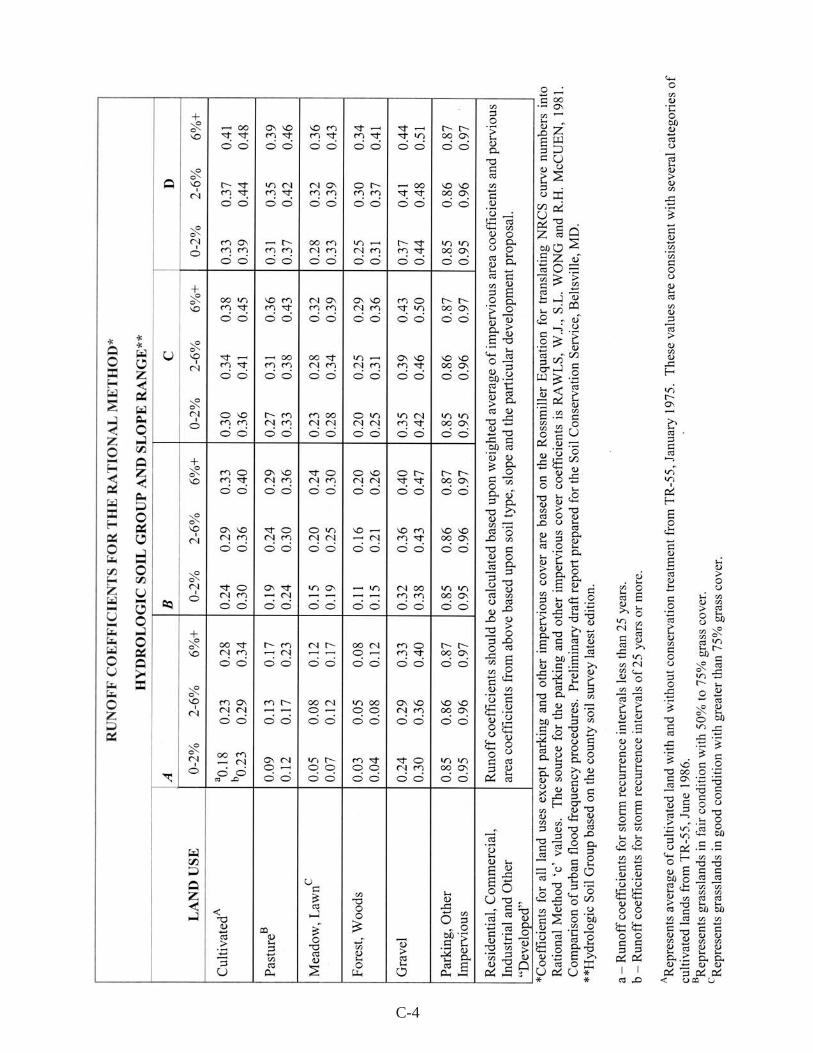
C-4

C-5

C-6

C-7
PERCENT D-RE PER FRACTION IMPERVIOUS VERSUS STORAGE CURVE USAGEINSTRUCTIONS
The “1st Stage D-RE” curve is based on impervious areas being diverted first to a D-RE BMP designed to capture less than the 2-year event, with the remaining 2-year runoff overflowing into an ET BMP. The “1st stage ET” curve is based on reversing the above. The curves may be used for the whole site, or for pieces of a site to achieve successful designs as follows:
A. If used for whole site designs, the “fraction I” used is the proposed impervious as a fraction of the entire site. As an example, for a 60% impervious site with all impervi-ous directed to a first stage D-RE BMP, use 30% D-RE with 0.60 fraction I to yield 50% D-RE/fraction I and translate into 0.42 inches of storage over impervious areas. The total first stage D-RE maximum BMP storage is 0.42 inches of depth times the surface area of the impervious cover. Similarly, if a first stage ET BMP followed by a second stage D-RE BMP was used, the minimum ET storage is 0.15 inches over the impervious cover.
B. If used for pieces of the site smaller than the whole site, the fraction I used is the imper-vious cover of the part of the site in question as a fraction of the area of the same piece. Each piece may be designed for 30% D-RE if desired, but individual pieces may exceed 30% D-RE provided all BMPs on site are providing less than 30% D-RE in aggregate. In this case, the BMP storage for each piece is used in the chart with the fraction I us-ing the whole site area to determine the contribution of each piece to the 30% D-RE allowable. As an example, still using the 60% impervious site, a piece of the site uses a D-RE BMP first. The piece is half of the total area of the site and is 80% impervious. The BMP is designed for 0.6 inches of runoff from the impervious surfaces. Using 0.6 inches of storage and a fraction I of 0.80, the piece is designed for (%D-RE/Fraction I = 60) 48% D-RE. The impervious cover in this piece has fraction I of 0.4 of the overall site acreage and, therefore, using 0.6 inches of storage and a fraction I of 0.4 yields a D-RE/ fraction I of 60% using the graph which solves to a D-RE of 24%. This means that this piece uses 24% of the allowable 30% D-RE. The remaining piece(s) will need to be designed for 6% or less D-RE. The remaining piece in this example has a fraction I of the overall site of 0.2. Using 6% D-RE and a fraction I of 0.2 yields a D-RE/fraction I of 30%. Entering the graph at that value, the maximum storage for the piece in a first stage D-RE BMP is 0.2 inches over the impervious portion of its tributary area.
C. If more than two stages of ET and D-RE BMPs are used to control the WQv, the design considerations are as follows:
1. If the design has a first stage ET BMP draining to additional stage ET BMPs and subsequent D-RE BMP, add the storage volumes of the ET BMPs and use this volume as the first stage ET storage volume.
2. Similarly, if two or more D-RE BMPs are used first followed by an ET BMP, add the storage volumes of the D-RE BMPs and use this volume as the first stage D-RE storage volume.

C-8
3. In designs with more than two ET or D-RE BMPs used in series to control the WQv and rules C.1 and C.2 don’t apply, the chart shall be applied conservatively to assure the D-RE standard is not violated. For example, with proposed use of a first stage D-RE BMP, second stage ET BMP, and third stage D-RE BMP, all stor-age provided shall be assumed to be D-RE for use in the chart. Essentially, any ET BMP applied beyond the first stage will be ignored for purposes of determining compliance with the D-RE standard.

D-1
APPENDIX D
STORMWATER BEST MANAGEMENT PRACTICES OPERATIONS AND MAINTENANCE AGREEMENT
THIS AGREEMENT, made and entered into this ____________ day of _________, 200__, by and between ____________________________________, (hereinafter the “Landowner”), and ________________________________, ___________________________ County, Pennsylvania, (hereinafter “municipality”);
WITNESSETH WHEREAS, the Landowner is the owner of certain real property as recorded by deed in the land records of ________________ County, Pennsylvania, Deed Book ___________ at Page ______, (hereinafter “Property”).
WHEREAS, the Landowner is proceeding to build and develop the Property; and
WHEREAS, the stormwater management BMP Operations and Maintenance Plan approved by the municipality (hereinafter referred to as the “Plan”) for the property identified herein, which is attached hereto as Appendix A and made part hereof, as approved by the municipality, provides for management of stormwater within the confines of the Property through the use of Best Man-agement Practices (BMP’s); and
WHEREAS, the municipality, and the Landowner, his successors and assigns, agree that the health, safety, and welfare of the residents of the municipality and the protection and maintenance of water quality require that on-site stormwater Best Management Practices be constructed and maintained on the Property; and
WHEREAS, for the purposes of this agreement, the following definitions shall apply:• BMP – “Best Management Practice;” activities, facilities, designs, measures or
procedures used to manage stormwater impacts from land development, to protect and maintain water quality and groundwater recharge and to otherwise meet the purposes of the Municipal Stormwater Management Ordinance, including but not limited to infiltration trenches, seepage pits, filter strips, bioretention, wet ponds, permeable paving, rain gardens, grassed swales, vegetated buffers, sand filters and detention basins.
• InfiltrationTrench –A BMP surface structure designed, constructed, and main-tained for the purpose of providing infiltration or recharge of stormwater into the soil and/or groundwater aquifer,
• SeepagePit –AnundergroundBMPstructuredesigned, constructed, andmain-tained for the purpose of providing infiltration or recharge of stormwater into the soil and/or groundwater aquifer,
• RainGarden–ABMPoverlainwith appropriatemulch and suitable vegetationdesigned, constructed, and maintained for the purpose of providing infiltration or recharge of stormwater into the soil and/or underground aquifer; and

D-2
WHEREAS, the municipality requires, through the implementation of the Plan, that storm-water management BMPs as required by said Plan and the Municipal Stormwater Management Ordinance be constructed and adequately operated and maintained by the Landowner, his succes-sors and assigns; and
NOW, THEREFORE, in consideration of the foregoing promises, the mutual covenants contained herein, and the following terms and conditions, the parties hereto agree as follows:
1. The BMPs shall be constructed by the Landowner in accordance with the plans and specifications identified in the Plan.
2. The Landowner shall operate and maintain the BMP(s) as shown on the Plan in good working order acceptable to the municipality and in accordance with the specific main-tenance requirements noted on the Plan.
3. The Landowner hereby grants permission to the municipality, its authorized agents and employees, to enter upon the property, at reasonable times and upon presentation of proper identification, to inspect the BMP(s) whenever it deems necessary. Whenever possible, the municipality shall notify the Landowner prior to entering the property.
4. In the event the Landowner fails to operate and maintain the BMP(s) as shown on the Plan in good working order acceptable to the municipality, the municipality or its rep-resentatives may enter upon the Property and take whatever action is deemed necessary to maintain said BMP(s). This provision shall not be construed to allow the munici-pality to erect any permanent structure on the land of the Landowner. It is expressly understood and agreed that the municipality is under no obligation to maintain or repair said facilities, and in no event shall this Agreement be construed to impose any such obligation on the municipality.
5. In the event the municipality, pursuant to this Agreement, performs work of any nature, or expends any funds in performance of said work for labor, use of equipment, supplies, materials, and the like, the Landowner shall reimburse the municipality for all expenses (direct and indirect) incurred within 10 days of receipt of invoice from the municipality and if not timely paid, a municipal lien shall be placed upon the premises for 110% of the invoice amount, plus statutorily allowed fees, expenses and costs.
6. The intent and purpose of this Agreement is to ensure the proper maintenance of the on-site BMP(s) by the Landowner; provided, however, that this Agreement shall not be deemed to create or effect any additional liability of any party for damage alleged to result from or be caused by stormwater runoff.
7. The Landowner, its executors, administrators, assigns, and other successors in interests, hereby release and hold harmless the municipality’s employees and designated repre-sentatives from all damages, accidents, casualties, occurrences or claims which might arise or be asserted against said employees and representatives from the construction, presence, existence, or maintenance of the BMP(s) by the Landowner or municipality. In the event that a claim is asserted against the municipality, its designated represen-tatives or employees, the municipality shall promptly notify the Landowner and the Landowner shall defend, at his own expense, any suit based on the claim. If any judg-ment or claims against the municipality’s employees or designated representatives shall be allowed, the Landowner shall pay all costs and expenses regarding said judgment or claim.

D-3
8. The municipality shall inspect the BMP(s) as necessary to ensure their continued func-tioning. The municipality may accept third party inspection certification as evidence of proper BMP functioning.
This Agreement shall be recorded at the Office of the Recorder of Deeds of ______________ County, Pennsylvania, and shall constitute a covenant running with the Property and/or equitable servitude, and shall be binding on the Landowner, his administrators, executors, assigns, heirs and any other successors in interests, in perpetuity. ATTEST:
WITNESS the following signatures and seals:
(SEAL) For the municipality:
____________________________________
(SEAL) For the Landowner:
____________________________________ ATTEST:
_____________________________ (City, Borough, Township)
County of ___________________________, Pennsylvania
I, _______________________________________, a Notary Public in and for the County and
State aforesaid, whose commission expires on the __________ day of __________________,
200_, do hereby certify that ________________________________________ whose
name(s) is/are signed to the foregoing Agreement bearing date of the ___________ day of
___________________, 200_, has acknowledged the same before me in my said County and
State.
GIVEN UNDER MY HAND THIS _____________ day of ___________, 200_.
________________________________ ____________________________________
NOTARY PUBLIC (SEAL)

D-4

E-1
APPENDIX E
LOW IMPACT DEVELOPMENT PRACTICES
ALTERNATIVE APPROACH FORMANAGING STORMWATER RUNOFF
Natural hydrologic conditions may be altered radically by poorly planned development practices, such as introducing unneeded impervious surfaces, destroying existing drainage swales, construct-ing unnecessary storm sewers, and changing local topography. A traditional drainage approach of development has been to remove runoff from a site as quickly as possible and capture it in a detention basin. This approach may lead ultimately to the degradation of water quality as well as expenditure of additional resources for detaining and managing concentrated runoff at some downstream location.
The recommended alternative approach is to promote practices that will minimize post-develop-ment runoff rates and volumes, which will minimize needs for artificial conveyance and storage facilities. To simulate pre-development hydrologic conditions, forced infiltration is often neces-sary to offset the loss of infiltration by creation of impervious surfaces. The ability of the ground to infiltrate depends upon the soil types and its conditions.
Preserving natural hydrologic conditions requires careful alternative site design considerations. Site design practices include preserving natural drainage features, minimizing impervious surface area, reducing the hydraulic connectivity of impervious surfaces, and protecting natural depression storage. A well-designed site will contain a mix of all those features. The following describes various techniques to achieve the alternative approach:
• PreservingNaturalDrainageFeatures.Protectingnaturaldrainagefeatures,particularlyveg-etated drainage swales and channels, is desirable because of their ability to infiltrate and at-tenuate flows and to filter pollutants. However, this objective is often not accomplished in land development. In fact, commonly held drainage philosophy encourages just the opposite pat-tern — streets and adjacent storm sewers typically are located in the natural headwater valleys and swales, thereby replacing natural drainage functions with a completely impervious system. As a result, runoff and pollutants generated from impervious surfaces flow directly into storm sewers with no opportunity for attenuation, infiltration, or filtration. Developments designed to fit site topography also minimize the amount of grading on site.
• ProtectingNaturalDepressionStorageAreas.Depressionstorageareashavenosurfaceoutlet,or drain very slowly following a storm event. They can be commonly seen as ponded areas in farm fields during the wet season or after large runoff events. Traditional development practices eliminate these depressions by filling or draining, thereby obliterating their ability to reduce surface runoff volumes and trap pollutants. The volume and release rate characteristics of depressions should be protected in the design of the development site. The depressions can be protected by simply avoiding the depression or by incorporating its storage as additional capacity in required detention facilities.

E-2
• AvoidingIntroductionofImperviousAreas.Carefulsiteplanningshouldconsiderreducingimpervious coverage to the maximum extent possible. Building footprints, sidewalks, drive-ways and other features producing impervious surfaces should be evaluated to minimize im-pacts on runoff.
• ReducingtheHydraulicConnectivityofImperviousSurfaces.Impervioussurfacesaresignifi-cantly less of a problem if they are not directly connected to an impervious conveyance system (such as storm sewer). Two basic ways to reduce hydraulic connectivity are routing of roof runoff over lawns and reducing the use of storm sewers. Site grading should promote increas-ing travel time of stormwater runoff, and should help reduce concentration of runoff to a single point in the development.
• RoutingRoofRunoffOverLawns.Roofrunoffcanbeeasilyroutedoverlawnsinmostsitedesigns. The practice discourages direct connections of downspouts to storm sewers or park-ing lots. The practice also discourages sloping driveways and parking lots to the street. By routing roof drains and crowning the driveway to run off to the lawn, the lawn is essentially used as a filter strip.
• Reducing theUseofStormSewers. By reducinguseof stormsewers fordrainingstreets,parking lots, and back yards, the potential for accelerating runoff from the development can be greatly reduced. The practice requires greater use of swales and may not be practical for some development sites, especially if there are concerns for areas that do not drain in a “reasonable” time. The practice requires educating local citizens and public works officials, who expect runoff to disappear shortly after a rainfall event.
• ReducingStreetWidths.Streetwidthscanbereducedbyeithereliminatingon-streetparkingor by reducing roadway widths. Municipal planners and traffic designers should encourage narrower neighborhood streets which ultimately could lower maintenance.
• LimitingSidewalkstoOneSideoftheStreet.Asidewalkononesideofthestreetmaysufficein low-traffic neighborhoods. The lost sidewalk could be replaced with bicycle/recreational trails that follow back-of-lot lines. Where appropriate, backyard trails should be constructed using pervious materials.
• UsingPermeablePavingMaterials.Thesematerialsincludepermeableinterlockingconcretepaving blocks or porous bituminous concrete. Such materials should be considered as alter-natives to conventional pavement surfaces, especially for low use surfaces such as driveways, overflow parking lots, and emergency access roads.
• ReducingBuildingSetbacks.Reducingbuildingsetbacksreducesdrivewayandentrywalksand is most readily accomplished along low-traffic streets where traffic noise is not a prob-lem.
• Constructing Cluster Developments. Cluster developments can also reduce the amount ofimpervious area for a given number of lots. The biggest savings is in street length, which also will reduce costs of the development. Cluster development clusters the construction activity onto less-sensitive areas without substantially affecting the gross density of development.

F-1

F-2

F-3
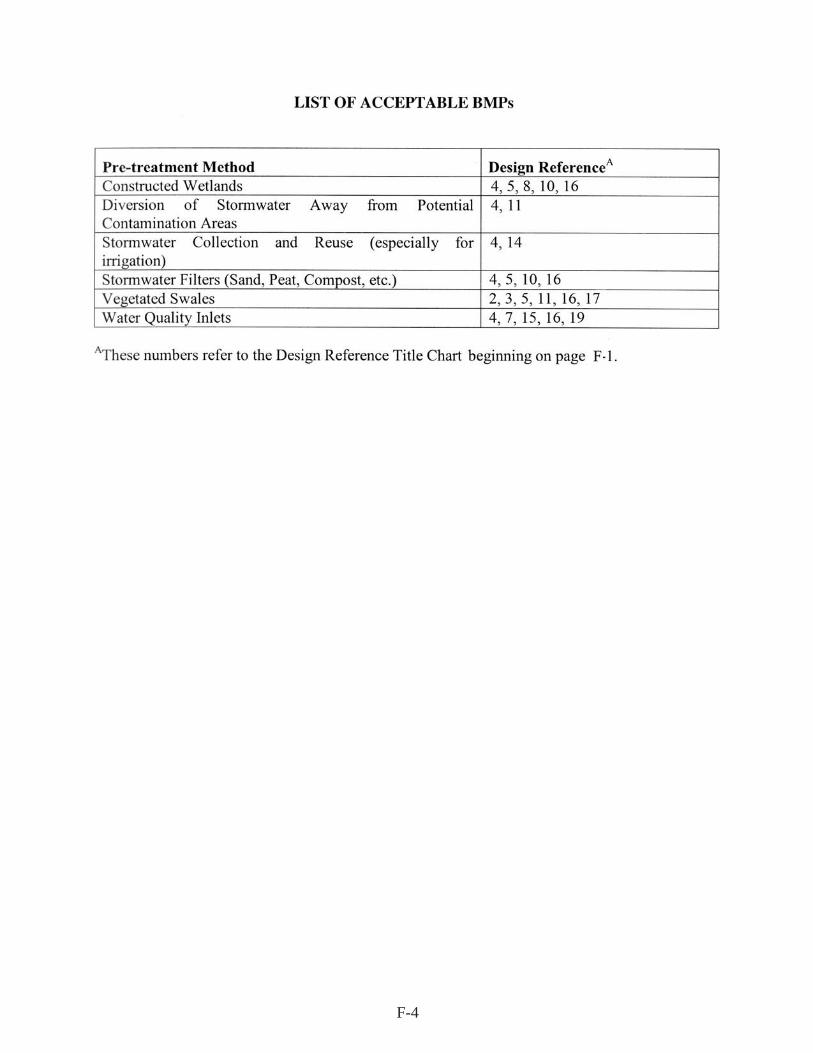
F-4

10-1
CHAPTER 10. PRIORITIES FOR IMPLEMENTATION OF THE PLAN
The Perkiomen Creek Headwaters Stormwater Management Plan preparation process is complete with the Lehigh County adoption of the draft Plan and submission of the final Plan to DEP for approval. Procedures for the review and adoption of the Plan are included in Chapter 11. Subsequent activities to carry out the provisions of the Plan are considered by DEP to be part of the implementation of the Plan. The initial step of Plan implementation is DEP approval. Plan approval sets in motion the mandatory schedule of adoption of municipal ordinance provisions to implement the stormwater management criteria. Perkiomen Creek Headwaters municipalities would have six months from DEP approval within which to adopt the necessary municipal ordinance provisions. Failure to do so could result in the withhold-ing of all state funds to the municipality(ies) per Act 167.
Additional implementation activities are the formal publishing of the final Plan after DEP approval, development of a local program to coordinate with DEP regarding permit reviews for stream encroachments, diversions, etc., and the development of a systematic approach for correction of existing storm drainage problem areas. The priorities for Plan implementation are presented in detail below in (essentially) chronological order.
A. DEP Approval of the Plan
Upon adoption of the Plan by Lehigh County, the Plan is submitted to DEP for approv-al. The DEP review process involves determination that all of the activities specified in the approved work program have been satisfactorily completed in the Plan. Further, the Department will only approve the Plan if it determines the following:
1. That the Plan is consistent with municipal floodplain management plans, State programs which regulate dams, encroachments and other water obstructions, and State and Federal flood control programs; and
2. That the Plan is compatible with other watershed stormwater plans for the basin in which the watershed is located, and is consistent with the policies of Act 167.
DEP action to either approve or disapprove the Plan must take place within ninety (90) days of receipt of the Plan by the Department. Otherwise, the Plan would be approved by default.
B. Publishing the Plan
Consistent with the Perkiomen Creek Headwaters Work Program, the LVPC will pub-lish additional copies of the study area Plan after DEP approval. One copy of the Plan will be provided to each municipality. Additional separate copies of the Perkiomen Creek Headwaters Act 167 Stormwater Management Ordinance will be published for use by the municipalities.

10-2
C. Development of a Local Program to Coordinate with DEP Regarding Chapter 105 and Chapter 106 Permit Application Reviews
Stream encroachments, stream enclosures, waterway diversions, water obstructions, and other activities regulated by Chapter 105 and Chapter 106 of DEP’s Rules and Regulations may have a bearing on the effectiveness of the runoff control strategy de-velopment for the Perkiomen Creek Headwaters. Activities of this type may modify the conveyance characteristics of the study area and have an impact on the relative timing of peak flows and/or the ability of the conveyance facilities to safely transport peak flows. Therefore, to ensure that the DEP permitting process is consistent with the adopted and approved Plan, a local review of Chapter 105 and Chapter 106 permit ap-plications should be coordinated with the DEP review process.
The local review for Lehigh County would be performed by the LVPC and would be accomplished through monitoring of the applications as published in the Pennsylvania Bulletin. The LVPC would be responsible for providing comments consistent with the adopted Act 167 Plan within the stated DEP review period. Further, the LVPC would keep records of applications reviewed and the DEP action.
D. Municipal Adoption of Ordinance Provisions to Implement the Plan
The key ingredient for implementation of the Stormwater Management Plan is the adoption of the necessary ordinance provisions by the Perkiomen Creek Headwaters municipalities. Provided as part of the Plan is the Perkiomen Creek Headwaters Act 167 Stormwater Management Ordinance, which is a single purpose stormwater ordi-nance that could be adopted by each municipality essentially as is to implement the Plan. The single purpose ordinance was chosen for ease of incorporation into the exist-ing structure of municipal ordinances. All that would be required of any municipality would be to adopt the ordinance itself and adopt the necessary tying provisions into the existing subdivision and land development ordinance and zoning ordinance. The tying provisions would simply refer any applicable regulated activities within the Perkiomen Creek Headwaters to the single purpose ordinance from the other ordinances.
However, it is not required that a municipality adopt the single purpose ordinance. At the municipality’s discretion, it may opt to incorporate all of the necessary provisions into the existing ordinances rather than adopt a separate ordinance. In this event, the municipality must ensure that the amended ordinance satisfactorily implements the ap-proved Plan.
E. Development of a Systematic Approach for Correction of Existing Storm Drainage Problem Areas
Correction of the existing storm drainage problem areas in the study area as document-ed in Chapter 5 is not specifically part of the Act 167 planning process. However, the development of the Plan has provided a framework for their correction for the follow-ing reasons: (1) existing storm drainage problems have been documented through inter-

10-3
action with the Watershed Plan Advisory Committee; (2) implementation of the runoff control criteria specified in the Plan will prevent the existing drainage problems from becoming worse (and prevent the creation of new drainage problem areas); and (3) the hydrologic model developed to formulate the runoff control criteria could be used as an analytical tool for designing engineering solutions to existing drainage problems.
With the above in mind, each municipality within the Perkiomen Creek Headwaters should take the following steps to implement solutions to the existing storm drainage problem areas:
1. Prioritize the list of storm drainage problems within the municipality as shown in Table 10 based on frequency of occurrence, potential for injury to persons or property, damage history, public perception of the problems, and other appropri-ate criteria.
2. For the top priority drainage problems in the municipality, conduct detailed engi-neering evaluations to determine the exact nature of the problems (if not known), determine alternative solutions, provide cost estimates for the alternative solu-tions, and recommend a course of municipal action. The number of drainage problems to be evaluated by a municipality as a first cut from the priority list should be based on a schedule compatible with completing engineering stud-ies on all problem areas within approximately five years. The Perkiomen Creek Headwaters hydrologic model would be available at the LVPC office to provide flow data as input to the engineering studies.
3. On the priority and cost bases, incorporate implementation of recommended solu-tions to the drainage problems in the annual municipal capital budget or the mu-nicipal maintenance budget as funds are available. Solutions for existing storm-water drainage problems may qualify for low interest loans from the Pennsylvania Infrastructure Investment Authority (PENNVEST). The number of drainage prob-lems corrected in a given year should be based on a maximum ten-year schedule of resolving all existing documented drainage problems in the municipality for which cost-effective solutions exist.
The above-stated procedure for dealing with existing storm drainage problem areas is not a mandatory action placed on municipalities with the adoption of the Plan. Rather, it represents one systematic method to approach the problems uniformly throughout the study area and attempt to improve the current runoff situation in the basin. The key elements involved in the success of the remedial strategy will be the dedication of the municipalities to construct corrective measures and the consistent and proper applica-tion of the runoff control criteria specified in the Plan. The latter element is essential to ensure that remedial measures do not become obsolete (under-designed) by increases in peak flows with development.

10-4

11-1
CHAPTER 11. PLAN REVIEW, ADOPTION, AND UPDATING PROCEDURES
A. Plan Review and Adoption
The opportunity for local review of the draft Stormwater Management Plan is prerequi-site to County adoption of the Plan. Local review of the Plan is composed of three parts, namely Watershed Plan Advisory Committee review, municipal review, and County review. Local review of the draft Plan is initiated with the completion of the Plan by the LVPC and distribution to the Watershed Plan Advisory Committee. Presented below is a chronological listing and brief narrative of the required local review steps through County adoption.
1. Watershed Plan Advisory Committee Review – This body has been formed to assist in the development of the Perkiomen Creek Headwaters Plan. Municipal members of the Committee have provided input data to the process in the form of storm drainage problem area documentation, proposed solutions to drainage problems, etc. The Committee met on four occasions to review the progress of the Plan. Municipal representatives on the committee have the responsibility to report on the progress of the Plan to their respective municipalities. Review of the draft Plan by the Advisory Committee will be expedited by the fact that the members are already familiar with the objectives of the Plan, the runoff control strategy employed and the basic contents of the Plan. The output of the Watershed Plan Advisory Committee review would be a revised draft Plan for municipal and County consideration.
2. Municipal Review – Act 167 specifies that, prior to adoption of the draft Plan by the County, the planning commission and governing body of each municipality in the study area must review the Plan for consistency with other plans and pro-grams affecting the study area. Of primary concern during the municipal review would be the draft Perkiomen Creek Headwaters Act 167 Stormwater Manage-ment Ordinance, which would implement the Plan through municipal adoption. The output of the municipal review would be a letter directed to Lehigh County outlining the municipal suggestions, if any, for revising the draft Plan (or Ordi-nance) prior to adoption by the County.
3. County Review and Adoption – Upon completion of the review by the Watershed Plan Advisory Committee and each municipality, the draft Plan will be submitted to the Lehigh County Commissioners for their consideration.
The County review of the draft Plan will include a detailed review by the County Com-missioners and an opportunity for public input through the holding of a public hear-ing. A public hearing on the draft Plan must be held with a minimum two-week notice period with copies of the draft Plan available for inspection by the general public. Any modifications to the draft Plan would be made by the County based upon input from the public hearing, comments received from the municipalities in the study area, or their
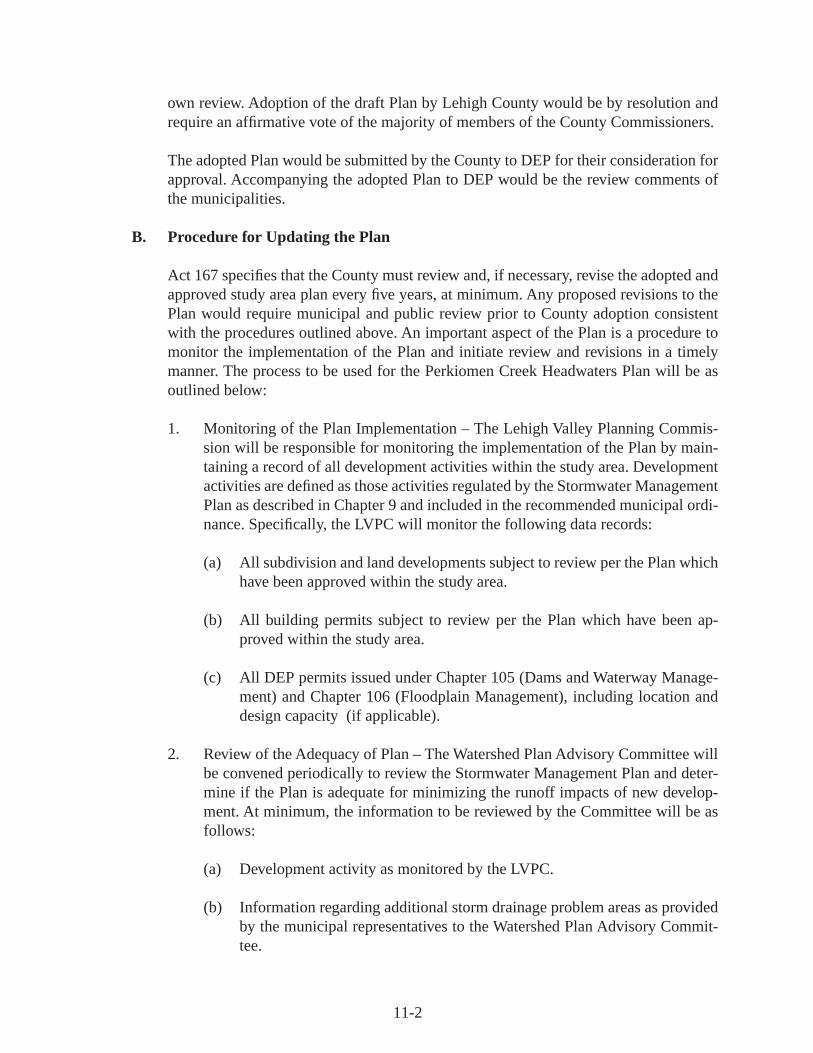
11-2
own review. Adoption of the draft Plan by Lehigh County would be by resolution and require an affirmative vote of the majority of members of the County Commissioners.
The adopted Plan would be submitted by the County to DEP for their consideration for approval. Accompanying the adopted Plan to DEP would be the review comments of the municipalities.
B. Procedure for Updating the Plan
Act 167 specifies that the County must review and, if necessary, revise the adopted and approved study area plan every five years, at minimum. Any proposed revisions to the Plan would require municipal and public review prior to County adoption consistent with the procedures outlined above. An important aspect of the Plan is a procedure to monitor the implementation of the Plan and initiate review and revisions in a timely manner. The process to be used for the Perkiomen Creek Headwaters Plan will be as outlined below:
1. Monitoring of the Plan Implementation – The Lehigh Valley Planning Commis-sion will be responsible for monitoring the implementation of the Plan by main-taining a record of all development activities within the study area. Development activities are defined as those activities regulated by the Stormwater Management Plan as described in Chapter 9 and included in the recommended municipal ordi-nance. Specifically, the LVPC will monitor the following data records:
(a) All subdivision and land developments subject to review per the Plan which have been approved within the study area.
(b) All building permits subject to review per the Plan which have been ap-proved within the study area.
(c) All DEP permits issued under Chapter 105 (Dams and Waterway Manage-ment) and Chapter 106 (Floodplain Management), including location and design capacity (if applicable).
2. Review of the Adequacy of Plan – The Watershed Plan Advisory Committee will be convened periodically to review the Stormwater Management Plan and deter-mine if the Plan is adequate for minimizing the runoff impacts of new develop-ment. At minimum, the information to be reviewed by the Committee will be as follows:
(a) Development activity as monitored by the LVPC.
(b) Information regarding additional storm drainage problem areas as provided by the municipal representatives to the Watershed Plan Advisory Commit-tee.

11-3
(c) Zoning amendments within the study area.
(d) Information associated with any regional detention alternatives implement-ed within the study area.
(e) Adequacy of the administrative aspects of regulated activity review.
The Committee will review the above data and make recommendations to the County as to the need for revision to the Perkiomen Creek Headwaters Stormwater Management Plan. Lehigh County will review the recommendations of the Watershed Plan Advisory Committee and determine if the revisions are to be made. A revised Plan would be subject to the same rules of adoption as the original Plan preparation.

11-4

11-5

11-6
11-7

11-8