performance tuning guide - informatica documentation/5/pc_1011... · chapter 1: performance tuning...
TRANSCRIPT

Informatica® PowerCenter (Version 10.1.1)
Performance Tuning Guide

Informatica PowerCenter Performance Tuning Guide
Version 10.1.1December 2016
© Copyright Informatica LLC 2000, 2016
This software and documentation are provided only under a separate license agreement containing restrictions on use and disclosure. No part of this document may be reproduced or transmitted in any form, by any means (electronic, photocopying, recording or otherwise) without prior consent of Informatica LLC.
Informatica, the Informatica logo, and PowerCenter are trademarks or registered trademarks of Informatica LLC in the United States and many jurisdictions throughout the world. A current list of Informatica trademarks is available on the web at https://www.informatica.com/trademarks.html. Other company and product names may be trade names or trademarks of their respective owners.
Portions of this software and/or documentation are subject to copyright held by third parties, including without limitation: Copyright DataDirect Technologies. All rights reserved. Copyright © Sun Microsystems. All rights reserved. Copyright © RSA Security Inc. All Rights Reserved. Copyright © Ordinal Technology Corp. All rights reserved. Copyright © Aandacht c.v. All rights reserved. Copyright Genivia, Inc. All rights reserved. Copyright Isomorphic Software. All rights reserved. Copyright © Meta Integration Technology, Inc. All rights reserved. Copyright © Intalio. All rights reserved. Copyright © Oracle. All rights reserved. Copyright © Adobe Systems Incorporated. All rights reserved. Copyright © DataArt, Inc. All rights reserved. Copyright © ComponentSource. All rights reserved. Copyright © Microsoft Corporation. All rights reserved. Copyright © Rogue Wave Software, Inc. All rights reserved. Copyright © Teradata Corporation. All rights reserved. Copyright © Yahoo! Inc. All rights reserved. Copyright © Glyph & Cog, LLC. All rights reserved. Copyright © Thinkmap, Inc. All rights reserved. Copyright © Clearpace Software Limited. All rights reserved. Copyright © Information Builders, Inc. All rights reserved. Copyright © OSS Nokalva, Inc. All rights reserved. Copyright Edifecs, Inc. All rights reserved. Copyright Cleo Communications, Inc. All rights reserved. Copyright © International Organization for Standardization 1986. All rights reserved. Copyright © ej-technologies GmbH. All rights reserved. Copyright © Jaspersoft Corporation. All rights reserved. Copyright © International Business Machines Corporation. All rights reserved. Copyright © yWorks GmbH. All rights reserved. Copyright © Lucent Technologies. All rights reserved. Copyright © University of Toronto. All rights reserved. Copyright © Daniel Veillard. All rights reserved. Copyright © Unicode, Inc. Copyright IBM Corp. All rights reserved. Copyright © MicroQuill Software Publishing, Inc. All rights reserved. Copyright © PassMark Software Pty Ltd. All rights reserved. Copyright © LogiXML, Inc. All rights reserved. Copyright © 2003-2010 Lorenzi Davide, All rights reserved. Copyright © Red Hat, Inc. All rights reserved. Copyright © The Board of Trustees of the Leland Stanford Junior University. All rights reserved. Copyright © EMC Corporation. All rights reserved. Copyright © Flexera Software. All rights reserved. Copyright © Jinfonet Software. All rights reserved. Copyright © Apple Inc. All rights reserved. Copyright © Telerik Inc. All rights reserved. Copyright © BEA Systems. All rights reserved. Copyright © PDFlib GmbH. All rights reserved. Copyright © Orientation in Objects GmbH. All rights reserved. Copyright © Tanuki Software, Ltd. All rights reserved. Copyright © Ricebridge. All rights reserved. Copyright © Sencha, Inc. All rights reserved. Copyright © Scalable Systems, Inc. All rights reserved. Copyright © jQWidgets. All rights reserved. Copyright © Tableau Software, Inc. All rights reserved. Copyright© MaxMind, Inc. All Rights Reserved. Copyright © TMate Software s.r.o. All rights reserved. Copyright © MapR Technologies Inc. All rights reserved. Copyright © Amazon Corporate LLC. All rights reserved. Copyright © Highsoft. All rights reserved. Copyright © Python Software Foundation. All rights reserved. Copyright © BeOpen.com. All rights reserved. Copyright © CNRI. All rights reserved.
This product includes software developed by the Apache Software Foundation (http://www.apache.org/), and/or other software which is licensed under various versions of the Apache License (the "License"). You may obtain a copy of these Licenses at http://www.apache.org/licenses/. Unless required by applicable law or agreed to in writing, software distributed under these Licenses is distributed on an "AS IS" BASIS, WITHOUT WARRANTIES OR CONDITIONS OF ANY KIND, either express or implied. See the Licenses for the specific language governing permissions and limitations under the Licenses.
This product includes software which was developed by Mozilla (http://www.mozilla.org/), software copyright The JBoss Group, LLC, all rights reserved; software copyright © 1999-2006 by Bruno Lowagie and Paulo Soares and other software which is licensed under various versions of the GNU Lesser General Public License Agreement, which may be found at http:// www.gnu.org/licenses/lgpl.html. The materials are provided free of charge by Informatica, "as-is", without warranty of any kind, either express or implied, including but not limited to the implied warranties of merchantability and fitness for a particular purpose.
The product includes ACE(TM) and TAO(TM) software copyrighted by Douglas C. Schmidt and his research group at Washington University, University of California, Irvine, and Vanderbilt University, Copyright (©) 1993-2006, all rights reserved.
This product includes software developed by the OpenSSL Project for use in the OpenSSL Toolkit (copyright The OpenSSL Project. All Rights Reserved) and redistribution of this software is subject to terms available at http://www.openssl.org and http://www.openssl.org/source/license.html.
This product includes Curl software which is Copyright 1996-2013, Daniel Stenberg, <[email protected]>. All Rights Reserved. Permissions and limitations regarding this software are subject to terms available at http://curl.haxx.se/docs/copyright.html. Permission to use, copy, modify, and distribute this software for any purpose with or without fee is hereby granted, provided that the above copyright notice and this permission notice appear in all copies.
The product includes software copyright 2001-2005 (©) MetaStuff, Ltd. All Rights Reserved. Permissions and limitations regarding this software are subject to terms available at http://www.dom4j.org/ license.html.
This product includes software copyright © 1996-2006 Per Bothner. All rights reserved. Your right to use such materials is set forth in the license which may be found at http:// www.gnu.org/software/ kawa/Software-License.html.
This product includes OSSP UUID software which is Copyright © 2002 Ralf S. Engelschall, Copyright © 2002 The OSSP Project Copyright © 2002 Cable & Wireless Deutschland. Permissions and limitations regarding this software are subject to terms available at http://www.opensource.org/licenses/mit-license.php.
This product includes software developed by Boost (http://www.boost.org/) or under the Boost software license. Permissions and limitations regarding this software are subject to terms available at http:/ /www.boost.org/LICENSE_1_0.txt.
This product includes software copyright © 1997-2007 University of Cambridge. Permissions and limitations regarding this software are subject to terms available at http:// www.pcre.org/license.txt.
This product includes software copyright © 2007 The Eclipse Foundation. All Rights Reserved. Permissions and limitations regarding this software are subject to terms available at http:// www.eclipse.org/org/documents/epl-v10.php and at http://www.eclipse.org/org/documents/edl-v10.php.
This product includes software licensed under the terms at http://www.tcl.tk/software/tcltk/license.html, http://www.bosrup.com/web/overlib/?License, http://www.stlport.org/doc/ license.html, http://asm.ow2.org/license.html, http://www.cryptix.org/LICENSE.TXT, http://hsqldb.org/web/hsqlLicense.html, http://httpunit.sourceforge.net/doc/ license.html, http://jung.sourceforge.net/license.txt , http://www.gzip.org/zlib/zlib_license.html, http://www.openldap.org/software/release/license.html, http://www.libssh2.org, http://slf4j.org/license.html, http://www.sente.ch/software/OpenSourceLicense.html, http://fusesource.com/downloads/license-agreements/fuse-message-broker-v-5-3- license-agreement; http://antlr.org/license.html; http://aopalliance.sourceforge.net/; http://www.bouncycastle.org/licence.html; http://www.jgraph.com/jgraphdownload.html; http://www.jcraft.com/jsch/LICENSE.txt; http://jotm.objectweb.org/bsd_license.html; . http://www.w3.org/Consortium/Legal/2002/copyright-software-20021231; http://www.slf4j.org/license.html; http://nanoxml.sourceforge.net/orig/copyright.html; http://www.json.org/license.html; http://forge.ow2.org/projects/javaservice/, http://www.postgresql.org/about/licence.html, http://www.sqlite.org/copyright.html, http://www.tcl.tk/software/tcltk/license.html, http://www.jaxen.org/faq.html, http://www.jdom.org/docs/faq.html, http://www.slf4j.org/license.html; http://www.iodbc.org/dataspace/iodbc/wiki/iODBC/License; http://www.keplerproject.org/md5/license.html; http://www.toedter.com/en/jcalendar/license.html; http://www.edankert.com/bounce/index.html; http://www.net-snmp.org/about/license.html; http://www.openmdx.org/#FAQ; http://www.php.net/license/3_01.txt; http://srp.stanford.edu/license.txt; http://www.schneier.com/blowfish.html; http://www.jmock.org/license.html; http://xsom.java.net; http://benalman.com/about/license/; https://github.com/CreateJS/EaselJS/blob/master/src/easeljs/display/Bitmap.js; http://www.h2database.com/html/license.html#summary; http://jsoncpp.sourceforge.net/LICENSE; http://jdbc.postgresql.org/license.html; http://protobuf.googlecode.com/svn/trunk/src/google/protobuf/descriptor.proto; https://github.com/rantav/hector/blob/master/LICENSE; http://web.mit.edu/Kerberos/krb5-current/doc/mitK5license.html; http://jibx.sourceforge.net/jibx-license.html; https://github.com/lyokato/libgeohash/blob/master/LICENSE; https://github.com/hjiang/jsonxx/blob/master/LICENSE; https://code.google.com/p/lz4/; https://github.com/jedisct1/libsodium/blob/master/LICENSE; http://one-jar.sourceforge.net/index.php?

page=documents&file=license; https://github.com/EsotericSoftware/kryo/blob/master/license.txt; http://www.scala-lang.org/license.html; https://github.com/tinkerpop/blueprints/blob/master/LICENSE.txt; http://gee.cs.oswego.edu/dl/classes/EDU/oswego/cs/dl/util/concurrent/intro.html; https://aws.amazon.com/asl/; https://github.com/twbs/bootstrap/blob/master/LICENSE; https://sourceforge.net/p/xmlunit/code/HEAD/tree/trunk/LICENSE.txt; https://github.com/documentcloud/underscore-contrib/blob/master/LICENSE, and https://github.com/apache/hbase/blob/master/LICENSE.txt.
This product includes software licensed under the Academic Free License (http://www.opensource.org/licenses/afl-3.0.php), the Common Development and Distribution License (http://www.opensource.org/licenses/cddl1.php) the Common Public License (http://www.opensource.org/licenses/cpl1.0.php), the Sun Binary Code License Agreement Supplemental License Terms, the BSD License (http:// www.opensource.org/licenses/bsd-license.php), the new BSD License (http://opensource.org/licenses/BSD-3-Clause), the MIT License (http://www.opensource.org/licenses/mit-license.php), the Artistic License (http://www.opensource.org/licenses/artistic-license-1.0) and the Initial Developer’s Public License Version 1.0 (http://www.firebirdsql.org/en/initial-developer-s-public-license-version-1-0/).
This product includes software copyright © 2003-2006 Joe WaInes, 2006-2007 XStream Committers. All rights reserved. Permissions and limitations regarding this software are subject to terms available at http://xstream.codehaus.org/license.html. This product includes software developed by the Indiana University Extreme! Lab. For further information please visit http://www.extreme.indiana.edu/.
This product includes software Copyright (c) 2013 Frank Balluffi and Markus Moeller. All rights reserved. Permissions and limitations regarding this software are subject to terms of the MIT license.
See patents at https://www.informatica.com/legal/patents.html.
DISCLAIMER: Informatica LLC provides this documentation "as is" without warranty of any kind, either express or implied, including, but not limited to, the implied warranties of noninfringement, merchantability, or use for a particular purpose. Informatica LLC does not warrant that this software or documentation is error free. The information provided in this software or documentation may include technical inaccuracies or typographical errors. The information in this software and documentation is subject to change at any time without notice.
NOTICES
This Informatica product (the "Software") includes certain drivers (the "DataDirect Drivers") from DataDirect Technologies, an operating company of Progress Software Corporation ("DataDirect") which are subject to the following terms and conditions:
1.THE DATADIRECT DRIVERS ARE PROVIDED "AS IS" WITHOUT WARRANTY OF ANY KIND, EITHER EXPRESSED OR IMPLIED, INCLUDING BUT NOT LIMITED TO, THE IMPLIED WARRANTIES OF MERCHANTABILITY, FITNESS FOR A PARTICULAR PURPOSE AND NON-INFRINGEMENT.
2. IN NO EVENT WILL DATADIRECT OR ITS THIRD PARTY SUPPLIERS BE LIABLE TO THE END-USER CUSTOMER FOR ANY DIRECT, INDIRECT, INCIDENTAL, SPECIAL, CONSEQUENTIAL OR OTHER DAMAGES ARISING OUT OF THE USE OF THE ODBC DRIVERS, WHETHER OR NOT INFORMED OF THE POSSIBILITIES OF DAMAGES IN ADVANCE. THESE LIMITATIONS APPLY TO ALL CAUSES OF ACTION, INCLUDING, WITHOUT LIMITATION, BREACH OF CONTRACT, BREACH OF WARRANTY, NEGLIGENCE, STRICT LIABILITY, MISREPRESENTATION AND OTHER TORTS.
The information in this documentation is subject to change without notice. If you find any problems in this documentation, please report them to us in writing at Informatica LLC 2100 Seaport Blvd. Redwood City, CA 94063.
INFORMATICA LLC PROVIDES THE INFORMATION IN THIS DOCUMENT "AS IS" WITHOUT WARRANTY OF ANY KIND, EXPRESS OR IMPLIED, INCLUDING WITHOUT ANY WARRANTIES OF MERCHANTABILITY, FITNESS FOR A PARTICULAR PURPOSE AND ANY WARRANTY OR CONDITION OF NON-INFRINGEMENT.
Publication Date: 2016-11-21
Table of Contents
Preface . . . . . . . . . . . . . . . . . . . . . . . . . . . . . . . . . . . . . . . . . . . . . . . . . . . . . . . . . . . . . . . . . . . . . . . 9Informatica Resources. . . . . . . . . . . . . . . . . . . . . . . . . . . . . . . . . . . . . . . . . . . . . . . . . . . 9
Informatica Network. . . . . . . . . . . . . . . . . . . . . . . . . . . . . . . . . . . . . . . . . . . . . . . . . . 9
Informatica Knowledge Base. . . . . . . . . . . . . . . . . . . . . . . . . . . . . . . . . . . . . . . . . . . . 9
Informatica Documentation. . . . . . . . . . . . . . . . . . . . . . . . . . . . . . . . . . . . . . . . . . . . . 9
Informatica Product Availability Matrixes. . . . . . . . . . . . . . . . . . . . . . . . . . . . . . . . . . . . 10
Informatica Velocity. . . . . . . . . . . . . . . . . . . . . . . . . . . . . . . . . . . . . . . . . . . . . . . . . 10
Informatica Marketplace. . . . . . . . . . . . . . . . . . . . . . . . . . . . . . . . . . . . . . . . . . . . . . 10
Informatica Global Customer Support. . . . . . . . . . . . . . . . . . . . . . . . . . . . . . . . . . . . . . 10
Chapter 1: Performance Tuning Overview. . . . . . . . . . . . . . . . . . . . . . . . . . . . . . . . . . . . . 11Performance Tuning Overview. . . . . . . . . . . . . . . . . . . . . . . . . . . . . . . . . . . . . . . . . . . . . 11
Chapter 2: Bottlenecks. . . . . . . . . . . . . . . . . . . . . . . . . . . . . . . . . . . . . . . . . . . . . . . . . . . . . . . 12Bottlenecks Overview. . . . . . . . . . . . . . . . . . . . . . . . . . . . . . . . . . . . . . . . . . . . . . . . . . . 12
Using Thread Statistics. . . . . . . . . . . . . . . . . . . . . . . . . . . . . . . . . . . . . . . . . . . . . . . . . . 13
Eliminating Bottlenecks Based on Thread Statistics. . . . . . . . . . . . . . . . . . . . . . . . . . . . . 13
Example. . . . . . . . . . . . . . . . . . . . . . . . . . . . . . . . . . . . . . . . . . . . . . . . . . . . . . . . 13
Target Bottlenecks. . . . . . . . . . . . . . . . . . . . . . . . . . . . . . . . . . . . . . . . . . . . . . . . . . . . . 14
Identifying Target Bottlenecks. . . . . . . . . . . . . . . . . . . . . . . . . . . . . . . . . . . . . . . . . . 14
Eliminating Target Bottlenecks. . . . . . . . . . . . . . . . . . . . . . . . . . . . . . . . . . . . . . . . . . 14
Source Bottlenecks. . . . . . . . . . . . . . . . . . . . . . . . . . . . . . . . . . . . . . . . . . . . . . . . . . . . 15
Identifying Source Bottlenecks. . . . . . . . . . . . . . . . . . . . . . . . . . . . . . . . . . . . . . . . . . 15
Eliminating Source Bottlenecks. . . . . . . . . . . . . . . . . . . . . . . . . . . . . . . . . . . . . . . . . . 16
Mapping Bottlenecks. . . . . . . . . . . . . . . . . . . . . . . . . . . . . . . . . . . . . . . . . . . . . . . . . . . 16
Identifying Mapping Bottlenecks. . . . . . . . . . . . . . . . . . . . . . . . . . . . . . . . . . . . . . . . . 16
Eliminating Mapping Bottlenecks. . . . . . . . . . . . . . . . . . . . . . . . . . . . . . . . . . . . . . . . . 16
Session Bottlenecks. . . . . . . . . . . . . . . . . . . . . . . . . . . . . . . . . . . . . . . . . . . . . . . . . . . . 17
Identifying Session Bottlenecks. . . . . . . . . . . . . . . . . . . . . . . . . . . . . . . . . . . . . . . . . . 17
Eliminating Session Bottlenecks. . . . . . . . . . . . . . . . . . . . . . . . . . . . . . . . . . . . . . . . . 17
System Bottlenecks. . . . . . . . . . . . . . . . . . . . . . . . . . . . . . . . . . . . . . . . . . . . . . . . . . . . 17
Identifying System Bottlenecks. . . . . . . . . . . . . . . . . . . . . . . . . . . . . . . . . . . . . . . . . . 17
Eliminating System Bottlenecks. . . . . . . . . . . . . . . . . . . . . . . . . . . . . . . . . . . . . . . . . 18
Chapter 3: Optimizing the Target. . . . . . . . . . . . . . . . . . . . . . . . . . . . . . . . . . . . . . . . . . . . . 20Optimizing Flat File Targets. . . . . . . . . . . . . . . . . . . . . . . . . . . . . . . . . . . . . . . . . . . . . . . 20
Dropping Indexes and Key Constraints. . . . . . . . . . . . . . . . . . . . . . . . . . . . . . . . . . . . . . . . 20
Increasing Database Checkpoint Intervals. . . . . . . . . . . . . . . . . . . . . . . . . . . . . . . . . . . . . . 21
Using Bulk Loads. . . . . . . . . . . . . . . . . . . . . . . . . . . . . . . . . . . . . . . . . . . . . . . . . . . . . . 21
Using External Loaders. . . . . . . . . . . . . . . . . . . . . . . . . . . . . . . . . . . . . . . . . . . . . . . . . . 21
4 Table of Contents
Minimizing Deadlocks. . . . . . . . . . . . . . . . . . . . . . . . . . . . . . . . . . . . . . . . . . . . . . . . . . . 22
Increasing Database Network Packet Size. . . . . . . . . . . . . . . . . . . . . . . . . . . . . . . . . . . . . 22
Optimizing Oracle Target Databases. . . . . . . . . . . . . . . . . . . . . . . . . . . . . . . . . . . . . . . . . 22
Chapter 4: Optimizing the Source. . . . . . . . . . . . . . . . . . . . . . . . . . . . . . . . . . . . . . . . . . . . . 23Optimizing the Query. . . . . . . . . . . . . . . . . . . . . . . . . . . . . . . . . . . . . . . . . . . . . . . . . . . 23
Using Conditional Filters. . . . . . . . . . . . . . . . . . . . . . . . . . . . . . . . . . . . . . . . . . . . . . . . . 24
Increasing Database Network Packet Size. . . . . . . . . . . . . . . . . . . . . . . . . . . . . . . . . . . . . 24
Connecting to Oracle Database Sources. . . . . . . . . . . . . . . . . . . . . . . . . . . . . . . . . . . . . . . 24
Using Teradata FastExport. . . . . . . . . . . . . . . . . . . . . . . . . . . . . . . . . . . . . . . . . . . . . . . 24
Using tempdb to Join Sybase or Microsoft SQL Server Tables. . . . . . . . . . . . . . . . . . . . . . . . . 25
Chapter 5: Optimizing Mappings. . . . . . . . . . . . . . . . . . . . . . . . . . . . . . . . . . . . . . . . . . . . . . 26Optimizing Mappings Overview. . . . . . . . . . . . . . . . . . . . . . . . . . . . . . . . . . . . . . . . . . . . . 26
Optimizing Flat File Sources. . . . . . . . . . . . . . . . . . . . . . . . . . . . . . . . . . . . . . . . . . . . . . 26
Optimizing the Line Sequential Buffer Length. . . . . . . . . . . . . . . . . . . . . . . . . . . . . . . . . 26
Optimizing Delimited Flat File Sources. . . . . . . . . . . . . . . . . . . . . . . . . . . . . . . . . . . . . 27
Optimizing XML and Flat File Sources. . . . . . . . . . . . . . . . . . . . . . . . . . . . . . . . . . . . . 27
Configuring Single-Pass Reading. . . . . . . . . . . . . . . . . . . . . . . . . . . . . . . . . . . . . . . . . . . 27
Optimizing Pass-Through Mappings. . . . . . . . . . . . . . . . . . . . . . . . . . . . . . . . . . . . . . . . . . 28
Optimizing Filters. . . . . . . . . . . . . . . . . . . . . . . . . . . . . . . . . . . . . . . . . . . . . . . . . . . . . . 28
Optimizing Datatype Conversions. . . . . . . . . . . . . . . . . . . . . . . . . . . . . . . . . . . . . . . . . . . 28
Optimizing Expressions. . . . . . . . . . . . . . . . . . . . . . . . . . . . . . . . . . . . . . . . . . . . . . . . . . 29
Factoring Out Common Logic. . . . . . . . . . . . . . . . . . . . . . . . . . . . . . . . . . . . . . . . . . . 29
Minimizing Aggregate Function Calls. . . . . . . . . . . . . . . . . . . . . . . . . . . . . . . . . . . . . . 29
Replacing Common Expressions with Local Variables. . . . . . . . . . . . . . . . . . . . . . . . . . . 29
Choosing Numeric Versus String Operations. . . . . . . . . . . . . . . . . . . . . . . . . . . . . . . . . 29
Optimizing Char-Char and Char-Varchar Comparisons. . . . . . . . . . . . . . . . . . . . . . . . . . . 29
Choosing DECODE Versus LOOKUP. . . . . . . . . . . . . . . . . . . . . . . . . . . . . . . . . . . . . . 30
Using Operators Instead of Functions. . . . . . . . . . . . . . . . . . . . . . . . . . . . . . . . . . . . . . 30
Optimizing IIF Functions. . . . . . . . . . . . . . . . . . . . . . . . . . . . . . . . . . . . . . . . . . . . . . 30
Evaluating Expressions. . . . . . . . . . . . . . . . . . . . . . . . . . . . . . . . . . . . . . . . . . . . . . . 31
Optimizing External Procedures. . . . . . . . . . . . . . . . . . . . . . . . . . . . . . . . . . . . . . . . . . . . 31
Chapter 6: Optimizing Transformations. . . . . . . . . . . . . . . . . . . . . . . . . . . . . . . . . . . . . . . 32Optimizing Aggregator Transformations. . . . . . . . . . . . . . . . . . . . . . . . . . . . . . . . . . . . . . . 32
Grouping By Simple Columns. . . . . . . . . . . . . . . . . . . . . . . . . . . . . . . . . . . . . . . . . . . 32
Using Sorted Input. . . . . . . . . . . . . . . . . . . . . . . . . . . . . . . . . . . . . . . . . . . . . . . . . . 33
Using Incremental Aggregation. . . . . . . . . . . . . . . . . . . . . . . . . . . . . . . . . . . . . . . . . . 33
Filtering Data Before You Aggregate. . . . . . . . . . . . . . . . . . . . . . . . . . . . . . . . . . . . . . 33
Limiting Port Connections. . . . . . . . . . . . . . . . . . . . . . . . . . . . . . . . . . . . . . . . . . . . . 33
Optimizing Custom Transformations. . . . . . . . . . . . . . . . . . . . . . . . . . . . . . . . . . . . . . . . . 33
Optimizing Joiner Transformations. . . . . . . . . . . . . . . . . . . . . . . . . . . . . . . . . . . . . . . . . . 34
Table of Contents 5
Optimizing Lookup Transformations. . . . . . . . . . . . . . . . . . . . . . . . . . . . . . . . . . . . . . . . . . 34
Using Optimal Database Drivers. . . . . . . . . . . . . . . . . . . . . . . . . . . . . . . . . . . . . . . . . 34
Caching Lookup Tables. . . . . . . . . . . . . . . . . . . . . . . . . . . . . . . . . . . . . . . . . . . . . . . 35
Optimizing the Lookup Condition. . . . . . . . . . . . . . . . . . . . . . . . . . . . . . . . . . . . . . . . . 36
Filtering Lookup Rows. . . . . . . . . . . . . . . . . . . . . . . . . . . . . . . . . . . . . . . . . . . . . . . 36
Indexing the Lookup Table. . . . . . . . . . . . . . . . . . . . . . . . . . . . . . . . . . . . . . . . . . . . . 37
Optimizing Multiple Lookups. . . . . . . . . . . . . . . . . . . . . . . . . . . . . . . . . . . . . . . . . . . . 37
Creating a Pipeline Lookup Transformation. . . . . . . . . . . . . . . . . . . . . . . . . . . . . . . . . . 37
Optimizing Normalizer Transformations. . . . . . . . . . . . . . . . . . . . . . . . . . . . . . . . . . . . . . . 37
Optimizing Sequence Generator Transformations. . . . . . . . . . . . . . . . . . . . . . . . . . . . . . . . . 37
Optimizing Sorter Transformations. . . . . . . . . . . . . . . . . . . . . . . . . . . . . . . . . . . . . . . . . . 38
Allocating Memory. . . . . . . . . . . . . . . . . . . . . . . . . . . . . . . . . . . . . . . . . . . . . . . . . . 38
Work Directories for Partitions. . . . . . . . . . . . . . . . . . . . . . . . . . . . . . . . . . . . . . . . . . 38
Unicode Mode. . . . . . . . . . . . . . . . . . . . . . . . . . . . . . . . . . . . . . . . . . . . . . . . . . . . . 39
Optimizing Source Qualifier Transformations. . . . . . . . . . . . . . . . . . . . . . . . . . . . . . . . . . . . 39
Optimizing SQL Transformations. . . . . . . . . . . . . . . . . . . . . . . . . . . . . . . . . . . . . . . . . . . . 39
Optimizing XML Transformations. . . . . . . . . . . . . . . . . . . . . . . . . . . . . . . . . . . . . . . . . . . . 40
Eliminating Transformation Errors. . . . . . . . . . . . . . . . . . . . . . . . . . . . . . . . . . . . . . . . . . . 40
Chapter 7: Optimizing Sessions. . . . . . . . . . . . . . . . . . . . . . . . . . . . . . . . . . . . . . . . . . . . . . 41Grid. . . . . . . . . . . . . . . . . . . . . . . . . . . . . . . . . . . . . . . . . . . . . . . . . . . . . . . . . . . . . . 41
Pushdown Optimization. . . . . . . . . . . . . . . . . . . . . . . . . . . . . . . . . . . . . . . . . . . . . . . . . . 42
Concurrent Sessions and Workflows. . . . . . . . . . . . . . . . . . . . . . . . . . . . . . . . . . . . . . . . . 42
Buffer Memory. . . . . . . . . . . . . . . . . . . . . . . . . . . . . . . . . . . . . . . . . . . . . . . . . . . . . . . 42
Increasing DTM Buffer Size. . . . . . . . . . . . . . . . . . . . . . . . . . . . . . . . . . . . . . . . . . . . 43
Optimizing the Buffer Block Size. . . . . . . . . . . . . . . . . . . . . . . . . . . . . . . . . . . . . . . . . 43
Caches. . . . . . . . . . . . . . . . . . . . . . . . . . . . . . . . . . . . . . . . . . . . . . . . . . . . . . . . . . . . 43
Limiting the Number of Connected Ports . . . . . . . . . . . . . . . . . . . . . . . . . . . . . . . . . . . 44
Cache Directory Location. . . . . . . . . . . . . . . . . . . . . . . . . . . . . . . . . . . . . . . . . . . . . 44
Increasing the Cache Sizes . . . . . . . . . . . . . . . . . . . . . . . . . . . . . . . . . . . . . . . . . . . . 44
Using the 64-bit Version of PowerCenter. . . . . . . . . . . . . . . . . . . . . . . . . . . . . . . . . . . . 45
Target-Based Commit. . . . . . . . . . . . . . . . . . . . . . . . . . . . . . . . . . . . . . . . . . . . . . . . . . . 45
Real-time Processing. . . . . . . . . . . . . . . . . . . . . . . . . . . . . . . . . . . . . . . . . . . . . . . . . . . 45
Flush Latency. . . . . . . . . . . . . . . . . . . . . . . . . . . . . . . . . . . . . . . . . . . . . . . . . . . . . 45
Source-Based Commit. . . . . . . . . . . . . . . . . . . . . . . . . . . . . . . . . . . . . . . . . . . . . . . 45
Staging Areas. . . . . . . . . . . . . . . . . . . . . . . . . . . . . . . . . . . . . . . . . . . . . . . . . . . . . . . . 46
Log Files. . . . . . . . . . . . . . . . . . . . . . . . . . . . . . . . . . . . . . . . . . . . . . . . . . . . . . . . . . . 46
Error Tracing. . . . . . . . . . . . . . . . . . . . . . . . . . . . . . . . . . . . . . . . . . . . . . . . . . . . . . . . 46
Post-Session Emails. . . . . . . . . . . . . . . . . . . . . . . . . . . . . . . . . . . . . . . . . . . . . . . . . . . 46
Chapter 8: Optimizing Grid Deployments. . . . . . . . . . . . . . . . . . . . . . . . . . . . . . . . . . . . . . 47Optimizing Grid Deployments Overview. . . . . . . . . . . . . . . . . . . . . . . . . . . . . . . . . . . . . . . 47
Storing Files. . . . . . . . . . . . . . . . . . . . . . . . . . . . . . . . . . . . . . . . . . . . . . . . . . . . . . . . . 47
6 Table of Contents
High Bandwidth Shared File System Files. . . . . . . . . . . . . . . . . . . . . . . . . . . . . . . . . . . 48
Low Bandwidth Shared File System Files. . . . . . . . . . . . . . . . . . . . . . . . . . . . . . . . . . . 48
Local Storage Files. . . . . . . . . . . . . . . . . . . . . . . . . . . . . . . . . . . . . . . . . . . . . . . . . 48
Using a Shared File System. . . . . . . . . . . . . . . . . . . . . . . . . . . . . . . . . . . . . . . . . . . . . . . 48
Configuring a Shared File System. . . . . . . . . . . . . . . . . . . . . . . . . . . . . . . . . . . . . . . . 49
Balancing CPU and Memory Usage. . . . . . . . . . . . . . . . . . . . . . . . . . . . . . . . . . . . . . . 49
Configuring PowerCenter Mappings and Sessions. . . . . . . . . . . . . . . . . . . . . . . . . . . . . 50
Distributing Files Across File Systems. . . . . . . . . . . . . . . . . . . . . . . . . . . . . . . . . . . . . . . . 50
Configuring Sessions to Distribute Files. . . . . . . . . . . . . . . . . . . . . . . . . . . . . . . . . . . . 51
Optimizing Sequence Generator Transformations. . . . . . . . . . . . . . . . . . . . . . . . . . . . . . . . . 52
Chapter 9: Optimizing the PowerCenter Components. . . . . . . . . . . . . . . . . . . . . . . . . . 53Optimizing the PowerCenter Components Overview. . . . . . . . . . . . . . . . . . . . . . . . . . . . . . . 53
Optimizing PowerCenter Repository Performance. . . . . . . . . . . . . . . . . . . . . . . . . . . . . . . . . 53
Location of the Repository Service Process and Repository. . . . . . . . . . . . . . . . . . . . . . . 53
Ordering Conditions in Object Queries. . . . . . . . . . . . . . . . . . . . . . . . . . . . . . . . . . . . . 54
Using a Single-Node DB2 Database Tablespace. . . . . . . . . . . . . . . . . . . . . . . . . . . . . . 54
Optimizing the Database Schema . . . . . . . . . . . . . . . . . . . . . . . . . . . . . . . . . . . . . . . . 54
Object Caching for the Repository Service. . . . . . . . . . . . . . . . . . . . . . . . . . . . . . . . . . 55
Optimizing Resilience. . . . . . . . . . . . . . . . . . . . . . . . . . . . . . . . . . . . . . . . . . . . . . . . 55
Optimizing Integration Service Performance. . . . . . . . . . . . . . . . . . . . . . . . . . . . . . . . . . . . 55
Using Native and ODBC Drivers. . . . . . . . . . . . . . . . . . . . . . . . . . . . . . . . . . . . . . . . . 56
Running the Integration Service in ASCII Data Movement Mode. . . . . . . . . . . . . . . . . . . . . 56
Caching PowerCenter Metadata for the Repository Service . . . . . . . . . . . . . . . . . . . . . . . 56
Chapter 10: Optimizing the System. . . . . . . . . . . . . . . . . . . . . . . . . . . . . . . . . . . . . . . . . . . 57Optimizing the System Overview. . . . . . . . . . . . . . . . . . . . . . . . . . . . . . . . . . . . . . . . . . . . 57
Improving Network Speed. . . . . . . . . . . . . . . . . . . . . . . . . . . . . . . . . . . . . . . . . . . . . . . . 58
Using Multiple CPUs. . . . . . . . . . . . . . . . . . . . . . . . . . . . . . . . . . . . . . . . . . . . . . . . . . . 58
Reducing Paging. . . . . . . . . . . . . . . . . . . . . . . . . . . . . . . . . . . . . . . . . . . . . . . . . . . . . . 58
Using Processor Binding. . . . . . . . . . . . . . . . . . . . . . . . . . . . . . . . . . . . . . . . . . . . . . . . . 58
Chapter 11: Using Pipeline Partitions. . . . . . . . . . . . . . . . . . . . . . . . . . . . . . . . . . . . . . . . . 60Using Pipeline Partitions Overview. . . . . . . . . . . . . . . . . . . . . . . . . . . . . . . . . . . . . . . . . . 60
Increasing the Number of Partitions. . . . . . . . . . . . . . . . . . . . . . . . . . . . . . . . . . . . . . . 60
Selecting the Best Performing Partition Types. . . . . . . . . . . . . . . . . . . . . . . . . . . . . . . . 61
Using Multiple CPUs. . . . . . . . . . . . . . . . . . . . . . . . . . . . . . . . . . . . . . . . . . . . . . . . 62
Optimizing the Source Database for Partitioning. . . . . . . . . . . . . . . . . . . . . . . . . . . . . . . . . . 62
Tuning the Database. . . . . . . . . . . . . . . . . . . . . . . . . . . . . . . . . . . . . . . . . . . . . . . . 62
Grouping Sorted Data. . . . . . . . . . . . . . . . . . . . . . . . . . . . . . . . . . . . . . . . . . . . . . . . 63
Optimizing Single-Sorted Queries. . . . . . . . . . . . . . . . . . . . . . . . . . . . . . . . . . . . . . . . 63
Optimizing the Target Database for Partitioning. . . . . . . . . . . . . . . . . . . . . . . . . . . . . . . . . . 63
Table of Contents 7

Appendix A: Performance Counters. . . . . . . . . . . . . . . . . . . . . . . . . . . . . . . . . . . . . . . . . . . 64Performance Counters Overview. . . . . . . . . . . . . . . . . . . . . . . . . . . . . . . . . . . . . . . . . . . . 64
Errorrows Counter. . . . . . . . . . . . . . . . . . . . . . . . . . . . . . . . . . . . . . . . . . . . . . . . . . . . . 64
Readfromcache and Writetocache Counters. . . . . . . . . . . . . . . . . . . . . . . . . . . . . . . . . . . . 65
Readfromdisk and Writetodisk Counters. . . . . . . . . . . . . . . . . . . . . . . . . . . . . . . . . . . . . . . 65
Rowsinlookupcache Counter. . . . . . . . . . . . . . . . . . . . . . . . . . . . . . . . . . . . . . . . . . . . . . 66
Index. . . . . . . . . . . . . . . . . . . . . . . . . . . . . . . . . . . . . . . . . . . . . . . . . . . . . . . . . . . . 67
8 Table of Contents

PrefaceThe PowerCenter® Performance Tuning Guide is written for PowerCenter administrators and developers, network administrators, and database administrators who are interested in improving PowerCenter performance. This guide assumes you have knowledge of your operating systems, networks, PowerCenter, relational database concepts, and flat files in your environment. For more information about database performance tuning not covered in this guide, see the documentation accompanying your database products.
Informatica Resources
Informatica NetworkInformatica Network hosts Informatica Global Customer Support, the Informatica Knowledge Base, and other product resources. To access Informatica Network, visit https://network.informatica.com.
As a member, you can:
• Access all of your Informatica resources in one place.
• Search the Knowledge Base for product resources, including documentation, FAQs, and best practices.
• View product availability information.
• Review your support cases.
• Find your local Informatica User Group Network and collaborate with your peers.
Informatica Knowledge BaseUse the Informatica Knowledge Base to search Informatica Network for product resources such as documentation, how-to articles, best practices, and PAMs.
To access the Knowledge Base, visit https://kb.informatica.com. If you have questions, comments, or ideas about the Knowledge Base, contact the Informatica Knowledge Base team at [email protected].
Informatica DocumentationTo get the latest documentation for your product, browse the Informatica Knowledge Base at https://kb.informatica.com/_layouts/ProductDocumentation/Page/ProductDocumentSearch.aspx.
If you have questions, comments, or ideas about this documentation, contact the Informatica Documentation team through email at [email protected].
9

Informatica Product Availability MatrixesProduct Availability Matrixes (PAMs) indicate the versions of operating systems, databases, and other types of data sources and targets that a product release supports. If you are an Informatica Network member, you can access PAMs at https://network.informatica.com/community/informatica-network/product-availability-matrices.
Informatica VelocityInformatica Velocity is a collection of tips and best practices developed by Informatica Professional Services. Developed from the real-world experience of hundreds of data management projects, Informatica Velocity represents the collective knowledge of our consultants who have worked with organizations from around the world to plan, develop, deploy, and maintain successful data management solutions.
If you are an Informatica Network member, you can access Informatica Velocity resources at http://velocity.informatica.com.
If you have questions, comments, or ideas about Informatica Velocity, contact Informatica Professional Services at [email protected].
Informatica MarketplaceThe Informatica Marketplace is a forum where you can find solutions that augment, extend, or enhance your Informatica implementations. By leveraging any of the hundreds of solutions from Informatica developers and partners, you can improve your productivity and speed up time to implementation on your projects. You can access Informatica Marketplace at https://marketplace.informatica.com.
Informatica Global Customer SupportYou can contact a Global Support Center by telephone or through Online Support on Informatica Network.
To find your local Informatica Global Customer Support telephone number, visit the Informatica website at the following link: http://www.informatica.com/us/services-and-training/support-services/global-support-centers.
If you are an Informatica Network member, you can use Online Support at http://network.informatica.com.
10 Preface

C H A P T E R 1
Performance Tuning OverviewThis chapter includes the following topic:
• Performance Tuning Overview, 11
Performance Tuning OverviewThe goal of performance tuning is to optimize session performance by eliminating performance bottlenecks. To tune session performance, first identify a performance bottleneck, eliminate it, and then identify the next performance bottleneck until you are satisfied with the session performance. You can use the test load option to run sessions when you tune session performance.
If you tune all the bottlenecks, you can further optimize session performance by increasing the number of pipeline partitions in the session. Adding partitions can improve performance by utilizing more of the system hardware while processing the session.
Because determining the best way to improve performance can be complex, change one variable at a time, and time the session both before and after the change. If session performance does not improve, you might want to return to the original configuration.
Complete the following tasks to improve session performance:
1. Optimize the target. Enables the Integration Service to write to the targets efficiently.
2. Optimize the source. Enables the Integration Service to read source data efficiently.
3. Optimize the mapping. Enables the Integration Service to transform and move data efficiently.
4. Optimize the transformation. Enables the Integration Service to process transformations in a mapping efficiently.
5. Optimize the session. Enables the Integration Service to run the session more quickly.
6. Optimize the grid deployments. Enables the Integration Service to run on a grid with optimal performance.
7. Optimize the PowerCenter components. Enables the Integration Service and Repository Service to function optimally.
8. Optimize the system. Enables PowerCenter service processes to run more quickly.
11

C H A P T E R 2
BottlenecksThis chapter includes the following topics:
• Bottlenecks Overview, 12
• Using Thread Statistics, 13
• Target Bottlenecks, 14
• Source Bottlenecks, 15
• Mapping Bottlenecks, 16
• Session Bottlenecks, 17
• System Bottlenecks, 17
Bottlenecks OverviewThe first step in performance tuning is to identify performance bottlenecks. Performance bottlenecks can occur in the source and target databases, the mapping, the session, and the system. The strategy is to identify a performance bottleneck, eliminate it, and then identify the next performance bottleneck until you are satisfied with the performance.
Look for performance bottlenecks in the following order:
1. Target
2. Source
3. Mapping
4. Session
5. System
Use the following methods to identify performance bottlenecks:
• Run test sessions. You can configure a test session to read from a flat file source or to write to a flat file target to identify source and target bottlenecks.
• Analyze performance details. Analyze performance details, such as performance counters, to determine where session performance decreases.
• Analyze thread statistics. Analyze thread statistics to determine the optimal number of partition points.
• Monitor system performance. You can use system monitoring tools to view the percentage of CPU use, I/O waits, and paging to identify system bottlenecks. You can also use the Workflow Monitor to view system resource usage.
12

Using Thread StatisticsYou can use thread statistics in the session log to identify source, target, or transformation bottlenecks. By default, the Integration Service uses one reader thread, one transformation thread, and one writer thread to process a session. The thread with the highest busy percentage identifies the bottleneck in the session.
The session log provides the following thread statistics:
• Run time. Amount of time the thread runs.
• Idle time. Amount of time the thread is idle. It includes the time the thread waits for other thread processing within the application. Idle time includes the time the thread is blocked by the Integration Service, but not the time the thread is blocked by the operating system.
• Busy time. Percentage of the run time the thread is by according to the following formula:(run time - idle time) / run time X 100
You can ignore high busy percentages when the total run time is short, such as under 60 seconds. This does not necessarily indicate a bottleneck.
• Thread work time. The percentage of time the Integration Service takes to process each transformation in a thread. The session log shows the following information for the transformation thread work time:
Thread work time breakdown: <transformation name>: <number> percent <transformation name>: <number> percent <transformation name>: <number> percent
If a transformation takes a small amount of time, the session log does not include it. If a thread does not have accurate statistics, because the session ran for a short period of time, the session log reports that the statistics are not accurate.
Eliminating Bottlenecks Based on Thread StatisticsComplete the following tasks to eliminate bottlenecks based on thread statistics:
• If the reader or writer thread is 100% busy, consider using string datatypes in the source or target ports. Non-string ports require more processing.
• If a transformation thread is 100% busy, consider adding a partition point in the segment. When you add partition points to the mapping, the Integration Service increases the number of transformation threads it uses for the session. However, if the machine is already running at or near full capacity, do not add more threads.
• If one transformation requires more processing time than the others, consider adding a pass-through partition point to the transformation.
ExampleWhen you run a session, the session log lists run information and thread statistics similar to the following text:
***** RUN INFO FOR TGT LOAD ORDER GROUP [1], CONCURRENT SET [1] *****Thread [READER_1_1_1] created for [the read stage] of partition point [SQ_two_gig_file_32B_rows] has completed. Total Run Time = [505.871140] secs Total Idle Time = [457.038313] secs Busy Percentage = [9.653215]Thread [TRANSF_1_1_1] created for [the transformation stage] of partition point [SQ_two_gig_file_32B_rows] has completed. Total Run Time = [506.230461] secs Total Idle Time = [1.390318] secs Busy Percentage = [99.725359]
Using Thread Statistics 13
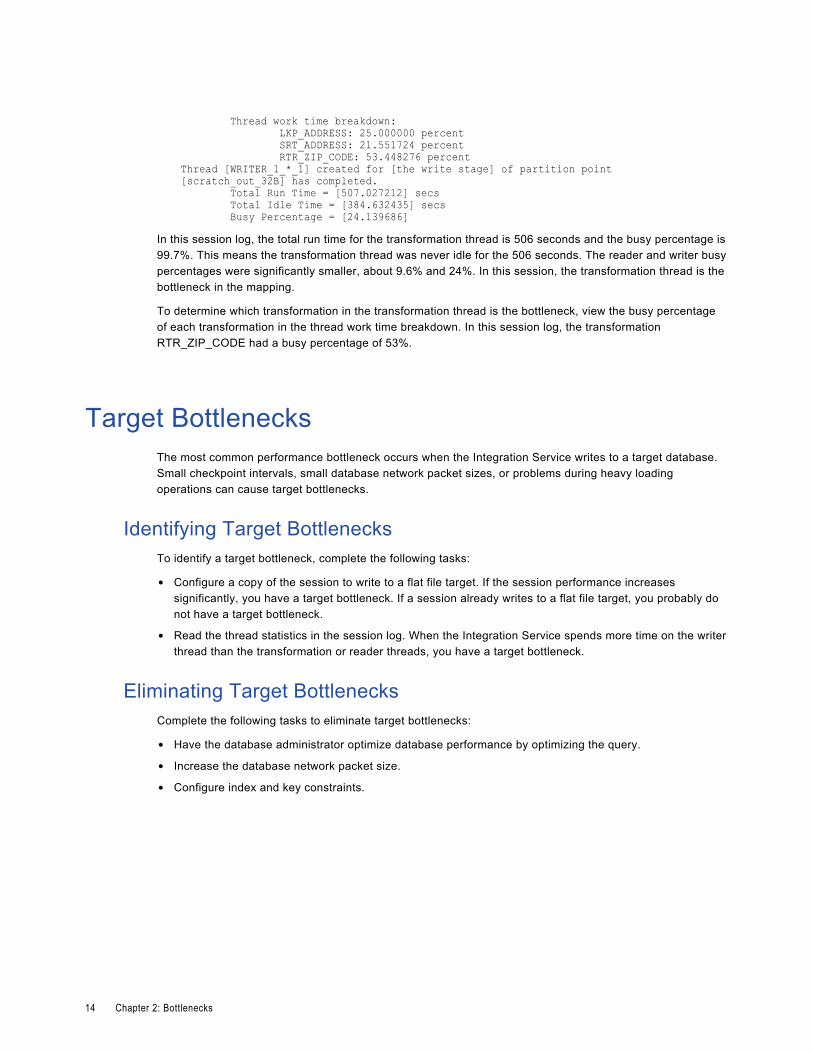
Thread work time breakdown: LKP_ADDRESS: 25.000000 percent SRT_ADDRESS: 21.551724 percent RTR_ZIP_CODE: 53.448276 percentThread [WRITER_1_*_1] created for [the write stage] of partition point [scratch_out_32B] has completed. Total Run Time = [507.027212] secs Total Idle Time = [384.632435] secs Busy Percentage = [24.139686]
In this session log, the total run time for the transformation thread is 506 seconds and the busy percentage is 99.7%. This means the transformation thread was never idle for the 506 seconds. The reader and writer busy percentages were significantly smaller, about 9.6% and 24%. In this session, the transformation thread is the bottleneck in the mapping.
To determine which transformation in the transformation thread is the bottleneck, view the busy percentage of each transformation in the thread work time breakdown. In this session log, the transformation RTR_ZIP_CODE had a busy percentage of 53%.
Target BottlenecksThe most common performance bottleneck occurs when the Integration Service writes to a target database. Small checkpoint intervals, small database network packet sizes, or problems during heavy loading operations can cause target bottlenecks.
Identifying Target BottlenecksTo identify a target bottleneck, complete the following tasks:
• Configure a copy of the session to write to a flat file target. If the session performance increases significantly, you have a target bottleneck. If a session already writes to a flat file target, you probably do not have a target bottleneck.
• Read the thread statistics in the session log. When the Integration Service spends more time on the writer thread than the transformation or reader threads, you have a target bottleneck.
Eliminating Target BottlenecksComplete the following tasks to eliminate target bottlenecks:
• Have the database administrator optimize database performance by optimizing the query.
• Increase the database network packet size.
• Configure index and key constraints.
14 Chapter 2: Bottlenecks
Related Topics:• “Optimizing the Target” on page 20
Source BottlenecksPerformance bottlenecks can occur when the Integration Service reads from a source database. Inefficient query or small database network packet sizes can cause source bottlenecks.
Identifying Source BottlenecksYou can read the thread statistics in the session log to determine if the source is the bottleneck. When the Integration Service spends more time on the reader thread than the transformation or writer threads, you have a source bottleneck.
If the session reads from a relational source, use the following methods to identify source bottlenecks:
• Filter transformation
• Read test mapping
• Database query
If the session reads from a flat file source, you probably do not have a source bottleneck.
Using a Filter TransformationYou can use a Filter transformation in the mapping to measure the time it takes to read source data.
Add a Filter transformation after each source qualifier. Set the filter condition to false so that no data is processed passed the Filter transformation. If the time it takes to run the new session remains about the same, you have a source bottleneck.
Using a Read Test MappingYou can create a read test mapping to identify source bottlenecks. A read test mapping isolates the read query by removing the transformation in the mapping.
To create a read test mapping, complete the following steps:
1. Make a copy of the original mapping.
2. In the copied mapping, keep only the sources, source qualifiers, and any custom joins or queries.
3. Remove all transformations.
4. Connect the source qualifiers to a file target.
Run a session against the read test mapping. If the session performance is similar to the original session, you have a source bottleneck.
Using a Database QueryTo identify source bottlenecks, execute the read query directly against the source database.
Copy the read query directly from the session log. Execute the query against the source database with a query tool such as isql. On Windows, you can load the result of the query in a file. On UNIX, you can load the result of the query in /dev/null.
Source Bottlenecks 15

Measure the query execution time and the time it takes for the query to return the first row.
Eliminating Source BottlenecksComplete the following tasks to eliminate source bottlenecks:
• Set the number of bytes the Integration Service reads per line if the Integration Service reads from a flat file source.
• Have the database administrator optimize database performance by optimizing the query.
• Increase the database network packet size.
• Configure index and key constraints.
• If there is a long delay between the two time measurements in a database query, you can use an optimizer hint.
Related Topics:• “Optimizing the Source” on page 23
Mapping BottlenecksIf you determine that you do not have a source or target bottleneck, you may have a mapping bottleneck.
Identifying Mapping BottlenecksTo identify mapping bottlenecks, complete the following tasks:
• Read the thread statistics and work time statistics in the session log. When the Integration Service spends more time on the transformation thread than the writer or reader threads, you have a transformation bottleneck. When the Integration Service spends more time on one transformation, it is the bottleneck in the transformation thread.
• Analyze performance counters. High errorrows and rowsinlookupcache counters indicate a mapping bottleneck.
• Add a Filter transformation before each target definition. Set the filter condition to false so that no data is loaded into the target tables. If the time it takes to run the new session is the same as the original session, you have a mapping bottleneck.
Eliminating Mapping BottlenecksTo eliminate mapping bottlenecks, optimize transformation settings in mappings.
16 Chapter 2: Bottlenecks
Related Topics:• “Optimizing Mappings” on page 26
Session BottlenecksIf you do not have a source, target, or mapping bottleneck, you may have a session bottleneck. Small cache size, low buffer memory, and small commit intervals can cause session bottlenecks.
Identifying Session BottlenecksTo identify a session bottleneck, analyze the performance details. Performance details display information about each transformation, such as the number of input rows, output rows, and error rows.
Eliminating Session BottlenecksTo eliminate session bottlenecks, optimize the session.
Related Topics:• “Optimizing Sessions” on page 41
System BottlenecksAfter you tune the source, target, mapping, and session, consider tuning the system to prevent system bottlenecks. The Integration Service uses system resources to process transformations, run sessions, and read and write data. The Integration Service also uses system memory to create cache files for transformations, such as Aggregator, Joiner, Lookup, Sorter, XML, and Rank.
Identifying System BottlenecksYou can view system resource usage in the Workflow Monitor. You can use system tools to monitor Windows and UNIX systems.
Using the Workflow Monitor to Identify System BottlenecksYou can view the Integration Service properties in the Workflow Monitor to see CPU, memory, and swap usage of the system when you are running task processes on the Integration Service. Use the following Integration Service properties to identify performance issues:
• CPU%. The percentage of CPU usage includes other external tasks running on the system.
• Memory usage. The percentage of memory usage includes other external tasks running on the system. If the memory usage is close to 95%, check if the tasks running on the system are using the amount indicated in the Workflow Monitor or if there is a memory leak. To troubleshoot, use system tools to check the memory usage before and after running the session and then compare the results to the memory usage while running the session.
Session Bottlenecks 17

• Swap usage. Swap usage is a result of paging due to possible memory leaks or a high number of concurrent tasks.
Identifying System Bottlenecks on WindowsYou can view the Performance and Processes tab in the Task Manager for system information. The Performance tab in the Task Manager provides an overview of CPU usage and total memory used. Use the Performance Monitor to view more detailed information.
The following table describes the system information that you can use in the Windows Performance Monitor to create a chart:
Property Description
Percent processor time If you have more than one CPU, monitor each CPU for percent processor time.
Pages/second If pages/second is greater than five, you may have excessive memory pressure known as thrashing.
Physical disks percent time The percent of time that the physical disk is busy performing read or write requests.
Physical disks queue length The number of users waiting for access to the same disk device.
Server total bytes per second The server has sent to and received from the network.
Identifying System Bottlenecks on UNIXUse the following tools to identify system bottlenecks on UNIX:
• top. View overall system performance. This tool displays CPU usage, memory usage, and swap usage for the system and for individual processes running on the system.
• iostat. Monitor the loading operation for every disk attached to the database server. Iostat displays the percentage of time that the disk is physically active. If you use disk arrays, use utilities provided with the disk arrays instead of iostat.
• vmstat. Monitor disk swapping actions.
• sar. View detailed system activity reports of CPU, memory, and disk usage. You can use this tool to monitor CPU loading. It provides percent usage on user, system, idle time, and waiting time. You can also use this tool to monitor disk swapping actions.
Eliminating System BottlenecksComplete the following tasks to eliminate system bottlenecks:
• If the CPU usage is more than 80%, check the number of concurrent running tasks. Consider changing the load or using a grid to distribute tasks to different nodes. If you cannot reduce the load, consider adding more processors.
• If swapping occurs, increase the physical memory or reduce the number of memory-intensive applications on the disk.
• If you have excessive memory pressure (thrashing), consider adding more physical memory.
• If the percent of time is high, tune the cache for PowerCenter to use in-memory cache instead of writing to disk. If you tune the cache, requests are still in queue, and the disk busy percentage is at least 50%, add
18 Chapter 2: Bottlenecks

another disk device or upgrade to a faster disk device. You can also use a separate disk for each partition in the session.
• If physical disk queue length is greater than two, consider adding another disk device or upgrading the disk device. You also can use separate disks for the reader, writer, and transformation threads.
• Consider improving network bandwidth.
• When you tune UNIX systems, tune the server for a major database system.
• If the percent time spent waiting on I/O (%wio) is high, consider using other under-utilized disks. For example, if the source data, target data, lookup, rank, and aggregate cache files are all on the same disk, consider putting them on different disks.
Related Topics:• “Reducing Paging” on page 58
• “Optimizing the System” on page 57
System Bottlenecks 19

C H A P T E R 3
Optimizing the TargetThis chapter includes the following topics:
• Optimizing Flat File Targets, 20
• Dropping Indexes and Key Constraints, 20
• Increasing Database Checkpoint Intervals, 21
• Using Bulk Loads, 21
• Using External Loaders, 21
• Minimizing Deadlocks, 22
• Increasing Database Network Packet Size, 22
• Optimizing Oracle Target Databases, 22
Optimizing Flat File TargetsIf you use a shared storage directory for flat file targets, you can optimize session performance by ensuring that the shared storage directory is on a machine that is dedicated to storing and managing files, instead of performing other tasks.
If the Integration Service runs on a single node and the session writes to a flat file target, you can optimize session performance by writing to a flat file target that is local to the Integration Service process node.
Dropping Indexes and Key ConstraintsWhen you define key constraints or indexes in target tables, you slow the loading of data to those tables. To improve performance, drop indexes and key constraints before you run the session. You can rebuild those indexes and key constraints after the session completes.
If you decide to drop and rebuild indexes and key constraints on a regular basis, you can use the following methods to perform these operations each time you run the session:
• Use pre-load and post-load stored procedures.
• Use pre-session and post-session SQL commands.
Note: To optimize performance, use constraint-based loading only if necessary.
20

Increasing Database Checkpoint IntervalsThe Integration Service performance slows each time it waits for the database to perform a checkpoint. To decrease the number of checkpoints and increase performance, increase the checkpoint interval in the database.
Note: Although you gain performance when you reduce the number of checkpoints, you also increase the recovery time if the database shuts down unexpectedly.
Using Bulk LoadsYou can use bulk loading to improve the performance of a session that inserts a large amount of data into a DB2, Sybase ASE, Oracle, or Microsoft SQL Server database. Configure bulk loading in the session properties.
When bulk loading, the Integration Service bypasses the database log, which speeds performance. Without writing to the database log, however, the target database cannot perform rollback. As a result, you may not be able to perform recovery. When you use bulk loading, weigh the importance of improved session performance against the ability to recover an incomplete session.
When bulk loading to Microsoft SQL Server or Oracle targets, define a large commit interval to increase performance. Microsoft SQL Server and Oracle start a new bulk load transaction after each commit. Increasing the commit interval reduces the number of bulk load transactions, which increases performance.
Related Topics:• “Target-Based Commit” on page 45
Using External LoadersTo increase session performance, configure PowerCenter to use an external loader for the following types of target databases:
• IBM DB2 EE or EEE
• Oracle
When you load data to an Oracle database using a pipeline with multiple partitions, you can increase performance if you create the Oracle target table with the same number of partitions you use for the pipeline.
• Sybase IQ
If the Sybase IQ database is local to the Integration Service process on the UNIX system, you can increase performance by loading data to target tables directly from named pipes. If you run the Integration Service on a grid, configure the Load Balancer to check resources, make Sybase IQ a resource, and make the resource available on all nodes of the grid. Then, in the Workflow Manager, assign the Sybase IQ resource to the applicable sessions.
• Teradata
Increasing Database Checkpoint Intervals 21

Minimizing DeadlocksIf the Integration Service encounters a deadlock when it tries to write to a target, the deadlock only affects targets in the same target connection group. The Integration Service still writes to targets in other target connection groups.
Encountering deadlocks can slow session performance. To improve session performance, you can increase the number of target connection groups the Integration Service uses to write to the targets in a session. To use a different target connection group for each target in a session, use a different database connection name for each target instance. You can specify the same connection information for each connection name.
Increasing Database Network Packet SizeIf you write to Oracle, Sybase ASE, or Microsoft SQL Server targets, you can improve the performance by increasing the network packet size. Increase the network packet size to allow larger packets of data to cross the network at one time. Increase the network packet size based on the database you write to:
• Oracle. You can increase the database server network packet size in listener.ora and tnsnames.ora. Consult your database documentation for additional information about increasing the packet size, if necessary.
• Sybase ASE and Microsoft SQL Server. Consult your database documentation for information about how to increase the packet size.
For Sybase ASE or Microsoft SQL Server, you must also change the packet size in the relational connection object in the Workflow Manager to reflect the database server packet size.
Optimizing Oracle Target DatabasesIf the target database is Oracle, you can optimize the target database by checking the storage clause, space allocation, and rollback or undo segments.
When you write to an Oracle database, check the storage clause for database objects. Make sure that tables are using large initial and next values. The database should also store table and index data in separate tablespaces, preferably on different disks.
When you write to Oracle databases, the database uses rollback or undo segments during loads. Ask the Oracle database administrator to ensure that the database stores rollback or undo segments in appropriate tablespaces, preferably on different disks. The rollback or undo segments should also have appropriate storage clauses.
To optimize the Oracle database, tune the Oracle redo log. The Oracle database uses the redo log to log loading operations. Make sure the redo log size and buffer size are optimal. You can view redo log properties in the init.ora file.
If the Integration Service runs on a single node and the Oracle instance is local to the Integration Service process node, you can optimize performance by using IPC protocol to connect to the Oracle database. You can set up Oracle database connection in listener.ora and tnsnames.ora.
For more information about optimizing Oracle databases, see the Oracle documentation.
22 Chapter 3: Optimizing the Target
C H A P T E R 4
Optimizing the SourceThis chapter includes the following topics:
• Optimizing the Query, 23
• Using Conditional Filters, 24
• Increasing Database Network Packet Size, 24
• Connecting to Oracle Database Sources, 24
• Using Teradata FastExport, 24
• Using tempdb to Join Sybase or Microsoft SQL Server Tables, 25
Optimizing the QueryIf a session joins multiple source tables in one Source Qualifier, you might be able to improve performance by optimizing the query with optimizing hints. Also, single table select statements with an ORDER BY or GROUP BY clause may benefit from optimization such as adding indexes.
Usually, the database optimizer determines the most efficient way to process the source data. However, you might know properties about the source tables that the database optimizer does not. The database administrator can create optimizer hints to tell the database how to execute the query for a particular set of source tables.
The query that the Integration Service uses to read data appears in the session log. You can also find the query in the Source Qualifier transformation. Have the database administrator analyze the query, and then create optimizer hints and indexes for the source tables.
Use optimizing hints if there is a long delay between when the query begins executing and when PowerCenter receives the first row of data. Configure optimizer hints to begin returning rows as quickly as possible, rather than returning all rows at once. This allows the Integration Service to process rows parallel with the query execution.
Queries that contain ORDER BY or GROUP BY clauses may benefit from creating an index on the ORDER BY or GROUP BY columns. Once you optimize the query, use the SQL override option to take full advantage of these modifications.
You can also configure the source database to run parallel queries to improve performance. For more information about configuring parallel queries, see the database documentation.
23
Using Conditional FiltersA simple source filter on the source database can sometimes negatively impact performance because of the lack of indexes. You can use the PowerCenter conditional filter in the Source Qualifier to improve performance.
Whether you should use the PowerCenter conditional filter to improve performance depends on the session. For example, if multiple sessions read from the same source simultaneously, the PowerCenter conditional filter may improve performance.
However, some sessions may perform faster if you filter the source data on the source database. You can test the session with both the database filter and the PowerCenter filter to determine which method improves performance.
Increasing Database Network Packet SizeIf you read from Oracle, Sybase ASE, or Microsoft SQL Server sources, you can improve the performance by increasing the network packet size. Increase the network packet size to allow larger packets of data to cross the network at one time. Increase the network packet size based on the database you read from:
• Oracle. You can increase the database server network packet size in listener.ora and tnsnames.ora. Consult your database documentation for additional information about increasing the packet size, if necessary.
• Sybase ASE and Microsoft SQL Server. Consult your database documentation for information about how to increase the packet size.
For Sybase ASE or Microsoft SQL Server, you must also change the packet size in the relational connection object in the Workflow Manager to reflect the database server packet size.
Connecting to Oracle Database SourcesIf you are running the Integration Service on a single node and the Oracle instance is local to the Integration Service process node, you can optimize performance by using IPC protocol to connect to the Oracle database. You can set up an Oracle database connection in listener.ora and tnsnames.ora.
Using Teradata FastExportFastExport is a utility that uses multiple Teradata sessions to quickly export large amounts of data from a Teradata database. You can create a PowerCenter session that uses FastExport to read Teradata sources quickly. To use FastExport, create a mapping with a Teradata source database. In the session, use FastExport reader instead of Relational reader. Use a FastExport connection to the Teradata tables that you want to export in a session.
24 Chapter 4: Optimizing the Source
Using tempdb to Join Sybase or Microsoft SQL Server Tables
When you join large tables on a Sybase or Microsoft SQL Server database, it is possible to improve performance by creating the tempdb as an in-memory database to allocate sufficient memory. For more information, see the Sybase or Microsoft SQL Server documentation.
Using tempdb to Join Sybase or Microsoft SQL Server Tables 25

C H A P T E R 5
Optimizing MappingsThis chapter includes the following topics:
• Optimizing Mappings Overview, 26
• Optimizing Flat File Sources, 26
• Configuring Single-Pass Reading, 27
• Optimizing Pass-Through Mappings, 28
• Optimizing Filters, 28
• Optimizing Datatype Conversions, 28
• Optimizing Expressions, 29
• Optimizing External Procedures, 31
Optimizing Mappings OverviewMapping-level optimization may take time to implement, but it can significantly boost session performance. Focus on mapping-level optimization after you optimize the targets and sources.
Generally, you reduce the number of transformations in the mapping and delete unnecessary links between transformations to optimize the mapping. Configure the mapping with the least number of transformations and expressions to do the most amount of work possible. Delete unnecessary links between transformations to minimize the amount of data moved.
Optimizing Flat File SourcesComplete the following tasks to optimize flat file sources:
• Optimize the line sequential buffer length.
• Optimize delimited flat file sources.
• Optimize XML and flat file sources.
Optimizing the Line Sequential Buffer LengthIf the session reads from a flat file source, you can improve session performance by setting the number of bytes the Integration Service reads per line. By default, the Integration Service reads 1024 bytes per line. If
26

each line in the source file is less than the default setting, you can decrease the line sequential buffer length in the session properties.
Optimizing Delimited Flat File SourcesIf a source is a delimited flat file, you must specify the delimiter character to separate columns of data in the source file. You must also specify the escape character. The Integration Service reads the delimiter character as a regular character if you include the escape character before the delimiter character. You can improve session performance if the source flat file does not contain quotes or escape characters.
Optimizing XML and Flat File SourcesXML files are usually larger than flat files because of the tag information. The size of an XML file depends on the level of tagging in the XML file. More tags result in a larger file size. As a result, the Integration Service may take longer to read and cache XML sources.
Configuring Single-Pass ReadingSingle-pass reading allows you to populate multiple targets with one source qualifier. Consider using single-pass reading if you have multiple sessions that use the same sources. You can combine the transformation logic for each mapping in one mapping and use one source qualifier for each source. The Integration Service reads each source once and then sends the data into separate pipelines. A particular row can be used by all the pipelines, by any combination of pipelines, or by no pipelines.
For example, you have the Purchasing source table, and you use that source daily to perform an aggregation and a ranking. If you place the Aggregator and Rank transformations in separate mappings and sessions, you force the Integration Service to read the same source table twice. However, if you include the aggregation and ranking logic in one mapping with one source qualifier, the Integration Service reads the Purchasing source table once, and then sends the appropriate data to the separate pipelines.
When changing mappings to take advantage of single-pass reading, you can optimize this feature by factoring out common functions from mappings. For example, if you need to subtract a percentage from the Price ports for both the Aggregator and Rank transformations, you can minimize work by subtracting the percentage before splitting the pipeline. You can use an Expression transformation to subtract the percentage, and then split the mapping after the transformation.
The following figure shows the single-pass reading, where the mapping splits after the Expression transformation:
Configuring Single-Pass Reading 27
Optimizing Pass-Through MappingsYou can optimize performance for pass-through mappings. To pass directly from source to target without any other transformations, connect the Source Qualifier transformation directly to the target. If you use the Getting Started Wizard to create a pass-through mapping, the wizard creates an Expression transformation between the Source Qualifier transformation and the target.
Optimizing FiltersUse one of the following transformations to filter data:
• Source Qualifier transformation. The Source Qualifier transformation filters rows from relational sources.
• Filter transformation. The Filter transformation filters data within a mapping. The Filter transformation filters rows from any type of source.
If you filter rows from the mapping, you can improve efficiency by filtering early in the data flow. Use a filter in the Source Qualifier transformation to remove the rows at the source. The Source Qualifier transformation limits the row set extracted from a relational source.
If you cannot use a filter in the Source Qualifier transformation, use a Filter transformation and move it as close to the Source Qualifier transformation as possible to remove unnecessary data early in the data flow. The Filter transformation limits the row set sent to a target.
Avoid using complex expressions in filter conditions. To optimize Filter transformations, use simple integer or true/false expressions in the filter condition.
Note: You can also use a Filter or Router transformation to drop rejected rows from an Update Strategy transformation if you do not need to keep rejected rows.
Optimizing Datatype ConversionsYou can increase performance by eliminating unnecessary datatype conversions. For example, if a mapping moves data from an Integer column to a Decimal column, then back to an Integer column, the unnecessary datatype conversion slows performance. Where possible, eliminate unnecessary datatype conversions from mappings.
Use the following datatype conversions to improve system performance:
• Use integer values in place of other datatypes when performing comparisons using Lookup and Filter transformations. For example, many databases store U.S. ZIP code information as a Char or Varchar datatype. If you convert the zip code data to an Integer datatype, the lookup database stores the zip code 94303-1234 as 943031234. This helps increase the speed of the lookup comparisons based on zip code.
• Convert the source dates to strings through port-to-port conversions to increase session performance. You can either leave the ports in targets as strings or change the ports to Date/Time ports.
28 Chapter 5: Optimizing Mappings

Optimizing ExpressionsYou can also optimize the expressions used in the transformations. When possible, isolate slow expressions and simplify them.
Complete the following tasks to isolate the slow expressions:
1. Remove the expressions one-by-one from the mapping.
2. Run the mapping to determine the time it takes to run the mapping without the transformation.
If there is a significant difference in session run time, look for ways to optimize the slow expression.
Factoring Out Common LogicIf the mapping performs the same task in multiple places, reduce the number of times the mapping performs the task by moving the task earlier in the mapping. For example, you have a mapping with five target tables. Each target requires a Social Security number lookup. Instead of performing the lookup five times, place the Lookup transformation in the mapping before the data flow splits. Next, pass the lookup results to all five targets.
Minimizing Aggregate Function CallsWhen writing expressions, factor out as many aggregate function calls as possible. Each time you use an aggregate function call, the Integration Service must search and group the data. For example, in the following expression, the Integration Service reads COLUMN_A, finds the sum, then reads COLUMN_B, finds the sum, and finally finds the sum of the two sums:
SUM(COLUMN_A) + SUM(COLUMN_B)If you factor out the aggregate function call, as below, the Integration Service adds COLUMN_A to COLUMN_B, then finds the sum of both.
SUM(COLUMN_A + COLUMN_B)
Replacing Common Expressions with Local VariablesIf you use the same expression multiple times in one transformation, you can make that expression a local variable. You can use a local variable only within the transformation. However, by calculating the variable only once, you speed performance.
Choosing Numeric Versus String OperationsThe Integration Service processes numeric operations faster than string operations. For example, if you look up large amounts of data on two columns, EMPLOYEE_NAME and EMPLOYEE_ID, configuring the lookup around EMPLOYEE_ID improves performance.
Optimizing Char-Char and Char-Varchar ComparisonsWhen the Integration Service performs comparisons between CHAR and VARCHAR columns, it slows each time it finds trailing blank spaces in the row. You can use the TreatCHARasCHARonRead option when you configure the Integration Service in the Informatica Administrator so that the Integration Service does not trim trailing spaces from the end of Char source fields.
Optimizing Expressions 29
Choosing DECODE Versus LOOKUPWhen you use a LOOKUP function, the Integration Service must look up a table in a database. When you use a DECODE function, you incorporate the lookup values into the expression so the Integration Service does not have to look up a separate table. Therefore, when you want to look up a small set of unchanging values, use DECODE to improve performance.
Using Operators Instead of FunctionsThe Integration Service reads expressions written with operators faster than expressions with functions. Where possible, use operators to write expressions. For example, you have the following expression that contains nested CONCAT functions:
CONCAT( CONCAT( CUSTOMERS.FIRST_NAME, ‘ ’) CUSTOMERS.LAST_NAME)You can rewrite that expression with the || operator as follows:
CUSTOMERS.FIRST_NAME || ‘ ’ || CUSTOMERS.LAST_NAME
Optimizing IIF FunctionsIIF functions can return a value and an action, which allows for more compact expressions. For example, you have a source with three Y/N flags: FLG_A, FLG_B, FLG_C. You want to return values based on the values of each flag.
You use the following expression:
IIF( FLG_A = 'Y' and FLG_B = 'Y' AND FLG_C = 'Y',
VAL_A + VAL_B + VAL_C,
IIF( FLG_A = 'Y' and FLG_B = 'Y' AND FLG_C = 'N',
VAL_A + VAL_B ,
IIF( FLG_A = 'Y' and FLG_B = 'N' AND FLG_C = 'Y',
VAL_A + VAL_C,
IIF( FLG_A = 'Y' and FLG_B = 'N' AND FLG_C = 'N',
VAL_A ,
IIF( FLG_A = 'N' and FLG_B = 'Y' AND FLG_C = 'Y',
VAL_B + VAL_C,
IIF( FLG_A = 'N' and FLG_B = 'Y' AND FLG_C = 'N',
VAL_B ,
IIF( FLG_A = 'N' and FLG_B = 'N' AND FLG_C = 'Y',
VAL_C,
IIF( FLG_A = 'N' and FLG_B = 'N' AND FLG_C = 'N',
0.0,
))))))))This expression requires 8 IIFs, 16 ANDs, and at least 24 comparisons.
If you take advantage of the IIF function, you can rewrite that expression as:
IIF(FLG_A='Y', VAL_A, 0.0)+ IIF(FLG_B='Y', VAL_B, 0.0)+ IIF(FLG_C='Y', VAL_C, 0.0)
30 Chapter 5: Optimizing Mappings
This results in three IIFs, two comparisons, two additions, and a faster session.
Evaluating ExpressionsIf you are not sure which expressions slow performance, evaluate the expression performance to isolate the problem.
Complete the following steps to evaluate expression performance:
1. Time the session with the original expressions.
2. Copy the mapping and replace half of the complex expressions with a constant.
3. Run and time the edited session.
4. Make another copy of the mapping and replace the other half of the complex expressions with a constant.
5. Run and time the edited session.
Optimizing External ProceduresYou might want to block input data if the external procedure needs to alternate reading from input groups. Without the blocking functionality, you would need to write the procedure code to buffer incoming data. You can block input data instead of buffering it which usually increases session performance.
For example, you need to create an external procedure with two input groups. The external procedure reads a row from the first input group and then reads a row from the second input group. If you use blocking, you can write the external procedure code to block the flow of data from one input group while it processes the data from the other input group. When you write the external procedure code to block data, you increase performance because the procedure does not need to copy the source data to a buffer. However, you could write the external procedure to allocate a buffer and copy the data from one input group to the buffer until it is ready to process the data. Copying source data to a buffer decreases performance.
Optimizing External Procedures 31
C H A P T E R 6
Optimizing TransformationsThis chapter includes the following topics:
• Optimizing Aggregator Transformations, 32
• Optimizing Custom Transformations, 33
• Optimizing Joiner Transformations, 34
• Optimizing Lookup Transformations, 34
• Optimizing Normalizer Transformations, 37
• Optimizing Sequence Generator Transformations, 37
• Optimizing Sorter Transformations, 38
• Optimizing Source Qualifier Transformations, 39
• Optimizing SQL Transformations, 39
• Optimizing XML Transformations, 40
• Eliminating Transformation Errors, 40
Optimizing Aggregator TransformationsAggregator transformations often slow performance because they must group data before processing it. Aggregator transformations need additional memory to hold intermediate group results.
Use the following guidelines to optimize the performance of an Aggregator transformation:
• Group by simple columns.
• Use sorted input.
• Use incremental aggregation.
• Filter data before you aggregate it.
• Limit port connections.
Grouping By Simple ColumnsYou can optimize Aggregator transformations when you group by simple columns. When possible, use numbers instead of string and dates in the columns used for the GROUP BY. Avoid complex expressions in the Aggregator expressions.
32
Using Sorted InputTo increase session performance, sort data for the Aggregator transformation. Use the Sorted Input option to sort data.
The Sorted Input option decreases the use of aggregate caches. When you use the Sorted Input option, the Integration Service assumes all data is sorted by group. As the Integration Service reads rows for a group, it performs aggregate calculations. When necessary, it stores group information in memory.
The Sorted Input option reduces the amount of data cached during the session and improves performance. Use this option with the Source Qualifier Number of Sorted Ports option or a Sorter transformation to pass sorted data to the Aggregator transformation.
You can increase performance when you use the Sorted Input option in sessions with multiple partitions.
Using Incremental AggregationIf you can capture changes from the source that affect less than half the target, you can use incremental aggregation to optimize the performance of Aggregator transformations.
When you use incremental aggregation, you apply captured changes in the source to aggregate calculations in a session. The Integration Service updates the target incrementally, rather than processing the entire source and recalculating the same calculations every time you run the session.
You can increase the index and data cache sizes to hold all data in memory without paging to disk.
Related Topics:• “Increasing the Cache Sizes ” on page 44
Filtering Data Before You AggregateFilter the data before you aggregate it. If you use a Filter transformation in the mapping, place the transformation before the Aggregator transformation to reduce unnecessary aggregation.
Limiting Port ConnectionsLimit the number of connected input/output or output ports to reduce the amount of data the Aggregator transformation stores in the data cache.
Optimizing Custom TransformationsThe Integration Service can pass a single row to a Custom transformation procedure or a block of rows in an array. You can write the procedure code to specify whether the procedure receives one row or a block of rows.
You can increase performance when the procedure receives a block of rows:
• You can decrease the number of function calls the Integration Service and procedure make. The Integration Service calls the input row notification function fewer times, and the procedure calls the output notification function fewer times.
• You can increase the locality of memory access space for the data.
• You can write the procedure code to perform an algorithm on a block of data instead of each row of data.
Optimizing Custom Transformations 33
Optimizing Joiner TransformationsJoiner transformations can slow performance because they need additional space at run time to hold intermediary results. You can view Joiner performance counter information to determine whether you need to optimize the Joiner transformations.
Use the following tips to improve session performance with the Joiner transformation:
• Designate the master source as the source with fewer duplicate key values. When the Integration Service processes a sorted Joiner transformation, it caches rows for one hundred unique keys at a time. If the master source contains many rows with the same key value, the Integration Service must cache more rows, and performance can be slowed.
• Designate the master source as the source with fewer rows. During a session, the Joiner transformation compares each row of the detail source against the master source. The fewer rows in the master, the fewer iterations of the join comparison occur, which speeds the join process.
• Perform joins in a database when possible. Performing a join in a database is faster than performing a join in the session. The type of database join you use can affect performance. Normal joins are faster than outer joins and result in fewer rows. In some cases, you cannot perform the join in the database, such as joining tables from two different databases or flat file systems.
To perform a join in a database, use the following options:
- Create a pre-session stored procedure to join the tables in a database.
- Use the Source Qualifier transformation to perform the join.
• Join sorted data when possible. To improve session performance, configure the Joiner transformation to use sorted input. When you configure the Joiner transformation to use sorted data, the Integration Service improves performance by minimizing disk input and output. You see the greatest performance improvement when you work with large data sets. For an unsorted Joiner transformation, designate the source with fewer rows as the master source.
Optimizing Lookup TransformationsIf the lookup table is on the same database as the source table in your mapping and caching is not feasible, join the tables in the source database rather than using a Lookup transformation.
If you use a Lookup transformation, perform the following tasks to increase performance:
• Use the optimal database driver.
• Cache lookup tables.
• Optimize the lookup condition.
• Filter lookup rows.
• Index the lookup table.
• Optimize multiple lookups.
• Create a pipeline Lookup transformation and configure partitions in the pipeline that builds the lookup source.
Using Optimal Database DriversThe Integration Service can connect to a lookup table using a native database driver or an ODBC driver. Native database drivers provide better session performance than ODBC drivers.
34 Chapter 6: Optimizing Transformations
Caching Lookup TablesIf a mapping contains Lookup transformations, you might want to enable lookup caching. When you enable caching, the Integration Service caches the lookup table and queries the lookup cache during the session. When this option is not enabled, the Integration Service queries the lookup table on a row-by-row basis.
The result of the Lookup query and processing is the same, whether or not you cache the lookup table. However, using a lookup cache can increase session performance for smaller lookup tables. In general, you want to cache lookup tables that need less than 300 MB.
Complete the following tasks to further enhance performance for Lookup transformations:
• Use the appropriate cache type.
• Enable concurrent caches.
• Optimize Lookup condition matching.
• Reduce the number of cached rows.
• Override the ORDER BY statement.
• Use a machine with more memory.
Related Topics:• “Caches” on page 43
Types of CachesUse the following types of caches to increase performance:
• Shared cache. You can share the lookup cache between multiple transformations. You can share an unnamed cache between transformations in the same mapping. You can share a named cache between transformations in the same or different mappings.
• Persistent cache. To save and reuse the cache files, you can configure the transformation to use a persistent cache. Use this feature when you know the lookup table does not change between session runs. Using a persistent cache can improve performance because the Integration Service builds the memory cache from the cache files instead of from the database.
Enabling Concurrent CachesWhen the Integration Service processes sessions that contain Lookup transformations, the Integration Service builds a cache in memory when it processes the first row of data in a cached Lookup transformation. If there are multiple Lookup transformations in a mapping, the Integration Service creates the caches sequentially when the first row of data is processed by the Lookup transformation. This slows Lookup transformation processing.
You can enable concurrent caches to improve performance. When the number of additional concurrent pipelines is set to one or more, the Integration Service builds caches concurrently rather than sequentially. Performance improves greatly when the sessions contain a number of active transformations that may take time to complete, such as Aggregator, Joiner, or Sorter transformations. When you enable multiple concurrent pipelines, the Integration Service no longer waits for active sessions to complete before it builds the cache. Other Lookup transformations in the pipeline also build caches concurrently.
Optimizing Lookup Condition MatchingWhen the Lookup transformation matches lookup cache data with the lookup condition, it sorts and orders the data to determine the first matching value and the last matching value. You can configure the transformation to return any value that matches the lookup condition. When you configure the Lookup transformation to
Optimizing Lookup Transformations 35
return any matching value, the transformation returns the first value that matches the lookup condition. It does not index all ports as it does when you configure the transformation to return the first matching value or the last matching value. When you use any matching value, performance can improve because the transformation does not index on all ports, which can slow performance.
Reducing the Number of Cached RowsYou can reduce the number of rows included in the cache to increase performance. Use the Lookup SQL Override option to add a WHERE clause to the default SQL statement.
Overriding the ORDER BY StatementBy default, the Integration Service generates an ORDER BY statement for a cached lookup. The ORDER BY statement contains all lookup ports. To increase performance, suppress the default ORDER BY statement and enter an override ORDER BY with fewer columns.
The Integration Service always generates an ORDER BY statement, even if you enter one in the override. Place two dashes ‘--’ after the ORDER BY override to suppress the generated ORDER BY statement.
For example, a Lookup transformation uses the following lookup condition:
ITEM_ID = IN_ITEM_IDPRICE <= IN_PRICE
The Lookup transformation includes three lookup ports used in the mapping, ITEM_ID, ITEM_NAME, and PRICE. When you enter the ORDER BY statement, enter the columns in the same order as the ports in the lookup condition. You must also enclose all database reserved words in quotes.
Enter the following lookup query in the lookup SQL override:
SELECT ITEMS_DIM.ITEM_NAME, ITEMS_DIM.PRICE, ITEMS_DIM.ITEM_ID FROM ITEMS_DIM ORDER BY ITEMS_DIM.ITEM_ID, ITEMS_DIM.PRICE --
Using a Machine with More MemoryTo increase session performance, run the session on an Integration Service node with a large amount of memory. Increase the index and data cache sizes as high as you can without straining the machine. If the Integration Service node has enough memory, increase the cache so it can hold all data in memory without paging to disk.
Optimizing the Lookup ConditionIf you include more than one lookup condition, place the conditions in the following order to optimize lookup performance:
• Equal to (=)
• Less than (<), greater than (>), less than or equal to (<=), greater than or equal to (>=)
• Not equal to (!=)
Filtering Lookup RowsCreate a filter condition to reduce the number of lookup rows retrieved from the source when the lookup cache is built.
36 Chapter 6: Optimizing Transformations
Indexing the Lookup TableThe Integration Service needs to query, sort, and compare values in the lookup condition columns. The index needs to include every column used in a lookup condition.
You can improve performance for the following types of lookups:
• Cached lookups. To improve performance, index the columns in the lookup ORDER BY statement. The session log contains the ORDER BY statement.
• Uncached lookups. To improve performance, index the columns in the lookup condition. The Integration Service issues a SELECT statement for each row that passes into the Lookup transformation.
Optimizing Multiple LookupsIf a mapping contains multiple lookups, even with caching enabled and enough heap memory, the lookups can slow performance. Tune the Lookup transformations that query the largest amounts of data to improve overall performance.
To determine which Lookup transformations process the most data, examine the Lookup_rowsinlookupcache counters for each Lookup transformation. The Lookup transformations that have a large number in this counter might benefit from tuning their lookup expressions. If those expressions can be optimized, session performance improves.
Related Topics:• “Optimizing Expressions” on page 29
Creating a Pipeline Lookup TransformationA mapping that contains a pipeline Lookup transformation includes a partial pipeline that contains the lookup source and a source qualifier. The Integration Service processes the lookup source data in this pipeline. It passes the lookup source data to the pipeline that contains the Lookup transformation and it creates the cache.
The partial pipeline is a separate target load order group in session properties. You can configure multiple partitions in this pipeline to improve performance.
Optimizing Normalizer TransformationsA Normalizer transformation generates rows. To optimize performance, place the Normalizer transformation as close to the target as possible.
Optimizing Sequence Generator TransformationsTo optimize Sequence Generator transformations, create a reusable Sequence Generator and using it in multiple mappings simultaneously. Also, configure the Number of Cached Values property.
Optimizing Normalizer Transformations 37
The Number of Cached Values property determines the number of values the Integration Service caches at one time. Make sure that the Number of Cached Value is not too small. Consider configuring the Number of Cached Values to a value greater than 1,000.
If you do not have to cache values, set the Number of Cache Values to 0. Sequence Generator transformations that do not use cache are faster than those that require cache.
When you connect the CURRVAL port in a Sequence Generator transformation, the Integration Service processes one row in each block. You can optimize performance by connecting only the NEXTVAL port in a mapping.
Related Topics:• “Optimizing Sequence Generator Transformations” on page 52
Optimizing Sorter TransformationsComplete the following tasks to optimize a Sorter transformation:
• Allocate enough memory to sort the data.
• Specify a different work directory for each partition in the Sorter transformation.
• Run the PowerCenter Integration Service in ASCII mode.
Allocating MemoryFor optimal performance, configure the Sorter cache size with a value less than or equal to the amount of available physical RAM on the Integration Service node. Allocate at least 16 MB of physical memory to sort data using the Sorter transformation. The Sorter cache size is set to 16,777,216 bytes by default. If the Integration Service cannot allocate enough memory to sort data, it fails the session.
If the amount of incoming data is greater than the amount of Sorter cache size, the Integration Service temporarily stores data in the Sorter transformation work directory. The Integration Service requires disk space of at least twice the amount of incoming data when storing data in the work directory. If the amount of incoming data is significantly greater than the Sorter cache size, the Integration Service may require much more than twice the amount of disk space available to the work directory.
Note: The session log contains the input row count and the size of incoming data for the Sorter transformation.
For example, the following message appears when the Integration Service processes the Sorter transformation:
SORT_40422 End of output from Sorter Transformation [srt_1_Billion_FF]. Processed 999999999 rows (866325637228 input bytes; 868929593344 temp I/O bytes)
In the message, the number of input rows is 999999999 and the size of the input rows is 866325637228.
Work Directories for PartitionsThe Integration Service creates temporary files when it sorts data. It stores them in a work directory. You can specify any directory on the Integration Service node to use as a work directory. By default, the Integration Service uses the value specified for the $PMTempDir service process variable.
38 Chapter 6: Optimizing Transformations
When you partition a session with a Sorter transformation, you can specify a different work directory for each partition in the pipeline. To increase session performance, specify work directories on physically separate disks on the Integration Service nodes.
Unicode ModeTo optimize a Sorter transformation, run the PowerCenter Integration Service in ASCII mode. If the PowerCenter Integration Service runs in Unicode mode, the Sorter transformation spills additional data to the disk.
Optimizing Source Qualifier TransformationsUse the Select Distinct option for the Source Qualifier transformation if you want the Integration Service to select unique values from a source. Use Select Distinct option to filter unnecessary data earlier in the data flow. This can improve performance.
Optimizing SQL TransformationsWhen you create an SQL transformation, you configure the transformation to use external SQL queries or queries that you define in the transformation. When you configure an SQL transformation to run in script mode, the Integration Service processes an external SQL script for each input row. When the transformation runs in query mode, the Integration Service processes an SQL query that you define in the transformation.
Each time the Integration Service processes a new query in a session, it calls a function called SQLPrepare to create an SQL procedure and pass it to the database. When the query changes for each input row, it has a performance impact.
When the transformation runs in query mode, construct= a static query in the transformation to improve performance. A static query statement does not change, although the data in the query clause changes. To create a static query, use parameter binding instead of string substitution in the SQL Editor. When you use parameter binding you set parameters in the query clause to values in the transformation input ports.
When an SQL query contains commit and rollback query statements, the Integration Service must recreate the SQL procedure after each commit or rollback. To optimize performance, do not use transaction statements in an SQL transformation query.
When you create the SQL transformation, you configure how the transformation connects to the database. You can choose a static connection or you can pass connection information to the transformation at run time.
When you configure the transformation to use a static connection, you choose a connection from the Workflow Manager connections. The SQL transformation connects to the database once during the session. When you pass dynamic connection information, the SQL transformation connects to the database each time the transformation processes an input row.
Optimizing Source Qualifier Transformations 39
Optimizing XML TransformationsYou can remove unprojected groups in an XML Parser transformation and from an XML source definition. You do not need to allocate memory for these unprojected groups, but you do need to maintain primary key-foreign key constraints.
Eliminating Transformation ErrorsIn large numbers, transformation errors slow the performance of the Integration Service. With each transformation error, the Integration Service pauses to determine the cause of the error and to remove the row causing the error from the data flow. Next, the Integration Service typically writes the row into the session log file.
Transformation errors occur when the Integration Service encounters conversion errors, conflicting mapping logic, and any condition set up as an error, such as null input. Check the session log to see where the transformation errors occur. If the errors center around particular transformations, evaluate those transformation constraints.
If you do not set the error threshold, the Integration Service continues to process error rows, thereby increasing the session run time. To optimize performance, set the error threshold to stop the session after a set number of row errors.
If you need to run a session that generates a large number of transformation errors, it is possible to improve performance by setting a lower tracing level. However, this is not a recommended long-term solution to transformation errors.
Related Topics:• “Error Tracing” on page 46
40 Chapter 6: Optimizing Transformations
C H A P T E R 7
Optimizing SessionsThis chapter includes the following topics:
• Grid, 41
• Pushdown Optimization, 42
• Concurrent Sessions and Workflows, 42
• Buffer Memory, 42
• Caches, 43
• Target-Based Commit, 45
• Real-time Processing, 45
• Staging Areas, 46
• Log Files, 46
• Error Tracing, 46
• Post-Session Emails, 46
GridYou can use a grid to increase session and workflow performance. A grid is an alias assigned to a group of nodes that allows you to automate the distribution of workflows and sessions across nodes.
A Load Balancer distributes tasks to nodes without overloading any node.
When you use a grid, the Integration Service distributes workflow tasks and session threads across multiple nodes. A Load Balancer distributes tasks to nodes without overloading any node. Running workflows and sessions on the nodes of a grid provides the following performance gains:
• Balances the Integration Service workload.
• Processes concurrent sessions faster.
• Processes partitions faster.
The Integration Service requires CPU resources for parsing input data and formatting the output data. A grid can improve performance when you have a performance bottleneck in the extract and load steps of a session.
A grid can improve performance when memory or temporary storage is a performance bottleneck. When a PowerCenter mapping contains a transformation that has cache memory, deploying adequate memory and separate disk storage for each cache instance improves performance.
41

Running a session on a grid can improve throughput because the grid provides more resources to run the session. Performance improves when you run a few sessions on the grid at a time. Running a session on a grid is more efficient than running a workflow over a grid if the number of concurrent session partitions is less than the number of nodes.
When you run multiple sessions on a grid, session subtasks share node resources with subtasks of other concurrent sessions. Running a session on a grid requires coordination between processes running on different nodes. For some mappings, running a session on a grid requires additional overhead to move data from one node to another node. In addition to loading the memory and CPU resources on each node, running multiple sessions on a grid adds to network traffic.
When you run a workflow on a grid, the Integration Service loads memory and CPU resources on nodes without requiring coordination between the nodes.
Related Topics:• “Optimizing Grid Deployments” on page 47
Pushdown OptimizationTo increase session performance, push transformation logic to the source or target database. Based on the mapping and session configuration, the Integration Service executes SQL against the source or target database instead of processing the transformation logic within the Integration Service.
Concurrent Sessions and WorkflowsIf possible, run sessions and workflows concurrently to improve performance. For example, if you load data into an analytic schema, where you have dimension and fact tables, load the dimensions concurrently.
Buffer MemoryWhen the Integration Service initializes a session, it allocates blocks of memory to hold source and target data. The Integration Service allocates at least two blocks for each source and target partition. Sessions that use a large number of sources and targets might require additional memory blocks. If the Integration Service cannot allocate enough memory blocks to hold the data, it fails the session.
You can configure the amount of buffer memory, or you can configure the Integration Service to calculate buffer settings at run time.
To increase the number of available memory blocks, adjust the following session properties:
• DTM Buffer Size. Increase the DTM buffer size on the Properties tab in the session properties.
• Default Buffer Block Size. Decrease the buffer block size on the Config Object tab in the session properties.
Note: If data partitioning is enabled, the DTM buffer size is the total size of all memory buffer pools allocated to all partitions. For a session that contains n partitions, set the DTM Buffer Size to at least n times the value for the session with one partition.
42 Chapter 7: Optimizing Sessions
Increasing DTM Buffer SizeThe DTM Buffer Size setting specifies the amount of memory that the Integration Service uses as DTM buffer memory. When you increase the DTM buffer memory, the Integration Service creates more buffer blocks, which improves performance during momentary slowdowns.
Increasing DTM buffer memory allocation generally causes performance to improve initially and then level off. If you do not see a significant increase in performance, DTM buffer memory allocation is not a factor in session performance.
To increase the DTM buffer size, open the session properties and click the Properties tab. Edit the DTM Buffer Size property in the Performance settings. Increase the DTM Buffer Size property by multiples of the buffer block size.
Optimizing the Buffer Block SizeIf the machine has limited physical memory and the mapping in the session contains a large number of sources, targets, or partitions, you might need to decrease the buffer block size.
If you are manipulating unusually large rows of data, increase the buffer block size to improve performance. If you do not know the approximate size of the rows, determine the row size by completing the following steps.
To evaluate needed buffer block size:
1. In the Mapping Designer, open the mapping for the session.
2. Open the target instance.
3. Click the Ports tab.
4. Add the precision for all columns in the target.
5. If you have more than one target in the mapping, repeat steps 2 to 4 for each additional target to calculate the precision for each target.
6. Repeat steps 2 to 5 for each source definition in the mapping.
7. Choose the largest precision of all the source and target precisions for the total precision in the buffer block size calculation.
The total precision represents the total bytes needed to move the largest row of data. For example, if the total precision equals 33,000, then the Integration Service requires 33,000 bytes in the buffer block to move that row. If the buffer block size is only 64,000 bytes, the Integration Service cannot move more than one row at a time.
To set the buffer block size, open the session properties and click the Config Object tab. Edit the Default Buffer Block Size property in the Advanced settings.
As with DTM buffer memory allocation, increasing buffer block size should improve performance. If you do not see an increase, buffer block size is not a factor in session performance.
CachesThe Integration Service uses the index and data caches for XML targets and Aggregator, Rank, Lookup, and Joiner transformations. The Integration Service stores transformed data in the data cache before returning it to the pipeline. It stores group information in the index cache. Also, the Integration Service uses a cache to store data for Sorter transformations.
Caches 43
To configure the amount of cache memory, use the cache calculator or specify the cache size. You can also configure the Integration Service to calculate cache memory settings at run time.
If the allocated cache is not large enough to store the data, the Integration Service stores the data in a temporary disk file, a cache file, as it processes the session data. Performance slows each time the Integration Service pages to a temporary file. Examine the performance counters to determine how often the Integration Service pages to a file.
Perform the following tasks to optimize caches:
• Limit the number of connected input/output and output only ports.
• Select the optimal cache directory location.
• Increase the cache sizes.
• Use the 64-bit version of PowerCenter to run large cache sessions.
Limiting the Number of Connected PortsFor transformations that use data cache, limit the number of connected input/output and output only ports. Limiting the number of connected input/output or output ports reduces the amount of data the transformations store in the data cache.
Cache Directory LocationIf you run the Integration Service on a grid and only some Integration Service nodes have fast access to the shared cache file directory, configure each session with a large cache to run on the nodes with fast access to the directory. To configure a session to run on a node with fast access to the directory, complete the following steps:
1. Create a PowerCenter resource.
2. Make the resource available to the nodes with fast access to the directory.
3. Assign the resource to the session.
If all Integration Service processes in a grid have slow access to the cache files, set up a separate, local cache file directory for each Integration Service process. An Integration Service process may have faster access to the cache files if it runs on the same machine that contains the cache directory.
Note: You may encounter performance degradation when you cache large quantities of data on a mapped or mounted drive.
Increasing the Cache SizesYou configure the cache size to specify the amount of memory allocated to process a transformation. The amount of memory you configure depends on how much memory cache and disk cache you want to use. If you configure the cache size and it is not enough to process the transformation in memory, the Integration Service processes some of the transformation in memory and pages information to cache files to process the rest of the transformation. Each time the Integration Service pages to a cache file, performance slows.
You can examine the performance details of a session to determine when the Integration Service pages to a cache file. The Transformation_readfromdisk or Transformation_writetodisk counters for any Aggregator, Rank, or Joiner transformation indicate the number of times the Integration Service pages to disk to process the transformation.
If the session contains a transformation that uses a cache and you run the session on a machine with sufficient memory, increase the cache sizes to process the transformation in memory.
44 Chapter 7: Optimizing Sessions
Using the 64-bit Version of PowerCenterIf you process large volumes of data or perform memory-intensive transformations, you can use the 64-bit PowerCenter version to increase session performance. The 64-bit version provides a larger memory space that can significantly reduce or eliminate disk input/output.
This can improve session performance in the following areas:
• Caching. With a 64-bit platform, the Integration Service is not limited to the 2 GB cache limit of a 32-bit platform.
• Data throughput. With a larger available memory space, the reader, writer, and DTM threads can process larger blocks of data.
Target-Based CommitThe commit interval setting determines the point at which the Integration Service commits data to the targets. Each time the Integration Service commits, performance slows. Therefore, the smaller the commit interval, the more often the Integration Service writes to the target database, and the slower the overall performance.
If you increase the commit interval, the number of times the Integration Service commits decreases and performance improves.
When you increase the commit interval, consider the log file limits in the target database. If the commit interval is too high, the Integration Service may fill the database log file and cause the session to fail.
Therefore, weigh the benefit of increasing the commit interval against the additional time you would spend recovering a failed session.
Click the General Options settings in the session properties to review and adjust the commit interval.
Real-time Processing
Flush LatencyFlush latency determines how often the Integration Service flushes real-time data from the source. The lower you set the flush latency interval, the more frequently the Integration Service commits messages to the target. Each time the Integration Service commits messages to the target, the session consumes more resources and throughput drops.
Increase the flush latency to improve throughput. Throughput increases as you increase the flush latency up to a certain threshold, depending on the hardware and available resources.
Source-Based CommitSource-based commit interval determines how often the Integration Service commits real-time data to the target. To obtain the fastest latency, set the source-based commit to 1.
Target-Based Commit 45

Staging AreasWhen you use a staging area, the Integration Service performs multiple passes on the data. When possible, remove staging areas to improve performance. The Integration Service can read multiple sources with a single pass, which can alleviate the need for staging areas.
Related Topics:• “Configuring Single-Pass Reading” on page 27
Log FilesA workflow runs faster when you do not configure it to write session and workflow log files. Workflows and sessions always create binary logs. When you configure a session or workflow to write a log file, the Integration Service writes logging events twice. You can access the binary logs session and workflow logs in the Administrator tool.
Error TracingTo improve performance, reduce the number of log events generated by the Integration Service when it runs the session. If a session contains a large number of transformation errors, and you do not need to correct them, set the session tracing level to Terse. At this tracing level, the Integration Service does not write error messages or row-level information for reject data.
If you need to debug the mapping and you set the tracing level to Verbose, you may experience significant performance degradation when you run the session. Do not use Verbose tracing when you tune performance.
The session tracing level overrides any transformation-specific tracing levels within the mapping. This is not recommended as a long-term response to high levels of transformation errors.
Post-Session EmailsWhen you attach the session log to a post-session email, enable flat file logging. If you enable flat file logging, the Integration Service gets the session log file from disk. If you do not enable flat file logging, the Integration Service gets the log events from the Log Manager and generates the session log file to attach to the email. When the Integration Service retrieves the session log from the log service, workflow performance slows, especially when the session log file is large and the log service runs on a different node than the master DTM. For optimal performance, configure the session to write to log file when you configure post-session email to attach a session log.
46 Chapter 7: Optimizing Sessions

C H A P T E R 8
Optimizing Grid DeploymentsThis chapter includes the following topics:
• Optimizing Grid Deployments Overview, 47
• Storing Files, 47
• Using a Shared File System, 48
• Distributing Files Across File Systems, 50
• Optimizing Sequence Generator Transformations, 52
Optimizing Grid Deployments OverviewWhen you run PowerCenter on a grid, you can configure the grid, sessions, and workflows to use resources efficiently and maximize scalability.
To improve PowerCenter performance on a grid, complete the following tasks:
• Add nodes to the grid.
• Increase storage capacity and bandwidth.
• Use shared file systems.
• Use a high-throughput network when you complete the following tasks:
- Access sources and targets over the network.
- Transfer data between nodes of a grid when using the Session on Grid option.
Storing FilesWhen you configure PowerCenter to run on a grid, you specify the storage location for different types of session files, such as source files, log files, and cache files. To improve performance, store files in optimal locations. For example, store persistent cache files on a high-bandwidth shared file system. Different types of files have different storage requirements.
You can store files in the following types of locations:
• Shared file systems. Store files on a shared file system to enable all Integration Service processes to access the same files. You can store files on low-bandwidth and high-bandwidth shared file systems.
47
• Local. Store files on the local machine running the Integration Service process when the files do not have to be accessed by other Integration Service processes.
High Bandwidth Shared File System FilesBecause they can be accessed often during a session, place the following files on a high-bandwidth shared file system:
• Source files, including flat files for lookups.
• Target files, including merge files for partitioned sessions.
• Persistent cache files for lookup or incremental aggregation.
• Non-persistent cache files for only grid-enabled sessions on a grid.
This allows the Integration Service to build the cache only once. If these cache files are stored on a local file system, the Integration Service builds a cache for each partition group.
Low Bandwidth Shared File System FilesBecause they are accessed less frequently during a session, store the following files on a low-bandwidth shared file system:
• Parameter files or other configuration related files.
• Indirect source or target files.
• Log files.
Local Storage FilesTo avoid unnecessary file sharing when you use shared file systems, store the following files locally:
• Non-persistent cache files for sessions that are not enabled for a grid, including Sorter transformation temporary files.
• Individual target files for different partitions when performing a sequential merge for partitioned sessions.
• Other temporary files that are deleted at the end of a session run. In general, to establish this, configure $PmTempFileDir for a local file system.
Avoid storing these files on a shared file system, even when the bandwidth is high.
Using a Shared File SystemYou can use the following shared file systems for file sharing:
• Network file systems such as CIFS (SMB) on Windows or Network File System (NFS) on UNIX. Although network file systems are not designed for high-performance computing, they can work well for sequential file access.
• Clustered file systems. Clustered file systems provide a group of nodes with high-bandwidth file access, as well as a unified namespace for files and directories. Clustered file system performance is similar to a direct-attached local file system.
Note: If you have the High Availability option, use a clustered file system.
48 Chapter 8: Optimizing Grid Deployments
Proper configuration and tuning can be critical for small grid performance. You can also configure mappings and sessions to avoid the intrinsic limitations of shared file systems.
Configuring a Shared File SystemUse the following general guidelines to configure shared file systems:
• Make sure the network has enough bandwidth.
• Make sure the underlying storage has enough I/O bandwidth.
• Configure the shared file system daemons, particularly the client, to have enough threads to access files quickly. For example, IBM recommends that you estimate the number of files that require simultaneous access and provide at least two biod threads for each file.
When you run concurrent sessions on a grid that use flat file sources or targets, provide enough threads so each partition can access the source or target files that they need simultaneously.
• Configure mount points of the shared file system based on access requirements. When running sequential sessions on a grid that use flat file sources or targets, avoid any configuration that might degrade the effectiveness of the default read-ahead or write-behind process. File systems optimize sequential file access with read-ahead and write-behind.
• If necessary, tune the shared file system read-ahead and write-behind settings.
• Review the cache settings of the shared file systems for both the client and server. Increasing the default settings may improve performance.
• Configure the release-behind settings of the file system to free memory pages after data is accessed. Otherwise, system performance might degrade when reading or writing large files.
• Because of the difference in access patterns, you might use different mount points for sources and targets, and persistent caches.
For more information, see the shared file system documentation.
Balancing CPU and Memory UsageUnlike local file systems, a shared file system server can take extra CPU cycles to access files. If you use one of the computation nodes as the shared file system server for the rest of the nodes, it might become overloaded and become a bottleneck for the entire grid. When the shared file system server is overloaded, CPU cycles can increase, along with repeated transmissions and time-out requests.
To avoid this, use one or more machines as dedicated shared file system servers for your PowerCenter grid nodes. Each machine should have enough storage, CPUs, and network bandwidth for required tasks.
Alternatively, you can cross-mount the shared file system server to distribute the file server load across the nodes of the grid. When PowerCenter mappings and sessions are configured to use an even balance of I/O and CPU usage, cross-mounting shared file system servers can optimize performance. If the number of nodes in the grid is small and you have a balanced mix of I/O and CPU usage, you might not need a dedicated shared file system server.
When you use more than one shared file system server, dedicated or cross-mounted, try to distribute shared files across the servers.
Using a Shared File System 49
Related Topics:• “Distributing Files Across File Systems” on page 50
Configuring PowerCenter Mappings and SessionsOne of the most important ways to improve performance is to avoid unnecessary file sharing. When properly configured, shared file systems can provide good performance for the sequential access of source and target files. However, the random access required for persistent cache files, especially large persistent cache files, can be more problematic.
Use the following guidelines for configuring persistent cache files, such as persistent dynamic lookups, for a grid with a shared file system:
• When possible, configure the session cache size to keep smaller persistent cache files in memory.
• Add a Sorter transformation to the mapping to sort the input rows before the persistent lookup. Shifting the work from the persistent lookup to the Sorter transformation can improve performance because the Sorter transformation can use the local file system.
• Group rows that require access to the same page of the lookup cache to minimize the number of times the Integration Service reads each page of the cache.
• When the size of input data is large, use source-based commits to manage input data to allow sorting to be performed in memory.
For example, you have a 4 GB persistent dynamic lookup that cannot be reduced without changing the mapping logic and you have 10 GB of source data. First add a Sorter transformation to sort input data to reduce random access of the lookup cache, then complete the following tasks:
- Configure the session to perform source-based commits with 1 GB commit intervals.
- Set the Sorter transformation transaction scope to Transaction.
- Configure the Sorter transformation for a 1 GB cache size, enough for the source input.
With this configuration, the Integration Service sorts 1 GB of input data at a time and passes rows to the persistent lookup that require access to similar data in the cache.
• If more than one file system is available, configure the cache files for each partition to use different file systems.
• Configure the sessions to distribute the files to different file systems if more than one file system is available.
Distributing Files Across File SystemsDistribute files to different file systems to use the combined bandwidth of the file systems assuming each file system uses an independent physical disk sub-system. Distributing files to different file systems can increase performance on a grid that uses either a shared file system or symmetric multiprocessing (SMP).
For optimal I/O bandwidth choose a file system that distributes files across multiple storage devices. If you use a clustered file system, distribute the files between servers. If possible, place the source, target, and cache files on different storage devices.
Use the following guidelines when you distribute files on file systems:
• Source files. If you place source files on a file system that enables the Integration Service to read data from a large number of files, tune the file system read-ahead setting before caching large files.
50 Chapter 8: Optimizing Grid Deployments
• Temporary files. If you place temporary files on a file system that enables the Integration Service to read data from large files and write to temporary files, tune the file system read and write settings for large files.
• Target files. If you place target files on a file system that enables the Integration Service to write large files to the disk, tune the file system for simultaneous large block writes. Target files can include merge files for partitioned sessions. Since partitioned sessions on a grid need to write files to the disk, tune the file system for optimal locking performance.
Configuring Sessions to Distribute FilesYou can manually configure sessions to distribute the file load. You might need to edit sessions when the load changes significantly or when you add new sessions or file systems, including adding new nodes to a grid with a cross-mounted shared file system.
Instead of editing sessions manually, use session variables to distribute files to different directories. This allows you to redirect session files to different file servers when necessary.
Use the following guidelines to use session variables:
• Name variables for session file names and directories to reflect business logic.
• In the parameter file, define each variable so the file load is evenly distributed across all available file systems. You can also define node-specific variables.
• Optionally, automate reconfiguration with a script to process parameter files.
Note: When you use a script, use a placeholder in the parameter file so the script can redefine session variables as necessary.
Guidelines for Parameter Files and ScriptsWhen you create parameter files and scripts, use the following guidelines:
• To easily maintain flexibility and control of session file locations, use a script to replace placeholders in a parameter file.
• Consider the estimated file size and file system capacity when you define file locations.
• Avoid organizing files according to business logic if the sessions and workflows need to access business-related files at the same time. For example, if you store California files on one file system and New York files on another, a bottleneck might occur if the session needs to access both files at the same time.
• When possible, place files for different partitions of the same source, target, or lookup on different file systems.
ExamplesIn the following excerpt of a raw parameter file, the placeholder “{fs}” represents the file system where the directory is located and must be assigned by a script before being used:
[SessionFFSrc_FFTgt_CA] $InputFile_driverInfo_CA={fs}/driverinfo_ca.dat $SubDir_processed_CA={fs}# Session has Output file directory set to: # $PmTargetFileDir/$SubDir_processed_CA# This file is the input of SessionFFSrc_DBTgt_CA. $SubDir_RecordLkup_Cache_CA={fs}# This session builds this persistent lookup cache to be used # by SessionFFSrc_DBTgt_CA.# The Lookup cache directory name in the session is set to: # $PmCacheDir/$SubDir_RecordLkup_Cache_CA[SessionFFSrc_FFTgt_NY]
Distributing Files Across File Systems 51

$InputFile_driverInfo_NY={fs}/driverinfo_ny.dat $SubDir_processed_NY={fs}[SessionFFSrc_DBTgt_CA] $SubDir_processed_CA={fs}# session has Source file directory set to: # $PmTargetFileDir/$SubDir_processed_CA $SubDir_RecordLkup_Cache_CA={fs}# Use the persistent lookup cache built in SessionFFSrc_FFTgt_CA.
In the following parameter file excerpt, a script has replaced the placeholder with the appropriate file system names, such as file_system_1 and file_system_2:
[SessionFFSrc_FFTgt_CA] $InputFile_driverInfo_CA=file_system_1/driverinfo_ca.dat $SubDir_processed_CA=file_system_2# Session has Output file directory set to: # $PmTargetFileDir/$SubDir_processed_CA# This file is the input of SessionFFSrc_DBTgt_CA. $SubDir_RecordLkup_Cache_CA=file_system_1# This session builds this persistent lookup cache to be used # by SessionFFSrc_DBTgt_CA.# The Lookup cache directory name in the session is set to: # $PmCacheDir/$SubDir_RecordLkup_Cache_CA[SessionFFSrc_FFTgt_NY] $InputFile_driverInfo_NY=file_system_2/driverinfo_ny.dat $SubDir_processed_NY=file_system_1[SessionFFSrc_DBTgt_CA] $SubDir_processed_CA=file_system_1# session has Source file directory set to: # $PmTargetFileDir/$SubDir_processed_CA $SubDir_RecordLkup_Cache_CA=file_system_2# Use the persistent lookup cache built in SessionFFSrc_FFTgt_CA.
Optimizing Sequence Generator TransformationsTo increase performance when running a session on a grid with Sequence Generator transformations, increase the number of cached values to one number for each row of data. This reduces the communication between the master and worker DTM processes and the repository. The master and worker DTMs communicate once for each cached value.
For example, you have 150,000 rows of data and seven Sequence Generator transformations. The number of cached values is 10. The master and worker DTM communicate 15,000 times. If you increase the number of cached values to 15,000, the master and worker DTM communicate ten times.
52 Chapter 8: Optimizing Grid Deployments
C H A P T E R 9
Optimizing the PowerCenter Components
This chapter includes the following topics:
• Optimizing the PowerCenter Components Overview, 53
• Optimizing PowerCenter Repository Performance, 53
• Optimizing Integration Service Performance, 55
Optimizing the PowerCenter Components OverviewYou can optimize performance of the following PowerCenter components:
• PowerCenter repository
• Integration Service
If you run PowerCenter on multiple machines, run the Repository Service and Integration Service on different machines. To load large amounts of data, run the Integration Service on the higher processing machine. Also, run the Repository Service on the machine hosting the PowerCenter repository.
Optimizing PowerCenter Repository PerformanceComplete the following tasks to improve PowerCenter repository performance:
• Ensure the PowerCenter repository is on the same machine as the Repository Service process.
• Order conditions in object queries.
• Use a single-node tablespace for the PowerCenter repository if you install it on a DB2 database.
• Optimize the database schema for the PowerCenter repository if you install it on a DB2 or Microsoft SQL Server database.
Location of the Repository Service Process and RepositoryYou can optimize the performance of a Repository Service that you configured without the high availability option. To optimize performance, ensure that the Repository Service process runs on the same machine where the repository database resides.
53
Ordering Conditions in Object QueriesWhen the Repository Service processes a parameter with multiple conditions, it processes them in the order you enter them. To receive expected results and improve performance, enter parameters in the order you want them to run.
Using a Single-Node DB2 Database TablespaceYou can optimize repository performance on IBM DB2 EEE databases when you store a PowerCenter repository in a single-node tablespace. When setting up an IBM DB2 EEE database, the database administrator can define the database on a single node.
When the tablespace contains one node, the PowerCenter Client and Integration Service access the repository faster than if the repository tables exist on different database nodes.
If you do not specify the tablespace name when you create, copy, or restore a repository, the DB2 system specifies the default tablespace for each repository table. The DB2 system may or may not specify a single-node tablespace.
Optimizing the Database SchemaYou can improve repository performance on IBM DB2 and Microsoft SQL Server databases when you enable the Optimize Database Schema option for the Repository Service in the Administration Console. The Optimize Database Schema option causes the Repository Service to store varying length character data in Varchar(2000) columns instead of CLOB columns wherever possible. Using Varchar(2000) columns improves repository performance in the following ways:
• Reduced disk access. The PowerCenter repository stores Varchar data directly in columns within a database table. It stores CLOB data as references to another table. To retrieve CLOB data from the repository, the Repository Service must access one database table to get the reference, and then access the referenced table to read the data. To retrieve Varchar data, the Repository Service accesses one database table.
• Improved caching. The repository database buffer manager can cache Varchar columns, but not CLOB columns.
Optimizing the database schema can improve repository performance for the following operations:
• Backing up a repository
• Restoring a repository
• Exporting repository objects
• Listing dependencies among objects
• Deploying folders
In general, performance improves proportionally as repository database and page sizes increase. Therefore, optimizing the database schema provides greater performance improvements in larger PowerCenter repositories.
You can optimize the database schema when you create repository contents or back up and restore an existing repository. To optimize database schema, the repository database must meet the following page size requirements:
• IBM DB2. Database page size 4 KB or greater. At least one temporary tablespace with page size 16 KB or greater.
• Microsoft SQL Server. Database page size 8 KB or greater.
54 Chapter 9: Optimizing the PowerCenter Components

Object Caching for the Repository ServiceRepository object caching increases performance when you run workflows. When the Repository Service caches objects in memory, the Integration Service can more easily access the cached objects it needs to complete the workflow run.
To manage object caching for the Repository Service, configure the following properties:
Property Description
Repository Agent Caching Optional. Enables the repository agent caching, which improves the performance when the Integration Service runs multiple sessions repeatedly. If you enable this property, the Repository Service process caches metadata requested by the Integration Service and the metadata that describes repository objects. Default is Yes.
Agent Cache Capacity Optional. Number of objects that the cache can contain when repository agent caching is enabled. You can increase the number of objects if there is available memory on the machine where the Repository Service process runs. Default is 10,000.
Allow Writes With Agent Caching
Optional. Allows you to use PowerCenter Client tools to change metadata in the repository when repository agent caching is enabled. When you enable writes, the Repository Service flushes the cache each time you save metadata through the PowerCenter Client. If you disable writes, you cannot save metadata to the repository through the PowerCenter Client, and the cache is not flushed. When you disable writes, the Integration Service can still write session and workflow metadata to the repository. The Repository Service does not flush the cache when the Integration Service writes metadata. Default is Yes.
Optimizing ResilienceConfigure the following resilience-related properties of the application services to improve repository performance:
Property Description
Limit on Resilience Timeouts Optional. Maximum amount of time that the service holds on to resources for resilience purposes. This property places a restriction on clients that connect to the service. Any resilience timeouts that exceed the limit are cut off at the limit. If the value of this property is blank, the value is derived from the domain-level settings. Default is blank.
Resilience Timeout Optional. Period of time that the service tries to establish or reestablish a connection to another service. If the value of this property is blank, the value is derived from the domain-level settings. Default is blank.
Optimizing Integration Service PerformanceComplete the following tasks to improve Integration Service performance:
• Use native drivers instead of ODBC drivers for the Integration Service.
• Run the Integration Service in ASCII data movement mode if character data is 7-bit ASCII or EBCDIC.
• Cache PowerCenter metadata for the Repository Service.
• Run Integration Service with high availability.
Optimizing Integration Service Performance 55

Note: When you configure the Integration Service with high availability, the Integration Service recovers workflows and sessions that may fail because of temporary network or machine failures. To recover from a workflow or session, the Integration Service writes the states of each workflow and session to temporary files in a shared directory. This may decrease performance.
Using Native and ODBC DriversThe Integration Service can use ODBC or native drivers to connect to databases. Use native drivers to improve performance.
Running the Integration Service in ASCII Data Movement ModeWhen all character data processed by the Integration Service is 7-bit ASCII or EBCDIC, configure the Integration Service to run in the ASCII data movement mode. In ASCII mode, the Integration Service uses one byte to store each character. When you run the Integration Service in Unicode mode, it uses two bytes for each character, which can slow session performance.
Caching PowerCenter Metadata for the Repository ServiceYou can use repository agent caching to improve DTM process performance. When you enable repository agent caching, the Repository Service caches metadata requested by the Integration Service. When you cache metadata, the Integration Service reads the cache for subsequent runs of the task rather than fetching the metadata from the repository. Only metadata requested by the Integration Service is cached.
For example, you run a workflow with 1,000 sessions. The first time you run a workflow with caching enabled, the Integration Service fetches the session metadata from the repository. During subsequent runs of the workflow, the Repository Service fetches the session metadata from the cache. This increases DTM process performance.
56 Chapter 9: Optimizing the PowerCenter Components
C H A P T E R 1 0
Optimizing the SystemThis chapter includes the following topics:
• Optimizing the System Overview, 57
• Improving Network Speed, 58
• Using Multiple CPUs, 58
• Reducing Paging, 58
• Using Processor Binding, 58
Optimizing the System OverviewOften performance slows because the session relies on inefficient connections or an overloaded Integration Service process system. System delays can also be caused by routers, switches, network protocols, and usage by many users.
Slow disk access on source and target databases, source and target file systems, and nodes in the domain can slow session performance. Have the system administrator evaluate the hard disks on the machines.
After you determine from the system monitoring tools that you have a system bottleneck, make the following global changes to improve the performance of all sessions:
• Improve network speed. Slow network connections can slow session performance. Have the system administrator determine if the network runs at an optimal speed. Decrease the number of network hops between the Integration Service process and databases.
• Use multiple CPUs. You can use multiple CPUs to run multiple sessions in parallel and run multiple pipeline partitions in parallel.
• Reduce paging. When an operating system runs out of physical memory, it starts paging to disk to free physical memory. Configure the physical memory for the Integration Service process machine to minimize paging to disk.
• Use processor binding. In a multi-processor UNIX environment, the Integration Service may use a large amount of system resources. Use processor binding to control processor usage by the Integration Service process. Also, if the source and target database are on the same machine, use processor binding to limit the resources used by the database.
57
Improving Network SpeedThe performance of the Integration Service is related to network connections. A local disk can move data 5 to 20 times faster than a network. Consider the following options to minimize network activity and to improve Integration Service performance.
If you use flat file as a source or target in a session and the Integration Service runs on a single node, store the files on the same machine as the Integration Service to improve performance. When you store flat files on a machine other than the Integration Service, session performance becomes dependent on the performance of the network connections. Moving the files onto the Integration Service process system and adding disk space might improve performance.
If you use relational source or target databases, try to minimize the number of network hops between the source and target databases and the Integration Service process. Moving the target database onto a server system might improve Integration Service performance.
When you run sessions that contain multiple partitions, have the network administrator analyze the network and make sure it has enough bandwidth to handle the data moving across the network from all partitions.
Using Multiple CPUsConfigure the system to use more CPUs to improve performance. Multiple CPUs allow the system to run multiple sessions in parallel as well as multiple pipeline partitions in parallel.
However, additional CPUs might cause disk bottlenecks. To prevent disk bottlenecks, minimize the number of processes accessing the disk. Processes that access the disk include database functions and operating system functions. Parallel sessions or pipeline partitions also require disk access.
Reducing PagingPaging occurs when the Integration Service process operating system runs out of memory for a particular operation and uses the local disk for memory. You can free up more memory or increase physical memory to reduce paging and the slow performance that results from paging. Monitor paging activity using system tools.
You might want to increase system memory in the following circumstances:
• You run a session that uses large cached lookups.
• You run a session with many partitions.
If you cannot free up memory, you might want to add memory to the system.
Using Processor BindingIn a multi-processor UNIX environment, the Integration Service may use a large amount of system resources if you run a large number of sessions. As a result, other applications on the machine may not have enough system resources available. You can use processor binding to control processor usage by the Integration
58 Chapter 10: Optimizing the System

Service process node. Also, if the source and target database are on the same machine, use processor binding to limit the resources used by the database.
In a Sun Solaris environment, the system administrator can create and manage a processor set using the psrset command. The system administrator can then use the pbind command to bind the Integration Service to a processor set so the processor set only runs the Integration Service. The Sun Solaris environment also provides the psrinfo command to display details about each configured processor and the psradm command to change the operational status of processors. For more information, see the system administrator and Sun Solaris documentation.
In an AIX environment, system administrators can use the Workload Manager in AIX 5L to manage system resources during peak demands. The Workload Manager can allocate resources and manage CPU, memory, and disk I/O bandwidth. For more information, see the system administrator and AIX documentation.
Using Processor Binding 59
C H A P T E R 1 1
Using Pipeline PartitionsThis chapter includes the following topics:
• Using Pipeline Partitions Overview, 60
• Optimizing the Source Database for Partitioning, 62
• Optimizing the Target Database for Partitioning, 63
Using Pipeline Partitions OverviewAfter you tune the application, databases, and system for maximum single-partition performance, you may find that the system is under-utilized. At this point, you can configure the session to have two or more partitions.
You can use pipeline partitioning to improve session performance. Increasing the number of partitions or partition points increases the number of threads. Therefore, increasing the number of partitions or partition points also increases the load on the nodes in the Integration Service. If the Integration Service node or nodes contain ample CPU bandwidth, processing rows of data in a session concurrently can increase session performance.
Note: If you use a single-node Integration Service and you create a large number of partitions or partition points in a session that processes large amounts of data, you can overload the system.
If you have the partitioning option, perform the following tasks to manually set up partitions:
• Increase the number of partitions.
• Select the best performing partition types at particular points in a pipeline.
• Use multiple CPUs.
Increasing the Number of PartitionsYou can increase the number of partitions in a pipeline to improve session performance. Increasing the number of partitions allows the Integration Service to create multiple connections to sources and process partitions of source data concurrently.
When a session uses a file source, you can configure it to read the source with one thread or multiple threads. Configure the session to read file sources with multiple threads to increase session performance. The Integration Service creates multiple concurrent connections to the file source.
When you create a session, the Workflow Manager validates each pipeline in the mapping for partitioning. You can specify multiple partitions in a pipeline if the Integration Service can maintain data consistency when it processes the partitioned data.
60
Use the following tips when you add partitions to a session:
• Add one partition at a time. To best monitor performance, add one partition at a time, and note the session settings before you add each partition.
• Set DTM Buffer Memory. When you increase the number of partitions, increase the DTM buffer size. If the session contains n partitions, increase the DTM buffer size to at least n times the value for the session with one partition.
• Set cached values for Sequence Generator. If a session has n partitions, you should not need to use the “Number of Cached Values” property for the Sequence Generator transformation. If you set this value to a value greater than 0, make sure it is at least n times the original value for the session with one partition.
• Partition the source data evenly. Configure each partition to extract the same number of rows.
• Monitor the system while running the session. If CPU cycles are available, you can add a partition to improve performance. For example, you may have CPU cycles available if the system has 20 percent idle time.
• Monitor the system after adding a partition. If the CPU utilization does not go up, the wait for I/O time goes up, or the total data transformation rate goes down, then there is probably a hardware or software bottleneck. If the wait for I/O time goes up by a significant amount, then check the system for hardware bottlenecks. Otherwise, check the database configuration.
Related Topics:• “Buffer Memory” on page 42
Selecting the Best Performing Partition TypesYou can specify different partition types at different points in the pipeline to increase session performance. To optimize session performance, use the database partitioning partition type for source and target databases. You can use database partitioning for Oracle and IBM DB2 sources and IBM DB2 targets. When you use source database partitioning, the Integration Service queries the database system for table partition information and fetches data into the session partitions. When you use target database partitioning, the Integration Service loads data into corresponding database partition nodes.
You can use multiple pipeline partitions and database partitions. To improve performance, ensure the number of pipeline partitions equals the number of database partitions. To improve performance for subpartitioned Oracle sources, ensure the number of pipeline partitions equals the number of database subpartitions.
To increase performance, specify partition types at the following partition points in the pipeline:
• Source Qualifier transformation. To read data from multiple flat files concurrently, specify one partition for each flat file in the Source Qualifier transformation. Accept the default partition type, pass-through.
• Filter transformation. Since the source files vary in size, each partition processes a different amount of data. Set a partition point at the Filter transformation, and choose round-robin partitioning to balance the load going into the Filter transformation.
• Sorter transformation. To eliminate overlapping groups in the Sorter and Aggregator transformations, use hash auto-keys partitioning at the Sorter transformation. This causes the Integration Service to group all items with the same description into the same partition before the Sorter and Aggregator transformations process the rows. You can delete the default partition point at the Aggregator transformation.
• Target. Since the target tables are partitioned by key range, specify key range partitioning at the target to optimize writing data to the target.
Using Pipeline Partitions Overview 61
Using Multiple CPUsThe Integration Service performs read, transformation, and write processing for a pipeline in parallel. It can process multiple partitions of a pipeline within a session, and it can process multiple sessions in parallel.
If you have a symmetric multi-processing (SMP) platform, you can use multiple CPUs to concurrently process session data or partitions of data. This provides increased performance, as true parallelism is achieved. On a single processor platform, these tasks share the CPU, so there is no parallelism.
The Integration Service can use multiple CPUs to process a session that contains multiple partitions. The number of CPUs used depends on factors such as the number of partitions, the number of threads, the number of available CPUs, and amount or resources required to process the mapping.
Optimizing the Source Database for PartitioningYou can add partitions to increase the speed of the query. Usually, each partition on the reader side represents a subset of the data to be processed.
Complete the following tasks to optimize the source database for partitioning,
• Tune the database. If the database is not tuned properly, creating partitions may not make sessions quicker.
• Enable parallel queries. Some databases may have options that must be set to enable parallel queries. Check the database documentation for these options. If these options are off, the Integration Service runs multiple partition SELECT statements serially.
• Separate data into different tables spaces. Each database provides an option to separate the data into different tablespaces. If the database allows it, use the PowerCenter SQL override feature to provide a query that extracts data from a single partition.
• Group the sorted data. You can partition and group source data to increase performance for a sorted Joiner transformation.
• Maximize single-sorted queries.
Tuning the DatabaseIf the database is not tuned properly, the results may not make the session any quicker. You can test the database to ensure it is tuned properly.
To verify that the database is tuned properly:
1. Create a pipeline with one partition.
2. Measure the reader throughput in the Workflow Monitor.
3. Add the partitions.
4. Verify that the throughput scales linearly.
For example, if the session has two partitions, the reader throughput should be twice as fast. If the throughput does not scale linearly, you probably need to tune the database.
62 Chapter 11: Using Pipeline Partitions
Grouping Sorted DataYou can also partition and group the source data to increase performance for the sorted Joiner transformation. Place the partition point before the Sorter transformation to maintain grouping and sort the data within each group.
To group data, ensure that rows with the same key value are routed to the same partition. The best way to ensure that data is grouped and distributed evenly among partitions is to add a hash auto-keys or key-range partition point before the sort origin.
Optimizing Single-Sorted QueriesTo optimize a single-sorted query on the database, consider the following tuning options that enable parallelization:
• Check for configuration parameters that perform automatic tuning. For example, Oracle has a parameter called parallel_automatic_tuning.
• Make sure intra-parallelism is enabled. Intra-parallelism is the ability to run multiple threads on a single query. For example, on Oracle, look at parallel_adaptive_multi_user. On DB2, look at intra_parallel.
• Verify the maximum number of parallel processes that are available for parallel executions. For example, on Oracle, look at parallel_max_servers. On DB2, look at max_agents.
• Verify the sizes for various resources used in parallelization. For example, Oracle has parameters such as large_pool_size, shared_pool_size, hash_area_size, parallel_execution_message_size, and optimizer_percent_parallel. DB2 has configuration parameters such as dft_fetch_size, fcm_num_buffers, and sort_heap.
• Verify the degrees of parallelism. You may be able to set this option using a database configuration parameter or an option on the table or query. For example, Oracle has parameters parallel_threads_per_cpu and optimizer_percent_parallel. DB2 has configuration parameters such as dft_prefetch_size, dft_degree, and max_query_degree.
• Turn off options that may affect database scalability. For example, disable archive logging and timed statistics on Oracle.
For a comprehensive list of database tuning options, see the database documentation.
Optimizing the Target Database for PartitioningIf a session contains multiple partitions, the throughput for each partition should be the same as the throughput for a single partition session. If you do not see this correlation, then the database is probably inserting rows into the database serially.
To ensure that the database inserts rows in parallel, check the following configuration options in the target database:
• Set options in the database to enable parallel inserts. For example, set the db_writer_processes and DB2 has max_agents options in an Oracle database to enable parallel inserts. Some databases may enable these options by default.
• Consider partitioning the target table. If possible, try to have each partition write to a single database partition using a Router transformation to do this. Also, have the database partitions on separate disks to prevent I/O contention among the pipeline partitions.
• Set options in the database to enhance database scalability. For example, disable archive logging and timed statistics in an Oracle database to enhance scalability.
Optimizing the Target Database for Partitioning 63
A P P E N D I X A
Performance CountersThis appendix includes the following topics:
• Performance Counters Overview, 64
• Errorrows Counter, 64
• Readfromcache and Writetocache Counters, 65
• Readfromdisk and Writetodisk Counters, 65
• Rowsinlookupcache Counter, 66
Performance Counters OverviewAll transformations have counters. The Integration Service tracks the number of input rows, output rows, and error rows for each transformation. Some transformations have performance counters. You can use the following performance counters to increase session performance:
• Errorrows
• Readfromcache and Writetocache
• Readfromdisk and Writetodisk
• Rowsinlookupcache
Errorrows CounterTransformation errors impact session performance. If a transformation has large numbers of error rows in any of the Transformation_errorrows counters, you can eliminate the errors to improve performance.
64
Related Topics:• “Eliminating Transformation Errors” on page 40
Readfromcache and Writetocache CountersIf a session contains Aggregator, Rank, or Joiner transformations, examine the Transformation_readfromcache and Transformation_writetocache counters along with the Transformation_readfromdisk and Transformation_writetodisk counters to analyze how the Integration Service reads from or writes to disk. To view the session performance details while the session runs, right-click the session in the Workflow Monitor and choose Properties. Click the Properties tab in the details dialog box.
To analyze the disk access, first calculate the hit or miss ratio. The hit ratio indicates the number of read or write operations the Integration Service performs on the cache.
The miss ratio indicates the number of read or write operations the Integration Service performs on the disk.
Use the following formula to calculate the cache miss ratio:
[(# of reads from disk) + (# of writes to disk)]/[(# of reads from memory cache) + (# of writes to memory cache)]
Use the following formula to calculate the cache hit ratio:
[1 - Cache Miss ratio]To minimize reads and writes to disk, increase the cache size. The optimal cache hit ratio is 1.
Readfromdisk and Writetodisk CountersIf a session contains Aggregator, Rank, or Joiner transformations, examine each Transformation_readfromdisk and Transformation_writetodisk counter. To view the session performance details while the session runs, right-click the session in the Workflow Monitor and choose Properties. Click the Properties tab in the details dialog box.
If these counters display any number other than zero, you can increase the cache sizes to improve session performance. The Integration Service uses the index cache to store group information and the data cache to store transformed data, which is typically larger. Therefore, although both the index cache and data cache sizes affect performance, you may need to increase the data cache size more than the index cache size. However, if the volume of data processed is greater than the memory available you can increase the index cache size to improve performance.
For example, the Integration Service uses 100 MB to store the index cache and 500 MB to store the data cache. With 200 randomly distributed accesses on each of the index and data caches, you can configure the cache in the following ways:
• To optimize performance, allocate 100 MB to the index cache and 200 MB to the data cache. The Integration Service accesses 100 percent of the data from the index cache and 40 percent of the data from the data cache. The Integration Service always accesses the index cache, and does not access the data cache 120 times. Therefore, the percentage of data that gets accessed is 70 percent.
Readfromcache and Writetocache Counters 65

• Allocate 50 MB to the index cache and 250 MB to the data cache. The Integration Service accesses 50 percent of the data from the index cache and 50 percent of the data from the data cache. The Integration Service does not access both index and data caches a 100 times each. Therefore, the percentage of data that gets accessed is 50 percent.
If the session performs incremental aggregation, the Integration Service reads historical aggregate data from the local disk during the session and writes to disk when saving historical data. As a result, the Aggregator_readtodisk and Aggregator_writetodisk counters display numbers besides zero.
However, since the Integration Service writes the historical data to a file at the end of the session, you can still evaluate the counters during the session. If the counters show numbers other than zero during the session run, you can tune the cache sizes to increase performance. However, there is a cost associated with allocating or deallocating memory, so refrain from increasing the cache sizes to accommodate more data volume if you know what volume of data the Integration Service will process.
Rowsinlookupcache CounterMultiple lookups can decrease session performance. To improve session performance, tune the lookup expressions for the larger lookup tables.
Related Topics:• “Optimizing Multiple Lookups” on page 37
66 Appendix A: Performance Counters
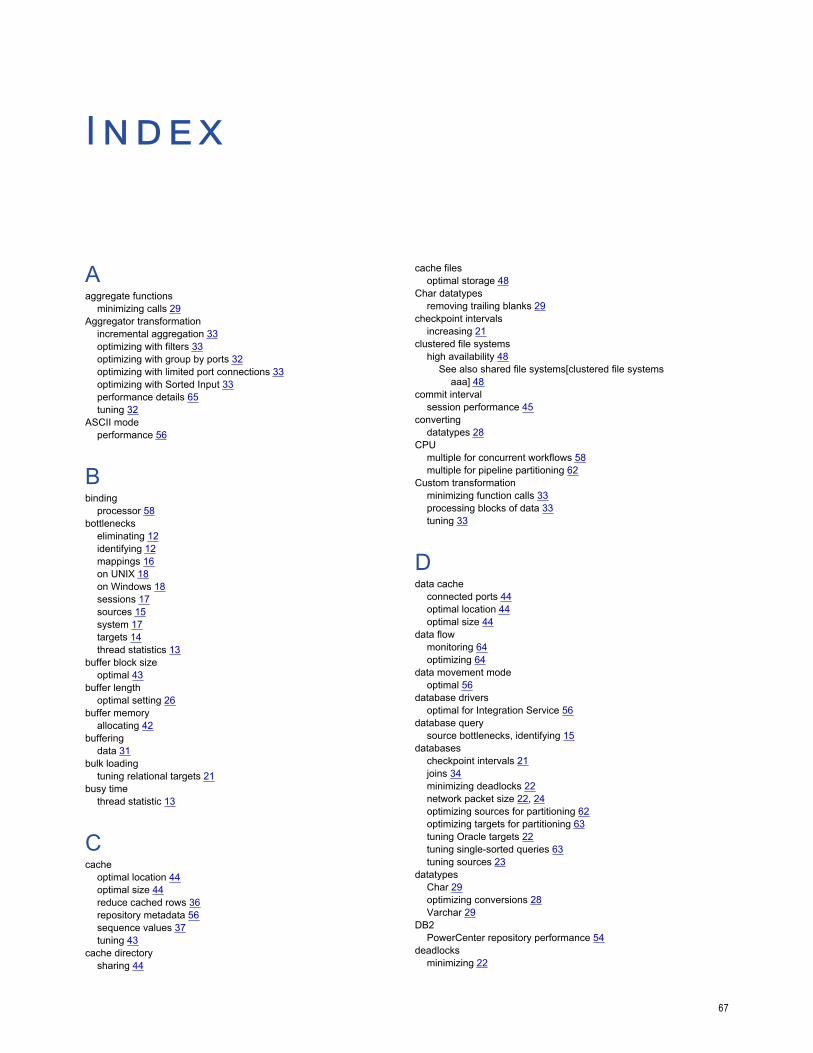
Index
Aaggregate functions
minimizing calls 29Aggregator transformation
incremental aggregation 33optimizing with filters 33optimizing with group by ports 32optimizing with limited port connections 33optimizing with Sorted Input 33performance details 65tuning 32
ASCII mode performance 56
Bbinding
processor 58bottlenecks
eliminating 12identifying 12mappings 16on UNIX 18on Windows 18sessions 17sources 15system 17targets 14thread statistics 13
buffer block size optimal 43
buffer length optimal setting 26
buffer memory allocating 42
buffering data 31
bulk loading tuning relational targets 21
busy time thread statistic 13
Ccache
optimal location 44optimal size 44reduce cached rows 36repository metadata 56sequence values 37tuning 43
cache directory sharing 44
cache files optimal storage 48
Char datatypes removing trailing blanks 29
checkpoint intervals increasing 21
clustered file systems high availability 48
See also shared file systems[clustered file systems aaa] 48
commit interval session performance 45
converting datatypes 28
CPU multiple for concurrent workflows 58multiple for pipeline partitioning 62
Custom transformation minimizing function calls 33processing blocks of data 33tuning 33
Ddata cache
connected ports 44optimal location 44optimal size 44
data flow monitoring 64optimizing 64
data movement mode optimal 56
database drivers optimal for Integration Service 56
database query source bottlenecks, identifying 15
databases checkpoint intervals 21joins 34minimizing deadlocks 22network packet size 22, 24optimizing sources for partitioning 62optimizing targets for partitioning 63tuning Oracle targets 22tuning single-sorted queries 63tuning sources 23
datatypes Char 29optimizing conversions 28Varchar 29
DB2 PowerCenter repository performance 54
deadlocks minimizing 22
67

DECODE function compared to Lookup function 30using for optimization 30
delimited flat files sources 27
directories shared caches 44
disk access, minimizing 58
dropping indexes and key constraints 20
DTM buffer optimal pool size 43
Eerror tracing
See tracing levels[error tracing aaa] 46
errors minimizing tracing level 46
evaluating expressions 31
expressions evaluating 31replacing with local variables 29tuning 29
external loader performance 21
External Procedure transformation blocking data 31
Ffactoring
common logic from mapping 29FastExport
for Teradata sources 24file sharing
cluster file systems 48network file systems 48
file storage local 47shared file system 47types 47
file systems cluster 48network 48shared, configuring 49
Filter transformation source bottlenecks, identifying 15
filtering data 28source data 39
filters sources 24
flat file logging post-session emails 46
flat files buffer length 26compared to XML files 27delimited source files 27optimal storage location 58optimizing sources 26
flush latency performance, increasing 45
function calls minimizing for Custom transformation 33
functions compared to operators 30DECODE versus LOOKUP 30
Ggrid
node bottleneck 49optimal storage locations 47performance 41, 47Sequence Generator performance, increasing 52
group by ports optimizing Aggregator transformation 32
Hhigh availability
clustered file systems 48
IIBM DB2
repository database schema, optimizing 54idle time
thread statistic 13IIF expressions
tuning 30incremental aggregation
optimizing Aggregator transformation 33index cache
optimal location 44optimal size 44
indexes dropping 20for Lookup table 37
Integration Service commit interval 45grid 41optimal database drivers 56tuning 55
IPC protocol Oracle sources 24
JJoiner transformation
designating master source 34performance details 65sorted data 34tuning 34
joins in database 34
Kkey constraints
dropping 20
68 Index
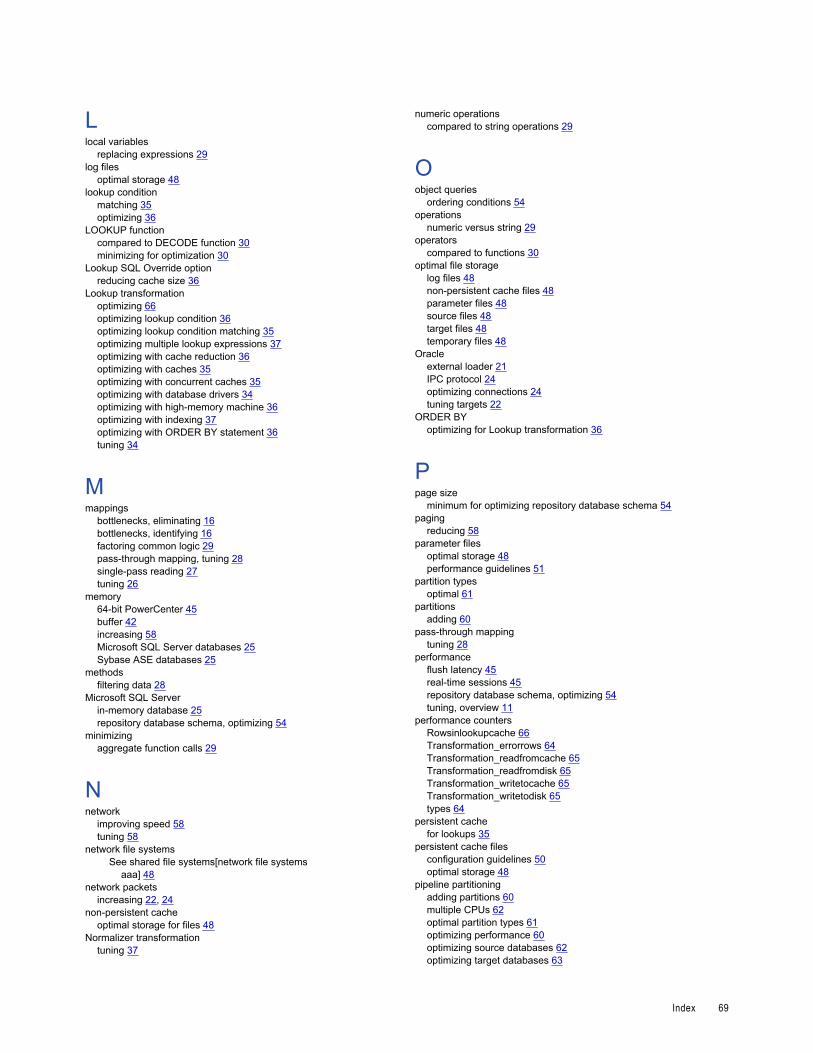
Llocal variables
replacing expressions 29log files
optimal storage 48lookup condition
matching 35optimizing 36
LOOKUP function compared to DECODE function 30minimizing for optimization 30
Lookup SQL Override option reducing cache size 36
Lookup transformation optimizing 66optimizing lookup condition 36optimizing lookup condition matching 35optimizing multiple lookup expressions 37optimizing with cache reduction 36optimizing with caches 35optimizing with concurrent caches 35optimizing with database drivers 34optimizing with high-memory machine 36optimizing with indexing 37optimizing with ORDER BY statement 36tuning 34
Mmappings
bottlenecks, eliminating 16bottlenecks, identifying 16factoring common logic 29pass-through mapping, tuning 28single-pass reading 27tuning 26
memory 64-bit PowerCenter 45buffer 42increasing 58Microsoft SQL Server databases 25Sybase ASE databases 25
methods filtering data 28
Microsoft SQL Server in-memory database 25repository database schema, optimizing 54
minimizing aggregate function calls 29
Nnetwork
improving speed 58tuning 58
network file systems See shared file systems[network file systems
aaa] 48network packets
increasing 22, 24non-persistent cache
optimal storage for files 48Normalizer transformation
tuning 37
numeric operations compared to string operations 29
Oobject queries
ordering conditions 54operations
numeric versus string 29operators
compared to functions 30optimal file storage
log files 48non-persistent cache files 48parameter files 48source files 48target files 48temporary files 48
Oracle external loader 21IPC protocol 24optimizing connections 24tuning targets 22
ORDER BY optimizing for Lookup transformation 36
Ppage size
minimum for optimizing repository database schema 54paging
reducing 58parameter files
optimal storage 48performance guidelines 51
partition types optimal 61
partitions adding 60
pass-through mapping tuning 28
performance flush latency 45real-time sessions 45repository database schema, optimizing 54tuning, overview 11
performance counters Rowsinlookupcache 66Transformation_errorrows 64Transformation_readfromcache 65Transformation_readfromdisk 65Transformation_writetocache 65Transformation_writetodisk 65types 64
persistent cache for lookups 35
persistent cache files configuration guidelines 50optimal storage 48
pipeline partitioning adding partitions 60multiple CPUs 62optimal partition types 61optimizing performance 60optimizing source databases 62optimizing target databases 63
Index 69
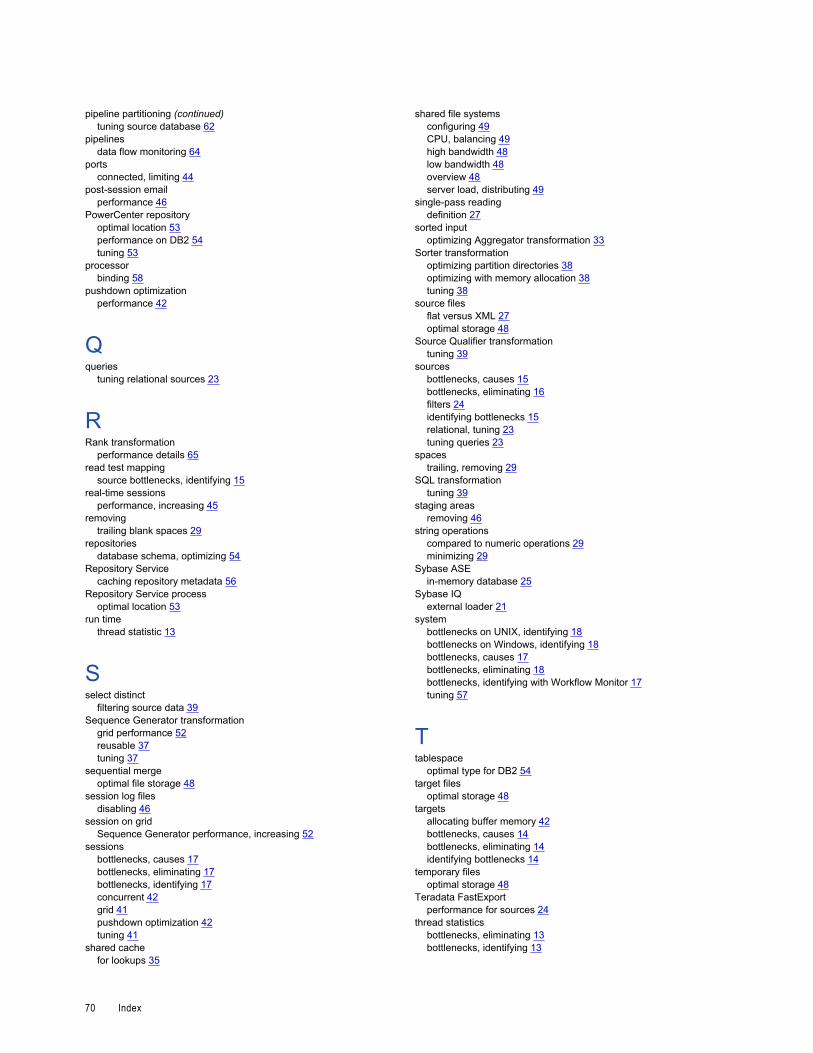
pipeline partitioning (continued)tuning source database 62
pipelines data flow monitoring 64
ports connected, limiting 44
post-session email performance 46
PowerCenter repository optimal location 53performance on DB2 54tuning 53
processor binding 58
pushdown optimization performance 42
Qqueries
tuning relational sources 23
RRank transformation
performance details 65read test mapping
source bottlenecks, identifying 15real-time sessions
performance, increasing 45removing
trailing blank spaces 29repositories
database schema, optimizing 54Repository Service
caching repository metadata 56Repository Service process
optimal location 53run time
thread statistic 13
Sselect distinct
filtering source data 39Sequence Generator transformation
grid performance 52reusable 37tuning 37
sequential merge optimal file storage 48
session log files disabling 46
session on grid Sequence Generator performance, increasing 52
sessions bottlenecks, causes 17bottlenecks, eliminating 17bottlenecks, identifying 17concurrent 42grid 41pushdown optimization 42tuning 41
shared cache for lookups 35
shared file systems configuring 49CPU, balancing 49high bandwidth 48low bandwidth 48overview 48server load, distributing 49
single-pass reading definition 27
sorted input optimizing Aggregator transformation 33
Sorter transformation optimizing partition directories 38optimizing with memory allocation 38tuning 38
source files flat versus XML 27optimal storage 48
Source Qualifier transformation tuning 39
sources bottlenecks, causes 15bottlenecks, eliminating 16filters 24identifying bottlenecks 15relational, tuning 23tuning queries 23
spaces trailing, removing 29
SQL transformation tuning 39
staging areas removing 46
string operations compared to numeric operations 29minimizing 29
Sybase ASE in-memory database 25
Sybase IQ external loader 21
system bottlenecks on UNIX, identifying 18bottlenecks on Windows, identifying 18bottlenecks, causes 17bottlenecks, eliminating 18bottlenecks, identifying with Workflow Monitor 17tuning 57
Ttablespace
optimal type for DB2 54target files
optimal storage 48targets
allocating buffer memory 42bottlenecks, causes 14bottlenecks, eliminating 14identifying bottlenecks 14
temporary files optimal storage 48
Teradata FastExport performance for sources 24
thread statistics bottlenecks, eliminating 13bottlenecks, identifying 13
70 Index
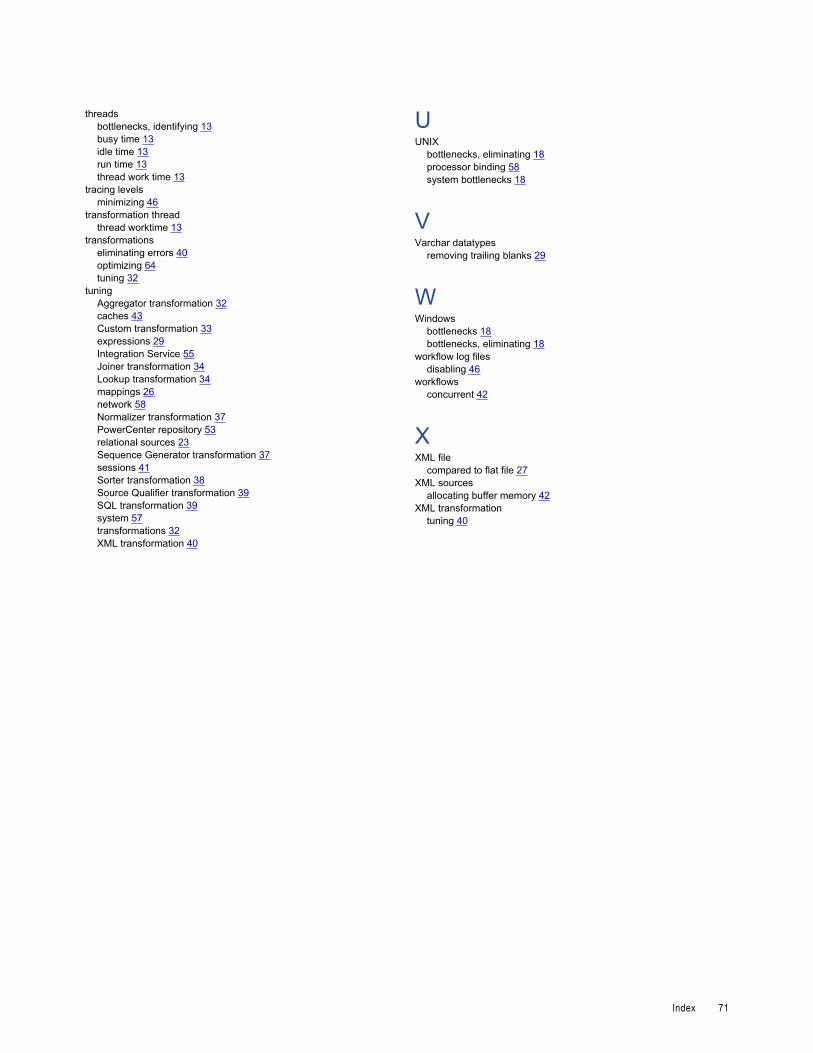
threads bottlenecks, identifying 13busy time 13idle time 13run time 13thread work time 13
tracing levels minimizing 46
transformation thread thread worktime 13
transformations eliminating errors 40optimizing 64tuning 32
tuning Aggregator transformation 32caches 43Custom transformation 33expressions 29Integration Service 55Joiner transformation 34Lookup transformation 34mappings 26network 58Normalizer transformation 37PowerCenter repository 53relational sources 23Sequence Generator transformation 37sessions 41Sorter transformation 38Source Qualifier transformation 39SQL transformation 39system 57transformations 32XML transformation 40
UUNIX
bottlenecks, eliminating 18processor binding 58system bottlenecks 18
VVarchar datatypes
removing trailing blanks 29
WWindows
bottlenecks 18bottlenecks, eliminating 18
workflow log files disabling 46
workflows concurrent 42
XXML file
compared to flat file 27XML sources
allocating buffer memory 42XML transformation
tuning 40
Index 71