performance specification aa
TRANSCRIPT

APPENDIX A
Performance Specification AA: Specifications and Test Procedures for X-ray Fluorescence
Based Metals Continuous Fence-Line Monitors
DRAFT EPA Contract EP-D-05-096, Assignment 4-07
EPA Project Manager: Daniel G. Bivins
MACTEC Work Order No. 201001192 MACTEC Project No. 688009S509
Submitted To: MACTEC Federal Programs Research Triangle Park, NC
Prepared By: Krag A. Petterson, John A. Cooper, Douglas Barth, and Blake Rupprecht
Cooper Environmental Services, LLC Portland, OR
December 3, 2010

Draft Performance Specifications AA December 3, 2010
Cooper Environmental Services ii
Executive Summary
Performance Specification AA (PS-AA) details the initial performance requirements and procedures for metals continuous fence line monitors (CFLM) that utilize X-ray fluorescence as an analytical technique. Each CFLM must meet the criteria for accuracy, linearity and stability found in PS-AA. Each CFLM must also meet the installation requirements found in PS-AA and the on-going quality control and assurance requirements set forth in Procedure B.

Draft Performance Specifications AA December 3, 2010
Cooper Environmental Services iii
List of Symbols TiA = The CFLM’s reported value for the ith element on a NIST traceable standard UiA = The measured value of the ith element ZiA = The measured value of the ith element
ob = The intercept of the least square fit of the ith element
1b = The slope of the least squares regression fit for the ith element CiC = The corrected concentration for the ith element
iCE = The XRF calibration error for the ith element of the CFLM expressed as a percent FLMiC = The CFLM reported concentration for the ith element FLMiC = The average daily CFLM reported concentration for the ith element LiC = The concentration of the permitted limit for the ith element
1RiC = The reported concentration of the ith element from reference method sampler one.
2RiC = The reported concentration of the ith element from reference method sampler two.
iD = The percent difference in reported concentration between the two reference method samplers for the ith element. FD = The flow drift of the metals CFLM in percent FE = Flow Error expressed as a percent
FLMF = Flow as measured by the metals CFLM
PF = The flow reading from the CFLM’s primary flow meter used during normal operation
QAF = The flow reading from the QA flow sensor
RF = Flow as measured by the NIST traceable flow measurement device UiM = The upscale reference value for the ith element ZiM = The zero reference value for the ith element
n = The number of FLM sample periods in a day TiR = The value the ith element on a NIST traceable standard
iUD = The upscale drift for the ith element in percent x = The reference aerosol or reference method concentration x = The average reference aerosol or reference method concentration
ix = An individual reference aerosol or reference method concentration
y = Concentration output of the CFLM as predicted by the linear least squares model
iy = An individual reported CFLM concentration y = The average reported CFLM concentration
iZD = The zero drift for the ith in percent

Draft Performance Specifications AA December 3, 2010
Cooper Environmental Services iv
Table of Contents
1 Purpose and Application .................................................................................................. 1
2 Definitions ....................................................................................................................... 1
3 Interferences ................................................................................................................... 4
4 Safety ............................................................................................................................. 4
5 Equipment and Supplies .................................................................................................. 4
6 Reference Standards ...................................................................................................... 5
7 Performance Specification Test Procedure ....................................................................... 7
8 Quality Control (Reserved) ............................................................................................ 15
9 Calibration and Standards (Reserved)............................................................................ 15
10 Analytical Procedures (Reserved)............................................................................... 15
11 Calculations and Data Analysis .................................................................................. 15
12 Method Performance ................................................................................................. 17
13 Pollution Prevention (Reserved) ................................................................................. 18
14 Waste Management (Reserved) ................................................................................. 18
15 Alternative Procedures (Reserved) ............................................................................. 18
16 Bibliography .............................................................................................................. 18
17 Tables and Figures .................................................................................................... 20

Draft Performance Specifications AA December 3, 2010
Cooper Environmental Services 1
1 Purpose and Application
1.1 Purpose
The purpose of Performance Specification AA (PS-AA) is to establish the initial performance requirements that must be met by X-ray fluorescence (XRF) based metals continuous fence line monitors (CFLM). These procedures assure the initial accuracy and precision for metals continuous fence line monitors. Instruments that have met the initial performance requirements of PS-AA may used by regulating agencies (local, state and federal) for the purposes of enforcing a permitted metals concentration either at the perimeter of a facility with fugitive metal emissions or in communities affected by metals emissions. Assurance of the continuing quality of metals CFLMs may be achieved by following the procedures defined in Procedure B – XRF Based Metals Fence Line Monitor Quality Assurance Procedures.1
1.2 Applicability
1.2.1 Analytes
Several analytes may be measured by XRF based metals continuous fence line monitors. These analytes include but are not limited to the following: Antimony (Sb), Arsenic (As), Cadmium (Cd), Chromium (Cr), Cobalt (Co), Lead (Pb), Manganese (Mn), Mercury (Hg), Nickel (Ni), and Selenium (Se).
1.2.2 Alternative methods
Metals monitoring approaches not entirely suitable to these specifications may be approvable under the alternative monitoring or alternative test method provisions of 40 CFR Part 60 and Part 63.2,3
2 Definitions
2.1 Metals Continuous Fence Line Monitor (CFLM)
A metals continuous fence line monitor is any monitor capable of measuring one or more metal concentrations on a continuous, real time basis. These monitors may be located at the fence line or perimeter of industrial facilities with fugitive metal emissions or in communities affected by metal emissions. These monitors generally consist of the following subsystems:

Draft Performance Specifications AA December 3, 2010
Cooper Environmental Services 2
2.1.1 Sample Inlet
The sample inlet for a metals CFLM can include any standard federally recognized PM10, PM2.5, or high-volume TSP inlets.4,5,6 Other types of sample inlets may be allowed or specified by applicable regulations or permits.
2.1.2 Analyzer Module
This is the portion of the metals continuous fence line monitor that measures the metal mass. For the XRF based monitors governed by this performance specification, this system consists of the filter media (if such filter material is necessary) designed to capture the particulate and/or vapor phase metals and the components of the X-ray analytical equipment (e.g. tube, detector, power supplies).
2.1.3 Sample Flow Module
The sample flow system includes those parts designed to generate and measure the flow into the CFLM.
2.1.4 Data Recorder
This is the portion of the metals CFLM that provides an electronic record of the instruments output in terms of ng/m3 or µg/m3.
2.2 Permitted Concentration Limit
This is the maximum concentration of a metal allowed by regulation, permit or other enforcement mechanism for a particular area or airshed. The metals continuous fence line monitor is used to determine a regulated facility’s compliance with this limit.
2.2.1 Seven Day Calibration Drift Test
Calibration drift is the difference in the CFLM output readings from established reference values after a stated period of operation during which no unscheduled maintenance, repair or adjustments took place. Three calibration drift checks are required of x-ray fluorescence based metals CFLMs: a zero drift check, an upscale drift check, and a flow drift check.
2.2.2 Zero Drift
The Zero Drift is the difference in the reported value for the zero reference and its value at the last analyzer calibration divided by the permitted concentration limit and expressed as a percent.

Draft Performance Specifications AA December 3, 2010
Cooper Environmental Services 3
2.2.3 Upscale Drift
The upscale drift is the difference in the reported value for the upscale reference from its value at the last analyzer calibration divided by the value at the last analyzer calibration and expressed as a percent.
2.2.4 Flow Drift
The flow drift is the difference between the flow measured by the CFLM and flow measured by the CFLM’s flow check measurement device divided by the flow from the flow check measurement device and expressed as a percent
2.3 XRF Analyzer Audit
This is a test of the accuracy of the metals CFLM’s XRF analyzer. Gravimetrically traceable to NIST thin film standards may be used to audit the accuracy of the metals analyzer (see Section 6.4). The results of this audit are used to calculate the calibration error (see Section 7.4)
2.4 Flow Audit
The flow audit measures the accuracy of the metals CFLM’s flow sensor using a NIST traceable flow measurement device. The results of this audit are used to calculate the flow error (see Section 7.5)
2.5 Linear Accuracy Audit
This test assesses the linearity of the metals CFLM’s response to a range of aerosol concentrations. The response of the CFLM is compared to the reference aerosol concentration.
2.6 Relative Accuracy Audit
The relative accuracy audit assesses the accuracy of a metals CFLM’s response by comparing it to a reference method.
2.7 Measurement Range
This is the range of concentrations over which the metals continuous CFLM has demonstrated valid and accurate measurement. If a Linear Accuracy Audit is performed then this range extends from the lowest aerosol concentration level to the highest aerosol concentration level. If relative accuracy audit is performed the instrument range spans from the lowest recorded concentration for which there is accurate comparison data to the highest recorded concentration for which there is accurate comparison data.

Draft Performance Specifications AA December 3, 2010
Cooper Environmental Services 4
2.8 Maximum Validated Concentration
The maximum validated concentration is the highest concentration that the metals CFLM has demonstrated it can accurately measure. If a Linear Accuracy Audit is performed against a reference aerosol the highest aerosol concentration level is the maximum validated concentration. If CFLM accuracy is validated using a relative accuracy audit, the maximum validated concentration is equal to the concentration of the highest recorded sample for which there is reference method data to compare.
3 Interferences
Please check with your metals CFLM’s manufacturer for any potential interferences.
4 Safety
People using PS-AA may be exposed to hazardous materials, operational hazards and hazardous site conditions. PS-AA does not address all of the safety issues associated with its use. It is the responsibility of those using PS-AA to ensure their own safety. Some helpful references regarding safety may include the CFLM’s manual and its manufacturer.
5 Equipment and Supplies
5.1 Metals Continuous Fence Line Monitor Equipment Specifications
5.1.1 Data Recorder
The metals continuous fence line monitor must be equipped with a means of electronically recording the metals concentration data generated by the monitor.
5.1.2 Flow Module
The metals continuous fence line monitor must be equipped with a means to generate and measure flow.
5.1.3 XRF Module
All XRF based CFLM’s must have a module based on X-ray fluorescence (either energy or wavelength dispersive) to measure metals concentrations or masses.
5.1.4 Calibration Drift References
The metals CFLM must provide a means of performing the zero, upscale and flow calibration drift checks at the frequency required in both this document (Performance

Draft Performance Specifications AA December 3, 2010
Cooper Environmental Services 5
Specification AA) and as required by Procedure B – XRF Based Metals Fence Line Monitor Quality Assurance Procedures.1
5.1.5 Sampler Inlet
The metals continuous fence line monitor must be equipped with a sample inlet. This sample inlet may include standard Federal Reference Method inlets such as PM10, PM2.5 or TSP inlets. If these standard inlets are used they must be used at the flows and in the conditions specified in appropriate guidance documentation provided in the Federal Register.4,5,6 Other types of sampler inlets may be used if they are specified by regulation.
5.2 Reference Methods
If the accuracy of the metals continuous fence line monitor is determined using a relative accuracy audit then it is necessary to have all the equipment required to gather suitable reference method measurements. This equipment could include samplers, filters, additional sample inlets and laboratory analytical equipment. Sampling reference methods may include those found for sampling PM10, PM2.5 and TSP in Appendices J, L and B respectively, of 40 CFR 50.4,5,6 Appropriate metals analysis procedures may be found in the Compendium of Methods for the Determination of Inorganic Compounds (I.O.) in Ambient Air.7
Examples of appropriate analysis methods include, X-ray Fluorescence (I.O. 3.3), inductively coupled plasma (ICP) spectroscopy (I.O. 3.4), inductively coupled plasma/mass spectrometry (I.O. 3.5), and proton induced X-ray emission (PIXE) spectroscopy (I.O. 3.6).
5.3 Reference Aerosol Generator
If the accuracy of the metals continuous fence line monitor is determined using a reference aerosol generator then it necessary to have all the equipment required to generate a reference aerosol. The equipment and quality assurance procedures for such a generator may be found elsewhere.8,9
5.4 Other equipment and supplies
Other equipment as specified by the manufacturer of the CFLM, or for proper operation of the reference method, or the reference aerosol generator may be needed.
6 Reference Standards
6.1 Zero Drift Reference
All metals continuous fence line monitors must be equipped with a zero drift reference. The reported concentration for this reference value must be between 0 and 20 percent of the permitted concentration limit. For CFLM’s utilizing filter tape to capture particulate and/or

Draft Performance Specifications AA December 3, 2010
Cooper Environmental Services 6
vapor phase metals concentrations, a blank section of tape may be used as a zero reference. The concentrations of metals on the zero drift reference do not need to be NIST traceable.
6.2 Upscale Drift Reference
All metals continuous fence line monitors must be equipped with an upscale drift reference. This reference is used to test the stability of the XRF analyzer and must have a reported concentration equivalent to at least 80 percent of the permitted concentration limit. The concentrations of each metal on the upscale drift reference do not need to be NIST traceable.
6.3 Quality Assurance Flow Meter
All metals continuous fence line monitors must be equipped with a flow measurement device that can be used to automatically check the accuracy of the instrument’s primary flow measurement device. This meter need not be NIST traceable and is used to perform the daily flow audits required for this performance specification.
6.4 NIST Traceable XRF Audit Standards
Most X-ray fluorescence analyzers used to determine metals concentrations on particulate matter (PM) filter samples are calibrated using thin film standards. An XRF based metals continuous fence line monitor may be calibrated in this same way. The accuracy of the XRF analyzer should be checked using these standards. Micromatter10 produces gravimetrically traceable to NIST thin film standards that have been recognized as being useful for the purposes of calibrating XRF analyzers.11 Other traceable to NIST thin film standards may be used if they are available. These standards are also required for quarterly XRF audits required by Procedure B.
6.5 NIST Traceable Flow Meter
During initial performance testing, a flow audit of the primary and QA flow meters is required. For this audit, a NIST traceable flow meter is required. Procedures for performing a flow audit with a NIST traceable flow meter can be found in Section 7.5. A NIST traceable flow meter is also required for quarterly flow audits as required by Procedure B.

Draft Performance Specifications AA December 3, 2010
Cooper Environmental Services 7
7 Performance Specification Test Procedure
7.1 Installation and Measurement Location Specifications
7.1.1 Installation Location
The metals continuous fence line monitor should be located in accordance with the applicable regulation and the Protocol for Developing and Implementing a Metals Fence Line Monitoring Plan Using X-ray Based Monitors.12
7.1.2 Shelter
The instrument should be housed in a manner consistent with the manufacturer’s specifications. This could include a climate controlled shelter for the sampling and analyzer modules and the data recorder.
7.1.3 Inlet location
The inlet locations for a metals continuous fence line monitor generally follow the same procedures as those for micro-scale particulate matter sampling. The inlet must be between 2 and 7 meters above the ground at least 2 meters horizontally away from any supporting structure walls and at least 1 meter above any supporting structure. Preferably, there should be no trees or shrubs located between the probe and the monitored facility. If this is not possible the probe should be located at least 10 meters away from the drip line of trees. For all other obstacles, the distance between the obstacle and the probe should be twice the height that the obstacle protrudes above the probe inlet.13 Exceptions to these rules may be made at the discretion of the regulating agency.
7.2 Pretest Preparation
After properly locating, installing, and housing the metals continuous fence line monitor, it is recommended that it operate for a period of time to assure that the user is familiar with operation and to assure that the instrument is functioning properly. During this period of operation all daily quality assurance procedures should be performed as they would during normal operation (See Procedure B).
7.3 Seven Day Calibration Drift (CD) Test Procedures
The purpose of the seven day calibration drift test is to demonstrate the stability of the continuous fence line monitor’s flow and XRF analyzer calibration. Prior to performing the calibration drift check, the CFLM’s XRF analyzer should be calibrated according to the manufacturer’s specifications. Following the calibration and appropriate calibration checks, the initial values for the Zero Drift Reference and the Upscale Drift Reference should be

Draft Performance Specifications AA December 3, 2010
Cooper Environmental Services 8
determined according to the manufacturer’s specifications. During the seven day calibration drift check no adjustments or calibrations may be made to the CFLM.
7.3.1 Analyzer Zero Drift
Determine the magnitude of the zero calibration drift at least once each day at 24 hour intervals for seven consecutive unit operating days. (The seven consecutive unit operating days need not be seven consecutive calendar days). The zero drift check may be performed automatically as a part of normal instrument function or it may be performed manually by the operator. Calculate the zero drift by determining the absolute value of the difference between the zero drift reference value ( Z
iM ) and the CFLM’s
reported value ( ZiA ), divided by the permitted concentration limit ( L
iC ) according to Equation AA-1. The zero drift reference value is determined according the manufacturers specifications immediately following the XRF calibration of the instrument.
%100×−
= Li
Zi
Zi
i C
AMZD Equation AA-1
Where:
iZD = The zero drift for the ith in percent
ZiM = The zero reference value for the ith element
ZiA = The measured value of the ith element
LiC = The concentration of the permitted limit for the ith element
7.3.2 Analyzer Upscale Drift Determine the magnitude of the upscale calibration drift at least once each day at 24 hour intervals for seven consecutive unit operating days. (The seven consecutive unit operating days need not be seven consecutive calendar days). The upscale drift check may be performed automatically as a part of normal instrument function or it may be performed manually by the operator. Calculate the upscale drift by determining the absolute value of the difference between the upscale reference value ( U
iM ) and the
metals CFLM’s reported value ( UiA ) and dividing by the upscale reference value
according to Equation AA-2. The upscale reference value is determined according to the manufacturers specifications immediately following the XRF calibration of the instrument.
%100×−
= Ui
Ui
Ui
i M
AMUD Equation AA-2

Draft Performance Specifications AA December 3, 2010
Cooper Environmental Services 9
Where:
iUD = The upscale drift for the ith element in percent
UiM = The upscale reference value for the ith element
UiA = The measured value of the ith element
7.3.3 Flow Calibration Drift
Determine the magnitude of the flow calibration drift at least once each day at 24 hour intervals for seven consecutive unit operating days. (The seven consecutive unit operating days need not be seven consecutive calendar days). The flow drift check may be performed automatically as a part of normal instrument function or may be performed manually by the operator. The flow drift is determined by comparing the flow from the CFLM’s primary flow sensor used during normal sampling, and a secondary flow sensor used only during quality assurance procedures. The flow rate during flow calibration drift check must be the same as that used during the normal operation of the instrument. The magnitude of the flow drift may be calculated by determining the absolute value of the difference between the quality assurance flow sensor reading and the primary flow sensor reading and dividing by the quality assurance flow sensor reading according to Equation AA-3.
%100×−
=QA
PQA
FFF
FD Equation AA-3
Where:
FD = The flow drift of the metals CFLM in percent
QAF = The flow reading from the QA flow sensor
PF = The flow reading from the CFLM’s primary flow meter used during normal operation
7.4 XRF Audit Test Procedures
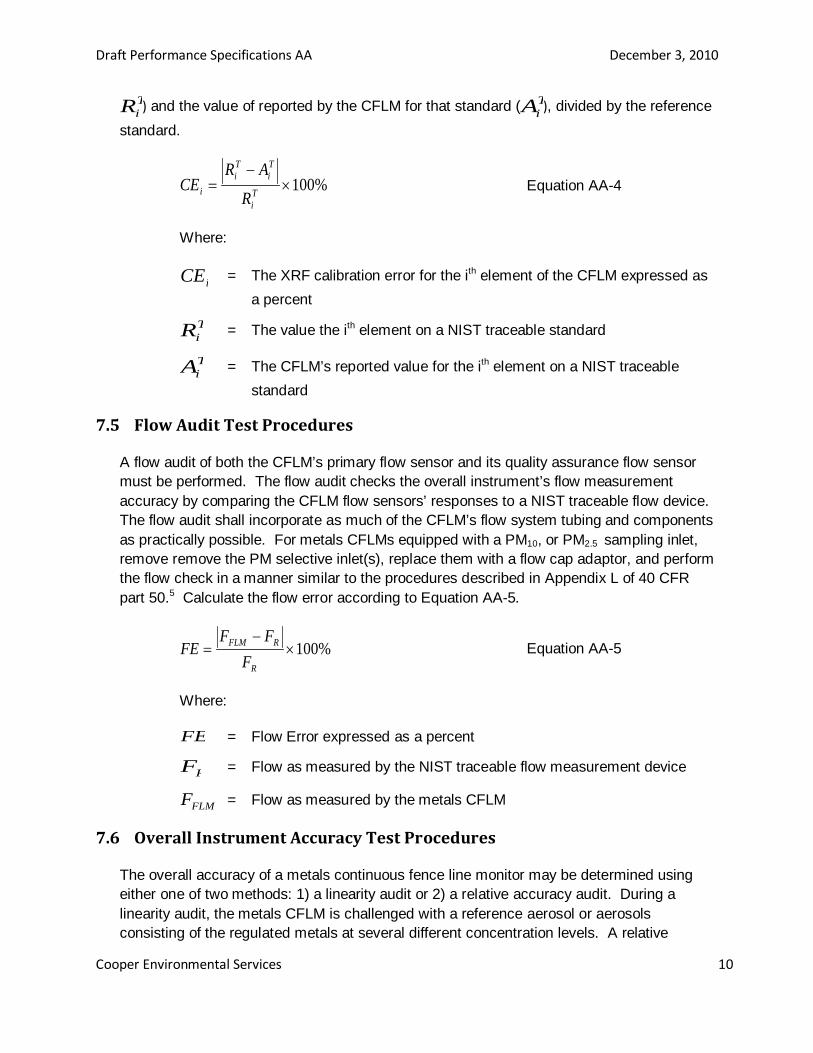
An XRF Audit must be performed for each regulated or permitted metal measured by the metals continuous fence line monitor. The XRF audit reference must be a NIST traceable standard. An example of such audit standards are the gravimetrically traceable to NIST thin film standards commercially available from Micromatter10. The XRF audit checks the XRF analyzer portion of the CFLM for accuracy relative to these standards. The magnitude of the XRF calibration error ( iCE ) is calculated by determining the absolute value of the difference between the value of the ith element on the NIST traceable reference standard (
Draft Performance Specifications AA December 3, 2010
Cooper Environmental Services 10
TiR ) and the value of reported by the CFLM for that standard ( T
iA ), divided by the reference standard.
%100×−
= Ti
Ti
Ti
i R
ARCE Equation AA-4
Where:
iCE = The XRF calibration error for the ith element of the CFLM expressed as a percent
TiR = The value the ith element on a NIST traceable standard
TiA = The CFLM’s reported value for the ith element on a NIST traceable
standard
7.5 Flow Audit Test Procedures
A flow audit of both the CFLM’s primary flow sensor and its quality assurance flow sensor must be performed. The flow audit checks the overall instrument’s flow measurement accuracy by comparing the CFLM flow sensors’ responses to a NIST traceable flow device. The flow audit shall incorporate as much of the CFLM’s flow system tubing and components as practically possible. For metals CFLMs equipped with a PM10, or PM2.5 sampling inlet, remove remove the PM selective inlet(s), replace them with a flow cap adaptor, and perform the flow check in a manner similar to the procedures described in Appendix L of 40 CFR part 50.5 Calculate the flow error according to Equation AA-5.
%100×−
=R
RFLM
FFF
FE Equation AA-5
Where:
FE = Flow Error expressed as a percent
RF = Flow as measured by the NIST traceable flow measurement device
FLMF = Flow as measured by the metals CFLM
7.6 Overall Instrument Accuracy Test Procedures
The overall accuracy of a metals continuous fence line monitor may be determined using either one of two methods: 1) a linearity audit or 2) a relative accuracy audit. During a linearity audit, the metals CFLM is challenged with a reference aerosol or aerosols consisting of the regulated metals at several different concentration levels. A relative

Draft Performance Specifications AA December 3, 2010
Cooper Environmental Services 11
accuracy audit consists of comparing the concentrations reported by the CFLM with that of a reference method.
There are advantages and disadvantageous to each approach. In general, spiking the instrument with a reference aerosol will give the user greater control over the time period required to complete the initial performance specifications and a larger and more robust verified concentration range. However, there may be metals for which reference aerosols are not available, or not available at the concentration levels likely to be observed during normal operation. In these cases, it is preferable to assess the instrument accuracy against a reference method.
7.6.1 Linearity Accuracy Test Procedures
If the accuracy of the metals continuous fence line monitor is determined using a linearity accuracy audit, the audit must be completed before the CFLM can be used for compliance purposes. The reference aerosol generator used for this test must be cable of delivering a traceable to NIST aerosol consisting of the regulated metal or metals at the concentration levels specified in this procedure. Quality control and assurance procedures for the reference aerosol generator can be found elsewhere.8,9
The aerosol must be delivered at a point such that as much of the metals CFLM as practically possible is challenged. For CFLM’s outfitted with standard particulate matter sampling inlets (PM10, PM2.5 and TSP) the PM sampling inlet may be removed and the aerosol may be introduced into the downtube just below the size selective inlet. Aerosol introduction points for non-standard inlets may be determined at the discretion of the regulating agency.
The linearity test consists of at least three concentration levels and a zero level. The zero concentration may be determined by operating the instrument with a filter to remove any of the measured metals from the sampled air. This filter must be placed in the same location as the aerosol is introduced when spiking. The three concentration levels consist of the following for each regulated metal:
1. 10 to 30 percent of the permitted concentration limit
2. 30 to 60 percent of the permitted concentration limit
3. 80 to 120 percent of the permitted concentration limit.
Although a Linear Accuracy Audit is only required up to the concentration level of the permitted limit, it is recommended that the CFLM is challenged with even higher concentration levels. Concentrations on the fence lines of metals producing facilities have demonstrated a wide range of variability, with very high concentrations occurring for very short time intervals. It is reasonable to expect, for example, an hourly average concentration to be 10 or 20 times the daily average concentration. The linearity accuracy audit should be expanded to include these higher concentration levels. The

Draft Performance Specifications AA December 3, 2010
Cooper Environmental Services 12
highest spiked concentration is considered to be the maximum validated concentration for the CFLM.
Five valid data points are required at each concentration level. These data points may be acquired at the normal instrument sampling interval or they may be acquired at shorter intervals to decrease total testing time. However, if shorter intervals are used, at least one measurement must be made at the desired sampling time period. For example, if the metals CFLM will normally acquire one hour samples the linearity testing can be done with a shorter sampling period, such as 15 minutes, provided at least one sample from each concentration level is determined at the normal sampling interval. The concentration reported during the normal sampling interval (e.g. 1 hour) must not differ from the average concentration of the shorter sampling intervals (e.g. 15 minutes) by more than three standard deviations.
After completing the aerosol spiking procedure, plot the concentrations reported by metals continuous fence line monitor versus the reference aerosol concentrations. Perform a linear least squares regression fit for each metal tested. All collected data must be used in the regression fit unless the operator can demonstrate a failure in the aerosol generator or in the instrument (outlier data may not be removed on a statistical basis only). If the slope of the least squares regression fit is between 0.85 and 1.15, the intercept is less than 20% of the permitted concentration level, and the correlation coefficient is greater than 0.90, the CFLM may be used for compliance without correction. If the slope or the intercept falls outside of their acceptable ranges, a correction factor may be applied to the metals CFLM data provided the following is true:
1. The slope of the best fit line is not greater than 1.3 or less than 0.70
2. The intercept is not greater than 40% of the permitted concentration limit
3. The correlation coefficient is greater than 0.90.
If these three criteria are not met the CFLM has failed the linearity accuracy audit. The slope and intercept correction factors can be calculated using Equations AA-6 and AA-7 respectively. Correcting both the slope and intercept simultaneously can be done using Equation AA-8. The symbols for slope and intercept refer to Equation AA-11 in Section 11.
1bC
CFLMiC
i = Equation AA-6
Where:
CiC = The corrected concentration for the ith metal
FLMiC = The CFLM reported concentration for the ith metal

Draft Performance Specifications AA December 3, 2010
Cooper Environmental Services 13
1b = The slope of the least squares regression fit for the ith metal (see Equation AA-11 in Section 11)
oFLMi
Ci bCC −= Equation AA-7
Where:
ob = The intercept of the least square fit of the ith metal (see Equation AA-11 in Section 11)
1
0
bbC
CFLMiC
i−
= Equation AA-8
7.6.2 Relative Accuracy Audit Procedures
The accuracy of a metals continuous fence line monitor may also be determined by comparing the concentrations reported by the CFLM with those reported by a reference method. Suitable reference methods may include sampling using a Federal Reference Method (FRM) samplers or Federal Equivalent Method (FEM) samplers for PM10, PM2.5 or TSP. A list of acceptable samplers may be found in the Federal Register. All applicable quality assurance procedures and criteria must be followed for each sampler. Quality assurance criteria for PM10, PM2.5 and TSP may be found in Appendices J, L, and B respectively of 40 CFR 50.4,5,6 Metals concentrations should be determined using those procedures commonly used and listed in the US EPA Compendium of Methods for the determination of Inorganic Compounds in Ambient Air.7 These analytical methods include, X-ray fluorescence (IO 3.3), Inductively Coupled Plasma Mass Spectroscopy (ICP-MS) (IO 3.5) Inductively Coupled Plasma Spectroscopy (IO 3.4) and Proton Induced X-ray Emission (PIXE) spectroscopy (IO 3.6). During the relative accuracy audit, the metals CFLM must be operating in accordance with the procedures found in Procedure B – XRF Based Metals Fence Line Monitor Quality Assurance Procedures,1 including all applicable calibration checks.
For the relative accuracy audit at least two reference method samplers must be co-located with the CFLM. For high volume samplers, sample inlets for the reference method and the CFLM must be between 2 and 4 meters from any other sampler inlet. For low volume samplers, sample inlets for the reference method and the CFLM must be located between 1 and 4 meters from any other inlet.14
Most available reference methods are only capable of producing one analyzable sample per day. The comparison between the reference method and the fence line monitor, must then be between the daily reference method sample concentration and the daily average concentration reported by the CFLM. The reference method sampler should be programmed so that its sampling time coincides with the sampling time of the CFLM. If the CFLM is not sampling for any significant period of time due to quality assurance

Draft Performance Specifications AA December 3, 2010
Cooper Environmental Services 14
procedures the reference method sampler should also not be sampling for that same period of time. The daily average for the CFLM should be calculated by adding all of the individual concentrations reported by the CFLM for each day and dividing by the total number of sampling periods as shown in Equation AA-9.
nC
CFLMiFLM
i∑= Equation AA-9
Where:
FLMiC = The average daily CFLM reported concentration for the ith metal FLMiC = An CFLM reported concentration for the ith metal for one sample
period n = The number of FLM sample periods in a day
Reference method data may be eliminated from comparison for days on which concentrations reported from each reference method sample differ by greater than 15%. The percent difference between each reference method may be calculated using Equation AA-10.
( ) %100)(2
21
21
×+−
= Ri
Ri
Ri
Ri
i CCCC
D Equation AA-10
Where:
iD = The percent difference in reported concentration between the two reference method samplers for the ith metal.
1RiC = The reported concentration of the ith metal from reference method
sampler one. 2R
iC = The reported concentration of the ith metal from reference method sampler two.
Nine valid points of comparison must be generated for each regulated metal. Valid data points are generated on days in which the reference method comparability criteria are met, and where the average concentration reported by the reference method is at least 5% of the permitted concentration limit. After obtaining at least nine valid points of comparison, plot the daily average reported by the CFLM versus the average reference method concentration (the average of the two reference method samplers). Perform a least squares regression fit for each regulated metal and determine the slope, intercept and correlation coefficient for the best fit line. If the slope is between 0.85 and 1.15, the intercept is less than 20 percent of the permitted concentration limit, and the correlation coefficient is greater than 0.90 the metals continuous fence line monitor may be used

Draft Performance Specifications AA December 3, 2010
Cooper Environmental Services 15
without correction. If the slope and/or intercept fall outside of their acceptable ranges a correction factor may be applied provided the following three criteria are met:
1. The slope of the best fit line is not greater than 1.3 or less than 0.70
2. The intercept is not greater than 40% of the permitted concentration limit
3. The correlation coefficient is greater than 0.90
If these criteria are not met the metals CFLM has failed the relative accuracy audit. Correction factors can be calculating using Equations AA-6 to AA-8 as appropriate.
7.7 Measurement Range
The CFLM’s measurement range is determined during either the Linear Accuracy Audit or during the Relative Accuracy Audit, depending on which is performed. For the Linear Accuracy Audit the CFLM’s validated measurement range extends from the lowest to the highest spiked concentration level. For the Relative Accuracy Audit, the measurement range extends from the lowest to the highest recorded concentrations for which there is reference method data to compare.
7.8 Reporting
At a minimum summarize all the results of the calibration drift checks, the XRF and flow audits and the results of the either the linearity audit or the relative accuracy audit. Include all data sheets, calculations, charts and any other information necessary to confirm that the metals CFLM meets the performance criteria.
8 Quality Control (Reserved)
9 Calibration and Standards (Reserved)
10 Analytical Procedures (Reserved)
11 Calculations and Data Analysis
11.1 Consistent Basis
All CFLM, reference method and aerosol generator data must be compared in units of micrograms or nanograms per standard cubic meter at 25 oC and 760 mm Hg.

Draft Performance Specifications AA December 3, 2010
Cooper Environmental Services 16
11.2 Linear Regression
Both the linearity audit and the relative accuracy audit utilize linear least squares fitting. For this fitting, the CFLM’s response is modeled as a linear function of either the reference aerosol concentration or the reported reference method concentration. The form of this simple linear least squares relationship can be found in Equation AA-11
xbby o 1ˆ += Equation AA-11
Where:
y = Concentration output of the CFLM as predicted by the linear least squares model
1b = The slope of the best fit line
ob = The intercept of the best fit line
x = The reference aerosol or reference method concentration
The slope of the simple least squares line is given by Equation AA-12
∑
∑
=
=
−
−−= n
ii
n
iii
xx
yyxxb
1
2
11
)(
))(( Equation AA-13
Where:
1b = The slope of the best fit line
ix = An individual reference aerosol or reference method concentration
x = The average reference aerosol or reference method concentration
iy = An individual reported CFLM concentration
y = The average reported CFLM concentration Using the slope calculated in Equation AA-13 the intercept can be calculated using Equation AA-14.
xbybo 1−= Equation AA-14 Finally the correlation coefficient (r) can be calculated using Equation AA-15.

Draft Performance Specifications AA December 3, 2010
Cooper Environmental Services 17
∑∑
∑
==
=
−−
−−=
n
ii
n
ii
n
iii
yyxx
yyxxr
1
2
1
2
1
)()(
))((
12 Method Performance
12.1 Zero Drift
The magnitude for the zero drift must not exceed 15% of the permitted concentration limit each day for seven consecutive instrument operating days.
12.2 Upscale Drift
The magnitude of the upscale drift must not exceed 15% of the reference value each day for the upscale standard for seven consecutive instrument operating days.
12.3 Flow Drift
The magnitude of the flow drift must not exceed 20% of the reading of the CFLM’s quality assurance flow meter each day for seven consecutive instrument operating days.
12.4 XRF Calibration Error
For each regulated metal the XRF calibration error must not exceed 10% of the value of the traceable to NIST reference standard.
12.5 Flow Error
The flow error must not exceed 10% of the NIST traceable reference flow meter.
12.6 Linearity Audit Criteria
Plot the CFLM reported concentration versus the reference aerosol concentration. If the slope of the best fit line is between 0.85 and 1.15, the intercept is less than 20% of the permitted concentration limit, and the correlation coefficient is greater than 0.90 the metals CFLM may be used without a correction factor. If the slope or the intercept fall outside of this range a correction factor may be applied to the CFLM data if the following three criteria are met:
1. The slope of the best fit line is not greater than 1.3 or less than 0.70
2. The intercept is not greater than 40% of the permitted concentration limit
3. The correlation coefficient is greater than 0.90.
Draft Performance Specifications AA December 3, 2010
Cooper Environmental Services 18
If these three criteria are not met the CFLM has failed the Linear Accuracy Audit.
12.7 Relative Accuracy Audit
Plot the daily CFLM average versus the daily average reference method concentration for each day. If the slope of the best fit line is between 0.85 and 1.15, the intercept is less than 20% of the permitted concentration limit, and the correlation coefficient is greater than 0.90 the metals CFLM may be used without a correction factor. If the slope or the intercept fall outside of this range a correction factor may be applied if the following three criteria are met:
1. The slope of the best fit line is not greater than 1.3 or less than 0.70
2. The intercept is not greater than 40% of the permitted concentration limit
3. The correlation coefficient is greater than 0.90.
If these three criteria are not met the CFLM has failed the Linear Accuracy Audit.
13 Pollution Prevention (Reserved)
14 Waste Management (Reserved)
15 Alternative Procedures (Reserved)
16 Bibliography
1. Petterson, K.A.; Cooper, J.A.; Barth, D. Procedure B – XRF Based Metals Fence Line Monitor Quality Assurance Procedures., 2010.
2. 40 CFR Part 60, “Standards of Performance for New Stationary sources.” http://ecfr.gpoaccess.gov/cgi/t/text/textidx?c=ecfr&tpl=/ecfrbrowse/Title40/40cfr60_main_02.tpl. (accessed September 8, 2010).
3. 40 CFR Part 63, “National Emissions Standards for Hazardous Air Pollutants for Source Categories.” http://ecfr.gpoaccess.gov/cgi/t/text/text-idx?c=ecfr&tpl=/ecfrbrowse/Title40/40cfr63_main_02.tpl. (accessed September 8, 2010).
4. 40 CFR Part 50, Appendix J, “Reference Method for the Determination of PM10 in the Atmosphere.” http://ecfr.gpoaccess.gov/cgi/t/text/text-idx?c=ecfr&sid=fe1bbdee1aef6355d582ab95848e7b54&rgn=div9&view=text&node=40:2.0.1.1.1.0.1.18.11&idno=40. (accessed September 8, 2010).

Draft Performance Specifications AA December 3, 2010
Cooper Environmental Services 19
5. 40 CFR Part 50, Appendix L, “Reference Method for the Determination of Fine Particulate Matter as PM2.5 in the Atmosphere.” http://ecfr.gpoaccess.gov/cgi/t/text/text-idx?c=ecfr&sid=fe1bbdee1aef6355d582ab95848e7b54&rgn=div9&view=text&node=40:2.0.1.1.1.0.1.18.13&idno=40. (Accessed September 8, 2010).
6. 40 CFR Part 50, Appendix B, “Reference Method for the Determination of Suspended Particulate Matter in the Atmosphere (High-Volume Method).” http://ecfr.gpoaccess.gov/cgi/t/text/text-idx?c=ecfr&sid=fe1bbdee1aef6355d582ab95848e7b54&rgn=div9&view=text&node=40:2.0.1.1.1.0.1.18.3&idno=40. (accessed September 8, 2010).
7. US Environmental Protection Agency; Compendium of Methods for the Determination of Inorganic Compounds in Ambient Air; EPA/625/R-96/010a. Cincinnati, OH. June 1999.
8. Petterson, K.A.; Cooper, J.A.; Traceability Protocol for the Certification of Reference Aerosol Generators, 2010.
9. U.S. Environmental Protection Agency; Other Test Method 21, Standard Operating Procedure for Generating a Quantitative Multi-Metals Reference Aerosol with CES QAG; http://www.epa.gov/ttn/emc/prelim/otm21.pdf (accessed September 8, 2010).
10. Micromatter Co.; 4004 Westbrook Mall, Vancouver, British Columbia, Canada.
11. EPA Compendium of Methods for the Determination of Inorganic Compounds in Ambient Air. June, 1999. Compendium Method IO-3.3 Determination of Metals in Ambient Particulate Matter Using X-Ray Fluorescence (XRF) Spectroscopy. EPA/625/R-96/010a
12. Cooper, J.A., Rupprecht, B., Petterson, K.A.; Protocol for Developing and Implementing a Metals Fence Line Monitoring Plan Using X-ray Based Monitors. 2010
13. 40 CFR Part 58, Appendix E, “Probe and Monitoring Path Siting Criteria for Ambient Air Quality Monitoring,” http://ecfr.gpoaccess.gov/cgi/t/text/text-idx?c=ecfr&sid=60c438915f17de8438c50a4bfb6136c1&rgn=div9&view=text&node=40:5.0.1.1.6.7.1.3.33&idno=40 (accessed September 8, 2010).
14. 40 CFR Part 53.33, “Test Procedure for Methods for Lead,” http://ecfr.gpoaccess.gov/cgi/t/text/text-idx?c=ecfr&sid=3382e77ca0ce8d197d4b36d38ac3d592&rgn=div8&view=text&node=40:5.0.1.1.1.3.1.4&idno=40 (accessed September 8, 2010).

Draft Performance Specifications AA December 3, 2010
Cooper Environmental Services 20
17 Tables and Figures
Table 1. Summary of Performance Specification AA Requirements
Test Category
Test Test Requirements Test Criteria
7 Day Stability
Upscale Monitor Upscale Standard once per day
for 7 consecutive days. Each check must run for the monitor’s intended sampling
time.
Must be less than 15% of the calibrated upscale standard
value
Zero Monitor the zero standard once per day for 7 consecutive days. Each check must run for the monitor’s intended sampling time.
Zero value must be less than 15% of the permitted
concentration limit for all days
Flow
Monitor the Flow drift once per day for seven consecutive days
Must be less than 20% difference between the reference flow meter and measuring flow sensor everyday for 7 days
Calibration Check
XRF Audit Test the analyzer response to each
permitted element using a NIST traceable standard.
Less than 10% difference between the standard and the instruments reported value
Flow Audit
Test the measurements made by the analyzer’s flow system using an
independent flow measurement device. Average at least 9 individual
measurements of flow
Average percent difference between the instrument flow and the Reference flow meter
must be less than 10%
Accuracy
Option A
Linearity Audit
• Generate a NIST Traceable Aerosol Concentration for each metal being permitted by the instrument
• Measure a zero concentration and at least 3 concentration levels including i) Between 10 and 30 % of PCLa ii)Between 30 and 60% of the PCLa iii) 80 and 120% of the PCLa
Spike must be as close as practically possible to the sampling inlet. Standard size selection inlets such as PM10, PM2.5 and TSP may be bypassed a. PCL = Permitted Concentration Limit
• Slope = 0.85 to 1.15 • Intercept = must be less than
20% of the permitted limit for each element
• Correlation Coefficient (r) greater than 0.90
• A correction factor may be applied if the slope and/or intercept criteria are not met but the correlation coefficient criteria is achieved
Option B
Comparability with
Reference Method
• Compare Metals FLM with two collocated Reference Methods.
• Obtain 9 samples for each permitted metal where the reported concentration is greater than 5% of the permitted concentration limit and where the precision requirement for the reference method is met
• Perform Linear Regression fit for each element
• Reference Method Precision – 15%
• Linear Regression fit i) Slope = 0.85 to 1.15 ii) Intercept = less than
20% of permitted limit iii) Correlation (r)
coefficient greater than 0.90.
• Correction factors may be applied if correlation coefficient criteria are met