performance review note q3 fy2014-15brands & retail segment excludes figures of arvind internet...
TRANSCRIPT
5th February 2015, Ahmedabad
Performance Review Note Q3 FY2014-15

2
Agenda
• Financial Performance: Consolidated
• Financial Performance: Standalone
• Business Analysis

3
Agenda
• Financial Performance: Consolidated
• Financial Performance: Standalone
• Business Analysis

4
2,074
1,772
500
1,000
1,500
2,000
2,500
17%
Q3 13-14 Q3 14-15
Rev, Rs Cr
288249
0
100
200
300
16%
Q3 14-15 Q3 13-14
EBITDA, Rs Cr
112103
0
50
100
150
PAT*, Rs Cr
9%
Q3 14-15 Q3 13-14
Financial Performance: Q3 2014-15 Consolidated Revenue growth of 17% and EBITDA growth of 16%
Strong growth in revenues... ...with steady weighted margins
*PAT before exception item
5
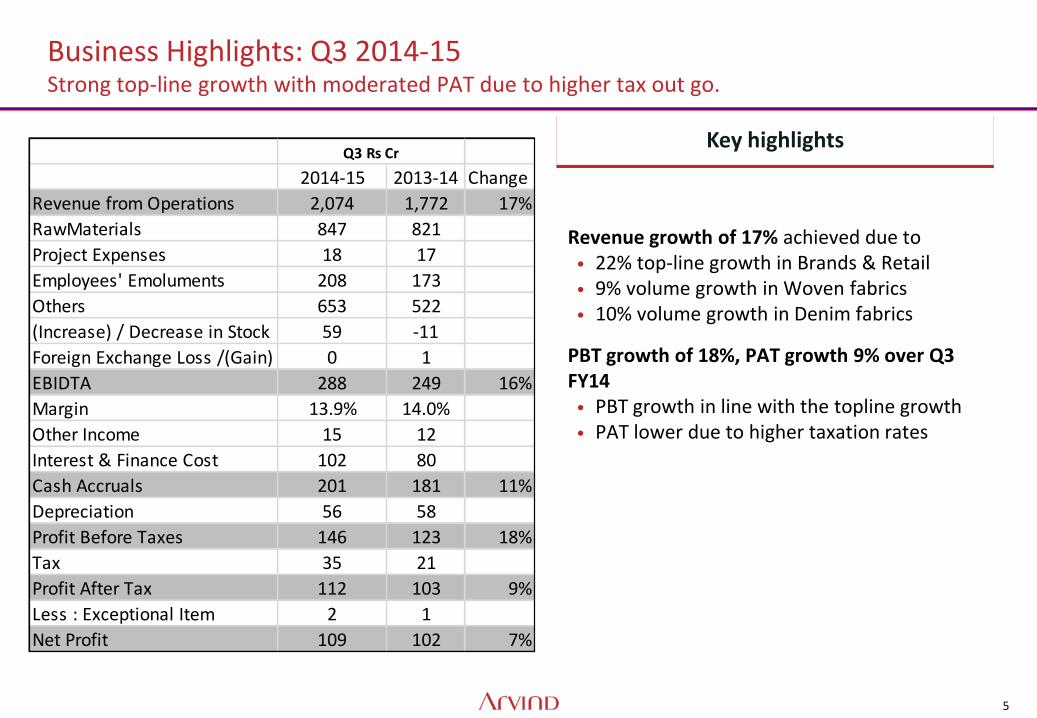
Business Highlights: Q3 2014-15 Strong top-line growth with moderated PAT due to higher tax out go.
Key highlights
Revenue growth of 17% achieved due to • 22% top-line growth in Brands & Retail • 9% volume growth in Woven fabrics • 10% volume growth in Denim fabrics
PBT growth of 18%, PAT growth 9% over Q3 FY14 • PBT growth in line with the topline growth • PAT lower due to higher taxation rates
2014-15 2013-14 Change
Revenue from Operations 2,074 1,772 17%
RawMaterials 847 821
Project Expenses 18 17
Employees' Emoluments 208 173
Others 653 522
(Increase) / Decrease in Stock 59 -11
Foreign Exchange Loss /(Gain) 0 1
EBIDTA 288 249 16%
Margin 13.9% 14.0%
Other Income 15 12
Interest & Finance Cost 102 80
Cash Accruals 201 181 11%
Depreciation 56 58
Profit Before Taxes 146 123 18%
Tax 35 21
Profit After Tax 112 103 9%
Less : Exceptional Item 2 1
Net Profit 109 102 7%
Q3 Rs Cr
6
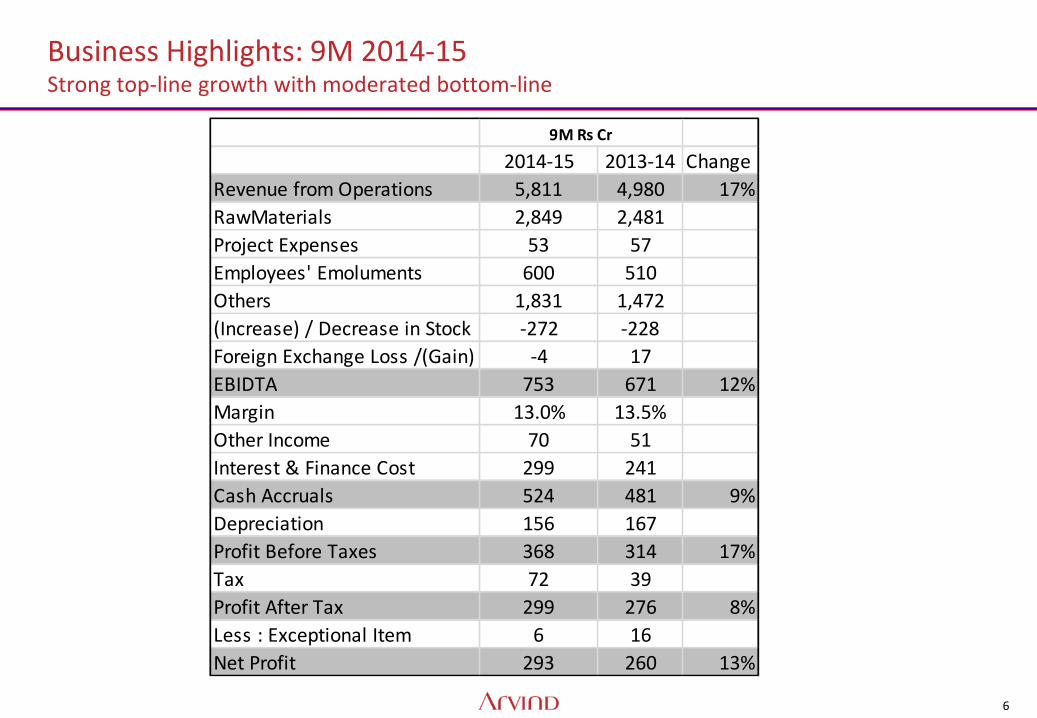
Business Highlights: 9M 2014-15 Strong top-line growth with moderated bottom-line
2014-15 2013-14 Change
Revenue from Operations 5,811 4,980 17%
RawMaterials 2,849 2,481
Project Expenses 53 57
Employees' Emoluments 600 510
Others 1,831 1,472
(Increase) / Decrease in Stock -272 -228
Foreign Exchange Loss /(Gain) -4 17
EBIDTA 753 671 12%
Margin 13.0% 13.5%
Other Income 70 51
Interest & Finance Cost 299 241
Cash Accruals 524 481 9%
Depreciation 156 167
Profit Before Taxes 368 314 17%
Tax 72 39
Profit After Tax 299 276 8%
Less : Exceptional Item 6 16
Net Profit 293 260 13%
9M Rs Cr

7
B & R Revenue growth moderate and Margin impacted due to weak festive season: Textile growth in line with expectation
Brands & Retail Textiles
EBITDA %, Q3 Vs LY
Revenue, Q3 Vs LY
0.02.5
5.07.5
10.0
Q3 13-14 Q3 14-15
7.0% 8.1%
EBITDA %
MM 3.4%, Other 8.5%
MM 7.4%, Other 9.0%
661544
0
500
1,000
Revenue, Rs Cr
22%
Q3 14-15 Q3 13-14
10
15
20
Q3 13-14
17.6%
EBITDA %
Q3 14-15
18.0%
1,2751,173
0
500
1,000
1,500
Revenue, Rs Cr 9%
Q3 14-15 Q3 13-14
9% volume growth in Woven
& 10% Volume growth in Denim
*Brands & Retail segment excludes figures of Arvind Internet Limited

8
Consolidated Balance Sheet, as at Dec 31st 2014
Rs Crs
31st
Dec'14
30th
Sept'14
Shareholders' Fund
Share Capital 258 258
Reserves and Surplus 2433 2328
Share application Money pending allotment0 0
Non Current Liabilities 1517 1462
Shortterm Borrowings 1828 1767
Current Liabilities 1827 1981
Minority Interest 34 33
Total 7897 7828
Assets
Fixed Assets 3243 3188
Non -Current Investment 57 57
Long Term Loans and Advances 607 624
Other Non Current Assets 7 8
Current Assets 3983 3951
Total 7897 7828
As at

9
Key Financial Ratios
2013-14 Q1 14-15 Q2 14-15 Q3 14-15 9M 14-15
EPS 14.4 3.5 3.7 4.3 11.4
Debt / Equity 1.16 1.28 1.34 1.34 1.34
Debt / EBIDTA 3.0 3.4 3.2 3.0 3.3
ROCE 13.5% 13.7% 14.5% 15.6% 14.0%
ROE 14.0% 14.3% 14.9% 16.6% 14.8%
Revenue Growth 30% 17% 14% 17% 17%
Current Ratio 2.3 2.1 2.3 2.6 2.6
Inventory Turn 4.2 3.9 4.0 4.4 4.1
Interest Cover 2.8 2.6 2.7 3.0 2.8
Asset Turn 1.2 1.2 1.0 1.1 1.0

10
Agenda
• Financial Performance: Consolidated
• Financial Performance: Standalone
• Business Analysis

11
Standalone Financial Performance Q3 14-15
2014-15 2013-14 Change
Revenue from Operations 1,330 1,205 10%
RawMaterials 563 553
Project Expenses 2 2
Employees' Emoluments 146 128
Others 432 343
(Increase) / Decrease in Stock -32 -19
Foreign Exchange Loss /(Gain) -2 -3
EBIDTA 222 201 11%
Margin 16.7% 16.7%
Other Income 22 17
Interest & Finance Cost 82 68
Cash Accruals 163 150 9%
Depreciation 31 40
Profit Before Taxes 132 110 20%
Tax 30 15
Profit After Tax 102 95 8%
Less : Exceptional Item 2 1
Net Profit 99 94 6%
Q3 Rs in Crs

12
Balance Sheet, as on 31st Dec 2014
31st
Dec'14
30th
Sept'14
Shareholders' Fund
Share Capital 258 258
Reserves and Surplus 2538 2441
Share application Money pending allotment0 0
Non Current Liabilities 1253 1257
Shortterm Borrowings 1435 1371
Current Liabilities 972 1001
Minority Interest
Total 6456 6329
Assets
Fixed Assets 2661 2615
Non -Current Investment 806 728
Long Term Loans and Advances 388 392
Other Non Current Assets 0 0
Current Assets 2601 2594
Total 6456 6329
As at
13
Agenda
• Financial Performance: Consolidated
• Financial Performance: Standalone
• Business Analysis
14
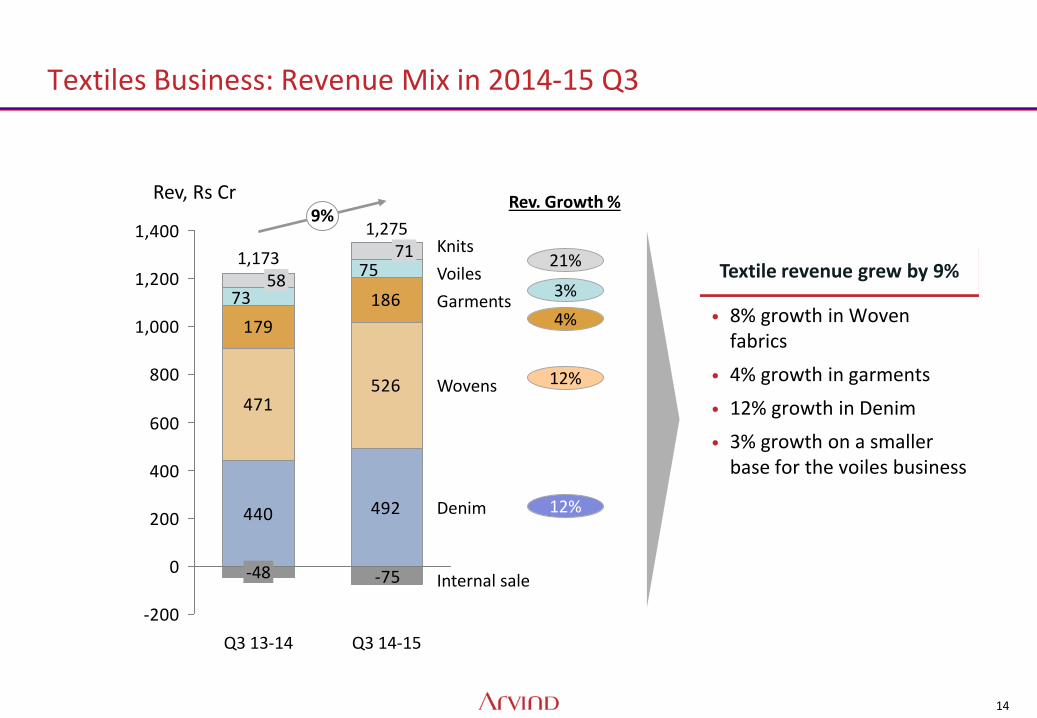
Textile revenue grew by 9%
Textiles Business: Revenue Mix in 2014-15 Q3
440 492
471526
179
186
-75
75
73
-200
0
200
400
600
800
1,000
1,200
1,4009%
Internal sale
Denim
Rev, Rs Cr
Garments
Knits
Wovens
Voiles
-48
1,173 58
71
Q3 13-14
1,275
Q3 14-15
• 8% growth in Woven fabrics
• 4% growth in garments
• 12% growth in Denim
• 3% growth on a smaller base for the voiles business
21%
3%
4%
12%
12%
Rev. Growth %

15
Volume growth: Denim volumes growth at 10%, while Wovens achieved 9% volume growth in Q3 14-15
29.827.3
0
10
20
30
9% Volume, Mn Mtrs
Q3 13-14 Q3 14-15
26.824.2
0
10
20
30
Q3 13-14 Q3 14-15
Volume, Mn Mtrs +10%
Denim Wovens (Shirting & Khaki)
Q3 comparison
Vs LY
83.577.0
0
50
100
9M 14-15
8% Volume, Mn Mtrs
9M 13-14
80.176.7
0
50
100
9M 14-15
+4%
9M 13-14
Volume, Mn Mtrs
9M comparison
Vs LY
16
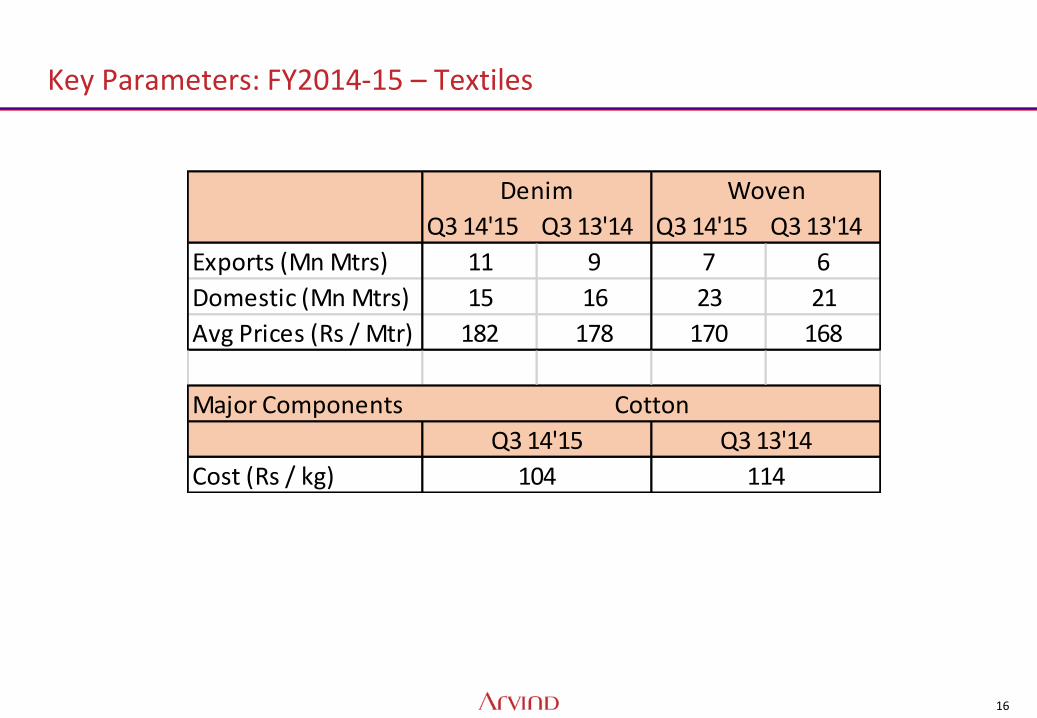
Key Parameters: FY2014-15 – Textiles
Q3 14'15 Q3 13'14 Q3 14'15 Q3 13'14
Exports (Mn Mtrs) 11 9 7 6
Domestic (Mn Mtrs) 15 16 23 21
Avg Prices (Rs / Mtr) 182 178 170 168
Major Components
Cost (Rs / kg)
Denim Woven
Cotton
Q3 14'15 Q3 13'14
104 114

17
Brands & Retail – Financial Performance: Q3 FY15 Revenue Growth of 22% despite subdued festive season
661544
0
200
400
600
800
Revenue, Rs Cr
22%
Q3 14-15 Q3 13-14
Strong revenue growth Key highlights
• Revenue growth of 22% achieved due to
31% revenue growth in Brands /other formats
3% revenue de-growth in Mega-Mart Retail
Like to Like growth
1.9% LTL growth in Brands
(-)2.3% LTL growth in Mega-Mart Retail
Margin lowered
Margin lowered from 8.1% in Q3 FY14 to 7% in Q3 FY 15
0
2
46
8
10
EBITDA %
Q3 14-15
7.0%
Q3 13-14
8.1% MM 3.4%, Other 8.5%
MM 7.4%, Other 9.0%
*Brands & Retail without Arvind InternetLimited

18
Performance of Power Brands
3748
0
30
60
0
5
10
15
Q3 FY14
12.8%
Q3 FY15
13.4%
EBITDA Rs Cr EBITDA %
360288
0
200
400
Q3 FY14 Q3 FY15
Revenues Rs Cr +25% Power brands
EBITDA Rs Cr EBITDA % Revenue Rs Cr
Q3 FY15 Vs Q3 FY14 YTD FY15 Vs YTD FY14
88 112
0306090
120
0
5
10
15
YTD FY14
EBITDA % EBITDA Rs Cr
11.4% 11.5%
YTD FY15
978776
0
500
1,000
YTD FY14
+26%
YTD FY15
Revenues Rs Cr
Note: 1. EOSS = ‘End of Season Sale’ period 2. Note: Tommy Hilfiger numbers reflect 50% Arvind share of the JV company

19
• Sales Increase in Key Account Counters: Growth of 27% in Q3 14-15
• ** 2014-15 figures include Calvin Klein
Brands & Retail Business – Distribution
Particulars Q4 2013-14 Q1 2014-15** Q2 2014-15** Q3 2014-15**
# Stores Sq ft # Stores Sq ft # Stores Sq ft # Stores Sq Ft
Brands 698 717,236 741 7,54,529 761 765,450 800 7,89,753
MM 166 744,785 158 7,96,467 146 806,143 145 8,42,078
Total 864 1462021 899 15,50,995 907 1,571,593 945 1,631,831
No of KA Exclusive Counters
692 810 819 923
20
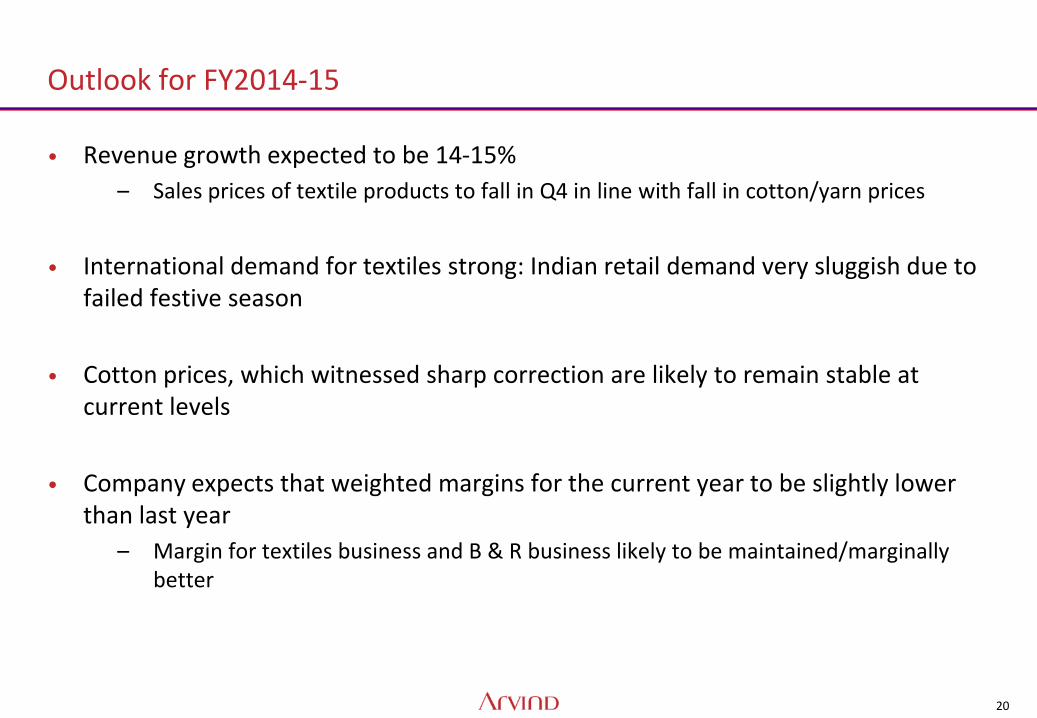
Outlook for FY2014-15
• Revenue growth expected to be 14-15%
– Sales prices of textile products to fall in Q4 in line with fall in cotton/yarn prices
• International demand for textiles strong: Indian retail demand very sluggish due to failed festive season
• Cotton prices, which witnessed sharp correction are likely to remain stable at current levels
• Company expects that weighted margins for the current year to be slightly lower than last year
– Margin for textiles business and B & R business likely to be maintained/marginally better
Thank You