performance of the belgian health system. report …...2012 kce report 196 s3 performance of the...
TRANSCRIPT

2012
KCE REPORT 196 S3
PERFORMANCE OF THE2012SUPPLEMENT S3 DETAILS ON LITERATUR
ERFORMANCE OF THE BELGIAN HEALTH SYSTEM
DETAILS ON LITERATURE SEARCHES AND SELEC
www.kce.fgov.be
YSTEM. REPORT
E SEARCHES AND SELECTION OF INDICATORS

2012
Belgian Health Care Knowledge Centre
The Belgian Health Care Knowledge Centre (KCE) is an organization of public interest, created on the 242002 under the supervision of the Minister of Public Health and Social Affairs. KCE is in charge of conducting studiesthat support the political decision making on health care and health insurance.
Executive BoardPresident
CEO - National Institute for Health and Disability Insurance (vicepresident)
President of the Federal Public Service Health, Food Chain Safety andEnvironment (vice president)
President of the Federal Public Service Social Security (vice president)
General Administrator of the Federal Agency for Medicines and HealthProducts
Representatives of the Minister of Public Health
Representatives of the Minister of Social Affairs
Representatives of
Intermutualistic Agency
Professional Organisations
Professional Organisations
Hospital Federations
Social Partners
House of Representatives
Belgian Health Care Knowledge Centre
The Belgian Health Care Knowledge Centre (KCE) is an organization of public interest, created on the 242002 under the supervision of the Minister of Public Health and Social Affairs. KCE is in charge of conducting studiesthat support the political decision making on health care and health insurance.
Actual Members
Pierre Gillet
National Institute for Health and Disability Insurance (vice Jo De Cock
President of the Federal Public Service Health, Food Chain Safety andEnvironment (vice president)
Dirk Cuypers
President of the Federal Public Service Social Security (vice president) Frank Van Massenhove
General Administrator of the Federal Agency for Medicines and Health Xavier De Cuyper
Representatives of the Minister of Public Health Bernard Lange
Marco Schetgen
Representatives of the Minister of Social Affairs Oliver de Stexhe
Ri De Ridder
Representatives of the Council of Ministers Jean-Noël Godin
Daniel Devos
Intermutualistic Agency Michiel Callens
Patrick Verertbruggen
Xavier Brenez
Professional Organisations - representatives of physicians Marc Moens
Jean-Pierre Baeyens
Professional Organisations - representatives of nurses Michel Foulon
Myriam Hubinon
Hospital Federations Johan Pauwels
Jean-Claude Praet
Rita Thys
Paul Palsterman
House of Representatives Lieve Wierinck
www.kce.fgov.be
The Belgian Health Care Knowledge Centre (KCE) is an organization of public interest, created on the 24th
of December2002 under the supervision of the Minister of Public Health and Social Affairs. KCE is in charge of conducting studies
Actual Members Substitute Members
Pierre Gillet
Jo De Cock Benoît Collin
Dirk Cuypers Chris Decoster
Frank Van Massenhove Jan Bertels
Xavier De Cuyper Greet Musch
Bernard Lange François Perl
Marco Schetgen Annick Poncé
Oliver de Stexhe Karel Vermeyen
Ri De Ridder Lambert Stamatakis
Noël Godin Frédéric Lernoux
Daniel Devos Bart Ooghe
Michiel Callens Frank De Smet
Patrick Verertbruggen Yolande Husden
Xavier Brenez Geert Messiaen
Marc Moens Roland Lemye
Pierre Baeyens Rita Cuypers
Michel Foulon Ludo Meyers
Myriam Hubinon Olivier Thonon
Johan Pauwels Katrien Kesteloot
Claude Praet Pierre Smiets
Leo Neels
Paul Palsterman Celien Van Moerkerke
Lieve Wierinck

2011
Control Government commissioner
Management ChiefAssistant Chief Executive Officer
Managers Program Management
Contact Belgian Health Care Knowledge Centre
Doorbuilding (10Boulevard du JardinB-1000 BrusselsBelgium
T +32 [0]2 287 33 88
F +32 [0]2 287 33 85
http://www.kce.fgov.be
Government commissioner Yves Roger
Chief Executive OfficerAssistant Chief Executive Officer
Raf MertensJean-Pierre Closon
Managers Program Management Christian LéonardKristel De Gauquier
Belgian Health Care Knowledge Centre (KCE)
Doorbuilding (10th
Floor)Boulevard du Jardin Botanique, 55
1000 BrusselsBelgium
T +32 [0]2 287 33 88
F +32 [0]2 287 33 85
http://www.kce.fgov.be
www.kce.fgov.be
Kristel De Gauquier


2012
KCE REPORT 196 S3
HEALTH SERVICES RESEARCH
PERFORMANCE OF THE B2012SUPPLEMENT S3 DETAILS ON LITERATURE SEARCH
FRANCE VRIJENS, FRANÇOISE RENARD, PASCALWALCKIERS, CÉCILE DUBOIS, CÉCILE CAMBERL
PERFORMANCE OF THE BELGIAN HEALTH SYSTEM
ON LITERATURE SEARCHES AND SELECTION OF
ÇOISE RENARD, PASCALE JONCKHEER, KOEN VAN DEN HEEDE, ANJA DESOMER, CARINE VAN DEBOIS, CÉCILE CAMBERLIN, JOAN VLAYEN, HERMAN VAN OYEN, CHRISTIAN LÉONARD, PASCAL
www.kce.fgov.be
ELGIAN HEALTH SYSTEM. REPORT
ES AND SELECTION OF INDICATORS
SOMER, CARINE VAN DE VOORDE, DENISEIAN LÉONARD, PASCAL MEEUS

COLOPHON
Title: Performance of the Belgian Health System. Report 2012and selection of indicators
Authors: France Vrijens (KCE), Françoise Renard (ISPAnja Desomer (KCE), Carine Van de Voorde (KCE), Denise Walckiers (ISPCamberlin (KCE), Joan Vlayen (KCE), Herman Van Oyen (WIV(INAMI
External experts: Health Promotion Group :Vlaanderen), Christian De Bock (Csanté Bruxelles), StephVlaanderen)
Mental Healthcare Group:Liefde), Pol Gerits (FOD Volksgezondheid– SPF Santé Publique), Bernard Jacob (SPF Santé publiqueLeuven), Jean
Continuity of Care and Patient Centeredness Group:Schowen), Xavier de Béthune (Artsenhuis), Anne Spinewine (UCL de Mont(Domus Medica), Johan Wens (UA)
Long term care Group:Leuven), Margareta Lambert (UZ Brussel), Jean Macq (UCL), Alex Peltier (MC), Luc Van Gorp (KatholiekeHogeschool Limburg), Isabelle Vanderbrempt (SPF Santé publique
End of Life Group:Menten (UZ L
Acknowledgements: Greet Haelterman (FOD VolksgezondheidSanté publique), MarieVolksgezondheidNicolas (SPF Santé publiqueSociale), Elke Van Hoof (KankercentrumFondation Registre du Cancer), Xavier Ledent (INAMI(VIGeZ), Sadja SteenhuizenViseur (ISPJohan Hellings (ICURO)
Performance of the Belgian Health System. Report 2012 — SUPPLEMENT Sand selection of indicators
France Vrijens (KCE), Françoise Renard (ISP – WIV), Pascale Jonckheer (KCE), Koen Van den Heede (KCE),Anja Desomer (KCE), Carine Van de Voorde (KCE), Denise Walckiers (ISPCamberlin (KCE), Joan Vlayen (KCE), Herman Van Oyen (WIV - ISP), Christian Léonard (KCE), Pascal Meeus(INAMI – RIZIV)
Health Promotion Group : Luc Berghmans (Observatoire de la santé du Hainaut), Lien Braeckevelt (WVGVlaanderen), Christian De Bock (CM), Léa Maes (UGent), Myriam De Spiegelaere (ULBsanté Bruxelles), Stephan Van Den Broucke (UCL), Chantal Vandoorne (ULg), Alexander Witpas (WVGVlaanderen)
Mental Healthcare Group: Joël Boydens (CM), Robert Cools (CGG - De Pont), Raf De Rycke (Broeders vanLiefde), Pol Gerits (FOD Volksgezondheid – SPF Santé Publique), Jean-Pierre Gorissen (FOD Volksgezondheid
SPF Santé Publique), Bernard Jacob (SPF Santé publique – FOD Volksgezondheid), Gert PeeLeuven), Jean-Paul Roussaux (Cliniques Universitaires St-Luc)
Continuity of Care and Patient Centeredness Group: Corinne Boüüaert (Maison Médicale Bautista VaSchowen), Xavier de Béthune (CM), Veerle Foulon (KU Leuven), Mirco Petrovic (UZ Gent),Artsenhuis), Anne Spinewine (UCL de Mont-Godinne), Johan Van der Heyden (WIV(Domus Medica), Johan Wens (UA)
Long term care Group: Daniel Crabbe (RIZIV – INAMI), Jan Delepeleire (KULeuven), Margareta Lambert (UZ Brussel), Jean Macq (UCL), Alex Peltier (MC), Luc Van Gorp (KatholiekeHogeschool Limburg), Isabelle Vanderbrempt (SPF Santé publique – FOD Volksgezondheid )
End of Life Group: Joachim Cohen (VUB), Marianne Desmedt (UCL), Rita Goetschalckx (RIMenten (UZ Leuven), Kathleen Kleemans (VUB), Birgit Gielen (CM)
Greet Haelterman (FOD Volksgezondheid - SPF Santé publique), Willem Alvoet (FOD VolksgezondheidSanté publique), Marie-Noëlle Verhaegen (FOD Volksgezondheid - SPF Santé publique ), Hans Verrept (FODVolksgezondheid - SPF Santé publique ), Isabelle Coune (SPF Santé publiqueNicolas (SPF Santé publique – FOD Volksgezondheid), Dirk Moens (FOD Sociale ZekeSociale), Elke Van Hoof (Kankercentrum – Centre Cancer), Elisabeth Van Eycken (Stichting KankerregisterFondation Registre du Cancer), Xavier Ledent (INAMI – RIZIV), Pierre Bonte (INAMI(VIGeZ), Sadja Steenhuizen (VIGeZ), Stefaan Demarest (WIV – ISP), Béatrice Jans (ISPViseur (ISP – WIV), Viviane Van Casteren (WIV – ISP), Nathalie Bossuyt (Johan Hellings (ICURO)
SUPPLEMENT S3 Details on literature searches
nckheer (KCE), Koen Van den Heede (KCE),Anja Desomer (KCE), Carine Van de Voorde (KCE), Denise Walckiers (ISP – WIV), Cécile Dubois (KCE), Cécile
ISP), Christian Léonard (KCE), Pascal Meeus
Luc Berghmans (Observatoire de la santé du Hainaut), Lien Braeckevelt (WVG), Léa Maes (UGent), Myriam De Spiegelaere (ULB – Observatoire de la
an Van Den Broucke (UCL), Chantal Vandoorne (ULg), Alexander Witpas (WVG
De Pont), Raf De Rycke (Broeders vanPierre Gorissen (FOD Volksgezondheid
FOD Volksgezondheid), Gert Peeters (UZ
Corinne Boüüaert (Maison Médicale Bautista VanLeuven), Mirco Petrovic (UZ Gent), Luc Seuntjens (het
ne), Johan Van der Heyden (WIV - ISP), Annelies Van Linden
INAMI), Jan Delepeleire (KU Leuven), Johan Flaming (UZLeuven), Margareta Lambert (UZ Brussel), Jean Macq (UCL), Alex Peltier (MC), Luc Van Gorp (Katholieke
FOD Volksgezondheid )
ta Goetschalckx (RIZIV – INAMI), Johan
SPF Santé publique), Willem Alvoet (FOD Volksgezondheid - SPFSPF Santé publique ), Hans Verrept (FOD
SPF Santé publique ), Isabelle Coune (SPF Santé publique - FOD Volksgezondheid), LucFOD Volksgezondheid), Dirk Moens (FOD Sociale Zekerheid – SPF Sécurité
Centre Cancer), Elisabeth Van Eycken (Stichting Kankerregister –RIZIV), Pierre Bonte (INAMI – RIZIV), Olaf Moens
ISP), Béatrice Jans (ISP – WIV), Natacha), Nathalie Bossuyt (WIV – ISP), Xavier de Béthune (MC),

External validators: Ann-(Academisch Medisch Centrum
Stakeholders: The following administrations and public institutions have been consultedat the federal level (Institute of Public Health), and at the regional level: Community and Dutch RegionGezondheid), de Federatie Wallonië(DGOV Ministerium der Deutschsprachigen Gemeinschaft), het Waalse Gewest (Direction généraleopérationelle des Pouvoirs locaux, de l’Brussels Hoofdstedelijk Gewest (Observatorium voor de Gezondheid)
Conflict of interest: Any other direct or indirect relationship with a producer, distributor or healthcare institutiointerpretedLeuven), Joël Boydens (MC
Layout: Ine Verhulst, Sophie Vaes
Disclaimer: Thecomments were discussed during meetings. They did not conecessarily agree with its content.
Subsequently, a (final) versfrom a consensus or a voting process between the validators. The validators did not coscientific report and did not necessarily all three agree with its content.
Finally,
Only the KCE is responsible for errors or omissions that could persist. The policy recommendationsare also under the full responsibility of the KCE.
Publication date: 25 January
Domain: Health Services Research (HSR)
MeSH: Delivery of Health CareOrganizational, Healthcare Disparities, Social Justice; Benchmarking, Belgium
NLM Classification: W84
Language: English
Format: Adobe® PDF™ (A4)
Legal depot: D/201
-Lise Guisset (WHO), Irene Papanicolas (London School of Economics and Political Science), Niek Klazinga(Academisch Medisch Centrum – Universiteit van Amsterdam)
The following administrations and public institutions have been consultedat the federal level (Federal Public Service Public Health, Federal Public Service Social Affairs, NIHDI, ScientificInstitute of Public Health), and at the regional level: Community and Dutch RegionGezondheid), de Federatie Wallonië-Brussel (Direction générale de la Santé), de Duitstalige Gemeenschap(DGOV Ministerium der Deutschsprachigen Gemeinschaft), het Waalse Gewest (Direction généraleopérationelle des Pouvoirs locaux, de l’Action sociale et de la Santé et observatoire wallon de la santé), hetBrussels Hoofdstedelijk Gewest (Observatorium voor de Gezondheid)
Any other direct or indirect relationship with a producer, distributor or healthcare institutiointerpreted as a conflict of interests: Gert Peeters (UZ Leuven - UPC) (Administratief manager van het UPCLeuven), Joël Boydens (MC ; Groep Emmaüs vzw – lid bestuurscomité)
Ine Verhulst, Sophie Vaes
The external experts were consulted about a (preliminary) version of the scientific report. Theircomments were discussed during meetings. They did not co-author the scientific report and did notnecessarily agree with its content.
Subsequently, a (final) version was submitted to the validators. The validation of the report resultsfrom a consensus or a voting process between the validators. The validators did not coscientific report and did not necessarily all three agree with its content.
Finally, this report has been approved by common assent by the Executive Board.
Only the KCE is responsible for errors or omissions that could persist. The policy recommendationsare also under the full responsibility of the KCE.
25 January 2013
Health Services Research (HSR)
Delivery of Health Care, Health Promotion; Health Services Accessibility, Quality of Health Care, Efficiency,Organizational, Healthcare Disparities, Social Justice; Benchmarking, Belgium
English
Adobe® PDF™ (A4)
D/2012/10.273/117
Lise Guisset (WHO), Irene Papanicolas (London School of Economics and Political Science), Niek Klazinga
The following administrations and public institutions have been consulted throughout the duration of the project :Federal Public Service Public Health, Federal Public Service Social Affairs, NIHDI, Scientific
Institute of Public Health), and at the regional level: Community and Dutch Region (Vlaams Agentschap Zorg enBrussel (Direction générale de la Santé), de Duitstalige Gemeenschap
(DGOV Ministerium der Deutschsprachigen Gemeinschaft), het Waalse Gewest (Direction généraleAction sociale et de la Santé et observatoire wallon de la santé), het
Any other direct or indirect relationship with a producer, distributor or healthcare institution that could beUPC) (Administratief manager van het UPC – UZ
external experts were consulted about a (preliminary) version of the scientific report. Theirauthor the scientific report and did not
ion was submitted to the validators. The validation of the report resultsfrom a consensus or a voting process between the validators. The validators did not co -author thescientific report and did not necessarily all three agree with its content.
by the Executive Board.
Only the KCE is responsible for errors or omissions that could persist. The policy recommendations
, Health Promotion; Health Services Accessibility, Quality of Health Care, Efficiency,Organizational, Healthcare Disparities, Social Justice; Benchmarking, Belgium

Copyright: KCE reports are published under a “by/nc/nd” Creative Commons Licencehttp://kce.fgov.be/content/about
How to refer to this document? Vrijens F, Renard F, Jonckheer P, Van den Heede K, Desomer A, Van de Voorde C, Walckiers D, Dubois C,Camberlin C, Vlayen J, Van Oyen H, Léonard C, Meeus P.2012KCE Report
This document is available on the website of the Belgian Health Care Knowledge Centre
KCE reports are published under a “by/nc/nd” Creative Commons Licencehttp://kce.fgov.be/content/about-copyrights-for-kce-reports
Vrijens F, Renard F, Jonckheer P, Van den Heede K, Desomer A, Van de Voorde C, Walckiers D, Dubois C,Camberlin C, Vlayen J, Van Oyen H, Léonard C, Meeus P. Performance of the Belgian Health System. Report2012. Health Services Research (HSR). Bruxelles: Centre Fédéral d’Expertise des Soins de Santé (KCE). 2012.KCE Report 196C. D/2012/10.273/117.
This document is available on the website of the Belgian Health Care Knowledge Centre
KCE reports are published under a “by/nc/nd” Creative Commons Licence
Vrijens F, Renard F, Jonckheer P, Van den Heede K, Desomer A, Van de Voorde C, Walckiers D, Dubois C,Performance of the Belgian Health System. Report
s: Centre Fédéral d’Expertise des Soins de Santé (KCE). 2012.
This document is available on the website of the Belgian Health Care Knowledge Centre .
KCE Report 196S3
SUPPLEMENT S3
TABLE OF CONTENTS
INTRODUCTION
1.
1.1.
1.2.
2.
2.1.
2.2.
2.3.
2.4.
2.5.
3.
3.1.
3.2.
4.
Health System Performance Report 2012
SUPPLEMENT S3................................................................ ................................
PART 1: INDICATORS IN MENTAL HEALTHCARE................................
INTRODUCTION ................................................................................................
1. METHODS................................................................................................
1.1. LONG-LIST OF MENTAL HEALTH PERFORMANCE INDICATORS: A REVIEW OF TH................................................................................................ ................................
1.1.1. Search Strategy: ................................................................
1.1.2. In- and exclusion criteria: ................................................................
1.1.3. Data extraction: ................................................................
1.2. SHORTLIST OF MENTAL HEALTH PERFORMANCE INDICATORS: EXPERT OP
2. RESULTS................................................................................................
2.1. SEARCH RESULTS ................................................................ ................................
2.2. INDICATORS EXTRACTED FROM THE LITERATURE ................................
2.3. PRE-SELECTION BASED ON EXPERT OPINION ................................
2.4. INTERMEDIATE SELECTION DURING FIRST EXPERT MEETING
2.5. FINAL SELECTION DURING SECOND EXPERT MEETING ................................
3. SEARCH STRATEGY:................................................................
3.1. SEARCH FOR REVIEWS: ................................................................
3.1.1. MEDLINE-OVID ................................................................
3.1.2. PSYCHINFO-OVID ................................................................
3.1.3. EMBASE ................................................................................................
3.2. SEARCH FOR STUDIES PUBLISHED SINCE 2008: ................................
3.2.1. MEDLINE-OVID ................................................................
3.2.2. EMBASE ................................................................................................
4. REFERENCES ................................................................ ................................
PART 2: INDICATORS IN HEALTH PROMOTION................................
1
................................................................. 1
........................................................................... 4
................................................................................. 4
............................................................................. 5
TORS: A REVIEW OF THE LITERATURE............................................................... 5
..................................................................................... 5
........................................................................ 5
....................................................................................... 5
NDICATORS: EXPERT OPINION ................ 5
.............................................................................. 7
.............................................................. 7
...................................................................... 7
.............................................................................. 9
RT MEETING................................................. 39
............................................................ 48
........................................................................................ 55
.................................................................................. 55
.................................................................................... 55
............................................................................... 56
............................................................... 57
......................................................................... 58
.................................................................................... 58
............................................................... 59
.................................................................... 60
............................................................................ 65

2
INTRODUCTION
1.
2.
2.1.
2.2.
3.
3.1.
3.2.
4.
INTRODUCTION
CONTINUITY OF CARE
PATIENT
1.
2.
3.
3.1.
3.2.
3.3.
3.4.
3.5.
4.
Health System Performance Report 2012
INTRODUCTION ................................................................................................
1. OBJECTIVES................................................................ ................................
2. METHODS................................................................................................
2.1. PHASE 1: PRODUCING OF A “LONG LIST” OF POTENTIAL INDICATORSSOURCES................................................................................................
2.1.1. Sources of indicators................................................................
2.1.2. Classification of the indicators................................................................
2.1.3. The Nutbeam ‘framework................................................................
2.2. PHASE 2: REDUCING THE LIST THROUGH AN ITERATIVE FILTERING
3. RESULTS................................................................................................
3.1. RESULTS FROM THE LITERATURE REVIEW ................................
3.2. RESULTS FROM THE SELECTION PROCESS OF INDICATORS
4. REFERENCES ................................................................ ................................
PART 3: INDICATORS IN CONTINUITY OF CARE AND PATIENT CENTERED
INTRODUCTION ................................................................................................
CONTINUITY OF CARE ................................................................................................
PATIENT-CENTEREDNESS................................................................ ................................
1. OBJECTIVES................................................................ ................................
2. METHODS................................................................................................
3. RESULTS................................................................................................
3.1. INDICATORS EXTRACTED FROM THE LITERATURE REVIEW
3.2. CONTINUITY................................................................................................
3.3. CENTEREDNESS ................................................................ ................................
3.3.1. Selected indicators................................................................
3.4. CONTINUITY AND PATIENT-CENTRED CARE : SEARCH STRATEGY
3.4.1. OVID MEDLINE for continuity of care ................................
3.4.2. OVID MEDLINE for patient-centered care ................................
3.4.3. Embase for continuity of care and patient-centered care
3.5. CONTINUITY AND PATIENT-CENTRED CARE : LONG LIST OF INDICATORS
4. REFERENCES ................................................................ ................................
KCE Report 196S3
............................................................................... 65
...................................................................... 66
........................................................................... 66
OTENTIAL INDICATORS FROM VARIOUS........................................................................... 66
............................................................................. 66
............................................................... 66
...................................................................... 67
ERATIVE FILTERING ...................................... 67
............................................................................ 67
................................................................................. 67
ROCESS OF INDICATORS................................................... 68
.................................................................... 88
AND PATIENT CENTEREDNESS.................. 96
............................................................................... 96
.................................................................... 96
............................................................. 97
...................................................................... 98
........................................................................... 98
............................................................................ 99
REVIEW..................................................... 99
....................................................................... 99
............................................................. 100
.............................................................................. 102
H STRATEGY ....................................... 104
................................................................................. 104
.......................................................................... 106
centered care ................................................... 108
LIST OF INDICATORS........................... 109
.................................................................. 198

KCE Report 196S3
LIST OF TABLES Table 1 Performance dimensions covered in long
Table 2 Performance dimensions covered in list after pre
Table 3 Pre
Table 4 Indicators excluded in
Table 5 Intermediate selection after 1st expert meeting
Table 6 Results rating 48 indicators by the experts
Table 7 Selected indicators for the dimension continuity
Table 8 Selected indicators for the dimension centeredness
Table 9. Indicators of continuity/coordination
Table 10. Indicators of patient
Health System Performance Report 2012
Table 1 Performance dimensions covered in long-list ................................
Table 2 Performance dimensions covered in list after pre-selection ................................
Table 3 Pre-selected indicators (1st
draft shortlist) ................................................................
Table 4 Indicators excluded in the pre-selection process................................
Table 5 Intermediate selection after 1st expert meeting ................................
Table 6 Results rating 48 indicators by the experts ................................................................
Table 7 Selected indicators for the dimension continuity ................................
Table 8 Selected indicators for the dimension centeredness ................................
Table 9. Indicators of continuity/coordination ................................................................
Table 10. Indicators of patient-centeredness................................................................
3
......................................................................................... 8
................................................................... 9
............................................................ 10
.................................................................................. 13
.................................................................................... 40
........................................................... 48
................................................................................ 102
.......................................................................... 103
.................................................................. 109
................................................................... 151

4
PART 1: INDICATORS IMENTAL HEALTHCARE
Health System Performance Report 2012
PART 1: INDICATORS INMENTAL HEALTHCARE
INTRODUCTIONSince the 1990’s mental health has become a policy priority in mostWestern industrialized countries
1. The WHO, after all, estimates that
mental health problems account for approximately 20% of the total diseaseburden in the European region and that one in four people at some time inlife are affected
a. Significant reforms i
services, characterized by a strong detaken place in many Western countries during the last decennia of the 20thcentury. This movement emphasized the need to reintegrate mentallydisordered persons in the society by shifting from large psychiatrichospitals towards alternative services in the community.beginning of the 21st century, the “balanced care” model is graduallygaining influence on mental health care organization. This model impliesthat community services should be offered whenever possible, but hospitalservices should be available if ambulatory care cannot provide a goodanswer to the patient’s needs. To facilitate smooth transition from oneservice to another many countries currently experiment on how to developintegrated care, care coordination and continu
The substantial burden of mental illness and the recent reforms in theorganization of mental health services highlight the importance of theevaluation of performance within this domain. Nevertheless, with theexception of “alcohol consumption” no indicators relevant to the mentalhealth domain were included in the first set of indicato measure the performance of the Belgian healthcare system.
The present study aims to fill this gap. Indraft a long-list of mental health performance indicators based on a reviewof the literature. Next, based on expert opinion this list of indicators will bereduced to a shortlist of indicators which will be tested, measinterpreted. Finally, a selection of ‘mental health indicators’ will beintegrated in the general set of indicators that aim to measure theperformance of the Belgian healthcare system.
ahttp://www.euro.who.int/en/what-
diseases/mental-health
KCE Report 196S3
Since the 1990’s mental health has become a policy priority in most. The WHO, after all, estimates that
mental health problems account for approximately 20% of the total diseaseburden in the European region and that one in four people at some time in
. Significant reforms in the delivery of mental healthservices, characterized by a strong de-institutionalization movement, havetaken place in many Western countries during the last decennia of the 20thcentury. This movement emphasized the need to reintegrate mentally
red persons in the society by shifting from large psychiatrichospitals towards alternative services in the community.
2Since the
beginning of the 21st century, the “balanced care” model is graduallygaining influence on mental health care organization. This model impliesthat community services should be offered whenever possible, but hospital
ces should be available if ambulatory care cannot provide a goodanswer to the patient’s needs. To facilitate smooth transition from oneservice to another many countries currently experiment on how to developintegrated care, care coordination and continuity of care.
2
The substantial burden of mental illness and the recent reforms in theon of mental health services highlight the importance of the
evaluation of performance within this domain. Nevertheless, with theexception of “alcohol consumption” no indicators relevant to the mentalhealth domain were included in the first set of indicators that was compiledto measure the performance of the Belgian healthcare system.
3
The present study aims to fill this gap. In first instance, the objective is tolist of mental health performance indicators based on a review
of the literature. Next, based on expert opinion this list of indicators will bereduced to a shortlist of indicators which will be tested, measured andinterpreted. Finally, a selection of ‘mental health indicators’ will beintegrated in the general set of indicators that aim to measure theperformance of the Belgian healthcare system.
-we-do/health-topics/noncommunicable-

KCE Report 196S3
1. METHODS
1.1. Long-list of mental health performance indicators: areview of the literature
1.1.1. Search Strategy:
The literature review, conducted between April 2011 and June 2011, isbased on Ovid Medline, PsychINFO and EMBASE. Language wasrestricted to English, Dutch and French.
The search was, in a first step, limited to (see appendix 1strings) review articles published since 2000. In aadditional search was performed (starting from 2008) to search for primarystudies published later than the time frame covered by the includedliterature reviews (see appendix 1 for search strings). Afocused, on grey literature by a targeted search of websites frominternational organizations (WHO, OECD, Common Wealth Fund,European Commission) and a specific search in google for a selection ofcountries (Australia, Canada, New Zealand, Scotland, UK). This selectionof countries was based on a pre-assessment of the literature. In astep, the reference lists were screened for original sources.
1.1.2. In- and exclusion criteria:
The following inclusion criteria, based on a study of Spaethused:
The initiative must have indicators related to mental healthsubstance abuse;
These indicators ideally should:
o Be able to be precisely defined with a numerator and denominatorthat is populated by data (in case of reviews going back to thesource article maybe necessary);
o Measure performance (as defined by Vlayen et al.Efficiency, Sustainability, Quality: effectiveness, appropriateness,safety, patient-centeredness, continuity);
Health System Performance Report 2012
list of mental health performance indicators: a
The literature review, conducted between April 2011 and June 2011, isbased on Ovid Medline, PsychINFO and EMBASE. Language was
(see appendix 1 for searchstrings) review articles published since 2000. In a second step, anadditional search was performed (starting from 2008) to search for primarystudies published later than the time frame covered by the included
for search strings). A third stepfocused, on grey literature by a targeted search of websites frominternational organizations (WHO, OECD, Common Wealth Fund,European Commission) and a specific search in google for a selection of
ies (Australia, Canada, New Zealand, Scotland, UK). This selectionassessment of the literature. In a fourth
the reference lists were screened for original sources.
criteria, based on a study of Spaeth-Ruble4, were
The initiative must have indicators related to mental health and (or)
Be able to be precisely defined with a numerator and denominatorthat is populated by data (in case of reviews going back to the
Vlayen et al.3: Accessibility,
Efficiency, Sustainability, Quality: effectiveness, appropriateness,continuity);
o These indicators must have a national or regional level focus orotherwise be used to assess performance among organizations orproviders.
Publications with a presentation of just clinical outcome measureswhich were not used as part of perfoexcluded.
1.1.3. Data extraction:
The information that resulted from the included studies was tabulated. Theoperational indicator definitions (e.g. Number of deaths due to suicide inthe general population) were extracted from the publicper indicator theme (e.g. suicide). Per theme the scope (e.g. generic,disease specific) and dimension of performance measurement (i.e.Accessibility, Efficiency, Sustainability, Quality: effectiveness,appropriateness, safety, patient-centeredness, continuity) was indicated.
1.2. Shortlist of mental health performance indicators: expertopinion
The long-list of indicators was submitted to a selection of 7 members withinthe research team (Appendix 2) with a general expertise in measuringhealth systems performance. Each expert was asked to submit the 25most relevant indicator themes. Indicators that appeared at least threetimes in a top 25 were included in a first draft of shortlist.
The shortlist was submitted to a panel of experts with aexpertise in the field of Mental Health (cf. Appendix 3). The panelconvened and was asked to:
Indicate publications (if any) that were missed during the literaturesearch;
Review the pre-selection of indicators made by the experts of theresearch team.
5
These indicators must have a national or regional level focus orotherwise be used to assess performance among organizations or
resentation of just clinical outcome measureswhich were not used as part of performance measurement were
The information that resulted from the included studies was tabulated. Theoperational indicator definitions (e.g. Number of deaths due to suicide inthe general population) were extracted from the publications and groupedper indicator theme (e.g. suicide). Per theme the scope (e.g. generic,disease specific) and dimension of performance measurement (i.e.Accessibility, Efficiency, Sustainability, Quality: effectiveness,
enteredness, continuity) was indicated.
Shortlist of mental health performance indicators: expert
list of indicators was submitted to a selection of 7 members withinteam (Appendix 2) with a general expertise in measuring
lth systems performance. Each expert was asked to submit the 25most relevant indicator themes. Indicators that appeared at least threetimes in a top 25 were included in a first draft of shortlist.
The shortlist was submitted to a panel of experts with a recognizedexpertise in the field of Mental Health (cf. Appendix 3). The panel
Indicate publications (if any) that were missed during the literature
selection of indicators made by the experts of the
6
Based on suggestions of the experts indicator themes that were initiallyexcluded from the long-list were again added to the shortlist. In addition,the experts suggested which operational definition was most relevant forthe indicator theme (if more than 1 operational definition was available). Inaddition, experts were asked to indicate which indicator themes from theshortlist were redundant. This resulted in a revised shortlist of indicatorthemes with one operational definition per indicator
Health System Performance Report 2012
Based on suggestions of the experts indicator themes that were initiallylist were again added to the shortlist. In addition,
the experts suggested which operational definition was most relevant formore than 1 operational definition was available). In
addition, experts were asked to indicate which indicator themes from theshortlist were redundant. This resulted in a revised shortlist of indicatorthemes with one operational definition per indicator theme.
This revised shortlist was submitted to all experts prior to a secondmeeting. Each expert was asked to score content validity, reliability,relevance/importance, interpretability, actionability on a 9scale from 1 (strongly disagree) to 9 (strongly agree). The results (medianand mean scores) of this rating were presented on a second meeting. Tofacilitate the discussion indicators were grouped thematically. Within eachthematic group, indicators were sorted according to the meanscores (from high to low). In addition, a colour code was assigned to eachcell (from dark green for scores ≥8 to dark red for scores <5.5).
KCE Report 196S3
This revised shortlist was submitted to all experts prior to a secondmeeting. Each expert was asked to score content validity, reliability,relevance/importance, interpretability, actionability on a 9-point Likert type
gree) to 9 (strongly agree). The results (medianand mean scores) of this rating were presented on a second meeting. Tofacilitate the discussion indicators were grouped thematically. Within eachthematic group, indicators were sorted according to the mean relevancescores (from high to low). In addition, a colour code was assigned to each
≥8 to dark red for scores <5.5).

KCE Report 196S3
2. RESULTS
2.1. Search results
The first step of the search identified 10 articles published since 2000:
4 reviews5-8
. The most recent review is from Baars et al,2010. This review includes 23 studies published up to October 2007
1 overview article of initiatives (up to 2010) in 12 different countries.
6 articles reviewing initiatives in specific countries (i.e. GermanyAustralia
10; Scotland
11; US
12and Japan
13).
The second step of the search (update since 2008) yielded 9 additionalstudies
14-22.
138 articles
Excluded after reading title and abstract
N=113
25 articles
Excluded after reading
N=15
10 articles
Health System Performance Report 2012
of the search identified 10 articles published since 2000:
. The most recent review is from Baars et al,5
published in2010. This review includes 23 studies published up to October 2007.
1 overview article of initiatives (up to 2010) in 12 different countries.4
6 articles reviewing initiatives in specific countries (i.e. Germany9;
of the search (update since 2008) yielded 9 additional
The third step of the search (grey literature) resulted in 13 references.
The fourth step (screening references included studies) resulted in 27additional publications.
36-61
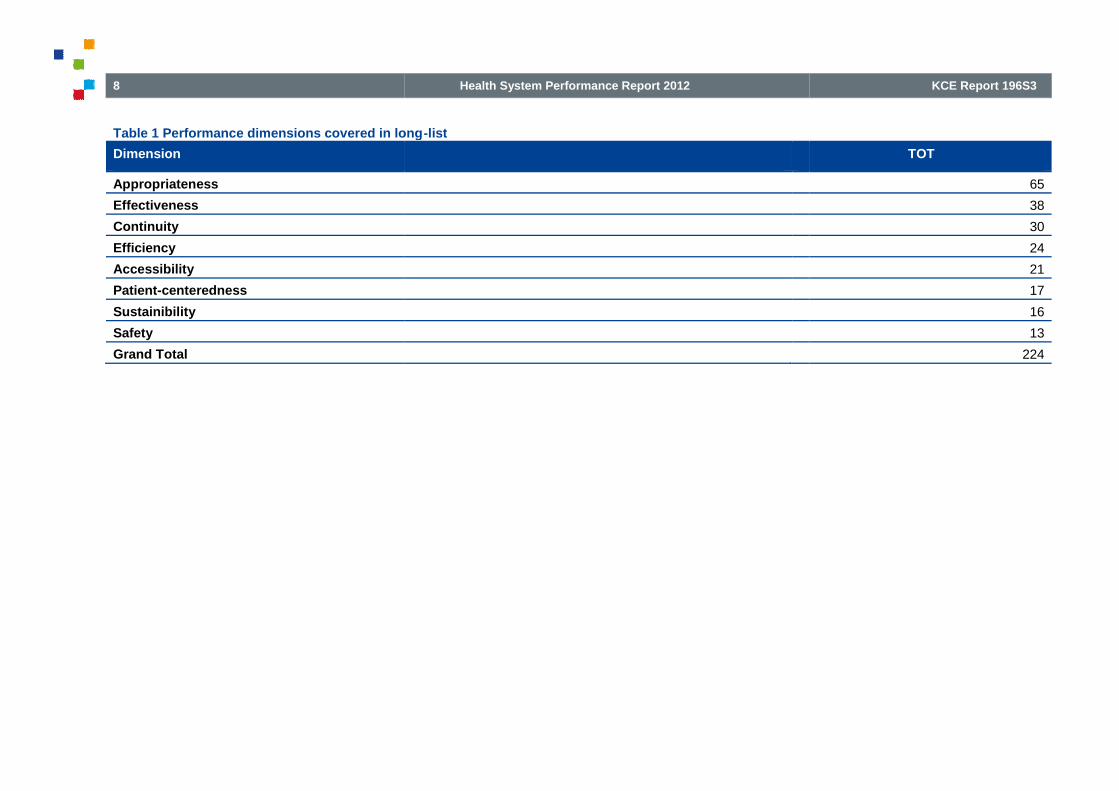
2.2. Indicators extracted from the literatureA total of 224 ‘indicator themes’ with multiple operational definitions wereextracted from the literature. All dimensions of performance were covered(Table 1)
.
Excluded after reading title and abstract:
N=113
Excluded after reading whole article
N=15
507 articles
39 articles
9 articles
7
of the search (grey literature) resulted in 13 references.23-35
(screening references included studies) resulted in 27
Indicators extracted from the literaturewith multiple operational definitions were
extracted from the literature. All dimensions of performance were covered
Excluded after reading title and abstract:
N=468
Excluded after reading whole article
N=30
8
Table 1 Performance dimensions covered in long
Dimension
Appropriateness
Effectiveness
Continuity
Efficiency
Accessibility
Patient-centeredness
Sustainibility
Safety
Grand Total
Health System Performance Report 2012
Performance dimensions covered in long-list
KCE Report 196S3
TOT
65
38
30
24
21
17
16
13
224

KCE Report 196S3
Most indicators (n=158) covered generic themes. Indicators coveringspecific target groups can be listed as follows:
Substance-abuse (n=16);
Depression (n=13);
Schizophrenia (n=10);
Children and adolescents (n=7);
Bipolar disorders (n=5);
Post-traumatic stress (n=4)
ADHD (n=3);
Dementia (n=2);
Psychotic disorders (n=2);
Borderline (n=1);
Electro Convulsion Therapy (n=1);
Homeless people (n=1);
Learning disabilities (n=1).
2.3. Pre-selection based on expert opinionSeven experts with an expertise in performance indicators submitted eachtheir top 25 of most relevant indicators. One indicator appeared in the top25 of 6 respondents; 4 indicators were scored by 4 respondents; 6indicators by 5 respondents; 9 indicators by 3 respondents; 26 indicatorsby 2 respondents; 44 indicators by 1 respondent and 134 appeared in nonof the submitted top 25’s.
Health System Performance Report 2012
Most indicators (n=158) covered generic themes. Indicators covering
selection based on expert opinionSeven experts with an expertise in performance indicators submitted eachtheir top 25 of most relevant indicators. One indicator appeared in the top
nts; 4 indicators were scored by 4 respondents; 6indicators by 5 respondents; 9 indicators by 3 respondents; 26 indicatorsby 2 respondents; 44 indicators by 1 respondent and 134 appeared in non
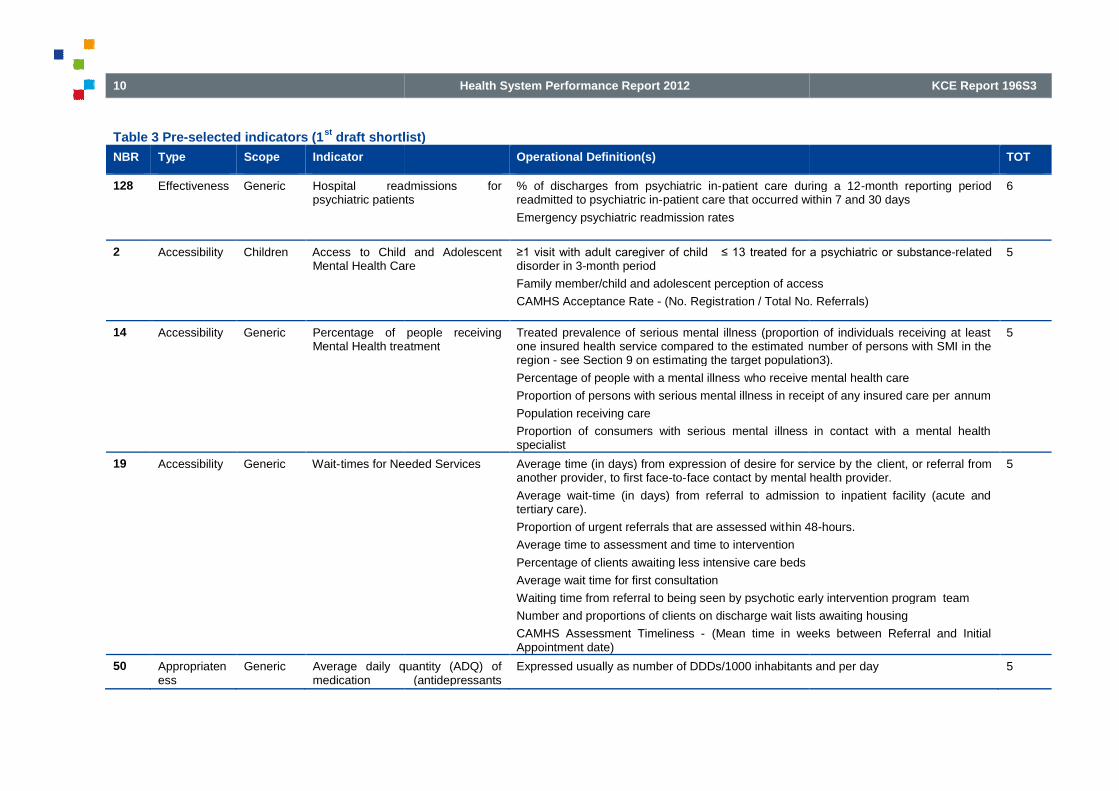
Based on the threshold of ‘at least 3 respondents placed the indicator intheir top-25’ the list of 224 indicators was divided in a first draft of “shortlist”including 20 indicators (Table 3) and a list of 204 indicators that wereexcluded(Table 4).
The shortlist covered 17 generic indicators, 1 indicator specific for children,1 for depression and 1 for substance
Except, for patient-centeredness, all dimensions of performancemeasurement contained at least 1 indicator (
Table 2 Performance dimensions covered in list after pre
Type
Effectiveness
Accessibility
Sustainability
Appropriateness
Continuity
Efficiency
Safety
Patient-centeredness
Grand Total
9
st 3 respondents placed the indicator in25’ the list of 224 indicators was divided in a first draft of “shortlist”
) and a list of 204 indicators that were
The shortlist covered 17 generic indicators, 1 indicator specific for children,and 1 for substance-abuse.
centeredness, all dimensions of performancemeasurement contained at least 1 indicator (Table 2).
formance dimensions covered in list after pre-selection
TOT
8
4
4
1
1
1
1
0
20
10
Table 3 Pre-selected indicators (1st
draft shortlist)
NBR Type Scope Indicator
128 Effectiveness Generic Hospital readmissions forpsychiatric patients
2 Accessibility Children Access to Child and AdolescentMental Health Care
14 Accessibility Generic Percentage of people receivingMental Health treatment
19 Accessibility Generic Wait-times for Needed Services
50 Appropriateness
Generic Average daily quantity (ADQ) ofmedication (antidepressants
Health System Performance Report 2012
draft shortlist)
Operational Definition(s)
Hospital readmissions forpsychiatric patients
% of discharges from psychiatric in-patient care during a 12readmitted to psychiatric in-patient care that occurred within 7 and 30 days
Emergency psychiatric readmission rates
to Child and AdolescentMental Health Care
≥1 visit with adult caregiver of child ≤ 13 treated for a psychiatric or substancedisorder in 3-month period
Family member/child and adolescent perception of access
CAMHS Acceptance Rate - (No. Registration / Total No. Referrals)
Percentage of people receivingMental Health treatment
Treated prevalence of serious mental illness (proportion of individuals receiving at leastone insured health service compared to the estimated number of persons with SMI in theregion - see Section 9 on estimating the target population3).
Percentage of people with a mental illness who receive mental health care
Proportion of persons with serious mental illness in receipt of any insured care per
Population receiving care
Proportion of consumers with serious mental illness in contact with a mental healthspecialist
times for Needed Services Average time (in days) from expression of desire for service by theanother provider, to first face-to-face contact by mental health provider.
Average wait-time (in days) from referral to admission to inpatient facility (acute andtertiary care).
Proportion of urgent referrals that are assessed within 48
Average time to assessment and time to intervention
Percentage of clients awaiting less intensive care beds
Average wait time for first consultation
Waiting time from referral to being seen by psychotic early intervention program team
Number and proportions of clients on discharge wait lists awaiting housing
CAMHS Assessment Timeliness - (Mean time in weeks between Referral and InitialAppointment date)
Average daily quantity (ADQ) ofmedication (antidepressants
Expressed usually as number of DDDs/1000 inhabitants and per day
KCE Report 196S3
TOT
patient care during a 12-month reporting periodpatient care that occurred within 7 and 30 days
6
≥1 visit with adult caregiver of child ≤ 13 treated for a psychiatric or substance-related
Family member/child and adolescent perception of access
ration / Total No. Referrals)
5
Treated prevalence of serious mental illness (proportion of individuals receiving at leastnumber of persons with SMI in the
mating the target population3).
who receive mental health care
Proportion of persons with serious mental illness in receipt of any insured care per annum
Proportion of consumers with serious mental illness in contact with a mental health
5
Average time (in days) from expression of desire for service by the client, or referral fromface contact by mental health provider.
time (in days) from referral to admission to inpatient facility (acute and
hin 48-hours.
Waiting time from referral to being seen by psychotic early intervention program team
and proportions of clients on discharge wait lists awaiting housing
(Mean time in weeks between Referral and Initial
5
Expressed usually as number of DDDs/1000 inhabitants and per day 5

KCE Report 196S3
NBR Type Scope Indicator
/antipsychotics/ hypnotics andanxiolytics) prescribed
147 Effectiveness Generic Suicide (in general population)
210 Sustainibility Generic Acute Psychiatric beds per 100,000population
7 Accessibility Generic Access to Psychiatrists
132 Effectiveness Generic Mortality for Persons with (Severe)Psychiatric Disorders
135 Effectiveness Generic Prevalence good mental health
150 Effectiveness Substance-abuse
Mortality for Persons withSubstance Abuse Disorders
105 Continuity Generic Racial/ethnic disparities in mentalhealth follow-up rates
124 Effectiveness Generic Directly age-standardized self harmhospital admission rate per
Health System Performance Report 2012
Operational Definition(s)
/antipsychotics/ hypnotics andanxiolytics) prescribed
Suicide (in general population) Number of deaths due to suicide in the civilian noninstitutionalized
Rank among causes of death —suicide
Suicide rate per 1000 for persons with Severe Mental Illness (or specific diagnosticgroups).
Potential years of life lost: due to suicide
Number of suicide attempts
Psychiatric beds per 100,000 Number of in-scope acute inpatient psychiatric beds available during the reference periodover the total catchment population for in-scope acute inpatient mental health servicesduring the reference period
Access to Psychiatrists Dollars spent per 10,000 population on psychiatry services including feesessional services, outreach services by local health region.
Services per 10,000 population by region.
Mortality for Persons with (Severe)Psychiatric Disorders
Standardized mortality rate for % of persons in total population with specified severepsychiatric disorders
Relative risk of death for persons with severe and enduring mentalthe general population
The total number of mental health service recipients between the ages of 35 and 50 whodied during the last 12 months by specific cause (excluding suicide and accidents),compared with the same measure for non-mental health service recipients
Prevalence good mental health Number of cases exceeding the cutpoint for good mental health/100 000 inhabitants
Number of persons exceeding cutpoint (upper quadrant of the population) for being an“optimist” within a country/100 000 inhabitants in year
Number of persons exceeding cutpoint for satisfactory level of sense of mastery within acountry (satisfactory level of mastery)/100 000 inhabitants in year
Health Status (SF36)
Mortality for Persons withSubstance Abuse Disorders
Number of drug related deaths/100 000 inhabitants in a year
Racial/ethnic disparities in mentalup rates
% of persons with a mental health related visit receiving at least one visit in 12 monthsafter initial visit stratified by race/ethnicity
standardized self harmhospital admission rate per
11
TOT
Number of deaths due to suicide in the civilian noninstitutionalized population
Suicide rate per 1000 for persons with Severe Mental Illness (or specific diagnostic
5
scope acute inpatient psychiatric beds available during the reference periodscope acute inpatient mental health services
5
Dollars spent per 10,000 population on psychiatry services including fee-for-service,sessional services, outreach services by local health region.
4
Standardized mortality rate for % of persons in total population with specified severe
Relative risk of death for persons with severe and enduring mental illness compared to
The total number of mental health service recipients between the ages of 35 and 50 whodied during the last 12 months by specific cause (excluding suicide and accidents),
tal health service recipients
4
Number of cases exceeding the cutpoint for good mental health/100 000 inhabitants
Number of persons exceeding cutpoint (upper quadrant of the population) for being an
Number of persons exceeding cutpoint for satisfactory level of sense of mastery within acountry (satisfactory level of mastery)/100 000 inhabitants in year
4
Number of drug related deaths/100 000 inhabitants in a year 4
visit receiving at least one visit in 12 months 3
3
12
NBR Type Scope Indicator
100,000 population
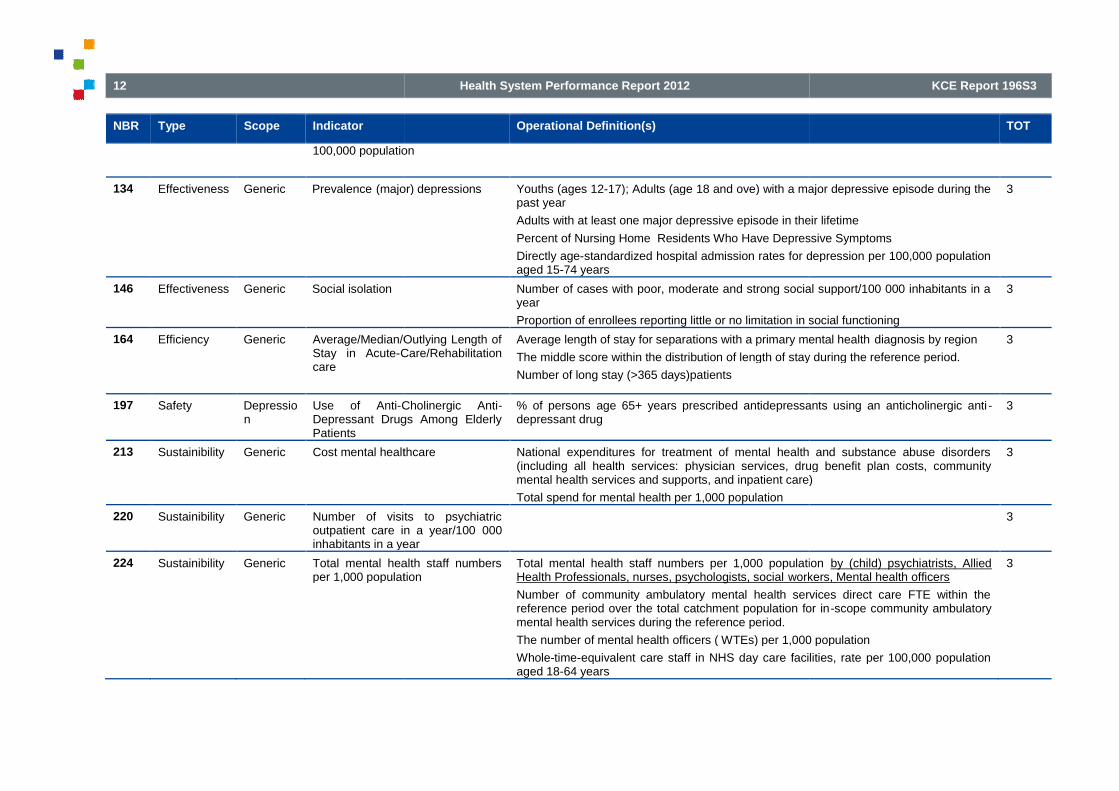
134 Effectiveness Generic Prevalence (major) depressions
146 Effectiveness Generic Social isolation
164 Efficiency Generic Average/Median/Outlying Length ofStay in Acute-Care/Rehabilitationcare
197 Safety Depression
Use of Anti-Cholinergic AntiDepressant Drugs Among ElderlyPatients
213 Sustainibility Generic Cost mental healthcare
220 Sustainibility Generic Number of visits to psychiatricoutpatient care in a year/100inhabitants in a year
224 Sustainibility Generic Total mental health staff numbersper 1,000 population
Health System Performance Report 2012
Operational Definition(s)
100,000 population
(major) depressions Youths (ages 12-17); Adults (age 18 and ove) with a major depressive episode during thepast year
Adults with at least one major depressive episode in their lifetime
Percent of Nursing Home Residents Who Have Depressive Symptoms
Directly age-standardized hospital admission rates for depression per 100,000 populationaged 15-74 years
Number of cases with poor, moderate and strong social support/100 000 inhabitants in ayear
Proportion of enrollees reporting little or no limitation in social functioning
Average/Median/Outlying Length ofCare/Rehabilitation
Average length of stay for separations with a primary mental health
The middle score within the distribution of length of stay during the reference period.
Number of long stay (>365 days)patients
Cholinergic Anti-Depressant Drugs Among Elderly
% of persons age 65+ years prescribed antidepressants using an anticholinergic antidepressant drug
Cost mental healthcare National expenditures for treatment of mental health and substance abuse disorders(including all health services: physician services, drug benefit plan costs, communitymental health services and supports, and inpatient care)
Total spend for mental health per 1,000 population
Number of visits to psychiatricoutpatient care in a year/100 000inhabitants in a year
Total mental health staff numbersper 1,000 population
Total mental health staff numbers per 1,000 populationHealth Professionals, nurses, psychologists, social workers, Mental health officers
Number of community ambulatory mental health services direct care FTE within thereference period over the total catchment population for inmental health services during the reference period.
The number of mental health officers ( WTEs) per 1,000 population
Whole-time-equivalent care staff in NHS day care facilities, rate per 100,000 populationaged 18-64 years
KCE Report 196S3
TOT
17); Adults (age 18 and ove) with a major depressive episode during the
Adults with at least one major depressive episode in their lifetime
Percent of Nursing Home Residents Who Have Depressive Symptoms
standardized hospital admission rates for depression per 100,000 population
3
Number of cases with poor, moderate and strong social support/100 000 inhabitants in a
Proportion of enrollees reporting little or no limitation in social functioning
3
Average length of stay for separations with a primary mental health diagnosis by region
The middle score within the distribution of length of stay during the reference period.
3
age 65+ years prescribed antidepressants using an anticholinergic anti - 3
National expenditures for treatment of mental health and substance abuse disordersphysician services, drug benefit plan costs, community
mental health services and supports, and inpatient care)
3
3
Total mental health staff numbers per 1,000 population by (child) psychiatrists, Alliedworkers, Mental health officers
Number of community ambulatory mental health services direct care FTE within thereference period over the total catchment population for in-scope community ambulatory
number of mental health officers ( WTEs) per 1,000 population
equivalent care staff in NHS day care facilities, rate per 100,000 population
3

KCE Report 196S3
Table 4 Indicators excluded in the pre-selection process
NBR Type Scope Indicator
9 Accessibility Generic Early Intervention
11 Accessibility Generic Financial accessibility Mental Health
23 Appropriateness ADHD Appropriate number of visits after initiatingADHD treatment
35 Appropriateness Depression Assessment suicidal ideation for patients withmajor
38 Appropriateness Depression Depression diagnosis accuracy
48 Appropriateness Generic Antipsichotic use in the absence of psychoticor related disorders
59 Appropriateness Generic Physical restraint use
80 Appropriateness Substance-abuse % patients with alcohol dependency receivingappropriate medication (e.g. naltrexon
Health System Performance Report 2012
selection process
Indicator Operational Definition(s)
Early Intervention Duration of untreated symptoms (self and/or family defined).
Mean age at first treatment contact for persons with psychoticdisorders.
Percentage of patients engaged in early psychosis interventionprogram services
Percentage patients for a psychotic early intervention programseen within 2 weeks of referral
Financial accessibility Mental Health Serices The percentage of consumers for whom cost is an obstacle toservice utilization
Appropriate number of visits after initiatingADHD treatment
Percentage of ADHD patients aged 6followed up clinically within 30 days of a first prescription ofADHD-specific medication
Percentage of patients with ADHDleast two follow-up visits within 1 year
Assessment suicidal ideation for patients withmajor depression
% of patients with a major depression who are assessed forsuicidal ideation at initial evaluation
Depression diagnosis accuracy Percentage of patients with newly diagnosed depression or anew phase of depression whose diagnosis was establishedaccording to ICD-10 criteria
Antipsichotic use in the absence of psychoticor related disorders
Daily antipsychotic dosage ≥200 CPZ equivalents for nursing home resident with dementia without psychotic symptoms in 3month period
Physical restraint use Number of involuntary physical restraint events per patient dayin 3-month period
Percentage of clients admitted for inpatient psychiatric care whowere restrained at least once per facility per year.
Number of nursing home residents with dementia restrainedphysically in 3-month period
% patients with alcohol dependency receivingappropriate medication (e.g. naltrexone)
% of patients with alcohol dependence with at least oneprescription: (a) offered for naltrexone, Antabuse (disulfiram) oracamprosate OR (b) filled OR (c) refused medication OR (d)documentation that prescription is contraindicated within 90 daysof start of new treatment episode
13
TOT
Duration of untreated symptoms (self and/or family defined).
Mean age at first treatment contact for persons with psychotic
Percentage of patients engaged in early psychosis intervention
Percentage patients for a psychotic early intervention programseen within 2 weeks of referral
2
The percentage of consumers for whom cost is an obstacle to 2
Percentage of ADHD patients aged 6–18 years who werewithin 30 days of a first prescription of
Percentage of patients with ADHD-specific medication with atup visits within 1 year
2
% of patients with a major depression who are assessed forsuicidal ideation at initial evaluation
2
Percentage of patients with newly diagnosed depression or adepression whose diagnosis was established
2
≥200 CPZ equivalents for nursing ia without psychotic symptoms in 3-
2
Number of involuntary physical restraint events per patient day
Percentage of clients admitted for inpatient psychiatric care whorestrained at least once per facility per year.
Number of nursing home residents with dementia restrained
2
% of patients with alcohol dependence with at least oneprescription: (a) offered for naltrexone, Antabuse (disulfiram) oracamprosate OR (b) filled OR (c) refused medication OR (d)documentation that prescription is contraindicated within 90 days
tart of new treatment episode
2

14
NBR Type Scope Indicator
82 Appropriateness Substance-abuse Alcohol Use
93 Continuity Generic Continuity of visits after mental healthhospitalisation (Postcare)
99 Continuity Generic Mental
113 Continuity Generic Timely ambulatory followhealth hospitalisation
119 Effectiveness Depression Depression remission rates
130 Effectiveness Generic Increase in mental health literacy
136 Effectiveness Generic Prevalence of Mental illness
137 Effectiveness Generic Prevalence psychological distress
140 Effectiveness Generic Proportion of adults with a severe anxiety,mood or addiction disorder who receive carefor this
Health System Performance Report 2012
Indicator Operational Definition(s)
Alcohol Use - Screening
Continuity of visits after mental health-relatedhospitalisation (Post-discharge communitycare)
% of persons hospitalized fordisorder with at least one visit per month for 6 months afterhospitalization
Proportion of persons with SMI lost to followmental health services at six months and one year.
Mental health related Emergency Room Visits Number of emergency service contacts for persons with SMI perannum
ER presentations with a mental health and/or substance misusediagnosis/total ER presentations
Percentage of visits to the ER for mental health and/orsubstance- related problems by time of day
Timely ambulatory follow-up after mentalhealth hospitalisation
% of persons hospitalized for primary mental health diagnoseswith an ambulatory mental health encounter with a mentalpractitioner within 7 and 30 days of discharge
Average number of days between hospital discharge and servicecontact for primary mental health separations.
Depression remission rates Depression remission at 6/12 months
Increase in mental health literacy Dissemination of information to public about symptoms of mentalillness and available resources.
Prevalence of Mental illness General prevalence of Mental illness in the community
Prevalence of Mental illness specific target groups (e.g. newlysentenced to adult and juvenile correctional facilities; homeless)
Prevalence psychological distress Adults aged 18 and over with serious psychological distress inthe past 30 days
The percentage of consumers who experience a decreased levelof psychological distress
Directly age-standardized hospital admission rates for anxietydisorders per 100,000 population
Proportion of adults with a severe anxiety,mood or addiction disorder who receive carefor this
KCE Report 196S3
TOT
2
% of persons hospitalized for psychiatric or substance-relateddisorder with at least one visit per month for 6 months after
Proportion of persons with SMI lost to follow-up by communitymental health services at six months and one year.
2
Number of emergency service contacts for persons with SMI per
ER presentations with a mental health and/or substance misusediagnosis/total ER presentations
Percentage of visits to the ER for mental health and/orrelated problems by time of day
2
% of persons hospitalized for primary mental health diagnoseswith an ambulatory mental health encounter with a mental healthpractitioner within 7 and 30 days of discharge
Average number of days between hospital discharge and servicecontact for primary mental health separations.
2
months 2
Dissemination of information to public about symptoms of mentalillness and available resources.
2
General prevalence of Mental illness in the community
Prevalence of Mental illness specific target groups (e.g. newlysentenced to adult and juvenile correctional facilities; homeless)
2
aged 18 and over with serious psychological distress in
The percentage of consumers who experience a decreased level
standardized hospital admission rates for anxietydisorders per 100,000 population aged 15-74 years
2
2

KCE Report 196S3
NBR Type Scope Indicator
144 Effectiveness Generic Relapse or recurrence during follow
151 Effectiveness Substance-abuse Prevalence alcohol/substance abuse
156 Efficiency Generic % community spend/Total spend
158 Efficiency Generic Appropriate Spending
185 Patient-centeredness
Generic Consumer perception of outcomes/ consumerperception of improvement
190 Patient-centeredness
Generic Involvement of Consumers in Service Deliveryand Planning
Health System Performance Report 2012
Indicator Operational Definition(s)
Relapse or recurrence during follow-up Relapse or recurrence during an 18defined as the initiation of a newantidepressant prescription, orby evidence of a suicide attempt, hospitalisation, mental healthrelated emergency roomvisit, or receipt of electroconvulsivetherapy
Prevalence alcohol/substance abuse Number of people aged 12 and over with alcohol and/or illicitdrug dependence or abuse in the past year
Rates of use of illicit drugs that contribute to mental illness inyoung peoplePrevalence alcohol dep
Standardized % of alcohol consumption above ‘sensible’ dailylimits
% community spend/Total spend Expenditure on community mental health and addiction servicesas a proportion of total expenditure on mental health andaddiction services
Appropriate Spending Proportion of total expenditures on service recipients with SMIrelative to total expenditures on all persons who have receivedany insured health service for a mental health problem.
Proportion of funds spent on preventing crises to funds spent onreacting to crises.
Proportion of investment in informal and consumerto the investment in formal supports.
Proportion of mental health sector expenditures on best practiceprograms to total sector expenditures.
Consumer perception of outcomes/ consumerperception of improvement
Involvement of Consumers in Service Deliveryand Planning
Proportion of communities within region with establishedregional consumer advisory groups
Total amount of resources allocated to support consumeradvisory structures and their activities as a percentage of totalmental health budget.
Proportion of regional health authothat have a designated person at the management level tofacilitate partnerships and involvement of consumers andfamilies
Number of consumer/family self
15
TOT
Relapse or recurrence during an 18-month follow-up period wasdefined as the initiation of a newantidepressant prescription, orby evidence of a suicide attempt, hospitalisation, mental health-related emergency roomvisit, or receipt of electroconvulsive
2
Number of people aged 12 and over with alcohol and/or illicitdrug dependence or abuse in the past year
Rates of use of illicit drugs that contribute to mental illness inyoung peoplePrevalence alcohol dependency
Standardized % of alcohol consumption above ‘sensible’ daily
2
Expenditure on community mental health and addiction servicesas a proportion of total expenditure on mental health and
2
Proportion of total expenditures on service recipients with SMIrelative to total expenditures on all persons who have receivedany insured health service for a mental health problem.
Proportion of funds spent on preventing crises to funds spent on
Proportion of investment in informal and consumer-run supportsto the investment in formal supports.
Proportion of mental health sector expenditures on best practiceams to total sector expenditures.
2
2
communities within region with establishedregional consumer advisory groups
Total amount of resources allocated to support consumeradvisory structures and their activities as a percentage of total
Proportion of regional health authorities within province/territorythat have a designated person at the management level tofacilitate partnerships and involvement of consumers and
Number of consumer/family self-directed initiatives
2

16
NBR Type Scope Indicator
203 Safety Generic Medication Errors/Side Effects
212 Sustainibility Generic Community residential beds per 100,000population
218 Sustainibility Generic Mental Health Staff Turnover
6 Accessibility Generic Access to Primary Care
16 Accessibility Generic Readily accessible services for mental health,Alcohol &
Other Drug Dependence treatment
22 Appropriateness ADHD ADHD diagnosis accuracy
Health System Performance Report 2012
Indicator Operational Definition(s)
Family involvement in treatmen t for Children /A
Medication Errors/Side Effects Number of medication errors/adverse effects reported by clientswith SMI to case managers.
Number of medical services and/or hospital services required asa direct result of psychotropic medication problems.
Appropriate monitoring of metabolic/cardiovascular side effectsfor individuals receiving antipsychotic medication
Community residential beds per 100,000population
Number of in-scope community residentialavailable during the reference period over the total catchmentpopulation for in-scope community residential mental healthservices during the reference period.
Mental Health Staff Turnover
Access to Primary Care Proportion of persons with Severe Mental Illness (SMI)registered with a primary care physician.
Number of primary care outreach services provided to personswith SMI.
Number of emergency room presentations forwhich could be managed in primary care setting.
% of service users registered with a general practitioner whohave severe long-term mental health problems
Proportion of clients whose first contact with the system isthrough emergency departments.
Readily accessible services for mental health,Alcohol &
Other Drug Dependence treatment
Denials for mental health or substancenumber of requests in 12-month period
The percentage of consumersavailable
ADHD diagnosis accuracy Percentage of patients newly diagnosed with ADHD whosemedical record contains documentation of DSM
KCE Report 196S3
TOT
Family involvement in treatmen t for Children /Adolesc ents
Number of medication errors/adverse effects reported by clients
Number of medical services and/or hospital services required asmedication problems.
Appropriate monitoring of metabolic/cardiovascular side effectsfor individuals receiving antipsychotic medication
2
scope community residential psychiatric bedsavailable during the reference period over the total catchment
scope community residential mental healthservices during the reference period.
2
2
Proportion of persons with Severe Mental Illness (SMI)registered with a primary care physician.
Number of primary care outreach services provided to persons
Number of emergency room presentations for medical problemsanaged in primary care setting.
% of service users registered with a general practitioner whoterm mental health problems
Proportion of clients whose first contact with the system istments.
1
Denials for mental health or substance-related services permonth period
The percentage of consumers reporting that services are readily
1
Percentage of patients newly diagnosed with ADHD whosemedical record contains documentation of DSM-IV or ICD-10
1

KCE Report 196S3
NBR Type Scope Indicator
30 Appropriateness Children Familiy treatment for children in mental healthcare
32 Appropriateness Dementia Rate of dementia patients aged 65 years orolder who themselves and their aregivers werecounseled about diagnosis, prognosis, andcommunity
37 Appropriateness Depression Continuous AntiTreatment in Continuation Phase
41 Appropriateness Depression Psychosis assessment of hospitalized elderlypatients with depression
52 Appropriateness Generic Existence of Best Practices Core Programs &Programs for the Severly Mentally Ill
53 Appropriateness Generic Fidelity of Best Practices to Established Model
61 Appropriateness Generic Screening of psychiatric patients for substanceuse disorders
74 Appropriateness Schizophrenia Clinician contact with family member ofconsenting individuals with schizophrenia atinitial evaluation
Health System Performance Report 2012
Indicator Operational Definition(s)
criteria having been addressed
Familiy treatment for children in mental healthcare
Rate of dementia patients aged 65 years orolder who themselves and their aregivers werecounseled about diagnosis, prognosis, andcommunity support
Continuous Anti-Depressant MedicationTreatment in Continuation Phase
% of persons age ≥18 years who are diagnosed with a new episode of depression and treated with antidepressantmedication, with a 180-daymedication
Psychosis assessment of hospitalized elderlypatients with depression
% of elderly patients 65 years of age and older admitted to ahospital with a diagnosis of depression who receiveassessment of psychosis.
Existence of Best Practices Core Programs &Programs for the Severly Mentally Ill
CORE: Existence of, or access to (if unavailable in smallercommunities), the following continuum of core programs:management/assertive community treatment; Crisisesponse/emergency services; Housing; Inpatient/outpatientcare; Supported consumer initiatives; Family selfVocational/educational programs; Early intervention; Primarycare
Fidelity of Best Practices to Established Model Evidence of a process for establishing, adopting, andmaintaining best practice core programs and system strategies
Program audit against established criteria
Use of treatment guidelines/ use of evidence based guidelines
Screening of psychiatric patients for substanceuse disorders
% of patients that are assessed for drug and alcohol use at initialevaluation for psychiatric disorder
Clinician contact with family member ofconsenting individuals with schizophrenia atinitial evaluation
% of schizophrenia patients for which there is clinician contactwith a close family member (living with them or seeing them atleast twice a week) at initial evaluation
17
TOT
criteria having been addressed
1
1
≥18 years who are diagnosed with a new episode of depression and treated with antidepressant
day treatment of antidepressant
1
% of elderly patients 65 years of age and older admitted to ahospital with a diagnosis of depression who receive an
1
CORE: Existence of, or access to (if unavailable in smallercommunities), the following continuum of core programs: Casemanagement/assertive community treatment; Crisisesponse/emergency services; Housing; Inpatient/outpatientcare; Supported consumer initiatives; Family self-help programs;Vocational/educational programs; Early intervention; Primary
1
Evidence of a process for establishing, adopting, andmaintaining best practice core programs and system strategies
Program audit against established criteria
es/ use of evidence based guidelines
1
% of patients that are assessed for drug and alcohol use at initialevaluation for psychiatric disorder
1
% of schizophrenia patients for which there is clinician contactwith a close family member (living with them or seeing them at
wice a week) at initial evaluation
1
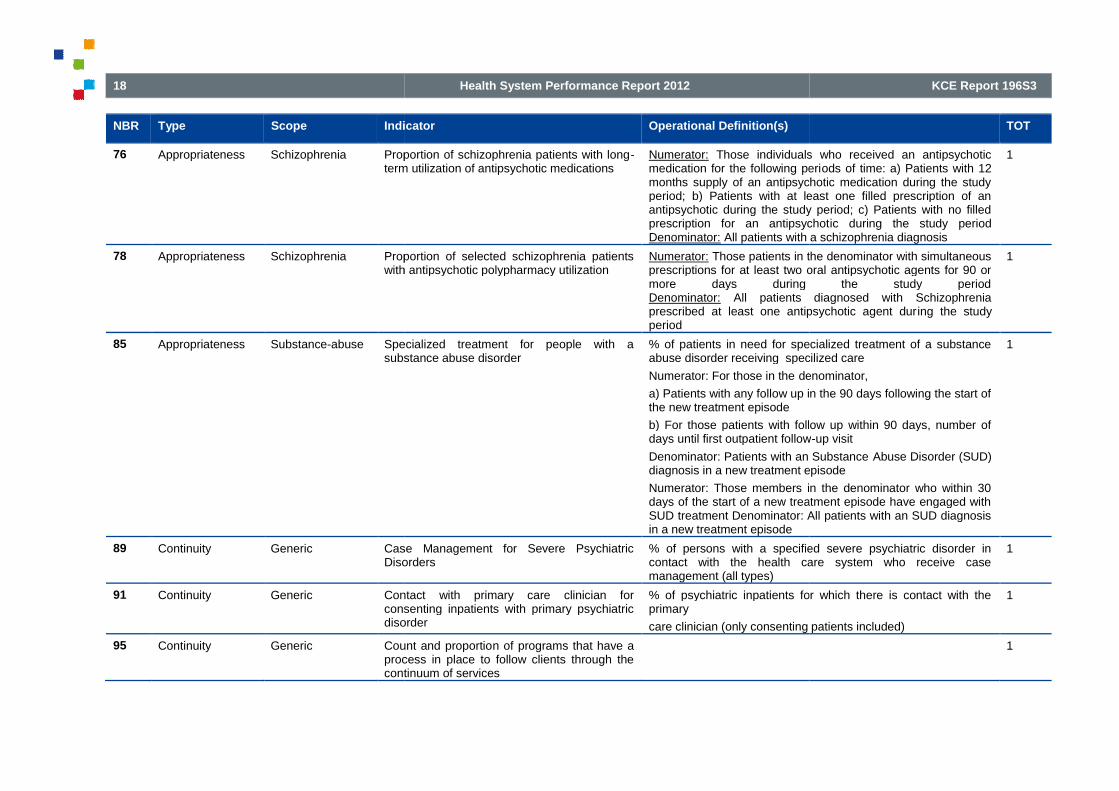
18
NBR Type Scope Indicator
76 Appropriateness Schizophrenia Proportion of schizophrenia patients with longterm utilization of antipsychotic medications
78 Appropriateness Schizophrenia Proportion of selected schizophrenia patientswith antipsychotic polypharmacy utilization
85 Appropriateness Substance-abuse Specialized treatment for people with asubstance abuse disorder
89 Continuity Generic Case Management for Severe PsychiatricDisorders
91 Continuity Generic Contactconsenting inpatients with primary psychiatricdisorder
95 Continuity Generic Count and proportioprocess in place to follow clients through thecontinuum of services
Health System Performance Report 2012
Indicator Operational Definition(s)
Proportion of schizophrenia patients with long-term utilization of antipsychotic medications
Numerator: Those individuals who received an antipsychoticmedication for the following perimonths supply of an antipsychotic medication during the studyperiod; b) Patients with at least one filled prescription of anantipsychotic during the study period; c) Patients with no filledprescription for an antipsychotDenominator: All patients with a schizophrenia diagnosis
Proportion of selected schizophrenia patientswith antipsychotic polypharmacy utilization
Numerator: Those patients in the denominator with simultaneousprescriptions for at least two oral antipsychotic agents for 90 ormore days during the study periodDenominator: All patients diagnosed with Schizophreniaprescribed at least one antipsychotic agent durperiod
Specialized treatment for people with asubstance abuse disorder
% of patients in need for specialized treatment of a substanceabuse disorder receiving specilized care
Numerator: For those in the denominator,
a) Patients with any follow up in the 90 days following the start ofthe new treatment episode
b) For those patients with follow up within 90 days, number ofdays until first outpatient follow
Denominator: Patients with an Substancediagnosis in a new treatment episode
Numerator: Those members in the denominator who within 30days of the start of a new treatment episode have engaged withSUD treatment Denominator: All patients with an SUD diagnosisin a new treatment episode
Case Management for Severe PsychiatricDisorders
% of persons with a specified severe psychiatric disorder incontact with the health care system who receive casemanagement (all types)
Contact with primary care clinician forconsenting inpatients with primary psychiatricdisorder
% of psychiatric inpatients for which there is contact with theprimary
care clinician (only consenting patients included)
Count and proportion of programs that have aprocess in place to follow clients through thecontinuum of services
KCE Report 196S3
TOT
Those individuals who received an antipsychoticmedication for the following periods of time: a) Patients with 12months supply of an antipsychotic medication during the studyperiod; b) Patients with at least one filled prescription of anantipsychotic during the study period; c) Patients with no filledprescription for an antipsychotic during the study period
All patients with a schizophrenia diagnosis
1
Those patients in the denominator with simultaneousprescriptions for at least two oral antipsychotic agents for 90 ormore days during the study period
All patients diagnosed with Schizophreniaprescribed at least one antipsychotic agent during the study
1
% of patients in need for specialized treatment of a substanceabuse disorder receiving specilized care
denominator,
a) Patients with any follow up in the 90 days following the start of
b) For those patients with follow up within 90 days, number ofdays until first outpatient follow-up visit
Denominator: Patients with an Substance Abuse Disorder (SUD)diagnosis in a new treatment episode
Numerator: Those members in the denominator who within 30days of the start of a new treatment episode have engaged withSUD treatment Denominator: All patients with an SUD diagnosis
1
% of persons with a specified severe psychiatric disorder incontact with the health care system who receive case
1
% of psychiatric inpatients for which there is contact with the
care clinician (only consenting patients included)
1
1

KCE Report 196S3
NBR Type Scope Indicator
98 Continuity Generic Integrated Care Pathways or care programapproach
101 Continuity Generic Physician Reimbursement Mechanism forCase Management/coordination activities
104 Continuity Generic Proportion of patients using Mental HealthIntensive Case Management
109 Continuity Generic Theemergency care who receive ambulatoryservices within 3 days
110 Continuity Generic The percentage of people served in a yearwho had only one mental health contact
116 Continuity Substance-abuse Length of TreatmentDisorders
117 Effectiveness Children School improvement (Children)
118 Effectiveness Children The percentage ofemotional disturbances placed outside thehome for at least one month during the year
Health System Performance Report 2012
Indicator Operational Definition(s)
Integrated Care Pathways or care programapproach
Number of accredited Integrated Care Pathway (ICP) standardsimplemented with 100% collection of prescribed datapoints
Care Programme Approach (CPA) 7 day follow
Poportion of patients with abn individualised care plan
Physician Reimbursement Mechanism forCase Management/coordination activities
Existence of a fee-item within the feereimburses physicians for case consultation/case managementactivities.
Proportion of physicians reimbursed through nonmechanisms.
Proportion of patients using Mental HealthIntensive Case Management
Numerator: Patients in the denominator using Mental HealthIntensive Case Management
Denominator: Patients in all cohorts
Numerator: a) Number of patients subsequently enrolled inMHICM; b) Number of days following date of eligibility (pernumerator [a]) until client is enrolled in MHICMDenominator: Number of patients in a study cohort who have atleast three inpatient discharges or 30 cumulative inpatient daysin the study period and were not enrolled in MHICM prior tomeeting the inpatient utilization criteria
The percentage of people discharged fromemergency care who receive ambulatoryservices within 3 days
The total number of emergency psychiatric encounters duringthe past year that were followed by at least one outpatient (nonemergency) care visit within 3 daof all emergency psychiatric encounters during the past year
The percentage of people served in a yearwho had only one mental health contact
Length of Treatment for Substance-RelatedDisorders
% of persons initiating treatment for a substancewith treatment lasting at least 90 days
School improvement (Children)
The percentage of children with seriousemotional disturbances placed outside thehome for at least one month during the year
The total number of children with serious emotional disturbancesplaced in any setting outside of the home for at least one monthover the period of one year, divided by the total number ofchildren with serious emotional disturbances served by the planduring the same year
19
TOT
Number of accredited Integrated Care Pathway (ICP) standardsection of prescribed datapoints
Care Programme Approach (CPA) 7 day follow-up
Poportion of patients with abn individualised care plan
1
item within the fee-for-service schedule thatreimburses physicians for case consultation/case management
Proportion of physicians reimbursed through non-feefor-service
1
Patients in the denominator using Mental Health
Patients in all cohorts
a) Number of patients subsequently enrolled in; b) Number of days following date of eligibility (per
numerator [a]) until client is enrolled in MHICMNumber of patients in a study cohort who have at
least three inpatient discharges or 30 cumulative inpatient daysin the study period and were not enrolled in MHICM prior tomeeting the inpatient utilization criteria
1
The total number of emergency psychiatric encounters duringthe past year that were followed by at least one outpatient (non-emergency) care visit within 3 days, divided by the total numberof all emergency psychiatric encounters during the past year
1
1
% of persons initiating treatment for a substance-related disorderwith treatment lasting at least 90 days
1
1
The total number of children with serious emotional disturbancesplaced in any setting outside of the home for at least one month
one year, divided by the total number ofchildren with serious emotional disturbances served by the plan
1

20
NBR Type Scope Indicator
120 Effectiveness Generic Clinical Status/ Clinical Outcomes
121 Effectiveness Generic Communitymental illness (aggregated days not spent inhospital, psychiatric facility or jail perper year)
125 Effectiveness Generic Employment Status
143 Effectiveness Generic Quality of Life
Health System Performance Report 2012
Indicator Operational Definition(s)
Clinical Status/ Clinical Outcomes Percentage of service recipients with Severe Mental Illnessexperiencing reductions in the number and severity of symptomsbetween admission and followclinical instruments available for the measurement ofsymptomatology.
Mental Health Outcomes Profile (HoNOS)
Mental health outcomes of people who receive treatment fromstate and territory services and the private hospital system
Community-tenure for clients with seriousmental illness (aggregated days not spent inhospital, psychiatric facility or jail per personper year)
Employment Status Percent of service recipients with Severe Mental Illness attainingindependent competitive (paid) employment
Participation rates by people with mental illness of working agein employment
Participation rates by young people aged 16illness in education and employment
% of respondents recently in the workforce reporting a targetlevel of improvement in ability to perform paid work
The average change in days of work lost
% adults with Mental Health-problems in supported employment
The proportion of individuals with any mental health diagnosisdischarged from an inpatient or residential substance abusedisorder specialty setting that move from being unemployed tobeing employed either part-time or fulldischarge
The number of patients who return to work divided by thenumber who do not
Proportion of persons with serious mental illness in supportedemployement/ vocational/ educational programs
Quality of Life Percent of service recipients with (severe) mental illnessreporting improvements in quality of life as determined by a validmeasure
KCE Report 196S3
TOT
Percentage of service recipients with Severe Mental Illnessexperiencing reductions in the number and severity of symptomsbetween admission and follow-up. There are a wide range ofclinical instruments available for the measurement of
Mental Health Outcomes Profile (HoNOS)
f people who receive treatment fromstate and territory services and the private hospital system
1
1
Percent of service recipients with Severe Mental Illness attainingindependent competitive (paid) employment
Participation rates by people with mental illness of working age
Participation rates by young people aged 16-30 with mentalillness in education and employment
% of respondents recently in the workforce reporting a targetlevel of improvement in ability to perform paid work
The average change in days of work lost
problems in supported employment
The proportion of individuals with any mental health diagnosisdischarged from an inpatient or residential substance abusedisorder specialty setting that move from being unemployed to
time or full-time one year after
The number of patients who return to work divided by the
Proportion of persons with serious mental illness in supportedemployement/ vocational/ educational programs
1
Percent of service recipients with (severe) mental illnessreporting improvements in quality of life as determined by a valid
1

KCE Report 196S3
NBR Type Scope Indicator
145 Effectiveness Generic Sickness compensation and benefits due tomental
149 Effectiveness Substance-abuse Alcohol
157 Efficiency Generic Acute bed occupancy
162 Efficiency Generic Average number of persons seen per year perambulatory direct
170 Efficiency Generic Number of professionals/ organizationsinvolved in care
172 Efficiency Generic Proportion of all health care funds allocated toinpatient, outpatient and all mental healthtreatment
177 Efficiency Generic Total mental health drug costs per 1,000population
183 Patient-centeredness
Generic Carer/family involvement
184 Patient-centeredness
Generic Consumer outcomes participation
Health System Performance Report 2012
Indicator Operational Definition(s)
Sickness compensation and benefits due tomental disorders
Persons on incapacity benefit/severe disablement allowancewith a mental health diagnosis per 1,000 population
Sickness compensation periods due to mental disorders
Days absent from work
Mental and behavioural disorders incapacity benefit claimanrate per 100,000 population aged 16
Total sick leave as number of total hours paid
Alcohol-impaired driving fatalities Alcohol-impaired driving fatalities
Acute bed occupancy Total accrued mental health patient days for inpsychiatric units during the reference period over the number ofavailable beds days during the reference period
Average number of persons seen per year perambulatory direct care FTE
Number of persons receiving one or more service contacts fromin-scope community ambulatory services during the referenceperiod over the total number of community ambulatory directcare FTE during the reference period.
umber of professionals/ organizationsinvolved in care
Proportion of all health care funds allocated toinpatient, outpatient and all mental healthtreatment
Total mental health drug costs per 1,000population
Carer/family involvement % carer involvement/those who have a carer
Projects to support parenting skills
the number of patients whose families are involved in treatmentdivided by the number whose whose
Consumer outcomes participation Proportion of ambulatory episodes of mental health care withcompleted consumer self-assessment outcome measures.
21
TOT
Persons on incapacity benefit/severe disablement allowancewith a mental health diagnosis per 1,000 population
Sickness compensation periods due to mental disorders
Mental and behavioural disorders incapacity benefit claimantrate per 100,000 population aged 16-59 years
Total sick leave as number of total hours paid
1
impaired driving fatalities 1
accrued mental health patient days for in-scope acutepsychiatric units during the reference period over the number ofavailable beds days during the reference period
1
Number of persons receiving one or more service contacts fromscope community ambulatory services during the reference
period over the total number of community ambulatory directcare FTE during the reference period.
1
1
1
1
who have a carer
Projects to support parenting skills
the number of patients whose families are involved in treatmentdivided by the number whose whose families are not
1
Proportion of ambulatory episodes of mental health care withassessment outcome measures.
1

22
NBR Type Scope Indicator
186 Patient-centeredness
Generic Consumer/familyreceived
189 Patient-centeredness
Generic Formal complaints
192 Patient-centeredness
Generic Percentage of total mental health budgetallocated to support consumerinitiatives
198 Safety ElectroConvulsionTherapy
Complications Associated with ElectroConvulsion Therapy
202 Safety Generic Inpatient injury rate
Health System Performance Report 2012
Indicator Operational Definition(s)
Consumer/family satisfaction with servicesreceived
Percentage of consumers/families satisfied with services asmeasured by valid method
Proportion of consumers with SMI who believe the service andsupports provided are appropriate to their needs.
The percentage of consumers for whom thelocation/appointment time of services is convenient
The percentage of consumers who report that physicians,mental health therapists, or case managers can be reachedeasily
The percentage of consumers who report that they receivedadequate information to make informed choices.
The proportion of individuals receiving care in a SUD specialtycare setting with any MHD diagnosis who report improvedsatisfaction with their care as measured by a standardizedinstrument after 6 months of tre
Formal complaints Existence of a clear process for filing complaints
Number of complaints received by complaints Commissioner,Mental Health Advocate, Ombudsperson (or equivalent offices),consumer advocacy associations, regional health authority, etc.concerning mental health services and supports.
Average time between receipt of complaint and satisfactoryresolution
Percentage of consumer (and families) satisfied with resolutionof complaints.
Complaints closed within 30 days
Percentage of total mental health budgetallocated to support consumer-directedinitiatives
Complications Associated with ElectroConvulsion Therapy
Percentage of patient undergoing ECT who experience a majormedical complication.
Inpatient injury rate Number of inpatient injuries per patient day in 3
Incidence of any physical injury requiring medical attention topsychiatric patients and staff by inpatient facility per year.
Incidence of substantiated reports of sexual assaults on
KCE Report 196S3
TOT
Percentage of consumers/families satisfied with services as
Proportion of consumers with SMI who believe the service andsupports provided are appropriate to their needs.
consumers for whom thelocation/appointment time of services is convenient
The percentage of consumers who report that physicians,mental health therapists, or case managers can be reached
The percentage of consumers who report that they receivedequate information to make informed choices.
The proportion of individuals receiving care in a SUD specialtycare setting with any MHD diagnosis who report improvedsatisfaction with their care as measured by a standardizedinstrument after 6 months of treatment
1
Existence of a clear process for filing complaints
Number of complaints received by complaints Commissioner,Mental Health Advocate, Ombudsperson (or equivalent offices),
associations, regional health authority, etc.ealth services and supports.
Average time between receipt of complaint and satisfactory
Percentage of consumer (and families) satisfied with resolution
closed within 30 days
1
1
Percentage of patient undergoing ECT who experience a major 1
Number of inpatient injuries per patient day in 3-month period
Incidence of any physical injury requiring medical attention topsychiatric patients and staff by inpatient facility per year.
Incidence of substantiated reports of sexual assaults on
1

KCE Report 196S3
NBR Type Scope Indicator
205 Safety Generic Patient satisfaction with patient safety and riskmanagement
1 Accessibility Borderline Access toborderline personality disorder
3 Accessibility Generic % of mental health teams with gatewayworkers
4 Accessibility Generic % of mental health teams with National HealthService (NHS) day hospitals
5 Accessibility Generic Access to crisis resolution home treatment
8 Accessibility Generic Availability of AfterTransportation
10 Accessibility Generic ERs have established relationships andprotocols for the assessment, referral andfollow
12 Accessibility Generic Geographic accessibility to mental health,Alcohol & Other Drug
13 Accessibility Generic New Client Index
15 Accessibility Generic Proportion of single treatment day consumersper three month community care period
17 Accessibility Generic systems to provide psychiatric services toprisons and to aid the transfer of MDOs from
Health System Performance Report 2012
Indicator Operational Definition(s)
inpatients.
Patient satisfaction with patient safety and riskmanagement
Access to psychotherapy for patients withborderline personality disorder
1 psychotherapy visit for individuals within 6 months ofhospitalization or ER visit for borderline personality disorder
% of mental health teams with gatewayworkers
% of mental health teams with National HealthService (NHS) day hospitals
Access to crisis resolution home treatment
Availability of After-Hours Care andTransportation
Proportion of communities within a region with 24health coverage.
Proportion of communities within a region with extended hours(evenings, weekends) mental health coverage.
Services that arrange transportation for clients and
ERs have established relationships andprotocols for the assessment, referral andfollow-up of mental health clients
Geographic accessibility to mental health,Alcohol & Other Drug Dependence treatment
Percentage of persons resident in mental health and addictionservice
organisation's defined cathcment area who received care from amental health and addiction service
New Client Index Number of patients entering the Mental Health Care system forthe first time
Proportion of single treatment day consumersper three month community care period
Number of consumers receiving one treatment day only perthree month community care period during the reference periodover the total 3-month community care periods during thereference period
systems to provide psychiatric services toprisons and to aid the transfer of MDOs from
23
TOT
1
1 psychotherapy visit for individuals within 6 months ofhospitalization or ER visit for borderline personality disorder
0
0
0
0
Proportion of communities within a region with 24-hour mental
Proportion of communities within a region with extended hours(evenings, weekends) mental health coverage.
Services that arrange transportation for clients and their families.
0
0
Percentage of persons resident in mental health and addiction
organisation's defined cathcment area who received care from amental health and addiction service
0
entering the Mental Health Care system for 0
Number of consumers receiving one treatment day only perperiod during the reference period
month community care periods during the
0
0

24
NBR Type Scope Indicator
prison to hospital
18 Accessibility Generic The percentage of enrollees participating inselected or indicated preventive programs.
20 Accessibility Homeless Service Reach to the Homeless
21 Accessibility Substance-abuse Initiationdependence treatment within 14 days, 30 days
24 Appropriateness ADHD Percentage of patients with ADHD whosemedical records contain documentation thatthe clinician discussed the need for schoolbased support andfor children with ADHD
25 Appropriateness Bipolar disorders Blood serum monitoring of mood stabilizers inpatients with bipolar disorders
26 Appropriateness Bipolar disorders Percent of bipolar patients with annualassessment of weight/BMI, glycemic control,and lipids
27 Appropriateness Bipolar disorders Proportion of bipolar I disorder patientstreated with mood stabilizer medications
Health System Performance Report 2012
Indicator Operational Definition(s)
prison to hospital
The percentage of enrollees participating inselected or indicated preventive programs.
The total number of enrollees with identified risk factors who areenrolled during a one-year period in mutual help and othersupport programs; programs for people with job loss,bereavement, and subclinical depressive symptoms; and skilland other developmental programs for youth at risk of substanceabuse or childhood behavior problems, divided by the totalnumber of enrollees during the same one
Service Reach to the Homeless Number of homeless clients receiving assertive communitytreatment as a proportion of the estimated number of homelesspeople with SMI.
Initiation and engagement in alcohol and drugdependence treatment within 14 days, 30 days
Percentage of patients with ADHD whosemedical records contain documentation thatthe clinician discussed the need for school-based support and educational service optionsfor children with ADHD
Blood serum monitoring of mood stabilizers inpatients with bipolar disorders
≥1 serum drug level taken for individuals with bipolar disorder treated with mood stabilizers in 12
Percent of bipolar patients with annualassessment of weight/BMI, glycemic control,and lipids
Proportion of bipolar I disorder patientstreated with mood stabilizer medications
Numerator:
a) Patients prescribed a mood stabilizer for 12 weeks followingthe start of a new treatment episode; b) Patients prescribed amood stabilizer for less than 12 weeks following the start of anew treatment episode; c) Patients with no filled prescription fora mood-stabilizing agent during the 12 weeks following the startof a new treatment episode
Denominator: All patients with bipolar I disorder in a newtreatment episode
Numerator: Patients included in the denominator with evidenceof a) 12 months of any mood-
KCE Report 196S3
TOT
The total number of enrollees with identified risk factors who areyear period in mutual help and otherograms for people with job loss,
bereavement, and subclinical depressive symptoms; and skilland other developmental programs for youth at risk of substanceabuse or childhood behavior problems, divided by the totalnumber of enrollees during the same one-year period.
0
Number of homeless clients receiving assertive communitytreatment as a proportion of the estimated number of homeless
0
0
0
≥1 serum drug level taken for individuals with bipolar disorder stabilizers in 12-month period
0
0
Patients prescribed a mood stabilizer for 12 weeks followingthe start of a new treatment episode; b) Patients prescribed amood stabilizer for less than 12 weeks following the start of a
episode; c) Patients with no filled prescription forstabilizing agent during the 12 weeks following the start
All patients with bipolar I disorder in a new
Patients included in the denominator with evidence-stabilizing medication; b) Any use
0

KCE Report 196S3
NBR Type Scope Indicator
28 Appropriateness Bipolar disorders Proportion of patients with bipolar I disorderwith an appropriate frequency of visits with alicensed prescribing provider or licensedmental health prescribing provider
29 Appropriateness Children Children receiving therapeutic foster careservices
31 Appropriateness Dementia Percentage of newly diagnosed dementiapatients, whose prescription list was reviewedfor medication which may contribute tocognitive
33 Appropriateness Depression % major depression patients assessed forcomorbidity (e.g. substance abuse, bipolarsymptoms)
34 Appropriateness Depression Assessing disease severity among patientswith depression
36 Appropriateness Depression Continuous antidepresstreatment in acute phase
39 Appropriateness Depression Individuals administered Electro ConvulsionTherapy, rate per 100,000 population aged 1664 years
Health System Performance Report 2012
Indicator Operational Definition(s)
of a mood-stabilizing agent during the study period; c) No filledprescription for a mood stabilizer
Denominator: All patients with bipolar I
Proportion of patients with bipolar I disorderwith an appropriate frequency of visits with alicensed prescribing provider or licensedmental health prescribing provider
Numerator: Those patients in the devisit per quarter (four visits per year) during the study period:a)With a licensed prescribing provider; b) With any mental healthlicensed prescribing provider
Denominator: Patients diagnosed with bipolar I disorder
Children receiving therapeutic foster careservices
Percentage of newly diagnosed dementiapatients, whose prescription list was reviewedfor medication which may contribute tocognitive dysfunctions
% major depression patients assessed forcomorbidity (e.g. substance abuse, bipolarsymptoms)
% of major depression patients with a new treatment episodehaving documentation of timely comorbid assessment,the presence or absence of: (a) Alcohol or other drug use; (b)Medication use and (c) History of bipolar symptoms
Assessing disease severity among patientswith depression
Percentage of patients with newlywhom disease severity was assessed with established scales(Patient Health questionnaireInventory, Hospital Anxiety and Depression Scale, ICD
Continuous antidepressant medicationtreatment in acute phase
% of persons age ≥18 years who are diagnosed with a new episode of depression and treated with antidepressantmedication, with an 84-day (12treatment with antidepressant medication
Individuals administered Electro ConvulsionTherapy, rate per 100,000 population aged 16-64 years
25
TOT
stabilizing agent during the study period; c) No filledprescription for a mood stabilizer
All patients with bipolar I disorder
Those patients in the denominator with at least onevisit per quarter (four visits per year) during the study period:a)With a licensed prescribing provider; b) With any mental health
Patients diagnosed with bipolar I disorder
0
0
0
% of major depression patients with a new treatment episodehaving documentation of timely comorbid assessment, includingthe presence or absence of: (a) Alcohol or other drug use; (b)Medication use and (c) History of bipolar symptoms
0
Percentage of patients with newly diagnosed depression inwhom disease severity was assessed with established scales(Patient Health questionnaire-Depression, Beck’s DepressionInventory, Hospital Anxiety and Depression Scale, ICD-10)
0
≥18 years who are diagnosed with a new episode of depression and treated with antidepressant
day (12-week acute treatment phase)treatment with antidepressant medication
0
0
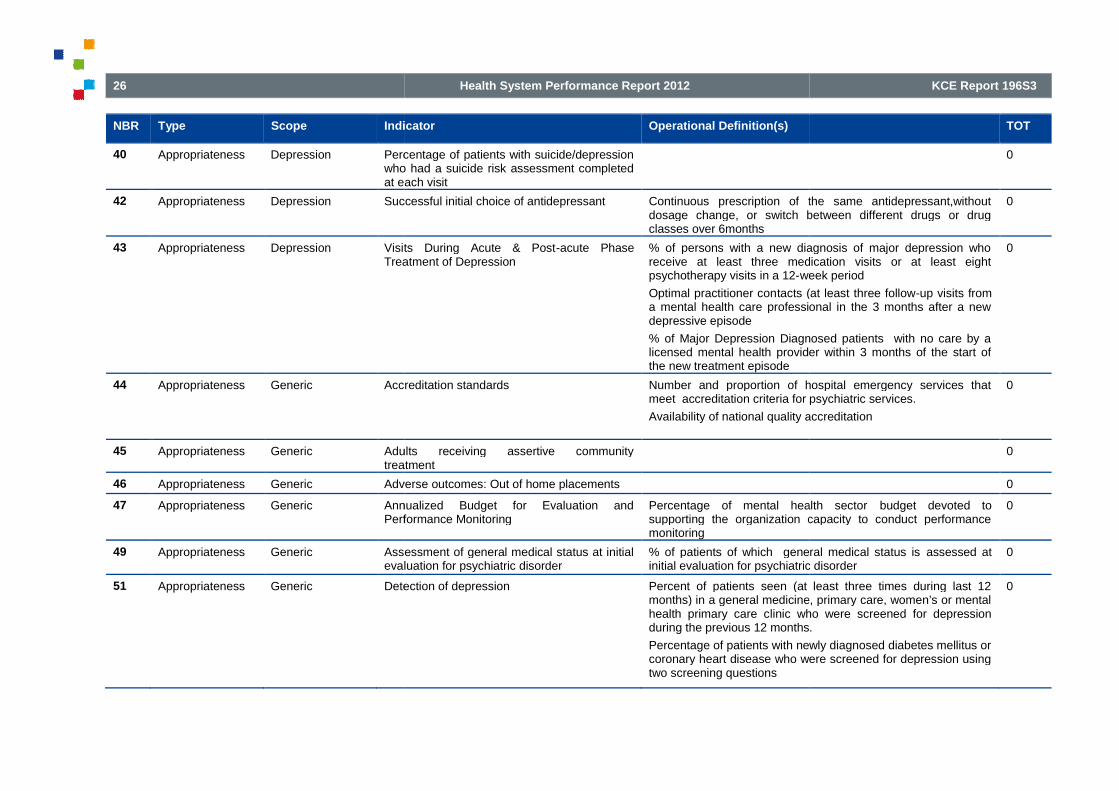
26
NBR Type Scope Indicator
40 Appropriateness Depression Percentage of patients with suicide/depressionwho had a suicide risk assessment completedat ea
42 Appropriateness Depression Successful initial choice of antidepressant
43 Appropriateness Depression Visits During Acute & PostTreatment of Depression
44 Appropriateness Generic Accreditation standards
45 Appropriateness Generic Adults receiving assertive communitytreatment
46 Appropriateness Generic Adverse outcomes: Out of home placements
47 Appropriateness Generic Annualized Budget for Evaluation andPerformance Monitoring
49 Appropriateness Generic Assessment of general medical status at initialevaluation for psychiatric disorder
51 Appropriateness Generic Detection of depression
Health System Performance Report 2012
Indicator Operational Definition(s)
Percentage of patients with suicide/depressionwho had a suicide risk assessment completedat each visit
Successful initial choice of antidepressant Continuous prescription of the same antidepressant,withoutdosage change, or switch between different drugs or drugclasses over 6months
Visits During Acute & Post-acute PhaseTreatment of Depression
% of persons with a new diagnosis of major depression whoreceive at least three medication visits or at least eightpsychotherapy visits in a 12-week period
Optimal practitioner contacts (at least three followa mental health care professional in the 3 months after a newdepressive episode
% of Major Depression Diagnosed patients with no care by alicensed mental health provider within 3 months of the start ofthe new treatment episode
Accreditation standards Number and proportion of hospital emergency services thatmeet accreditation criteria for psychiatric services.
Availability of national quality accreditation
Adults receiving assertive communitytreatment
Adverse outcomes: Out of home placements
Annualized Budget for Evaluation andPerformance Monitoring
Percentage of mental health sectorsupporting the organization capacity to conduct performancemonitoring
Assessment of general medical status at initialevaluation for psychiatric disorder
% of patients of which general medical status isinitial evaluation for psychiatric disorder
Detection of depression Percent of patients seen (at least three times during last 12months) in a general medicine, primary care, women’s or mentalhealth primary care clinic who were screened for depressionduring the previous 12 months.
Percentage of patients with newly diagnosed diabetes mellitus orcoronary heart disease who were screened for depression usingtwo screening questions
KCE Report 196S3
TOT
0
Continuous prescription of the same antidepressant,withoutdosage change, or switch between different drugs or drug
0
% of persons with a new diagnosis of major depression whoreceive at least three medication visits or at least eight
week period
tacts (at least three follow-up visits froma mental health care professional in the 3 months after a new
% of Major Depression Diagnosed patients with no care by alicensed mental health provider within 3 months of the start of
0
Number and proportion of hospital emergency services thatmeet accreditation criteria for psychiatric services.
Availability of national quality accreditation
0
0
0
Percentage of mental health sector budget devoted tosupporting the organization capacity to conduct performance
0
% of patients of which general medical status is assessed atinitial evaluation for psychiatric disorder
0
Percent of patients seen (at least three times during last 12months) in a general medicine, primary care, women’s or mental
linic who were screened for depressionduring the previous 12 months.
Percentage of patients with newly diagnosed diabetes mellitus orcoronary heart disease who were screened for depression using
0

KCE Report 196S3
NBR Type Scope Indicator
54 Appropriateness Generic Involuntary Committal Rate
55 Appropriateness Generic Least Restrictive Setting
56 Appropriateness Generic Mental Health Promotion Policy
57 Appropriateness Generic Outcomes readiness
58 Appropriateness Generic Percentage of staff trained in HoNos (MentalHealth Outcomes
60 Appropriateness Generic Proportion of patients with completed
Health System Performance Report 2012
Indicator Operational Definition(s)
Use of standardized assessmentdepression
Screening patients diagnosed with dementia for depression
Involuntary Committal Rate Rate of involuntary committals as a percentage of allhospitalizations per annum.
% of voluntary inpatient/inpatients subject to compulsorytreatment by Board
Rate of compulsory assessments that commence but do notprogress to a compulsory treatment order
the number of clients on communitytreatment orders ( CCTOs) as a percentage of cCommunity Mental Health Services [total compulsory treatmentorders ( CTOs)].
the proportion of individuals with any MHD diagnosis dischargedfrom an inpatient or residential SUD specialty care setting whoreport having an episode ofdischarge
Rate of service provider population with Severe Mental Illnessapprehended or incarcerated compared to rate for generalpopulation.
Least Restrictive Setting Ratio served in inpatient care to outpatient care
Mental Health Promotion Policy % of local implementation teams (LITs) selfa mental health promotion lead officer
% of LITs self-assessed as ‘GREEN’ for having a mental healthpromotion strategy and action plan
Outcomes readiness Proportion of mental health episodes with clinical outcomeassessments completed
Percentage of staff trained in HoNos (MentalHealth Outcomes Profile)
Proportion of patients with completed
27
TOT
Use of standardized assessment tools (for example, PHQ-9) for
Screening patients diagnosed with dementia for depression
Rate of involuntary committals as a percentage of all
npatient/inpatients subject to compulsory
Rate of compulsory assessments that commence but do notprogress to a compulsory treatment order
the number of clients on community-based compulsorytreatment orders ( CCTOs) as a percentage of clients known toCommunity Mental Health Services [total compulsory treatment
the proportion of individuals with any MHD diagnosis dischargedfrom an inpatient or residential SUD specialty care setting whoreport having an episode of incarceration within 6 months of
Rate of service provider population with Severe Mental Illnessapprehended or incarcerated compared to rate for general
0
care to outpatient care 0
% of local implementation teams (LITs) self-assessed as havinga mental health promotion lead officer
assessed as ‘GREEN’ for having a mental healthpromotion strategy and action plan
0
Proportion of mental health episodes with clinical outcome 0
0
0

28
NBR Type Scope Indicator
diagnostic assessment
62 Appropriateness Generic Seclusion
63 Appropriateness Generic Suicide prevention projects
64 Appropriateness Generic Treatment Protocols
65 Appropriateness Learningdisabilities
Best practice in mental health services forpeople with a learning disability
66 Appropriateness Post-traumaticstress
% of PTSD Patients who have an assessmentof PTSD symptoms withinnew treatment episode
67 Appropriateness Post-traumaticstress
Proportion of all PTSD patients with a newtreatment episode who are assessed fordepression
68 Appropriateness Post-traumaticstress
Proportion of patientsSpecialized Intensive PTSD Programs (SIPP)
69 Appropriateness Post-traumaticstress
Proportion of Posttraumatic stress disorder(PTSD) patients who are monitored regardingsymptom severity
70 Appropriateness Psychoticdisorders
Daily antipsychotic dosagechlorpromazine (CPZ ) equivalents per kgbody weigh at discharge for individual < 18hospitalized for psychotic disorder
71 Appropriateness Psychoticdisorders
Percentage of caregivers of eligible psychoticpatient provided with psychoeducation and
Health System Performance Report 2012
Indicator Operational Definition(s)
diagnostic assessment
Seclusion Percentage of clients admitted for inpatient psychiatric care whoexperience seclusion per facility per year.
Hours of seclusion as a percent of total client hours duringadmission per facility per year.
Suicide prevention projects % of primary care trusts with completed suicide audit
Treatment Protocols for Co-morbidity Number of community mental health programs that screen forsubstance use disorders and have an appropriate protocol fortreatment and/or referral.
Proportion of severe mental illness patients with identifiedsubstance misuse receiving addi
Best practice in mental health services forpeople with a learning disability
% of PTSD Patients who have an assessmentof PTSD symptoms within the first 30 days of anew treatment episode
Proportion of all PTSD patients with a newtreatment episode who are assessed fordepression
Proportion of patients receiving anySpecialized Intensive PTSD Programs (SIPP)
Numerator: Number of patients receiving any SIPP care a) In the60 days following the start of a new treatment episode; b) Duringthe study period
Denominator: Patients diagnosed with PTSD a) In a netreatment episode; b) All patients
Proportion of Posttraumatic stress disorder(PTSD) patients who are monitored regardingsymptom severity
Daily antipsychotic dosage between 0.5–9.0chlorpromazine (CPZ ) equivalents per kgbody weigh at discharge for individual < 18hospitalized for psychotic disorder
% of hospitalized children (<18 years) with a psychotic disorderwith a daily antipsychotic dosage between 0.5equivalents per kg body weigh at discharge
Percentage of caregivers of eligible psychoticpatient provided with psychoeducation and
KCE Report 196S3
TOT
Percentage of clients admitted for inpatient psychiatric care whoexperience seclusion per facility per year.
Hours of seclusion as a percent of total client hours duringadmission per facility per year.
0
% of primary care trusts with completed suicide audit 0
Number of community mental health programs that screen forsubstance use disorders and have an appropriate protocol for
Proportion of severe mental illness patients with identifiedsubstance misuse receiving addictions treatment.
0
0
0
0
Number of patients receiving any SIPP care a) In the60 days following the start of a new treatment episode; b) During
Patients diagnosed with PTSD a) In a newtreatment episode; b) All patients
0
0
% of hospitalized children (<18 years) with a psychotic disorderwith a daily antipsychotic dosage between 0.5–9.0 CPZequivalents per kg body weigh at discharge
0
0

KCE Report 196S3
NBR Type Scope Indicator
support
72 Appropriateness Schizophrenia % schizo patients receivingtraining visits
73 Appropriateness Schizophrenia % schizo patients with annual assessment ofweight/ BMI, glycemic control, and lipidsamong schizo patients
75 Appropriateness Schizophrenia Cumulative daily antipsychotic dosagebetween 300)equivalents at hospital discharge forschizophrenia
77 Appropriateness Schizophrenia Proportion of selected schizophrenia patientswho receive anticomorbid depression in addition to theirantipsychotic regimen
79 Appropriateness Schizophrenia Proportion of selected schizophrenia patientswith appropriate shortantipsychotic medications
81 Appropriateness Substance-abuse % patients with opiate dependency receivingOpiate agonist therapy as first line of defense
Health System Performance Report 2012
Indicator Operational Definition(s)
support
% schizo patients receiving social skillstraining visits
% schizo patients with annual assessment ofweight/ BMI, glycemic control, and lipidsamong schizo patients
Cumulative daily antipsychotic dosagebetween 300–1000 chlorpromazine (CPZ)equivalents at hospital discharge forschizophrenia
% of patients with schizophrenia that receive a cumulative dailyantipsychotic dosage between 300hospital discharge
Proportion of selected schizophrenia patientswho receive anti-depressant medication forcomorbid depression in addition to theirantipsychotic regimen
Numerator: Patients in the denominator with simultaneousantidepressant and antipsychotic prescriptions in the studyperiod
Denominator: Patients diagnosed with schizophrenia andcomorbid depression who are not in a new treatment episode
Proportion of selected schizophrenia patientswith appropriate short-term utilization ofantipsychotic medications
Numerator: a) Patients prescribed an antipsychotic for 12 weeksfollowing the start of a new treatment episode; b) Patientsprescribed an antipsychotic for less than 12 weeks following thestart of a new treatment episode; c) Patients with no filledprescription for an antipsychotic during the 12 weeks followingthe start of a new treatment episode
Denominator: All patients with sepisode
Percentage of patients with schizophrenia receiving newgeneration (e.g. Clozapine, Quetiapine, Olanzapine,Risperidone, (Ziprasidone) medication
% patients with opiate dependency receivingOpiate agonist therapy as first line of defense
29
TOT
0
0
% of patients with schizophrenia that receive a cumulative dailyantipsychotic dosage between 300–1000 CPZ equivalents at
0
Patients in the denominator with simultaneousantidepressant and antipsychotic prescriptions in the study
Patients diagnosed with schizophrenia andcomorbid depression who are not in a new treatment episode
0
a) Patients prescribed an antipsychotic for 12 weeksfollowing the start of a new treatment episode; b) Patients
scribed an antipsychotic for less than 12 weeks following thestart of a new treatment episode; c) Patients with no filledprescription for an antipsychotic during the 12 weeks followingthe start of a new treatment episode
All patients with schizophrenia in a new treatment
Percentage of patients with schizophrenia receiving newgeneration (e.g. Clozapine, Quetiapine, Olanzapine,Risperidone, (Ziprasidone) medication
0
0

30
NBR Type Scope Indicator
83 Appropriateness Substance-abuse Early discharge rates from residential care forSubstance Use Disorder
84 Appropriateness Substance-abuse Proportion of patients with Cohealth and substance use disorders andsevere functional impairment that receiveintegrated substance abuse and mental healthtreatment
86 Appropriateness Substance-abuse The proportion of providers in a substance usedisorders specialty care setting who aretrained to provide specified mental health care
87 Continuity Generic % ofas achieving full local integration between NHSand social services partners
88 Continuity Generic % of Healthcare Commission surveyrespondents that had an outtelephone number
90 Continuity Generic Communication between providers
92 Continuity Generic Continuity of visits after hospitalisation for dualpsychiatric/ substance related conditions
94 Continuity Generic Continuity of visits after mental healthtreatment initiation
96 Continuity Generic Delayed transfers of care
97 Continuity Generic Drop
Health System Performance Report 2012
Indicator Operational Definition(s)
Early discharge rates from residential care forSubstance Use Disorder
Numerator:
a) Inpatient admission in the denominatordischarged from residential care for SUD within one week ofadmission
b) Total length of stay in days per related inpatient admission forpatients in the denominator discharged from residential care forSUD
Denominator: SUD-related inpatperiod for patients with cohort diagnosis of SUD
Proportion of patients with Co-occurring mentalhealth and substance use disorders andsevere functional impairment that receiveintegrated substance abuse and mental healthtreatment
The proportion of providers in a substance usedisorders specialty care setting who aretrained to provide specified mental health care
the proportion of (substance use disorders ( SUD) providers in aSUD specialty care setting who are trained to provide specifiedmental health care, and who have a certificate, license or someother documentation to demonstrate proficiency
% of community mental health teams reportedas achieving full local integration between NHSand social services partners
% of Healthcare Commission surveyrespondents that had an out-of-hours contacttelephone number
Communication between providers
Continuity of visits after hospitalisation for dualpsychiatric/ substance related conditions
% of persons discharged with a dual diagnosis of psychiatricdisorder and substance abuse with at least four psychiatric andat least four substance abuse visits within the 12 months afterdischarge
Continuity of visits after mental health-relatedtreatment initiation
Receipt of at least two additional outpatientdays after initiation of treatment
Delayed transfers of care the number of discharges for mental health specialties delayedby 6 weeks or longer than scheduled per 1,000 population
Drop-outs; Community do not attend rate
KCE Report 196S3
TOT
a) Inpatient admission in the denominator where patient wasdischarged from residential care for SUD within one week of
b) Total length of stay in days per related inpatient admission forpatients in the denominator discharged from residential care for
related inpatient admissions during the studyperiod for patients with cohort diagnosis of SUD
0
0
(substance use disorders ( SUD) providers in aSUD specialty care setting who are trained to provide specifiedmental health care, and who have a certificate, license or someother documentation to demonstrate proficiency
0
0
0
0
% of persons discharged with a dual diagnosis of psychiatricabuse with at least four psychiatric and
at least four substance abuse visits within the 12 months after
0
Receipt of at least two additional outpatient services within 30days after initiation of treatment
0
the number of discharges for mental health specialties delayedby 6 weeks or longer than scheduled per 1,000 population
0
0

KCE Report 196S3
NBR Type Scope Indicator
100 Continuity Generic Numbers of patients diverted from the criminaljustice system
102 Continuity Generic Post discharge continuing care plan
103 Continuity Generic Pre-
106 Continuity Generic Repatriation of SMI Clients
107 Continuity Generic Single Point of accountability
108 Continuity Generic The percentage of consumersservices that support recovery
111 Continuity Generic The percentage of service recipients who hada change in principal mental healthcareprovider during the year or term of treatment
112 Continuity Generic The proportion of resources expended onservices that promote recovery
114 Continuity Schizophrenia Intentive case management for patients withschizophrenia
Health System Performance Report 2012
Indicator Operational Definition(s)
Numbers of patients diverted from the criminaljustice system
Post discharge continuing care plan Percentage of patients discharged from acute(excluding those discharged against medical advice) who have adocumented discharge plan
Percentage of patients with a post discharge continuing careplan
Percentage of patients for which post discharge continuing careplan is transmitted to next level of
-admission community care Percentage of patients with primary care contact prior to mentalhealth admission
Repatriation of SMI Clients Percentage of clients transferredcare who return to home community upon discharge.
Single Point of accountability Existence of single mental health authority at local level.
The percentage of consumers who receiveservices that support recovery
The percentage of service recipients who hada change in principal mental healthcareprovider during the year or term of treatment
The total number of service recipients who had aprincipal mental healthcare provider during the yeatreatment, divided by all mental health service recipients duringthe year
The proportion of resources expended onservices that promote recovery
Intentive case management for patients withschizophrenia
% of patients with 4 ER visits or 2 hospitschizophrenia in 12-month period that are enrolled in intensivecase management (ICM)
31
TOT
0
Percentage of patients discharged from acute-care facilities(excluding those discharged against medical advice) who have a
Percentage of patients with a post discharge continuing care
Percentage of patients for which post discharge continuing careplan is transmitted to next level of care provider upon discharge
0
Percentage of patients with primary care contact prior to mental 0
Percentage of clients transferred out of region for acuteor tertiarycare who return to home community upon discharge.
0
Existence of single mental health authority at local level. 0
0
The total number of service recipients who had a change inmental healthcare provider during the year or term of
by all mental health service recipients during
0
0
% of patients with 4 ER visits or 2 hospitalizations formonth period that are enrolled in intensive
0
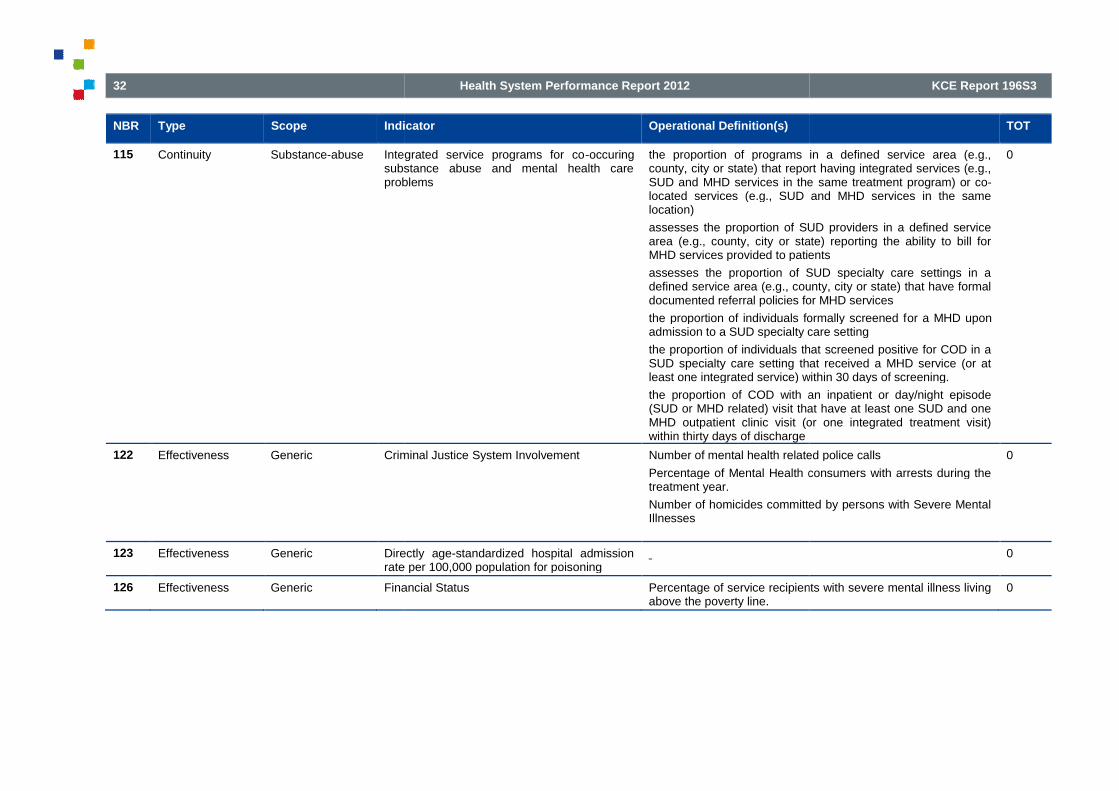
32
NBR Type Scope Indicator
115 Continuity Substance-abuse Integrated service programs for cosubstance abuse and mental health careproblems
122 Effectiveness Generic Criminal Justice
123 Effectiveness Generic Directlyrate per 100,000 population for poisoning
126 Effectiveness Generic Financial Status
Health System Performance Report 2012
Indicator Operational Definition(s)
Integrated service programs for co-occuringsubstance abuse and mental health careproblems
the proportion of programs in a defined service area (e.g.,county, city or state) that report having integrated services (e.g.,SUD and MHD services in thelocated services (e.g., SUD and MHD services in the samelocation)
assesses the proportion of SUD providers in a defined servicearea (e.g., county, city or state) reporting the ability to bill forMHD services provided to patients
assesses the proportion of SUD specialty care settings in adefined service area (e.g., county, city or state) that have formaldocumented referral policies for MHD services
the proportion of individuals formally screened fadmission to a SUD specialty care setting
the proportion of individuals that screened positive for COD in aSUD specialty care setting that received a MHD service (or atleast one integrated service) within 30 days of screening.
the proportion of COD with an inpatient or day/night episode(SUD or MHD related) visit that have at least one SUD and oneMHD outpatient clinic visit (or one integrated treatment visit)within thirty days of discharge
Criminal Justice System Involvement Number of mental health related police calls
Percentage of Mental Health consumers with arrests during thetreatment year.
Number of homicides committed by persons with Severe MentalIllnesses
Directly age-standardized hospital admissionrate per 100,000 population for poisoning
Financial Status Percentage of service recipients with severe mental illness livingabove the poverty line.
KCE Report 196S3
TOT
the proportion of programs in a defined service area (e.g.,county, city or state) that report having integrated services (e.g.,SUD and MHD services in the same treatment program) or co-located services (e.g., SUD and MHD services in the same
assesses the proportion of SUD providers in a defined servicearea (e.g., county, city or state) reporting the ability to bill for
D services provided to patients
assesses the proportion of SUD specialty care settings in adefined service area (e.g., county, city or state) that have formaldocumented referral policies for MHD services
the proportion of individuals formally screened for a MHD uponadmission to a SUD specialty care setting
the proportion of individuals that screened positive for COD in aSUD specialty care setting that received a MHD service (or atleast one integrated service) within 30 days of screening.
n of COD with an inpatient or day/night episode(SUD or MHD related) visit that have at least one SUD and oneMHD outpatient clinic visit (or one integrated treatment visit)
0
Number of mental health related police calls
Percentage of Mental Health consumers with arrests during the
Number of homicides committed by persons with Severe Mental
0
0
Percentage of service recipients with severe mental illness living 0
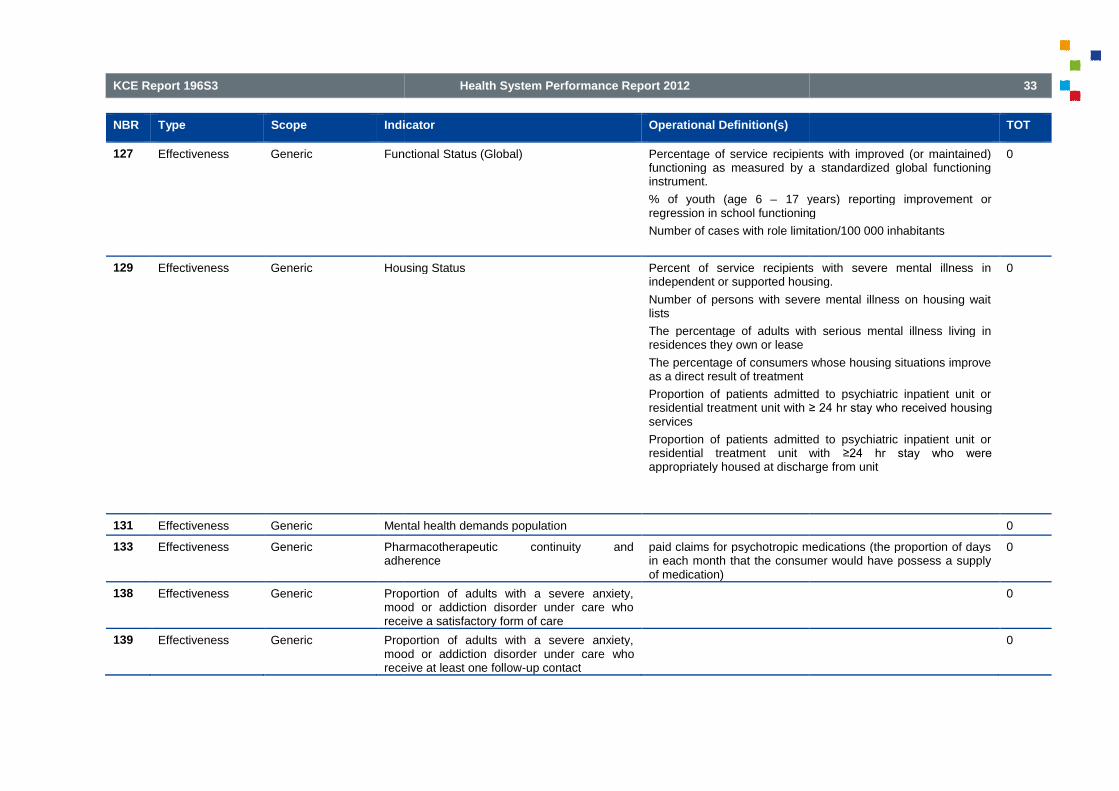
KCE Report 196S3
NBR Type Scope Indicator
127 Effectiveness Generic Functional
129 Effectiveness Generic Housing Status
131 Effectiveness Generic Mental health demands population
133 Effectiveness Generic Pharmacotherapeutic continuity andadherence
138 Effectiveness Generic Proportion of adults with a severe anxiety,mood or addiction disorder under care whoreceive a satisfactory form of care
139 Effectiveness Generic Proportion of adults with a severe anxiety,mood or addiction disorder under carereceive at least one follow
Health System Performance Report 2012
Indicator Operational Definition(s)
Functional Status (Global) Percentage of service recipients with improved (or maintained)functioning as measured by a standardized global functioninginstrument.
% of youth (age 6 – 17 years) reporting improvement orregression in school functioning
Number of cases with role limitation/100 000 inhabitants
Housing Status Percent of service recipients with severe mental illness inindependent or supported housing.
Number of persons with severe mental illness on housing waitlists
The percentage of adults with serious mental illness living inresidences they own or lease
The percentage of consumers whose housing situations improveas a direct result of treatment
Proportion of patients admitted to psychiatric inpatient unit orresidential treatment unit with ≥ 24 hr stay who received housing services
Proportion of patients admitted to psychiatric inpatient unit orresidential treatment unit withappropriately housed at discharge from unit
Mental health demands population
Pharmacotherapeutic continuity andadherence
paid claims for psychotropic medications (the proportion of daysin each month that the consumer would have possess a supplyof medication)
Proportion of adults with a severe anxiety,mood or addiction disorder under care whoreceive a satisfactory form of care
Proportion of adults with a severe anxiety,mood or addiction disorder under care whoreceive at least one follow-up contact
33
TOT
Percentage of service recipients with improved (or maintained)functioning as measured by a standardized global functioning
17 years) reporting improvement orression in school functioning
s with role limitation/100 000 inhabitants
0
Percent of service recipients with severe mental illness inindependent or supported housing.
Number of persons with severe mental illness on housing wait
percentage of adults with serious mental illness living in
The percentage of consumers whose housing situations improve
Proportion of patients admitted to psychiatric inpatient unit or≥ 24 hr stay who received housing
Proportion of patients admitted to psychiatric inpatient unit orresidential treatment unit with ≥24 hr stay who were appropriately housed at discharge from unit
0
0
paid claims for psychotropic medications (the proportion of daysin each month that the consumer would have possess a supply
0
0
0
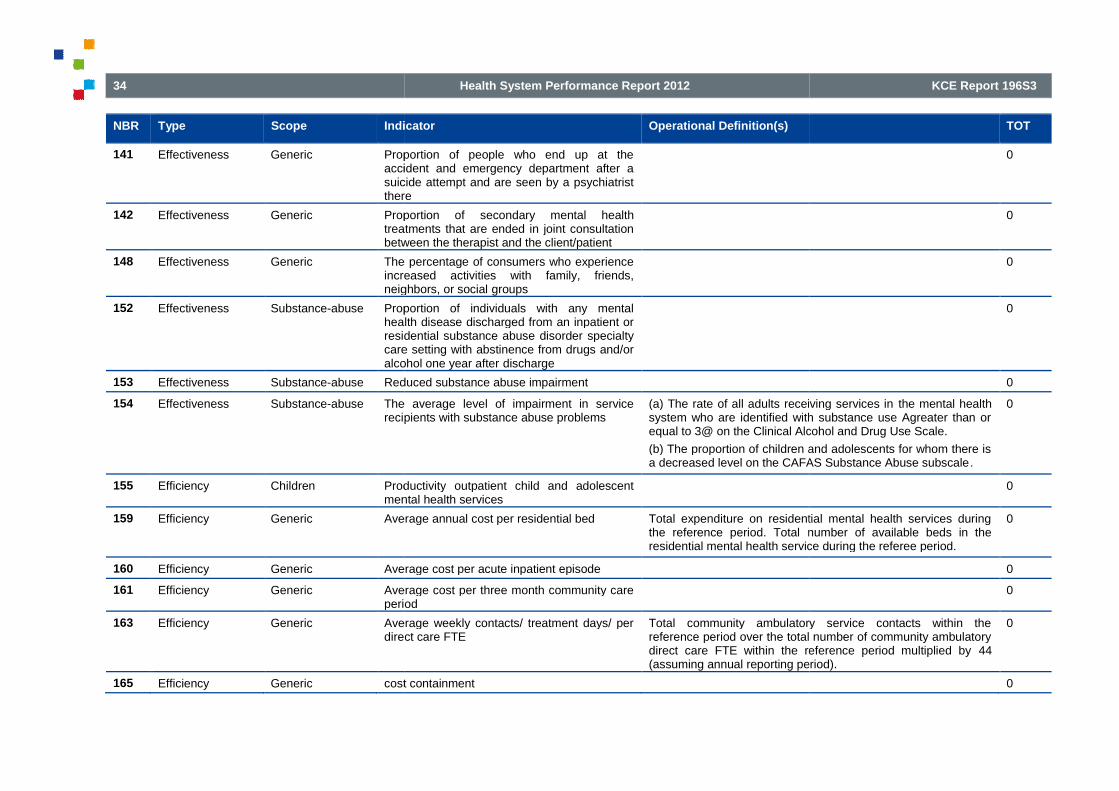
34
NBR Type Scope Indicator
141 Effectiveness Generic Proportion of people who end up at theaccident and emergency department after asuicide attempt and are seen by a psychiatristthere
142 Effectiveness Generic Proportion oftreatments that are ended in joint consultationbetween the therapist and the client/patient
148 Effectiveness Generic The percentage of consumers who experienceincreased activities with family, friends,neighbors, or social
152 Effectiveness Substance-abuse Proportion of individuals with any mentalhealth disease discharged from an inpatient orresidential substance abuse disorder specialtycare setting with abstinence from drugs and/oralcohol one year after
153 Effectiveness Substance-abuse Reduced substance abuse impairment
154 Effectiveness Substance-abuse The average level of impairment in servicerecipients with substance abuse problems
155 Efficiency Children Productivity outpatient child and adolescentmental health services
159 Efficiency Generic Average annual cost per residential bed
160 Efficiency Generic Average cost per acute inpatient episode
161 Efficiency Generic Average cost per three month community careperiod
163 Efficiency Generic Average weekly contacts/ treatment days/ perdirect care FTE
165 Efficiency Generic cost containment
Health System Performance Report 2012
Indicator Operational Definition(s)
Proportion of people who end up at theaccident and emergency department after asuicide attempt and are seen by a psychiatristthere
Proportion of secondary mental healthtreatments that are ended in joint consultationbetween the therapist and the client/patient
The percentage of consumers who experienceincreased activities with family, friends,neighbors, or social groups
Proportion of individuals with any mentalhealth disease discharged from an inpatient orresidential substance abuse disorder specialtycare setting with abstinence from drugs and/oralcohol one year after discharge
Reduced substance abuse impairment
The average level of impairment in servicerecipients with substance abuse problems
(a) The rate of all adults receiving services insystem who are identified with substance use Agreater than orequal to 3@ on the Clinical Alcohol and Drug Use Scale.
(b) The proportion of children and adolescents for whom there isa decreased level on the CAFAS Substance Abuse subscale
Productivity outpatient child and adolescentmental health services
Average annual cost per residential bed Total expenditure on residential mental health services duringthe reference period. Total number of available beds in theresidential mental health service during the referee period.
Average cost per acute inpatient episode
Average cost per three month community careperiod
Average weekly contacts/ treatment days/ perdirect care FTE
Total community ambulatory service contacts within thereference period over the total number of community ambulatorydirect care FTE within the reference period multiplied by(assuming annual reporting period).
cost containment
KCE Report 196S3
TOT
0
0
0
0
0
(a) The rate of all adults receiving services in the mental healthsystem who are identified with substance use Agreater than orequal to 3@ on the Clinical Alcohol and Drug Use Scale.
(b) The proportion of children and adolescents for whom there isa decreased level on the CAFAS Substance Abuse subscale.
0
0
Total expenditure on residential mental health services duringnumber of available beds in the
residential mental health service during the referee period.
0
0
0
Total community ambulatory service contacts within thereference period over the total number of community ambulatorydirect care FTE within the reference period multiplied by 44(assuming annual reporting period).
0
0

KCE Report 196S3
NBR Type Scope Indicator
166 Efficiency Generic Expenditures per enrollee on dissemination ofpreventive information
167 Efficiency Generic Labour Overhead
168 Efficiency Generic Needs Based Resource Allocation Strategy
169 Efficiency Generic Number of consultation
171 Efficiency Generic Price divided by units of service (for example,per diem rate, case rate, and premium permember per month)
173 Efficiency Generic Proportion of expenditures on
174 Efficiency Generic Proportion of outseparations
175 Efficiency Generic The average resources per enrollee expendedon mental health services.
176 Efficiency Generic Throughput time
178 Efficiency Generic utilization of capacity
179 Patient-centeredness
Children The proportionmental health services provided in a naturalsetting (home, school, and work)
180 Patient-centeredness
Generic Adequate provision of information ontreatment/support
181 Patient-centeredness
Generic Adults receiving peer
Health System Performance Report 2012
Indicator Operational Definition(s)
Expenditures per enrollee on dissemination ofpreventive information
Labour Overhead Proportion of dollars spent ontime employees (FTEs) to dollars spent on total FTEs.
Needs Based Resource Allocation Strategy Existence of a regional mental health funding formula reflectinga needs-based resource allocation
Number of consultation
Price divided by units of service (for example,per diem rate, case rate, and premium permember per month)
Proportion of expenditures on administration
Proportion of out-of-scope overnightseparations
Number of overnight separations deemed outacute psychiatric inpatient units within the reference period overthe total number of overnight separations from acute psychiatricinpatient units during the reference period.
The average resources per enrollee expendedon mental health services.
The total amount of direct service expenditures on mental health
services in one year, divided by the total number of fullenrollees
who received at least one mental health service
Throughput time
utilization of capacity
The proportion of resources expended onmental health services provided in a naturalsetting (home, school, and work)
For child and adolescent enrollees only: the total amount ofdirect service expenditures on mental health services that areprovided in the child's homeamount of direct service expenditures for children andadolescents
Adequate provision of information ontreatment/support
Adults receiving peer support services Numerator: Unduplicated number of consumers with severemental illness receiving peer support services (e.g. dropcenters, peer case management, peer professional services,and social clubs)during the reporting period.
Denominator: Unduplicated number of adults with serious mental
35
TOT
0
Proportion of dollars spent on administrative and support full-time employees (FTEs) to dollars spent on total FTEs.
0
Existence of a regional mental health funding formula reflectingbased resource allocation strategy.
0
0
0
0
Number of overnight separations deemed out-of-scope fromacute psychiatric inpatient units within the reference period over
separations from acute psychiatricinpatient units during the reference period.
0
The total amount of direct service expenditures on mental health
one year, divided by the total number of full-time
who received at least one mental health service
0
0
0
For child and adolescent enrollees only: the total amount ofdirect service expenditures on mental health services that are
in one year, divided by the totalamount of direct service expenditures for children and
0
0
Unduplicated number of consumers with severemental illness receiving peer support services (e.g. drop-incenters, peer case management, peer professional services,and social clubs)during the reporting period.
plicated number of adults with serious mental
0
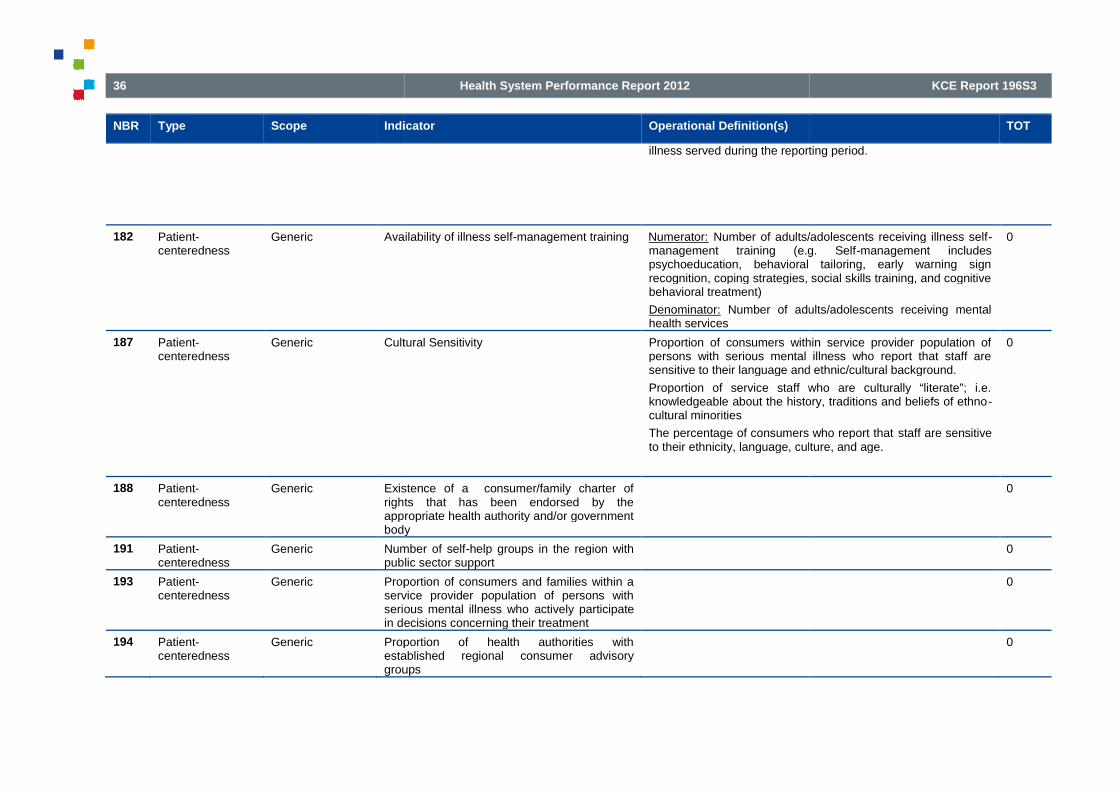
36
NBR Type Scope Indicator
182 Patient-centeredness
Generic Availability of illness self
187 Patient-centeredness
Generic Cultural Sensitivity
188 Patient-centeredness
Generic Existence of a consumer/family charter ofrights that has been endorsed by theappropriate health authority and/or governmentbody
191 Patient-centeredness
Generic Number of selfpublic sector support
193 Patient-centeredness
Generic Proportion of consumers and families within aservice provider population of persons withserious mental illness whoin decisions concerning their treatment
194 Patient-centeredness
Generic Proportion of health authorities withestablished regional consumer advisorygroups
Health System Performance Report 2012
Indicator Operational Definition(s)
illness served during the reporting period.
Availability of illness self-management training Numerator: Number of adults/adolescents receiving illness selfmanagement training (e.g. Selfpsychoeducation, behavioral tailoring, early warning signrecognition, coping strategies, social skills training, and cognitivebehavioral treatment)
Denominator: Number of adults/adolescents receiving mentalhealth services
Cultural Sensitivity Proportion of consumers within service provider population ofpersons with serious mental illness who report that staff aresensitive to their language and ethnic/cultural background.
Proportion of service staff who are culturally “literate”; i.e.knowledgeable about the history, traditions and beliefs of ethnocultural minorities
The percentage of consumers who report thatto their ethnicity, language, culture, and age.
Existence of a consumer/family charter ofrights that has been endorsed by theappropriate health authority and/or governmentbody
Number of self-help groups in the region withpublic sector support
Proportion of consumers and families within aservice provider population of persons withserious mental illness who actively participatein decisions concerning their treatment
Proportion of health authorities withestablished regional consumer advisorygroups
KCE Report 196S3
TOT
illness served during the reporting period.
Number of adults/adolescents receiving illness self-management training (e.g. Self-management includespsychoeducation, behavioral tailoring, early warning signrecognition, coping strategies, social skills training, and cognitive
Number of adults/adolescents receiving mental
0
Proportion of consumers within service provider population ofpersons with serious mental illness who report that staff aresensitive to their language and ethnic/cultural background.
Proportion of service staff who are culturally “literate”; i.e.knowledgeable about the history, traditions and beliefs of ethno-
The percentage of consumers who report that staff are sensitiveto their ethnicity, language, culture, and age.
0
0
0
0
0

KCE Report 196S3
NBR Type Scope Indicator
195 Patient-centeredness
Generic The percentage of enrollees who areconsumers and family members who serve onplanning and development groups or hold paidstaff positions in the health plan.
196 Safety Bipolar disorder % patients with bipolar disorders assessedregularly for medication side effects
199 Safety Generic Average number of assaults per inpatient bednight
200 Safety Generic Hazards due to lack of information withemergency admissions
201 Safety Generic Information about the side
204 Safety Generic Number and proportion of staff trained yearlyin non
206 Safety Generic Percentageprevention, education and training
207 Safety Generic Undesired combination of medication andclinical care
208 Safety Schizophrenia % schizophrenia assessed regularly formedication side effects
209 Sustainability Generic % in total planned investment in adult mentalhealth services by main provider type
211 Sustainability Generic Amount of training delivered to and supervisionprovided by mental health staff e.g. stafftraining in Care Programme Approach, selfharm and suicide, looked after children
214 Sustainability Generic Full year cost per
Health System Performance Report 2012
Indicator Operational Definition(s)
The percentage of enrollees who are adultconsumers and family members who serve onplanning and development groups or hold paidstaff positions in the health plan.
The total number of full-time(either direct care or administrative) that are occupied byconsumers of mental health services, divided by the totalnumber of FTE direct care and/or administrative positions
The total number of family members on planning, evaluation,and Total Quality Management teams, divided by the totalmembership of these groups.
% patients with bipolar disorders assessedregularly for medication side effects
Percentage of patients with bipolar disorders for whiChmedication side effects are assessed 2initiation of any antipsychotic treatment
Average number of assaults per inpatient bednight
Hazards due to lack of information withemergency admissions
Information about the side-effects of medicines Percentage of (psychotic) patients with structured assessment ofmedication side effects done at least twice in 1 year
Number and proportion of staff trained yearlyin non-violent crisis intervention
Percentage of staff trained in suicideprevention, education and training
Undesired combination of medication andclinical care
% schizophrenia assessed regularly formedication side effects
Percentage of patients with schizophrenia for whiCh medicationside effects are assessed 2–4 months after the initiation of anyantipsychotic treatment
% in total planned investment in adult mentalhealth services by main provider type
Amount of training delivered to and supervisionprovided by mental health staff e.g. stafftraining in Care Programme Approach, self-harm and suicide, looked after children
Full year cost per acute inpatient bed Total expenditure for all in-scope acute psychiatric inpatient unitsduring the reference period over the number of inpsychiatric inpatient beds available during the reference period.
37
TOT
time-equivalent (FTE) staff positions(either direct care or administrative) that are occupied byconsumers of mental health services, divided by the totalnumber of FTE direct care and/or administrative positions
The total number of family members on planning, evaluation,and Total Quality Management teams, divided by the total
0
Percentage of patients with bipolar disorders for whiChmedication side effects are assessed 2–4 months after the
antipsychotic treatment
0
0
0
Percentage of (psychotic) patients with structured assessment ofmedication side effects done at least twice in 1 year
0
0
0
0
patients with schizophrenia for whiCh medication4 months after the initiation of any
0
0
0
scope acute psychiatric inpatient unitsduring the reference period over the number of in-scope acutepsychiatric inpatient beds available during the reference period.
0

38
NBR Type Scope Indicator
215 Sustainability Generic Full yearcare FTE
216 Sustainability Generic Information technology use
217 Sustainability Generic Mental Health Staff Satisfaction
219 Sustainability Generic Number of innovations introduced each year
221 Sustainability Generic Resources available for on the jobdevelopment
222 Sustainability Generic Resources available to train staff to meetrequired competencies for role
223 Sustainability Generic Staffing mix per acute patient day
Health System Performance Report 2012
Indicator Operational Definition(s)
Full year cost per community ambulatory directcare FTE
Total expenditure for in-scope community ambulatory serviceswithin the reference period over the total community ambulatorymental health direct care FTE within the reference period.
Information technology use
Mental Health Staff Satisfaction
Number of innovations introduced each year
Resources available for on the jobdevelopment and continuous learning
Resources available to train staff to meetrequired competencies for role
Staffing mix per acute patient day Total direct care staffing hours for nursing/medical/alliedfor in-scope acute psychiatric units during the reference periodover the total direct care staffing hours for inpsychiatric units during the reference period.
KCE Report 196S3
TOT
scope community ambulatory serviceswithin the reference period over the total community ambulatorymental health direct care FTE within the reference period.
0
0
0
0
0
0
Total direct care staffing hours for nursing/medical/allied healthscope acute psychiatric units during the reference period
over the total direct care staffing hours for in-scope acutepsychiatric units during the reference period.
0

KCE Report 196S3
2.4. Intermediate selection during first expert meetingThe short-list and list with excluded indicators were presented during anexpert meeting. Based on suggestions of the experts 22 indicator themesthat were initially excluded from the long-list were againshortlist (i.e. indicator numbers: 5; 11; 25; 26; 54; 75; 78; 99; 102; 103120;125; 129; 156; 186; 188; 189; 191; 193; 203; 202;). The experts suggestedto divide indicator 203 “side effects medication” in two parts (i.e. 203a“Appropriate monitoring of metabolic/cardiovascular side effects forindividuals receiving antipsychotic medication” and 203b “Number ofmedical services and/or hospital services required as a direct result ofpsychotropic medication problems.”). The panel suggested alsoindicator 147 in:
147a “Suicide in general population”;
147b “Suicide attempts in general population”;
The panel suggested to exclude four indicators from the shortlist (i.e. 7;105; 124; 212). Of the 12 indicators suggested by the only 3 indicato128 Hospital readmissions for psychiatric patients; 132 Mortality forPersons with Severe Psychiatric Disorders; 197 Use of AntiAnti-Depressant Drugs Among Elderly Patients) were included directly in
Health System Performance Report 2012
Intermediate selection during first expert meetinglist and list with excluded indicators were presented during an
expert meeting. Based on suggestions of the experts 22 indicator themeslist were again added to the
shortlist (i.e. indicator numbers: 5; 11; 25; 26; 54; 75; 78; 99; 102; 103120;125; 129; 156; 186; 188; 189; 191; 193; 203; 202;). The experts suggestedto divide indicator 203 “side effects medication” in two parts (i.e. 203a
itoring of metabolic/cardiovascular side effects forindividuals receiving antipsychotic medication” and 203b “Number ofmedical services and/or hospital services required as a direct result ofpsychotropic medication problems.”). The panel suggested also to split
”;
The panel suggested to exclude four indicators from the shortlist (i.e. 7;105; 124; 212). Of the 12 indicators suggested by the only 3 indicators (i.e.128 Hospital readmissions for psychiatric patients; 132 Mortality forPersons with Severe Psychiatric Disorders; 197 Use of Anti-Cholinergic
Depressant Drugs Among Elderly Patients) were included directly in
the shortlist. Also the OECD indichealth follow-up rates) was suggested to be included in the subof, for example, indicator 2 “Access to Mental Health Care”. Given theinternational character of the OECD indicators and the likelihood thatOECD will ask Belgium to provide data for this subnear future, the 8 other indicators (i.e. 36; 37; 43; 89; 92; 93; 113; 117)were kept in the list that was submitted to the experts for inevaluation. It should be noted that 3 indicators are also included in Healthat a glance 2011:
128: Hospital readmission (OECD: schizophrenia and bipolardisorders);
147a: Suicide;
224 Total mental health staff numbers per 1000 population (OECD:psychiatrists per 100.000 population).
In addition Health at a glance also includes figures about ‘type of providerconsulted for mental health problems: GP; psychiatrist; psychologist).
During the meeting experts also suggested which operational definitionwas most relevant for the indicator tdefinition was available). (see Table
39
the shortlist. Also the OECD indicator “racial/ethnic disparities in mentalup rates) was suggested to be included in the sub-analysis
of, for example, indicator 2 “Access to Mental Health Care”. Given theinternational character of the OECD indicators and the likelihood that theOECD will ask Belgium to provide data for this sub-set of indicators in thenear future, the 8 other indicators (i.e. 36; 37; 43; 89; 92; 93; 113; 117)were kept in the list that was submitted to the experts for in-depth
that 3 indicators are also included in Health
128: Hospital readmission (OECD: schizophrenia and bipolar
224 Total mental health staff numbers per 1000 population (OECD:psychiatrists per 100.000 population).
n addition Health at a glance also includes figures about ‘type of providerconsulted for mental health problems: GP; psychiatrist; psychologist).
During the meeting experts also suggested which operational definitionwas most relevant for the indicator theme (if more than 1 operational
Table 5)
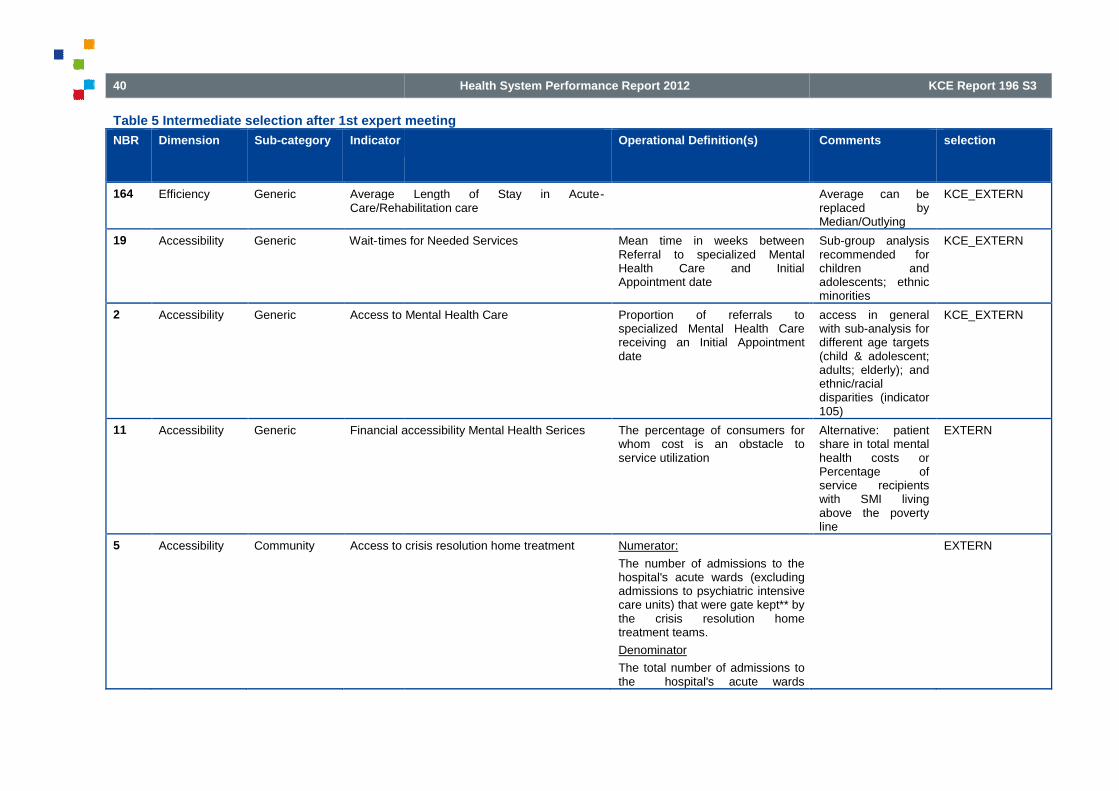
40
Table 5 Intermediate selection after 1st expert meeting
NBR Dimension Sub-category Indicator
164 Efficiency Generic Average Length of Stay in AcuteCare/Rehabilitation care
19 Accessibility Generic Wait-times for Needed Services
2 Accessibility Generic Access to Mental Health Care
11 Accessibility Generic Financial accessibility Mental Health Serices
5 Accessibility Community Access to crisis resolution home treatment
Health System Performance Report 2012
Intermediate selection after 1st expert meeting
Operational Definition(s)
Average Length of Stay in Acute-Care/Rehabilitation care
times for Needed Services Mean time in weeks betweenReferral to specialized MentalHealth Care and InitialAppointment date
Access to Mental Health Care Proportion of referrals tospecialized Mental Health Carereceiving an Initial Appointmentdate
Financial accessibility Mental Health Serices The percentage of consumers forwhom cost is an obstacle toservice utilization
Access to crisis resolution home treatment Numerator:
The number of admissions to thehospital's acute wards (excludingadmissions to psychiatric intensivecare units) that were gate kept** bythe crisis resolution hometreatment teams.
Denominator
The total number of admissions tothe hospital's acute wards
KCE Report 196 S3
Comments selection
Average can bereplaced byMedian/Outlying
KCE_EXTERN
Sub-group analysisrecommended forchildren andadolescents; ethnicminorities
KCE_EXTERN
access in generalwith sub-analysis fordifferent age targets(child & adolescent;adults; elderly); andethnic/racialdisparities (indicator105)
KCE_EXTERN
Alternative: patientshare in total mentalhealth costs orPercentage ofservice recipientswith SMI livingabove the povertyline
EXTERN
EXTERN

KCE Report 196S3
NBR Dimension Sub-category Indicator
220 Sustainibility Community Number of visits to psychiatric outpatient carein a year/100 000 inhabitants in a year
156 Efficiency Community % community spend/Total spend
125 Effectiveness Re-integration Employment Status
129 Effectiveness Re-integration Housing Status
Health System Performance Report 2012
Operational Definition(s)
(excluding admissions topsychiatric intensive care units).
Number of visits to psychiatric outpatient carein a year/100 000 inhabitants in a year
% community spend/Total spend Expenditure on community mentalhealth and addiction services as aproportion of total expenditure onmental health and addictionservices
Employment Status Participation rates by people withmental illness of working age inemployment
Housing Status Percent of service recipients withsevere mental illness inindependent or supported housing
41
Comments selection
Outpatient care:outpatient service orunity withinspecialisedpsychiatric care(public or private);includes e.g.Community MentalHealth Centres,Polyclinics inhospitals etc.
KCE_EXTERN
EXTERN
EXTERN
EXTERN

42
NBR Dimension Sub-category Indicator
146 Effectiveness Generic Social support
14 Accessibility Generic Percentage of people receiving Mental Healthtreatment
135 Effectiveness Prevalence Prevalence good mental health
134 Effectiveness Prevalence Prevalence (major) depressions
Health System Performance Report 2012
Operational Definition(s)
Social support Number of cases with poor,moderate and strong socialsupport/100 000 inhabitants
Percentage of people receiving Mental Health Population receiving care(proportion of individuals receivingat least one insured health service)
Prevalence good mental health Number of cases exceeding thecutpoint for good mentalhealth/100 000 inhabitants using avalidated instrument (e.g. SF36)
Prevalence (major) depressions Youths (ages 12-17); Adults (age18 and above) with a majordepressive episode during the pastyear
KCE Report 196 S3
Comments selection
Social support isgenerally defined asavailability of peoplewhom the individualtrusts and whomake one feel caredfor and valued as aperson. The keyissue in terms ofhealth effects iswhether socialsupport is “received”in some form (e.g.having someone tolisten to one’stroubles) or“perceived” by theindividual to exist(e.g. the belief thatin times of troublesupport would beexpectable).Alternative: socialisolation
KCE_EXTERN
sub-analysis forgroup of SevereMental Illness
KCE_EXTERN
KCE_EXTERN
KCE_EXTERN

KCE Report 196S3
NBR Dimension Sub-category Indicator
128 Effectiveness Generic Hospital readmissions for
147a Effectiveness Generic Suicide in general population
147b Effectiveness Generic Suicide attempts in general population
150 Effectiveness Substance-abuse
Mortality for Persons with Substance AbuseDisorders
132 Effectiveness Generic Mortality for Persons with SevereDisorders
120 Effectiveness Generic Clinical Status/ Clinical Outcomes
50 Appropriateness
Medication Average daily quantity (ADQ) of medication(antidepressants /antipsychotics/ hypnotics andanxiolytics) prescribed
197 Safety Medication Use of AntiAmong Elderly Patients
78 Appropriateness
Medication Proportion of selected schizophrenia patientswith antipsychotic polypharmacy utilization
Health System Performance Report 2012
Operational Definition(s)
Hospital readmissions for psychiatric patients % of discharges from psychiatricin-patient care during a 12-monthreporting period readmitted topsychiatric in-patient care thatoccurred within 30 days
Suicide in general population Number of deaths due to suicide inthe general population
Suicide attempts in general population Number of suicide attempts in thegeneral population
Mortality for Persons with Substance Abuse Number of drug related deaths/100000 inhabitants in a year
Mortality for Persons with Severe Psychiatric Standardized mortality rate for %of persons in total population withspecified severe psychiatricdisorders
Clinical Status/ Clinical Outcomes Mental health outcomes of peoplewho receive treatment usingstandardized instruments (HoNos;Honosca)
Average daily quantity (ADQ) of medication(antidepressants /antipsychotics/ hypnotics andanxiolytics) prescribed
Expressed usually as number ofDDDs/1000 inhabitants and perday
Use of Anti-Cholinergic Anti-Depressant DrugsAmong Elderly Patients
% of persons age 65+ yearsprescribed antidepressants usingan anticholinergic anti-depressantdrug
Proportion of selected schizophrenia patientswith antipsychotic polypharmacy utilization
Numerator: Those patients in thedenominator with simultaneousprescriptions for at least two oralantipsychotic agents for 90 ormore days during the study periodDenominator: All patientsdiagnosed with Schizophreniaprescribed at least one
43
Comments selection
Health at a glance2011 (schizophrenia& bipolar disorders)
KCE_EXTERN
Health at a glance KCE_EXTERN
KCE_EXTERN
KCE_EXTERN
KCE_EXTERN
Routine outcomemonitoring
EXTERN
KCE_EXTERN
KCE_EXTERN
EXTERN

44
NBR Dimension Sub-category Indicator
25 Appropriateness
Medication Blood serum monitoring of mood stabilizers inpatients with bipolar disorders
26 Appropriateness
Medication Percent of bipolar patients with annualassessment of weight/BMI, glycemic control,and lipids
75 Appropriateness
Medication Cumulative daily antipsychotic dosage between300–1000 chlorpromazine (CPZhospital discharge for schizophrenia
203a Safety Medication Side Effects Medication
203b Safety Medication Side Effects Medication
202 Safety Generic Inpatient injury rate
210 Sustainibility Generic Acute Psychiatric beds per 100,000 population
Health System Performance Report 2012
Operational Definition(s)
antipsychotic agent during thestudy period
Blood serum monitoring of mood stabilizers inpatients with bipolar disorders
≥1 serum drug level taken for individuals with bipolar disordertreated with mood stabilizers in 12-month period
Percent of bipolar patients with annualassessment of weight/BMI, glycemic control,
Cumulative daily antipsychotic dosage between1000 chlorpromazine (CPZ )equivalents at
hospital discharge for schizophrenia
% of patients with schizophreniathat receive a cumulative dailyantipsychotic dosage between300–1000 CPZ equivalents athospital discharge
Side Effects Medication Appropriate monitoring ofmetabolic/cardiovascular sideeffects for individuals receivingantipsychotic medication
Side Effects Medication Number of medical services and/orhospital services required as adirect result of psychotropicmedication problems.
Inpatient injury rate Number of inpatient injuries perpatient day in 3-month period
Acute Psychiatric beds per 100,000 population Number of acute inpatientpsychiatric beds
KCE Report 196 S3
Comments selection
EXTERN
EXTERN
EXTERN
EXTERN
EXTERN
EXTERN
(A, T, K beds) KCE_EXTERN

KCE Report 196S3
NBR Dimension Sub-category Indicator
213 Sustainibility Generic Cost mental healthcare
224 Sustainibility Generic Total mental health staff numbers per 1,000population
189 Patient-centeredness
Generic Formal complaints
186 Patient-centeredness
Generic Consumer/family satisfaction with servicesreceived
188 Patient-centeredness
Generic Existence of a consumer/family charter ofrights that has been endorsed by theappropriate health authority and/or governmentbody
Health System Performance Report 2012
Operational Definition(s)
Cost mental healthcare Total spend (including all healthservices: physician services, drugbenefit plan costs, communitymental health services andsupports, and inpatient care) formental health per 1,000 population
Total mental health staff numbers per 1,000population
Total mental health staff numbersper 1,000 population by (child)psychiatrists, Allied HealthProfessionals, nurses,psychologists, social workers,Mental health officers
Formal complaints Number of complaints received bycomplaints Commissioner, MentalHealth Advocate, Ombudsperson(or equivalent offices), consumeradvocacy associations, regionalhealth authority, etc. concerningmental health services andsupports.
Consumer/family satisfaction with services Percentage of consumers/familiessatisfied with services asmeasured by valid method
Existence of a consumer/family charter ofrights that has been endorsed by theappropriate health authority and/or government
45
Comments selection
combination withindicator 172(Proportion of allhealth care fundsallocated toinpatient, outpatientand all mentalhealth treatment)
KCE_EXTERN
KCE_EXTERN
EXTERN
EXTERN
The explicitdescription of clientand familyexpectations ofmental healthservices by way of aformal charter ofrights can facilitatethe development ofa care system andstandards within that
EXTERN

46
NBR Dimension Sub-category Indicator
191 Patient-centeredness
Generic Number of selfpublic sector support
193 Patient-centeredness
Generic Proportion of consumers and families within aservice provider population of persons withserious mental illness who actively participatein decisions concerning their treatment
54 Appropriateness
Generic Involuntary Committal Rate
99 Continuity Generic Mental health related Emergency Room Visits
102 Continuity Generic Post discharge continuing care plan
103 Continuity Generic Pre-admission community care
113 Continuity Generic Timely ambulatory followhospitalisation
92 Continuity Generic Continuity of visits after hospitalisation for dualpsychiatric/ substance related
Health System Performance Report 2012
Operational Definition(s)
Number of self-help groups in the region withpublic sector support
Proportion of consumers and families within aservice provider population of persons withserious mental illness who actively participatein decisions concerning their treatment
Involuntary Committal Rate Rate of involuntary committals as apercentage of all hospitalizationsper annum.
Mental health related Emergency Room Visits Percentage of visits to the ER formental health and/or substance-related problems
Post discharge continuing care plan Percentage of patients dischargedfrom acute-care facilities(excluding those dischargedagainst medical advice) who havea documented discharge plan
admission community care Percentage of patients withprimary care contact prior tomental health admission
Timely ambulatory follow-up after mental healthhospitalisation
% of persons hospitalized forprimary mental health diagnoseswith an ambulatory mental healthencounter with a mental healthpractitioner within 7 and 30 days ofdischarge
Continuity of visits after hospitalisation for dualpsychiatric/ substance related conditions
% of persons discharged with adual diagnosis of psychiatricdisorder and substance abuse withat least four psychiatric and atleast four substance abuse visits
KCE Report 196 S3
Comments selection
system that meetthe needs ofconsumers.
EXTERN
EXTERN
EXTERN
EXTERN
EXTERN
EXTERN
OECD
OECD
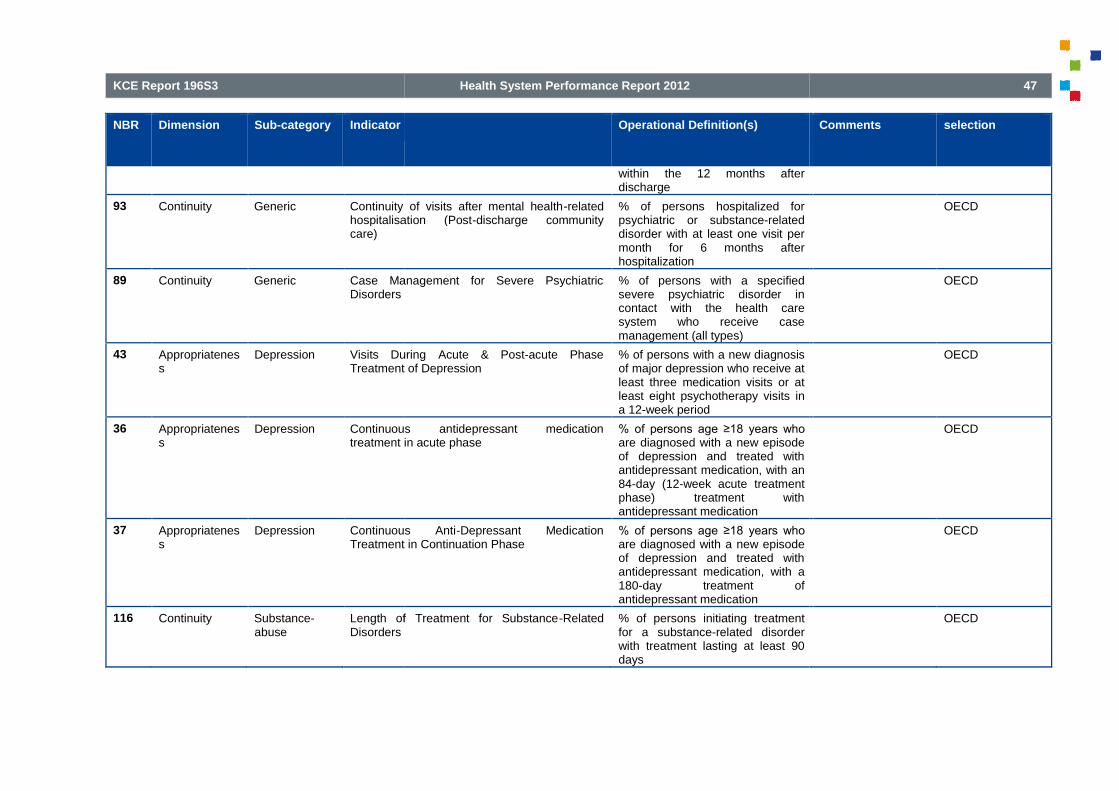
KCE Report 196S3
NBR Dimension Sub-category Indicator
93 Continuity Generic Continuity of visits after mental healthhospitalisation (Postcare)
89 Continuity Generic Case Management for Severe PsychiatricDisorders
43 Appropriateness
Depression Visits DuringTreatment of Depression
36 Appropriateness
Depression Continuoustreatment in acute phase
37 Appropriateness
Depression Continuous AntiTreatment in Continuation Phase
116 Continuity Substance-abuse
Length of Treatment for SubstanceDisorders
Health System Performance Report 2012
Operational Definition(s)
within the 12 months afterdischarge
Continuity of visits after mental health-relatedhospitalisation (Post-discharge community
% of persons hospitalized forpsychiatric or substance-relateddisorder with at least one visit permonth for 6 months afterhospitalization
Case Management for Severe Psychiatric % of persons with a specifiedsevere psychiatric disorder incontact with the health caresystem who receive casemanagement (all types)
Visits During Acute & Post-acute PhaseTreatment of Depression
% of persons with a new diagnosisof major depression who receive atleast three medication visits or atleast eight psychotherapy visits ina 12-week period
Continuous antidepressant medicationtreatment in acute phase
% of persons age ≥18 years who are diagnosed with a new episodeof depression and treated withantidepressant medication, with an84-day (12-week acute treatmentphase) treatment withantidepressant medication
Continuous Anti-Depressant MedicationTreatment in Continuation Phase
% of persons age ≥18 years who are diagnosed with a new episodeof depression and treated withantidepressant medication, with a180-day treatment ofantidepressant medication
Length of Treatment for Substance-Related % of persons initiating treatmentfor a substance-related disorderwith treatment lasting at least 90days
47
Comments selection
OECD
OECD
OECD
OECD
OECD
OECD

48
2.5. Final selection during second expert meetingA total of 7 experts rated the validity, reliability, relevance, interpretability and actionability of the intermediate set o
Table 6 Results rating 48 indicators by the experts
NB
R
Dim
en
sio
n
Su
b-c
ate
go
ry
Ind
ica
tor
11 Accessibility Generic
FinancialaccessibilityMental HealthServices
The percentage of consumers for whom cost is an obstacle toservice utilization
14 Accessibility Generic
Percentage ofpeople receivingMental Healthtreatment
Population receiving care (proportion of individuals receivingat least one insured health service)
19 Accessibility GenericWait-times forNeeded Services
Mean time in weeks between Referral to specialized MentalHealth Care and Initial Appointment date
2 Accessibility GenericAccess to MentalHealth Care
Proportion of referrals to specialized Mental Health Carereceiving an Initial Appointment date
43 Appropriateness Depression
Visits DuringAcute & Post-acute PhaseTreatment ofDepression
% of persons with a new diagnosis of major depressionreceive at least three medication visits or at least eightpsychotherapy visits in a 12
37 Appropriateness Depression
Continuous Anti-DepressantMedicationTreatment inContinuationPhase
% of persons ageepisode of depression and treated with antidepressantmedication, with a 180medication
Health System Performance Report 2012
selection during second expert meetingA total of 7 experts rated the validity, reliability, relevance, interpretability and actionability of the intermediate set o f 48 indicators.
Results rating 48 indicators by the experts
Op
era
tio
na
lD
efi
nit
ion
(s)
Va
lid
ity
ME
DIA
N
Va
lid
ity
ME
AN
Re
lia
bil
ity
ME
DIA
N
Re
lia
bil
ity
ME
AN
Re
lev
an
ce
ME
DIA
N Re
lev
an
ce
ME
AN
Inte
rpre
tab
ilit
yM
ED
IAN
The percentage of consumers for whom cost is an obstacle toservice utilization 7 6,9 5 5,3 8 7,7 6
Population receiving care (proportion of individuals receivingat least one insured health service) 6 5,9 7 6,3 7,5 7,7 5
Mean time in weeks between Referral to specialized MentalHealth Care and Initial Appointment date 6 6,6 6 5,3 7 7,3 5
Proportion of referrals to specialized Mental Health Carereceiving an Initial Appointment date 7 6,1 7 5,6 8 7 7
% of persons with a new diagnosis of major depression whoreceive at least three medication visits or at least eightpsychotherapy visits in a 12-week period 7 6,4 7 6,6 8 6,9 5
% of persons age ≥18 years who are diagnosed with a new episode of depression and treated with antidepressantmedication, with a 180-day treatment of antidepressantmedication 7 7 7 6,9 8 6,9 5
KCE Report 196 S3
f 48 indicators.
Inte
rpre
tab
ilit
yM
EA
N
Ac
tio
na
bil
ity
ME
DIA
N
Ac
tio
na
bil
ity
ME
AN
Co
mm
en
ts
5,9 8 7,3
Alternative: patient share in totalmental health costs orPercentage of service recipientswith SMI living above the povertyline
5,7 6,5 7sub-analysis for group of SevereMental Illness
4,9 6 5,6
Sub-group analysisrecommended for children andadolescents; ethnic minoritiesdata zijn maar zeer disparaatbeschikbaar; wachttijden wordenvaak veroorzaakt door multiplefactoren, vaak bij de patient zelf
5,6 6 5,6
access in general with sub-analysis for different age targets(child & adolescent; adults;elderly); and ethnic/racialdisparities (indicator 105)
welke database ga je raadplegen?; kan alleen via prospectievegegevens verzameling
5,6 6 6,7
6,3 6 6,4

KCE Report 196S3
54 Appropriateness GenericInvoluntaryCommittal Rate
Rate of involuntary committals as a percentage of allhospitalizations per annum.
36 Appropriateness Depression
Continuousantidepressantmedicationtreatment in acutephase
% of persons ageepisode of depression and treated with antidepressantmedication, with an 84treatment with
156 Efficiency Community
% communityspend/Totalspend
Expenditure on community mental health and addictionservices as a proportion of total expenditure on mental healthand addiction services
5 Accessibility Community
Access to crisisresolution hometreatment
Numerator:The number of admissions to the hospital's acute wards(excluding admissions to psychiatric intensive care units) thatwere gate kept** by the crisis resolution home treatmentteams.DenominatorThe total number(excluding admissions to psychiatric intensive care units).
220 Sustainibility Community
Number of visitsto psychiatricoutpatient care ina year/100 000inhabitants in ayear
89 Continuity Generic
Case Managementfor SeverePsychiatricDisorders
% of persons with a specified severe psychiatric disorder incontact with the health care system who receive casemanagement (all types)
102 Continuity Generic
Post dischargecontinuing careplan
Percentage of patients discharged from acute(excluding those discharged against medical advice) whohave a documented discharge plan
103 Continuity GenericPre-admissioncommunity care
Percentage of patients with primary care contact prior tomental health admission
Health System Performance Report 2012
Rate of involuntary committals as a percentage of allhospitalizations per annum. 8 7,1 7 6,6 7,5 6,8 7
% of persons age ≥18 years who are diagnosed with a new episode of depression and treated with antidepressantmedication, with an 84-day (12-week acute treatment phase)treatment with antidepressant medication 7 6,7 7 6,9 8 6,7 5
Expenditure on community mental health and addictionservices as a proportion of total expenditure on mental healthand addiction services 8 7,1 5 6,4 8 7,9 8
Numerator:The number of admissions to the hospital's acute wards(excluding admissions to psychiatric intensive care units) thatwere gate kept** by the crisis resolution home treatment
DenominatorThe total number of admissions to the hospital's acute wards(excluding admissions to psychiatric intensive care units). 7 5,3 5 4,9 7 7 4
7 6,1 6 5,6 6 6,7 7
% of persons with a specified severe psychiatric disorder incontact with the health care system who receive casemanagement (all types) 8 7,1 8 7 8,5 8,3 6
Percentage of patients discharged from acute-care facilities(excluding those discharged against medical advice) whohave a documented discharge plan 7 6,9 8 7 8,5 7,7 8
Percentage of patients with primary care contact prior tomental health admission 7 7,3 7 6,9 8 7,6 6
49
6,1 7 6,9zeker relevant in het licht van dehervormingen GGZ
6 6 6,4
7,3 8 7,6
4,6 6 6
A crisis resolution team(sometimes called a crisisresolution home treatment team)provides intensive support forpeople in mental health crises intheir own home: they stayinvolved until the problem isresolved.
5,7 7 6,3
Outpatient care: outpatientservice or unity withinspecialised psychiatric care(public orprivate); includes e.g.Community Mental HealthCentres, Polyclinics in hospitalsetc.
6,4 7 7Quid definitie vancasemanagement
6,9 6,5 6,7
5,9 6 6,4moeilijkheid van 1 patient ID encentraliseren van gegevens

50
113 Continuity Generic
Timelyambulatoryfollow-up aftermental healthhospitalisation
% of persons hospitalized for primary mental health diagnoseswith an ambulatory mental health encounter with a mentalhealth practitioner within 7 and 30 days of discharge
93 Continuity Generic
Continuity ofvisits after mentalhealth-relatedhospitalisation(Post-dischargecommunity care)
% of persons hospitalized for psychiatric or substancedisorder with at least onehospitalization
116 ContinuitySubstance-abuse
Length ofTreatment forSubstance-Related Disorders
% of persons initiating treatment for a substancedisorder with treatment lasting at least 90 days
99 Continuity Generic
Mental healthrelatedEmergency RoomVisits
Percentage of visits to the ER for mental health and/orsubstance
92 Continuity Generic
Continuity ofvisits afterhospitalisation fordual psychiatric/substance relatedconditions
% of persons discharged with a dual diagnosis of psychiatricdisorder and substance abuse with at least four psychiatricand at least four substance abuse visitsafter discharge
147a Effectiveness GenericSuicide in generalpopulation Number of deaths due to suicide in the general population
128 Effectiveness Generic
Hospitalreadmissions forpsychiatricpatients
% of discharges from psychiatric inmonth reporting period readmitted to psychiatric incare that occurred within 30 days
147b Effectiveness Generic
Suicide attemptsin generalpopulation Number of suicide attempts in the general population
150 EffectivenessSubstance-abuse
Mortality forPersons withSubstance AbuseDisorders Number of drug related deaths/100 000 inhabitants in a year
132 Effectiveness Generic
Mortality forPersons withSeverePsychiatricDisorders
Standardized mortality rate for % of persons in total populationwith specified severe psychiatric disorders
Health System Performance Report 2012
% of persons hospitalized for primary mental health diagnoseswith an ambulatory mental health encounter with a mentalhealth practitioner within 7 and 30 days of discharge 8 7,4 8 7,1 8,5 7,5 6
% of persons hospitalized for psychiatric or substance-relateddisorder with at least one visit per month for 6 months afterhospitalization 8 7,4 6 6,4 8,5 7,5 6
% of persons initiating treatment for a substance-relateddisorder with treatment lasting at least 90 days 7 7 8 7,1 8 7,3 7
Percentage of visits to the ER for mental health and/orsubstance- related problems 8 7,4 8 7 7 7 7
% of persons discharged with a dual diagnosis of psychiatricdisorder and substance abuse with at least four psychiatricand at least four substance abuse visits within the 12 monthsafter discharge 7 6,6 6 6,6 7,5 7 6
Number of deaths due to suicide in the general population 8 7,9 8 7,7 8 8 8
% of discharges from psychiatric in-patient care during a 12-month reporting period readmitted to psychiatric in-patientcare that occurred within 30 days 8 7,7 8 7,1 8 7,7 7
Number of suicide attempts in the general population 8 7,7 5 6,1 8 7,6 5
Number of drug related deaths/100 000 inhabitants in a year 7 7,6 7 7,1 8 7,1 6
Standardized mortality rate for % of persons in total populationwith specified severe psychiatric disorders 7 7 7 7,4 8 7 7
KCE Report 196 S3
6,6 6 6,7moeilijkheid van 1 patient ID encentraliseren van gegevens
6,6 6,5 7
6,4 8 7,3
6,4 7 6, 7validiteit wordt sterk bepaalddoor codering op spoed
5,9 6 6,8moeilijkheid van 1 patient ID encentraliseren van gegevens
7,4 8 7,3
de betekenis van dezeparameters is niet altijd duidelijk,noch het verband met dekwaliteit/toegankelijkheid vanzorgverlening
6,6 6 6,4
5,7 6 6
6,3 6 6,1
6,4 7 6,7
samen met gegevens vanmedicatiegebruik te bekijken ifvlong term side effects vanmedicatie

KCE Report 196S3
120 Effectiveness GenericClinical Status/Clinical Outcomes
Mental health outcomes of people who receive treatmentusing standardized instruments (HoNos; Honosca)
164 Efficiency Generic
Average Length ofStay in Acute-Care/Rehabilitation care
50 Appropriateness Medication
Average dailyquantity (ADQ) ofmedication(antidepressants/antipsychotics/hypnotics andanxiolytics)prescribed
Expressed usually as number of DDDs/1000 inhabitants andper day
197 Safety Medication
Use of Anti-Cholinergic Anti-Depressant DrugsAmong ElderlyPatients
% of persons age 65+ years prescribed antidepressants usingan anticholinergic anti
78 Appropriateness Medication
Proportion ofselectedschizophreniapatients withantipsychoticpolypharmacyutilization
Numerator:simultaneous prescriptions for at least two oral antipsychoticagents for 90 or more days during the study periodDenominator:prescribed at least one antipsychotic agent durperiod
203a Safety MedicationSide EffectsMedication
Appropriate monitoring of metabolic/cardiovascular sideeffects for individuals receiving antipsychotic medication
75 Appropriateness Medication
Cumulative dailyantipsychoticdosage between300–1000chlorpromazine(CPZ )equivalentsat hospitaldischarge forschizophrenia
% of patients with schizophrenia that receive a cumulativedaily antipsychotic dosage between 300equivalent
Health System Performance Report 2012
Mental health outcomes of people who receive treatmentusing standardized instruments (HoNos; Honosca) 7 6,3 7 6,3 8 7 6
7 6,9 7 6,6 7 6,6 6
Expressed usually as number of DDDs/1000 inhabitants and8 6,6 8 6,4 8 6,9 8
% of persons age 65+ years prescribed antidepressants usingan anticholinergic anti-depressant drug 7 6,9 7 6,6 7 6,7 7
Numerator: Those patients in the denominator withsimultaneous prescriptions for at least two oral antipsychoticagents for 90 or more days during the study periodDenominator: All patients diagnosed with Schizophreniaprescribed at least one antipsychotic agent during the study
7 6,6 6 6,1 5 5,7 4
Appropriate monitoring of metabolic/cardiovascular sideeffects for individuals receiving antipsychotic medication 8 6,6 6 6 6 5,6 7
% of patients with schizophrenia that receive a cumulativedaily antipsychotic dosage between 300–1000 CPZequivalents at hospital discharge 6 6 5 5,3 4 5,2 5,5
51
5,3 6 6,3
Routine outcome monitoring
Quid clinical time; analyse persub-populatie te overwegen;belangrijk om acute situaties enchronische populaties uit elkaarte houden
5,4 7 7,1
Average can be replaced byMedian/Outlyingspreiding op het gemiddelde;mediane waarde
7,1 8 7,1
6,6 6 6,9
5,6 7 6,9
6,285714 7 6,1
5,5 5 5,3

52
203b Safety MedicationSide EffectsMedication
Number of medical services and/or hospital services requiredas a direct result of psychotropic medication problems.
25 Appropriateness Medication
Blood serummonitoring ofmood stabilizersin patients withbipolar disorders
≥1 serum drug level taken for individuals with bipolar disorder treated with mood stabilizers in 12
26 Appropriateness Medication
Percent of bipolarpatients withannualassessment ofweight/BMI,glycemic control,and lipids
186Patient-centeredness Generic
Consumer/familysatisfaction withservices received
Percentage of consumers/families satisfied with services asmeasured by valid method
188Patient-centeredness Generic
Existence of aconsumer/familycharter of rightsthat has beenendorsed by theappropriate healthauthority and/orgovernment body
193Patient-centeredness Generic
Proportion ofconsumers andfamilies within aservice providerpopulation ofpersons withserious mentalillness whoactivelyparticipate indecisionsconcerning theirtreatment
189Patient-centeredness Generic
Formalcomplaints
Number of complaints received by complaints Commissioner,Mental Health Advocate, Ombudsperson (or equivalentoffices), consumer advocacy associations, regional healthauthority, etc. concerning mental health services andsupports.
191Patient-centeredness Generic
Number of self-help groups in theregion with publicsector support
Health System Performance Report 2012
Number of medical services and/or hospital services requiredas a direct result of psychotropic medication problems. 5 5,3 4 4,9 5 5,1 4
≥1 serum drug level taken for individuals with bipolar disorder treated with mood stabilizers in 12-month period 6 6,3 6 6 4 5 7
8 6,7 7 6,1 5 5 7
Percentage of consumers/families satisfied with services asmeasured by valid method 7 6,7 5 5,6 8 7,6 6
7 7 7 6,7 7 7,5 7
6,5 5,7 5 4, 7 7,5 7 5
Number of complaints received by complaints Commissioner,Mental Health Advocate, Ombudsperson (or equivalentoffices), consumer advocacy associations, regional healthauthority, etc. concerning mental health services andsupports. 7 6,6 5 5,1 6 6,9 5
7 6 6 5,1 6 4,9 5
KCE Report 196 S3
4,7 4 4,7
6,142857 6 6,1
6 6 5,6Operationaliseerbaar ? Gaat omdossiergegevens
5,9 6 6,3
7,2 7 7,3
The explicit description of clientand family expectations ofmental health services by way ofa formal charter of rights canfacilitate the development of acare system and standardswithin that system that meet theneeds of consumers.
4,5 6 5 hoe ga je dat meten ?
5 5,5 5,3
zeer disparaat; zegt vaak meerover cultuur in een organisatieen over performantie vanombudsdienst; individuelecasuïstiek is wel bruikbaar
4,9 6 5,1

KCE Report 196S3
135 Effectiveness PrevalencePrevalence goodmental health
Number of cases exceeding the cutpoint for good mentalhealth/100 000 inhabitants using a validated instrument (e.g.SF36)
134 Effectiveness Prevalence
Prevalence(major)depressions
Youths (ages 12depressive episode during the past year
125 Effectiveness Re-integrationEmploymentStatus
Participation rates by people with mental illness of workingage in employment
129 Effectiveness Re-integration Housing StatusPercent of service recipients with severe mental illness inindependent or supported housing
146 Effectiveness Generic Social supportNumber of cases with poor, moderate and strong socialsupport/100 000 inhabitants
202 Safety GenericInpatient injuryrate Number of inpatient injuries per patient day in 3
Health System Performance Report 2012
Number of cases exceeding the cutpoint for good mentalhealth/100 000 inhabitants using a validated instrument (e.g.
8 7,3 8 7,3 7 7,3 6
Youths (ages 12-17); Adults (age 18 and above) with a majordepressive episode during the past year 7 7,3 7 6,3 7 7,3 7
Participation rates by people with mental illness of workingage in employment 7 7,4 7 6,9 8 7,7 8
Percent of service recipients with severe mental illness inindependent or supported housing 8 7,7 8 7,4 8 7,7 8
Number of cases with poor, moderate and strong socialsupport/100 000 inhabitants 7 6,9 6 5,9 7 7,1 6
Number of inpatient injuries per patient day in 3-month period 5 5,9 5 4,7 5 5,4 4
53
6,6 5 6,1
7,1 7 6,6
7,1 7 7,1
valide voor zover het gaat omgekende psychiatrischepatienten; de zorgmijders heb jevaak niet mee
7,6 7 7,4
5,9 7 6
Social support is generallydefined as availability of peoplewhom the individual trustsand who make one feel cared forand valued as a person. The keyissue in terms ofhealth effects is whether socialsupport is “received” in someform (e.g. having someoneto listen to one’s troubles) or“perceived” by the individual toexist (e.g. the belief that intimes of trouble support wouldbe expectable). Alternative:social isolationVeel ruis op de definitie vansocial support
4,3 4 5,3
zegt vaak meer over cultuur vanincidentmelding, performantievan het systeem, of zorgzwaarte

54
213 Sustainibility GenericCost mentalhealthcare
Total spend (including all health services: physician services,drug benefit plan costs, community mental health services andsupports, and inpatient care) for mental health per 1,000population
224 Sustainibility Generic
Total mentalhealth staffnumbers per1,000 population
Total mental health staff numbers per 1,000 population(child) psychiatrists, Allied Health Professionals, nurses,psychologists, social workers, Mental health officers
210 Sustainibility Generic
Acute Psychiatricbeds per 100,000population Number of acute inpatient psychiatric beds
After discussion the following 14 indicators were retained:
The percentage of consumers of mental health services for whom cost is an obstacle to service utilization
Mean time in weeks between Referral to specialized Mental Health Care and Initial Appointment date
Rate of involuntary committals as a percentage of
Expenditure on community mental health and addiction services as a proportion of total expenditure on mental health and addic
% of persons with a specified severe psychiatric disorder in contact with the health care system who receive case management (all ty
Percentage of visits to the Emergency Rooms in general hospitals for mental health and/or substance
Number of deaths due to suicide in the general population
% of discharges from psychiatric in-patient care during a 12(Nbr 128)
Mortality for Persons with Severe Psychiatric Disorders or Substance Abuse Disorders
Average daily quantity (ADQ) of medication (antidepressants /antipsychotics/ hypnotics and anxiolytics) prescribed
% of persons age 65+ years prescribed antidepressants using an anticholinergic anti
Percentage of consumers/families satisfied with services as measured by valid method
Participation rates by people with mental illness of working age in employment
Total mental health staff numbers per 1,000 population by (child) psychiatrists, Allied Health Professionals, nurses, psychologistshealth officers (Nbr 224)
Health System Performance Report 2012
Total spend (including all health services: physician services,drug benefit plan costs, community mental health services andsupports, and inpatient care) for mental health per 1,000population 8 7,7 6 6,7 8 8,3 8
Total mental health staff numbers per 1,000 population by(child) psychiatrists, Allied Health Professionals, nurses,psychologists, social workers, Mental health officers 6 7 6 6,1 8 8,1 7
Number of acute inpatient psychiatric beds 8 7,1 8 7,4 7 6,6 7
the following 14 indicators were retained:
The percentage of consumers of mental health services for whom cost is an obstacle to service utilization (Nbr 11)
Mean time in weeks between Referral to specialized Mental Health Care and Initial Appointment date (Nbr 19)
Rate of involuntary committals as a percentage of all hospitalizations per annum (Nbr 54)
Expenditure on community mental health and addiction services as a proportion of total expenditure on mental health and addic
rsons with a specified severe psychiatric disorder in contact with the health care system who receive case management (all ty
Percentage of visits to the Emergency Rooms in general hospitals for mental health and/or substance - related problems
Number of deaths due to suicide in the general population (Nbr 147a)
patient care during a 12-month reporting period readmitted to psychiatric in-patient care that occurred within 30 days
r Persons with Severe Psychiatric Disorders or Substance Abuse Disorders (NBR’s 150/132)
Average daily quantity (ADQ) of medication (antidepressants /antipsychotics/ hypnotics and anxiolytics) prescribed
epressants using an anticholinergic anti-depressant drug (Nbr 197)
Percentage of consumers/families satisfied with services as measured by valid method (Nbr 186)
Participation rates by people with mental illness of working age in employment (Nbr 125)
mental health staff numbers per 1,000 population by (child) psychiatrists, Allied Health Professionals, nurses, psychologists
KCE Report 196 S3
7,4 8 7,56
combination with indicator 172(Proportion of all health carefunds allocated to inpatient,outpatient and all mental healthtreatment)
7 8 7,1
zelfstandige psychologen entherapeuten zijn moeilijk in kaartte brengen; therapeut is geenbeschermde titel
6,4 7 7,1
(A, T, K beds)
Type bed zegt al lang niets meerover type zorg dat er inplaatsheeft
(Nbr 11)
Expenditure on community mental health and addiction services as a proportion of total expenditure on mental health and addic tion services (Nbr 156)
rsons with a specified severe psychiatric disorder in contact with the health care system who receive case management (all ty pes) (Nbr 89)
related problems (Nbr 99)
patient care that occurred within 30 days
Average daily quantity (ADQ) of medication (antidepressants /antipsychotics/ hypnotics and anxiolytics) prescribed (Nnr 50)
mental health staff numbers per 1,000 population by (child) psychiatrists, Allied Health Professionals, nurses, psychologists , social workers, Mental

KCE Report 196S3
3. SEARCH STRATEGY:
3.1. Search for reviews:
3.1.1. MEDLINE-OVID
Date 20/04/2011
Database
(name + access ; e.g.: Medline OVID)
Database: Ovid MEDLINE(R) 1948 to Present with Daily Update
Search Strategy:
--------------------------------------------------------------------------------
Search Strategy
(attention, for PubMed, check« Details »)
1.
2.
3.
4.
5.
6.
7.
8.
9.
10.
11.
12.
13.
14.
15.
16.
17.
18.
Health System Performance Report 2012
20/04/2011
Database: Ovid MEDLINE(R) 1948 to Present with Daily Update
Search Strategy:
--------------------------------------------------------------------------------
*"Outcome and Process Assessment (Health Care)"/ (6574)
*"Outcome Assessment (Health Care)"/ (15926)
*"Process Assessment (Health Care)"/ (1137)
*"Quality Assurance, Health Care"/ (24288)
*Benchmarking/ (3406)
*"Quality Indicators, Health Care"/ (3920)
*"Health Status Indicators"/ (7622)
(performance adj2 (measurement or analysis or indicator$ or evaluation or assessment)).mp. [mp=protocolsupplementary concept, rare disease supplementary concept, title, original title, abstract, name ofsubstance word, subject heading word, unique identifier] (26109)
1 or 2 or 3 or 4 or 5 or 6 or 7 or 8 (84981)
*Mental Health Services/ (16719)
*Mental Disorders/ (78832)
*Mental Health/ (10011)
*Psychiatry/ (22130)
*Child Psychiatry/ (3084)
*Adolescent Psychiatry/ (1463)
*community mental health services/ (10605)
*Emergency Services, Psychiatric/ (1454)
10 or 11 or 12 or 13 or 14 or 15 or 16 or 17 (129510)
55
(performance adj2 (measurement or analysis or indicator$ or evaluation or assessment)).mp. [mp=protocolsupplementary concept, rare disease supplementary concept, title, original title, abstract, name of
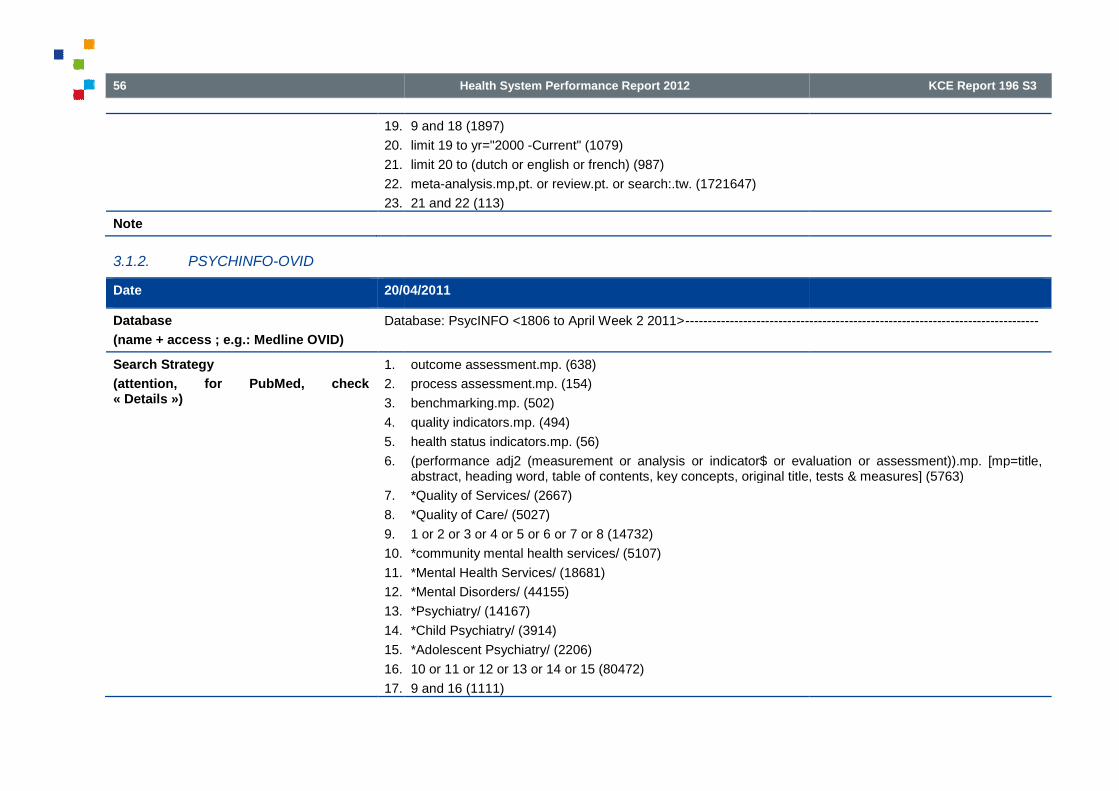
56
19.
20.
21.
22.
23.
Note
3.1.2. PSYCHINFO-OVID
Date 20/04/2011
Database
(name + access ; e.g.: Medline OVID)
Database: PsycINFO <1806 to April Week 2 2011>
Search Strategy
(attention, for PubMed, check« Details »)
1.
2.
3.
4.
5.
6.
7.
8.
9.
10.
11.
12.
13.
14.
15.
16.
17.
Health System Performance Report 2012
9 and 18 (1897)
limit 19 to yr="2000 -Current" (1079)
limit 20 to (dutch or english or french) (987)
meta-analysis.mp,pt. or review.pt. or search:.tw. (1721647)
21 and 22 (113)
20/04/2011
Database: PsycINFO <1806 to April Week 2 2011>--------------------------------------------------------------------------------
outcome assessment.mp. (638)
process assessment.mp. (154)
benchmarking.mp. (502)
quality indicators.mp. (494)
health status indicators.mp. (56)
(performance adj2 (measurement or analysis or indicator$ or evaluation or assessment)).mp. [mp=title,abstract, heading word, table of contents, key concepts, original title, tests & measures] (5763)
*Quality of Services/ (2667)
*Quality of Care/ (5027)
1 or 2 or 3 or 4 or 5 or 6 or 7 or 8 (14732)
*community mental health services/ (5107)
*Mental Health Services/ (18681)
*Mental Disorders/ (44155)
*Psychiatry/ (14167)
*Child Psychiatry/ (3914)
*Adolescent Psychiatry/ (2206)
10 or 11 or 12 or 13 or 14 or 15 (80472)
9 and 16 (1111)
KCE Report 196 S3
--------------------------------------------------------------------------------
(performance adj2 (measurement or analysis or indicator$ or evaluation or assessment)).mp. [mp=title,abstract, heading word, table of contents, key concepts, original title, tests & measures] (5763)

KCE Report 196S3
18.
19.
20.
21.
Note
3.1.3. EMBASE
Date 20/04/2011
Database
(name + access ; e.g.: Medline OVID)
Embase
Search Strategy
(attention, for PubMed, check« Details »)
Embase Session Results
No.
#7
#6
#5
#4
#3
#2
Note
Health System Performance Report 2012
limit 17 to yr="2000 -Current" (767)
limit 18 to (dutch or english or french) (707)
meta-analysis.mp,pt. or review.pt. or search:.tw. (55550)
19 and 20 (22)
20/04/2011
Embase
Embase Session Results
No. Query
#7 #6 AND ([cochrane review]/lim OR [meta analysis]/lim OR [systematicreview]/lim) AND [embase]/lim AND [2000-2011]/py
#6 #5 AND ([article]/lim OR [article in press]/lim OR [review]/lim) AND([dutch]/lim OR [english]/lim OR [french]/lim) AND [embase]/lim AND[2000-2011]/py
#5 #2 AND #3 AND (2000:py OR 2001:py OR 2002:py OR 2003:py OR2004:py OR 2005:py OR 2006:py OR 2007:py OR 2008:py OR 2009:pyOR 2010:py OR 2011:py)
#4 #2 AND #3
#3 'mental health care'/mj OR 'mental health service'/mj OR 'home mentalhealth care'/mj OR 'mental hospital'/mj OR 'mental disease'/mj OR'psychiatry'/mj OR 'child psychiatry'/mj OR 'mental health'/mj OR'community mental health'/mj OR 'psychological well being'/mj
#2 'outcome assessment'/mj OR 'health care quality'/mj OR 'healthsurvey'/mj OR 'quality control'/mj OR 'performance measurementsystem'/mj
57
Results Date
#6 AND ([cochrane review]/lim OR [meta analysis]/lim OR [systematic 9 20 Apr 2011
#5 AND ([article]/lim OR [article in press]/lim OR [review]/lim) AND([dutch]/lim OR [english]/lim OR [french]/lim) AND [embase]/lim AND
299 20 Apr 2011
2001:py OR 2002:py OR 2003:py OR2004:py OR 2005:py OR 2006:py OR 2007:py OR 2008:py OR 2009:py
953 20 Apr 2011
1953 20 Apr 2011
'mental health care'/mj OR 'mental health service'/mj OR 'home mentalj OR 'mental hospital'/mj OR 'mental disease'/mj OR
'psychiatry'/mj OR 'child psychiatry'/mj OR 'mental health'/mj OR
165166 20 Apr 2011
OR 'healthsurvey'/mj OR 'quality control'/mj OR 'performance measurement
91397 20 Apr 2011

58
3.2. Search for studies published since 2008:
3.2.1. MEDLINE-OVID
Date 20/05/2011
Database
(name + access ; e.g.: Medline OVID)
Database: Ovid
Search Strategy:
--------------------------------------------------------------------------------
Search Strategy
(attention, for PubMed, check« Details »)
1.
2.
3.
4.
5.
6.
7.
8.
9.
10.
11.
12.
13.
14.
15.
16.
17.
18.
19.
20.
Note
Health System Performance Report 2012
since 2008:
20/05/2011
Database: Ovid MEDLINE(R) 1948 to Present with Daily Update
Search Strategy:
--------------------------------------------------------------------------------
*"Outcome and Process Assessment (Health Care)"/ (6613)
*"Outcome Assessment (Health Care)"/ (16054)
*"Process Assessment (Health Care)"/ (1146)
*"Quality Assurance, Health Care"/ (24399)
*Benchmarking/ (3432)
*"Quality Indicators, Health Care"/ (3958)
*"Health Status Indicators"/ (7666)
(performance adj2 (measurement or analysis or indicator$ or evaluation or assessment)).mp. (26317)
1 or 2 or 3 or 4 or 5 or 6 or 7 or 8 (85552)
*Mental Health Services/ (16834)
*Mental Disorders/ (79197)
*Mental Health/ (10091)
*Psychiatry/ (22214)
*Child Psychiatry/ (3091)
*Adolescent Psychiatry/ (1466)
*community mental health services/ (10645)
*Emergency Services, Psychiatric/ (1460)
10 or 11 or 12 or 13 or 14 or 15 or 16 or 17 (130129)
9 and 18 (1912)
limit 19 to (english language and yr="2008 -Current" and (dutch or english or french)) (301)
KCE Report 196 S3
2 (measurement or analysis or indicator$ or evaluation or assessment)).mp. (26317)
or english or french)) (301)

KCE Report 196S3
3.2.2. EMBASE
Date 20/04/2011
Database
(name + access ; e.g.: Medline OVID)
Embase
Search Strategy
(attention, for PubMed, check« Details »)
Embase
Session Results
.......................................................
No. Query Results Results Date
#6. #3 AND #4 AND (2008:py OR 2009:py OR 2010:py OR 336 20 May 2011
2011:py)
#5. #3 AND #4 1,941 20 May 2011
#4. 'mental health care'/mj OR 'mental health 161,447 20 May 2011
service'/mj OR 'home mental health care'/mj OR
'mental hospital'/mj OR 'mental disease'/mj OR
'psychiatry'/mj OR 'mental health'/mj OR
'community mental health'/mj OR 'psychological
well being'/mj
#3. 'outcome assessment'/mj OR 'health care 91,692 20 May 2011
quality'/mj OR 'health survey'/mj OR 'quality
control'/mj OR 'performance measurement
system'/mj
Note
Health System Performance Report 2012
20/04/2011
Embase
Embase
Session Results
.......................................................
No. Query Results Results Date
#6. #3 AND #4 AND (2008:py OR 2009:py OR 2010:py OR 336 20 May 2011
2011:py)
#5. #3 AND #4 1,941 20 May 2011
#4. 'mental health care'/mj OR 'mental health 161,447 20 May 2011
service'/mj OR 'home mental health care'/mj OR
'mental hospital'/mj OR 'mental disease'/mj OR
'psychiatry'/mj OR 'mental health'/mj OR
'community mental health'/mj OR 'psychological
well being'/mj
#3. 'outcome assessment'/mj OR 'health care 91,692 20 May 2011
quality'/mj OR 'health survey'/mj OR 'quality
control'/mj OR 'performance measurement
system'/mj
59
#6. #3 AND #4 AND (2008:py OR 2009:py OR 2010:py OR 336 20 May 2011
#4. 'mental health care'/mj OR 'mental health 161,447 20 May 2011
#3. 'outcome assessment'/mj OR 'health care 91,692 20 May 2011

60
4. REFERENCES1. WHO. Policies and practices for mental health in Europe
the challenges. Copenhagen: 2008. Available from:http://www.euro.who.int/__data/assets/pdf_file/0006/96452.pdf
2. Eyssen M, Leys M, Desomer A, Arnaud S, Léonard C. Organisatievan geestelijke gezondheidszorg voor mensen met een ernstigeen persisterende mentale aandoening.wetenschappelijke basis? Brussel: KCE; 2010. KCE Reports 144
3. Vlayen JV, K. Camberlin, C. Piérart, J. Walckiers, D. Kohn, L.Vinck, I. Denis, A. Meeus, P. Van, Oyen HL, C. A first step towardsmeasuring the performance of the Belgian healthcare system.Brussels: KCE; 2010. KCE Reports 128
4. Spaeth-Rublee B, Pincus HA, Huynh PT, Brown P, Rosen A,Durbin J, et al. Measuring quality of mental health care: A reviewof initiatives and programs in selected countries. Can. J.Psychiatry. 2010;55(9):539-48.
5. Baars IJ, Evers SMAA, Arntz A, Van Merode GG. Performancemeasurement in mental health care: Present situation and futurepossibilities. Int. J. Health Plann. Manage. 2009;25(3):198
6. Gilbody SM, House AO, Sheldon TA. Outcomes research inmental health. Systematic review. British Journal of Psychiatry.2002;181:8-16.
7. Slade M. What outcomes to measure in routine mental healthservices, and how to assess them: a systematic review. Aust N Z JPsychiatry. 2002;36(6):743-53.
8. Wobrock T, Weinmann S, Falkai P, Gaebel W. Quality assurancein psychiatry: quality indicators and guideline implementation.European Archives of Psychiatry & Clinical Neuroscience.2009;259(2).
9. Gaebel W, Janssen B, Zielasek J. Mental health quality, outcomemeasurement, and improvement in Germany. Curr OpinPsychiatry. 2009;22(6):636-42.
Health System Performance Report 2012
WHO. Policies and practices for mental health in Europe - meetingCopenhagen: 2008. Available from:
http://www.euro.who.int/__data/assets/pdf_file/0006/96450/E9173
Eyssen M, Leys M, Desomer A, Arnaud S, Léonard C. Organisatievan geestelijke gezondheidszorg voor mensen met een ernstigeen persisterende mentale aandoening. Wat is dewetenschappelijke basis? Brussel: KCE; 2010. KCE Reports 144
Vlayen JV, K. Camberlin, C. Piérart, J. Walckiers, D. Kohn, L.Vinck, I. Denis, A. Meeus, P. Van, Oyen HL, C. A first step towardsmeasuring the performance of the Belgian healthcare system.
HA, Huynh PT, Brown P, Rosen A,Durbin J, et al. Measuring quality of mental health care: A reviewof initiatives and programs in selected countries. Can. J.
Baars IJ, Evers SMAA, Arntz A, Van Merode GG. Performanceement in mental health care: Present situation and future
possibilities. Int. J. Health Plann. Manage. 2009;25(3):198-214.
Gilbody SM, House AO, Sheldon TA. Outcomes research inmental health. Systematic review. British Journal of Psychiatry.
Slade M. What outcomes to measure in routine mental healthservices, and how to assess them: a systematic review. Aust N Z J
Wobrock T, Weinmann S, Falkai P, Gaebel W. Quality assuranceators and guideline implementation.
European Archives of Psychiatry & Clinical Neuroscience.
Gaebel W, Janssen B, Zielasek J. Mental health quality, outcomemeasurement, and improvement in Germany. Curr Opin
10. Brown P, Pirkis J. Mental health quality and outcomemeasurement and improvement in Australia. Curr Opin Psychiatry.2009;22(6):610-8.
11. Coia D, Glassborow R. Mental health quality and outcomemeasurement and improvement in Scotland. Curr Opin Psychia2009;22(6):643-7.
12. Herbstman BJ, Pincus HA. Measuring mental healthcare quality inthe United States: a review of initiatives. Curr Opin Psychiatry.2009;22(6):623-30.
13. Ito H. Quality and performance improvement for mental healthcarein Japan. Curr Opin Psychiatry. 2009;22(6):619
14. Byrne SL, Hooke GR, Page AC. Readmission: A useful indicator ofthe quality of inpatient psychiatric care. J. Affective Disord.2010;126(1-2):206-13.
15. Chong SA, Mythily, DeurenbergPerformance measures for mental healthcare in Singapore. AnnAcad Med Singapore. 2008;37(9):791
16. Dausey DJ, Pincus HA, Herrell JM. Performance measurement forco-occurring mental health and substance use disorders.Substance Abuse Treatment, Preventio
17. Halsteinli V, Kittelsen SA, Magnussen J. Productivity growth inoutpatient child and adolescent mental health services: the impactof case-mix adjustment. Soc Sci Med. 2010;70(3):439
18. Merrick EL, Hodgkin D, Horgan CM, GaChanging mental health gatekeeping: effects on performanceindicators. J Behav Health Serv Res. 2007;35(1):3
19. Pincus HA, Spaeth-Rublee B, Watkins KE. Analysis &commentary: The case for measuring quality in mental health andsubstance abuse care. Health Aff (Millwood). 2011;30(4):730
KCE Report 196 S3
Brown P, Pirkis J. Mental health quality and outcomemeasurement and improvement in Australia. Curr Opin Psychiatry.
Coia D, Glassborow R. Mental health quality and outcomemeasurement and improvement in Scotland. Curr Opin Psychiatry.
Herbstman BJ, Pincus HA. Measuring mental healthcare quality inthe United States: a review of initiatives. Curr Opin Psychiatry.
Ito H. Quality and performance improvement for mental healthcareCurr Opin Psychiatry. 2009;22(6):619-22.
Byrne SL, Hooke GR, Page AC. Readmission: A useful indicator ofthe quality of inpatient psychiatric care. J. Affective Disord.
Chong SA, Mythily, Deurenberg-Yap M, Verma S, Swartz M.erformance measures for mental healthcare in Singapore. Ann
Acad Med Singapore. 2008;37(9):791-6.
Dausey DJ, Pincus HA, Herrell JM. Performance measurement foroccurring mental health and substance use disorders.
Substance Abuse Treatment, Prevention, & Policy. 2009;4(18).
Halsteinli V, Kittelsen SA, Magnussen J. Productivity growth inoutpatient child and adolescent mental health services: the impact
mix adjustment. Soc Sci Med. 2010;70(3):439-46.
Merrick EL, Hodgkin D, Horgan CM, Garnick DW, McLaughlin TJ.Changing mental health gatekeeping: effects on performanceindicators. J Behav Health Serv Res. 2007;35(1):3-19.
Rublee B, Watkins KE. Analysis &commentary: The case for measuring quality in mental health andsubstance abuse care. Health Aff (Millwood). 2011;30(4):730-6.
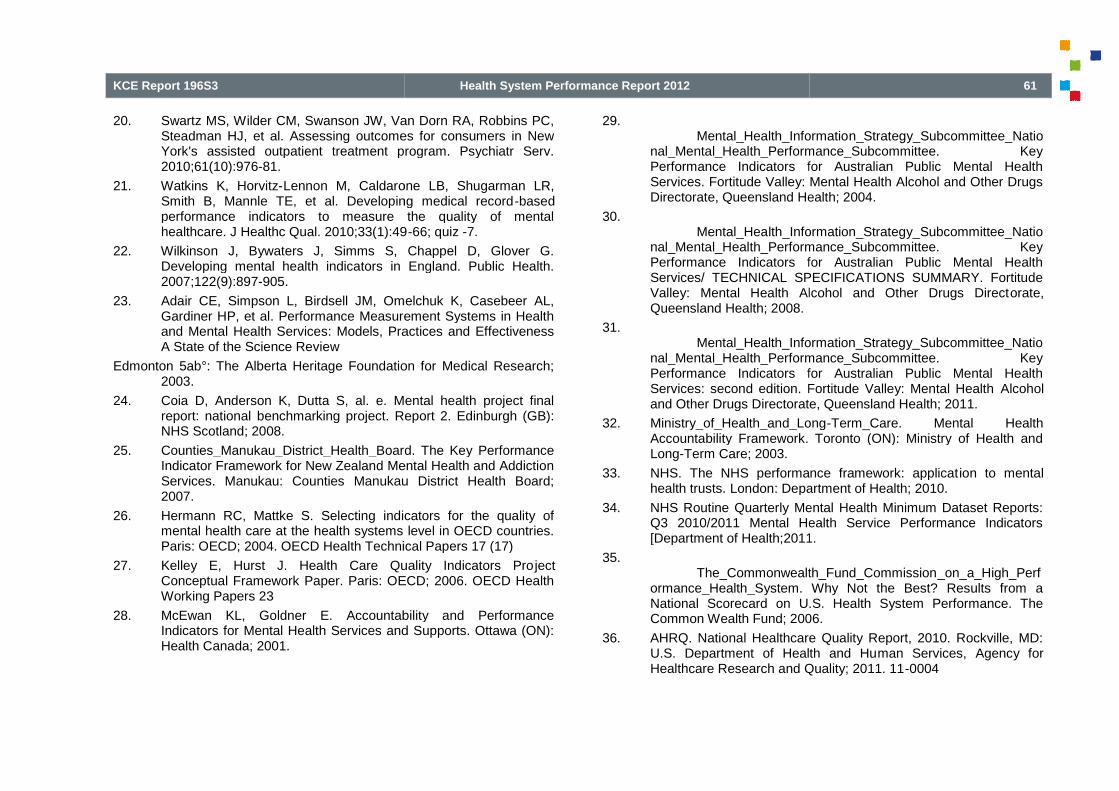
KCE Report 196S3
20. Swartz MS, Wilder CM, Swanson JW, Van Dorn RA, Robbins PC,Steadman HJ, et al. Assessing outcomes for consumers in NewYork's assisted outpatient treatment program. Psychiatr Serv.2010;61(10):976-81.
21. Watkins K, Horvitz-Lennon M, Caldarone LB, Shugarman LR,Smith B, Mannle TE, et al. Developing medical recordperformance indicators to measure the quality of mentalhealthcare. J Healthc Qual. 2010;33(1):49
22. Wilkinson J, Bywaters J, Simms S, Chappel D, Glover G.Developing mental health indicators in England. Public Health.2007;122(9):897-905.
23. Adair CE, Simpson L, Birdsell JM, Omelchuk K, Casebeer AL,Gardiner HP, et al. Performance Measurement Systems in Healthand Mental Health Services: Models, Practices and EffectivenessA State of the Science Review
Edmonton 5ab°: The Alberta Heritage Foundation for Medical Research;2003.
24. Coia D, Anderson K, Dutta S, al. e. Mental health project finalreport: national benchmarking project. Report 2. Edinburgh (GB):NHS Scotland; 2008.
25. Counties_Manukau_District_Health_Board. The Key PerformanceIndicator Framework for New Zealand Mental Health and AddictionServices. Manukau: Counties Manukau District Health Board;2007.
26. Hermann RC, Mattke S. Selecting indicators for the quality ofmental health care at the health systems level in OECD countries.Paris: OECD; 2004. OECD Health Technical Papers 17 (17)
27. Kelley E, Hurst J. Health Care Quality Indicators ProConceptual Framework Paper. Paris: OECD; 2006. OECD HealthWorking Papers 23
28. McEwan KL, Goldner E. Accountability and PerformanceIndicators for Mental Health Services and Supports. Ottawa (ON):Health Canada; 2001.
Health System Performance Report 2012
Swartz MS, Wilder CM, Swanson JW, Van Dorn RA, Robbins PC,Steadman HJ, et al. Assessing outcomes for consumers in NewYork's assisted outpatient treatment program. Psychiatr Serv.
Lennon M, Caldarone LB, Shugarman LR,Smith B, Mannle TE, et al. Developing medical record-basedperformance indicators to measure the quality of mentalhealthcare. J Healthc Qual. 2010;33(1):49-66; quiz -7.
n J, Bywaters J, Simms S, Chappel D, Glover G.Developing mental health indicators in England. Public Health.
Adair CE, Simpson L, Birdsell JM, Omelchuk K, Casebeer AL,Gardiner HP, et al. Performance Measurement Systems in Healthand Mental Health Services: Models, Practices and Effectiveness
Edmonton 5ab°: The Alberta Heritage Foundation for Medical Research;
Coia D, Anderson K, Dutta S, al. e. Mental health project finalbenchmarking project. Report 2. Edinburgh (GB):
Counties_Manukau_District_Health_Board. The Key PerformanceIndicator Framework for New Zealand Mental Health and AddictionServices. Manukau: Counties Manukau District Health Board;
Hermann RC, Mattke S. Selecting indicators for the quality ofmental health care at the health systems level in OECD countries.Paris: OECD; 2004. OECD Health Technical Papers 17 (17)
Kelley E, Hurst J. Health Care Quality Indicators ProjectConceptual Framework Paper. Paris: OECD; 2006. OECD Health
McEwan KL, Goldner E. Accountability and PerformanceIndicators for Mental Health Services and Supports. Ottawa (ON):
29.Mental_Health_Informatio
nal_Mental_Health_Performance_Subcommittee. KeyPerformance Indicators for Australian Public Mental HealthServices. Fortitude Valley: Mental Health Alcohol and Other DrugsDirectorate, Queensland Health; 2004.
30.Mental_Health_Information_Strategy_Subcommittee_Natio
nal_Mental_Health_Performance_Subcommittee. KeyPerformance Indicators for Australian Public Mental HealthServices/ TECHNICAL SPECIFICATIONS SUMMARY. FortitudeValley: Mental Health Alcohol and Other Drugs DirectQueensland Health; 2008.
31.Mental_Health_Information_Strategy_Subcommittee_Natio
nal_Mental_Health_Performance_Subcommittee. KeyPerformance Indicators for Australian Public Mental HealthServices: second edition. Fortitude Valley: Mental Healthand Other Drugs Directorate, Queensland Health; 2011.
32. Ministry_of_Health_and_LongAccountability Framework. Toronto (ON): Ministry of Health andLong-Term Care; 2003.
33. NHS. The NHS performance framework: applicathealth trusts. London: Department of Health; 2010.
34. NHS Routine Quarterly Mental Health Minimum Dataset Reports:Q3 2010/2011 Mental Health Service Performance Indicators[Department of Health;2011.
35.The_Commonwealth_Fund_Commission
ormance_Health_System. Why Not the Best? Results from aNational Scorecard on U.S. Health System Performance. TheCommon Wealth Fund; 2006.
36. AHRQ. National Healthcare Quality Report, 2010. Rockville, MD:U.S. Department of Health and HuHealthcare Research and Quality; 2011. 11
61
Mental_Health_Information_Strategy_Subcommittee_National_Mental_Health_Performance_Subcommittee. KeyPerformance Indicators for Australian Public Mental HealthServices. Fortitude Valley: Mental Health Alcohol and Other DrugsDirectorate, Queensland Health; 2004.
lth_Information_Strategy_Subcommittee_National_Mental_Health_Performance_Subcommittee. KeyPerformance Indicators for Australian Public Mental HealthServices/ TECHNICAL SPECIFICATIONS SUMMARY. FortitudeValley: Mental Health Alcohol and Other Drugs Directorate,Queensland Health; 2008.
Mental_Health_Information_Strategy_Subcommittee_National_Mental_Health_Performance_Subcommittee. KeyPerformance Indicators for Australian Public Mental HealthServices: second edition. Fortitude Valley: Mental Health Alcoholand Other Drugs Directorate, Queensland Health; 2011.
Ministry_of_Health_and_Long-Term_Care. Mental HealthAccountability Framework. Toronto (ON): Ministry of Health and
NHS. The NHS performance framework: application to mentalLondon: Department of Health; 2010.
NHS Routine Quarterly Mental Health Minimum Dataset Reports:Q3 2010/2011 Mental Health Service Performance Indicators[Department of Health;2011.
The_Commonwealth_Fund_Commission_on_a_High_Performance_Health_System. Why Not the Best? Results from aNational Scorecard on U.S. Health System Performance. TheCommon Wealth Fund; 2006.
AHRQ. National Healthcare Quality Report, 2010. Rockville, MD:U.S. Department of Health and Human Services, Agency forHealthcare Research and Quality; 2011. 11-0004

62
37. Barrett TJ, Berger BL, Bradley LA. Performance contracting: theColorado model revisited. Administration and Policy in MentalHealth. 1992;20(2):75-85.
38. Birleson P, Brann P, Smith A. Using program theory to developkey performance indicators for child and adolescent mental healthservices. Aust Health Rev. 2001;24(1):10-
39. Bremer RW, Scholle SH, Keyser D, Houtsinger JV, Pincus HA.Pay for performance in behavioral health.2008;59(12):1419-29.
40. Carpinello S, Felton CJ, Pease EA, DeMasi M, Donahue S.Designing a system for managing the performance of mentalhealth managed care: an example from New York State's prepaidmental health plan. J Behav Health Serv Res. 1998;25(3):269
41. Cohen A, Eastman N. Needs assessment for mentally disorderedoffenders: measurement of 'ability to benefit' and outcome. BritishJournal of Psychiatry. 2000;177:493-8.
42. Druss BG. A review of HEDIS measures and performance fmental disorders. Manag Care. 2004;13(6 Suppl Depression):4851.
43. Durbin J, Prendergast P, Dewa CS, Rush B, Cooke RG. Mentalhealth program monitoring: towards simplifying a complex task.Psychiatr Rehabil J. 2003;26(3):249-61.
44. Ganju V, Adams N, Bartels S, Callahan N, Carpinello S, GonzalezO, et al. Recommended Operational Definitions and Measures toImplement the NASMHPD Framework of Mental HealthPerformance Indicators. Alexandria (VA): NASMHPD President 'sTask; 2000.
45. GGZ_Transparency_steering_group. Basic set of performanceindicators for mental health care and addition care 2007Den Haag: Health Care Inspectorate; 2007.
46. Hermann RC, Chan JA, Provost SE, Chiu WT. Statisticalbenchmarks for process measures of quality of care fsubstance use disorders. Psychiatr Serv. 2006;57(10):1461
Health System Performance Report 2012
Barrett TJ, Berger BL, Bradley LA. Performance contracting: theColorado model revisited. Administration and Policy in Mental
Smith A. Using program theory to developkey performance indicators for child and adolescent mental health
-21.
Bremer RW, Scholle SH, Keyser D, Houtsinger JV, Pincus HA.Pay for performance in behavioral health. Psychiatr Serv.
Carpinello S, Felton CJ, Pease EA, DeMasi M, Donahue S.Designing a system for managing the performance of mentalhealth managed care: an example from New York State's prepaid
v Res. 1998;25(3):269-78.
Cohen A, Eastman N. Needs assessment for mentally disorderedoffenders: measurement of 'ability to benefit' and outcome. British
Druss BG. A review of HEDIS measures and performance formental disorders. Manag Care. 2004;13(6 Suppl Depression):48-
Durbin J, Prendergast P, Dewa CS, Rush B, Cooke RG. Mentalhealth program monitoring: towards simplifying a complex task.
Bartels S, Callahan N, Carpinello S, GonzalezO, et al. Recommended Operational Definitions and Measures toImplement the NASMHPD Framework of Mental HealthPerformance Indicators. Alexandria (VA): NASMHPD President 's
eering_group. Basic set of performanceindicators for mental health care and addition care 2007–2008.Den Haag: Health Care Inspectorate; 2007.
Hermann RC, Chan JA, Provost SE, Chiu WT. Statisticalbenchmarks for process measures of quality of care for mental andsubstance use disorders. Psychiatr Serv. 2006;57(10):1461-7.
47. Hermann RC, Leff HS, Palmer RH, Yang D, Teller T, Provost S, etal. Quality measures for mental health care: results from a nationalinventory. Medical Care Research & Review. 2
48. Hermann RC, Mattke S, Somekh D, Silfverhielm H, Goldner E,Glover G, et al. Quality indicators for international benchmarking ofmental health care. International Journal for Quality in Health Care.2006;1:31-8.
49. Hermann RC, Palmer H, Leff S, Shwartz M, Provost S, Chan J, etal. Achieving consensus across diverse stakeholders on qualitymeasures for mental healthcare. Med Care. 2004;42(12):1246
50. Jenkins R. Towards a system of outcome indicators for mentalhealth care. British Journal of Psychiatry. 1990;157:500
51. Lehman AF, Steinwachs DM. Patterns of usual care forschizophrenia: initial results from the Schizophrenia PatientOutcomes Research Team (PORT) Client Survey. Schizophr Bull.1998;24(1):11-20; discussion
52. Leslie DL, Rosenheck RA. Comparing quality of mental health carefor public-sector and privately insured populations. Psychiatr Serv.2000;51(5):650-5.
53. Lutterman T, Ganju V, Schacht L, Shaw R, Monihan K, et.al.Sixteen State Study on Mental Health PerfoRockville, MD: Center for Mental Health Services, SubstanceAbuse and Mental Health Services Administration; 2003. DHHSPublication (SMA) 03-3835
54. Marcus SC, Olfson M, Pincus HA, Zarin DA, Kupfer DJ.Therapeutic drug monitoring of moodpatients with bipolar disorder. Am J Psychiatry. 1999;156(7):10148.
55. McEwan KL, Goldner EM. Keeping mental health reform oncourse: selecting indicators of mental health system performance.Can J Commun Ment Health. 2002;21(1):
56. Milne D, Eminson S, Wood H, Hamilton L, Gibson K. Monitoringperformance in a community mental health centre. Int J HealthCare Qual Assur. 1995;8(6):38
KCE Report 196 S3
Hermann RC, Leff HS, Palmer RH, Yang D, Teller T, Provost S, etal. Quality measures for mental health care: results from a nationalinventory. Medical Care Research & Review. 2000;2:136-54.
Hermann RC, Mattke S, Somekh D, Silfverhielm H, Goldner E,Glover G, et al. Quality indicators for international benchmarking ofmental health care. International Journal for Quality in Health Care.
Leff S, Shwartz M, Provost S, Chan J, etal. Achieving consensus across diverse stakeholders on qualitymeasures for mental healthcare. Med Care. 2004;42(12):1246-53.
Jenkins R. Towards a system of outcome indicators for mentalrnal of Psychiatry. 1990;157:500-14.
Lehman AF, Steinwachs DM. Patterns of usual care forschizophrenia: initial results from the Schizophrenia PatientOutcomes Research Team (PORT) Client Survey. Schizophr Bull.
20; discussion -32.
eslie DL, Rosenheck RA. Comparing quality of mental health caresector and privately insured populations. Psychiatr Serv.
Lutterman T, Ganju V, Schacht L, Shaw R, Monihan K, et.al.Sixteen State Study on Mental Health Performance Measures.Rockville, MD: Center for Mental Health Services, SubstanceAbuse and Mental Health Services Administration; 2003. DHHS
3835
Marcus SC, Olfson M, Pincus HA, Zarin DA, Kupfer DJ.Therapeutic drug monitoring of mood stabilizers in Medicaidpatients with bipolar disorder. Am J Psychiatry. 1999;156(7):1014-
McEwan KL, Goldner EM. Keeping mental health reform oncourse: selecting indicators of mental health system performance.Can J Commun Ment Health. 2002;21(1):5-16.
Milne D, Eminson S, Wood H, Hamilton L, Gibson K. Monitoringperformance in a community mental health centre. Int J HealthCare Qual Assur. 1995;8(6):38-41.

KCE Report 196S3
57. Rosenheck R, Cicchetti D. A mental health program report card: amultidimensional approach to performance monitoring in publicsector programs. Community Ment Health J. 1998;34(1):85
58. Santiago JM. Use of the balanced scorecard to improve the qualityof behavioral health care. Psychiatr Serv. 1999;50(12):1571
59. Stakes. European mental health indicators. Proposed set of mentalhealth indicators; definitions, description and sources. Helsinki:National Research and Development Centre for Welfare andHealth (STAKES); 2001.
60. Westert GP, Berg MJvdK, X., H. V. Dutch Health CarePerformance Report 2008. Bilthoven: National Institute for PublicHealth and the Environment; 2008.
61. Young AS, Sullivan G, Burnam MA, Brook RH. Measuring thequality of outpatient treatment for schizophrenia. Arch GenPsychiatry. 1998;55(7):611-7.
62. Desai RA, Dausey DJ, Rosenheck RA. Mental health servicedelivery and suicide risk: the role of individual patient and facilityfactors. Am J Psychiatry. 2005;162(2):311
63. OECD. Health Care Quality Indicators: background paper to themental health subgroup meeting. Paris: OECD; 2011 Thursday 17November.
64. OECD. Health at a Glance 2011, OECD Indicators. 2011.
65. Deprez N, Antoine J, Asueta-Lorente JF, Bollaerts K, Van derLinden T, van Bussel J. Belgian national report on drugs 2011:new developments, trends and in-depth information on selectedissues. Brussels: Scientific Institute of Public Health, OD PublicHealth and Surveillance, Substance Use and Related Disorders,Belgian Monitoring Centre for Drugs and Drugs Addiction; 2011.
66. OECD. Sickness, Disability and Work Breaking the Barriers. 2010.
67. Counties Manukau District Health Board. The Key PerformanceIndicator Framework for New Zealand Mental Health and AddictionServices. Manukau: Counties Manukau District Health Board;2007.
Health System Performance Report 2012
Rosenheck R, Cicchetti D. A mental health program report card: aroach to performance monitoring in public
sector programs. Community Ment Health J. 1998;34(1):85-106.
Santiago JM. Use of the balanced scorecard to improve the qualityof behavioral health care. Psychiatr Serv. 1999;50(12):1571-6.
mental health indicators. Proposed set of mentalhealth indicators; definitions, description and sources. Helsinki:National Research and Development Centre for Welfare and
Westert GP, Berg MJvdK, X., H. V. Dutch Health Careerformance Report 2008. Bilthoven: National Institute for Public
Young AS, Sullivan G, Burnam MA, Brook RH. Measuring thequality of outpatient treatment for schizophrenia. Arch Gen
Desai RA, Dausey DJ, Rosenheck RA. Mental health servicedelivery and suicide risk: the role of individual patient and facilityfactors. Am J Psychiatry. 2005;162(2):311-8.
OECD. Health Care Quality Indicators: background paper to thegroup meeting. Paris: OECD; 2011 Thursday 17
OECD. Health at a Glance 2011, OECD Indicators. 2011.
Lorente JF, Bollaerts K, Van derLinden T, van Bussel J. Belgian national report on drugs 2011:
depth information on selectedissues. Brussels: Scientific Institute of Public Health, OD PublicHealth and Surveillance, Substance Use and Related Disorders,Belgian Monitoring Centre for Drugs and Drugs Addiction; 2011.
OECD. Sickness, Disability and Work Breaking the Barriers. 2010.
Counties Manukau District Health Board. The Key PerformanceIndicator Framework for New Zealand Mental Health and AddictionServices. Manukau: Counties Manukau District Health Board;
68. Lorant V, Depuydt C, Gillain B, Guillet A, Dubois V. Involuntarycommitment in psychiatric care: what drives the decision? SocPsychiatry Psychiatr Epidemiol. 2007;42(5):360
69. Morgan C, Mallett R, Hutchinson G, Leff J. Negative pathways topsychiatric care and ethnicity: the bridge between social scienceand psychiatry. Soc Sci Med. 2004;58(4):739
70. Priebe S, Badesconyi A, Fioritti A, Hansson L, Kilian R, TorresGonzales F, et al. Reinstitutionalisation in mental health care:comparison of data on service provision from six Europeancountries. BMJ. 2005;330(7483):123
71. Salize HJ, Dressing H. Epidemiology of involuntary placement ofmentally ill people across the European Union. British Journal ofPsychiatry. 2004;184:163-8.
72. WHO. Policies and practices for mental health in Europe: meetingthe challenges. Copenhagen: WHO Regional Office for Europe;2008.
73. RIZIV. Farmaceutische kengetallen, Farmaceutischeverstrekkingen, Ambulante praktijk. Brussel: RIZIV; 2009.
74. Superior Health Council. De impact van psychofarmaca op degezondheid met een bijzondere aandacht voor ouderen. Brussel:Hoge Gezondheidsraad; 2011. nr. 8571
75. Casteels M, Danckaerts M, De Lepeleire J, Demyttenaere K,Laekman G, Luyten P, et al. Het toenemend gebruik vanpsychofarmaca: visietekst werkgroep metaforum Leuven. Leuven:KULeuven; 2010. Metaforum
76. Boutsen M, Laasman JM, Maron L. Antidepresseurs: ela prescription. Bruxelles: UNMS
77. Garcia-Armesto S, Medeiros H, Wei L. Information Availibility formeasuring and comparing quality of mental health care acrossOECD countries. Paris: OECD; 2008. OECD Health TechnicPapers
78. van Eijk ME, Avorn J, Porsius AJ, de Boer A. Reducing prescribingof highly anticholinergic antidepressants for elderly people:randomised trial of group versus individual academic detailing.2001;322(7287):654-7.
63
Lorant V, Depuydt C, Gillain B, Guillet A, Dubois V. Involuntarycommitment in psychiatric care: what drives the decision? SocPsychiatry Psychiatr Epidemiol. 2007;42(5):360-5.
Morgan C, Mallett R, Hutchinson G, Leff J. Negative pathways tosychiatric care and ethnicity: the bridge between social science
and psychiatry. Soc Sci Med. 2004;58(4):739-52.
Priebe S, Badesconyi A, Fioritti A, Hansson L, Kilian R, Torres-Gonzales F, et al. Reinstitutionalisation in mental health care:
of data on service provision from six Europeancountries. BMJ. 2005;330(7483):123-6.
Salize HJ, Dressing H. Epidemiology of involuntary placement ofmentally ill people across the European Union. British Journal of
8.
Policies and practices for mental health in Europe: meetingthe challenges. Copenhagen: WHO Regional Office for Europe;
RIZIV. Farmaceutische kengetallen, Farmaceutischeverstrekkingen, Ambulante praktijk. Brussel: RIZIV; 2009.
Health Council. De impact van psychofarmaca op degezondheid met een bijzondere aandacht voor ouderen. Brussel:Hoge Gezondheidsraad; 2011. nr. 8571
Casteels M, Danckaerts M, De Lepeleire J, Demyttenaere K,Laekman G, Luyten P, et al. Het toenemend gebruik vanpsychofarmaca: visietekst werkgroep metaforum Leuven. Leuven:
Metaforum
Boutsen M, Laasman JM, Maron L. Antidepresseurs: evolution deBruxelles: UNMS-Direction Etudes; 2012.
Armesto S, Medeiros H, Wei L. Information Availibility formeasuring and comparing quality of mental health care acrossOECD countries. Paris: OECD; 2008. OECD Health Technical
van Eijk ME, Avorn J, Porsius AJ, de Boer A. Reducing prescribingof highly anticholinergic antidepressants for elderly people:randomised trial of group versus individual academic detailing.

64
79. Mintzer J, Burns A. Anticholinergic side-effects of drugs in elderlypeople. J R Soc Med. 2000;93(9):457-62.
80. van Eijk ME, Bahri P, Dekker G, Herings RM, Porsius A, Avorn J,et al. Use of prevalence and incidence measures to describe agerelated prescribing of antidepressantanticholinergic effects. J Clin Epidemiol. 2000;53(6):645
81. CIHI Indicateurs de la santé [2011 [cited 20 september].from: http://secure.cihi.ca/indicators/2011/tables_f.html
82. Armesto SG, Medeiros H, Wei L. Information Availability formeasuring and comparing quality of mental health care acrossoecd countries. Paris: OECD; 2008. OECD Health TechnicalPapers
Health System Performance Report 2012
effects of drugs in elderly62.
van Eijk ME, Bahri P, Dekker G, Herings RM, Porsius A, Avorn J,Use of prevalence and incidence measures to describe age-
related prescribing of antidepressants with and withoutJ Clin Epidemiol. 2000;53(6):645-51.
CIHI Indicateurs de la santé [2011 [cited 20 september]. Available/2011/tables_f.html
Armesto SG, Medeiros H, Wei L. Information Availability formeasuring and comparing quality of mental health care acrossoecd countries. Paris: OECD; 2008. OECD Health Technical
83. Horovitz-Lennon M, Watkins KE, Pincus HA,Smith B, Mattox T, et al. Veterans Health Administration MentalHealth Program Evaluation Technical Manual. RAND; 2009.
84. Owens PL, Mutter R, Stocks C. Mental Health and SubstanceAbuse-Related Emergency Department Visits among Adults.AHRQ, HEALTHCARE COST AND UTILIZATION PROJECT;2010. Statistical Briefs
85. Larkin G, Claassen C, Emond J, al. e. Trends in US emergencydepartment visits for mental health conditions, 1992 to 2001.Psychiatric Services. 2005;56(6):671
KCE Report 196 S3
Lennon M, Watkins KE, Pincus HA, Shugarman LR,Smith B, Mattox T, et al. Veterans Health Administration MentalHealth Program Evaluation Technical Manual. RAND; 2009.
Owens PL, Mutter R, Stocks C. Mental Health and SubstanceRelated Emergency Department Visits among Adults.
HRQ, HEALTHCARE COST AND UTILIZATION PROJECT;
Larkin G, Claassen C, Emond J, al. e. Trends in US emergencydepartment visits for mental health conditions, 1992 to 2001.Psychiatric Services. 2005;56(6):671-7.
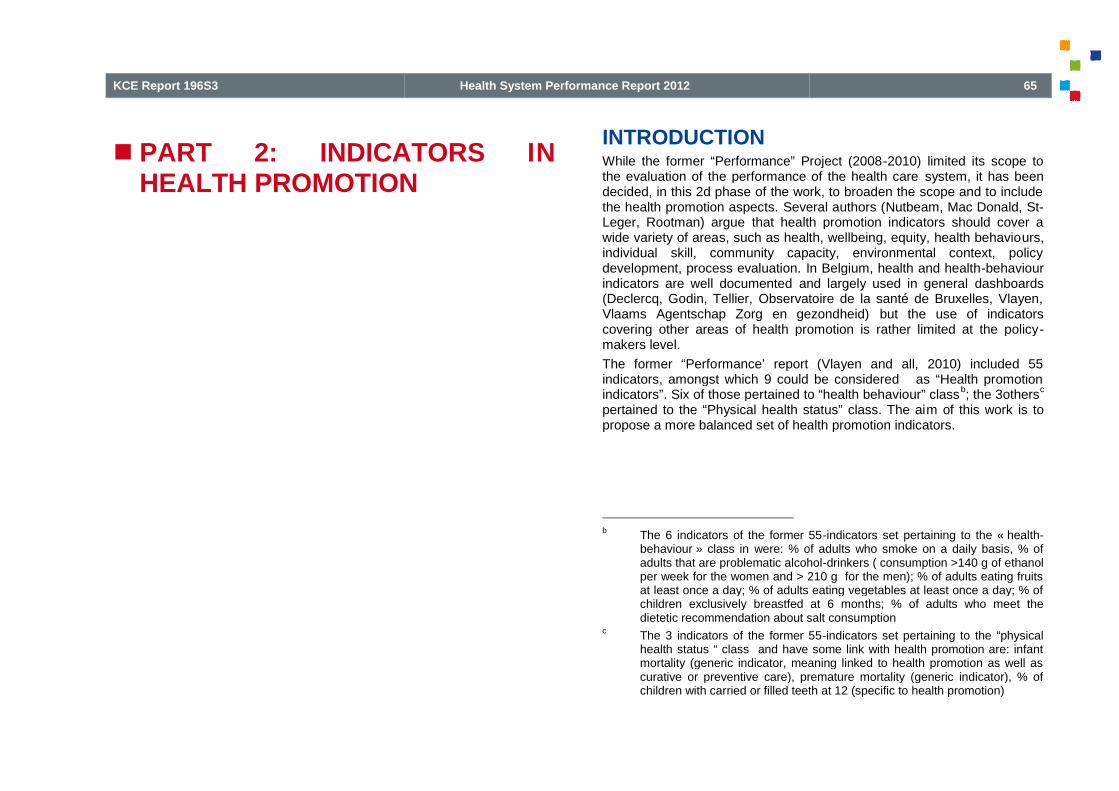
KCE Report 196S3
PART 2: INDICATORS IHEALTH PROMOTION
Health System Performance Report 2012
PART 2: INDICATORS INHEALTH PROMOTION
INTRODUCTIONWhile the former “Performance” Project (2008the evaluation of the performance of the health caredecided, in this 2d phase of the work, to broaden the scope and to includethe health promotion aspects. Several authors (Leger, Rootman) argue that health promotion indicators should cover awide variety of areas, such as health, wellbeing, equity, health behavioindividual skill, community capacity, environmental context, policydevelopment, process evaluation. In Belgium, health and healthindicators are well documented and largely used in general(Declercq, Godin, Tellier, Observatoire de la santé de Bruxelles, Vlayen,Vlaams Agentschap Zorg en gezondheid)covering other areas of health promotion is rather limited at the policymakers level.
The former “Performance’ report (Vlayen and all, 2010) included 55indicators, amongst which 9 could be considered as “Health promotionindicators”. Six of those pertained to “health behaviour” classpertained to the “Physical health status” class. The aipropose a more balanced set of health promotion indicators.
bThe 6 indicators of the former 55behaviour » class in were: % of adults who smoke on a daily basis, % ofadults that are problematic alcoholper week for the women and > 210 g for the men); % of adults eating fruitsat least once a day; % of adults eating vegetables at least once a day; % ofchildren exclusively breastfed at 6 mondietetic recommendation about salt consumption
cThe 3 indicators of the former 55health status “ class and have some link with health promotion are: infantmortality (generic indicator, meaning linked to health promotion as well ascurative or preventive care), premature mortality (generic indicator), % ofchildren with carried or filled teeth at 12 (specific to health promotion)
65
While the former “Performance” Project (2008-2010) limited its scope tothe evaluation of the performance of the health care system, it has beendecided, in this 2d phase of the work, to broaden the scope and to include
Several authors (Nutbeam, Mac Donald, St-that health promotion indicators should cover a
s, such as health, wellbeing, equity, health behaviours,individual skill, community capacity, environmental context, policy
In Belgium, health and health-behaviourand largely used in general dashboards
(Declercq, Godin, Tellier, Observatoire de la santé de Bruxelles, Vlayen,Vlaams Agentschap Zorg en gezondheid) but the use of indicatorscovering other areas of health promotion is rather limited at the policy-
rmance’ report (Vlayen and all, 2010) included 55indicators, amongst which 9 could be considered as “Health promotionindicators”. Six of those pertained to “health behaviour” class
b; the 3others
c
pertained to the “Physical health status” class. The aim of this work is topropose a more balanced set of health promotion indicators.
The 6 indicators of the former 55-indicators set pertaining to the « health-were: % of adults who smoke on a daily basis, % of
e problematic alcohol-drinkers ( consumption >140 g of ethanolper week for the women and > 210 g for the men); % of adults eating fruitsat least once a day; % of adults eating vegetables at least once a day; % ofchildren exclusively breastfed at 6 months; % of adults who meet thedietetic recommendation about salt consumption
indicators of the former 55-indicators set pertaining to the “physicalhealth status “ class and have some link with health promotion are: infantmortality (generic indicator, meaning linked to health promotion as well ascurative or preventive care), premature mortality (generic indicator), % of
ried or filled teeth at 12 (specific to health promotion)

66
1. OBJECTIVESThe purpose of this section is to examine the feasibility to broaden thespectrum of indicators to cover other issues related to health promotion,such as environmental context, policy development, community capacity,individual skills. The set of health promotion indicators should beintegrated in the global set of performance indicators, and should thenkept at a reasonable number.
2. METHODSThe general principle of the method was to select indicators through aniterative process. An initial “Long list” of potential indicators is generatedfrom various sources. It is then gradually filtered down through severalselection steps.
2.1. Phase 1: producing of a “long list” of potential indicatorsfrom various sources
2.1.1. Sources of indicators
Literature review: A search in the indexed literature on healthpromotion indicators was completed using the Medline (Ovid) andEmbase databases. The concepts of performance measurement,health promotion and health policies were approached by a searchstrategy using several terms for each concept (see annex). Thesearch was limited to articles published since 2000 in English, Frenchor Dutch. 706 articles were retrieved and scanned on title and/orabstract. The criteria to exclude articles were: no indicator presented,too different context (developing countries), too specific intervention(for instance evaluation of a specific project of physical acgiven town or enterprise) or intervention targeting a very specificsubpopulation (example baby’s, patients with cognitive problems, etc).
Additional published articles providing indicators were found by“handsearching”, for instance by checking in the list of references ofthe articles read.
Health System Performance Report 2012
is to examine the feasibility to broaden thespectrum of indicators to cover other issues related to health promotion,
ntal context, policy development, community capacity,The set of health promotion indicators should be
integrated in the global set of performance indicators, and should then be
elect indicators through an. An initial “Long list” of potential indicators is generated
from various sources. It is then gradually filtered down through several
of potential indicators
A search in the indexed literature on healthpromotion indicators was completed using the Medline (Ovid) and
The concepts of performance measurement,health promotion and health policies were approached by a searchstrategy using several terms for each concept (see annex). Thesearch was limited to articles published since 2000 in English, French
ticles were retrieved and scanned on title and/orabstract. The criteria to exclude articles were: no indicator presented,too different context (developing countries), too specific intervention(for instance evaluation of a specific project of physical activity in agiven town or enterprise) or intervention targeting a very specificsubpopulation (example baby’s, patients with cognitive problems, etc).
Additional published articles providing indicators were found byng in the list of references of
Beside this search in the indexed literature, a search on healthpromotion indicators in the grey literature was performedwas essentially done in international websites providing healthindicators (WHO- OECD, European Union). For national websites, weused links provide in a former review comparing health systems indeveloped countries (Doumont
The provisory results of the literature search have been discusseda panel expert, during a 1st expbeen proposed by the experts.
2.1.2. Classification of the indicators
Extraction of the indicators from the sources:indicators were then extracted from the retained material.the list of “Physical health outcomes” indicators to those that could beimproved by health promotion intervention. For each indicator, weextracted also its purpose and the potential use of this information (towhat, for whom), in the context of each publicwere extracted to generate the initial “Long list”.
Choice of a conceptual framework: several frameworks have beenproposed to classify health promotion indicators (EUHPID). Nutbeam has proposed a framework that clapromotion indicators in 4 broad classes ranking from most proximalindicators (health promotion actions), through health promotionoutcomes (health literacy, social influence and policies), intermediatehealth outcomes (healthy lifestyle, efhealthy settings), to final health and social outcomes (physical health,like morbidity and mortality, and social health like well being andequity). In this work, we choose the Nutbeam’s framework to classifythe indicators, because it corresponds largely to the broad axes andprinciples of the Ottawa Charter. He has been widely usedrelative simplicity makes it appropriate tools for evaluation purposes.
Classification of the indicators: the 210 indicators of the long list wereclassified according to the subclasses of the Nutbeam model. Someindicators that were part of a comprehensive auditassessing all aspects of projects were considerscope of this work.
KCE Report 196 S3
Beside this search in the indexed literature, a search on healthpromotion indicators in the grey literature was performed. The search
international websites providing health-relatedOECD, European Union). For national websites, we
used links provide in a former review comparing health systems in).
The provisory results of the literature search have been discussed with1st expert meeting; additional reading has
been proposed by the experts.
Classification of the indicators
Extraction of the indicators from the sources: the health promotionindicators were then extracted from the retained material. We limited
“Physical health outcomes” indicators to those that could beimproved by health promotion intervention. For each indicator, weextracted also its purpose and the potential use of this information (towhat, for whom), in the context of each publication. 210 indicators
the initial “Long list”.
Choice of a conceptual framework: several frameworks have beenproposed to classify health promotion indicators (Nutbeam, Cloetta,
). Nutbeam has proposed a framework that classifies healthpromotion indicators in 4 broad classes ranking from most proximalindicators (health promotion actions), through health promotionoutcomes (health literacy, social influence and policies), intermediatehealth outcomes (healthy lifestyle, effective health services andhealthy settings), to final health and social outcomes (physical health,like morbidity and mortality, and social health like well being andequity). In this work, we choose the Nutbeam’s framework to classify
ecause it corresponds largely to the broad axes andprinciples of the Ottawa Charter. He has been widely used and itsrelative simplicity makes it appropriate tools for evaluation purposes.
Classification of the indicators: the 210 indicators of the long list wereclassified according to the subclasses of the Nutbeam model. Some
a comprehensive audit-tool intended atassessing all aspects of projects were considered as outside the
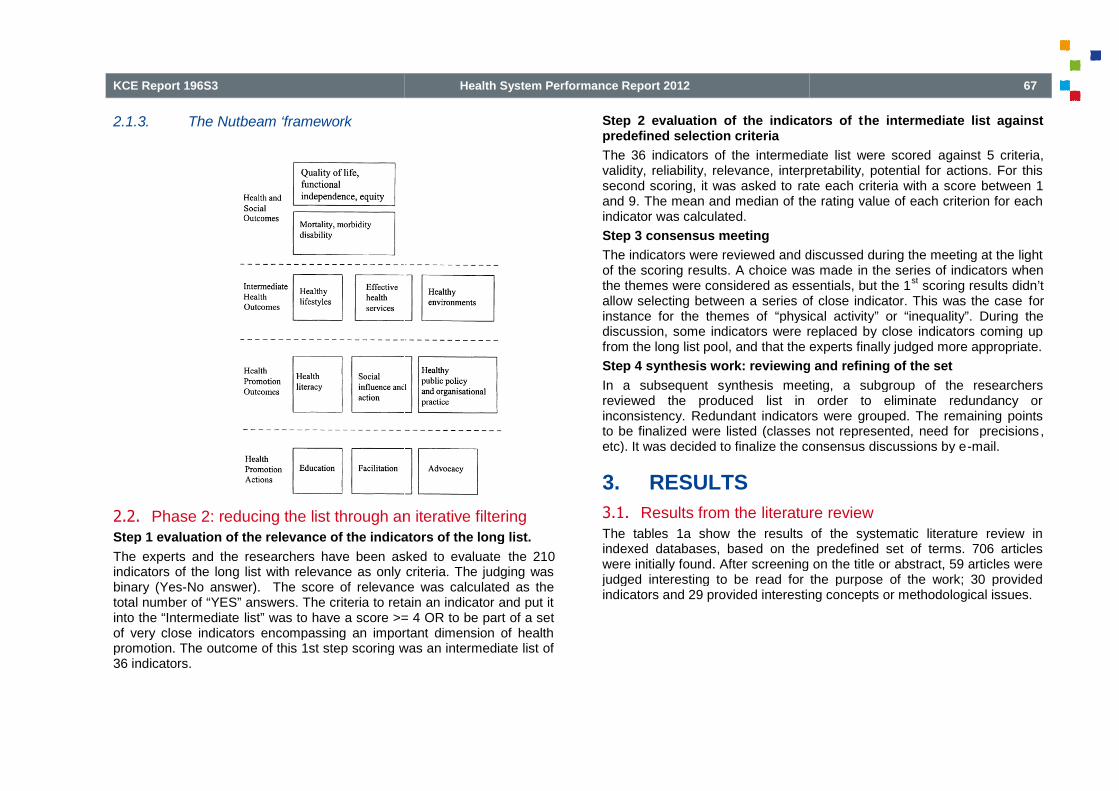
KCE Report 196S3
2.1.3. The Nutbeam ‘framework
2.2. Phase 2: reducing the list through an iterative filteringStep 1 evaluation of the relevance of the indicators of the long list.
The experts and the researchers have been asked to evaluateindicators of the long list with relevance as only criteria. The judging wasbinary (Yes-No answer). The score of relevance was calculated as thetotal number of “YES” answers. The criteria to retain an indicator and put itinto the “Intermediate list” was to have a score >= 4 OR to be part of a setof very close indicators encompassing an important dimension of healthpromotion. The outcome of this 1st step scoring was an intermediate list of36 indicators.
Health System Performance Report 2012
Phase 2: reducing the list through an iterative filteringStep 1 evaluation of the relevance of the indicators of the long list.
The experts and the researchers have been asked to evaluate the 210indicators of the long list with relevance as only criteria. The judging was
No answer). The score of relevance was calculated as thetotal number of “YES” answers. The criteria to retain an indicator and put it
list” was to have a score >= 4 OR to be part of a setof very close indicators encompassing an important dimension of healthpromotion. The outcome of this 1st step scoring was an intermediate list of
Step 2 evaluation of the indicators of tpredefined selection criteria
The 36 indicators of the intermediate list were scoredvalidity, reliability, relevance, interpretability, potential for actions. For thissecond scoring, it was asked to ratand 9. The mean and median of the rating value of each criterion for eachindicator was calculated.
Step 3 consensus meeting
The indicators were reviewed and discussed during the meeting at the lightof the scoring results. A choice was madethe themes were considered as essentials, but the 1allow selecting between a series of close indicator. This was the caseinstance for the themes of “physical activitydiscussion, some indicators were replaced by close indicators coming upfrom the long list pool, and that the experts finally judged more appropriate.
Step 4 synthesis work: reviewing and refining of the set
In a subsequent synthesis meeting, a subgroup of the researchersreviewed the produced list in order to eliminate redundancy orinconsistency. Redundant indicators were grouped. The remaining pointsto be finalized were listed (classes not represented, need for precisionsetc). It was decided to finalize the consensus discussions by e
3. RESULTS
3.1. Results from the literatureThe tables 1a show the results of the systematic literature review inindexed databases, based on the predefined set of terms. 706 articleswere initially found. After screening on the title or abstract, 59 articles werejudged interesting to be read for the purpose of the work; 30 providedindicators and 29 provided interesting concepts or methodological issues.
67
Step 2 evaluation of the indicators of the intermediate list against
he 36 indicators of the intermediate list were scored against 5 criteria,validity, reliability, relevance, interpretability, potential for actions. For this
rate each criteria with a score between 1The mean and median of the rating value of each criterion for each
The indicators were reviewed and discussed during the meeting at the lightesults. A choice was made in the series of indicators when
were considered as essentials, but the 1st
scoring results didn’tallow selecting between a series of close indicator. This was the case for
“physical activity” or “inequality”. During thediscussion, some indicators were replaced by close indicators coming upfrom the long list pool, and that the experts finally judged more appropriate.
Step 4 synthesis work: reviewing and refining of the set
ynthesis meeting, a subgroup of the researchersreviewed the produced list in order to eliminate redundancy or
Redundant indicators were grouped. The remaining pointsto be finalized were listed (classes not represented, need for precisions,etc). It was decided to finalize the consensus discussions by e-mail.
literature reviewThe tables 1a show the results of the systematic literature review inindexed databases, based on the predefined set of terms. 706 articles
ere initially found. After screening on the title or abstract, 59 articles werejudged interesting to be read for the purpose of the work; 30 providedindicators and 29 provided interesting concepts or methodological issues.

68
Table 1a: Results from the systematic literature reviewdatabases
1. Standardized searchMedline-embase
Total found
Rejected based on title or abstract
Read from systematic search
Documents with indicators
Documents interesting for conceptmethodological issues
The table 1b shows the results of the whole documental research, bysource. On the light of those results, it should be noted that the research inthe grey literature and by handsearching was much more productive thatthe systematic literature research. Some possible explanations are thatmany of those indicators are still in development phase and not yetpublished, that many of them are context-dependent (meaning adapted tonational objectives) and are not judged enough interesthat the subject itself of indicators in health promotion doesn’t interest theeditors.
Health System Performance Report 2012
literature review in indexed
Standardized search Nb
706
647
59
From which
30
Documents interesting for concept or 29
The table 1b shows the results of the whole documental research, bysource. On the light of those results, it should be noted that the research inthe grey literature and by handsearching was much more productive that
matic literature research. Some possible explanations are thatmany of those indicators are still in development phase and not yet
dependent (meaning adapted tonational objectives) and are not judged enough interesting to be published,that the subject itself of indicators in health promotion doesn’t interest the
Table 1b: Results from the whole documental research, by source
2. Total readfrom allsources
StandardizedsearchMedline-embase
Documents withindicators
30
Documentsinteresting forconcept ormethod
29
Read from allsources
59
3.2. Results from the selection process ofStep 1 Evaluation of the relevance of the indicators of the long list.
The evaluation of the long list of 210 indicators is shown in table 2.
26 indicators reached a score >=4
10 indicators with a score <4 were kept for the second round because theyencompass an important dimension; they were very close from each other,so the experts choices were spread between them.
An intermediate list of 36 indicators was produced
KCE Report 196 S3
Table 1b: Results from the whole documental research, by source
Standardized Handsearching Greyliterature
Total
15 48 93
23 15 67
38 63 160
s from the selection process of indicatorsStep 1 Evaluation of the relevance of the indicators of the long list.
The evaluation of the long list of 210 indicators is shown in table 2.
10 indicators with a score <4 were kept for the second round because theyompass an important dimension; they were very close from each other,
so the experts choices were spread between them.
An intermediate list of 36 indicators was produced

KCE Report 196S3
Step 2 evaluation of the indicators of the intermediate list againstpredefined selection criteria
The intermediate list of 36 indicators contained 10 indicators that scored 7or higher at the 1
stscoring. Those were kept in the set for discussion at the
expert meeting but were not scored against other predetermined criteria.
6 indicators from last years were re-evaluated positively and stayed in thenew data set:
Infant mortality
Premature mortality
% of adults who smokes on a daily basis
% of adults who are problematic alcohol-drinkers
% of children with carried or filled teeth at 12
2 others indicators were kept after the 1st
round because they reacheda good score.
% of health expenditures devoted to prevention of public health
% of people who are overweight or obese, stratified by childrenadolescents-adults
The remaining 28 indicators were submitted to the scoring against theother criteria (reliability, relevance, interpretability, potential for actionsThe mean and median of the rating value of each criterion for eachindicator scoring of the intermediate list is shown in
Step 3 consensus meeting, and
Step 4 synthesis work: reviewing and refining of the set
The results of the step 3 and 4 are presented together in the table 4.
21 indicators were retained: 5 of them are generichealth promotion. They are spread into many of the subclasses of theconceptual model (table 2); seemingly it is more difficult to find indicatorsfor some categories than for others.
dMeaning that they are linked to curative and preventive care as well as to health
promotion
Health System Performance Report 2012
Step 2 evaluation of the indicators of the intermediate list against
The intermediate list of 36 indicators contained 10 indicators that scored 7scoring. Those were kept in the set for discussion at the
expert meeting but were not scored against other predetermined criteria.
evaluated positively and stayed in the
drinkers
round because they reached
% of health expenditures devoted to prevention of public health
% of people who are overweight or obese, stratified by children-
indicators were submitted to the scoring against thereliability, relevance, interpretability, potential for actions).
mean and median of the rating value of each criterion for eachscoring of the intermediate list is shown in table 3.
Step 4 synthesis work: reviewing and refining of the set
The results of the step 3 and 4 are presented together in the table 4.
indicators were retained: 5 of them are genericd
and 16 are specific foromotion. They are spread into many of the subclasses of the
conceptual model (table 2); seemingly it is more difficult to find indicators
Meaning that they are linked to curative and preventive care as well as to health
The following issues or limits of the set were pointed out:
In particular, there was no indicator for the category “effective healthservices”. An additional effort will be made to find one.
No indicator was proposed in the field of occupational healthpromotion.
The indicator “Composite index on the health promotion policy in tmunicipalities (VIGEZ) should be further documented
The indicator on health literacy issued from the European work is stillin development and should be validated.
The optimal indicator on the consumption of fruits ad vegetablesshould be “% of people who consume fruits and vegetable inaccordance to the national/regional recommendations”; since it is notregularly measurable, it will be recommended to use the 2 indicatorsfrom the HIS to follow this behavior. They will be considered assecondary indicators
At the end of the process, the resulting list of indicatorthan the expected result (the expected number was about ten).Maybe this will be further shortened when the global set ofperformance indicators will be set up.
69
The following issues or limits of the set were pointed out:
no indicator for the category “effective healthAn additional effort will be made to find one.
No indicator was proposed in the field of occupational health
The indicator “Composite index on the health promotion policy in themunicipalities (VIGEZ) should be further documented
The indicator on health literacy issued from the European work is stillin development and should be validated.
The optimal indicator on the consumption of fruits ad vegetablesho consume fruits and vegetable in
accordance to the national/regional recommendations”; since it is notregularly measurable, it will be recommended to use the 2 indicatorsfrom the HIS to follow this behavior. They will be considered as
, the resulting list of indicator is a bit longerthan the expected result (the expected number was about ten).Maybe this will be further shortened when the global set ofperformance indicators will be set up.
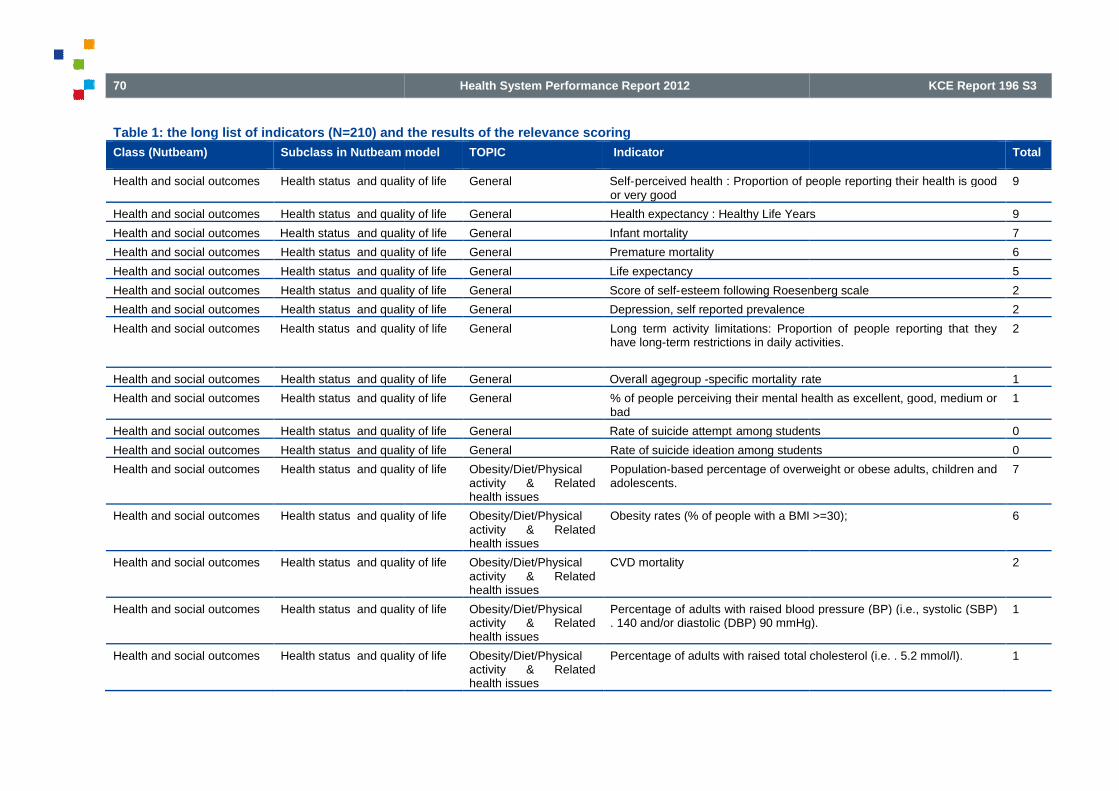
70
Table 1: the long list of indicators (N=210) and the results of the relevance scoring
Class (Nutbeam) Subclass in Nutbeam model
Health and social outcomes Health status and quality of life
Health and social outcomes Health status and quality of life
Health and social outcomes Health status and quality of life
Health and social outcomes Health status and quality of life
Health and social outcomes Health status and quality of life
Health and social outcomes Health status and quality of life
Health and social outcomes Health status and quality of life
Health and social outcomes Health status and quality of life
Health and social outcomes Health status and quality of life
Health and social outcomes Health status and quality of life
Health and social outcomes Health status and quality of life
Health and social outcomes Health status and quality of life
Health and social outcomes Health status and quality of life
Health and social outcomes Health status and quality of life
Health and social outcomes Health status and quality of life
Health and social outcomes Health status and quality of life
Health and social outcomes Health status and quality of life
Health System Performance Report 2012
: the long list of indicators (N=210) and the results of the relevance scoring
Subclass in Nutbeam model TOPIC Indicator
Health status and quality of life General Self-perceived health : Proportion of people reporting their health is goodor very good
Health status and quality of life General Health expectancy : Healthy Life Years
and quality of life General Infant mortality
Health status and quality of life General Premature mortality
Health status and quality of life General Life expectancy
Health status and quality of life General Score of self-esteem following Roesenberg scale
Health status and quality of life General Depression, self reported prevalence
quality of life General Long term activity limitations: Proportion of people reporting that theyhave long-term restrictions in daily activities.
Health status and quality of life General Overall agegroup -specific mortality rate
Health status and quality of life General % of people perceiving their mental health as excellent, good, medium orbad
Health status and quality of life General Rate of suicide attempt among students
Health status and quality of life General Rate of suicide ideation among students
Health status and quality of life Obesity/Diet/Physicalactivity & Relatedhealth issues
Population-based percentage of overweight or obese adults, children andadolescents.
Health status and quality of life Obesity/Diet/Physicalactivity & Relatedhealth issues
Obesity rates (% of people with a BMI >=30);
Health status and quality of life Obesity/Diet/Physicalactivity & Relatedhealth issues
CVD mortality
Health status and quality of life Obesity/Diet/Physicalactivity & Relatedhealth issues
Percentage of adults with raised blood pressure (BP) (i.e., systolic (SBP). 140 and/or diastolic (DBP) 90 mmHg).
Health status and quality of life Obesity/Diet/Physicalactivity & Relatedhealth issues
Percentage of adults with raised total cholesterol (i.e. . 5.2 mmol/l).
KCE Report 196 S3
Total
perceived health : Proportion of people reporting their health is good 9
Health expectancy : Healthy Life Years 9
7
6
5
esteem following Roesenberg scale 2
2
Long term activity limitations: Proportion of people reporting that theyterm restrictions in daily activities.
2
rate 1
% of people perceiving their mental health as excellent, good, medium or 1
among students 0
Rate of suicide ideation among students 0
based percentage of overweight or obese adults, children and 7
Obesity rates (% of people with a BMI >=30); 6
2
adults with raised blood pressure (BP) (i.e., systolic (SBP). 140 and/or diastolic (DBP) 90 mmHg).
1
total cholesterol (i.e. . 5.2 mmol/l). 1
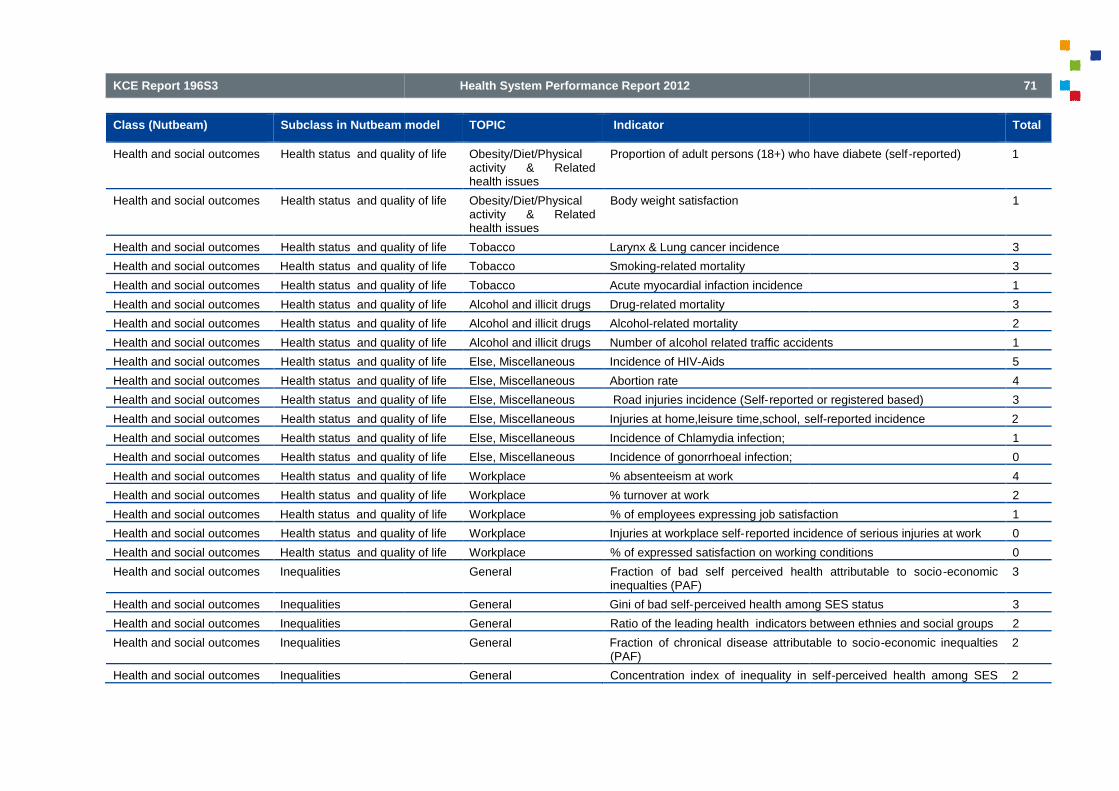
KCE Report 196S3
Class (Nutbeam) Subclass in Nutbeam model
Health and social outcomes Health status and quality of life
Health and social outcomes Health status and quality of life
Health and social outcomes Health status and quality of life
Health and social outcomes Health status and quality of life
Health and social outcomes Health status and quality of life
Health and social outcomes Health status and quality of life
Health and social outcomes Health status and quality of life
Health and social outcomes Health status and quality of life
Health and social outcomes Health status and quality of life
Health and social outcomes Health status and quality of life
Health and social outcomes Health status and quality of life
Health and social outcomes Health status and quality of life
Health and social outcomes Health status and quality of life
Health and social outcomes Health status and quality of life
Health and social outcomes Health status and quality of life
Health and social outcomes Health status and quality of life
Health and social outcomes Health status and quality of life
Health and social outcomes Health status and quality of life
Health and social outcomes Health status and quality of life
Health and social outcomes Inequalities
Health and social outcomes Inequalities
Health and social outcomes Inequalities
Health and social outcomes Inequalities
Health and social outcomes Inequalities
Health System Performance Report 2012
Subclass in Nutbeam model TOPIC Indicator
Health status and quality of life Obesity/Diet/Physicalactivity & Relatedhealth issues
Proportion of adult persons (18+) who have diabete (self
Health status and quality of life Obesity/Diet/Physicalactivity & Relatedhealth issues
Body weight satisfaction
Health status and quality of life Tobacco Larynx & Lung cancer incidence
status and quality of life Tobacco Smoking-related mortality
Health status and quality of life Tobacco Acute myocardial infaction incidence
Health status and quality of life Alcohol and illicit drugs Drug-related mortality
Health status and quality of life Alcohol and illicit drugs Alcohol-related mortality
Health status and quality of life Alcohol and illicit drugs Number of alcohol related traffic accidents
Health status and quality of life Else, Miscellaneous Incidence of HIV-Aids
Health status and quality of life Else, Miscellaneous Abortion rate
Health status and quality of life Else, Miscellaneous Road injuries incidence (Self-reported or registered based)
Health status and quality of life Else, Miscellaneous Injuries at home,leisure time,school, self
Health status and quality of life Else, Miscellaneous Incidence of Chlamydia infection;
Health status and quality of life Else, Miscellaneous Incidence of gonorrhoeal infection;
Health status and quality of life Workplace % absenteeism at work
Health status and quality of life Workplace % turnover at work
quality of life Workplace % of employees expressing job satisfaction
Health status and quality of life Workplace Injuries at workplace self-reported incidence of serious injuries at work
status and quality of life Workplace % of expressed satisfaction on working conditions
General Fraction of bad self perceived health attributable to socioinequalties (PAF)
General Gini of bad self-perceived health among SES status
General Ratio of the leading health indicators between ethnies and social groups
General Fraction of chronical disease attributable to socio(PAF)
General Concentration index of inequality in self
71
Total
Proportion of adult persons (18+) who have diabete (self-reported) 1
1
3
3
1
3
2
lcohol related traffic accidents 1
5
4
reported or registered based) 3
self-reported incidence 2
1
0
4
2
% of employees expressing job satisfaction 1
reported incidence of serious injuries at work 0
% of expressed satisfaction on working conditions 0
Fraction of bad self perceived health attributable to socio-economic 3
perceived health among SES status 3
Ratio of the leading health indicators between ethnies and social groups 2
of chronical disease attributable to socio-economic inequalties 2
Concentration index of inequality in self-perceived health among SES 2

72
Class (Nutbeam) Subclass in Nutbeam model
Health and social outcomes Inequalities
Health and social outcomes Inequalities
Health and social outcomes Inequalities
Intermediate healthoutcomes
Healthy lifestyle
Intermediate healthoutcomes
Healthy lifestyle
Intermediate healthoutcomes
Healthy lifestyle
Intermediate healthoutcomes
Healthy lifestyle
Intermediate healthoutcomes
Healthy lifestyle
Intermediate healthoutcomes
Healthy lifestyle
Intermediate healthoutcomes
Healthy lifestyle
Intermediate healthoutcomes
Healthy lifestyle
Intermediate healthoutcomes
Healthy lifestyle
Intermediate health Healthy lifestyle
Health System Performance Report 2012
Subclass in Nutbeam model TOPIC Indicator
status
General Inequality in incomes (for instance GINI, quintile ratio of incomes))
General Gini of the prevalence chronical disease among SES status
General Odd ratio of Bad Self perceived health between higher and lower SESstatus
Obesity/Diet/Physicalactivity & Relatedhealth issues
Percentage of population eating fewer than 5 servings of fruit andvegetables per day, or proportion of adults eating less than 400 g of fruitand vegetables per day.
Obesity/Diet/Physicalactivity & Relatedhealth issues
% of people practising at least 30 minutes of PA per day
Obesity/Diet/Physicalactivity & Relatedhealth issues
% of sedentary people
Obesity/Diet/Physicalactivity & Relatedhealth issues
% of adults reporting to eat fruits at least o
Obesity/Diet/Physicalactivity & Relatedhealth issues
% of adults reporting to eat vegetables at least once a day
Obesity/Diet/Physicalactivity & Relatedhealth issues
% of children achieving 30 minutes of sportive activity in afterschoolprogram
Obesity/Diet/Physicalactivity & Relatedhealth issues
Percentage of children participating in at leastactivity per day.
Obesity/Diet/Physicalactivity & Relatedhealth issues
% engaged in leisure-time physical activity;
Obesity/Diet/Physicalactivity & Relatedhealth issues
Percentage of population with dietary fat intake > 30 % of total energydaily consumed
Obesity/Diet/Physical Percentage of children exclusively breastfed for 6 months.
KCE Report 196 S3
Total
Inequality in incomes (for instance GINI, quintile ratio of incomes)) 2
Gini of the prevalence chronical disease among SES status 1
perceived health between higher and lower SES 1
Percentage of population eating fewer than 5 servings of fruit andon of adults eating less than 400 g of fruit
5
% of people practising at least 30 minutes of PA per day 4
3
% of adults reporting to eat fruits at least once a day 2
% of adults reporting to eat vegetables at least once a day 2
% of children achieving 30 minutes of sportive activity in afterschool 2
Percentage of children participating in at least 60 minutes of physical 2
time physical activity; 1
Percentage of population with dietary fat intake > 30 % of total energy 1
e of children exclusively breastfed for 6 months. 1

KCE Report 196S3
Class (Nutbeam) Subclass in Nutbeam model
outcomes
Intermediate healthoutcomes
Healthy lifestyle
Intermediate healthoutcomes
Healthy lifestyle
Intermediate healthoutcomes
Healthy lifestyle
Intermediate healthoutcomes
Healthy lifestyle
Intermediate healthoutcomes
healthy lifestyle
Intermediate healthoutcomes
Healthy lifestyle
Intermediate healthoutcomes
Healthy lifestyle
Intermediate healthoutcomes
Healthy lifestyle
Intermediate healthoutcomes
Healthy lifestyle
Intermediate healthoutcomes
Healthy lifestyle
Intermediate healthoutcomes
Healthy lifestyle
Intermediate healthoutcomes
Healthy lifestyle
Intermediate healthoutcomes
Effective health services
Intermediate healthoutcomes
Effective health services
Health System Performance Report 2012
Subclass in Nutbeam model TOPIC Indicator
activity & Relatedhealth issues
Obesity/Diet/Physicalactivity & Relatedhealth issues
Percentage of adults with low level of physical activity (<600 Metabolocequivalent per week)
Obesity/Diet/Physicalactivity & Relatedhealth issues
% of people who meet the recommendations about the consumption ofsalt
Obesity/Diet/Physicalactivity & Relatedhealth issues
% of people practicing more than 4 hours PA per week
Tobacco % of the population > 15 years that smokes on a daily basis
Tobacco Prevalence and incidence of smokers in adolescents
Tobacco Percentage of smoke-free adults
Tobacco Percentage of smoke-free adolescents
Alcohol and illicit drugs % of the population >=15 years who are problematic drinkers (>14 glassper weeks for women and >21 for men)
Alcohol and illicit drugs % of people who drink and drive
Alcohol and illicit drugs Percentage of people reporting to have used illicit drugs during the pastyear (last year prevalence).
Alcohol and illicit drugs Alcohol consumption among individuals aged 15+, expressed in litres ofpure ethanol consumed per person per year.
Else, Miscellaneous score of global behaviour risk profile (see
Effective health services General % of healthy lifestyle advice in high-risk patients in primary care
Effective health services Obesity/Diet/Physicalactivity & Relatedhealth issues
Percentage of the population offered advice on a healthy diet by primarycare team.
73
Total
Percentage of adults with low level of physical activity (<600 Metaboloc 1
% of people who meet the recommendations about the consumption of 0
% of people practicing more than 4 hours PA per week 0
% of the population > 15 years that smokes on a daily basis 6
Prevalence and incidence of smokers in adolescents 2
2
free adolescents 2
% of the population >=15 years who are problematic drinkers (>14 glassper weeks for women and >21 for men)
10
2
Percentage of people reporting to have used illicit drugs during the past 1
Alcohol consumption among individuals aged 15+, expressed in litres ofpure ethanol consumed per person per year.
1
score of global behaviour risk profile (see details in référence) 0
risk patients in primary care 3
Percentage of the population offered advice on a healthy diet by primary 0

74
Class (Nutbeam) Subclass in Nutbeam model
Intermediate healthoutcomes
Effective health services
Intermediate healthoutcomes
Effective health services
Intermediate healthoutcomes
Healthy environment
Intermediate healthoutcomes
Healthy environment
Intermediate healthoutcomes
Healthy environment
Intermediate healthoutcomes
Healthy environment
Intermediate healthoutcomes
Healthy environment
Intermediate healthoutcomes
Healthy environment
Intermediate healthoutcomes
Healthy environment
Intermediate healthoutcomes
Healthy environment
Intermediate healthoutcomes
Healthy environment
Intermediate healthoutcomes
Healthy environment
Intermediate healthoutcomes
Healthy environment
Health System Performance Report 2012
Subclass in Nutbeam model TOPIC Indicator
Effective health services Hospitals % of hospitals offering counselling/consultation on healthy lifestyle
Effective health services Hospitals % of hospitals offering information on healthy lifestyle
Obesity/Diet/Physicalactivity & Relatedhealth issues
Kilometres of bicycle paths per squarekilometres) by urban versus rural.
Obesity/Diet/Physicalactivity & Relatedhealth issues
Number of fast food restaurants per capita
Obesity/Diet/Physicalactivity & Relatedhealth issues
availability of physical activity facilities to community members (%, hoursopen, cost)
Obesity/Diet/Physicalactivity & Relatedhealth issues
presence of healthy menus in restaurants
Obesity/Diet/Physicalactivity & Relatedhealth issues
Percentage of food manufacturers providing full nutrition labelling.
Obesity/Diet/Physicalactivity & Relatedhealth issues
Kms of walking trails per capita
Obesity/Diet/Physicalactivity & Relatedhealth issues
Kms of bike lanes per capita
Obesity/Diet/Physicalactivity & Relatedhealth issues
% of restaurants in companies offering healthy food options on menu
Schools presence of healthy foods in vending machines in schools
Schools Total school hours allocated to physical activity at primary and secondarylevel.
Schools Percentage of schools restricting the availability of high fat, salt, sugarproducts in vending machines.
KCE Report 196 S3
Total
% of hospitals offering counselling/consultation on healthy lifestyle 1
% of hospitals offering information on healthy lifestyle 0
Kilometres of bicycle paths per square kilometre (or per 100 square 3
Number of fast food restaurants per capita 2
availability of physical activity facilities to community members (%, hours 0
presence of healthy menus in restaurants 0
Percentage of food manufacturers providing full nutrition labelling. 0
0
0
% of restaurants in companies offering healthy food options on menu 0
ods in vending machines in schools 4
Total school hours allocated to physical activity at primary and secondary 4
schools restricting the availability of high fat, salt, sugar 4

KCE Report 196S3
Class (Nutbeam) Subclass in Nutbeam model
Intermediate healthoutcomes
Healthy environment
Intermediate healthoutcomes
Healthy environment
Intermediate healthoutcomes
Healthy environment
Intermediate healthoutcomes
Healthy environment
Intermediate healthoutcomes
Healthy environment
Intermediate healthoutcomes
Healthy environment
Intermediate healthoutcomes
Healthy environment
Intermediate healthoutcomes
Healthy environment
Intermediate healthoutcomes
Healthy environment
Intermediate healthoutcomes
Healthy environment
Intermediate healthoutcomes
Healthy environment
Intermediate healthoutcomes
Healthy environment
Intermediate healthoutcomes
Healthy environment
Intermediate healthoutcomes
Healthy environment
Intermediate healthoutcomes
Healthy environment
Intermediate healthoutcomes
Healthy environment
Health promotion outcomes Health literacy
Health System Performance Report 2012
Subclass in Nutbeam model TOPIC Indicator
Schools % of schools having obtained the label of healthy attitudes"Mangerbouger" of the French Speaking Commu
Schools % of children educated in a health promoting school
Schools % of schools having consulted a dietician to optimize the nutritionalpractices inside the school
Schools presence of healthy menus in schools
Schools % of schools offering soup or vegetables at least 4 times a week
Schools % of schools with a fast-food restaurant
Schools % of schools offering/vending soda's with the meal
Schools % of secondary schools offering effective schoolsprogramme
Schools Percentage of schools offering school meals consistent to dietaryguidelines.
Workplace % of population working in enterprises offering specific worksites healthpromotion programmes
Workplace Percentage of workplaces serving mealsguidelines.
Workplace % of large companies having implemented health promotionprogrammes (tobacco/alcohol/physical activity)
Workplace Percentage of workplaces with showers and changing
Workplace Percentage of workplaces offering physical activity programmes foremployees.
Hospitals % patients educated for self management
Hospitals % patients assessed for risk factors
General % of people reporting to be able to interpret and evaluate easily
75
Total
% of schools having obtained the label of healthy attitudes"Mangerbouger" of the French Speaking Community;
2
% of children educated in a health promoting school 2
% of schools having consulted a dietician to optimize the nutritional 1
presence of healthy menus in schools 1
% of schools offering soup or vegetables at least 4 times a week 0
food restaurant 0
% of schools offering/vending soda's with the meal 0
% of secondary schools offering effective schools-based prevention 0
Percentage of schools offering school meals consistent to dietary 0
% of population working in enterprises offering specific worksites health 3
Percentage of workplaces serving meals consistent with national dietary 2
% of large companies having implemented health promotionprogrammes (tobacco/alcohol/physical activity)
0
Percentage of workplaces with showers and changing-room facilities. 0
Percentage of workplaces offering physical activity programmes for 0
% patients educated for self management 3
2
% of people reporting to be able to interpret and evaluate easily 4

76
Class (Nutbeam) Subclass in Nutbeam model
Health promotion outcomes Health literacy
Health promotion outcomes Health literacy
Health promotion outcomes Health literacy
Health promotion outcomes Health literacy
Health promotion outcomes Health literacy
Health promotion outcomes Health literacy
Health promotion outcomes Health literacy
Health promotion outcomes Health literacy
Health promotion outcomes Health literacy
Health promotion outcomes Health literacy
Health promotion outcomes Health literacy
Health promotion outcomes Health literacy
Health promotion outcomes Health literacy
Health promotion outcomes Health literacy
Health promotion outcomes Health literacy
Health promotion outcomes Social influence and actions
Health System Performance Report 2012
Subclass in Nutbeam model TOPIC Indicator
information on medical issues and treatment
General % of people reporting be able to take decisions on risk factor for health
General % of people facing challenges in understanding basic instruction fromtheir physician
General % of people reporting to find easily information on medical isues andtreatment
General % of people reporting be able to take decisions onon determinants ofhealth in the social and physical environment
General % of people reporting tounderstand easand treatment
General % of people reporting be able to take decisions on medical issues andtreatment
General % of people reporting tounderstand easily information on risk factors forhealth
General % of people reporting to be able to interpret and evaluate easilyinformation on risk factor for health
General % of people reporting tounderstand easily information on determinants ofhealth in the social and physical environment
General % of people reporting to be able to interpret and evaluate easilyinformation on determinants of health in the social and physicalenvironment
General % of people reporting to find easily information on risk factors for health
General % of people reporting to find easily information on determinants of healthin the social and physical environment
Obesity/Diet/Physicalactivity & Relatedhealth issues
perception, understanding , knowledge regarding physical activity anddiet recommendations, and food offer
Obesity/Diet/Physicalactivity & Relatedhealth issues
score of attitudes concerning physical activity
Else, Miscellaneous trends in the number of new breast cancer diagnosis per month inrelation with the moment of the campaign
Social influence and actions General Social support measured with the OSS3 scale
KCE Report 196 S3
Total
information on medical issues and treatment
% of people reporting be able to take decisions on risk factor for health 4
% of people facing challenges in understanding basic instruction from 3
% of people reporting to find easily information on medical isues and 2
% of people reporting be able to take decisions onon determinants ofhealth in the social and physical environment
2
% of people reporting tounderstand easily information on medical isues 1
% of people reporting be able to take decisions on medical issues and 1
tounderstand easily information on risk factors for 1
% of people reporting to be able to interpret and evaluate easily 1
% of people reporting tounderstand easily information on determinants ofhealth in the social and physical environment
1
% of people reporting to be able to interpret and evaluate easilynformation on determinants of health in the social and physical
1
% of people reporting to find easily information on risk factors for health 0
% of people reporting to find easily information on determinants of healthin the social and physical environment
0
edge regarding physical activity anddiet recommendations, and food offer
2
score of attitudes concerning physical activity 0
trends in the number of new breast cancer diagnosis per month inrelation with the moment of the campaign
0
Social support measured with the OSS3 scale 4

KCE Report 196S3
Class (Nutbeam) Subclass in Nutbeam model
Health promotion outcomes Social influence and actions
Health promotion outcomes Social influence and actions
Health promotion outcomes Social influence and actions
Health promotion outcomes Social influence and actions
Health promotion outcomes Social influence and actions
Health promotion outcomes Social influence and actions
Health promotion outcomes Social influence and actions
Health promotion outcomes Social influence and actions
Health promotion outcomes Social influence and actions
Health promotion outcomes Social influence and actions
Health promotion outcomes Social influence and actions
Health promotion outcomes Social influence and actions
Health promotion outcomes Social influence and actions
Health promotion outcomes Social influence and actions
Health promotion outcomes Social influence and actions
Health promotion outcomes Social influence and actions
Health promotion outcomes Social influence and actions
Health promotion outcomes Social influence and actions
Health promotion outcomes Social influence and actions
Health promotion outcomes Social influence and actions
Health promotion outcomes Social influence and actions
Health System Performance Report 2012
Subclass in Nutbeam model TOPIC Indicator
Social influence and actions General Rate of young people leaving schools without a diploma
Social influence and actions General % of people >=65 years who socialize with friends or neighbours in thepast week
Social influence and actions General Long term unemployment rate
Social influence and actions General self-reported level of belonging to the local community
Social influence and actions General The community is welcoming and supportive to the whole diversity of thecommunity
Social influence and actions General People participate actively in the social, political and economic lifecommunity
Social influence and actions General People from all parts of the community are involved in communityactivities
Social influence and actions General Access to high level responsibility to women with children
Social influence and actions General Success rate at school in children from low socio
Social influence and actions General Residents have positive perceptions of their community
Social influence and actions General % of people >=65 years who attended movies, sport event, clubs in thepast week
Social influence and actions General Proportion of homeless people in the population
Social influence and actions General Existence of religious or ethnical ghettos
Social influence and actions General Proportion of over-indebted households
Social influence and actions General Participation rate to the elections
Social influence and actions General Proportion of disable people working in the public/private sectors
Social influence and actions General Proportion of elderly people living in the family
Social influence and actions General score of traditional social cohesion, based on 1, shared common values(measured by the rate of participation to the main catholic rituals) 2,absence of property crime (theft) 3, social capital (measured by the rateof socio-cultural associations, rate
Social influence and actions General score of modern social cohesion, based on 1, absence of deprivation(measured by rate of unemployment, rate of long term unemployment,percentage of population on welfare benefits, percentage of births inunderprivileged families)/2, absence of violent cr
Social influence and actions Hospitals % of hospitals who cooperate with patients organisations
Social influence and actions Hospitals % of hospitals who practice patient satisfaction studies
77
Total
Rate of young people leaving schools without a diploma 4
% of people >=65 years who socialize with friends or neighbours in the 3
3
reported level of belonging to the local community 2
The community is welcoming and supportive to the whole diversity of the 1
People participate actively in the social, political and economic life of the 1
People from all parts of the community are involved in community 1
responsibility to women with children 1
Success rate at school in children from low socio-economic class 1
ve perceptions of their community 0
% of people >=65 years who attended movies, sport event, clubs in the 0
of homeless people in the population 0
Existence of religious or ethnical ghettos 0
indebted households 0
0
Proportion of disable people working in the public/private sectors 0
Proportion of elderly people living in the family 0
score of traditional social cohesion, based on 1, shared common valuesf participation to the main catholic rituals) 2,
absence of property crime (theft) 3, social capital (measured by the rate
0
ion, based on 1, absence of deprivation(measured by rate of unemployment, rate of long term unemployment,percentage of population on welfare benefits, percentage of births inunderprivileged families)/2, absence of violent cr
0
% of hospitals who cooperate with patients organisations 3
% of hospitals who practice patient satisfaction studies 1

78
Class (Nutbeam) Subclass in Nutbeam model
Health promotion outcomes Healthy public policies andorganisational practice
Health promotion outcomes Healthy public policies andorganisational practice
Health promotion outcomes Healthy public policies andorganisational practice
Health promotion outcomes Healthy public policies andorganisational practice
Health promotion outcomes Healthy public policies andorganisational practice
Health promotion outcomes Healthy public policies andorganisational practice
Health promotion outcomes Healthy public policies andorganisational practice
Health promotion outcomes Healthy public policies andorganisational practice
Health promotion outcomes Healthy public policies andorganisational practice
Health promotion outcomes Healthy public policies andorganisational practice
Health promotion outcomes Healthy public policies andorganisational practice insettings (schools, worksites)
Health promotion outcomes Healthy public policies andorganisational practice insettings (schools, worksites)
Health promotion outcomes Healthy public policies andorganisational practice
Health System Performance Report 2012
Subclass in Nutbeam model TOPIC Indicator
hy public policies and General Net expenditure on health promotion and prevention per inhabitant
Healthy public policies and General % of the public « Health expenditureshealth services
Healthy public policies and General % of municipalities where the health promotion is integrated in thebroader scope of social policy and inpeople, old people, school, etc) and in a long term agenda
Healthy public policies and General % of municipalities with a workgroup on health promotion where citizensare represented
Healthy public policies and General % of municipalities with an employee explicitly in charge of thecoordination of health promotion
Healthy public policies and General Existence of intersectorial action between at least 2 sectors who develope coordinated policy in response to a common priority
Healthy public policies and General % of municipalities developing expertise on health promotion in their staff
Healthy public policies and Obesity/Diet/Physicalactivity & Relatedhealth issues
Existence of a clear national programme or campaigneducation and public awareness.
Healthy public policies and Obesity/Diet/Physicalactivity & Relatedhealth issues
Percentage of the population or specific target population reached withthe healthy diet and physical activity communication campaigns ormessages
Healthy public policies and Obesity/Diet/Physicalactivity & Relatedhealth issues
Composite index measuring the strength of healtin municipalities; components of the index are offer of healthyfood/information/regulation/participation/networking/budget
Healthy public policies andorganisational practice in
worksites)
Obesity/Diet/Physicalactivity & Relatedhealth issues
Existence of a policy that affects the cost of healthier foods andbeverages (as defined by the Insitute of Medicine(IOM)) relative to thecost of less healthy foods and beverages sold in vaschools, local government facilities)
Healthy public policies andorganisational practice insettings (schools, worksites)
Obesity/Diet/Physicalactivity & Relatedhealth issues
% of companies with policies for healthy food and exercise
Healthy public policies and Obesity/Diet/Physicalactivity & Relatedhealth issues
National action plan on diet and physical activity published
KCE Report 196 S3
Total
Net expenditure on health promotion and prevention per inhabitant 8
Health expenditures » allocated to prevention or public 6
% of municipalities where the health promotion is integrated in thebroader scope of social policy and in different sub matters (youngpeople, old people, school, etc) and in a long term agenda
4
% of municipalities with a workgroup on health promotion where citizens 3
% of municipalities with an employee explicitly in charge of the 2
Existence of intersectorial action between at least 2 sectors who develope coordinated policy in response to a common priority
0
nicipalities developing expertise on health promotion in their staff 0
Existence of a clear national programme or campaign for physical 2
Percentage of the population or specific target population reached withe healthy diet and physical activity communication campaigns or
2
Composite index measuring the strength of healthy diet promoting policyin municipalities; components of the index are offer of healthyfood/information/regulation/participation/networking/budget
2
Existence of a policy that affects the cost of healthier foods andbeverages (as defined by the Insitute of Medicine(IOM)) relative to thecost of less healthy foods and beverages sold in various settings (eg
2
for healthy food and exercise 1
National action plan on diet and physical activity published 1
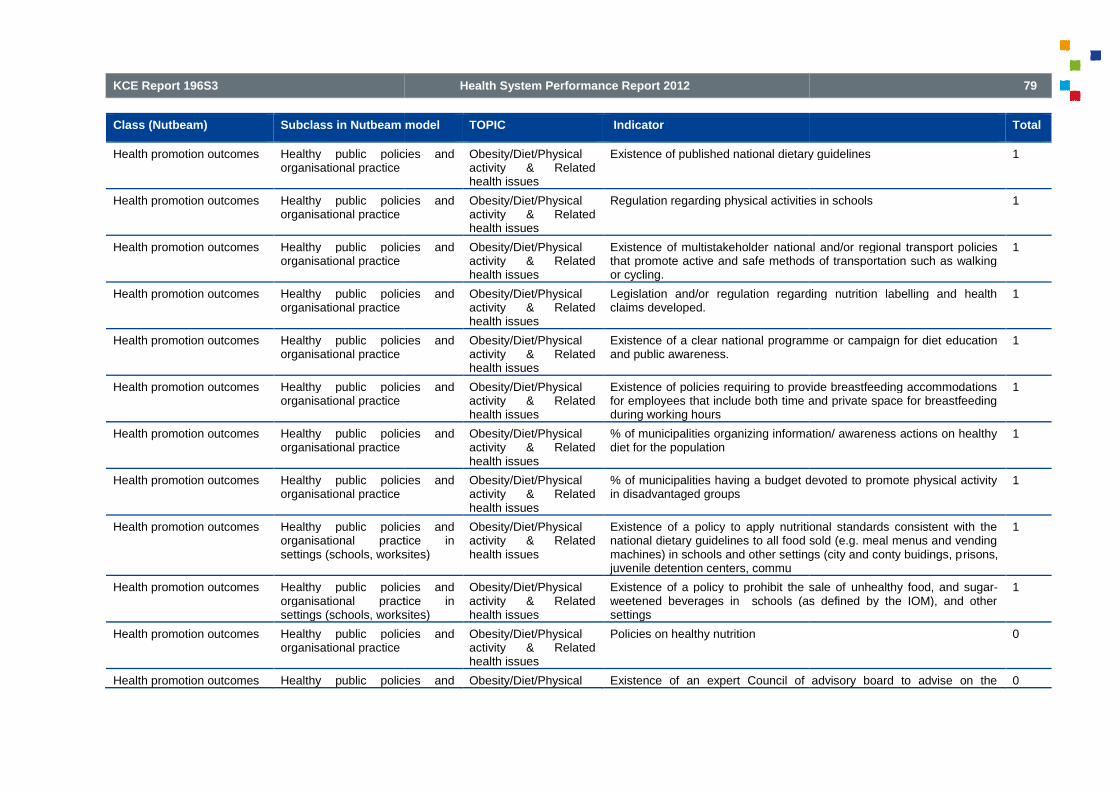
KCE Report 196S3
Class (Nutbeam) Subclass in Nutbeam model
Health promotion outcomes Healthy public policies andorganisational practice
Health promotion outcomes Healthy public policies andorganisational practice
Health promotion outcomes Healthy public policies andorganisational practice
Health promotion outcomes Healthy public policies andorganisational practice
Health promotion outcomes Healthy public policies andorganisational practice
Health promotion outcomes Healthy public policies andorganisational practice
Health promotion outcomes Healthy public policies andorganisational practice
Health promotion outcomes Healthy public policies andorganisational practice
Health promotion outcomes Healthy public policies andorganisational practice insettings (schools, worksites)
Health promotion outcomes Healthy public policies andorganisational practice insettings (schools, worksites)
Health promotion outcomes Healthy public policies andorganisational practice
Health promotion outcomes Healthy public policies and
Health System Performance Report 2012
Subclass in Nutbeam model TOPIC Indicator
Healthy public policies and Obesity/Diet/Physicalactivity & Relatedhealth issues
Existence of published national dietary guidelines
Healthy public policies and Obesity/Diet/Physicalactivity & Relatedhealth issues
Regulation regarding physical activities in schools
Healthy public policies and Obesity/Diet/Physicalactivity & Relatedhealth issues
Existence of multistakeholder national and/or regional transport policiesthat promote active and safe methods of transportation such as walkingor cycling.
Healthy public policies and Obesity/Diet/Physicalactivity & Relatedhealth issues
Legislation and/or regulation regarding nutrition labelling and healthclaims developed.
Healthy public policies and Obesity/Diet/Physicalactivity & Relatedhealth issues
Existence of a clear national programme or campaign for diet educationand public awareness.
Healthy public policies and Obesity/Diet/Physicalactivity & Relatedhealth issues
Existence of policies requiring to provide breastfeeding accommodationsfor employees that include both time and private space for breastfeedingduring working hours
Healthy public policies and Obesity/Diet/Physicalactivity & Relatedhealth issues
% of municipalities organizing information/ awareness actions on healthydiet for the population
Healthy public policies and Obesity/Diet/Physicalactivity & Relatedhealth issues
% of municipalities having a budget devoted to promote physical activityin disadvantaged groups
Healthy public policies andorganisational practice insettings (schools, worksites)
Obesity/Diet/Physicalactivity & Relatedhealth issues
Existence of a policy to apply nutritional standards consistent with thenational dietary guidelines to all food sold (e.g. meal menus and vendingmachines) in schools and other settings (city and conty buidings, pjuvenile detention centers, commu
Healthy public policies andorganisational practice insettings (schools, worksites)
Obesity/Diet/Physicalactivity & Relatedhealth issues
Existence of a policy to prohibit the sale ofweetened beverages in schools (as defined by the IOM), and othersettings
Healthy public policies and Obesity/Diet/Physicalactivity & Relatedhealth issues
Policies on healthy nutrition
Healthy public policies and Obesity/Diet/Physical Existence of an expert Council of advisory board to advise on the
79
Total
Existence of published national dietary guidelines 1
Regulation regarding physical activities in schools 1
national and/or regional transport policiesthat promote active and safe methods of transportation such as walking
1
Legislation and/or regulation regarding nutrition labelling and health 1
ional programme or campaign for diet education 1
Existence of policies requiring to provide breastfeeding accommodationsfor employees that include both time and private space for breastfeeding
1
% of municipalities organizing information/ awareness actions on healthy 1
% of municipalities having a budget devoted to promote physical activity 1
Existence of a policy to apply nutritional standards consistent with thenational dietary guidelines to all food sold (e.g. meal menus and vendingmachines) in schools and other settings (city and conty buidings, prisons,
1
Existence of a policy to prohibit the sale of unhealthy food, and sugar-weetened beverages in schools (as defined by the IOM), and other
1
0
Existence of an expert Council of advisory board to advise on the 0

80
Class (Nutbeam) Subclass in Nutbeam model
organisational practice
Health promotion outcomes Healthy public policies andorganisational practice
Health promotion outcomes Healthy public policiesorganisational practice
Health promotion outcomes Healthy public policies andorganisational practice
Health promotion outcomes Healthy public policies andorganisational practice
Health promotion outcomes Healthy public policies andorganisational practice
Health promotion outcomes Healthy public policies andorganisational practice
Health promotion outcomes Healthy public policies andorganisational practice
Health promotion outcomes Healthy public policies andorganisational practice
Health promotion outcomes Healthy public policies andorganisational practice
Health promotion outcomes Healthy public policies andorganisational practice
Health promotion outcomes Healthy public policies andorganisational practice
Health System Performance Report 2012
Subclass in Nutbeam model TOPIC Indicator
activity & Relatedhealth issues
development of the strategy
Healthy public policies and Obesity/Diet/Physicalactivity & Relatedhealth issues
Existence of legislation to support availability and access to healthy food.
Healthy public policies and Obesity/Diet/Physicalactivity & Relatedhealth issues
Existence of national coordinating mechanism (an organization,committee or other body) to oversee, develop and implement thenutritionnal and physical activity policy or
Healthy public policies and Obesity/Diet/Physicalactivity & Relatedhealth issues
Existence of published national physical activity guidelines.
policies and Obesity/Diet/Physicalactivity & Relatedhealth issues
Existence of clear and sustainable national and/or subfor action on diet and nutrition.
Healthy public policies and Obesity/Diet/Physicalactivity & Relatedhealth issues
Existence of national or regional guidance for the development of urbanplans that promote physical activity.
Healthy public policies and Obesity/Diet/Physicalactivity & Relatedhealth issues
Existence of a regulatory framework and/or selflimit the marketing of food and non-alcoholic beverages to children.
policies and Obesity/Diet/Physicalactivity & Relatedhealth issues
Existence of local or municipal food subsidies and food pricing strategiesthat are consistent with national dietary guidelines.
y public policies and Obesity/Diet/Physicalactivity & Relatedhealth issues
Percent of counties or municipalities with policies that promote recreationfacilities (e.g. bikeways, parks, fields, gyms, pools, tennic courts, andplaygrounds) in new and redeveloped residentail and mixedcommunities
Healthy public policies and Obesity/Diet/Physicalactivity & Relatedhealth issues
Nutritional labeling requirements at restaurants,
Healthy public policies and Obesity/Diet/Physicalactivity & Relatedhealth issues
% of municipalities organizing information/ awareness actions on healthydiet for their employees
Healthy public policies and Obesity/Diet/Physicalactivity & Related
% of municipalities implementing policies aiming to increase theconsumption of healthy food and drinks for the population
KCE Report 196 S3
Total
Existence of legislation to support availability and access to healthy food. 0
Existence of national coordinating mechanism (an organization,committee or other body) to oversee, develop and implement thenutritionnal and physical activity policy or strategy.
0
Existence of published national physical activity guidelines. 0
Existence of clear and sustainable national and/or sub-national budget 0
Existence of national or regional guidance for the development of urban 0
Existence of a regulatory framework and/or self-regulatory mechanism toalcoholic beverages to children.
0
Existence of local or municipal food subsidies and food pricing strategiesthat are consistent with national dietary guidelines.
0
Percent of counties or municipalities with policies that promote recreationfacilities (e.g. bikeways, parks, fields, gyms, pools, tennic courts, and
rounds) in new and redeveloped residentail and mixed-use
0
Nutritional labeling requirements at restaurants, stores, snack bars 0
% of municipalities organizing information/ awareness actions on healthy 0
% of municipalities implementing policies aiming to increase theconsumption of healthy food and drinks for the population
0

KCE Report 196S3
Class (Nutbeam) Subclass in Nutbeam model
Health promotion outcomes Healthy public policies andorganisational practice
Health promotion outcomes Healthy public policies andorganisational practice
Health promotion outcomes Healthy public policies andorganisational practice
Health promotion outcomes Healthy public policies andorganisational practice
Health promotion outcomes Healthy public policies andorganisational practice
Health promotion outcomes Healthy public policies andorganisational practice
Health promotion outcomes Healthy public policies andorganisational practice
Health promotion outcomes Healthy public policies andorganisational practice
Health promotion outcomes Healthy public policies andorganisational practice
Health promotion outcomes Healthy public policies andorganisational practice
Health promotion outcomes Healthy public policies andorganisational practice
Health promotion outcomes Healthy public policies andorganisational practice
Health promotion outcomes Healthy public policies andorganisational practice
Health promotion outcomes Healthy public policies andorganisational practice
Health promotion outcomes Healthy public policies and
Health System Performance Report 2012
Subclass in Nutbeam model TOPIC Indicator
health issues
Healthy public policies and Obesity/Diet/Physicalactivity & Relatedhealth issues
% of municipalities implementing policies aiming to increase theconsumption of healthy food and drinks for their
Healthy public policies and Obesity/Diet/Physicalactivity & Relatedhealth issues
% of municipalities organizing information/awareness actions on physicalactivity for the population
Healthy public policies and Obesity/Diet/Physicalactivity & Relatedhealth issues
% of municipalities organizing information/awareness actions on physicalactivity for their employees
Healthy public policies and Tobacco Composite index summarizing regulations implemented by health (andother) authorities on smoking restrictions in specific areas
Healthy public policies and Tobacco Composite index measuring the strength of tobacco prevention policy inmunicipalities; components of the index areinformation/regulation/intervention/participation/networking/budget
ic policies and Tobacco Intensity of the smoke free environments legislation
Healthy public policies and Tobacco % of taxes in the retail price of tobacco products
Healthy public policies and Tobacco Clean air laws in public buildings, restaurants, worksites, etccc
Healthy public policies and Tobacco Tobacco vending machine regulations in communities
Healthy public policies and Tobacco Enforcement of ordinances prohibiting tobacco sales to minors
Healthy public policies and Tobacco Intensity of the monitoring of smoking prevalence
Healthy public policies and Tobacco Level of the offer of treatment for tobacco dependance
c policies and Tobacco Level of the obligation of warning about the dangers of tobacco on thepacks
Healthy public policies and Tobacco Level of the anti-smoking mass media
Healthy public policies and Tobacco Level of the bans on tobacco advertising and promoting
81
Total
% of municipalities implementing policies aiming to increase theconsumption of healthy food and drinks for their employees
0
% of municipalities organizing information/awareness actions on physical 0
% of municipalities organizing information/awareness actions on physical 0
Composite index summarizing regulations implemented by health (andother) authorities on smoking restrictions in specific areas
5
Composite index measuring the strength of tobacco prevention policy inmunicipalities; components of the index areinformation/regulation/intervention/participation/networking/budget
3
Intensity of the smoke free environments legislation 2
% of taxes in the retail price of tobacco products 1
Clean air laws in public buildings, restaurants, worksites, etccc 0
e regulations in communities 0
Enforcement of ordinances prohibiting tobacco sales to minors 0
Intensity of the monitoring of smoking prevalence 0
Level of the offer of treatment for tobacco dependance 0
Level of the obligation of warning about the dangers of tobacco on the 0
smoking mass media campaign 0
Level of the bans on tobacco advertising and promoting 0

82
Class (Nutbeam) Subclass in Nutbeam model
organisational practice
Health promotion outcomes Healthy public policies andorganisational practice
Health promotion outcomes Healthy public policies andorganisational practice
Health promotion outcomes Healthy public policies andorganisational practice
Health promotion outcomes Healthy public policies andorganisational practice
Health promotion outcomes Healthy public policies andorganisational practice
Health promotion outcomes Healthy public policies andorganisational practice
Health promotion outcomes Healthy public policies andorganisational practice
Health promotion outcomes Healthy public policieorganisational practice
Health promotion outcomes Healthy public policies andorganisational practice
Health promotion outcomes Healthy public policies andorganisational practice
Health promotion outcomes Healthy public policies andorganisational practice
Health promotion outcomes Healthy public policies andorganisational practice
Health promotion outcomes Healthy public policies andorganisational practice
Health promotion outcomes Healthy public policies andorganisational practice
Health System Performance Report 2012
Subclass in Nutbeam model TOPIC Indicator
Healthy public policies and Tobacco % of municipalities who conducted awareness action for the populationlast year
Healthy public policies and Tobacco % of municipalities with a total / partial interdiction of smoking for theiremployees
Healthy public policies and Tobacco % of municipalities where a procedure is foreseen when employees/ thepopulation in the municipality services don't respect the interdiction ofsmoking
Healthy public policies and Tobacco % of municipalities offering support to stop smoking (organization ofcourses, intervention in the costs of medicine, etc..)
Healthy public policies and Tobacco % of municipalities collaborating with partners (networking) for thetobacco prevention
Healthy public policies and Alcohol and illicit drugs
Healthy public policies and Schools Existence of a policy that limits advertising and promotion of less healthyfoods and beverages within local government facilities or in schools
Healthy public policies and Schools Composite index measuring the strength of healthy diet promoting policyin fundamental schools; components of the index are offer of healthyfood/health education/regulation/participation/networking
Healthy public policies and Schools Composite index measuring the strength of policy promoting physicalactivity in municipalities enterprises; components of the index are offer/information/regulation/participation/netwo
Healthy public policies and Schools Existence of a policy that requires students to be physically active for atleast 50% of time spent in Physical Education classes
Healthy public policies and Schools Composite index measuring the strength of tobacco prevention policy insecondary schools; components of the index areeducation/regulation/intervention/ participation/networking
Healthy public policies and Schools Composite index measuring the strength of policy promoting physicalactivity in secondary schools; components of the index are offer /healtheducation/regulation/participation/networking
Healthy public policies and Schools Presence of local policy to include Physical Education in schools
Healthy public policies and Schools Policies that limit junk food sales in schools
KCE Report 196 S3
Total
municipalities who conducted awareness action for the population 0
% of municipalities with a total / partial interdiction of smoking for their 0
% of municipalities where a procedure is foreseen when employees/ thepopulation in the municipality services don't respect the interdiction of
0
% of municipalities offering support to stop smoking (organization ofcourses, intervention in the costs of medicine, etc..)
0
% of municipalities collaborating with partners (networking) for the 0
Existence of a policy that limits advertising and promotion of less healthyfoods and beverages within local government facilities or in schools
3
Composite index measuring the strength of healthy diet promoting policyin fundamental schools; components of the index are offer of healthyfood/health education/regulation/participation/networking
2
Composite index measuring the strength of policy promoting physicalactivity in municipalities enterprises; components of the index are offer/information/regulation/participation/networking
2
Existence of a policy that requires students to be physically active for atleast 50% of time spent in Physical Education classes
1
Composite index measuring the strength of tobacco prevention policy insecondary schools; components of the index areeducation/regulation/intervention/ participation/networking
1
Composite index measuring the strength of policy promoting physicalactivity in secondary schools; components of the index are offer /health
networking
1
Presence of local policy to include Physical Education in schools 0
Policies that limit junk food sales in schools 0

KCE Report 196S3
Class (Nutbeam) Subclass in Nutbeam model
Health promotion outcomes Healthy public policies andorganisational practice
Health promotion outcomes Healthy public policies andorganisational practice
Health promotion outcomes Healthy public policies andorganisational practice
Health promotion outcomes Healthy public policies andorganisational practice
Health promotion outcomes Healthy public policies andorganisational practice
Health promotion outcomes Healthy public policies andorganisational practice
Health promotion outcomes Healthy public policies andorganisational practice
Health promotion outcomes Healthy public policies andorganisational practice
Health promotion outcomes Healthy public policies andorganisational practice
Health System Performance Report 2012
Subclass in Nutbeam model TOPIC Indicator
Healthy public policies and Schools Composite index measuring the strength of tobacco prevention policy infundamental schools; components of the index are/intervention/ participation/ networking
Healthy public policies and Schools Composite index measuring the strength of healthy diet promoting policyin secondary schools; componentsfood/health education/regulation/participation/networking
Healthy public policies and Schools Composite index measuring the strength of policy promoting physicalactivity in fundamental schools; components of the index are offer /healtheducation/regulation/participation/networking
Healthy public policies and Workplace % of companies with breastfeeding accommodat
Healthy public policies and Workplace Composite index measuring the strength of tobacco prevention policy inenterprises; components of the index are education/regulation/intervention/ participation/ networking
Healthy public policies and Workplace Formal policy that supports healthy eating at worksites
Healthy public policies and Workplace Composite index measuring the strength of healthy diet promoting policyin enterprises; components of the index are offer of healthyfood/information/regulation/participation/networking/budget
Healthy public policies and Workplace Composite index measuring the strength of policy promoting physicalactivity in enterprises; components of the index are offer/information/regulation/participation/networking
Healthy public policies and Workplace Presence of formal worksite policies that support physical activity (e.g.flextime)
83
Total
Composite index measuring the strength of tobacco prevention policy infundamental schools; components of the index are education/regulation/intervention/ participation/ networking
0
Composite index measuring the strength of healthy diet promoting policyin secondary schools; components of the index are offer of healthyfood/health education/regulation/participation/networking
0
Composite index measuring the strength of policy promoting physicalactivity in fundamental schools; components of the index are offer /healtheducation/regulation/participation/networking
0
% of companies with breastfeeding accommodations for employees 2
Composite index measuring the strength of tobacco prevention policy inenterprises; components of the index are education/regulation/
2
Formal policy that supports healthy eating at worksites 1
Composite index measuring the strength of healthy diet promoting policyin enterprises; components of the index are offer of healthyfood/information/regulation/participation/networking/budget
1
Composite index measuring the strength of policy promoting physicalactivity in enterprises; components of the index are offer/information/regulation/participation/networking
1
Presence of formal worksite policies that support physical activity (e.g. 0

84
Table 2: The intermediate list of indicators evaluated against
Indicator
Self-perceived health : Proportion of people reporting their health isgood or very good
Health expectancy : Healthy Life Years
Infant mortality
Premature mortality
Life expectancy
Population-based percentage of overweight or obese adults, childrenand adolescents.
Obesity rates (% of people with a BMI >=30);
Incidence of HIV-Aids
Abortion rate
% absenteeism at work
Health System Performance Report 2012
The intermediate list of indicators evaluated against predetermined criteria
Validity Reliability
relevance,total at 1st
round
Med M Med M
perceived health : Proportion of people reporting their health is 9
9
7
6
5 7 6,88 8,5 8,38
based percentage of overweight or obese adults, children 7
6
5 7 7,29 5 6,14
4 5 6,33 5,5 6
4 7 6,88 6 6
KCE Report 196 S3
Relevance Interpreta. Action
Med M Med M Med M
7 6,75 7 6,88 4,5 5,25
8 6,29 6 6,71 6 5,71
5,5 5,67 5 5 5,5 5,5
7,5 7,5 5,5 5,13 5,5 5,63

KCE Report 196S3
Fraction of bad self perceived health attributable toeconomic inequalties (PAF)
Gini of bad self-perceived health among SES status
Ratio of the leading health indicators between ethnies and socialgroups
Fraction of chronical disease attributable to socioinequalties (PAF)
Concentration index of inequality in self-perceived health among SESstatus
Gini of the prevalence chronical disease among SES status
Odd ratio of Bad Self perceived health between higher and lower SESstatus
Percentage of population eating fewer than 5 servings of fruitand vegetables per day, or proportion of adults eating less than400 g of fruit and vegetables per day.
% of people practising at least 30 minutes of PA per day
% of sedentary people
% engaged in leisure-time physical activity;
Percentage of adults with low level of physicalMetaboloc equivalent per week)
Health System Performance Report 2012
Fraction of bad self perceived health attributable to socio- 3 7 7 6,5 6,5
perceived health among SES status 3 8 7,5 6,5 6,5
Ratio of the leading health indicators between ethnies and social 2 8 7,2 7 6,6
Fraction of chronical disease attributable to socio-economic 2 8 7 7 6,67
perceived health among SES 2 6,5 6,5 6,5 6,5
prevalence chronical disease among SES status 1 6,5 6,5 6,5 6,5
Odd ratio of Bad Self perceived health between higher and lower SES 1 7 7,25 7 6,75
Percentage of population eating fewer than 5 servings of fruitand vegetables per day, or proportion of adults eating less than
5 7 6,86 7 5,71
of PA per day 4 7 6,88 7 5,88
3 6 6 5 5,33
1 6,5 6,5 6 5,88
Percentage of adults with low level of physical activity (<600 1 7 7,33 6,5 6
85
7 7,67 7 6,67 5 5,33
9 8,2 8 6,8 5 5,6
7 7 7 7 5 5,2
7 7,67 7 7 5 5
8 8 3 4,67 5 5
7 7,67 5 5,67 5 4
7 6,75 7 6,5 4,5 4,75
7 6,86 7 6,43 6 6,14
8 8 7 6,75 7 6,75
7,5 7,17 5 5,83 5 5,83
6 6,38 6 6,13 7 6,25
7 7,43 6,5 6,83 6 6

86
% of the population > 15 years that smokes on a daily basis
% of the population >=15 years who are problematic drinkers(>14 glass per weeks for women and >21 for men)
presence of healthy foods in vending machines in schools
Total school hours allocated to physical activity at primary andsecondary level.
Percentage of schools restricting the availability of high fat, salt, sugarproducts in vending machines.
% of people reporting to be able to interpret and evaluate easilyinformation on medical issues and treatment *
% of people reporting be able to take decisions on risk factor forhealth
% of people facing challenges in understanding basic instruction fromtheir physician
Health System Performance Report 2012
% of the population > 15 years that smokes on a daily basis 6
years who are problematic drinkers(>14 glass per weeks for women and >21 for men)
10
presence of healthy foods in vending machines in schools 4 7 6,43 7 6,57
school hours allocated to physical activity at primary and 4 7,5 7,5 8 7,63
Percentage of schools restricting the availability of high fat, salt, sugar 4 7 6,71 6 5,29
% of people reporting to be able to interpret and evaluate easily 4 8 7,71 6 5,43
able to take decisions on risk factor for 4 7 6,57 6 5,43
% of people facing challenges in understanding basic instruction from 3 7 6,5 6,5 6,13
KCE Report 196 S3
6 6,43 6 6,29 7 7,14
7 7 7 6,75 7 6,75
6 6,43 6 5,43 5 5,14
8 7,57 7 6,86 7 7
7 6,86 6 5,71 6 5,57
8 7,57 7 6,57 8 6,86

KCE Report 196S3
Social support measured with the OSS3 scale
Rate of young people leaving schools without a diploma
Net expenditure on health promotion and prevention per inhabitant
% of the public « Health expenditures » allocated to prevention orpublic health services
% of municipalities where the health promotion is integratedthe broader scope of social policy and in different sub matters(young people, old people, school, etc) and in a long termagenda *
Composite index summarizing regulationshealth (and other) authorities on smoking restrictions in specificareas
% of schools with elements of health promotion written in theirschool-project **
* Indicator that was replaced by a close indicator from the long list during the meetin** Indicator proposed during the meeting
Health System Performance Report 2012
measured with the OSS3 scale 4 7,5 7 6,5 6,5
Rate of young people leaving schools without a diploma 4 8 7,75 8 8
Net expenditure on health promotion and prevention per inhabitant 8
» allocated to prevention or 6
% of municipalities where the health promotion is integrated inthe broader scope of social policy and in different sub matters(young people, old people, school, etc) and in a long term
4 5 5,43 5 5
Composite index summarizing regulations implemented byhealth (and other) authorities on smoking restrictions in specific
5 7 7 6,5 6,5
% of schools with elements of health promotion written in their
* Indicator that was replaced by a close indicator from the long list during the meetin
87
8,5 8 7,5 7,25 6 6,25
8 6,88 7 6,63 5,5 5,38
8 6,86 7 6 6 6,57
7 6,67 7 6,6 6,5 6,83

88
4. REFERENCES1. Abma TA. Responsive evaluation in health
ambiguous contexts. Health Promot Int 2005;20(4):391
2. Abrams MA, Klass P, Dreyer BP. Health literacy and children:recommendations for action. Pediatrics 2009 Nov;124:Suppl
3. Ader M, Berensson K, Carlsson P, Granath M, Urwitzindicators for health promotion programmes. [Review] [40 refs]. HealthPromot Int 2001 Jun;16(2):187-95.
4. Aeberli I, Ammann RS, Knabenhans M, Molinari L, Zimmermann MB.Decrease in the prevalence of paediatric adiposity in Switzerland from2002 to 2007. Public Health Nutrition 2010 Jun;13(6):806
5. Aldana SG, Greenlaw R, Diehl HA, Englert H, Jackson R. Impact ofthe coronary health improvement project (CHIP) on several employeepopulations. Journal of Occupational & Environmental Medicine 2002Sep;44(9):831-9.
6. Alegre JC, Marsh D, Snetro-Plewman G, Fullerton J, Dershem L,Sadruddin S. Global case study on measuring community capacity forbetter health and social change outcomes. 2008. Save the ChildrenUSA.Ref Type: Unpublished Work
7. American Medical Association Fondation. Putting the spotlight onhealth literacy to improve quality care. Quality Letter for HealthcareLeaders 2003;15(7):2-11.
8. Aro AA, Van den Broucke S, Raty S. Toward European consensustools for reviewing the evidence and enhancinpromotion practice. Promot Educ 2005;Suppl 1:10
9. Aseltine RH, DeMartino R. An outcome evaluation of the SOS SuicidePrevention Program. Am J Public Health 2004 Mar;94(3):446
10. Baker DW. The meaning and the measure of healthIntern Med 2006 Aug;21(8):878-83.
Health System Performance Report 2012
Abma TA. Responsive evaluation in health promotion: Its value forambiguous contexts. Health Promot Int 2005;20(4):391-7.
Abrams MA, Klass P, Dreyer BP. Health literacy and children:recommendations for action. Pediatrics 2009 Nov;124:Suppl-31.
Ader M, Berensson K, Carlsson P, Granath M, Urwitz V. Qualityindicators for health promotion programmes. [Review] [40 refs]. Health
Aeberli I, Ammann RS, Knabenhans M, Molinari L, Zimmermann MB.Decrease in the prevalence of paediatric adiposity in Switzerland from
o 2007. Public Health Nutrition 2010 Jun;13(6):806-11.
Aldana SG, Greenlaw R, Diehl HA, Englert H, Jackson R. Impact ofthe coronary health improvement project (CHIP) on several employeepopulations. Journal of Occupational & Environmental Medicine 2002
Plewman G, Fullerton J, Dershem L,Sadruddin S. Global case study on measuring community capacity forbetter health and social change outcomes. 2008. Save the Children
dical Association Fondation. Putting the spotlight onhealth literacy to improve quality care. Quality Letter for Healthcare
Aro AA, Van den Broucke S, Raty S. Toward European consensustools for reviewing the evidence and enhancing the quality of healthpromotion practice. Promot Educ 2005;Suppl 1:10-6, 55.
Aseltine RH, DeMartino R. An outcome evaluation of the SOS SuicidePrevention Program. Am J Public Health 2004 Mar;94(3):446-51.
Baker DW. The meaning and the measure of health literacy. J Gen
11. Baker KM, Goetzel RZ, Pei X, Weiss AJ, Bowen J, Tabrizi MJ, et al.Using a return-on-investment estimation model to evaluate outcomesfrom an obesity management worksite health promotion program.Journal of Occupational & Environmental Medicine 2008Sep;50(9):981-90.
12. Bantuelle M, Lonfils R. Un programme politique de promotion de lasanté: l'exemple de la Communauté française de Belgique.& Education 2008;15(1 suppl):26
13. Baranski B. Policy requirements and performance indicators for goodpractice in workplace health: public health perspectives. [Review] [37refs]. International Journal of Occupational Medicine & EnvironmentalHealth 2002;15(2):121-32.
14. Baron-Epel O, Levin-Zamir D, Satranparticipatory process for developing quality assurance tools for healtheducation programs. [Review] [17 refs]. Patient Education &Counseling 2004 Aug;54(2):213
15. Barrett L, Plotnikoff RC, Raine K, Anderson D. Development ofmeasures of organizational leadership for health promotion. HealthEduc Behav 2005 Apr;32(2):195
16. Bauer G, Davies JK, Pelikan J, Noack H, Broesskamp U, Hill C, et al.Advancing a theoretical model for public health and health promotionindicator development: proposal from the EUHPID consortium. Eur JPubl Health 2003 Sep;13(3:Suppl):Suppl
17. Bauer G, Davies JK, Pelikan J. The EUHPID Health DevelopmentModel for the classification of public health indicators. Health PromotInt 2006 Jun;21(2):153-9.
18. Baum FE, Ziersch AM. Social capital.2003 May;57(5):320-3.
19. Bauman A, Bowles HR, Huhman M, Heitzler CD, Owen N, Smith BJ,et al. Testing a Hierarchy-of-Effects Model. Pathways from Awarenessto Outcomes in the VERB(trademark) Campaign2008;34(6 SUPPL.):S249-S256.
20. Beaglehole R, Bonita R, Horton R, Adams C, Alleyne G, Asaria P, etal. Priority actions for the non2011 Apr 23;377(9775):1438-47.
KCE Report 196 S3
Baker KM, Goetzel RZ, Pei X, Weiss AJ, Bowen J, Tabrizi MJ, et al.investment estimation model to evaluate outcomes
from an obesity management worksite health promotion program.Occupational & Environmental Medicine 2008
Bantuelle M, Lonfils R. Un programme politique de promotion de lasanté: l'exemple de la Communauté française de Belgique. Promotion& Education 2008;15(1 suppl):26-8.
ments and performance indicators for goodpractice in workplace health: public health perspectives. [Review] [37refs]. International Journal of Occupational Medicine & Environmental
Zamir D, Satran-Argaman C, Livny N, Amit N. Aparticipatory process for developing quality assurance tools for healtheducation programs. [Review] [17 refs]. Patient Education &Counseling 2004 Aug;54(2):213-9.
Barrett L, Plotnikoff RC, Raine K, Anderson D. Development off organizational leadership for health promotion. Health
Educ Behav 2005 Apr;32(2):195-207.
Bauer G, Davies JK, Pelikan J, Noack H, Broesskamp U, Hill C, et al.Advancing a theoretical model for public health and health promotion
posal from the EUHPID consortium. Eur JPubl Health 2003 Sep;13(3:Suppl):Suppl-13.
Bauer G, Davies JK, Pelikan J. The EUHPID Health DevelopmentModel for the classification of public health indicators. Health Promot
ch AM. Social capital. J Epidemiol Community Health
Bauman A, Bowles HR, Huhman M, Heitzler CD, Owen N, Smith BJ,Effects Model. Pathways from Awareness
to Outcomes in the VERB(trademark) Campaign 2002-2003. AJPMS256.
Beaglehole R, Bonita R, Horton R, Adams C, Alleyne G, Asaria P, etal. Priority actions for the non-communicable disease crisis. Lancet
47.
KCE Report 196S3
21. Beets MW, Rooney L, Tilley F, Beighle A, Webpolicies to promote physical activity in afterschool programs: are wemeeting current benchmarks? Preventive Medicine 2010 Sep;51(34):299-301.
22. Béduwé C, Coppieters Y, Collignon J, Hubens V, Leveque A.Proposition de Plan de promotion de la santé cardiovasculaire enCommunauté française, volume 1: Programmation générale.Cap Coeur; 2009.
23. Bopp M, GermAnn K, Bopp J, Littlejohns LB, Smith N. Assessingcommunity capacity for change. David Thompson Health Region andFour Worlds Centre for Development Learning; 2000.
24. Bosch AL. Health Literacy: werken aaneen'gezondheidsvaardig'Nederland. Nationaal Instituut voorGezondheidsbevordering en Ziektepreventie; 2005.
25. Botterman S, Hooghe M, Reeskens T. 'One size fits all' ? an empiricastudy into the multidimensionality of social cohesion indicators inbelgian Local Communities. Urban Studies Journal2011;(DOI:10.1177/0042098010397397).
26. Bourgeois DM, Llodra JC, Nordblad A, Pitts NB. Report of theEGOHID I Project. Selecting a coherent set of indicators for monitoringand evaluating oral health in Europe: criteria, methods and resultsfrom the EGOHID I project. Community Dental Health 2008Mar;25(1):4-10.
27. Breitbart EW, Greinert R, Volkmer B. Effectiveness of informationcampaigns. [Review] [13 refs]. Progress in Biophysics & MolecularBiology 2006 Sep;92(1):167-72.
28. Brennan Ramirez LK, Hoehner CM, Brownson RC, Cook R, OrleansCT, Hollander M, et al. Indicators of Activity-Friendly Communities:: AnEvidence-Based Consensus Process. AJPM 200
29. Burke V, Mansour J, Beilin LJ, Mori TA.participants in a health promotion program for treated hypertensives(ADAPT). Nutrition Metabolism & Cardiovascular Diseases 2008Mar;18(3):198-206.
Health System Performance Report 2012
Beets MW, Rooney L, Tilley F, Beighle A, Webster C. Evaluation ofpolicies to promote physical activity in afterschool programs: are we
Preventive Medicine 2010 Sep;51(3-
Béduwé C, Coppieters Y, Collignon J, Hubens V, Leveque A.de la santé cardiovasculaire en
Communauté française, volume 1: Programmation générale. Brussels:
Bopp M, GermAnn K, Bopp J, Littlejohns LB, Smith N. Assessingcommunity capacity for change. David Thompson Health Region and
Centre for Development Learning; 2000.
Bosch AL. Health Literacy: werken aanNationaal Instituut voor
Gezondheidsbevordering en Ziektepreventie; 2005.
Botterman S, Hooghe M, Reeskens T. 'One size fits all' ? an empiricalstudy into the multidimensionality of social cohesion indicators inbelgian Local Communities. Urban Studies Journal
Bourgeois DM, Llodra JC, Nordblad A, Pitts NB. Report of theset of indicators for monitoring
and evaluating oral health in Europe: criteria, methods and resultsfrom the EGOHID I project. Community Dental Health 2008
Breitbart EW, Greinert R, Volkmer B. Effectiveness of informationw] [13 refs]. Progress in Biophysics & Molecular
Brennan Ramirez LK, Hoehner CM, Brownson RC, Cook R, OrleansFriendly Communities:: An
Based Consensus Process. AJPM 2006;31(6):515-24.
Burke V, Mansour J, Beilin LJ, Mori TA. Long-term follow-up ofparticipants in a health promotion program for treated hypertensives(ADAPT). Nutrition Metabolism & Cardiovascular Diseases 2008
30. Burris S, Wagenaar AC, SwansMaking the case for laws that improve health: a framework for publichealth law research. Milbank Quarterly 2010 Jun;88(2):169
31. Bush R, Dower J, Mutch A. Community capacity index. 2002.
32. Bush R, Dower J, Mutch A. Community capacity index manual.
33. Buytaert B, Moens O, Tambuyzer J, Wouters E, Vauhauwaert E.Verslag van de indicatorenmeting 2009 van het gezondheidsbeleid(tabak, voeding, beweging) in Vlaamse bedrijven, scholen engemeenten. Vlaams Instituut voor Gezondheidspromotie enZiektepreventie; 2010.
34. Campostrini S, Holtzman D, Mcqueen DV, Boaretto E. Evaluating theeffectiveness of health promotion policy: changes in the law ondrinking and driving in California. Health PromotJun;21(2):130-5.
35. Carter-Pokras O, Baquet C. What is a "health disparity"? Public HealthReports 2002 Sep;117(5):426-34.
36. Cecchini M, Sassi F, Lauer JA, Lee YY, GuajardoD. Tackling of unhealthy diets, physical inactivity, and obeeffects and cost-effectiveness. Lancet 2010 Nov 20;376(9754):177584.
37. Cheadle A, Sterling TD, Schmid TL, Fawcett SB. Promisingcommunity-level indicators for evaluating cardiovascular healthpromotion programs. Health Educ Res 2000 Feb;15(1):1
38. Clement V, Serra D. Egalitarisme et responsabilité. Revue d'économiepolitique 111, 173Ref Type: Journal (Full)
39. Cloetta B, Spencer B, Sporri A, Ruckstuhl B, BroesskampAckermann G. [Model for the systematic classification of ouhealth promotion and prevention]. [French]. Promotion et Education1981;12(2):88-93.
40. Cloetta B, Sporri-Fahrni A, Spencer B, BroesskampRuckstuhl B, Ackermann G. Pomotion Santé Suisse.catégorisation des résultats. Promotio
89
Burris S, Wagenaar AC, Swanson J, Ibrahim JK, Wood J, Mello MM.Making the case for laws that improve health: a framework for publichealth law research. Milbank Quarterly 2010 Jun;88(2):169-210.
Bush R, Dower J, Mutch A. Community capacity index. 2002.
Bush R, Dower J, Mutch A. Community capacity index manual. 2002.
Buytaert B, Moens O, Tambuyzer J, Wouters E, Vauhauwaert E.Verslag van de indicatorenmeting 2009 van het gezondheidsbeleid(tabak, voeding, beweging) in Vlaamse bedrijven, scholen en
Vlaams Instituut voor Gezondheidspromotie en
Campostrini S, Holtzman D, Mcqueen DV, Boaretto E. Evaluating theeffectiveness of health promotion policy: changes in the law ondrinking and driving in California. Health Promot Int 2006
Pokras O, Baquet C. What is a "health disparity"? Public Health34.
Cecchini M, Sassi F, Lauer JA, Lee YY, Guajardo-Barron V, ChisholmD. Tackling of unhealthy diets, physical inactivity, and obesity: health
effectiveness. Lancet 2010 Nov 20;376(9754):1775-
Cheadle A, Sterling TD, Schmid TL, Fawcett SB. Promisinglevel indicators for evaluating cardiovascular health-
Health Educ Res 2000 Feb;15(1):109-16.
Clement V, Serra D. Egalitarisme et responsabilité. Revue d'économiepolitique 111, 173-193. 2001.
Cloetta B, Spencer B, Sporri A, Ruckstuhl B, Broesskamp-Stone U,Ackermann G. [Model for the systematic classification of outcomes inhealth promotion and prevention]. [French]. Promotion et Education
Fahrni A, Spencer B, Broesskamp-Stone U,Ruckstuhl B, Ackermann G. Pomotion Santé Suisse. Guide pour lacatégorisation des résultats. Promotion Santé Suisse; 2005.

90
41. Cole BL, Fielding JE. Health impact assessment: a tool to help policymakers understand health beyond health care.Annual Review of Public Health 2007;28:393-
42. Conseil de l'Europe : Division Recherche et dévelocohésion sociale. Elaboration concertée des indicateurs de cohésionsociale. Guide méthodologique. 2010.
43. Conseil de l'Europe : Division Recherche et développement de lacohésion sociale. Construire le progrès sociétal pour le bientous avec les citoyens et les communautés2010.
44. Conseil Supérieur de promotion de la santé CfWdu programme quiquennal 1998-2003 et réflexions.
45. Coulter A, Ellins J. Patient-focused interventions , aevidence. London: The Helath Foundation; 2006.
46. Coulter A, Ellins J. Effectiveness of strategies for informing, educating,and involving patients. BMJ 2007 Jul 7;335(7609):24
47. Danielzik S, Pust S, Muller MJ. School-based interventions to preventoverweight and obesity in prepubertal children: process and 4outcome evaluation of the Kiel Obesity Prevention Study (KOPS).Paediatrica Supplement 2007 Apr;96(454):19
48. Declercq E, Deliège D, Lorant V. Tableau de bord en Promotion de laSanté. Bruxelles; 1997.
49. Direction Générale de la Santé- Administration de la CommunautéFrançaise. Deuxième rapport sur la mise en oeuvre et l'évaluation dela Politique de Promotion des attitudes saines en CommunautéFrançaise. 2009.
50. Doumont D, Verstaeten Y, Libion F. Quelques exemples de politiquesde santé publique mises en place au sein de l'Europe et de laProvince du Québec (1ere partie). Brussels; 2007.
51. Doumont D, Verstaeten Y, Gossiaux Y, Libion F. Quelques exemplesde politiques de santé publique mises en place au sein de l'Europe etde la Province du Québec (2eme partie). Brussels: ServiceCommunautaire de Promotion de la Santé; 2008.
52. Dugdill L, Springett J. Evaluating health promotion programmes in theworkplace. WHO Reg Publ Eur Ser 2001;(92):285
Health System Performance Report 2012
Health impact assessment: a tool to help policymakers understand health beyond health care. [Review] [89 refs].
-412.
Conseil de l'Europe : Division Recherche et développement de lacohésion sociale. Elaboration concertée des indicateurs de cohésion
Conseil de l'Europe : Division Recherche et développement de lacohésion sociale. Construire le progrès sociétal pour le bien-être deous avec les citoyens et les communautés - Guide méthodologique.
Conseil Supérieur de promotion de la santé CfW-B. Eléments de bilan2003 et réflexions. 2003 May.
focused interventions , a review of theevidence. London: The Helath Foundation; 2006.
Coulter A, Ellins J. Effectiveness of strategies for informing, educating,and involving patients. BMJ 2007 Jul 7;335(7609):24-7.
based interventions to preventoverweight and obesity in prepubertal children: process and 4-yearsoutcome evaluation of the Kiel Obesity Prevention Study (KOPS). ActaPaediatrica Supplement 2007 Apr;96(454):19-25.
clercq E, Deliège D, Lorant V. Tableau de bord en Promotion de la
Administration de la CommunautéFrançaise. Deuxième rapport sur la mise en oeuvre et l'évaluation de
titudes saines en Communauté
Doumont D, Verstaeten Y, Libion F. Quelques exemples de politiquesde santé publique mises en place au sein de l'Europe et de laProvince du Québec (1ere partie). Brussels; 2007.
siaux Y, Libion F. Quelques exemplesde politiques de santé publique mises en place au sein de l'Europe etde la Province du Québec (2eme partie). Brussels: ServiceCommunautaire de Promotion de la Santé; 2008.
omotion programmes in theWHO Reg Publ Eur Ser 2001;(92):285-308.
53. Durlak JA, DuPre EP. Implementation matters: a review of researchon the influence of implementation on program outcomes and thefactors affecting implementation. [Review] [75 refof Community Psychology 2008 Jun;41(3
54. Ebbesen LS, Heath S, Naylor PJ, Anderson D. Issues in measuringhealth promotion capacity in Canada: a multiHealth Promot Int 2004 Mar;19(1):85
55. Edington M, Karjalainen T, Hirschland D, Edington DW.health promotion program. Successful outcomes. [Review] [4 refs].AAOHN Journal 2002 Jan;50(1):26
56. EQUIHP. Final technical implementation report of the actionGetting Evidence into PracticeNo. 2003123 (Evidence Consortium 790841). EQUIHP; 2005.
57. EUHPID consortium. The development of a European HealthPromotion Monitoring System. 2004.
58. European Community Health Inidicators Monitoring Project. ECHIShort list of indicators. ECHIM Project, DG Sanco; 200
59. Exworthy M, Bindman A, Davies H, Washington AE. Evidence intopolicy and practice? Measuring the progress of U.S. and U.K. policiesto tackle disparities and inequalities in U.S. and U.K. health and healthcare. Milbank Quarterly 2006;84(1):75
60. Federal Centre for Health Education in Germany. Public awareness ofAIDS in the Federal Republic of Germany 2009. 2010.
61. Feldman PH, Oberlink MR. Developing community indicators topromote the health and wellCommunity Health 2003 Oct;26(4):268
62. First International Conference for health promotion. Ottawa charter forhealth promotion. Health Promotion 1987;1:3
63. Fletcher F, McKennitt D, Baydala L. Community capacity building: anaboriginal exploratory case study. Pimatisiand Indigeous Community Health 2008;5(2):9
64. Frankish CJ, Green LW, Ratner PA, Chomik T, Larsen C. Healthimpact assessment as a tool for health promotion and populationhealth. [Review] [116 refs]. WHO Regional PublicationsSeries (92):405-37, 2001 2001;(92):405
KCE Report 196 S3
Durlak JA, DuPre EP. Implementation matters: a review of researchon the influence of implementation on program outcomes and thefactors affecting implementation. [Review] [75 refs]. American Journalof Community Psychology 2008 Jun;41(3-4):327-50.
Ebbesen LS, Heath S, Naylor PJ, Anderson D. Issues in measuringhealth promotion capacity in Canada: a multi-province perspective.Health Promot Int 2004 Mar;19(1):85-94.
jalainen T, Hirschland D, Edington DW. The UAW-GMhealth promotion program. Successful outcomes. [Review] [4 refs].AAOHN Journal 2002 Jan;50(1):26-31.
EQUIHP. Final technical implementation report of the actionGetting Evidence into Practice
Evidence Consortium 790841). EQUIHP; 2005.
EUHPID consortium. The development of a European HealthPromotion Monitoring System. 2004.
European Community Health Inidicators Monitoring Project. ECHIShort list of indicators. ECHIM Project, DG Sanco; 2008.
Exworthy M, Bindman A, Davies H, Washington AE. Evidence intopolicy and practice? Measuring the progress of U.S. and U.K. policiesto tackle disparities and inequalities in U.S. and U.K. health and healthcare. Milbank Quarterly 2006;84(1):75-109.
Federal Centre for Health Education in Germany. Public awareness ofAIDS in the Federal Republic of Germany 2009. 2010.
Feldman PH, Oberlink MR. Developing community indicators topromote the health and well-being of older people. Family &
th 2003 Oct;26(4):268-74.
First International Conference for health promotion. Ottawa charter forhealth promotion. Health Promotion 1987;1:3-5.
Fletcher F, McKennitt D, Baydala L. Community capacity building: anaboriginal exploratory case study. Pimatisiwin: A journal of Aboriginaland Indigeous Community Health 2008;5(2):9-32.
Frankish CJ, Green LW, Ratner PA, Chomik T, Larsen C. Healthimpact assessment as a tool for health promotion and populationhealth. [Review] [116 refs]. WHO Regional Publications European
37, 2001 2001;(92):405-37.

KCE Report 196S3
65. Gibbon M, Labonte R, Laverack G. Evaluating community capacity.Health Soc Care Community 2002 Nov;10(6):485
66. Gibbs BK, Nsiah-Jefferson L, McHugh MD, Trivedi AN, ProthrowD. Reducing racial and ethnic health disparities: exploring anoutcome-oriented agenda for research and policy. Journal of HealthPolitics, Policy & Law 2006 Feb;31(1):185-218.
67. Glouberman S, Millar J. Evolution of the determinants of health, healthpolicy, and health information systems in Canada.2003 Mar;93(3):388-92.
68. Godin I, de Smet P, Moreau N, Parent F. Tableau de bord de la santéen Communauté Française de Belgique -2008.
69. Goodman RM, Speers MA, McLeroy K, Fawcett S, Kegler M, ParkE, et al. Identifying and defining the dimensions of community capacityto provide a basis for measurement. Health Educ Behav 1998Jun;25(3):258-78.
70. Gruman J, Rovner MH, French ME, Jeffress D, Sofaer S, Shaller D, etal. From patient education to patient engagement: Implications for thefield of patient education. Patient Educ Couns 2010;78(3):350
71. Guralnik JM, Kritchevsky SB. Translating research to promote healthyaging: the complementary role of longitudinal studies and clinical trials.[Review]. Journal of the American Geriatrics Society 2010Oct;58:Suppl-42.
72. Habicht JP, Victora CG, Vaughan JP. Evaluation designs foradequacy, plausibility and probability of public health programmeperformance and impact. Int J Epidemiol 1999 Feb;28(1):10
73. Hanni KD, Mendoza E, Snider J, Winkleby MA.evaluating organizational change in communityinterventions. Preventing Chronic Disease 2007 Oct;4(4):A105.
74. Harbers MM, Van der Wilk EA, Kramers PGN, Kuunders MMAP,Verschuuren M, Ellyahu N, et al. Dare to compare! BenchmarkingDutch health with the European Community Health Indicators (ECHI).Bilthoven: National Institute for Public Health and Environment(RIVM); 2008.
Health System Performance Report 2012
Gibbon M, Labonte R, Laverack G. Evaluating community capacity.Health Soc Care Community 2002 Nov;10(6):485-91.
Jefferson L, McHugh MD, Trivedi AN, Prothrow-Stiththnic health disparities: exploring an
oriented agenda for research and policy. Journal of Health218.
Glouberman S, Millar J. Evolution of the determinants of health, healthsystems in Canada. Am J Public Health
Godin I, de Smet P, Moreau N, Parent F. Tableau de bord de la santé2007. Bruxelles: SIPES;
Goodman RM, Speers MA, McLeroy K, Fawcett S, Kegler M, ParkerE, et al. Identifying and defining the dimensions of community capacityto provide a basis for measurement. Health Educ Behav 1998
Gruman J, Rovner MH, French ME, Jeffress D, Sofaer S, Shaller D, ett engagement: Implications for the
field of patient education. Patient Educ Couns 2010;78(3):350-6.
Guralnik JM, Kritchevsky SB. Translating research to promote healthyaging: the complementary role of longitudinal studies and clinical trials.
urnal of the American Geriatrics Society 2010
Habicht JP, Victora CG, Vaughan JP. Evaluation designs foradequacy, plausibility and probability of public health programmeperformance and impact. Int J Epidemiol 1999 Feb;28(1):10-8.
D, Mendoza E, Snider J, Winkleby MA. A methodology forevaluating organizational change in community-based chronic diseaseinterventions. Preventing Chronic Disease 2007 Oct;4(4):A105.
Harbers MM, Van der Wilk EA, Kramers PGN, Kuunders MMAP,Dare to compare! Benchmarking
Dutch health with the European Community Health Indicators (ECHI).Bilthoven: National Institute for Public Health and Environment
75. Hawe P, King L, Noort M, Jordens C, Lloyd B. Indicators to helcapacity building in health promotion.Center for Health Promotion/NSW Health; 2000.
76. Hekkink CF, Molleeman G, Keijsers JFEM, Saan H. Onderzoek naarindicator-ontwikkeling voor gezondheidsbevordering. NationaalInstituut voor Gezondheidsbevordering en Ziektepreventie; 2007.
77. Huber M, Knottnerus JA, Green L, Horst H, Jadad AR, Kromhout D, eal. How should we define health? BMJ 2011;343:d4163.
78. IUHPE. Vers des écoles promotrices de santé.
79. Jackson SF, Cleverly S, Poland B, Burman D, Edwards R, RobertsonA. Working with Toronto neighbourhoods toward developing indicatorsof community capacity. Health Promot Int 2003 Dec;18(4):339
80. Jacobsen GD, Jacobsen KH. Health awareness campaigns anddiagnosis rates: Evidence from National Breast Cancer AwarenessMonth. J Health Econ 2011 Jan;30(1):55
81. Kelly CM, Hoehner CM, Baker EA, BrenRC. Promoting physical activity in communities: Approaches forsuccessful evaluation of programs and policies. Evaluation andProgram Planning 2006;29(3):280
82. Khan LK, Sobush K, Keener D, Goodman K, Lowry A, Kakietek J, etal. Recommended community strategies and measurements toprevent obesity in the United States. Morbidity & Mortality WeeklyReport Recommendations & Reports 2009 Jul 24;58(RR
83. Kim JM, Koh KW, Yu BC, Jeon MJ, Kim YJ, Kim YH. Assessment ofcommunity capacity building ability of health promotion workers inpublic health centers. J Prev Med Public Health 2009 Sep;42(5):28392.
84. Kindig DA. Understanding population health terminology. [Review] [48refs]. Milbank Quarterly 2007;85(1):139
85. Klassen A, Miller A, Anderson N, Shen J, Schiariti V, O'Donnell M.Performance measurement and improvement frameworks in health,education and social services systems: A systematic review. Int J QualHealth Care 2010;22(1):44-69.
86. Kristenson M, Weinehall L. Towards a more healservice. 2006.
91
Hawe P, King L, Noort M, Jordens C, Lloyd B. Indicators to help withcapacity building in health promotion. Sydney, Australia: AustralianCenter for Health Promotion/NSW Health; 2000.
Hekkink CF, Molleeman G, Keijsers JFEM, Saan H. Onderzoek naarontwikkeling voor gezondheidsbevordering. Nationaal
Instituut voor Gezondheidsbevordering en Ziektepreventie; 2007.
Huber M, Knottnerus JA, Green L, Horst H, Jadad AR, Kromhout D, etHow should we define health? BMJ 2011;343:d4163.
IUHPE. Vers des écoles promotrices de santé. IUHPE; 2011.
Jackson SF, Cleverly S, Poland B, Burman D, Edwards R, RobertsonA. Working with Toronto neighbourhoods toward developing indicators
nity capacity. Health Promot Int 2003 Dec;18(4):339-50.
Jacobsen GD, Jacobsen KH. Health awareness campaigns anddiagnosis rates: Evidence from National Breast Cancer AwarenessMonth. J Health Econ 2011 Jan;30(1):55-61.
Kelly CM, Hoehner CM, Baker EA, Brennan Ramirez LK, BrownsonRC. Promoting physical activity in communities: Approaches forsuccessful evaluation of programs and policies. Evaluation andProgram Planning 2006;29(3):280-92.
Khan LK, Sobush K, Keener D, Goodman K, Lowry A, Kakietek J, etecommended community strategies and measurements to
prevent obesity in the United States. Morbidity & Mortality WeeklyReport Recommendations & Reports 2009 Jul 24;58(RR-7):1-26.
Kim JM, Koh KW, Yu BC, Jeon MJ, Kim YJ, Kim YH. Assessment ofity building ability of health promotion workers in
public health centers. J Prev Med Public Health 2009 Sep;42(5):283-
Kindig DA. Understanding population health terminology. [Review] [48refs]. Milbank Quarterly 2007;85(1):139-61.
Anderson N, Shen J, Schiariti V, O'Donnell M.Performance measurement and improvement frameworks in health,education and social services systems: A systematic review. Int J Qual
Kristenson M, Weinehall L. Towards a more health-promoting health
92
87. Kumaresan J, Prasad A, Alwan A, Ishikawa N. Promoting healthequity in cities through evidence-based action. Journal of UrbanHealth 2010 Sep;87(5):727-32.
88. Labonte R, Laverack G. Capacity building in health promotion, pwhose use? and with what measurement? Critical Public Health2001;11(2):129-38.
89. Lalonde M. A new perspectieve on the health of Canadians. A workingdocument. Ottawa: Goverment of Canada; 1974.
90. Laverack G. Evaluating community capacity: visualinterpretation. Community Development Journal 2005;1
91. Lempa M, Goodman RM, Rice J, Becker AB. Development of scalesmeasuring the capacity of community-based initiatives. Health EducBehav 2008 Jun;35(3):298-315.
92. Levin-Zamir D, Peterburg Y. Health literacy in health systems:perspectives on patient self-management in Israel. Health Promot Int2001 Mar;16(1):87-94.
93. Lin V, Gruszin S, Ellikson C, Glover J, Silburn K, Wilson G, et al.comparative evaluation of indicators for gender equity2011.
94. Lundgren B. Indicators for monitoring the new Swedish public healthpolicy. 2004.
95. Macdonald G, Veen C, Tones K. Evidence for success in healthpromotion: suggestions for improvement. Health Educ Res 1996Sep;11(3):367-76.
96. Maclellan-Wright MF, Anderson D, Barber S, Smith N, Cantin B, FelixR, et al. The development of measures of community capacity forcommunity-based funding programs in Canada.2007 Dec;22(4):299-306.
97. Maier B, Bau AM, James J, Gorgen R, Graf C, HanewiMethods for evaluation of health promotion programmes. Smokingprevention and obesity prevention for children and adolescents.Bundesgesundheitsblatt Gesundheitsforschung Gesundheitsschutz2007 Jul;50(7):980-6.
Health System Performance Report 2012
Kumaresan J, Prasad A, Alwan A, Ishikawa N. Promoting healthbased action. Journal of Urban
Labonte R, Laverack G. Capacity building in health promotion, part 2:whose use? and with what measurement? Critical Public Health
Lalonde M. A new perspectieve on the health of Canadians. A workingdocument. Ottawa: Goverment of Canada; 1974.
Laverack G. Evaluating community capacity: visual representation andinterpretation. Community Development Journal 2005;1-11.
Lempa M, Goodman RM, Rice J, Becker AB. Development of scalesbased initiatives. Health Educ
urg Y. Health literacy in health systems:management in Israel. Health Promot Int
Lin V, Gruszin S, Ellikson C, Glover J, Silburn K, Wilson G, et al.comparative evaluation of indicators for gender equity and health.
Lundgren B. Indicators for monitoring the new Swedish public health
Macdonald G, Veen C, Tones K. Evidence for success in healthpromotion: suggestions for improvement. Health Educ Res 1996
ight MF, Anderson D, Barber S, Smith N, Cantin B, FelixR, et al. The development of measures of community capacity for
based funding programs in Canada. Health Promot Int
Maier B, Bau AM, James J, Gorgen R, Graf C, Hanewinkel R, et al.Methods for evaluation of health promotion programmes. Smokingprevention and obesity prevention for children and adolescents.Bundesgesundheitsblatt Gesundheitsforschung Gesundheitsschutz
98. Mancuso JM. Assessment and meaintegrative review of the literature. [Review] [75 refs]. Nursing & HealthSciences 2009 Mar;11(1):77-89.
99. Margellos H, Silva A, Whitman S. Comparison of health statusindicators in chicago: are BlackPublic Health 2004 Jan;94(1):116
100.Marshall M, Klazinga N, Leatherman S, Hardy C, Bergmann E, PiscoL, et al. OECD Health Care Quality Indicator Project. The expert panelon primary care prevention and health promotion. Int J Qual HealthCare 2006 Sep;18:Suppl-5.
101.Mcdowell I, Spasoff RA, Kristjansson B. On the classification ofpopulation health measurements.Mar;94(3):388-93.
102.Ministère de la Communauté FrançaiseULB. Rapport de l'état des lieux desl'organisation des cantines et autres restaurants des établissementsscolaires. 2006.
103.Molleman G, Peeters L, Hommel L, Ploeg M. Outil de pilotage etd'analysyse de l'efficacité attendue des interventions en promotion dela santé- Preffi 2.0. 2011.
104.Molleman GR, Ploeg MA, Hosman CM, Peters L. [Preffi 2.0: a Dutchinstrument to analyse the effectiveness of health promotioninterventions]. Promot Educ 2004;Spec no 1:22
105.Molleman GRM, Peters LWH, Hosman CMH, Kok GJ,Project quality rating by experts and practitioners: Experience withPreffi 2.0 as a quality assessment instrument. Health Educ Res2006;21(2):219-29.
106.Nutbeam D. Evaluating Health Promotionsolutions. Health PromotionRef Type: Journal (Full)
107.Nutbeam D. Health promotion glossary. 1998.
108.Nutbeam D. The evolving concept of health literacy. Soc Sci Med2008 Dec;67(12):2072-8.
109.Nutbeam D. Defining and measuring health literacy: what can wfrom literacy studies? Int J Public Health 2009;54(5):303
KCE Report 196 S3
Mancuso JM. Assessment and measurement of health literacy: anintegrative review of the literature. [Review] [75 refs]. Nursing & Health
89.
Margellos H, Silva A, Whitman S. Comparison of health statusindicators in chicago: are Black-White disparities worsening? Am JPublic Health 2004 Jan;94(1):116-21.
Marshall M, Klazinga N, Leatherman S, Hardy C, Bergmann E, PiscoL, et al. OECD Health Care Quality Indicator Project. The expert panelon primary care prevention and health promotion. Int J Qual Health
Mcdowell I, Spasoff RA, Kristjansson B. On the classification ofpopulation health measurements. Am J Public Health 2004
Ministère de la Communauté Française- DG Enseignement, SIPES-ULB. Rapport de l'état des lieux des pratiques culinaires et del'organisation des cantines et autres restaurants des établissements
Molleman G, Peeters L, Hommel L, Ploeg M. Outil de pilotage etd'analysyse de l'efficacité attendue des interventions en promotion de
Molleman GR, Ploeg MA, Hosman CM, Peters L. [Preffi 2.0: a Dutchinstrument to analyse the effectiveness of health promotioninterventions]. Promot Educ 2004;Spec no 1:22-7, 49.
Molleman GRM, Peters LWH, Hosman CMH, Kok GJ, Oosterveld P.Project quality rating by experts and practitioners: Experience withPreffi 2.0 as a quality assessment instrument. Health Educ Res
Nutbeam D. Evaluating Health Promotion - progress, problems andsolutions. Health Promotion International 13[1], 27-44. 1998.
Nutbeam D. Health promotion glossary. 1998.
Nutbeam D. The evolving concept of health literacy. Soc Sci Med
Nutbeam D. Defining and measuring health literacy: what can we learnfrom literacy studies? Int J Public Health 2009;54(5):303-5.

KCE Report 196S3
110.O'Connor-Fleming ML, Parker E, Higgins H, Gould T. A framework forevaluating health promotion programs. Health Promot J Austr 2006Apr;17(1):61-6.
111.Observatoire de la Santé de la Province de Luxembourg. Tableau debord de la santé en province de Luxembourg 2010. Observatoire dela Santé de la Province de Luxembourg; 2010.
112.Observatoire de la Santé du Hainaut - Santé en Hainaut n°7. Carnetde bord de la santé des jeunes 2010. ObservatoireHainaut - Santé en Hainaut n°7; 2010.
113.Observatoire de la santé et du social de Bruxellesde bord de la santé en Région Bruxelloise en 2010.
114.OECD. A system of health accounts. OCDE; 2000.
115.OECD. Health Care Quality Indicators (HCQI) project: overview ofresults from the 2010-2011 data collection and next steps. OECD;2011.
116.Organisation for Economic Cooperation and Devlopment. OECDHealth data 2011. OECD; 2011.
117.Peerson A, Saunders M. Health literacy revisited: wand why does it matter? Health Promot Int 2009 Sep;24(3):285
118.Peiro R, Alvarez-Dardet C, Plasencia A, Borrell C, Colomer C, MoyaC, et al. Rapid appraisal methodology for 'health for all' policyformulation analysis. Health Policy 2002 Dec;62(3):309
119.Pluto DM, Phillips MM, MBA DMK, Shepard DM, MAT JMR,Brownstein JN. Policy and environmental indicators for heart diseaseand stroke prevention: data sources in two states. Policy 2004;1(2):03.
120.Potvin L, Haddad S, Frohlich KL. Beyond procevaluation: a comprehensive approach for evaluating health promotionprogrammes. WHO Regional Publications European Series (92):4562, 2001 2001;(92):45-62.
121.Public Health Agency of Canada. Community capacity building tool.2005.
122.Rootman I, Goodstadt M, Potvin L, Springett J. A framework for healthpromotion evaluation. WHO Reg Publ Eur Ser 2001;(92):7
Health System Performance Report 2012
Fleming ML, Parker E, Higgins H, Gould T. A framework forHealth Promot J Austr 2006
de Luxembourg. Tableau debord de la santé en province de Luxembourg 2010. Observatoire dela Santé de la Province de Luxembourg; 2010.
Santé en Hainaut n°7. Carnetde bord de la santé des jeunes 2010. Observatoire de la Santé du
Observatoire de la santé et du social de Bruxelles-Capitale. Tableaude bord de la santé en Région Bruxelloise en 2010. 2010.
OECD. A system of health accounts. OCDE; 2000.
y Indicators (HCQI) project: overview of2011 data collection and next steps. OECD;
Organisation for Economic Cooperation and Devlopment. OECD
Peerson A, Saunders M. Health literacy revisited: what do we meanand why does it matter? Health Promot Int 2009 Sep;24(3):285-96.
Dardet C, Plasencia A, Borrell C, Colomer C, MoyaRapid appraisal methodology for 'health for all' policy
Dec;62(3):309-28.
Pluto DM, Phillips MM, MBA DMK, Shepard DM, MAT JMR,Brownstein JN. Policy and environmental indicators for heart diseaseand stroke prevention: data sources in two states. Policy 2004;1(2):03.
Potvin L, Haddad S, Frohlich KL. Beyond process and outcomeevaluation: a comprehensive approach for evaluating health promotionprogrammes. WHO Regional Publications European Series (92):45-
Public Health Agency of Canada. Community capacity building tool.
, Goodstadt M, Potvin L, Springett J. A framework for healthpromotion evaluation. WHO Reg Publ Eur Ser 2001;(92):7-38.
123.Roy K, Haddix AC, Ikeda RM, Curry CW, Truman BI, Thacker SB.Monitoring progress toward CDC's health protection goals: healthoutcome measures by life stage. Public Health Reports 2009Mar;124(2):304-16.
124.Ruger JP. Health capability: conceptualization and operationalization.Am J Public Health 2010;100(1):41
125.Saunders RP, Evans MH, Joshi P. Developing a processplan for assessing health promotion program implementation: a howguide. [Review] [24 refs]. Health Promotion Practice 2005Apr;6(2):134-47.
126.Schmidt M, Robbesom D, Bakker M, Stronks K. Empowerment in hetreferentiekader Gezondheidsbevordering. Nationaal Instituut voorGezondheidsbevordering en Ziektepreventie; 2007.
127.Smith N, Littlejohns LB, Hawe P, Sutherland L. Great expectationsand hard times: developing community indicators in a healthycommunities initiative in Canada. Health Promot Int 2008Jun;23(2):119-26.
128.Sondik EJ, Huang DT, Klein RJ, Satcher D. Progress toward thehealthy people 2010 goals and objectives. [Review] [9 refs]. AnnualReview of Public Health 2010 Apr 21;31:271
129.Spencer B, Broesskamp-Stone U, Ruckstuhl B, Ackermann G, SpoerriA, Cloetta B. Modelling the results of health promotion activities inSwitzerland: development of the Swiss Model for OutcomeClassification in Health Promotion and Prevention. Health Promot Int2008 Mar;23(1):86-97.
130.Spinakis A, Anastasion G, Panousis V, Spiliopoulos S, PaYfantopoulos J. Expert Review and Proposals for measurement ofhealth inequalities in the EU. Luxembourg: DG SANCO; 2011.
131.St Leger L. health promotion indicators. Coming out of the maze with apurpose. Health Promot Int 2011;14(3):193
132.St Leger L, Young I, Blanchard C, Perry M. Promoting health inschools, from evidence to action.
133.Stamm HP, Fischer A, Wiegand D, Lamprecht M. Recueild'indicateurs du Système de monitiorage alimentation et activitéphysique (MOSEB). Office fédé
93
Roy K, Haddix AC, Ikeda RM, Curry CW, Truman BI, Thacker SB.Monitoring progress toward CDC's health protection goals: health
asures by life stage. Public Health Reports 2009
Ruger JP. Health capability: conceptualization and operationalization.Am J Public Health 2010;100(1):41-9.
Saunders RP, Evans MH, Joshi P. Developing a process-evaluationng health promotion program implementation: a how-to
[Review] [24 refs]. Health Promotion Practice 2005
Schmidt M, Robbesom D, Bakker M, Stronks K. Empowerment in hetreferentiekader Gezondheidsbevordering. Nationaal Instituut voorGezondheidsbevordering en Ziektepreventie; 2007.
Smith N, Littlejohns LB, Hawe P, Sutherland L. Great expectationsand hard times: developing community indicators in a healthycommunities initiative in Canada. Health Promot Int 2008
dik EJ, Huang DT, Klein RJ, Satcher D. Progress toward thehealthy people 2010 goals and objectives. [Review] [9 refs]. AnnualReview of Public Health 2010 Apr 21;31:271-81.
Stone U, Ruckstuhl B, Ackermann G, Spoerrielling the results of health promotion activities in
Switzerland: development of the Swiss Model for OutcomeClassification in Health Promotion and Prevention. Health Promot Int
Spinakis A, Anastasion G, Panousis V, Spiliopoulos S, Palailalogou S,Yfantopoulos J. Expert Review and Proposals for measurement ofhealth inequalities in the EU. Luxembourg: DG SANCO; 2011.
St Leger L. health promotion indicators. Coming out of the maze with apurpose. Health Promot Int 2011;14(3):193-5.
Leger L, Young I, Blanchard C, Perry M. Promoting health inschools, from evidence to action. UIHPE; 2010.
Stamm HP, Fischer A, Wiegand D, Lamprecht M. Recueild'indicateurs du Système de monitiorage alimentation et activitéphysique (MOSEB). Office fédéral de la santé publique; 2009.

94
134.Statistics Denmark. Focus on health indicators.
135.Statistique Canada. Indicateurs de la santé. 2008.
136.Stein CE. Targets for health 2020. 2011.
137.Tellier V, Fiszman P, Vanlierde A, Berra P, Massot C, Wathieu V, etal. Tableau de bord de la santé en Wallonie. 2010.
138.Van den Broucke S, Lenders F. Monitoring the planning quality ofhealth promotion projects in Flanders. Promot Educ 1997 Jun;4(2):268.
139.van Hees F, van Ballegooijen M. Indicatorengegevensset voor landlijke monitor en kwaliteitsborging voor hetbevolkingsonderzoek naar dikkedarmkanker.
140.Van Hoye A. Stratégie de promotion de l'activité physique au sein del'école : un outil pour comparer trois communautés. 2009 Apr 3; Paris:5th Conference of INPES; 2009.
141.Van Oyen H, Deboosere P, Lorant V, Charafeddine R. Les inégalitéssociales de santé en Belgique - Sociale ongelijkheden in gezondheidin België. 2011.
142.Vlaams Agentschap Zorg en Gezondheid. Cijfers over gezond leven;http://www.zorg-en-gezondheid.be/. 2010.
143.Vlayen J, Vanthomme K, Camberlin C, Walckiers D, Kohn L, Vinck I,et al. Un premier pas vers la mesure de la performance du système desoins de santé belgeEen eerste stap naar het meten van de performantie van hetBelgische gezondheidszorgsysteem. Brussels: KCE; 2010 Jul 5.Report No.: 128B.
144.Wallace JE, Lemaire JB, Ghali WA. Physician wellness: a missingquality indicator. [Review] [100 refs]. Lancet 2009 Nov14;374(9702):1714-21.
145.Watt RG, Harnett R, Daly B, Fuller SS, Kay E, Morgan A, et al.Evaluating oral health promotion: need for quality outcome measures.Community Dentistry & Oral Epidemiology 2006 Feb;34(1):11
Health System Performance Report 2012
Statistics Denmark. Focus on health indicators. 2011.
2008.
Tellier V, Fiszman P, Vanlierde A, Berra P, Massot C, Wathieu V, et2010.
Van den Broucke S, Lenders F. Monitoring the planning quality ofPromot Educ 1997 Jun;4(2):26-
an Hees F, van Ballegooijen M. Indicatoren- en minimalegegevensset voor landlijke monitor en kwaliteitsborging voor hetbevolkingsonderzoek naar dikkedarmkanker. 2011.
Van Hoye A. Stratégie de promotion de l'activité physique au sein deil pour comparer trois communautés. 2009 Apr 3; Paris:
Van Oyen H, Deboosere P, Lorant V, Charafeddine R. Les inégalitésSociale ongelijkheden in gezondheid
org en Gezondheid. Cijfers over gezond leven;
Vlayen J, Vanthomme K, Camberlin C, Walckiers D, Kohn L, Vinck I,et al. Un premier pas vers la mesure de la performance du système desoins de santé belge
stap naar het meten van de performantie van hetBrussels: KCE; 2010 Jul 5.
Physician wellness: a missingquality indicator. [Review] [100 refs]. Lancet 2009 Nov
Watt RG, Harnett R, Daly B, Fuller SS, Kay E, Morgan A, et al.Evaluating oral health promotion: need for quality outcome measures.Community Dentistry & Oral Epidemiology 2006 Feb;34(1):11-7.
146.Wendel M, Burdine J, McLeroy K, Alaniz A, Norton BCommunity capacity: theory and application. In: Kegler M, DiClementeR, Crosby R, Kegler M, editors. Emerging theories in health promotionpractice and research.San Francisco: John Wiley & Sons; 2009. p.277-302.
147.Westert GP, Verkleij H. Dutch Health Care Perfomance Report 2006.Bilthoven: RIVM; 2006.
148.WHO- Europe. Alcohol Database. WHO
149.WHO Europe HSPP. Pathway to Health System Performanceassessment. 2011.
150.WHO European Office for Integrated Healfor Health Promotion in Hospitals: Development of indicators for aSelf-Assessment Tool; Report on 4
151.WHO European Workgroup on Health Promotion Evaluation.Evaluation in health promotionCopenhague: WHO Regional Publications; 2001.
152.WHO Global Strategy on Diet PAaH. A Framework to monitor andevaluate implementation. 2008. Geneva.http://www.who.int/dietphysicalactivity/M&ERef Type: Online Source
153.WHO Global Strategy on Diet PAaH. Recommendations for PhysicalActivity for Health. 2011.
154.WHO Regional Office for Europe. Measurement in health promotionand protection. Copenhagen: 1987.
155.WHO Regional Office for Europe. Health for all Data Base.Copenhagen; 1998 Jun.
156.WHO Regional Office for Europe. Food and health in Europe: a newbasis for action. WHO Europe; 2011. Report No.: 96.
157.WHO Regional Office for Europe, Nutrition and Food SecurityProgramme. Comparative analyses of food and nutrition policies inWHO European members states. Copenhague; 2003.
158.WHO Tobacco Free Initiative.2011: warnings about the dangers of tobacco. Appendix X, maps onglobal tobacco control policy data.
KCE Report 196 S3
Wendel M, Burdine J, McLeroy K, Alaniz A, Norton B, Felix M.Community capacity: theory and application. In: Kegler M, DiClementeR, Crosby R, Kegler M, editors. Emerging theories in health promotionpractice and research.San Francisco: John Wiley & Sons; 2009. p.
Westert GP, Verkleij H. Dutch Health Care Perfomance Report 2006.
Europe. Alcohol Database. WHO- Europe; 2011.
WHO Europe HSPP. Pathway to Health System Performance
WHO European Office for Integrated Health Care Services. Standardsfor Health Promotion in Hospitals: Development of indicators for a
Assessment Tool; Report on 4th
WHO Workshop. 2003.
WHO European Workgroup on Health Promotion Evaluation.Evaluation in health promotion - Principles and perspectives.Copenhague: WHO Regional Publications; 2001.
WHO Global Strategy on Diet PAaH. A Framework to monitor andevaluate implementation. 2008. Geneva.http://www.who.int/dietphysicalactivity/M&E-ENG-09.pdf.
tegy on Diet PAaH. Recommendations for Physical
WHO Regional Office for Europe. Measurement in health promotionand protection. Copenhagen: 1987.
WHO Regional Office for Europe. Health for all Data Base.
WHO Regional Office for Europe. Food and health in Europe: a newbasis for action. WHO Europe; 2011. Report No.: 96.
WHO Regional Office for Europe, Nutrition and Food SecurityProgramme. Comparative analyses of food and nutrition policies in
members states. Copenhague; 2003.
WHO Tobacco Free Initiative. Report on the global tobacco epidemic2011: warnings about the dangers of tobacco. Appendix X, maps onglobal tobacco control policy data. WHO; 2011.

KCE Report 196S3
159.World Health organisation.First International Conference for healthpromotion. Ottawa Charter for Health Promotion. 1986.
Health System Performance Report 2012
ational Conference for healthpromotion. Ottawa Charter for Health Promotion. 1986.
160.World Health Organization Regional Office for Europe. Health 21: thehealth for all policy framework for the WHO European Region.Copenhagen: World Health Organization; 1
95
World Health Organization Regional Office for Europe. Health 21: thehealth for all policy framework for the WHO European Region.Copenhagen: World Health Organization; 1999.
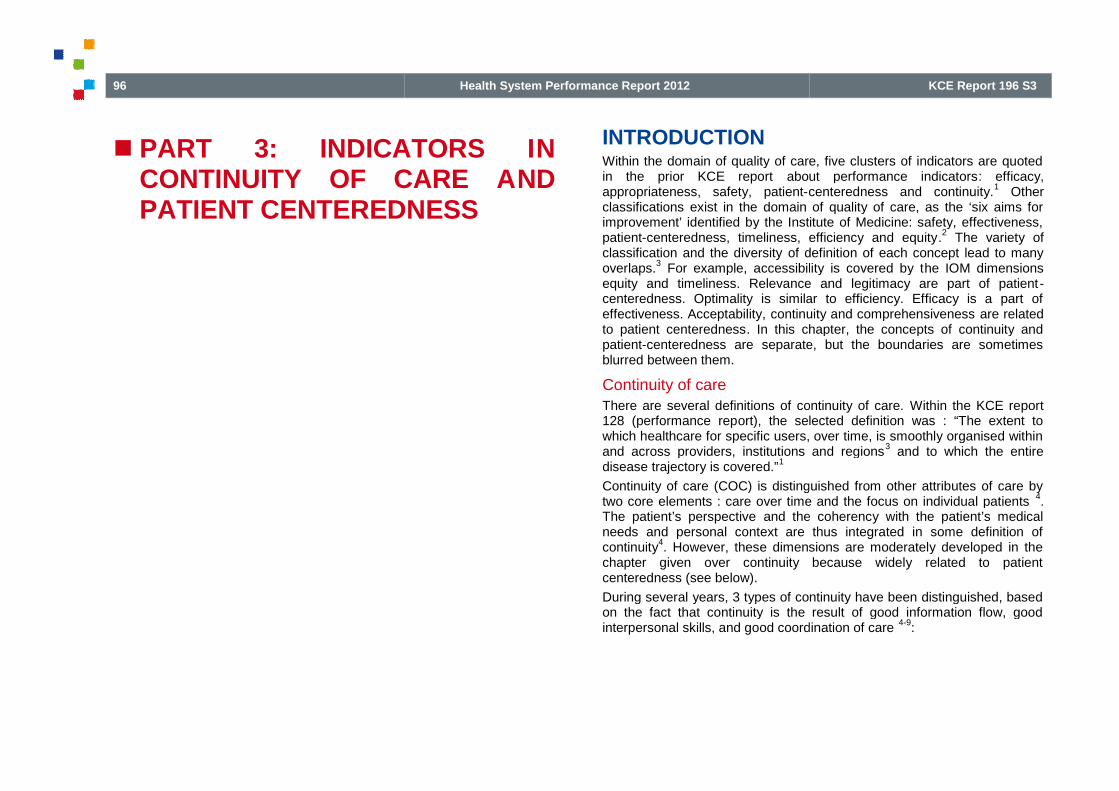
96
PART 3: INDICATORS ICONTINUITY OF CARE APATIENT CENTEREDNESS
Health System Performance Report 2012
PART 3: INDICATORS INCONTINUITY OF CARE ANDPATIENT CENTEREDNESS
INTRODUCTIONWithin the domain of quality of care, five clusters of indicators are quotedin the prior KCE report about performance indicatorsappropriateness, safety, patient-centeredness and continuity.classifications exist in the domain of quality of care, as the ‘six aims forimprovement’ identified by the Institute of Medicine: safety, effectiveness,patient-centeredness, timeliness, efficiency and equityclassification and the diversity of defoverlaps.
3For example, accessibility is covered by t
equity and timeliness. Relevance and legitimacy are part of patientcenteredness. Optimality is similar to efficiency. Efficacy is a part ofeffectiveness. Acceptability, continuity and comprehensivenessto patient centeredness. In this chapter, the concepts of continuity andpatient-centeredness are separate, but the boundaries are sometimesblurred between them.
Continuity of careThere are several definitions of continuity of care.128 (performance report), the selected definition was : “The extent towhich healthcare for specific users, over time, is smoothly organised withinand across providers, institutions and regionsdisease trajectory is covered.”
1
Continuity of care (COC) is distinguished from other attributes of care bytwo core elements : care over time and the focus on individual patientsThe patient’s perspective and the coherency with the patient’s medicalneeds and personal context are thus integrated in some definition ofcontinuity
4. However, these dimensions are moderately developed in the
chapter given over continuity because widely related to patientcenteredness (see below).
During several years, 3 types of continuity have been distinguished, basedon the fact that continuity is the result of good information flow, goodinterpersonal skills, and good coordination of care
KCE Report 196 S3
Within the domain of quality of care, five clusters of indicators are quotedabout performance indicators: efficacy,
centeredness and continuity.1
Otherexist in the domain of quality of care, as the ‘six aims for
improvement’ identified by the Institute of Medicine: safety, effectiveness,centeredness, timeliness, efficiency and equity.
2The variety of
of definition of each concept lead to manyFor example, accessibility is covered by the IOM dimensions
equity and timeliness. Relevance and legitimacy are part of patient -centeredness. Optimality is similar to efficiency. Efficacy is a part of
continuity and comprehensiveness are related. In this chapter, the concepts of continuity and
centeredness are separate, but the boundaries are sometimes
There are several definitions of continuity of care. Within the KCE reportort), the selected definition was : “The extent to
which healthcare for specific users, over time, is smoothly organised withinand across providers, institutions and regions
3and to which the entire
Continuity of care (COC) is distinguished from other attributes of care bytwo core elements : care over time and the focus on individual patients
4.
and the coherency with the patient’s medicalneeds and personal context are thus integrated in some definition of
. However, these dimensions are moderately developed in thechapter given over continuity because widely related to patient
During several years, 3 types of continuity have been distinguished, basedon the fact that continuity is the result of good information flow, goodinterpersonal skills, and good coordination of care
4-9:

KCE Report 196S3
Informational continuity : availability and use of data from priorevents during current patient encounters; information links care fromone provider to another and from one health event to another. Someauthors make a distinction between informational continuity and teamcontinuity, the last focusing on the good communication across a teamof professionals or services.
6
Management continuity: coherent delivery of care from differentproviders (often focus on care plan for specific, chronic healthproblem).The measures of this aspect of contboundaries of quality of medical care (focusing on compliance withmanagement protocols).
9
Relational continuity: an ongoing relationship between patients andone or more providers that connects care over time and bridgesdiscontinuous events (mainly for primary care and mental health care).This relational continuity is also defined as a therapeutic relationshipbetween a patient and one or more providers that spans varioushealth care events and results in accumulated knowledge of thepatient and care consistent with the patient’s needs.
Therefore, these concepts overlap and some authors propose othercategories:
6,
“Seamless care” or “coordinated care” which involves integration,coordination and shared information between probetween provider organisations.
6Coordination encompasses what
others have described as “informational continuity”, ‘team continuity”and “management continuity”.
11Transitional care is a part of it as a
“set of actions designed to ensure the coordination and continuity ofcare as patient transfer between different locations or different levelsof care within the same location”.
12
“Longitudinal continuity” with an identified professionalobjective fact of repeated consultations over time with a fas possible.
6
“Continuous caring relationship” or “patientrelationship” : the subjective experience of a caring relationshipbetween patient and doctor.
6
Health System Performance Report 2012
: availability and use of data from priorevents during current patient encounters; information links care fromone provider to another and from one health event to another. Someauthors make a distinction between informational continuity and team
ity, the last focusing on the good communication across a team
: coherent delivery of care from differentproviders (often focus on care plan for specific, chronic healthproblem).The measures of this aspect of continuity can overstep theboundaries of quality of medical care (focusing on compliance with
: an ongoing relationship between patients andone or more providers that connects care over time and bridges
inly for primary care and mental health care).This relational continuity is also defined as a therapeutic relationshipbetween a patient and one or more providers that spans varioushealth care events and results in accumulated knowledge of the
d care consistent with the patient’s needs.10
Therefore, these concepts overlap and some authors propose other
which involves integration,between professionals or
Coordination encompasses whatothers have described as “informational continuity”, ‘team continuity”
ansitional care is a part of it as a“set of actions designed to ensure the coordination and continuity ofcare as patient transfer between different locations or different levels
identified professional : thefact of repeated consultations over time with a few doctors
“Continuous caring relationship” or “patient-professionalexperience of a caring relationship
Patient-centerednessThere are also several definitions of patientinterconnecting components. In the KCE reports 128 and 41selected definition of patient-centrespectful of and responsive to individual patient preferences, needs, andvalues, and ensuring that patient values guide all clinical decisions’
According to the Institute of Medicine, patient“Health care that establishes a partnership among practitioners, patients,and their families (when appropriatpatients’ wants, needs, and preferences and that patients have theeducation and support they need to make decisions and participate in theirown care”.
15
Responsiveness and patient-centeredness are often taken to beequivalent.
3, 16. Some authors talk about “people
patient-centred care.17
Several attributes is given to patientinstance, we can find : access to care, patient engagement in care, clinicalinformation systems, care coordination, integratesongoing-routine patient feed-back, and publicly available information aboutpractices.
18For nursing (qualitative study), patient
associated by patients with individualising care, including the patient as apartner, respecting patient preferencesestablishing rapport, assuring care coordination and continuity, andpromptly attending to patients’ concerns and comfort.attributes show the overlap between conceptscenteredness and coordination or continuity. In the 8 dimensions ofpatient-centred care defined by the Picker approach, centeredness is alsorelated to accessibility, coordination and integration, transition andcontinuity.
19, 20
Therefore to avoid a repetition of performance indicator in theparts of this study, we focus on the specific element of centeredness, apart from continuity, coordination, accessibility and timeliness.
97
There are also several definitions of patient-centred care with manyecting components. In the KCE reports 128 and 41
1, 13, the
centeredness is “ ‘providing care that isrespectful of and responsive to individual patient preferences, needs, andvalues, and ensuring that patient values guide all clinical decisions’
14.
According to the Institute of Medicine, patient-centeredness is defined as :“Health care that establishes a partnership among practitioners, patients,and their families (when appropriate) to ensure that decisions respectpatients’ wants, needs, and preferences and that patients have theeducation and support they need to make decisions and participate in their
centeredness are often taken to be. Some authors talk about “people-centred” rather than
Several attributes is given to patient-centered care. For primary care bywe can find : access to care, patient engagement in care, clinical
information systems, care coordination, integrates-comprehensive care,back, and publicly available information about
For nursing (qualitative study), patient-centered care isassociated by patients with individualising care, including the patient as apartner, respecting patient preferences, displaying a caring approach,establishing rapport, assuring care coordination and continuity, andpromptly attending to patients’ concerns and comfort.
19These different
attributes show the overlap between concepts, mainly betweencenteredness and coordination or continuity. In the 8 dimensions of
centred care defined by the Picker approach, centeredness is alsorelated to accessibility, coordination and integration, transition and
Therefore to avoid a repetition of performance indicator in the differentparts of this study, we focus on the specific element of centeredness, apart from continuity, coordination, accessibility and timeliness.

98
1. OBJECTIVESThe objectives of the literature review on continuity and paticare indicators are:
1. To gather information on the indicators used in other countries
2 To help for the choice of a restricted number of indicators in Belgium
2. METHODS Literature review: search for published indicators
o A search in the indexed literature oncentred care indicators was completed using the Medline (Ovid)and Embase databases. The concepts of performancemeasurement, continuity and patient-centred carepolicies were approached by a search strategterms for each concept (see chapter 3.4).to articles published since 2000 in English, French or Dutch.articles were retrieved and scanned on title and/or abstract. Thecriteria to exclude articles were: out of scope,different context (developing countries).
o 17 additional published articles were found by “handsearching”.
o Beside this search in the indexed literature, a search onand patient-centred care indicators in the grey literature wasperformed in 13 national and international websites providinghealth-related indicators (WHO- OECD, National Institute forPublic Health and the Environment of Dutch, Agency forHealthcare Research and Quality, JCAHO…).
Extraction and selection of the indicators:
o The continuity and patient-centred care indicators werefrom the retained material and organised in 2 separated lists (onefor continuity of care and one for patientlists (see chapter 3.5) had been checked by 7 members of tresearch team (KCE-ISP-INAMI) with the aim of choosing 25indicators per topic, based on their relevanceindicators selected by the experts per topic varied between 16and 33.
Health System Performance Report 2012
continuity and patient-centred
1. To gather information on the indicators used in other countries
2 To help for the choice of a restricted number of indicators in Belgium
Literature review: search for published indicators
d literature on continuity and patient-indicators was completed using the Medline (Ovid)
and Embase databases. The concepts of performancecentred care and health
policies were approached by a search strategy using several). The search was limited
to articles published since 2000 in English, French or Dutch. 803articles were retrieved and scanned on title and/or abstract. The
out of scope, no indicator, too
dditional published articles were found by “handsearching”.
Beside this search in the indexed literature, a search on continuityindicators in the grey literature was
international websites providingOECD, National Institute for
Public Health and the Environment of Dutch, Agency forHealthcare Research and Quality, JCAHO…).
centred care indicators were extractedand organised in 2 separated lists (one
continuity of care and one for patient-centeredness). Thesechecked by 7 members of the
INAMI) with the aim of choosing 25relevance. The number of
indicators selected by the experts per topic varied between 16
o On this basis, an intermediate list of indicators was constiwith 54 indicators for continuity of care and 55 indicators forpatient-centeredness. The criteriselection by minimum 2 expertsonly, but encompassing a specific dimensionpatient-centeredness.
o An expert panel was formed with extern experts. Because of theoverlap of several item in the 2 topics, only one panel wasconstituted for both continuity and patientexperts who were known for their expertise inpatient-centeredness were contacted. 10 have confirmed theirinterest in the project. Finally,panel was charged with reviewing and evaluating the indicators. Aproposition of missing indicators was also stimumeeting were organised (on November and December 2011)obtain an agreement on a short list of max 15 indicators by topic.
KCE Report 196 S3
On this basis, an intermediate list of indicators was constitutedfor continuity of care and 55 indicators for
The criteria to retain an indicator were the2 experts OR the selection by one expert
encompassing a specific dimension of continuity or
An expert panel was formed with extern experts. Because of theoverlap of several item in the 2 topics, only one panel wasconstituted for both continuity and patient-centeredness. 13experts who were known for their expertise in continuity or
centeredness were contacted. 10 have confirmed theirinterest in the project. Finally, 8 have really participated. Thepanel was charged with reviewing and evaluating the indicators. Aproposition of missing indicators was also stimulated. Twomeeting were organised (on November and December 2011) toobtain an agreement on a short list of max 15 indicators by topic.

KCE Report 196S3
3. RESULTS
3.1. Indicators extracted from the literature review
Figure 1 Flowchart with amount of included and excluded articles,and exclusion criteria
Potentially relevant citations
identified: 803
Additional potentially relevant
citations (hand searching):33
Based on title and abstract
evaluation, citations excluded:
Reasons:
Population
Intervention
Outcome
Design
Language
no indicators measured
out of scope
Other 3
Other 4
Other 5
Studies retrieved for more
detailed evaluation:175
Based on full text evaluation,
studies excluded:
Reasons:
Population
Intervention
Outcome
Design
Language
no indicators measured
out of scopeOther 3
Other 4
Other 5
Relevant studies: 85
Health System Performance Report 2012
Indicators extracted from the literature review
uded and excluded articles,
To the 803 articles identified for continuity and centeredness, 33 wereadded by hand searching. From this amount, 661 were eliminated on thebasis of titles and abstracts. From the 175 articleson the basis of the full text. The reasons for exclusion can be found in theflow chart above.
By the end of October, some 212 indicators related topatient-centred care were extracted from the literature search
3.2. ContinuityThere is no consensus among the published literature about what shouldcomprise COC indices but it’s clear that no index is wholly inclusive allfacets of continuity.
21. Multiples measures are needed to capture all
aspects of continuity, some being more useful in some contexts thanothers.
9
The three type of indicators are distinguished : structure, process andoutcome. A categorisation is made on the basis of van Walraeven reviwhich distinguishes the measure of 3 types of continuity for the process(informational, management and provider) and 4 types of outcomes. In theprocess indicators category, we added 2 domains: the broader concept ofcoordination and a separate classe of patient’s perception questionnaire.Some outcome indicators are quoted but few result from an interventionimproving continuity of care .
1. Structure
2. Process
Informational continuity : this can be measured for medical history,medication or test use;
Management continuity : follow up plan (from one provider group toanother) and transition plan (from one organisation to another)
Provider or relational or longitudinal continuitylink with a same provider ; duration of care with thediversity of providers ; sequence of care ; link between family andprovider;
Coordination : collaboration between primary care provider andspecialists ; collaboration between physicians and nurses ;collaboration intra clinic, intra-teamwith other concepts of quality ; integrated care pathways.
Based on title and abstract
evaluation, citations excluded: 661
Reasons:
Population 27
Intervention 0
Outcome 75
Design 68
Language 0
no indicators measured 4
out of scope 477
Other 3 2
Other 4 0
Other 5 0
Based on full text evaluation,
studies excluded: 90
Reasons:
Population 1
Intervention 0
Outcome 21
Design 8
Language 0
no indicators measured 30
out of scope 17Other 3 5
Other 4 0
Other 5 0
99
To the 803 articles identified for continuity and centeredness, 33 wereadded by hand searching. From this amount, 661 were eliminated on thebasis of titles and abstracts. From the 175 articles selected, 85 remainedon the basis of the full text. The reasons for exclusion can be found in the
indicators related to continuity and 248 towere extracted from the literature search
There is no consensus among the published literature about what shouldcomprise COC indices but it’s clear that no index is wholly inclusive all
. Multiples measures are needed to capture allaspects of continuity, some being more useful in some contexts than
The three type of indicators are distinguished : structure, process andoutcome. A categorisation is made on the basis of van Walraeven review
5
which distinguishes the measure of 3 types of continuity for the process(informational, management and provider) and 4 types of outcomes. In theprocess indicators category, we added 2 domains: the broader concept of
te classe of patient’s perception questionnaire.quoted but few result from an intervention
: this can be measured for medical history,
: follow up plan (from one provider group toanother) and transition plan (from one organisation to another)
9);
Provider or relational or longitudinal continuity : place of primary care ;; duration of care with the same provider ;
diversity of providers ; sequence of care ; link between family and
: collaboration between primary care provider andspecialists ; collaboration between physicians and nurses ;
team ; overall coordination; or mixedwith other concepts of quality ; integrated care pathways.

100
3. Outcome
Clinical
Resource utilisation
Treatment plan compliance
Patient satisfaction: This part quoted several instruments withoutdetails because a description of each item of all of this instrumentencompasses broadly the scope of this study.
Each indicator has been classified according to 2 categories:
The level of care assessed : health care system level; institution level;provider level;
The focus of the measurement : generic (comprehensive, assessingthe overall impact independently of specific disease typeversus disease-specific measures (related to a given medicalcondition).
All continuity measure are classified as objective (quantitativsubjective (included patient-reported assessments of continuity) accordingto the type of data gathered.
5
The aspect “patient-centeredness” of care are treated in the correspondingchapter.
3.3. CenterednessThe need for multiple measures to assess the patientoutlined by several authors.
2, 22Furthermore, there is a difficulty to
measure the “patient-centeredness’” within a quantitative paradigm,notably because this concept may have less to do with the relative quantityof specific behaviours than with the doctor’s ability to successfully matchcommunication style to the particular needs of the
The two main methodological approaches used to measure patientcare are thus based on
24:
Self-report measures of doctors’ patientinitiatives around the world are collecting and comparing data onpatients’ experience of care in healthcare organisation.
External observation of consultation process: rating scales or verbalbehaviour coding system.
Health System Performance Report 2012
Patient satisfaction: This part quoted several instruments withouteach item of all of this instrument
encompasses broadly the scope of this study.
Each indicator has been classified according to 2 categories:
he level of care assessed : health care system level; institution level;
measurement : generic (comprehensive, assessingdently of specific disease type or treatment)
specific measures (related to a given medical
All continuity measure are classified as objective (quantitative indexes) orreported assessments of continuity) according
centeredness” of care are treated in the corresponding
to assess the patient-centeredness care isFurthermore, there is a difficulty to
hin a quantitative paradigm,notably because this concept may have less to do with the relative quantityof specific behaviours than with the doctor’s ability to successfully matchcommunication style to the particular needs of the patient.
23
gical approaches used to measure patient-centred
report measures of doctors’ patient-centeredness. Majorinitiatives around the world are collecting and comparing data onpatients’ experience of care in healthcare organisation.
25
External observation of consultation process: rating scales or verbal
For each attribute of patient-centeredness,measures exist including by instance patients’ perception of doctors skill incommunication; patient scale in empowerment; patients’ satisfaction… Inot in our purpose to describe each existing questionnaire.because found in several articles or because used in a international level,are in appendix. For others, only titles and references are quoted in thetable below.
The result are presented for the 3 types of indicators : structure, processand outcomes. According to the centeredness defdistinguished several domains of structure andThe outcome indicators are poorly developedintervention. They have to be taken with caution.
1. Structure
Acknowledgement of patients needs, wants, preferenceright ; privacy ; comfort preference.
Providers skill of communication
Patients and carers involvement (enabling patients to manage theircare and to make informed decisions about their treatment options):patient information; inform consent;patients involvement in service & delivery planning; patientsinvolvement in quality improvement
2. Process
Acknowledgement of patients needsright ; patients’ needs ; preference of care ; pain management ;privacy ; spiritual support ; cultural needs ; patients’ strengths ;psycho-social aspects ; comfort ; social support.
Providers skill of communication : propatients carefully; providers ability to explain things clearly;courtesy/respect; spent enough time to their patient; emotional supportto relieve fear and anxiety; language; global communication skills;poor communication.
Patients and carers involvement (enabling patients to manage theircare and to make informed decisions about their treatment options):patients/carers information; inform consent; self
KCE Report 196 S3
centeredness, many patients self-reportincluding by instance patients’ perception of doctors skill in
communication; patient scale in empowerment; patients’ satisfaction… It isnot in our purpose to describe each existing questionnaire. Some of them,
les or because used in a international level,are in appendix. For others, only titles and references are quoted in the
The result are presented for the 3 types of indicators : structure, processand outcomes. According to the centeredness def inition, we havedistinguished several domains of structure and process indicators.
10, 15, 26-28
The outcome indicators are poorly developed for patient-centredintervention. They have to be taken with caution.
Acknowledgement of patients needs, wants, preference : patients’right ; privacy ; comfort preference.
Providers skill of communication : response to language need.
Patients and carers involvement (enabling patients to manage theirinformed decisions about their treatment options):
information; inform consent; global patients involvement;service & delivery planning; patients
involvement in quality improvement.
Acknowledgement of patients needs, wants, preference : patients’right ; patients’ needs ; preference of care ; pain management ;privacy ; spiritual support ; cultural needs ; patients’ strengths ;
social aspects ; comfort ; social support.
Providers skill of communication : providers ability to listen theirpatients carefully; providers ability to explain things clearly;courtesy/respect; spent enough time to their patient; emotional supportto relieve fear and anxiety; language; global communication skills;
Patients and carers involvement (enabling patients to manage theircare and to make informed decisions about their treatment options):
information; inform consent; self-management support;

KCE Report 196S3
patients/carers involvement in services and deliverparticipation in decision or shared decision-making.
Global centeredness process indicators or mixquality.
3. Outcome
Empowerment
Clinical
Resource utilisation
Treatment plan compliance
Patient satisfaction. This part quoted several instruments withoutdetails because a description of each item of all of this instrumentencompasses broadly the scope of this study. Therefore,reservations have been raised about the validity of both conceptmeasures of satisfaction.
29, 30
Health System Performance Report 2012
patients/carers involvement in services and delivery planning; patients’making.
Global centeredness process indicators or mixed with other domain of
part quoted several instruments withoutdetails because a description of each item of all of this instrumentencompasses broadly the scope of this study. Therefore, seriousreservations have been raised about the validity of both concepts and
Each indicator has been classified according to 2 categories:
The level of care assessed : health care system level; institution level;provider level;
The focus of the measurement : generic (comprehensive, assessingthe overall impact independently of specific disease type or treatment)versus disease-specific measures (related to a given medicalcondition).
The type of data, objective or subjective, is also given.
The aspect “continuity and secure transition between health careproviders” and the aspect “coordination of care” are treated in thecorresponding chapter.
101
Each indicator has been classified according to 2 categories:
The level of care assessed : health care system level; institution level;
The focus of the measurement : generic (comprehensive, assessingthe overall impact independently of specific disease type or treatment)
specific measures (related to a given medical
subjective, is also given.
The aspect “continuity and secure transition between health careproviders” and the aspect “coordination of care” are treated in the

102
3.3.1. Selected indicators
An amount of 12 indicators for the dimension continuity of care and 8 indicators for the dimension patient centeredness were selected (see ta
Table 7 Selected indicators for the dimension continuity
Category
Informational continuity - structure
Informational continuity (medical history) - process
Informational continuity (medication) - process
Informational continuity(tests) - process
Management continuity - process
Relational continuity - process
Health System Performance Report 2012
indicators for the dimension continuity of care and 8 indicators for the dimension patient centeredness were selected (see ta
Selected indicators for the dimension continuity
Indicators
% practices with EMR that allows sharing the data : internal coordination(problem list, ambulatory visits, medication lists, laboratory findings,medication-ordering reminders, drug interaction, radiology findings); externalcoordination, including out of hours (GPs & pharmacist, specialist,physiotherapist, dietetician…)
process % patients whose the specialist consultation was referred by GP’s letters.
process % patients for which information on medication prescribed at outpatientclinics, hospital wards, and outside the hospital is accessible at outpatientclinics, hospital wards, the hospital pharmacy and outside the hospital.
% chronically ill people for who they are problems with the coordination ofcare: test results not available at time of doctor’s appointment, or duplicationof tests.
% patients, regardless of age, discharged from an hospital to ambulatory careor home health care, or their caregiver(s), who received a transition record atthe time of discharge including, at a minimum, all of specified elements:
Major procedures and tests performed during hospital vi
Principal diagnosis at discharge OR chief complaint, AND
Patient instructions, AND
Plan for follow-up care (OR statement that none required), includingprimary physician, other health care professional, or site designated forfollow-up care, AND
List of new medications and changes to continued medications thatpatient should take after discharge, with quantity prescribed and/ordispensed (OR intended duration) and instructions for each
% of individuals with a GMD / all citizen
KCE Report 196 S3
indicators for the dimension continuity of care and 8 indicators for the dimension patient centeredness were selected (see ta ble below)
% practices with EMR that allows sharing the data : internal coordination(problem list, ambulatory visits, medication lists, laboratory findings,
ordering reminders, drug interaction, radiology findings); externalation, including out of hours (GPs & pharmacist, specialist,
% patients whose the specialist consultation was referred by GP’s letters.
% patients for which information on medication prescribed at outpatientclinics, hospital wards, and outside the hospital is accessible at outpatientclinics, hospital wards, the hospital pharmacy and outside the hospital.
% chronically ill people for who they are problems with the coordination ofcare: test results not available at time of doctor’s appointment, or duplication
discharged from an hospital to ambulatory careor home health care, or their caregiver(s), who received a transition record atthe time of discharge including, at a minimum, all of specified elements:
Major procedures and tests performed during hospital visit, AND
Principal diagnosis at discharge OR chief complaint, AND
up care (OR statement that none required), includingprimary physician, other health care professional, or site designated for
List of new medications and changes to continued medications thatpatient should take after discharge, with quantity prescribed and/ordispensed (OR intended duration) and instructions for each
all citizen

KCE Report 196S3
Relational continuity - process
Coordination - process
Coordination / timeliness - process
Coordination - process
Coordination - process
Coordination - outcome
Table 8 Selected indicators for the dimension centeredness
Category
Acknowledgement of patients needs, wants, preferences, values(patients’ right)- structure
Providers skills of communication (language need)
Patients and carers involvement in management & decision of carestructure
Acknowledgement of patients needs, wants, preferences, values(patients’ preference)- process
Acknowledgement of patients needs, wants, preferences, values (painmanagement)- process
Providers skill of communication - process
Health System Performance Report 2012
UPC= proportion of consultations that were conducted by the professionalconsulted most frequently
Proportion of breast cancer women discussed at the multidisciplinary team(MDT) meeting
Proportion of women with class (3), 4 or 5 abnormal mammograms who haveat least one of the following procedure within 2 months after communicationof the screening result : mammography, ultrasound, finepercutaneous biopsy
% of patients with diabetes or renal failure registered in a care pathway.
% of CT patients with care pathways who meet the target of consulting theirCT GP (or a GP of the practice of the CT GP) or CT specialist at least 4 timesin the period 01/01/2010 - 31/12/2010
Potentially avoidable emergency department encounters for asthma amongadults and children / population
Selected indicators for the dimension centeredness
Indicators
Acknowledgement of patients needs, wants, preferences, values Existence of a clear process for filing or managing complaints
communication (language need) - structure % d'hôpitaux implantés dans les grandes villes avec service linguistique ouqui ont une collaboration organisée avec un service linguistique
Patients and carers involvement in management & decision of care - % hospitals with internal quality improvement including monitoring patientsviews
Acknowledgement of patients needs, wants, preferences, values the number of terminally ill patients (or patients with end stage disease)whom the patients’ preferences for care are documented in the medicalrecord
Acknowledgement of patients needs, wants, preferences, values (pain % adult inpatients who reported that their pain level was assessed
% of care users who reported that:
103
UPC= proportion of consultations that were conducted by the professional
Proportion of breast cancer women discussed at the multidisciplinary team
Proportion of women with class (3), 4 or 5 abnormal mammograms who haveat least one of the following procedure within 2 months after communicationof the screening result : mammography, ultrasound, fine-needle aspiration, or
% of patients with diabetes or renal failure registered in a care pathway.
% of CT patients with care pathways who meet the target of consulting theirpractice of the CT GP) or CT specialist at least 4 times
Potentially avoidable emergency department encounters for asthma among
Existence of a clear process for filing or managing complaints
% d'hôpitaux implantés dans les grandes villes avec service linguistique ouqui ont une collaboration organisée avec un service linguistique
% hospitals with internal quality improvement including monitoring patients
the number of terminally ill patients (or patients with end stage disease) forwhom the patients’ preferences for care are documented in the medical
% adult inpatients who reported that their pain level was assessed

104
Patients and carers involvement in management & decision of careprocess
Outcome
3.4. Continuity and patient-centred care : Search Strategy
3.4.1. OVID MEDLINE for continuity of care
Description :
Database: Ovid Medline
Description This search is based on the 5th step described in the document of Koen Van den Heed (“SEARCH
15032011.doc”). The “step 5 search” has been adapted to the domain of continuity of care.
The Mesh term used was “Continuity of Patient Car
continuing basis from the initial contact, following through all phases of medical care. In primary health care in the
Tree.
Name of the search PerformanceContinuityHPolicy
Date of the last run: 29/04/2011
Health System Performance Report 2012
Care providers listened carefully
They were given understandable information by care providers
They were treated politely by care providers
Care providers spent enough time with them
Care providers respected what they had to say
Patients and carers involvement in management & decision of care - % of care users who reported that: the doctor/nurse/allied health professionalinvolved them as much as they wanted to in decisions abouttreatment
% of population above 15 years old who report to be satisfied with healthcareservices
centred care : Search Strategy
care
Ovid Medline
This search is based on the 5th step described in the document of Koen Van den Heed (“SEARCH
15032011.doc”). The “step 5 search” has been adapted to the domain of continuity of care.
The Mesh term used was “Continuity of Patient Care”, Year of Entry : 91 (75), SCOPE: Health care provided on a
continuing basis from the initial contact, following through all phases of medical care. In primary health care in the
PerformanceContinuityHPolicy
29/04/2011
KCE Report 196 S3
They were given understandable information by care providers
They were treated politely by care providers
Care providers spent enough time with them
providers respected what they had to say
% of care users who reported that: the doctor/nurse/allied health professionalinvolved them as much as they wanted to in decisions about their care and
% of population above 15 years old who report to be satisfied with healthcare
This search is based on the 5th step described in the document of Koen Van den Heed (“SEARCH -MEDILINE-MH-
15032011.doc”). The “step 5 search” has been adapted to the domain of continuity of care.
e”, Year of Entry : 91 (75), SCOPE: Health care provided on a
continuing basis from the initial contact, following through all phases of medical care. In primary health care in the
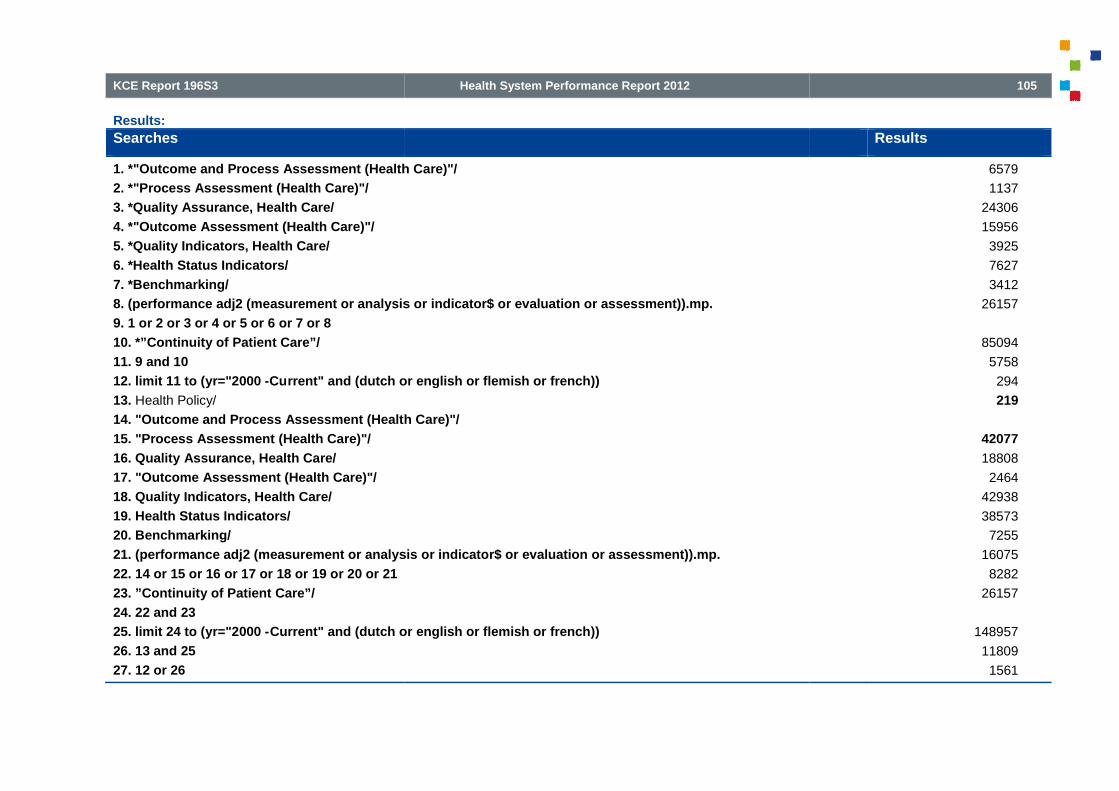
KCE Report 196S3
Results:
Searches
1. *"Outcome and Process Assessment (Health Care)"/
2. *"Process Assessment (Health Care)"/
3. *Quality Assurance, Health Care/
4. *"Outcome Assessment (Health Care)"/
5. *Quality Indicators, Health Care/
6. *Health Status Indicators/
7. *Benchmarking/
8. (performance adj2 (measurement or analysis or indicator$ or evaluation or assessment)).mp.
9. 1 or 2 or 3 or 4 or 5 or 6 or 7 or 8
10. *”Continuity of Patient Care”/
11. 9 and 10
12. limit 11 to (yr="2000 -Current" and (dutch or english or flemish or french))
13. Health Policy/
14. "Outcome and Process Assessment (Health Care)"/
15. "Process Assessment (Health Care)"/
16. Quality Assurance, Health Care/
17. "Outcome Assessment (Health Care)"/
18. Quality Indicators, Health Care/
19. Health Status Indicators/
20. Benchmarking/
21. (performance adj2 (measurement or analysis or indicator$ or evaluation or assessment)).mp.
22. 14 or 15 or 16 or 17 or 18 or 19 or 20 or 21
23. ”Continuity of Patient Care”/
24. 22 and 23
25. limit 24 to (yr="2000 -Current" and (dutch or english or flemish or french))
26. 13 and 25
27. 12 or 26
Health System Performance Report 2012
1. *"Outcome and Process Assessment (Health Care)"/
8. (performance adj2 (measurement or analysis or indicator$ or evaluation or assessment)).mp.
rrent" and (dutch or english or flemish or french))
14. "Outcome and Process Assessment (Health Care)"/
21. (performance adj2 (measurement or analysis or indicator$ or evaluation or assessment)).mp.
Current" and (dutch or english or flemish or french))
105
Results
6579
1137
24306
15956
3925
7627
3412
26157
85094
5758
294
219
42077
18808
2464
42938
38573
7255
16075
8282
26157
148957
11809
1561

106
3.4.2. OVID MEDLINE for patient-centered care
Description :
Database: Ovid Medline
Description This search is based on the 5th step described in the document of Koen Van den Heed (“SEARCH
15032011.doc”). The “step 5 search” has been adapted
The Mesh term used was “Patient
institutional resources and personnel are organized around patients rather than around specialized department
primary health care also in the Tree.
Name of the search PerformanceCenteredHPolicy
Date of the last run: 29/04/2011
Health System Performance Report 2012
centered care
Ovid Medline
This search is based on the 5th step described in the document of Koen Van den Heed (“SEARCH
15032011.doc”). The “step 5 search” has been adapted to the domain of patient
The Mesh term used was “Patient-Centered Care”, Year of Entry : 95, SCOPE: Design of patient care wherein
institutional resources and personnel are organized around patients rather than around specialized department
primary health care also in the Tree.
PerformanceCenteredHPolicy
29/04/2011
KCE Report 196 S3
1080
23
242
This search is based on the 5th step described in the document of Koen Van den Heed (“SEARCH -MEDLINE-MH-
to the domain of patient-centered care.
Centered Care”, Year of Entry : 95, SCOPE: Design of patient care wherein
institutional resources and personnel are organized around patients rather than around specialized department s. In

KCE Report 196S3
Results :
Searches
1. *"Outcome and Process Assessment (Health Care)"/
2. *"Process Assessment (Health Care)"/
3. *Quality Assurance, Health Care/
4. *"Outcome Assessment (Health Care)"/
5. *Quality Indicators, Health Care/
6. *Health Status Indicators/
7. *Benchmarking/
8. (performance adj2 (measurement or analysis or indicator$ or evaluation or assessment)).mp.
9. 1 or 2 or 3 or 4 or 5 or 6 or 7 or 8
10. *Patient-Centered Care/
11. 9 and 10
12. limit 11 to (yr="2000 -Current" and (dutch or english or flemish or french))
13. Health Policy/
14. "Outcome and Process Assessment (Health Care)"/
15. "Process Assessment (Health Care)"/
16. Quality Assurance, Health Care/
17. "Outcome Assessment (Health Care)"/
18. Quality Indicators, Health Care/
19. Health Status Indicators/
20. Benchmarking/
21. (performance adj2 (measurement or analysis or indicator$ or evaluation or asse
22. 14 or 15 or 16 or 17 or 18 or 19 or 20 or 21
23. Patient-Centered Care/
24. 22 and 23
25. limit 24 to (yr="2000 -Current" and (dutch or english or flemish or french))
26. 13 and 25
27. 12 or 26
Health System Performance Report 2012
1. *"Outcome and Process Assessment (Health Care)"/
8. (performance adj2 (measurement or analysis or indicator$ or evaluation or assessment)).mp.
Current" and (dutch or english or flemish or french))
14. "Outcome and Process Assessment (Health Care)"/
21. (performance adj2 (measurement or analysis or indicator$ or evaluation or assessment)).mp.
Current" and (dutch or english or flemish or french))
107
Results
6579
1137
24306
15956
3925
7627
3412
26157
85094
4061
266
203
42077
18808
2464
42938
38573
7255
16075
8282
26157
148957
7161
1209

108
3.4.3. Embase for continuity of care and patient
Description:
Database: Embase
Description This search is based on the document of Françoisehas been adapted to the domain of continuity of care (and patient centered
In Emtree, the synonym of “continuity of care” is “patient care”. This term was added to Emtree in 1974. It is alssynonym of patient
Synonyms are : advance care planning; care, continuity of; continuity of care; continuity of patient care; episode ofcare; night care; patientpatient management.
“Outcome assessment” was added to Emtree in 2006. Synonyms are: outcome assessment (health care); outcomemeasurement.
“Health care quality” was added to Emtree in 1981. Synonyms are: clinical governance; health cacare evaluation mechanisms; health care quality, access, and evaluation; healthcare evaluation; healthcare quality;process assessment (health care); program evaluation; quality assurance, health care; quality indicators, health care;quality of care research; quality of health care; quality, health care. To explode.
“Health survey” was added to Emtree in 1974. Synonyms are : dental health surveys; dmf index; health caresurveillance, registration and quality control; health status indhealth. It was in tree of “Health care quality”.
“Quality control” was added to Emtree in 1974. Synonyms are: benchmarking; quality assessment; quality assurance;quality control chart.
“Performanc
Name of the search PerformanceContiCenter
Date of the last run: 29/04/2011
Health System Performance Report 2012
continuity of care and patient-centered care
Embase
This search is based on the document of Françoise Renard (“Embase strategy 20110407_HP5.notepad”). The searchhas been adapted to the domain of continuity of care (and patient centered-care).
In Emtree, the synonym of “continuity of care” is “patient care”. This term was added to Emtree in 1974. It is alssynonym of patient-centered care.
Synonyms are : advance care planning; care, continuity of; continuity of care; continuity of patient care; episode ofcare; night care; patient-centered care; patient care management; patient care team; patient helpepatient management.
“Outcome assessment” was added to Emtree in 2006. Synonyms are: outcome assessment (health care); outcomemeasurement.
“Health care quality” was added to Emtree in 1981. Synonyms are: clinical governance; health cacare evaluation mechanisms; health care quality, access, and evaluation; healthcare evaluation; healthcare quality;process assessment (health care); program evaluation; quality assurance, health care; quality indicators, health care;quality of care research; quality of health care; quality, health care. To explode.
“Health survey” was added to Emtree in 1974. Synonyms are : dental health surveys; dmf index; health caresurveillance, registration and quality control; health status indicators; health surveys; population surveillance; survey,health. It was in tree of “Health care quality”.
“Quality control” was added to Emtree in 1974. Synonyms are: benchmarking; quality assessment; quality assurance;quality control chart.
“Performance measurement system” was added in 2006.
PerformanceContiCenter
29/04/2011
KCE Report 196 S3
923
27
230
Renard (“Embase strategy 20110407_HP5.notepad”). The searchcare).
In Emtree, the synonym of “continuity of care” is “patient care”. This term was added to Emtree in 1974. It is als o the
Synonyms are : advance care planning; care, continuity of; continuity of care; continuity of patient care; episode ofcentered care; patient care management; patient care team; patient helper; patient isolation;
“Outcome assessment” was added to Emtree in 2006. Synonyms are: outcome assessment (health care); outcome
“Health care quality” was added to Emtree in 1981. Synonyms are: clinical governance; health ca re evaluation; healthcare evaluation mechanisms; health care quality, access, and evaluation; healthcare evaluation; healthcare quality;process assessment (health care); program evaluation; quality assurance, health care; quality indicators, health care;quality of care research; quality of health care; quality, health care. To explode.
“Health survey” was added to Emtree in 1974. Synonyms are : dental health surveys; dmf index; health careicators; health surveys; population surveillance; survey,
“Quality control” was added to Emtree in 1974. Synonyms are: benchmarking; quality assessment; quality assurance;
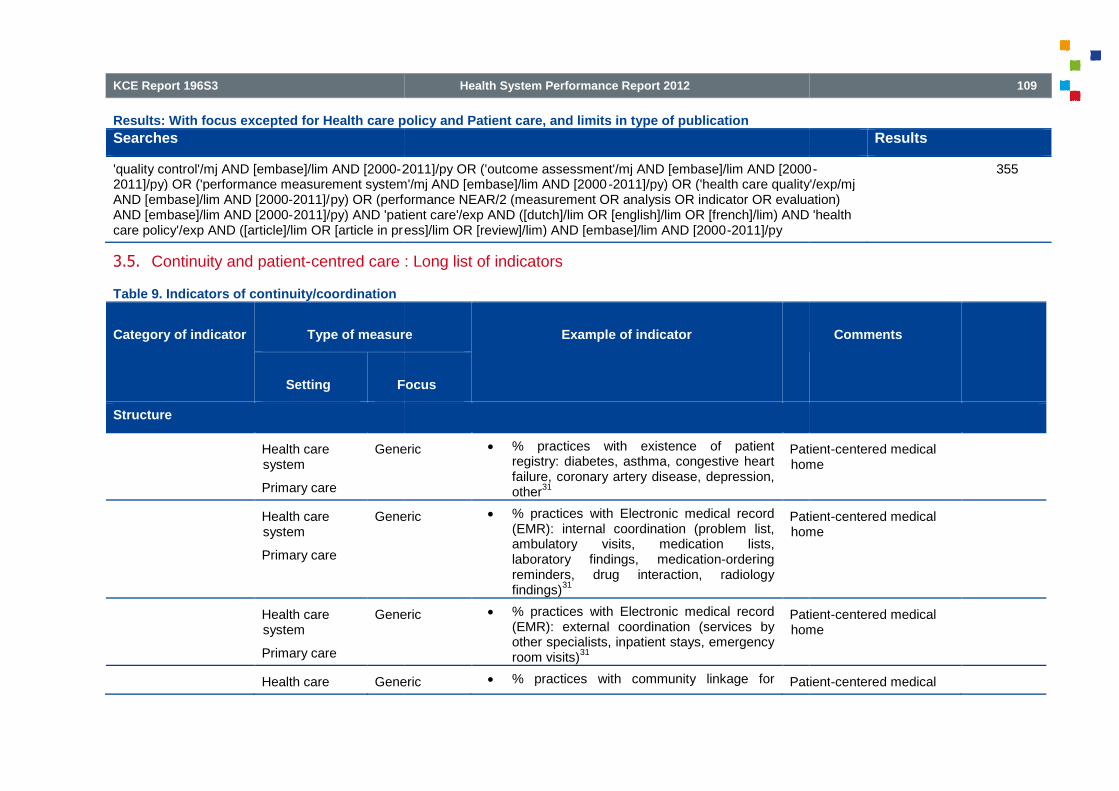
KCE Report 196S3
Results: With focus excepted for Health care policy and Patient care, and limits in type of publication
Searches
'quality control'/mj AND [embase]/lim AND [2000-2011]/py OR ('outcome assessment'/mj AND [embase]/lim AND [20002011]/py) OR ('performance measurement system'/mj AND [embase]/lim AND [2000AND [embase]/lim AND [2000-2011]/py) OR (performance NEAR/2 (measurement OR analysis OR indicator OR evaluation)AND [embase]/lim AND [2000-2011]/py) AND 'patient care'/exp AND ([dutch]/lim OR [english]/lim OR [french]/lim) AND 'healthcare policy'/exp AND ([article]/lim OR [article in press]/lim OR [review]/lim) AND [embase]/lim AND [2000
3.5. Continuity and patient-centred care : Long list of indicators
Table 9. Indicators of continuity/coordination
Category of indicator Type of measure
Setting Focus
Structure
Health caresystem
Primary care
Generic
Health caresystem
Primary care
Generic
Health caresystem
Primary care
Generic
Health care Generic
Health System Performance Report 2012
Results: With focus excepted for Health care policy and Patient care, and limits in type of publication
2011]/py OR ('outcome assessment'/mj AND [embase]/lim AND [20002011]/py) OR ('performance measurement system'/mj AND [embase]/lim AND [2000-2011]/py) OR ('health care quality'/exp/mj
py) OR (performance NEAR/2 (measurement OR analysis OR indicator OR evaluation)2011]/py) AND 'patient care'/exp AND ([dutch]/lim OR [english]/lim OR [french]/lim) AND 'health
ess]/lim OR [review]/lim) AND [embase]/lim AND [2000-2011]/py
centred care : Long list of indicators
Type of measure Example of indicator
Focus
Generic % practices with existence of patientregistry: diabetes, asthma, congestive heartfailure, coronary artery disease, depression,other
31
Patienthome
Generic % practices with Electronic medical record(EMR): internal coordination (problem list,ambulatory visits, medication lists,laboratory findings, medication-orderingreminders, drug interaction, radiologyfindings)
31
Patienthome
Generic % practices with Electronic medical record(EMR): external coordination (services byother specialists, inpatient stays, emergencyroom visits)
31
Patienthome
Generic % practices with community linkage for Patient
109
Results
2011]/py OR ('outcome assessment'/mj AND [embase]/lim AND [2000-2011]/py) OR ('health care quality'/exp/mj
py) OR (performance NEAR/2 (measurement OR analysis OR indicator OR evaluation)2011]/py) AND 'patient care'/exp AND ([dutch]/lim OR [english]/lim OR [french]/lim) AND 'health
355
Comments
Patient-centered medicalhome
Patient-centered medicalhome
Patient-centered medicalhome
Patient-centered medical

110
Category of indicator Type of measure
Setting Focus
Structure
system
Primary care
Health caresystem
Primary care
Generic
Health caresystem
Mental health
Health caresystem
Mental health
Health caresystem
Mental health
Health caresystem
Mental health
Health caresystem(regional)
Mental health
Health System Performance Report 2012
Type of measure Example of indicator
Focus
care31
home
Generic Information technology use amongprimary care physicians
32
Patient clinical information and officesystems among PCP
32
Comparison between 7countries
Parts of a physician s’questionnaire (parts inappendix)
Mental health Count and proportion of programs that havea process in place to follow clients throughthe continuum of services (cf Koen)
Mental health Existence of a fee-item within the fee-for-service schedule that reimburses physiciansfor case consultation/case managementactivities (cf Koen)
Mental health Proportion of physicians reimbursed throughnon-fee-for-service mechanisms (cf Koen)
Mental health Proportion of resources expended onservices that promote recovery (cf Koen)
Mental health Proportion of programs in a defined servicearea (e.g., county, city or state) that reporthaving integrated services (e.g., SUD andMHD services in the same treatmentprogram) or co-located services (e.g.,SUD
KCE Report 196 S3
Comments
home
Comparison between 7countries
Parts of a physician s’questionnaire (parts inappendix)

KCE Report 196S3
Category of indicator Type of measure
Setting Focus
Structure
Health caresystem(regional)
Mental health
Health caresystem(regional)
Mental
Institution Generic
Process
Informational continuity : measures related to the availability of documentation, the completeness of information transfer betweenproviders, and to the extent to which existing information is acknowledged or used by a provider
Medical historycontinuity
Health caresystem
Generic
Health caresystem
Generic
Health caresystem
Generic
Health System Performance Report 2012
Type of measure Example of indicator
Focus
and MHD services in the same location)(cfKoen)
Mental health Proportion of SUD providers in a definedservice area (e.g., county, city or state)reporting the ability to bill for MHD servicesprovided to patients (cf Koen)
Mental health Proportion of SUD specialty care settings ina defined service area (e.g., county, city orstate) that have formal documented referralpolicies for MHD services (cf Koen)
Generic Presence of a case-manager (or otherperson responsible for coordination of care)
9
measures related to the availability of documentation, the completeness of information transfer betweenproviders, and to the extent to which existing information is acknowledged or used by a provider or patient
9
Generic % patients who reported that they had to tellthe same story more than once
16Dutch performance
Generic % patients quoting that prior information areused by their providers
9
Generic % adult health plan members who reportedhow often their personal doctor seemed
NCQM (CAHPSquestionnaire; HEDIS)
111
Comments
measures related to the availability of documentation, the completeness of information transfer between
Dutch performance
NCQM (CAHPSquestionnaire; HEDIS)

112
Health caresystem
Generic
Children
Primary care Generic
Primary care Generic
Ambulatory care
Follow-up afterdischarge
Generic
Hospital
Discharge
Generic
Hospital
Discharge
Generic
Health System Performance Report 2012
informed and up-to-date about care they gotfrom other doctors or other healthproviders.
33
Generic
Children
% parents or guardians who reported howoften their child's personal doctor seemedinformed and up-to-date about the care theirchild got from other doctors or healthproviders.
33
NCQM (CAHPSquestionnaire; HEDIS)
Generic % patient with medical records from a priorcare source (or request for such medicalrecords) in the outpatient medical record /patient new to a primary care practice
34
Focus on vulnerable elders(ACOVE)
Modified indicator
Generic Confidence that if patient needs to see analternate physician, the regular physician willreceive information about this visit
35
5 item from the Primary care assessment tool(PCAT-AE)
No details given
Generic % patients with physician visit or telephonecontact documented within 6 weeks ofdischarge and acknowledgement of therecent hospitalisation in the medical record /patient discharged from a hospital to homeand surviving 6 weeks or longer afterdischarge
34
Focus on vulnerable elders(ACOVE)
Modified indicator
Generic % outpatient for which the referringphysician’s medical record acknowledge theconsultant’s recommendation (or why theconsultation did not occur) / patient referredto a consultant and revisiting the referringphysician
34
Focus on vulnerable elders(ACOVE)
Modified indicator
Generic % patient with information noted on visit ortreatment in the medical record (taken orpostponed) / patient discharged from ahospital to home or a nursing home and with
Focus on vulnerable elders(ACOVE)
Modified indicator
KCE Report 196 S3
NCQM (CAHPSquestionnaire; HEDIS)
Focus on vulnerable elders(ACOVE)
Modified indicator
No details given
Focus on vulnerable elders(ACOVE)
Modified indicator
Focus on vulnerable elders(ACOVE)
Modified indicator
Focus on vulnerable elders(ACOVE)
Modified indicator

KCE Report 196S3
Hospital
Discharge
Generic
Hospital
Discharge
Generic
Hospital
Discharge
Mental health
Hospital
Discharge
Mental health
Hospital
Admission
Generic
Institution
Transitionbetween facility
Generic
Institution
Transitionbetween facility
Generic
Health System Performance Report 2012
a follow-up appointment for a physician visitor a treatment specified in the hospitalmedical record
34
Generic % patient with discharge summary in theoutpatient or nursing home medical record /patient discharged from a hospital to homeor nursing home
34
Focus on vulnerable elders(ACOVE)
Modified indicator
Generic % patient with discharge summary in theoutpatient medical record / patientdischarged from a nursing home to home
34
Focus on vulnerable elders
Modified indicator
Mental health Total number of inpatients who have adischarge summary or letter at the time ofhospital discharge / Total number ofinpatient separations.
33, 36
Australian quality indicator
Mental health indicators
Mental health % inpatients who have a final dischargesummary recorded in the medical recordwithin 2 weeks of hospital discharge.
33
NQMC (Australian qualityindicator)
Mental health indicators
Generic % patient with documentation (during theemergency department visit or within first 2days after admission) of communication witha continuity physician (or an attempt toreach) / patient treated at an ED or admittedto a hospital
34
Focus on vulnerable elders(ACOVE)
Modified indicator
Generic % patients transferred to another health carefacility whose medical record documentationindicated that medication-related informationwas communicated to the receiving facilitywithin 60 minutes of departure.
33
NQMC (UniversityMinnesota)
Generic % patients transferred to another health carefacility whose medical record documentationindicated that physician or practitionergenerated information was communicated tothe receiving facility within 60 minutes of
NQMC (UniversityMinnesota)
113
Focus on vulnerable elders(ACOVE)
odified indicator
Focus on vulnerable elders
Modified indicator
Australian quality indicator
Mental health indicators
NQMC (Australian qualityindicator)
Mental health indicators
Focus on vulnerable elders(ACOVE)
Modified indicator
NQMC (UniversityMinnesota)
NQMC (UniversityMinnesota)

114
Institution
Transitionbetween facility
Generic
Institution
Transitionbetween facility
Generic
Medication/therapycontinuity
Health caresystem
Generic
Health caresystem
Generic
Ambulatory care Chronic illness
Ambulatory care Generic
Ambulatory care Generic
Health System Performance Report 2012
departure.33
Generic % patients transferred to another health carefacility whose medical record documentationindicated that pre-transfer information wascommunicated to the receiving facility within60 minutes of departure.
33
NQMC (UniversityMinnesota)
Generic % patients transferred to another health carefacility whose medical record documentationindicated that patient identification wascommunicated to the receiving facility within60 minutes of departure.
33
NQMC (UniversityMinnesota)
Generic % hospitals with electronic exchange ofpatient information on medication history.
15AHRQ
Generic % hospitals where information onmedication prescribed at outpatient clinics,hospital wards, and outside the hospital isonline accessible at outpatient clinics,hospital wards, the hospital pharmacy andoutside the hospital
16
Dutch performance
Chronic illness % outpatient for which the non prescribingphysician acknowledge the medicationchange at the next visit / patient underoutpatient care of 2 or more physicians and1 physician prescribed a new chronicdisease medication or a change in priormedication
34
Focus on(ACOVE)
Modified indicator
Generic % outpatient with information (onmedication’s taking) noted on the follow-upvisits / outpatient with a new chronic diseasemedication and follow-up with theprescribing physician
34
Focus on vulnerable elders(ACOVE)
Modified indicator
Generic % people with a usual source of care whosehealth provider usually asks about
AHRQ
KCE Report 196 S3
NQMC (UniversityMinnesota)
NQMC (UniversityMinnesota)
AHRQ
Dutch performance
Focus on vulnerable elders(ACOVE)
Modified indicator
Focus on vulnerable elders(ACOVE)
Modified indicator
AHRQ

KCE Report 196S3
Hospital
Discharge
Generic
Hospital
Discharge
Generic
Hospital
Discharge
Cardio
Hospital
Discharge
Generic
Hospitalpharmacyservice
Generic
Hospitalpharmacyservice
Generic
Health System Performance Report 2012
prescription medications and treatmentsfrom other doctors / Civilian noninstitutionalised population who report ausual source of care.
15
Generic % hospitalised patient with documentationon medication change in outpatient medicalrecord within 6 weeks of discharge / patientdischarged from a hospital to home and withnew chronic disease medication or a changeof prior medication
34
Focus on vulnerable elders(ACOVE)
Modified indicator
Generic % hospitalised patient with documentationon medication level (or medication stopped)in outpatient medical record / patientdischarged from a hospital to home with anew medication that requires a serummedication level to be checked
34
Focus on vulnerable elders(ACOVE)
Modified indicator
Cardio Total number of patients on hospital initiatedwarfarin who receive written druginformation on discharge / Total number ofdischarged patients on hospital initiatedwarfarin.
36
Australian quality indicator
Adverse drug reaction
Generic % patients, regardless of age, dischargedfrom an inpatient facility to home or anyother site of care, or their caregiver(s), whoreceived a reconciled medication list at thetime of discharge including, at a minimum,medications in the specified categories.
Generic % patients with an accurate admissionmedicine history
37Centerness for the author
Modified indicator
Generic % patients for which the administration ofmedicines during the first 24 hours ofadmission to a surgical receiving ward wasfollowed for 7 days, using the administrationrecording sheet use within the patient care
Centerness for the author
Modified indicator
115
Focus on vulnerable elders(ACOVE)
Modified indicator
Focus on vulnerable elders(ACOVE)
Modified indicator
Australian quality indicator
Adverse drug reaction
Centerness for the author
Modified indicator
Centerness for the author
Modified indicator

116
Hospitalpharmacyservice
Generic
Hospitalpharmacyservice
Generic
Institution
Transitionbetween facility
Generic
Specialist care
Transition withothers providers
Cancer
Specialist care
Transition withothers providers
Cancer
Specialist care
Transition withothers providers
Cancer
Health System Performance Report 2012
documentation.37
Generic % new patients admitted to the medicalreceiving ward which were assessed formedicine-related care issues each morningand evening by the duty admissionspharmacist.
37
Centerness for the author
Modified indicator
Generic % discharged patients with completed formscontaining records on prescription of eachstage of the process and time that this wasaccomplished.
37
Centerness for the author
Modified indicator
Generic % patients transferred to another health carefacility whose medical record documentationindicated that medication-related informationwas communicated to the receiving facilitywithin 60 minutes of departure.
33
NQMC (UniversityMinnesota)
Cancer Total number of patients who have a letteron file to the referring doctor and generalpractitioner, regarding the currentradiotherapy course / Total number ofpatients receiving radiotherapy.
36
Australian quality indicator
Radiation oncoindicators
Cancer % patients, regardless of age, with adiagnosis of cancer who have undergonebrachytherapy or external beam radiationtherapy who have a treatment summaryreport in the chart that was communicatedto physician(s) providing continuing care andto the patient within one month completingtreatment.
33, 38
NQCM (American Societyfor Therapeutic Radiology& Oncology)
Cancer % patients, regardless of age, with adiagnosis of cancer who have completedchemotherapy within the 12 month reportingperiod who: A) have a chemotherapytreatment summary documented in thechart; AND B) have documentation that thewritten chemotherapy treatment summary
JCAHO (American Societyfor Therapeutic Radiologyand Oncology and al)
Also centeredness for
KCE Report 196 S3
Centerness for the author
Modified indicator
Centerness for the author
Modified indicator
NQMC (UniversityMinnesota)
Australian quality indicator
Radiation oncologyindicators
NQCM (American Societyfor Therapeutic Radiology& Oncology)
JCAHO (American Societyfor Therapeutic Radiologyand Oncology and al)
Also centeredness for

KCE Report 196S3
Test continuity Health system Chronic illness
Ambulatory care Generic
Hospital
Transitionbetween facility
Generic
Hospital
Transitionbetween facility
Generic
Hospitaldischarge
Generic
Specialist care Cancer
Specialist care Cancer
Health System Performance Report 2012
was provided to the patient; AND C) havedocumentation that the chemotherapytreatment summary was communicated tothe physician(s) providing continuing care.
38
JCAHO
Chronic illness % chronically ill people who reported thatthey experienced problems with thecoordination of care: test results notavailable at time of doctor’s appointment, orduplication of tests, by country
16
Dutch performance
Generic % outpatient with information about the test(even if is pending) noted on the follow-upvisits / outpatient with an order for adiagnostic test
34
Focus on vulnerable elders(ACOVE)
Modified indicator
Generic % patients transferred to another health carefacility whose medical record documentationindicated that procedure and tests werecommunicated to the receiving facility within60 minutes of departure.
33
NQMC (UniversityMinnesota)
Generic % patients transferred to another health carefacility whose medical record documentationindicated that vital signs werecommunicated to the receiving facility within60 minutes of departure.
33
NQMC (UniversityMinnesota)
Generic % hospitalised patient with documentationon test result in outpatient or nursingmedical record within 6 weeks of discharge /patient discharged from a hospital to homeor nursing home and with transfer form ordischarge summary indicating that a result ispending
34
Focus on vulnerable elders(ACOVE)
Modified indicator
Cancer Use of the pathology report sheet for rectalcancer patients(eo)
39KCE report
Rectal cancer
Cancer Quality of TME assessed according toQuirke and mentioned in the pathology
KCE report
117
JCAHO
Dutch performance
Focus on vulnerable elders(ACOVE)
Modified indicator
NQMC (UniversityMinnesota)
NQMC (UniversityMinnesota)
Focus on vulnerable elders(ACOVE)
Modified indicator
KCE report
Rectal cancer
KCE report

118
Specialist care Cancer
Specialist care Cancer
Specialist care Cancer
Specialist care Generic
Children
Specialist care Generic
Primary care Generic
Management continuity : measures focusing on the delivery of owhether follow-up visits are made when care crosses organisational boundaries
Follow-up plan Ambulatory care
Preventive care
Generic
Health System Performance Report 2012
report (lle)39
Rectal cancer
Cancer Distal tumour-free margin mentioned in thepathology report (lle)
39KCE report
Rectal cancer
Cancer (y)pCRM mentioned in mm in the pathologyreport (lle)
39KCE report
Rectal
Cancer Tumour regression grade mentioned in thepathology report (after neoadjuvanttreatment) (lle)
39
KCE report
Rectal cancer
Generic
Children
% parents/guardians who reported howoften their child's doctor's office followed upon results for blood tests, x-rays or any othertests ordered.
33
AHRQ
Generic % adult specialty care patients who reportedhow often their doctor's office followed up onresults for blood tests, x-rays or any othertests ordered.
33
AHRQ
Generic % adult primary care patients who reportedhow often their doctor's office followed up onresults for blood tests, x-rays or any othertests ordered.
33
AHRQ
: measures focusing on the delivery of one aspect of care in the continuum of the management plan, most commonlyup visits are made when care crosses organisational boundaries
9
Generic % outpatient with medical recorddocumentation of a reminder that apreventive care is needed within one fullinterval since the missed event / outpatientmissing a required preventive care eventthat is recurrent with a specific periodicity
34
Focus on vulnerable elders
Modified indicator
QI = 100 %
KCE Report 196 S3
Rectal cancer
KCE report
Rectal cancer
KCE report
Rectal cancer
KCE report
Rectal cancer
AHRQ
AHRQ
AHRQ
ne aspect of care in the continuum of the management plan, most commonly
Focus on vulnerable elders
Modified indicator
QI = 100 %

KCE Report 196S3
Specialist care Cancer
Specialist care Cancer
Specialist care HIV
Specialist care Generic
Transition plan Hospital
Discharge
Generic
Hospital
Discharge
Generic
Hospital Generic
Health System Performance Report 2012
Cancer % patients, regardless of age, with a newoccurrence of melanoma who have atreatment plan documented in the chartthat was communicated to the physician(s)providing continuing care within one monthof diagnosis.
33
NCQM (American Academyof Dermatology)
Cancer % adult patients with a progressive,debilitating disease who have a palliativecare plan documented in the medicalrecord.
33
AHRQ
% HIV positive adolescent and adult patientswho reported how often their case managerwent over their service plan and updated itwith them every 3 months.
33
AHRQ
Generic Temporal Continuity Index (TCI)9
= intervals between index and follow-up visit inrelation to what would be expected
Not extensively developeor validated
Generic Total number of separations for which thereis an appropriate discharge plan for apatient (excluding deaths and those caseswith a suspension of rehabilitation treatmentleads to a care type change to acute care) /Total number of separations (excludingdeaths and those cases with a suspensionof rehabilitation treatment leads to a caretype change to acute care).
36
Australian quality indicator
Rehabilitation indicators
Generic % patients, regardless of age, dischargedfrom an inpatient facility to home or anyother site of care for whom a transitionrecord was transmitted to the facility orprimary physician or other health careprofessional designated for follow-up carewithin 24 hours of discharge
33
NQCM (American Board ofinternal MedicineFoundation)
Generic % patients, regardless of age, discharged AHRQ
119
NCQM (American Academyof Dermatology)
AHRQ
AHRQ
Not extensively developedor validated
9
Australian quality indicator
Rehabilitation indicators
NQCM (American Board ofinternal MedicineFoundation)
AHRQ

120
Discharge
Hospital
Discharge
Generic
Hospital
Discharge
Asthma
Hospital
Discharge
Asthma
Hospital Thrombo
Health System Performance Report 2012
from an emergency department (ED) toambulatory care or home health care, ortheir caregiver(s), who received a transitionrecord at the time of ED discharge including,at a minimum, all of specified elements:
33
•Major procedures and tests performed duringED visit, AND
•Principal diagnosis at discharge OR chiefcomplaint, AND
•Patient instructions, AND
•Plan for follow-up care (OR statement thatnone required), including primary physician,other health care professional, or sitedesignated for follow-up care, AND
•List of new medications and changes tocontinued medications that patient should takeafter ED discharge, with quantity prescribedand/or dispensed (OR intended duration) andinstructions for each
Generic % separations for which there is anappropriate discharge plan for a patient,during the 6 month time period.
33.
AHRQ
Asthma Total number of patients admitted to hospitalwith a diagnosis of acute asthma for whomthere is documented evidence of anappropriate discharge plan / Denominator:Total number of patients admitted to hospitalwith a diagnosis of acute asthma.
36
Australian quality indicator
Internal medicine indicators
Asthma Total of asthmatic inpatient children withhome management plan of care documentgiven to patient/caregiver / total of asthmaticinpatient children.
33
AHRQ Children’s asthmacare
Modified indicators
Thrombo- Total of venous thromboembolism (VTE)patient with Warfarin therapy discharge
AHRQ
KCE Report 196 S3
AHRQ
Australian quality indicator
Internal medicine indicators
AHRQ Children’s asthmacare
Modified indicators
AHRQ

KCE Report 196S3
Discharge embolism
Hospital
Discharge
Heart
Hospital
Discharge
Generic
Hospital
Discharge
Chronic illness
Hospital
Discharge
Mental health
Hospital
Discharge
Mental health
Hospital
Discharge
Mental health
Hospital
Discharge
Mental health
Health System Performance Report 2012
embolism instructions / total of venousthromboembolism patient with Warfarintherapy.
33
VTE care
Modified indicators
Heart failure % hospitalized adult patients with heartfailure who were given complete writtendischarge instructions / Hospitalized adultpatients with a principal discharge diagnosisof heart failure
15
AHRQ
Generic % patients who reported that they receivedinformation about follow-up care at hospitaldischarge
16
Dutch performance
Chronic illness % chronically people who reported that theyreceived information about follow-up care athospital discharge
16
Dutch performance
Mental health Psychiatric inpatients for whom the postdischarge continuing care plan is createdand contains all of the following: reason forhospitalization, principal dischargediagnosis, discharge medications and nextlevel of care recommendations.
33
AHRQ
Mental health Is there documentation in the medical recordof a continuing care plan which includesthe discharge medications, dosage andindication for use or states no medicationswere prescribed?
38
AHRQ
Mental health Is there documentation in the medical recordof a continuing care plan which includesnext level of care recommendations ANDwas the continuing care plan including nextlevel of care?
33, 38
AHRQ
Mental health Is there documentation in the medical recordof a continuing care plan which includesthe principal discharge diagnosis AND wasthe continuing care plan including theprincipal discharge diagnosis transmitted to
AHRQ
121
VTE care
Modified indicators
AHRQ
Dutch performance
Dutch performance
AHRQ
AHRQ
AHRQ
AHRQ

122
Hospital
Discharge
Mental health
Hospital
Discharge
Mental health
Hospital
Discharge
Mental health
Hospital
Discharge
Mental health
Provider or relational or longitudinal continuity: measures of the affiliation between patient and provider or duration of their relationship or by askingpatients and providers directly how strong their ties are
Place of primary care Health caresystem
Generic
Health caresystem
Generic
Link with a sameprovider
Generalpractitioners
Generic
Health System Performance Report 2012
the next level of care provider no later thanthe fifth post-discharge day?
38
Mental health Is there documentation in the medical recordof a continuing care plan which includesthe reason for hospitalization AND was thecontinuing care plan including the reason forhospitalization transmitted to the next levelof care provider no later than the fifth post-discharge day?
38
AHRQ
Mental health Is there documentation in the medical recordthat the patient was referred to the next levelof care provider upon discharge from ahospital-based inpatient psychiatricsetting?
38
AHRQ
Mental health % patients discharged from acute-carefacilities (excluding those discharged againstmedical advice) who have a documenteddischarge plan(cf Koen)
Mental health % patients for which post dischargecontinuing care plan is transmitted to nextlevel of care provider upon discharge(cfKoen)
measures of the affiliation between patient and provider or duration of their relationship or by askingpatients and providers directly how strong their ties are
9
Generic Clinician index21
= N of ambulatory visit to a primary clinician / N ofambulatory visits in the 1
styear
High continuity defined as aprimary site or provider thataccounted for at least 50%of visits.
Generic % of adults (19-64) having accessibleprimary care provider
40U.S. Health SystemPerformance
Generic % of individuals without a GMD/all citizen1
KCE report
KCE Report 196 S3
AHRQ
AHRQ
measures of the affiliation between patient and provider or duration of their relationship or by asking
High continuity defined as amary site or provider that
accounted for at least 50%of visits.
21
U.S. Health SystemPerformance
KCE report

KCE Report 196S3
Generic
Primary careproviders
Generic
Generic
Generic
Health System Performance Report 2012
Generic % patients answering they know theirproviders “well”; adequacy of communicationand trust; extent of knowledge obtained fromasking providers; provider’s sense ofongoing responsibility
9
Strength of relationship
Generic Fundamental Continuity of Care index(FCCI)
21
(Fractional visit to the PCP) X (normalised timethe patient spends with the PCP)
Generic Usual provider of care (UPC) index5, 6, 9, 21, 41,
42
= proportion of consultations that were conductedby the professional consulted most frequently
UPCcat or Categorical UPC index41
= "low" continuity if UPC ≦0,50; "high" continuity ifUPC>0,50
UPC12 or UPC-12 index41
= n of 12 most recent visits to predominantprovider/12 visits
Measure of concentrationof care
For GPs in surgery but alsofor doctors and nurses, alltype consultations
Is easily interpreted, OK forlarge sample
Generic Continuity of care (COC) index5, 6, 9, 21, 41-43
= proportion of consultations with the samedoctor, adjusted for the number of consultations
S
Σ n²j-N/N(N-1)
j=1
where N=total number of visits; n=number of visitsto jth provider; s=number of providers
Measure both of theconcentration and thedispersion of care amongall providers seen.
For GPs in surgery but alsofor doctors and nurses, alltype consultatio
Allows comparison, isindependent of practice
123
Strength of relationship
Measure of concentrationof care
For GPs in surgery but alsofor doctors and nurses, alltype consultations
Is easily interpreted, OK forlarge sample
Measure both of theconcentration and thedispersion of care amongall providers seen.
For GPs in surgery but alsofor doctors and nurses, alltype consultations.
Allows comparison, isindependent of practice

124
Generic
Generic
Primary careproviders
Generic
Generalpractitioners
Generic
Health System Performance Report 2012
size or patients consultationrate but has no intuitivemeaning apart from at theextremes.
Generic Continuity Score21
1-(N of ambulatory providers/{N of ambulatoryvisits +0.1})
1-(1/{N of ambulatory visits +0.1})
Continuity Score by measurement period21
= The visits that is scored for continuity isobserved within the measurement period (MP)
Range from approximately0 (if each visit is to differentprovider) to 1 (if all visitsare to the same provider)
Generic Binary measure21
= proportion of patients still seeing the sameprovider at each time point.
Indicates the time untilpatients report that theprovider they saw for theirinitial study visit is notlonger the person servingas their regular PCP.
Generic Percentage visits by PCP21
= % of patients seen by the same practitioner asin index visit
Generic Provider continuity21
= N of visits with own physician for a year / total Nof physician office visits for the year
Usual Provider continuity score44
= N of visits to the usual provider / total N ofambulatory visits
Provider continuity45
= patient always visiting (home or office) the samefamily physician during 2 years (more than one =
KCE Report 196 S3
size or patients consultationrate but has no intuitivemeaning apart from at theextremes.
6
Range from approximately0 (if each visit is to differentprovider) to 1 (if all visitsare to the same provider)
Indicates the time untilpatients report that theprovider they saw for theirinitial study visit is notlonger the person servingas their regular PCP.
21
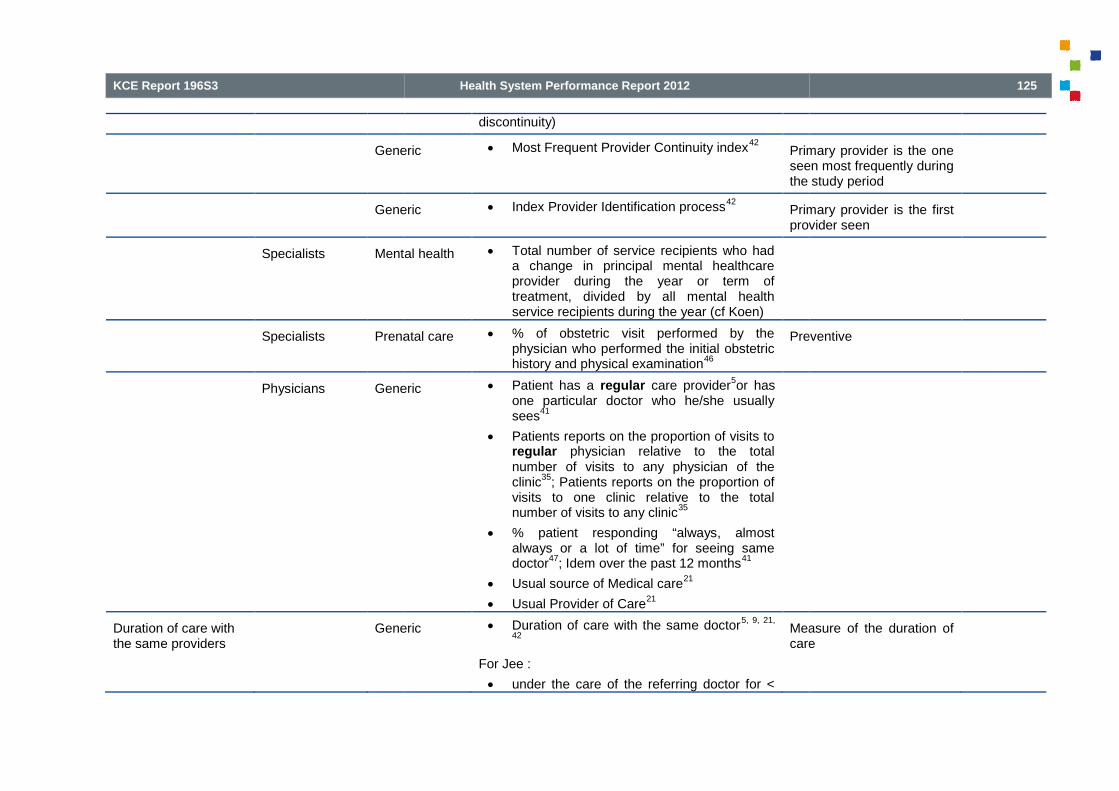
KCE Report 196S3
Generic
Generic
Specialists Mental health
Specialists Prenatal care
Physicians Generic
Duration of care withthe same providers
Generic
Health System Performance Report 2012
discontinuity)
Generic Most Frequent Provider Continuity index42
Primary provider is the oneseen most frequently duringthe study
Generic Index Provider Identification process42
Primary provider is the firstprovider seen
Mental health Total number of service recipients who hada change in principal mental healthcareprovider during the year or term oftreatment, divided by all mental healthservice recipients during the year (cf Koen)
Prenatal care % of obstetric visit performed by thephysician who performed the initial obstetrichistory and physical examination
46
Preventive
Generic Patient has a regular care provider5or has
one particular doctor who he/she usuallysees
41
Patients reports on the proportion of visits toregular physician relative to the totalnumber of visits to any physician of theclinic
35; Patients reports on the proportion of
visits to one clinic relative to the totalnumber of visits to any clinic
35
% patient responding “always, almostalways or a lot of time” for seeing samedoctor
47; Idem over the past 12 months
41
Usual source of Medical care21
Usual Provider of Care21
Generic Duration of care with the same doctor5, 9, 21,
42
For Jee :
under the care of the referring doctor for <
Measure of the duration ofcare
125
Primary provider is the oneseen most frequently duringthe study period
Primary provider is the firstprovider seen
Preventive
Measure of the duration ofcare

126
Generic
Diversity of providers Generic
Generic
Generic
Health System Performance Report 2012
12 months
under the care of the referring doctor for 1 to10 years
under the care of the referring doctor for>10 years
Generic Longitudinal Care : Duration and Density9, 21
Duration = time from the first visit to the present
Density = N of consultations (office or home visits)within the last 12 months.
Generic FRAC Index (FRAC)21, 42
Likelihood of Continuity index (LICON)42
Likelihood of Sequential Continuity index(LISECON)
42
Herfindahl index21, 42
Index of Concentration (CON)21, 42
GINI Index of Concentration (GINI)21, 42
Fraction of care continuity21
= Fraction of visits during the continuity-determining period that were made to the currentprovider
Discounted Fraction of Care Continuity21
Formule in Jee
LICON = measure of theprobability that the N ofproviders seen is fewerthan that would haveoccurred under randomconditions, given thepatient’s utilisation levelsand the numbeproviders
Generic K index (K)21, 42, 48
= (N of visits – N of doctors) / (N of visits-1)
Measurof care with differentproviders
Generic Modified Continuity (MCI) index21, 41-43, 49
1-(N of providers / (N of all visits + 0,1))
Measure of concentrationof care in apatients
KCE Report 196 S3
LICON = measure of theprobability that the N ofproviders seen is fewerthan that would haveoccurred under randomconditions, given thepatient’s utilisation levelsand the number of availableproviders
9
Measure of concentrationof care with differentproviders
9
Measure of concentrationof care in a population ofpatients
9

KCE Report 196S3
Generic
Generic
Generic
Sequence of care Generic
Generic
Link between familyand provider
Generic
Generic
Health System Performance Report 2012
Generic Modified, Modified Continuity (MMCI)index
21, 41, 42
1-(N of providers/{n of all visits + 0,1})
1-(1/n of visits + 0,1)
Measure of concentrationof care with providers andat the individual patientlevel
CCI = {(a²+b²+c²)-(a+b+c)} /{(a+b+c)x(a+b+c-1)}
50
Where variables ‘a’, ‘b’ and ‘c’ are the number ofvisits with different general medical providers and‘a’ would be the designated primary provider.
Generic Nb of providers seen (NOP) during anepisode of care (e.g. hospitalisation) or in adefined time interval
5, 9, 42
Measure of concentrationof care
Generic % patients able to identify a physician or aclinic to call for medical care or knowing thetelephone number or other mechanism toreach this source of care
34
Focus on vulnerable elders
Modified indicator
Generic Sequential Continuity index (SECON)index
5, 21, 42
Formule in Jee and Reid
Measure of the sequencingof care
Generic Alpha index9
Alpha index = measure ofvisit sequencing (SECON)with a measure ofconcentration
Generic Family Care Measure (FC)42
Family Mean Continuity index (FMCI)42
Family Continuity of Care index (FCOC)42
Generic % of parents saying: “my child hardly eversees the same doctor when he or she goesfor medical care”
21
% of parents saying: “my child sees the
Child Continuity
127
Measure of concentrationof care with providers andat the individual patientlevel
9
Measure of concentrationof care
Focus on vulnerable elders
Modified indicator
Measure of the sequencingof care
9
Alpha index = measure ofvisit sequencing (SECON)with a measure ofconcentration
9
Child Continuity21

128
Coordination : measures of the integration, coordination and shared information between professionals or between provider organisations.
Collaboration Primarycare provider (PCP)-Specialists
Health caresystem
Generic
Hospital Mental health
CollaborationPhysicians-nurses
Health caresystem
Generic
Hospital nursing Cancer
Health System Performance Report 2012
same doctor just about every time he or shegoes for medical care”
21
3-item Continuity scale21
= Score of 0-12 for3 items:
“my child hardly ever sees the same doctorwhen he or she goes for medical care”
“if more than one family member needsmedical care, we have to go to differentdoctors”
“my child sees the same doctor just aboutevery time he or she goes for medical care”
measures of the integration, coordination and shared information between professionals or between provider organisations.
Generic Confidence that PCP and specialist willcollaborate and communicate for patients’care
35
7 items from the Primary care assessment tool(PCAT-AE)
No details given
Mental health % of psychiatric inpatients for which there iscontact with the primary care clinician (onlyconsenting patients included) (cf Koen)
Generic Confidence that nurse and PCP willcommunicate regarding visit with nurse andthat PCP is concerned with the quality ofcare received from the nurse
35
6 items from the Primary care assessment tool(PCAT-AE)
No details given
Cancer Collaboration and satisfaction about caredecisions scale (nurse & physicians werecooperatively working together, sharingresponsibility for problem solving and
Focus on hematopatient
KCE Report 196 S3
measures of the integration, coordination and shared information between professionals or between provider organisations.6
No details given
No details given
Focus on hemato-oncologypatient

KCE Report 196S3
Collaboration intra-clinic, intra-team
Hospital Generic
Hospital Cancer
Hospital Cancer
Institution Rehabilitation
Hospital Haematemesis/ melaena
Hospital Asthma
Health System Performance Report 2012
decision making to formulate and carry outplans for patient care)
19
Generic Confidence that health care providers fromone clinic will collaborate in andcommunicate about patients’ care (nurse-physician or physician-physiciancollaboration)
35
4 items from the Primary care assessment tool(PCAT-AE)
No details given
Cancer Proportion of breast cancer womendiscussed at the multidisciplinary team(MDT) meeting
51
KCE report
Cancer Proportion of patients with rectal cancerdiscussed at a multidisciplinary teammeeting (low level of evidence)
39
KCE report
Rehabilitation % patients admitted to a rehabilitationunit/facility for whom there is a documentedestablished multidisciplinaryrehabilitation plan within 7 days of patientadmission, during the 6 month time period.
33
JCAHO
Haematemesis/ melaena
Total number of patients admitted to hospitalwith haematemesis and / or melaena, whoreceive a blood transfusion, for whom thereis documented evidence that a member ofsurgical staff has been notified of theircondition / Total number of patientsadmitted to hospital with haematemesis and/ or melaena who receive a bloodtransfusion.
36
Australian quality indicator
Internal medicine indicators
Asthma Total number of patients admitted to hospitalwith a diagnosis of acute asthma for whomthere is documented objective assessmentof severity in addition to the initialassessment which facilitates ongoing
Australian quality indicator
Internal medicine indicators
129
No details given
KCE report
KCE report
JCAHO
Australian quality indicator
Internal medicine indicators
Australian quality indicator
Internal medicine indicators

130
Institution Mental health
Specialist care HIV
Health caresystem
End of life care
Overall coordination Health caresystem
Generic
Health caresystem
Generic
Health System Performance Report 2012
inpatient management / Total number ofpatients admitted to hospital with adiagnosis of acute asthma.
36
Mental health Total number of inpatient who have amultidisciplinary review recorded every 3months / Total number of inpatient with thestay of greater than 3 months.
33, 36
Australian quality indicator
Mental health indicators
HIV positive adolescent and adult patientswho reported how often their case managerand their HIV medical care providers workedtogether to help them.
33
AHRQ
End of life care % practices who has a complete registeravailable of all patients in need of palliativecare-support irrespective of age / practiceswhose patient population includesindividuals who are in need of palliativecare*support (one practice at a time).
33
% practices who has regular (at least 3monthly) multidisciplinary case reviewmeetings where all patients on the palliativecare register are discussed / practiceswhose patient population includesindividuals who are in need of palliativecare/support (one practice at a time).
33
Palliative care
NQMC (BMA)
Generic % care users who reported that they weregiven contradictory advices by careproviders
16
Dutch Performance
Generic Subjective assessment that care is similaracross providers
9Confounded by issues ofaccess
Difficult to distinguish fromquality of care processmeasures
KCE Report 196 S3
Australian quality indicator
Mental health indicators
AHRQ
Palliative care
NQMC (BMA)
Dutch Performance
Confounded by issues ofaccess
9
Difficult to distinguish fromquality of care processmeasures
9

KCE Report 196S3
Ambulatory care
Follow-up afterdischarge
Generic
Older
Follow-up Generic
Older
Health caresystem
Chronic illness
Children
Health caresystem
Chronic illness
Children
Health caresystem
Chronic illness
Children
Health caresystem
Chronic illness
Children
Health System Performance Report 2012
Generic
Older
% patients aged 65 years and olderdischarged from any inpatient facility (e.g.,hospital, skilled nursing facility, orrehabilitation facility) and seen within 60days discharge in the office by the physicianproviding on-going care who had areconciliation of the discharge medicationswith the current medication list in theoutpatient medical record documented
33
NQMC (American Geriatricsociety)
Generic
Older
% adults 66 years and older who had eachof the following during the measurementyear: advance care planning, medicationreview, functional status assessment andpain screening.
33
JCAHO
Chronic illness
Children
% patients or guardians of health planmembers who reported whether theyreceived assistance with coordination ofcare and services for their children (17 years& younger) with chronic conditions
33
NCQM (CAHPSquestionnaire)
Chronic illness
Children
% patients or guardians who reportedwhether they received assistance withcoordination of care and services for theirenrolled children (17 years & younger) withchronic conditions
33
NCQM (CAHPSquestionnaire)
Chronic illness
Children
proportion of children needing more thanone health care service who receivedcoordinated care.
33
AHRQ
Chronic illness
Children
Proportion of children age 3 months to 48months who needed care from multiplehealth care providers or used more than oneservice, who received a well-child visit in thelast 12 months, and whose parent answeredthe item in the "Care Coordination (CC)"scale on the Promoting HealthyDevelopment Survey (PHDS)
33
NCQM (CAHPSquestionnaire)
131
NQMC (American Geriatricsociety)
JCAHO
NCQM (CAHPSquestionnaire)
NCQM (CAHPSquestionnaire)
AHRQ
NCQM (CAHPSquestionnaire)

132
Health caresystem
Chronic illness
Children
Primary care
physicians
Generic
Primary care
physicians
Chronic illness
Primary care
Medical centres
Generic
Health System Performance Report 2012
Chronic illness
Children
% children with effective care coordinationand with a medical home / Children underage 18.
15
AHRQ
Generic Primary care physicians’ reports onexperiences
32Comparison between 7countries
Part of a physicians’questionnaire (partappendix)
Chronic illness Care for chronically ill patients and useof teams among primary carephysicians
32
Comparison between 7countries
Part of a physicians’questionnaire (part inappendix)
Generic VA Patient satisfaction with care survey:Coordination of Care (Overall)
10, 526 item
Were the providers who cared for you alwaysfamiliar with your most recent medicalhistory?
Were there times when one of your providersdid not know about tests you had or theirresults?
Were there times when one of your providersdid not know about changes in your treatmentthat another provider recommended?
Were there times when you were confusedbecause different providers told you differentthings?
Did you always know what the next step inyour care would be?
Did you know who to ask when you hadquestions about your health care?
National VA (veteransaffairs) Patiwith Care Survey (based onPicker Commonwealthapproach)
From a long questionnaire
KCE Report 196 S3
AHRQ
Comparison between 7countries
Part of a physicians’questionnaire (part inappendix)
Comparison between 7countries
Part of a physicians’questionnaire (part inappendix)
National VA (veteransaffairs) Patient Satisfactionwith Care Survey (based onPicker Commonwealthapproach)
From a long questionnaire

KCE Report 196S3
Primary care
Medical centres
Generic
Generic
Specialist care Generic
Health System Performance Report 2012
Generic VA Patient satisfaction with care survey:Coordination of Care (Visit)
525 item
Did someone tell you how you would find outthe results of your tests?
Did someone tell you when you would findout the results of your tests?
If you needed another visit with this provider,did the staff do everything they could to makethe necessary arrangements?
If you needed another visit with anotherprovider did the staff do everything they couldto make the necessary arrangements?
Did you know who to call if you needed helpor had more questions after you left yourappointment?
National VA (veteransaffairs) Patient Satisfactionwith Care Survey (based onPicker Commonwealthapproach)
From a long questionnaire
Generic Perception of Continuity Scale9, 41
Self administered questionnaire 23 items
No details given
Generic Questionnaire on Continuity of care(QCC)
53
15 indicators scored (1-5)
Health professionals should :
- Have a locum in case of absence
- Give sufficient information to the locum
- Inform each other adequately aboutpatients’ situation
- Adapt care when necessary in changingsituations
- Provide care immediately duringemergencies
- Provide concurrent care
- Cooperate with each other
Focus on people withrheumatic diseases andtransmural nurse clinic
133
National VA (veteransaffairs) Patient Satisfactionwith Care Survey (based onPicker Commonwealthapproach)
From a long questionnaire
No details given
Focus on people withrheumatic diseases andtransmural nurse clinic
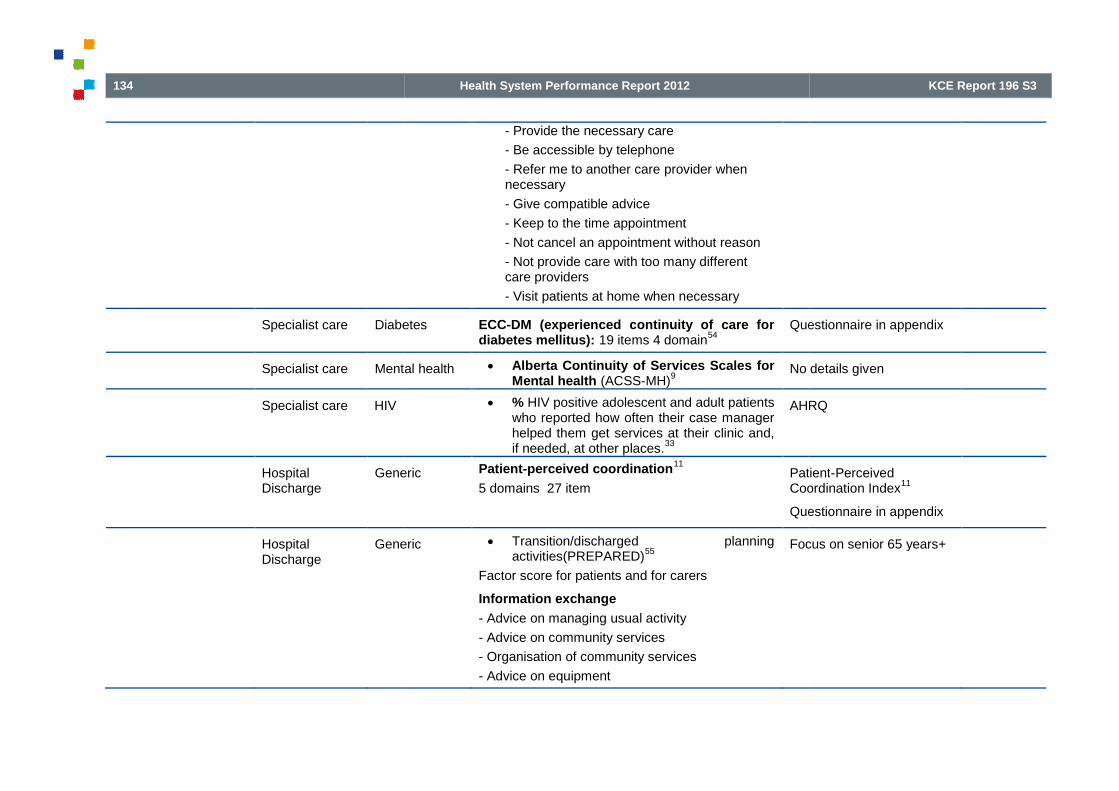
134
Specialist care Diabetes
Specialist care Mental health
Specialist care HIV
HospitalDischarge
Generic
HospitalDischarge
Generic
Health System Performance Report 2012
- Provide the necessary care
- Be accessible by telephone
- Refer me to another care provider whennecessary
- Give compatible advice
- Keep to the time appointment
- Not cancel an appointment without reason
- Not provide care with too many differentcare providers
- Visit patients at home when necessary
Diabetes ECC-DM (experienced continuity of care fordiabetes mellitus): 19 items 4 domain
54Questionnaire in appendix
Mental health Alberta Continuity of Services Scales forMental health (ACSS-MH)
9No details giv
% HIV positive adolescent and adult patientswho reported how often their case managerhelped them get services at their clinic and,if needed, at other places.
33
AHRQ
Generic Patient-perceived coordination11
5 domains 27 itemPatientCoordination Index
Questionnaire in appendix
Generic Transition/discharged planningactivities(PREPARED)
55
Factor score for patients and for carers
Information exchange
- Advice on managing usual activity
- Advice on community services
- Organisation of community services
- Advice on equipment
Focus on senior 65 years+
KCE Report 196 S3
Questionnaire in appendix
No details given
AHRQ
Patient-PerceivedCoordination Index
11
Questionnaire in appendix
Focus on senior 65 years+

KCE Report 196S3
Institution
Transitionbetweenservices
Mental health
Child & Ado
Health System Performance Report 2012
- Organisation of equipment
Receipt of medication information
- Advice on use of medications at home
- Advice on side effects
- Written instructions on medications
- For carer: information on personal care of patient
Preparation for coping post-discharge
- Any other information required whilst in hospital
- For patient: Worries about managing at home
- Carer confidence about managing the patient athome
Control of discharge circumstances
- On the day of discharge, patient confidenceabout managing at home
- Delays in leaving hospital
The mean score for each of the 4 processdomains and the total process score = % ofthe maximum possible score
Mental health
Child & Ado
- Combined transition score56
4 items
Information transfer (information continuity)
- % of patients with evidence that a referral letter,summary of prior care or case notes transferred tothe new system of care along with acontemporaneous risk assessment
56
Period of parallel care (relational continuity)
- % of patients with a period of joint workingbetween 2 services during transition
56
Transition between child &ado mental health serviceand adults mental healthservice
135
Transition between child &ado mental health serviceand adults mental healthservice

136
Hospital
Transitionbetweenservices
Cancer
Transition
Health System Performance Report 2012
Transition planning (cross-boundary and teamcontinuity)
- % of patient with at least one meeting involvingservice user and/or carer and a key professionalfrom both services prior to transfer of care
56
Continuity of care (long term continuity)
- % of patient either engaged with the new service3 months post-transition or appropriatelydischarged by this service following transition
56
Combined
Sub-optimal transitions were those that failed tomeet one or more of the 4 criteria
56
Cancer
Transition
- Transition for breast cancer patients57
10items
- % patients knowing at all times what is tohappen next.
- % patients always knowing how they can be incontact with a health professional.
- % patients feeling there is concordance betweenthe information they receive from the 2departments.
- % patients where relevant papers are present inthe chart upon the first consultation in theoncology outpatient clinic.
- % patients receiving an appointment at theoncology department over the phone, the dayafter discharge from the surgical department
- % of the appointment letters from the oncologydepartment sent out the latest 5 days after thepatient at the surgical department had receivedinformation about her oncology/adjuvant
Breast cancer patientsleaving the surgicaldepartment for theoncology out
KCE Report 196 S3
Breast cancer patientsleaving the surgicaldepartment for theoncology out-patient clinic

KCE Report 196S3
Generic
Health System Performance Report 2012
treatment.(standard = 90%)
- % patients who are offered a consultation within2 weeks in the oncology department. (standard =100%)
- % patients who are consulted by an oncologyspecialist (standard = 60%)
- % discharge summary made by the surgicalnurse received by the oncology department uponthe first visit to the oncology out-patient clinic.
- % patients who are offered postoperativeinstructions by a physiotherapist (standard = 90%)
Generic Handoff quality assessment58
17 items
Handoff characteristics
- Handoff followed a logical structure (F1)
- The person handing off the patient continuouslyused the available documentation (anaesthesiarecord, patient chart, etc) to structure thehandoff(F1 & F2)
- Not enough time was allowed for the handoff(F1)
- All relevant information was selected andcommunicated (F1)
- Priorities for further treatment were addressed(F1 & F2)
- The person handing off the patient clearlycommunicated her/his assessment of the patient(F1)
- Possible risk and complication were discussed(F2)
- It was easy to establish good contact at the
Analysis of 3 factors ofhandoff :
F1 Information transfer (ortechnical aspect)
F2 Shared
F3 Working atmosphere
137
Analysis of 3 factors ofhandoff :
F1 Information transfer (ortechnical aspect)
F2 Shared understanding
F3 Working atmosphere

138
Mixed coordination/
timeliness
Health caresystem
Breast cancer(follow up)
Health System Performance Report 2012
beginning to the handoff (F2 & F3)
- There was tension within the team duringhandoff (F3)
- Questions and ambiguities were resolved (activeenquiry by the person taking on responsibility forthe patient) (F2)
- The team jointly ensured that the handoff wascomplete (F2)
- Documentation was complete ((F1)
- The patient’s experience was consideredcarefully during handoff (respect) ((F1 & F3)
Handoff quality
- Overall, the quality of handoff was very high
Circumstances of the handoff
- The person handling off the patient was undertime pressure
- The person taking on the responsibility for thepatient was under time pressure
Breast cancer(follow up)
- Proportion of women with class (3), 4 or 5abnormal mammograms having an assessmentwith a specialist within 2 months ofmammography
51
- Proportion of women with class (3), 4 or 5abnormal mammograms who have at least one ofthe following procedure within 2 months aftercommunication of the screening result :mammography, ultrasound, fine-needle aspiration,or percutaneous biopsy
51
- Proportion of newly diagnosed cstage I-III breastcancer women who underwent two-viewmammography or breast sonography within 3
KCE report
KCE Report 196 S3
KCE report

KCE Report 196S3
Health caresystem
Breast cancer(follow up)
Health caresystem
Rectal cancer(follow
Health caresystem
Cancer
Health caresystem
Melanoma
Health caresystem
Cardiology
Health System Performance Report 2012
months prior to surgery51
Breast cancer(follow up)
- % Breast Imaging and Reporting Data System(BI-RADS) category 4 or BI-RADS category 5mammograms that are followed by a biopsy within7 to 10 days.
33
AHRQ
Rectal cancer(follow-up)
- Time between first histopathologic diagnosis andfirst treatment (lle)
39
- Rate of curatively treated patients that receiveda total colonoscopy within 1 year after resection(mle)
39
- Rate of patients undergoing regular follow-up(according to the PROCARE recommendations)(mle)
39
- Late grade 4 complications of radiotherapy orchemoradiation (eo)
39
KCE report
Cancer - % patients with cancer diagnosed within the last18 months who have a patient review recorded asoccurring within 6 months of the practice receivingconfirmation of the diagnosis.
33
AHRQ
Melanoma - % patients, regardless of age, with a currentdiagnosis of melanoma or a history of melanomawho were entered into a recall system with thedate for the next complete physical skin examspecified, at least once within the 12 monthreporting period.
33
NQMC (American Academyof Dermatology)
Cardiology - % patients, regardless of age, with anemergency department diagnosis of ST-elevationmyocardial infarction (STEMI) or new left bundlebranch block (LBBB) on 12-leadelectrocardiogram (ECG) who received primarypercutaneous coronary intervention (PCI) whohad documentation that the emergency physician
NQMC (American Collegeof Emergency Physicians)
139
AHRQ
KCE report
AHRQ
NQMC (American Academyof Dermatology)
NQMC (American Collegeof Emergency Physicians)
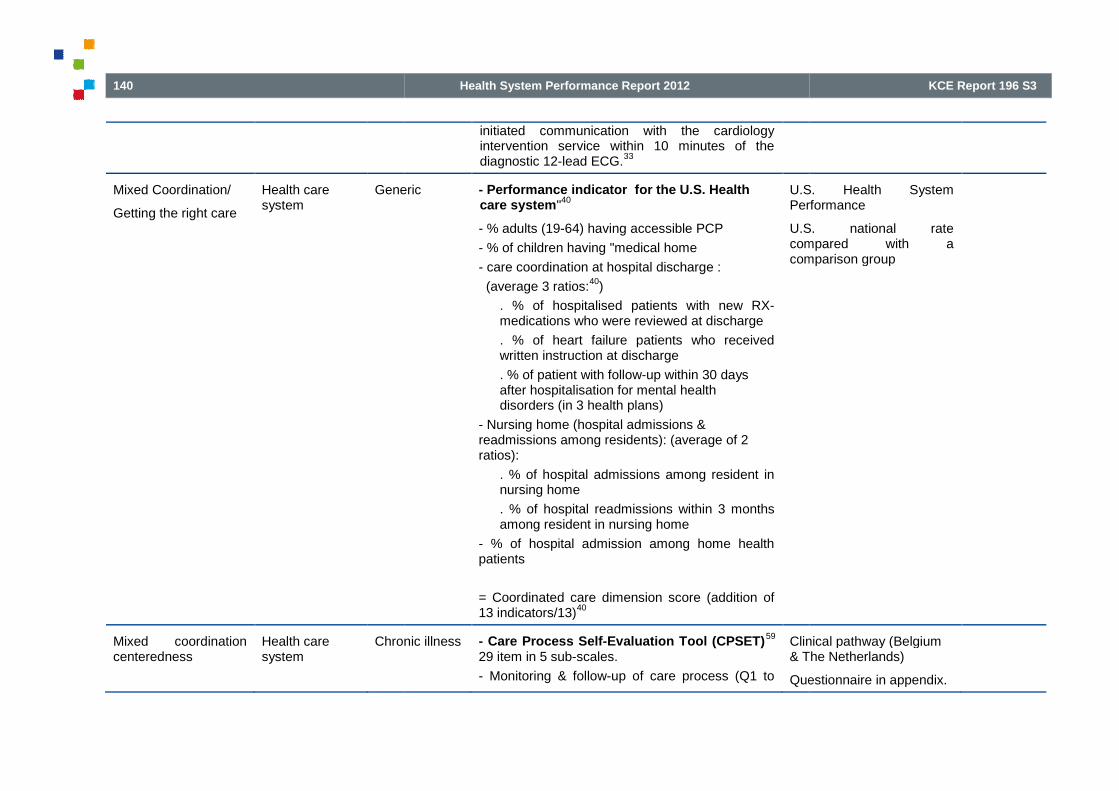
140
Mixed Coordination/
Getting the right care
Health caresystem
Generic
Mixed coordinationcenteredness
Health caresystem
Chronic illness
Health System Performance Report 2012
initiated communication with the cardiologyintervention service within 10 minutes of thediagnostic 12-lead ECG.
33
Generic - Performance indicator for the U.S. Healthcare system"
40
- % adults (19-64) having accessible PCP
- % of children having "medical home
- care coordination at hospital discharge :
(average 3 ratios:40
)
. % of hospitalised patients with new RX-medications who were reviewed at discharge
. % of heart failure patients who receivedwritten instruction at discharge
. % of patient with follow-up within 30 daysafter hospitalisation for mental healthdisorders (in 3 health plans)
- Nursing home (hospital admissions &readmissions among residents): (average of 2ratios):
. % of hospital admissions among resident innursing home
. % of hospital readmissions within 3 monthsamong resident in nursing home
- % of hospital admission among home healthpatients
= Coordinated care dimension score (addition of13 indicators/13)
40
U.S. Health SystemPerformance
U.S. national ratecompared with acomparison group
Chronic illness - Care Process Self-Evaluation Tool (CPSET)59
29 item in 5 sub-scales.
- Monitoring & follow-up of care process (Q1 to
Clinical pathway (Belgium& The Netherlands)
Questionnaire in appendix.
KCE Report 196 S3
U.S. Health SystemPerformance
U.S. national ratecompared with acomparison group
Clinical pathway (Belgium& The Netherlands)
Questionnaire in appendix.

KCE Report 196S3
Health caresystem
Chronic illness
Specialist andprimary care
Generic
Primary care Generic
Primary care Generic
Primary care Generic
Health System Performance Report 2012
Q9)
- Coordination of the care process (Q10 to Q16)
- Patient-focused organisation (Q17 to Q22)
- Communication with patient and family (Q23 toQ26)
- Collaboration with primary care (Q27 to Q29)
Chronic illness - Care coordination and transition amongadults with chronic condition
60Comparison betweencountries
Part of a the 2008Commonwealth FundInternational Health PolicySurvey (part in appendix)
Generic - Consumers Quality index (CQ-index)7
22 items in 4 domains (4-point scale)
Assess GPcollaboration
Questionnaire in appendix.
Generic - Patients’ reports of Primary careRelationship and accessibility
61Comparison between7countries
Part of a the 2007Commonwealth FundInternational Health PolicySurvey (several parts inappendix, also incenteredness)
Generic - CPCI : Component of primary care index48, 62
19 items
Questionnaire in appendix
Generic - MHFS : Medical Home Family Survey62
= measure the delivery of PC for all children andyouth including those with special care needs
141
Comparison between 8countries
Part of a the 2008Commonwealth FundInternational Health PolicySurvey (part in appendix)
Assess GP-Specialistcollaboration
Questionnaire in appendix.
Comparison between7countries
Part of a the 2007Commonwealth FundInternational Health PolicySurvey (several parts inappendix, also incenteredness)
Questionnaire in appendix
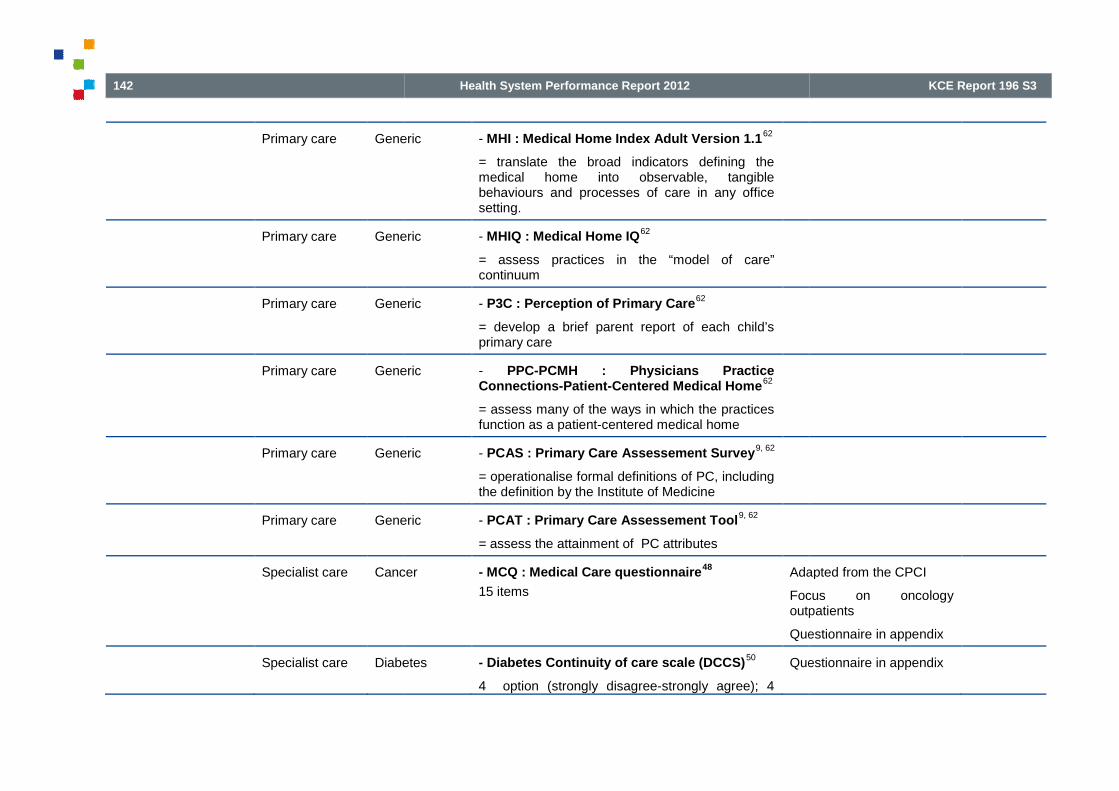
142
Primary care Generic
Primary care Generic
Primary care Generic
Primary care Generic
Primary care Generic
Primary care Generic
Specialist care Cancer
Specialist care Diabetes
Health System Performance Report 2012
Generic - MHI : Medical Home Index Adult Version 1.162
= translate the broad indicators defining themedical home into observable, tangiblebehaviours and processes of care in any officesetting.
Generic - MHIQ : Medical Home IQ62
= assess practices in the “model of care”continuum
Generic - P3C : Perception of Primary Care62
= develop a brief parent report of each child’sprimary care
Generic - PPC-PCMH : Physicians PracticeConnections-Patient-Centered Medical Home
62
= assess many of the ways in which the practicesfunction as a patient-centered medical home
Generic - PCAS : Primary Care Assessement Survey9, 62
= operationalise formal definitions of PC, includingthe definition by the Institute of Medicine
Generic - PCAT : Primary Care Assessement Tool9, 62
= assess the attainment of PC attributes
Cancer - MCQ : Medical Care questionnaire48
15 items
Adapted from the CPCI
Focus on oncologyoutpatients
Que
Diabetes - Diabetes Continuity of care scale (DCCS)50
4 option (strongly disagree-strongly agree); 4
Questionnaire in appendix
KCE Report 196 S3
Adapted from the CPCI
Focus on oncologyoutpatients
Questionnaire in appendix
Questionnaire in appendix

KCE Report 196S3
Hospital
Discharge
Generic
Hospital
Discharge
Generic
Integrated carepathways or careprogram approach orcase management
Health caresystem
Mental
Health caresystem
Mental health
Health caresystem
Mental health
Health System Performance Report 2012
domains:
Domain 1: Access/getting care
Domain 2: Care by doctor
Domain 3: Care by other healthcare professional
Domain 4: Communication between healthcareprofessionals
Domain 5: Self-care
Generic - CTM-15: Care Transitions Measure12, 63
15items
Transition in versus outhospital
Questionnaire in appendix
Generic - CTM-3 : Care Transitions Measure63
3 items
- The hospital staff took my preferences and thoseof my family or caregiver into account in decidingwhat my health care needs would be when I leftthe hospital.
- When I left the hospital, I had a goodunderstanding of the things I was responsible forin managing my health.
- When I left the hospital, I clearly understood thepurpose for taking each of my medications.
Shorter & valid CTM
Mental health - N of accredited Integrated Care Pathway (ICP)standards implemented with 100% collection ofprescribed data points (cf Koen)
Mental health - Care Programme Approach (CPA) 7 day follow-up (cf Koen)
Mental health - Proportion of patients with an individualised careplan (in Koen)
143
Transition in versus outhospital
Questionnaire in appendix
Shorter & valid CTM

144
Specialist care
Integrated care
Mental health
Health caresystem
Mental health
Mental health
Health caresystem
Mental health
Health caresystem
Mental health
Health System Performance Report 2012
Mental health - Proportion of individuals formally screened for aMHD upon admission to a substance abusedisorders (SUD) specialty care setting (in Koen)
- Proportion of individuals that screened positivefor COD in a SUD specialty care setting thatreceived a MHD service (or at least one integratedservice) within 30 days of screening. (in Koen)
- Proportion of COD with an inpatient or day/nightepisode (SUD or MHD related) visit that have atleast one SUD and one MHD outpatient clinic visit(or one integrated treatment visit) within thirtydays of discharge (in Koen)
Mental health - % persons with a specified severe psychiatricdisorder in contact with the health care systemwho receive case management (all types)(coordination pour Herman 2006 in Koen)
Mental health - Patients in the denominator using intensive casemanagement (MHICM) divided by Patients in allcohorts (in Koen)
Mental health - Numerator
a) N of patients subsequently enrolled in MHICM
b) N of days following date of eligibility (pernumerator [a]) until client is enrolled in MHICM
Denominator: N of patients in a study cohort whohave at least three inpatient discharges or 30cumulative inpatient days in the study period andwere not enrolled in MHICM prior to meeting theinpatient utilization criteria. (in Koen)
Mental health - % patients with 4 ER visits or 2 hospitalizationsfor schizophrenia in 12-month period that are
KCE Report 196 S3

KCE Report 196S3
Health caresystem
Mental health
Health caresystem
Mental health
Health caresystem
Mental health
Health caresystem
Mental health
Health caresystem
Mental health
Hospital Mental health
Hospital Mental health
Hospital Mental health
Health System Performance Report 2012
enrolled in intensive case management (ICM). (inKoen)
Mental health - % people served in a year who had only onemental health contact (in Koen)
Mental health - % consumers who receive services that supportrecovery (in Koen)
Mental health - N patients diverted from criminal justice system(in Koen)
Mental health - N discharges for mental health specialtiesdelayed by 6 weeks or longer thanscheduled/1000 population (in Koen)
Mental health - % healthcare commission survey respondentsthat had an out-of-hours contact telephonenumber (in Koen)
Mental health - Total number of hours that all psychiatricinpatients were held in seclusion (Include patientsfor whom at least one seclusion event is reportedduring the month)
33
AHRQ
Mental health - Total number of hours that all patients admittedto a hospital-based inpatient psychiatric settingwere maintained in physical restraint. (Includepatients for whom at least one physical restraintevent is reported during the month).
33
AHRQ
Mental health - % patients admitted to a hospital-based inpatientpsychiatric setting who are screened within thefirst three days of admission for all of thefollowing: risk of violence to self or others,substance use, psychological trauma history andpatient strengths.
33
AHRQ
145
AHRQ
AHRQ
AHRQ

146
Hospital Mental health
Hospital Mental health
Health caresystem
Chronic illness
Outcome
Clinical Specialist care Mental health
Hospitaldischarge
Generic
Rehabilitation
Resource utilisation Primary care Generic
Health System Performance Report 2012
Mental health - % patients discharged from a hospital-basedinpatient psychiatric setting on two or moreantipsychotic medications with appropriatejustification.
33
AHRQ
Mental health - % patients discharged from a hospital-basedinpatient psychiatric setting on two or moreantipsychotic medications.
33
AHRQ
Chronic illness - Integrated Care Pathway Appraisal Tool(ICPAT)
59
= score the clinical pathway document in thepatient record
Clinical pathway (Belgium& The Netherlands)
Mental health - Substance abuse as Addiction Severity index(ASI)
43
- Psychiatric/psychological problems as GlobalSeverity index (GSI)
43
- Social adjustment (veteran’s currentemployment; size of social network)
43
- Housing (N of day homeless and N of dayhoused)
43
Veteran
Generic
Rehabilitation
- Total number of patients discharged from acompleted rehabilitation program for whom thereis documented evidence of functional gain / Totalnumber of patients discharged from a completedrehabilitation program.
36
Australian quality indicator
Rehabilitation indicators
Generic - % of referral leading to appointments (a)64
Considered as an outcomeof informational continuity
KCE Report 196 S3
AHRQ
AHRQ
Clinical pathway (Belgium& The Netherlands)
Veteran
Australian quality indicator
Rehabilitation indicators
Considered as an outcomeof informational continuity

KCE Report 196S3
Primary care Generic
Hospital Generic
Hospital Generic
Hospital Generic
Hospital Heart Failure(HF)
Hospital AcuteMyocardialInfarction(AMI)
Hospital Heart Failure(HF)
Health System Performance Report 2012
- % of appointments leading to consultation (b)64
- Overall completion rate (a x b)64
by the author.
Older urban
Generic - Regularity of care (checkups at least twice ayear), continuity of care (seeing the same GP forat least 2 years)
21
HealthLife (HRQOL)
Generic - Average length of stay in hospitals (ALOS)1
But considered as anindicator of efficiency byother authors
Generic - N of acute inpatient stays during themeasurement year that were followed by an acutereadmission for any diagnosis within 30 days andthe predicted probability of an acute readmission,for members 18 years of age and older.
33
NCQ
Generic - % hospitalisation within 30 days after discharge5
Heart Failure - % rehospitalization for congestive heart failure /Patients hospitalized for congestive heart failure
15AHRQ
AcuteMyocardialInfarction(AMI)
- Hospital 30-day, all-cause, risk-standardizedreadmission rate (RSRR) following AMIhospitalization : calculated as the ratio ofpredicted to expected readmissions, multiplied bythe national unadjusted rate. ("numerator" of theratio component = predicted N of readmissions foreach hospital within 30 days given the hospital'sperformance with its observed case mix.)
33
NCQM (Centers forMedicare & MedicaidServices)
Safety for IOM
Heart Failure - Hospital 30-day, all-cause, risk-standardizedreadmission rate (RSRR) following HFhospitalization : calculated as the ratio ofpredicted to expected readmissions, multiplied bythe national unadjusted rate. ("numerator" of theratio component = predicted N of readmissions for
NCQM (Centers forMedicare & MedicaidServices)
147
by the author.
Older urban
Health-Related Quality ofLife (HRQOL)
21
But considered as anindicator of efficiency byother authors
65, 66
NCQM (NCQA HEDIS)
AHRQ
NCQM (Centers forMedicare & MedicaidServices)
Safety for IOM
NCQM (Centers forMedicare & MedicaidServices)

148
Hospital Pneumonia
Health caresystem
Mental health/
Disability
Child
Generic
Asthma
Generic
Generic
Treatment plancompliance
Specialist care
Follow-up
Cancer
Specialist care
Follow-up
Cancer
Specialist care Mental health
Health System Performance Report 2012
each hospital within 30 days)33
Pneumonia - Hospital 30-day, all-cause, risk-standardizedreadmission rate (RSRR) following pneumoniahospitalization : calculated as the ratio ofpredicted to expected readmissions, multiplied bythe national unadjusted rate. ("numerator" of theratio component = predicted N of readmissions foreach hospital within 30 days)
33
NCQM (Centers forMedicare & MedicaidServices)
Safety for IOM
Mental health/
Disability
Child
- Resource Acquisition Needs subscale in theFamily Needs Survey (FNS)
67
(because a major function of service coordinationis to facilitate the acquisition of child and familysupport resources)
Time period = entry in thedisability services and 1year later.
No details given
Generic - Emergency department use5, 41
Asthma - Potentially avoidable emergency departmentencounters for asthma among adults and children/ U.S. population.
15
AHRQ
Generic - Hospitalisation & ED use combined5
Generic - Receipt of preventive services41
Cancer - Total number of patients who had radiotherapyfor glottic cancer (T1-2N0M0), who had completefollow-up / Total number of patients who receiveradiotherapy for glottic cancer.
36
Australian quality indicator
Radiation oncologyindicators
Cancer - Total number of patients who had radiotherapyfor breast conservation who had completefollow-up / Total number of patients who receiveradiotherapy for breast conservation.
36
Australian quality indicator
Radiation oncologyindicators
Mental health - Length of stay in the program43
Others indicators in Koen
KCE Report 196 S3
NCQM (Centers forMedicare & MedicaidServices)
Safety for IOM
Time period = entry in thedisability services and 1year later.
No details given
AHRQ
Australian quality indicator
Radiation oncologyindicators
Australian quality indicator
Radiation oncologyindicators
Others indicators in Koen

KCE Report 196S3
Specialist care Mental health
Specialist care Mental health
Health System Performance Report 2012
- N of AA meetings attended per week43
- Average weekly earnings in the work therapyprogram
43
- Toxicology screenings per week43
Mental health - % patients beginning a new episode of treatmentfor substance use disorder (SUD) who maintaincontinuous treatment involvement for at least90 days after qualifying date.
33
- % patients who were diagnosed with a newepisode of depression, and treated withantidepressant medication, and who remained onan antidepressant drug for at least 84 treatmentdays (12 weeks) after the Index PrescriptionDate
33
NQMC (Veteran healthadministration)
Mental health - N of months in the 6 month after the initialassessment in which the patient had at least 1visit
68
- % patient discharged from an inpatientpsychiatry program receiving any MH outpatienttreatment during the 1st 30 days or the first 3months after discharge (Yes/No)
43, 68
- total number of visits between the initial globalassessment functioning (GAF) and the last GAFwithin 180 days
68
- Average number of days between hospitaldischarge and service contact for primary mentalhealth separations. (in Koen)
- % persons hospitalized for primary mental healthdiagnoses with an ambulatory mental healthencounter with a mental health practitioner within7 and 30 days of discharge (Herman 2006 inKoen)
149
NQMC (Veteran healthadministration)

150
Patient satisfaction HospitalDischarge
Generic
Health System Performance Report 2012
- % persons discharged with a dual diagnosis ofpsychiatric disorder and substance abuse with atleast four psychiatric and at least four substanceabuse visits within the 12 months after discharge(Herman in Koen)
- % of persons hospitalized for psychiatric orsubstance-related disorder with at least one visitper month for 6 months after hospitalization(Herman in Koen)
- Proportion of persons with SMI lost to follow-upby community mental health services at sixmonths and one year (in Koen).
- Total N of emergency psychiatric encountersduring the past year that were followed by at leastone outpatient (non-emergency) care visit within 3days, divided by the total number of all emergencypsychiatric encounters during the past year (inKoen)
Generic - Transition / discharge planningactivities(PREPARED)
55
- Satisfied with community service
- Equipment met needs
- Overall satisfied with way hospital preparedpatient / carer for returning home
- Free text (has anything been done to deal withyour worries about managing at home/ have anyunexpected problems occurred)
- Use of health services in the week post-discharge (patient / carer): GP, specialists medicaldoctor, physiotherapist, pharmacist, occupationaltherapist, meals-on-wheels, domiciliary care,district nurse, hospital outpatient/emergencyclinic, other.
Focus on seniors 65 years+
KCE Report 196 S3
Focus on seniors 65 years

KCE Report 196S3
NS= not specified PCP= Primary Care provider
Table 10. Indicators of patient-centeredness
Category ofindicator
Type of measure
Level Focus
Structure
Acknowledgement of patients needs, wants, preference
Patients’ right Health caresystem
Generic
Hospital level Generic
Specialist care Mental health
Privacy Hospital level Generic
Health System Performance Report 2012
- Use of home support services : homemodifications, assistance with shopping, housecleaning, other.
- Extra out-of-pocket expenses: taxi fares, petrol,extra shopping, private health services, extrapharmacy costs, extra electricity
Total outcome score = % of the maximumpossible score
Type of measure Example of indicator
Focus
Acknowledgement of patients needs, wants, preference
Generic - Existence of a consumer/family charter of rights thathas been endorsed by the appropriate health authorityand/or government body (McEwan et al. 2001 in Koen)
Article about Mental health
Generic - % hospitals with patients’ right posted20
Modified indicators (from along questionnaire)
Mental health - Existence of a clear process for filing complaints (cfKoen)
Generic - % hospitals where consultation and treatment allowprivacy
20Modified inlong questionnaire)
151
Comments
Article about Mental health
Modified indicators (from along questionnaire)
Modified indicators (from along questionnaire)

152
Category ofindicator
Type of measure
Level Focus
Structure
Acknowledgement of patients needs, wants, preference
Ward level Generic
Hospital level Generic
Comfort preference Hospital level Generic
Hospital level Generic
Ward level Generic
Hospital level Generic
Ward level Generic
Providers skills of communication
Language need Health caresystem
Generic
Health System Performance Report 2012
Type of measure Example of indicator
Focus
Acknowledgement of patients needs, wants, preference
Generic - % wards where consultation and treatment allowprivacy
20Modified indicatorslong questionnaire)
Generic - % hospitals with written policy on confidentiality20
Modified indicatorslong questionnaire)
Generic - % hospitals offering patients plenty of choice in thefood provided
29Modified indicators
Generic - % hospitals offering choice in timing of meals20
Modified indicatorslong questionnaire)
Generic - % ward offering choice in timing of meals20
Modified indicatorslong questionnaire)
Generic - % hospitals offering a possibility of obtaining a singleroom upon request
20Modified inlong questionnaire)
Generic - % ward offering a possibility of obtaining a singleroom upon request
20Modified indicatorslong questionnaire)
Generic - % practices with linguistic services31
Patienthome
KCE Report 196 S3
Comments
Modified indicators (from along questionnaire)
Modified indicators (from along questionnaire)
Modified indicators
Modified indicators (from along questionnaire)
Modified indicators (from along questionnaire)
Modified indicators (from along questionnaire)
Modified indicators (from along questionnaire)
Patient-centered medicalhome
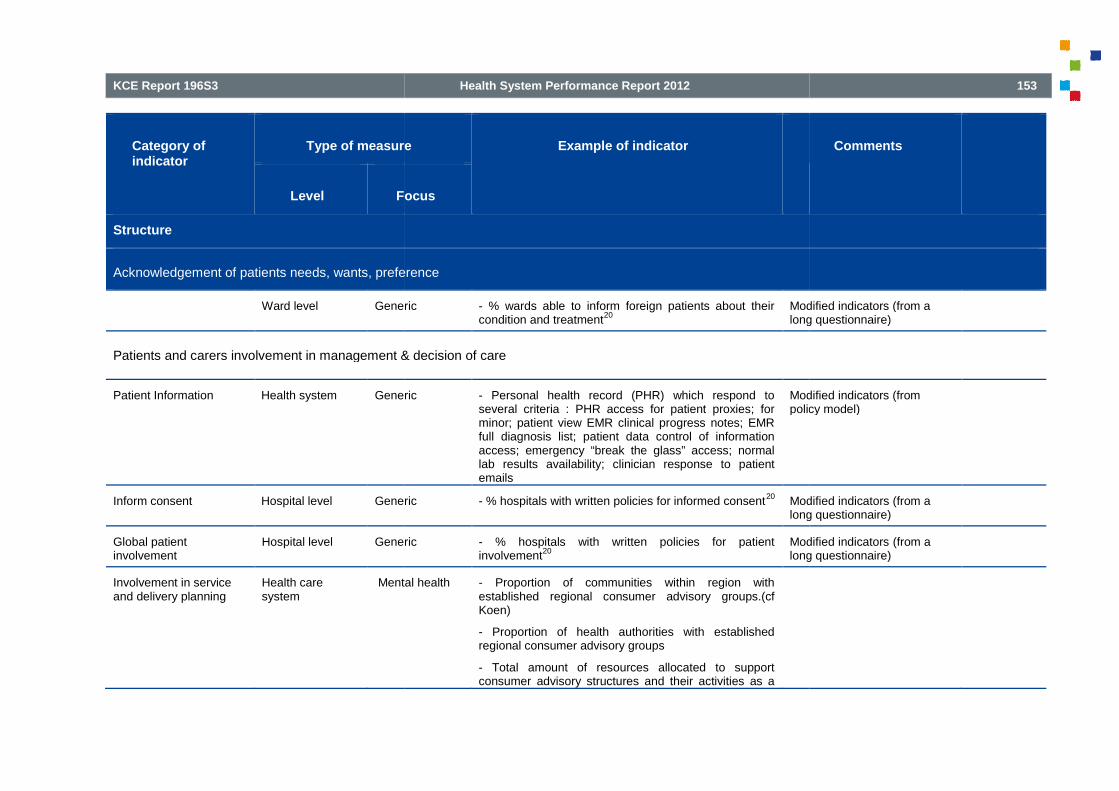
KCE Report 196S3
Category ofindicator
Type of measure
Level Focus
Structure
Acknowledgement of patients needs, wants, preference
Ward level Generic
Patients and carers involvement in management & decision of care
Patient Information Health system Generic
Inform consent Hospital level Generic
Global patientinvolvement
Hospital level Generic
Involvement in serviceand delivery planning
Health caresystem
Mental health
Health System Performance Report 2012
Type of measure Example of indicator
Focus
Acknowledgement of patients needs, wants, preference
Generic - % wards able to inform foreign patients about theircondition and treatment
20Modified indicators (from along questionnaire)
Patients and carers involvement in management & decision of care
Generic - Personal health record (PHR) which respond toseveral criteria : PHR access for patient proxies; forminor; patient view EMR clinical progress notes; EMRfull diagnosis list; patient data control of informationaccess; emergency “break the glass” access; normallab results availability; clinician response to patientemails
Modified indicators (frompolicy model)
Generic - % hospitals with written policies for informed consent20
Modified inlong questionnaire)
Generic - % hospitals with written policies for patientinvolvement
20Modified indicatorslong questionnaire)
Mental health - Proportion of communities within region withestablished regional consumer advisory groups.(cfKoen)
- Proportion of health authorities with establishedregional consumer advisory groups
- Total amount of resources allocated to supportconsumer advisory structures and their activities as a
153
Comments
Modified indicators (from along questionnaire)
Modified indicators (frompolicy model)
Modified indicators (from along questionnaire)
Modified indicators (from along questionnaire)

154
Category ofindicator
Type of measure
Level Focus
Structure
Acknowledgement of patients needs, wants, preference
Patient involvement inquality improvement
Hospital Generic
Hospital Generic
Health System Performance Report 2012
Type of measure Example of indicator
Focus
Acknowledgement of patients needs, wants, preference
percentage of total mental health budget. (cf Koen)
- Proportion of regional health authorities withinprovince/territory that have a designated person at themanagement level to facilitate partnerships andinvolvement of consumers and families. (cf Koen)
- Total N of full-time-equivalent (FTE) staff positions(either direct care or administrative) that are occupiedby consumers of mental health services, divided by thetotal number of FTE direct care and/or administrativepositions(cf Koen)
- % total mental health budget allocated to supportconsumer-directed initiatives. (cf Koen)
- N of self-help groups in the region with public sectorsupport. (cf Koen)
- Total N of family members on planning, evaluation,and Total Quality Management teams, divided by thetotal membership of these groups.(cf Koen)
- Patient Bill of rights.(cf Koen)
Generic - % hospitals where patients are involved indevelopment of criteria or standards
20Modified indicatorslong questionnaire)
Generic - % hospitals where patients are involved in design ofprotocols
20Modified indicatorslong questionnaire)
KCE Report 196 S3
Comments
Modified indicators (from along questionnaire)
Modified indicators (from along questionnaire)

KCE Report 196S3
Category ofindicator
Type of measure
Level Focus
Structure
Acknowledgement of patients needs, wants, preference
Hospital Generic
Hospital Generic
Hospital Generic
Hospital Generic
Hospital Generic
Hospital Generic
Hospital Generic
Hospital Generic
Ward Generic
Ward Generic
Health System Performance Report 2012
Type of measure Example of indicator
Focus
Acknowledgement of patients needs, wants, preference
Generic - % hospitals where patients are involved in evaluationof quality objectives
20Modified indicatorslong questionnaire)
Generic - % hospitals where patients are involved inparticipation in quality committee
20Modified indlong questionnaire)
Generic - % hospitals where patients are involved inparticipation in improvement project
20Modified indicatorslong questionnaire)
Generic - % hospitals where patients are involved in discussionof results of patient survey
20Modified indicatorslong questionnaire)
Generic - % hospitals with internal quality improvementincluding monitoring patients views
20Modified indicatorslong questionnaire)
Generic - % hospitals with internal quality improvementincluding analysis of patients’ complaints
20Modified indicatorslong questionnaire)
Generic - % hospitals with data on complaints reported togoverning board
20Modifiedlong questionnaire)
Generic - % hospitals with data on monitoring patients’ opinionreported to governing board
20Modified indlong questionnaire)
Generic - % wards where patients are invited to expressopinion
20Modified indicatorslong questionnaire)
Generic - % wards where patients are informed aboutcomplaints procedure
20Modified indicators
155
Comments
Modified indicators (from along questionnaire)
Modified indicators (from along questionnaire)
Modified indicators (from along questionnaire)
Modified indicators (from along questionnaire)
Modified indicators (from along questionnaire)
Modified indicators (from along questionnaire)
Modified indicators (from along questionnaire)
Modified indicators (from along questionnaire)
Modified indicators (from along questionnaire)
Modified indicators (from a

156
Category ofindicator
Type of measure
Level Focus
Structure
Acknowledgement of patients needs, wants, preference
Health System Performance Report 2012
Type of measure Example of indicator
Focus
Acknowledgement of patients needs, wants, preference
long questionnaire)
KCE Report 196 S3
Comments
long questionnaire)

KCE Report 196S3
Process
Acknowledgement of patients needs, wants, preferences
Patients’ right Hospital Generic
Patients’ needs Hospital Generic
Health caresystem
Generic
Children
Health caresystem
Generic
Children
Health caresystem
Generic
Children
Health caresystem
Generic
Children
Health caresystem
Generic
Children
Health caresystem
Generic
Children
Health System Performance Report 2012
Acknowledgement of patients needs, wants, preferences
Generic - % adult patients who reported whether theywere given information about patient rights.
33AHRQ
Generic - % adult inpatients who reported how often thehospital staff was responsive to their needs.
33AHRQ
Generic
Children
- Proportion of children whose parents hadconcerns about their child's learning, developmentand behavior and they received information toaddress their concerns.
33
AHRQ
Generic
Children
- % parents/guardians who reported whether theirchild's doctor addressed their child's growth anddevelopment.
33
AHRQ
Generic
Children
- % parents/guardians who reported whether theirchild's doctor gave advice on keeping their childsafe and healthy.
33
AHRQ
Generic
Children
- Proportion of children whose parents reportedcare provided was helpful or very helpful on coreaspects of preventive and developmental healthcare.
33
AHRQ
Generic
Children
- Proportion of children whose parents routinelyreceived all aspects of family-centered care.
33AHRQ
Generic
Children
- Average percentage of recommended aspects offamily-centered care regularly received.
33AHRQ
157
AHRQ
AHRQ
AHRQ
AHRQ
AHRQ
AHRQ
AHRQ
AHRQ

158
Process
Acknowledgement of patients needs, wants, preferences
Hospital Generic
Specialist care Palliativecare
Specialist care HIV
Health caresystem
Generic
Preference of care Specialist care Cancer
Specialist care Cancer
Health System Performance Report 2012
Acknowledgement of patients needs, wants, preferences
Generic - % adult inpatients who reported how often thehospital staff was responsive to their needs.
33AHRQ
Palliative - % patients in intensive care unit (ICU) palliativecare who have documentation of resuscitationstatus on or before Day One of ICU admission.
33
AHRQ
- % HIV positive adolescent and adult patientswho reported whether their providers asked themwhether they needed help to tell their sexualpartners about their HIV status and made areferral if needed.
33
AHRQ
Generic - % adult health plan members who reported howoften their health plans handled their claimsquickly and correctly.
33
AHRQ
Cancer - % patients with advanced cancer who areadmitted to the ICU and survive 48 hours forwhom the patient's preferences for care or anattempt to identify them was documented in themedical record within 48 hours of ICU admission.33
AHRQ
Cancer - % patients with advanced cancer who aremechanically ventilated in the ICU for whom thepatient's preference for mechanical ventilation orwhy this information was unavailable wasdocumented in the medical record within 48 hoursof admission to the ICU.
33
AHRQ
KCE Report 196 S3
AHRQ
AHRQ
AHRQ
AHRQ
AHRQ
AHRQ

KCE Report 196S3
Process
Acknowledgement of patients needs, wants, preferences
Specialist care End-of
Pain management Institution Generic
Hospital Generic
Specialist care Palliativecare
Specialist care Palliativecare
Specialist care Palliativecare
Specialist care Rheumato
Privacy Health care Generic
Health System Performance Report 2012
Acknowledgement of patients needs, wants, preferences
of-life - % healthcare professionals who affirm that intheir unit or area enquiries are always made aboutterminal patients' preferences regarding life-support procedures and treatment.
33
AHRQ
Generic - % of adult home health care patients whoreported whether their home health care providersaddressed specific care issues related to pain andmedication.
33
AHRQ
Generic - % adult inpatients who reported how often theirpain was controlled.
33AHRQ
Palliative - For patients in intensive care unit (ICU) palliativecare, % percent of 4-hour intervals (on Day Zeroand Day One of ICU admission) for which painwas assessed and documented.
33
AHRQ
Palliative - % 4-hour intervals (on Day Zero and Day One ofICU admission) for which the documented painscore was less than or equal to 3 in patientsIntensive care unit (ICU) palliative care.
33
AHRQ
Palliative - % patients with advanced cancer who died anexpected death who were referred for palliativecare prior to death (hospital-based or communityhospice) or there was documentation why therewas no referral.
33
AHRQ
Rheumato - For patients with osteoarthritis, % patient visitswith assessment for function and pain.
33AHRQ
Generic - % adult patients who reported whether anyone AHRQ
159
AHRQ
AHRQ
AHRQ
AHRQ
AHRQ
AHRQ
AHRQ
AHRQ

160
Process
Acknowledgement of patients needs, wants, preferences
system
Specialist care HIV
Specialist care HIV
Spiritual support Specialist care Palliativecare
Cultural needs Health caresystem
Generic
Specialist care Mental health
Health System Performance Report 2012
Acknowledgement of patients needs, wants, preferences
shared information regarding their counseling ortreatment that should have been kept private.
33
- % HIV positive adult patients who reported howoften their plan protected their confidentiality.
33AHRQ
- % HIV positive adolescent and adult patientswho reported how often the staff and theirproviders kept their HIV status confidential.
33
AHRQ
Palliative - % patients in intensive care unit (ICU) palliativecare who have documentation in the medicalrecord that spiritual support was offered to thepatient and/or family on or before Day Three ofICU admission.
33
AHRQ
Generic - % adult patients who reported whether the carethey received was responsive to their culturalneeds.
33
AHRQ
Mental health - Proportion of consumers within service providerpopulation of persons with serious mental illnesswho report that staff are sensitive to theirlanguage and ethnic/cultural background. (cfKoen)
- Proportion of service staff who are culturally“literate”; i.e. knowledgeable about the history,traditions and beliefs of ethno-cultural minorities(cfKoen)
- % consumers who report that staff are sensitiveto their ethnicity, language, culture, and age. (cf
KCE Report 196 S3
AHRQ
AHRQ
AHRQ
AHRQ

KCE Report 196S3
Process
Acknowledgement of patients needs, wants, preferences
Patients strengths Hospitals Mental health
Psycho-social aspects Provider level Diabetes
GP Generic
Health caresystem
Generic
Children
Health caresystem
Generic
Children
Health caresystem
Generic
Children
Health caresystem
Generic
Children
Health System Performance Report 2012
Acknowledgement of patients needs, wants, preferences
Koen)
Mental health - Is there documentation in the medical record thatthe patient was screened for a minimum of twopatient strengths within the first three days ofadmission?
38
JCAHO
Diabetes - Health care professionals should be aware ofpotential effects of life events on stress and self-care behaviour
69
Generic - Proportion of all GPs questions relating topsychosocial and lifestyle issues / total GP talk inthe consultation.
23
Videoteaped
Generic
Children
- Assessment of psychosocial well-being ofparent(s) in the family: average percentage ofrecommended topics assessed.
33
AHRQ
Generic
Children
- Assessment of psychosocial well-being ofparent(s) in the family: proportion of childrenwhose parents were assessed for one or moretopics related to psychosocial well-being.
33
AHRQ
Generic
Children
- Assessment of smoking, substance abuse,safety, and firearms risks in the family by a child'sdoctor(s) or other health care provider(s):proportion of children whose parents wereassessed for one or more risk factors.
33
AHRQ
Generic
Children
- proportion of children who were determined tobe at significant risk for developmental,behavioral, or social delays who received some
AHRQ
161
JCAHO
Videoteaped
AHRQ
AHRQ
AHRQ
AHRQ

162
Process
Acknowledgement of patients needs, wants, preferences
Specialist care HIV
Specialist care HIV
Comfort Hospital Generic
Hospital Generic
Social support Health caresystem
Generic
Specialist care Palliativecare
Specialist care HIV
Health System Performance Report 2012
Acknowledgement of patients needs, wants, preferences
level of follow-up health care.33
- HIV positive adolescent and adult patients whoreported whether their providers or casemanagers asked them how they were feelingemotionally and made a referral to a mental healthprovider, counselor, or support group if needed.
33
AHRQ
- % HIV positive adolescent and adult patientswho reported whether their providers or casemanagers asked them about their life situation(housing, their finances, etc.), and made a referralif needed.
33
AHRQ
Generic - % adult inpatients who reported how often thearea around their room was quiet at night.
33AHRQ
Generic - % adult inpatients who reported how often theirroom and bathroom were kept clean.
33AHRQ
Generic - % adult patients who reported whether someonetalked to them about including family or friends intheir counseling or treatment.
33
AHRQ
Palliative - % patients in intensive care unit (ICU) palliativecare who have documentation in the medicalrecord that social work support was offered to thepatient and/or family on or before Day Three ofICU admission.
33
AHRQ
- % HIV positive adolescent and adult patientswho reported how often their case managerinvolved their family and friends in their care as
AHRQ
KCE Report 196 S3
AHRQ
AHRQ
AHRQ
AHRQ
AHRQ
AHRQ
AHRQ

KCE Report 196S3
Process
Acknowledgement of patients needs, wants, preferences
Specialist care Mental health
Providers skill of communication
Listening ability Medical centres Generic
Specialist care HIV
Specialist care HIV
Explaining ability Health care Generic
Health System Performance Report 2012
Acknowledgement of patients needs, wants, preferences
much as they needed.33
Mental health - proportion of patients with schizophrenia whererelatives accept an offer of contact with thetreatment system.
33
AHRQ
Generic VA Patient satisfaction with care survey52
Preferences 4 item/5
- When you saw the provider, did he or she giveyou a chance to explain the reason for your visit?
- Did the provider listen to what you had to say?
- Were you involved in decisions about your careas much as you wanted?
- Was the provider willing to talk to your family orfriends about your health or treatment?
- Did the provider ask how your family or livingsituation might affect your health?
National VA (veterans affairs)Patient Satisfaction with CareSurvey (based on PickerCommonwealth approach)
From
- % HIV positive adolescent and adult patientswho reported how often their providers ignored acomplaint about their medical care.
33
JCAHO
- % HIV positive adolescent and adult patientswho reported how often they found it hard to talkto their case manager.
33
JCAHO
Generic - % patients who reported that they were given an Dutch performance
163
AHRQ
National VA (veterans affairs)Patient Satisfaction with CareSurvey (based on PickerCommonwealth approach)
From a long questionnaire
JCAHO
JCAHO
Dutch performance

164
Process
Acknowledgement of patients needs, wants, preferences
system
Medical centres Generic
Specialist care HIV
Health System Performance Report 2012
Acknowledgement of patients needs, wants, preferences
understandable explanations by care providers16
Generic VA Patient satisfaction with care survey52
Patient Education/Information 7 item
- Did the provider explain why you needed testsin a way that you could understand?
- When you asked questions, did you get answersyou could understand?
- After the tests were done, did the providerexplain the results in a way that you couldunderstand?
- Did someone explain the purpose of anyprescribed medicines in a way you couldunderstand?
- Did someone tell you about side effects of yourmedicines in a way you could understand?
- Did the provider explain what to do if problemsor symptoms continued, got worse, or cameback?
- Did you get as much information about yourhealth and/or treatment as you wanted from theprovider?
National VA (veterans affairs)Patient SatSurvey (based on PickerCommonwealth approach)
From a long questionnaire
- % HIV positive adolescent and adult patientswho reported how often their providers' answersto their questions about their HIV health care werehard to understand.
33
AHRQ
KCE Report 196 S3
National VA (veterans affairs)Patient Satisfaction with CareSurvey (based on PickerCommonwealth approach)
From a long questionnaire
AHRQ

KCE Report 196S3
Process
Acknowledgement of patients needs, wants, preferences
Specialist care HIV
Specialist care HIV
Specialist care HIV
Courtesy/Respect Health caresystem:providers
Generic
PCP Generic
PCP Generic
Children
Specialist care Generic
Specialist care HIV
Health System Performance Report 2012
Acknowledgement of patients needs, wants, preferences
- % HIV positive adult patients who reported howoften the written materials about their plan and itsbenefits were difficult to understand.
33
AHRQ
- % HIV positive adolescent and adult patientswho reported whether their providers explainedthe side effects of their HIV medications in a waythey could understand.
33
AHRQ
- % HIV positive adolescent and adult patientswho reported how often their providers made surethey understood what their lab test results (suchas CD4 and viral load) meant for their health.
33
AHRQ
Generic - % care users who reported that they weretreated politely by care providers
16Dutch performance
Generic - % adult primary care patients who reported howoften their doctor's office staff was courteous andhelpful.
33
AHRQ
Generic
Children
- % parents/guardians who reported how oftentheir child's doctor's office staff was courteous andhelpful.
33
AHRQ
Generic - % adult specialty care patients who reportedhow often their doctor's office staff was courteousand helpful.
33
AHRQ
- % HIV positive adolescent and adult patientswho reported how often their visits with theirproviders got interrupted (by phone calls, other
AHRQ
165
AHRQ
AHRQ
AHRQ
Dutch performance
AHRQ
AHRQ
AHRQ
AHRQ

166
Process
Acknowledgement of patients needs, wants, preferences
Specialist care HIV
Medical centres Generic
Time spend byproviders
Health caresystem
Generic
Health caresystem
Generic
GP Generic
Specialist care HIV
Emotional support GP Generic
Health System Performance Report 2012
Acknowledgement of patients needs, wants, preferences
patients, etc.).33
- % HIV positive adolescent and adult patientswho reported how often they found their providersto be accepting and non-judgmental of their lifeand health care choices.
33
AHRQ
Generic VA Patient satisfaction with care survey52
Courtesy 2 item
- How would you rate the courtesy of the personwho made your appointment?
52
- Overall, how would you rate the courtesy of yourprovider?
52
National VA (veterans affairs)Patient Satisfaction with CareSurvey (based on PickerCommonwealth approach)
From a long questionnaire
Generic - % care users who reported that care providersspent enough time with them (by type of care)
16Dutch performance
Generic - % routine booked appointments with doctors inthe practice that are not less than 10 minutes (8minutes for practices with only an open surgerysystem).
33
AHRQ
Generic - Total N of patient ‘utterances’ to total GP‘utterances’ indicating the degree to which the GPgives the patient space to tell their ‘story’.
23
Videotaped
- % HIV positive adolescent and adult patientswho reported how often they wanted theirproviders to spend more time with them.
33
AHRQ
Generic - Proportion of all GPs social talk and expressions Videoteaped
KCE Report 196 S3
AHRQ
National VA (veterans affairs)Patient Satisfaction with CareSurvey (based on PickerCommonwealth approach)
From a long questionnaire
Dutch performance
AHRQ
Videotaped
AHRQ
Videoteaped

KCE Report 196S3
Process
Acknowledgement of patients needs, wants, preferences
GP Generic
GP Generic
Medical centres Generic
Specialist care HIV
Health System Performance Report 2012
Acknowledgement of patients needs, wants, preferences
of reassurance & encouragement / total GP talk inthe consultation (verbal caring).
23
Generic - Observer ratings of GP ‘warmth-friendliness’ and‘interest-concern’ / maximum score across the 2rating scales (non verbal caring).
23
Videoteaped
Generic - Patients' experience with their general practiceconsultation: overall mean Consultation andRelational Empathy (CARE) score among patientswho completed the CARE measure.
33
AHRQ
Generic VA Patient satisfaction with care survey52
Emotional Support 3 item/4
- Did you have concerns that you wanted todiscuss but did not?
- If you and the provider did not talk about yourconcerns, was it because:
(1) you were embarrassed about bringing themup, (2) you didn’t have time to bring them up, (3)provider did not have time to listen, (4) providerdidn’t ask about your concerns, (5)too manyinterruptions/no privacy
- Did you have confidence and trust in theprovider you saw?
- Did you have trouble understanding the providerbecause of a language problem?
National VA (veterans affairs)Patient Satisfaction with CareSurvey (based on PickerCommonwealth approach)
From a long questionnaire
- % HIV positive adolescent and adult patientswho reported how often the staff were unfriendly
AHRQ
167
Videoteaped
AHRQ
National VA (veterans affairs)Patient Satisfaction with CareSurvey (based on PickerCommonwealth approach)
From a long questionnaire
AHRQ

168
Process
Acknowledgement of patients needs, wants, preferences
Specialist care HIV
Specialist care HIV
Language Health caresystem
Generic
Health caresystem
Generic
Health caresystem
Generic
Health caresystem
Generic
Health caresystem
Generic
Health System Performance Report 2012
Acknowledgement of patients needs, wants, preferences
to them while they checked in and waited for theirvisit.
33
- % HIV positive adolescent and adult patientswho reported how often they felt comfortablesharing their feelings and problems with their casemanager.
33
AHRQ
- % HIV positive adolescent and adult patientswho reported how often they felt uncomfortabletalking about personal or intimate issues with theirproviders.
33
AHRQ
Generic - % patient which received an interpreter ortranslated materials to facilitate communication /patients deaf or not speaking english
34
Focus on vulnerable elders
Modified indicator
Generic - % limited English-proficient (LEP) patientsreceiving both initial assessment and dischargeinstructions supported by assessed and trainedinterpreters or from bilingual providers andbilingual workers/employees assessed forlanguage proficiency.
33
AHRQ
Generic - % encounters where the wait time for aninterpreter is 15 minutes or less.
33AHRQ
Generic - % patient visits and admissions where preferredspoken language for health care is screened andrecorded.
33
AHRQ
Generic - % patient visits and admissions where preferredwritten language for health care is screened and
AHRQ
KCE Report 196 S3
AHRQ
AHRQ
Focus on vulnerable elders
Modified indicator
AHRQ
AHRQ
AHRQ
AHRQ

KCE Report 196S3
Process
Acknowledgement of patients needs, wants, preferences
Specialist care HIV
Global communicationskills
PCP Generic
PCP Generic
PCP Generic
PCP Generic
PCP Generic
PCP Generic
PCP Generic
Children
Health System Performance Report 2012
Acknowledgement of patients needs, wants, preferences
recorded.33
- % HIV positive adolescent and adult patientswho reported how often they got services in thelanguage they wanted.
33
AHRQ
Generic - Measure of patient-centered communication(MPCC) during an standardised patientencounter
70or current patients
71, in 3 components
: Exploring both the disease and the illnessexperience; understanding the whole person;finding common ground (about the nature of theproblem and its management).
Audiotaped analyse
Generic - Claims data from patients70
Generic - Patients survey : 5-item HCCQ autonomy scale;2 subscales from the PCAS; 4 item PCAS-K & 8item PCAS-T; 6 option Likert scale question onsatisfaction
70
Generic - Claims data from patients; MPCC et Patientssurvey (see above)
70
Generic - Patient perception of Patient-centeredness: 14-item
71No details given
Generic - % adult primary care patients who reported howoften their doctors communicated well.
33AHRQ
Generic
Children
- % parents/guardians who reported how oftentheir child's doctor communicated well.
33AHRQ
169
AHRQ
Audiotaped analyse
No details given
AHRQ
AHRQ

170
Process
Acknowledgement of patients needs, wants, preferences
Specialist care Generic
Specialist care Nephrology
Hospital Generic
Hospital doctors Generic
Hospital nursing Generic
Institution Generic
Poor communication Provider level
(in & out)
Generic
Adults
Provider level
(in & out)
Generic
Children
Health System Performance Report 2012
Acknowledgement of patients needs, wants, preferences
Generic - % adult specialty care patients who reportedhow often their doctors communicated well.
33AHRQ
Nephrology - % in-center hemodialysis patients who reportedhow often their nephrologist cared andcommunicated well.
33
AHRQ
Generic - % adult inpatients who reported how often thehospital staff communicated well aboutmedications.
33
AHRQ
Generic - % adult inpatients who reported how often theirdoctors communicated well.
33AHRQ
Generic - % adult inpatients who reported how often theirnurses communicated well.
33AHRQ
Generic - mean score on seven items asking abouthelpfulness of office staff, overall rating of careand whether doctor/other providers listencarefully, explain things clearly, respect you,spend enough time.
33
AHRQ
Generic
Adults
- % adults who had a doctor's office or clinic visitin the last 12 months who reported poorcommunication with health providers / civiliannon institutionalised population aged 18 & overwho had a doctor’s office or clinic visit in the last12 months
15
AHRQ
Generic
Children
- % children who had a doctor's office or clinic visitin the last 12 months whose parents reported poor
AHRQ
KCE Report 196 S3
AHRQ
AHRQ
AHRQ
AHRQ
RQ
AHRQ
AHRQ
AHRQ

KCE Report 196S3
Process
Acknowledgement of patients needs, wants, preferences
Hospitalprovider level
Generic
Specialist care HIV
Health System Performance Report 2012
Acknowledgement of patients needs, wants, preferences
communication with health providers / Civiliannon institutionalised population under age 18 whohad a doctor's office or clinic visit in the last 12months.
15
Generic - % adult hospital patients who reported poorcommunication with nurses and doctors
= composite indicators that combines 4 measures:data on providers who sometimes or neverlistened carefully, explained things clearly,respected what patients had to say, and spentenough time with patients.
15
AHRQ
- % HIV positive adolescent and adult patientswho reported how often they had questions theywanted to ask their providers about their HIV carebut did not ask.
33
AHRQ
171
AHRQ
AHRQ

172
Patients involvement in management & decision of care
Patients/carersInformation
Health caresystem
Generic
Health caresystem
Generic
Health caresystem
Generic
Health caresystem
Generic
Children
Health caresystem
Generic
Children
Health caresystem
Generic
Children
Hospital ward Generic
Specialist care Anaesthesia
Specialist care Anaesthesia
Health System Performance Report 2012
Patients involvement in management & decision of care
Generic - % adult patients who reported whether they weretold about medication side effects.
33AHRQ
Generic - % adult patients who reported whether they weretold about other ways to receive treatment aftertheir benefits were used up.
33
AHRQ
Generic - % adult patients who reported whether they wereprovided information about treatment options.
33AHRQ
Generic
Children
- proportion of children whose parents received allhealth information.
33AHRQ
Generic
Children
- proportion of parents who had their informationalneeds met.
33AHRQ
Generic
Children
- % parents or guardians of health plan memberswho reported their experiences in getting neededinformation for their children with chronicconditions.
33
NCQM (CAHPSquestionnaire; HEDIS)
Generic - % wards with patients informed at dischargeabout follow-up care
20Modified inlong questionnaire)
Anaesthesia - Total number of patients who have receivedinformation about the risks associated with theanaesthesia technique, as documented in thepatient chart / Total number of patients receivinganaesthesia care.
36
Australian quality indicators
Anesthesia indicators
Anaesthesia - Total number of patients who have receivedwritten, verbal or visual information on theanaesthesia technique, as documented in the
Australian quality indicators
Anesthesia indicators
KCE Report 196 S3
AHRQ
AHRQ
AHRQ
AHRQ
AHRQ
NCQM (CAHPSquestionnaire; HEDIS)
Modified indicators (from along questionnaire)
Australian quality indicators
Anesthesia indicators
Australian quality indicators
Anesthesia indicators
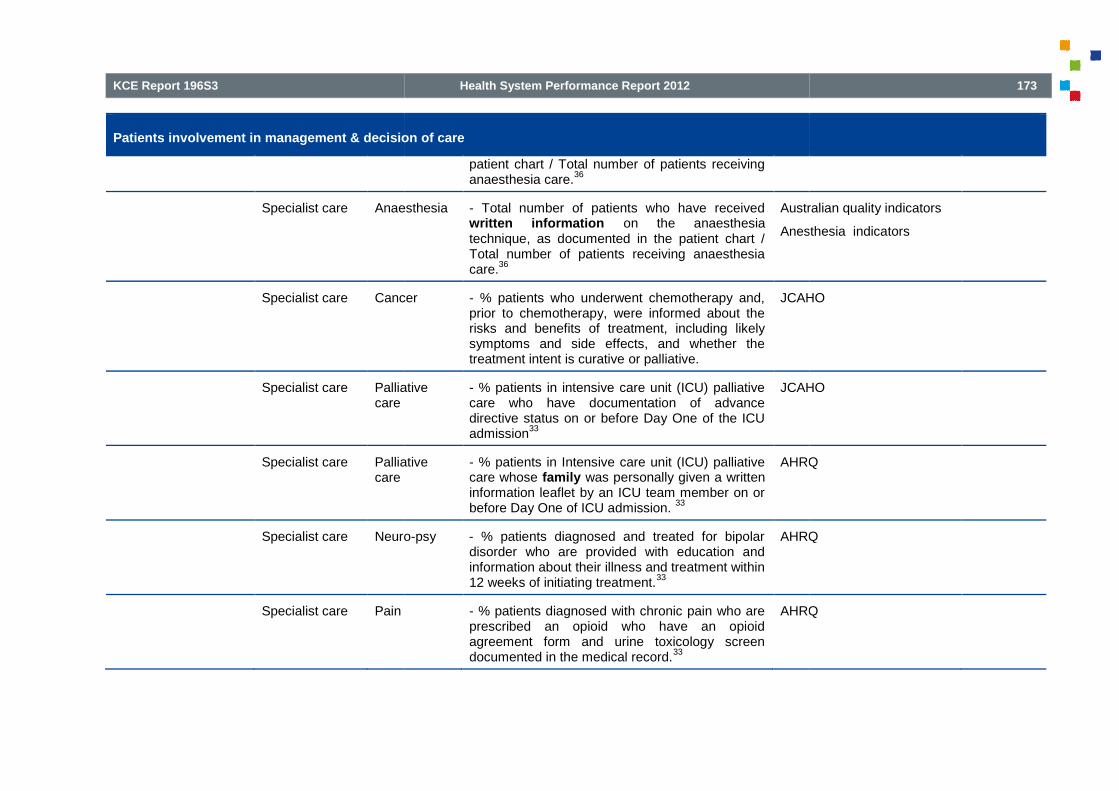
KCE Report 196S3
Patients involvement in management & decision of care
Specialist care Anaesthesia
Specialist care Cancer
Specialist care Palliativecare
Specialist care Palliativecare
Specialist care Neuro
Specialist care Pain
Health System Performance Report 2012
Patients involvement in management & decision of care
patient chart / Total number of patients receivinganaesthesia care.
36
Anaesthesia - Total number of patients who have receivedwritten information on the anaesthesiatechnique, as documented in the patient chart /Total number of patients receiving anaesthesiacare.
36
Australian quality indicators
Anesthesia indicators
Cancer - % patients who underwent chemotherapy and,prior to chemotherapy, were informed about therisks and benefits of treatment, including likelysymptoms and side effects, and whether thetreatment intent is curative or palliative.
JCAHO
Palliative - % patients in intensive care unit (ICU) palliativecare who have documentation of advancedirective status on or before Day One of the ICUadmission
33
JCAHO
Palliative - % patients in Intensive care unit (ICU) palliativecare whose family was personally given a writteninformation leaflet by an ICU team member on orbefore Day One of ICU admission.
33
AHRQ
Neuro-psy - % patients diagnosed and treated for bipolardisorder who are provided with education andinformation about their illness and treatment within12 weeks of initiating treatment.
33
AHRQ
Pain - % patients diagnosed with chronic pain who areprescribed an opioid who have an opioidagreement form and urine toxicology screendocumented in the medical record.
33
AHRQ
173
Australian quality indicators
Anesthesia indicators
JCAHO
JCAHO
AHRQ
AHRQ
AHRQ

174
Patients involvement in management & decision of care
Specialist care Obstetric/pain
Specialist care Obstetric/
Routineprenatal care
Specialist care Obstetric/
Routineprenatal care
Specialist care Gynaecology
Specialist care HIV
Specialist care Urology
Inform consent Healthcaresystem
Generic
Health System Performance Report 2012
Patients involvement in management & decision of care
Obstetric/pai - % obstetric patients who have documentation ofrisks and benefits of spinal analgesia/epidural,during the time period under study.
33
AHRQ
Obstetric/
Routineprenatal care
- % pregnant women who report to have receivedcounseling and education by the 28th-week visit.
33AHRQ
Obstetric/
Routineprenatal care
- % vaginal birth after cesarean (VBAC)-eligiblewomen who receive general education describingrisks and benefits of VBAC (e.g., the AmericanCollege of Obstetricians and Gynecologistspamphlet on VBAC).
33
AHRQ
Gynaecology - % women who have been prescribed an oral orpatch contraceptive method who have alsoreceived information from the practice about longacting reversible methods of contraception in theprevious 15 months.
33
AHRQ
- % HIV positive adolescent and adult patientswho reported whether their providers explained tothem what kinds of medical tests they should begetting and how often they should get them.
33
AHRQ
Urology - % in-center hemodialysis patients who reportedwhether specified information was provided tothem.
33
AHRQ
Generic - % healthcare professionals who affirm that intheir unit or area steps are always taken to ensurethat patients have understood the risks andcomplications before they sign the informedconsent form.
33
AHRQ
KCE Report 196 S3
AHRQ
AHRQ
AHRQ
AHRQ
AHRQ
AHRQ
AHRQ

KCE Report 196S3
Patients involvement in management & decision of care
Hospital ward Generic
Specialist care Anaesthesia
Specialist care Transfusion
Specialist care Radiotherapy
Self-managementsupport
Health caresystem
Generic
Health caresystem
Generic
Children
Health caresystem
Generic
Health care Generic
Health System Performance Report 2012
Patients involvement in management & decision of care
Generic - % wards where patients give written consent totreatment
20Modified indicatorslong questionnaire)
Anaesthesia - Total number of obstetric patients for whomthere is documented evidence of informedconsent for labour ward epidural/spinal analgesia/ Total number of obstetric patients receivingepidural/spinal/combined spinal-epiduralprocedures in the labour ward.
36
Australian quality indicators
Anesthesia indicators
Transfusion - Total number of transfusion episodes whereinformed patient consent was not documented /Total number of transfusion episodes.
36
Australian quality indicators
HospitalIndicators
Radiotherapy - Total number of patients who have informedconsent recorded in the medical record beforereceiving radiotherapy / Total number of patientsreceiving radiotherapy.
33, 36
Australian quality indicators
Radiation oncology indicators
Generic - % adult health plan members who reported howoften their doctor and other health provider talkedabout specific things they could do to preventillness.
33
NCQM (CAHPSquestionnaire; HEDIS)
Generic
Children
- % parents or guardians who reported how oftenthey and their child's doctor or other healthprovider talked about specific things they could doto prevent illness in their child.
33
NCQM (CAHPSquestionnaire; HEDIS)
Generic - % adult patients who reported whether they weregiven enough information to manage theircondition.
33
AHRQ
Generic - patients, regardless of age, discharged from aninpatient facility to home or any other site of care,
AHRQ
175
Modified indicators (from along questionnaire)
Australian quality indicators
Anesthesia indicators
Australian quality indicators
Hospital-Wide ClinicalIndicators
Australian quality indicators
Radiation oncology indicators
NCQM (CAHPSquestionnaire; HEDIS)
NCQM (CAHPSquestionnaire; HEDIS)
AHRQ
AHRQ

176
Patients involvement in management & decision of care
system
Health caresystem
Generic
Health caresystem
Generic
Children
Health caresystem(hospital)
Generic
Primary care Chronicillness
Specialist care Mental health
Specialist care Neuromuscular
Health System Performance Report 2012
Patients involvement in management & decision of care
or their caregiver(s), who received a reconciledmedication list at the time of discharge including,at a minimum, medications in the specifiedcategories.
33
Generic - % encounters for cold symptoms (phone careand/or office visits) for which there isdocumentation of home treatment education.
33
AHRQ
Generic
Children
- proportion of children whose parents reportedcare had a positive influence on their confidencein parenting their child and managing theirresponsibilities.
33
AHRQ
Generic - % adult inpatients who reported whether theywere provided specific discharge information.
33AHRQ
Chronicillness
- PCRS (Assesment of Primary Care Resourcesand Supports for chronic disease self-management) Composite questionnaire forprimary care team to assess their current capacityto support & implement consistent patient-centered self-management.
72
PC team
Mental health - N of adults-ado receiving illness self-management training (e.g. Self-managementincludes psychoeducation, behavioral tailoring,early warning sign recognition, coping strategies,social skills training, and cognitive behavioraltreatment) / N of adults-ado receiving mentalhealth services. (cf Koen)
Neuro-muscular
- % patients with low back pain diagnosis whoreceived education regarding low back pain self-
AHRQ
KCE Report 196 S3
AHRQ
AHRQ
AHRQ
PC team
AHRQ

KCE Report 196S3
Patients involvement in management & decision of care
Specialist care Asthma
Specialist care Asthma
Specialist care Cardio
Specialist care Cardio
Specialist care Cardio
Specialist care Cardio
Health System Performance Report 2012
Patients involvement in management & decision of care
care and the importance of maintaining an activelifestyle.
33
Asthma - % asthmatic patients with documented self-management goals in the last 12 months.
33
AHRQ
Asthma - % pediatric asthma inpatients withdocumentation that they or their caregivers weregiven a written Home Management Plan of Care(HMPC) document.
33
AHRQ
Cardio - % hypertensive patients who receive educationon the usage of non-pharmacologicaltreatments.
33
AHRQ
Cardio - % hypertensive patients with a home bloodpressure monitoring device who have beeneducated in the correct technique for bloodpressure measurement and monitoring.
33
AHRQ
Cardio - % hospitalized patients at risk for venousthromboembolism who have venousthromboembolism education within 24 hours ofadmission that includes: 1) venousthromboembolism risk, 2) signs and symptoms, 3)early and frequent mobilization and 4) clinicallyappropriate treatment/prophylaxis methods.
33
AHRQ
Cardio - % patients diagnosed with confirmed VTE thatare discharged to home, to home with homehealth or home hospice, or discharged/transferredto court/law enforcement on warfarin with writtendischarge instructions that address all four criteria:compliance issues, dietary advice, follow-upmonitoring, and information about the potential for
AHRQ
177
AHRQ
AHRQ
AHRQ
AHRQ
AHRQ
AHRQ
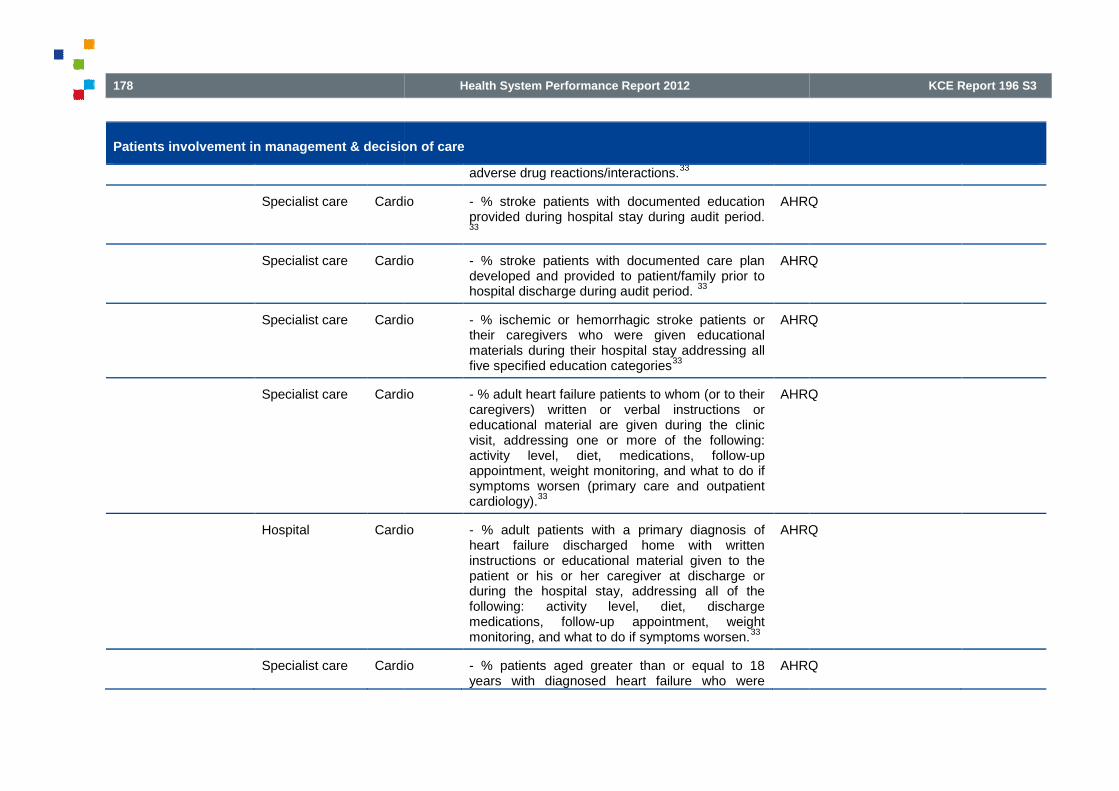
178
Patients involvement in management & decision of care
Specialist care Cardio
Specialist care Cardio
Specialist care Cardio
Specialist care Cardio
Hospital Cardio
Specialist care Cardio
Health System Performance Report 2012
Patients involvement in management & decision of care
adverse drug reactions/interactions.33
Cardio - % stroke patients with documented educationprovided during hospital stay during audit period.33
AHRQ
Cardio - % stroke patients with documented care plandeveloped and provided to patient/family prior tohospital discharge during audit period.
33
AHRQ
Cardio - % ischemic or hemorrhagic stroke patients ortheir caregivers who were given educationalmaterials during their hospital stay addressing allfive specified education categories
33
AHRQ
Cardio - % adult heart failure patients to whom (or to theircaregivers) written or verbal instructions oreducational material are given during the clinicvisit, addressing one or more of the following:activity level, diet, medications, follow-upappointment, weight monitoring, and what to do ifsymptoms worsen (primary care and outpatientcardiology).
33
AHRQ
Cardio - % adult patients with a primary diagnosis ofheart failure discharged home with writteninstructions or educational material given to thepatient or his or her caregiver at discharge orduring the hospital stay, addressing all of thefollowing: activity level, diet, dischargemedications, follow-up appointment, weightmonitoring, and what to do if symptoms worsen.
33
AHRQ
Cardio - % patients aged greater than or equal to 18years with diagnosed heart failure who were
AHRQ
KCE Report 196 S3
AHRQ
AHRQ
AHRQ
AHRQ
AHRQ
AHRQ

KCE Report 196S3
Patients involvement in management & decision of care
Specialist care Cardio
Hospital Cardio
Specialist care Cardio
Specialist care Neuro
Specialist care Neuro
Specialist care Neuro
Health System Performance Report 2012
Patients involvement in management & decision of care
provided with patient education on diseasemanagement and health behavior changes duringone or more visit(s).
33
Cardio - % adult heart failure patients who have usedtobacco anytime during the previous year andwho were given smoking cessation advice orcounseling at the last clinic visit (primary care andoutpatient cardiology).
33
AHRQ
Cardio - % adult patients with a primary diagnosis ofheart failure who have used tobacco anytimeduring the year prior to hospital arrival and whoare given smoking cessation advice or counselingduring the hospital stay or at discharge.
33
AHRQ
Cardio - % people diagnosed with hypertensiondiagnosed after 1 April 2009 who are givenlifestyle advice in the last 15 months for:increasing physical activity, smoking cessation,safe alcohol consumption and healthy diet.
33
AHRQ
Neuro - % patients with a diagnosis of depression withdocumented self-management goals set within thelast 12 months.
33
AHRQ
Neuro - % patients diagnosed with ADHD whose medicalrecord contains documentation that the cliniciandiscussed the need for school-based supportsand educational service options for children withADHD.
33
AHRQ
Neuro - % migraineurs who have documentation in themedical record that they have received writteneducational materials on migraines at a
AHRQ
179
AHRQ
AHRQ
AHRQ
AHRQ
AHRQ
AHRQ

180
Patients involvement in management & decision of care
Specialist care HIV
Specialist care HIV
Specialist care HIV
Specialist care HIV
Specialist care HIV
Specialist care Urology
Specialist care Gyneco
Health System Performance Report 2012
Patients involvement in management & decision of care
clinic/office visit.
- % HIV positive adolescent and adult patientswho reported how often HIV-specific educationalmaterials were available for them to read.
33
AHRQ
- % HIV positive adolescent and adult patientswho reported how often their case manager wasgood at showing them how they could helpthemselves.
33
AHRQ
- % HIV positive adolescent and adult patientswho reported whether their providers explained tothem how to avoid getting sick.
33
AHRQ
- % HIV positive adolescent and adult patientswho reported whether their providers suggestedways to help them remember to take their HIVmedications.
33
AHRQ
- % HIV positive adolescent and adult patientswho reported how often their providers told themhow important it was to keep their appointments.33
AHRQ
Urology - For patient with advanced chronic kidneydisease (CKD), % patients with documentationthat education was provided.
33
AHRQ
Gyneco - % women prescribed emergency hormonalcontraception at least once in the year by thepractice who have received information from thepractice about long acting reversible methods ofcontraception at the time of, or within one monthof, the prescription.
33
AHRQ
KCE Report 196 S3
AHRQ
AHRQ
AHRQ
AHRQ
AHRQ
AHRQ
AHRQ

KCE Report 196S3
Patients involvement in management & decision of care
Specialist care Diabetes
Specialist care Cardio
Specialist care Mental health
Specialist care Hepatitis C
Specialist care Mental health
Health System Performance Report 2012
Patients involvement in management & decision of care
Diabetes - % patients aged 18 years and older with adiagnosis of diabetes and foot ulcer who receivededucation regarding appropriate foot care ANDdaily inspection of the feet within the 12 monthreporting period.
33
AHRQ
Cardio - % patients aged 18 years and older with adiagnosis of venous ulcer who received educationregarding the need for long term compressiontherapy including interval replacement ofcompression stockings within the 12 monthreporting period.
33
AHRQ
Mental health - % patients aged 18 years and older with adiagnosis of current alcohol dependence whowere counseled regarding psychosocial ANDpharmacologic treatment options for alcoholdependence within the 12 month reporting period.33
AHRQ
Hepatitis C - % patients aged 18 years and older with adiagnosis of hepatitis C who were counseledregarding the risks of alcohol consumption at leastonce within the 12 month reporting period.
33
AHRQ
Mental health - Unduplicated N of consumers with severemental illness receiving peer support services(e.g. drop-in centers, peer case management,peer professional services, and socialclubs)during the reporting period / Unduplicated Nof adults with serious mental illness served duringthe reporting period. (cfr Koen)
181
AHRQ
AHRQ
AHRQ
AHRQ
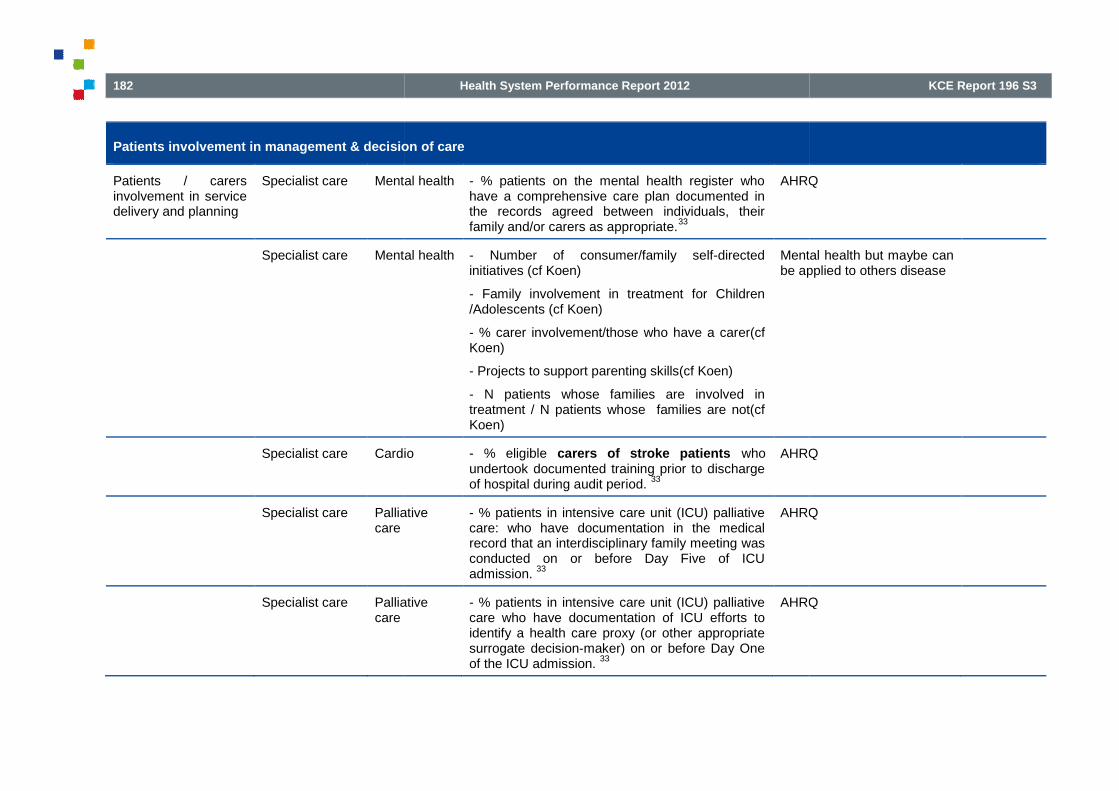
182
Patients involvement in management & decision of care
Patients / carersinvolvement in servicedelivery and planning
Specialist care Mental health
Specialist care Mental health
Specialist care Cardio
Specialist care Palliativecare
Specialist care Palliativecare
Health System Performance Report 2012
Patients involvement in management & decision of care
Mental health - % patients on the mental health register whohave a comprehensive care plan documented inthe records agreed between individuals, theirfamily and/or carers as appropriate.
33
AHRQ
Mental health - Number of consumer/family self-directedinitiatives (cf Koen)
- Family involvement in treatment for Children/Adolescents (cf Koen)
- % carer involvement/those who have a carer(cfKoen)
- Projects to support parenting skills(cf Koen)
- N patients whose families are involved intreatment / N patients whose families are not(cfKoen)
Mental health but maybe canbe applied to others disease
Cardio - % eligible carers of stroke patients whoundertook documented training prior to dischargeof hospital during audit period.
33
AHRQ
Palliative - % patients in intensive care unit (ICU) palliativecare: who have documentation in the medicalrecord that an interdisciplinary family meeting wasconducted on or before Day Five of ICUadmission.
33
AHRQ
Palliative - % patients in intensive care unit (ICU) palliativecare who have documentation of ICU efforts toidentify a health care proxy (or other appropriatesurrogate decision-maker) on or before Day Oneof the ICU admission.
33
AHRQ
KCE Report 196 S3
AHRQ
Mental health but maybe canapplied to others disease
AHRQ
AHRQ
AHRQ

KCE Report 196S3
Patients involvement in management & decision of care
Patients participationin decision/ shareddecision making(SDM)
Health caresystem
Generic
Health caresystem
Generic
Health caresystem
Generic
Health caresystem
Generic
Health caresystem
Generic
Children
Health caresystem
Cardio
Physicians (GP) Generic
Physicians (GP) Generic
Health System Performance Report 2012
Patients involvement in management & decision of care
Generic - % care users who reported that they wereinvolved in decision making about care andtreatment
16
Dutch performance
Generic - % adults with a usual source of care whosehealth providers sometimes or never asked forthe patient's help to make treatment decisions
15
AHRQ
Generic - % adult patients who reported whether they feltthey could refuse a specific type of medicine ortreatment.
33
AHRQ
Generic - % adult health plan members who reportedwhether a doctor or other health provider includedthem in shared decision making.
33
AHRQ
Generic
Children
- % parents or guardians who reported theirexperiences with shared decision-making for theirenrolled children with chronic conditions.
33
NCQM (CAHPSquestionnaire)
Cardio - % women 56 through 79 years and men 46through 79 years who discussed the risks andbenefits of using aspirin with a doctor or otherhealth provider.
33
AHRQ
Generic - Proportion of GP behaviours that facilitatepatient involvement in decision-making (givinginformation about the condition and associatedtreatment, using ‘clarifying’ statements to solicitpatient opinions and check understanding) / GPs’total talk.
23
Video
Generic - Informed Decision Making (IDM)73
9 item
Audio
183
Dutch performance
AHRQ
AHRQ
AHRQ
NCQM (CAHPSquestionnaire)
AHRQ
Video-taped
Audio-taped

184
Patients involvement in management & decision of care
Physicians (GPor specialists)
Generic &breastcancer
Physicians (GPor specialists)
Breastcancer
Physicians (GPor specialists)
Breastcancer
Specialist care Cancer
Health System Performance Report 2012
Patients involvement in management & decision of care
- discussion of the patient’s role in decisionmaking- determination of the context of thedecision
- discussion of the clinical issue and nature of thedecision to be made
- discussion of the alternatives
- discussion of the pros and cons of thealternatives
- discussion of the uncertainties associated withthe decision
- assessment of the patient’s understanding
- assessment of the patient’s desire or input
- asking the patient to express a preference
Item in appendix
Both doctorelements and interactionalelement
Generic &breastcancer
Observing Patient Involvement (OPTION)instrument.
73-7512 item in a set of competences:
- problem definition
- explaining legitimate choices
- portraying options and communicating risk
- conducting the decision process or its deferment
Audio
Item in appendix
Focus o
Breastcancer
- Response to Emotional Cues and Concerns(RECC) coding system.
74which codes emotional
expressions, specifically cues, concerns andpsychosocial issues
Audio
Breastcancer
- Blocking and facilitating behaviour scales74
- 10 item blocking behaviour scale
- 9 item facilitating behaviour scale
Audio
Cancer - Assessment of SDM behaviours in the oncology Audio
KCE Report 196 S3
Item in appendix
Both doctor-focusedelements and interactionalelement
Audio-taped
Item in appendix
Focus on doctor-behaviour
Audio-taped
Audio-taped
Audio-taped

KCE Report 196S3
Patients involvement in management & decision of care
Specialist care Mental health
Specialist care HIV
Specialist care HIV
Global centeredness process indicators or mixed with other domain of quality, patient assessment included
Health caresystem :hospitals
Generic
Health caresystem :hospitals
Gener
Health caresystem :hospital wards
Generic
Health care Generic
Health System Performance Report 2012
Patients involvement in management & decision of care
context by coding audio-taped consultation (3coding systems : OPTION, DSAT & DAS-O)
76
Mental health - Proportion of consumers and families within aservice provider population of persons withserious mental illness who actively participate indecisions concerning their treatment (McEwan etal. 2001; Herbstman & Pincus 2009; Ganju 1996in Koen)
Mental health
- % HIV positive adult patients who reported howoften they wanted to be more involved in makingdecisions about their health care.
33
AHRQ
- % HIV positive adolescent and adult patientswho reported how often they felt they would get introuble if they disagreed with or complained abouttheir case manager.
33
AHRQ
Global centeredness process indicators or mixed with other domain of quality, patient assessment included
Generic - Number of hospitals which achieve recognitionas a Designated Patient-Centered Hospital (50criteria).
77
Generic - % hospitals with implementation of strategies toimprove patient-centeredness according to thequestionnaire of the MARQuIS project.
20
Generic - % wards with implementation of strategies toimprove patient-centeredness according to thequestionnaire of the MARQuIS project.
20
Generic - World health survey : responsiveness module Questionnaire to 50persons/country in
185
Mental health
AHRQ
AHRQ
Questionnaire to 50persons/country involved in
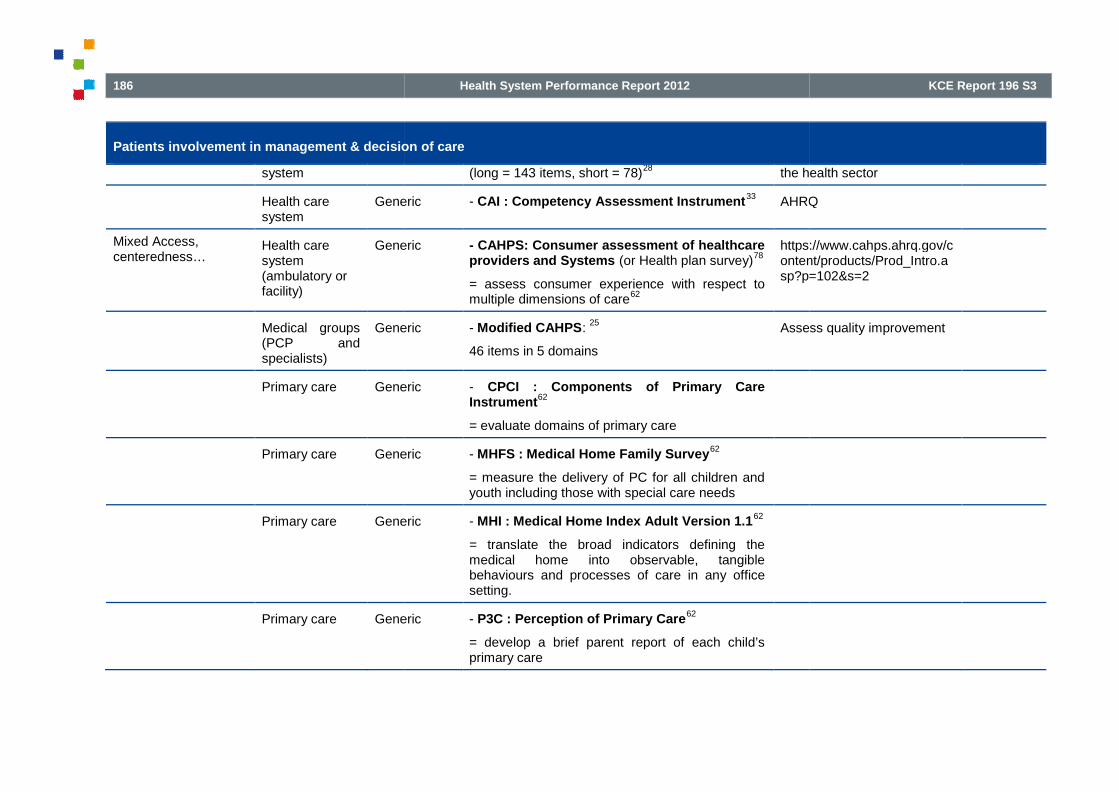
186
Patients involvement in management & decision of care
system
Health caresystem
Generic
Mixed Access,centeredness…
Health caresystem(ambulatory orfacility)
Generic
Medical groups(PCP andspecialists)
Generic
Primary care Generic
Primary care Generic
Primary care Generic
Primary care Generic
Health System Performance Report 2012
Patients involvement in management & decision of care
(long = 143 items, short = 78)28
the health sector
Generic - CAI : Competency Assessment Instrument33
AHRQ
Generic - CAHPS: Consumer assessment of healthcareproviders and Systems (or Health plan survey)
78
= assess consumer experience with respect tomultiple dimensions of care
62
https://www.cahps.ahrq.gov/content/products/Prod_Intro.asp?p=102&s=2
Generic - Modified CAHPS:25
46 items in 5 domains
Assess quality improvement
Generic - CPCI : Components of Primary CareInstrument
62
= evaluate domains of primary care
Generic - MHFS : Medical Home Family Survey62
= measure the delivery of PC for all children andyouth including those with special care needs
Generic - MHI : Medical Home Index Adult Version 1.162
= translate the broad indicators defining themedical home into observable, tangiblebehaviours and processes of care in any officesetting.
Generic - P3C : Perception of Primary Care62
= develop a brief parent report of each child’sprimary care
KCE Report 196 S3
the health sector
AHRQ
https://www.cahps.ahrq.gov/content/products/Prod_Intro.asp?p=102&s=2
Assess quality improvement

KCE Report 196S3
Patients involvement in management & decision of care
Primary care Generic
Primary care Generic
Hospital
Discharge
Generic
Hospital
Discharge
Generic
Hospitals Generic
Hospitals Generic
Health System Performance Report 2012
Patients involvement in management & decision of care
Generic - PCAS : Primary Care Assessement Survey10,
62
= operationalise formal definitions of PC, includingthe definition by the Institute of Medicine
eneric - PCAT : Primary Care Assessement Tool62
= assess the attainment of PC attributes
Generic - CTM-15 : Care Transitions Measure12, 63
15items
Transition in versus outhospital
Questionnaire in appendix (incontinuity)
Generic - CTM-3 : Care Transitions Measure63
3 items
- The hospital staff took my preferences and thoseof my family or caregiver into account in decidingwhat my health care needs would be when I leftthe hospital.
- When I left the hospital, I had a goodunderstanding of the things I was responsible forin managing my health.
- When I left the hospital, I clearly understood thepurpose for taking each of my medications.
Shorter & valid CTM
Generic - P-CIS: Patient-Centred Inpatient Scale: 20items
29Frail older population
Questionnaire
Generic - Patient expectations questionnaire : 70 itemsin 8 domains (annexe)
30: provider competence;
provider behaviour; respect & caring; hotelservices; education/communication; anticipation of
Common theme withsatisfaction questionnairebut also different asanticipation of needs,
187
Transition in versus outhospital
Questionnaire in appendix (incontinuity)
Shorter & valid CTM
Frail older population
Questionnaire in appendix
Common theme withsatisfaction questionnairebut also different asanticipation of needs,

188
Patients involvement in management & decision of care
Medical centres Generic
Pediatrichospitals
Generic
Hospital nursing Cancer
Health System Performance Report 2012
Patients involvement in management & decision of care
needs; individualisation of care; postdischargestatus.
provider competence andpostdischarge status.
Generic - Picker/Commonwealth patient-centered caresurvey
52National VA (veterans affairs)PatientSurvey (based on PickerCommonwealth approach)
Generic - PFCC : Patient-and-Family-Centered-Caresurvey
79
. 17 subscales with 107 items for leadership &staff
. 10 subscales with 58 items for families
Benchmarking
Cancer - OPPQNCS : Oncology Patients’ Perceptionsof the Quality of Nursing Care Scale
19
- Responsiveness scale: degree to which thenurse demonstrated that she or he was able tomeet patient needs in a caring and attentivemanner.
- Individualisation : degree to which the nursepersonalised care according to the patient’sfeelings, preferences, and desired level ofinvolvement in care.
- Coordination: degree to which the nursepromoted communication among other nursesand the patient.
- Proficiency : degree to which the nurse providedknowledgeable, skilful nursing care.
Focus on hpatient
KCE Report 196 S3
provider competence andpostdischarge status.
National VA (veterans affairs)Patient Satisfaction with CareSurvey (based on PickerCommonwealth approach)
Benchmarking of institutions
Focus on hemato-oncologypatient

KCE Report 196S3
Patients involvement in management & decision of care
Nursing Generic
Nursing Generic
Health caresystem
ChronicIllness
Health caresystem
Chronicillness
Children
Health System Performance Report 2012
Patients involvement in management & decision of care
Generic - ICS-patient Instrument: patients’ perception80
43 item in 2 scales
- Taking account of patient individuality 22 item;
- Facilitating patients’ participation in decision-making 21 item.
Individual care
Generic - ICS-Nurse Instrument: nurses’ perception:81
34item in 2 scales
- ICS-A-Nurse 17 item to explore nurses’ views onhow nurses support patient individuality throughnursing activities in general;
- ICS-B-Nurse 17 item exploring the extent towhich nurses perceive the care they provide topatients is individual.
Nurses’ perception
ChronicIllness
- PACIC : Patient Assessment of chronicillness care
78, 82
20 item in 5 domains:
- patient activation (Q1-3)
- delivery system design/ decision support 4-6)
- goal setting (Q7-11)
- problem solving/ contextual counselling (Q12-15)
- follow-up/coordination (Q16-20)
Complement the ACIC whichassesseschronic illness care (Chroniccare model CCM)
Questionnaire in appendix
Chronicillness
Children
- % parents or guardians who reported theirexperiences with their children's personal doctoror nurse for their enrolled children with chronicconditions. .
33
NCQM (CAHPSquestionnaire)
189
Individual care
Nurses’ perception
Complement the ACIC whichassesses the quality ofchronic illness care (Chroniccare model CCM)
Questionnaire in appendix
NCQM (CAHPSquestionnaire)

190
Patients involvement in management & decision of care
Health caresystem
Epilepsy
Specialist care Cancer
Mixed Centeredness,Continuity, Quality ofcare…
PCP Generic
Outcome
Empowerment Health caresystem
Chronicillness
Health caresystem
Chronicillness
Health caresystem
Chronicillness
Health System Performance Report 2012
Patients involvement in management & decision of care
Epilepsy - PGQI : Patient-Generated Quality Indicators83
5 indicatorsType of providers notspecified
Cancer - Medical Care questionnaire (MCQ)48
15 items
Adapted from the CPCI
Focus on oncologyoutpatients
Generic - PCP-ACES82
(refinement of PCAS; item from 4– 11 subscales from the primary care module ofthe Ambulatory care experiencesurvey):communication; integration; contextualknowledge of patient; preventive care).
Chronicillness
- Use of self-management service (Website,health education classes, emotional supportgroups…)
78: 5 question yes/no
Chronicillness
- Performance of self-management behaviours 4item: patients rate about : consuming 5 servingsof fruits and vegetable; doing tasks needed tomanage their chronic condition; following a regularexercise program; following a regular stressmanagement program.
78
Chronicillness
- Medication adherence78
: patients question abouthow many days of medication doses were missedin the past 7 days.
KCE Report 196 S3
Type of providers notspecified
Adapted from the CPCI
Focus on oncologyoutpatients

KCE Report 196S3
Outcome
Health caresystem
Chronicillness
Health caresystem
Generic
Health caresystem
Generic
PCP Generic
PCP Generic
PCP Chronicillness
Health System Performance Report 2012
Chronicillness
- Care management Experiences among adultswith chronic condition
60
Doctor-patient communication
Comparison between 8countries
Part of a the 2008Commonwealth FundInternational Health PolicySurvey (part in
Related to CCM
Generic - % adults who found it easy to understand writteninformation from a doctor’s office.
15AHRQ
Generic - % adults who found it easy to read theinstructions on a prescription bottle.
15AHRQ
Generic - Health care climate questionnaire (HCCQautonomy scale): 5-item
70:
= measure of autonomy supportiveness andpatient involvement in decision-making.
Generic - Doctor-Patient Communication and carecoordination
61Comparison between 8countries
Part of a the 2007Commonwealth FundInternational Health PolicySurvey (part in appendix)
Chronicillness
- Patient Self-Activation scale82
:
22 item to assess the extent to which patients feelable to take responsibility for their care (havingthe knowledge, skill, confidence to self-manageand collaborate with providers)
191
Comparison between 8countries
Part of a the 2008Commonwealth FundInternational Health PolicySurvey (part in appendix)
Related to CCM
AHRQ
AHRQ
Comparison between 8countries
Part of a the 2007Commonwealth FundInternational Health PolicySurvey (part in appendix)

192
Outcome
PCP (GP) Generic
Patients frompsychiatry Dayhospitals / Dayunits
Mental health
Physician(specialists)
Breastcancer
Physician(specialists)
Breastcancer
Ambulatory care Mental health
Clinical outcome Health caresystem
Chronicillness
Specialist care Cancer
Specialist care Pain specific
PCP (GP) Generic
Health System Performance Report 2012
Generic - PEI: Patient Enablement Instrument23
Mental health - Self-efficacy scale : 15 point questionnaire84
Questionnaire in appendix
Breastcancer
- Decisional Conflict scale (DCS)74
3 item measuring decisional uncertainty and 9items factors contributing to uncertainty.
Breastcancer
- State-Trait Anxiety Inventory74
20 item measuring decisional uncertainty and 9items factors contributing to uncertainty.
Mental health - Consumer outcome participation (cf Koen)
- Proportion of ambulatory episodes of mentalhealth care with completed consumer self-assessment outcome measures.
Chronicillness
- WHOQOL-BREF (Quality of Life)78
Cancer - HRQOL (Quality of life)2
SF-36; SIP; NHP; EORTC QLQ-C30
Pain specific - Total number of patients satisfied with theircurrent pain relief / Total number of patientsreceiving acute pain management.
36
Australian quality indicators
Anesthesia indicators
Generic - Measure Yourself Medical Outcome Profile(MYMOP)
85Focus on complementarypractitioners
KCE Report 196 S3
Questionnaire in appendix
Australian quality indicators
Anesthesia indicators
Focus on complementarypractitioners

KCE Report 196S3
Outcome
PCP (GP) Generic
PCP (GP) Generic
PCP Diabetes
Nursing hospital Surgery
Resource utilisation PCP (GP) Generic
Health System Performance Report 2012
Not possible to deal with‘control & coping’ and‘securing support and hope’
Questionnaire in appendix
Generic - Patient recovery from Discomfort andConcerns by Visual Analogue Scales (VAS) :
71
- severity of the symptom they identified as themain presenting problem
- concern about that problem at 2 points : thepost-encounter interview and the follow-up 2month later.
Generic - Patient health status: SF-3671
Diabetes - % diabetics with cholesterol & glycohemoglobintesting
70
Surgery - Absence of infection during hospital stay in themedical record
86
- Absence of falls during hospital stay in themedical records
86
- Hospital Length of stay86
- Adverse event in the medical record within 7days after discharge, pain consult included
86
LOS but
Generic - Number and kind of diagnostic tests ordered andof referrals made during the 2 months that wererelevant to the problems presented at the priorvisit.
71
- Number and kind of referrals made during the 2months that were relevant to the problems
193
Not possible to deal with‘control & coping’ and‘securing support and hope’
Questionnaire in appendix
LOS but PCC sans impact

194
Outcome
Treatment plancompliance
Consumer/familysatisfaction
Health caresystem
Generic
Health caresystem
Generic
PCP (GP) Generic
PCP (GP) Generic
Nursing Home Generic
Health System Performance Report 2012
presented at the prior visit.71
Generic - % patients who reported that they were satisfiedwith care providers’ behaviour towards them
16Dutch performance
Generic - % population (de 15 ans et plus) qui se ditsatisfaite des prestations …
87
. des services hospitaliers 87%
. des dentistes et orthodontistes 94%
. des médecins spécialistes 92%
. des médecins généralistes 95%
. des services de soins à domicile 92%
- % population (de 15 ans et plus) qui se dit trèssatisfaite des prestations …
87
. des services hospitaliers 43%
. des dentistes et orthodontistes 61%
. des médecins spécialistes 57%
. des médecins généralistes 70%
. des services de soins à domicile 61%
Belgium HIS
Generic - MISS : Medical Interview Satisfaction Scale23
Generic - CSG : Consultation SatisfactionQuestionnaire
2318 item
Generic - Nursing Home Family Survey33
- Nursing Home Resident Survey33
AHRQ
KCE Report 196 S3
Dutch performance
Belgium HIS
AHRQ

KCE Report 196S3
Outcome
Specialist care Cancer
Specialist care Intensivecare
Specialist care Cancer
Specialist care Cancer
Specialist care Cancer
Specialist care Cancer
Health System Performance Report 2012
Cancer - Satisfaction with the SDM (12 item).76
Intensive - Mean score on the "Family Satisfaction withDecision-making Around Care of Critically IllPatients" scale on the Family Satisfaction in theIntensive Care Unit© (FS-ICU 24) questionnaire.33
AHRQ
Cancer QLQ-INPATSAT32 questionnaire2: 7 dim:
- provider/support staff technical & interpersonalskills,
- information availability and provision,
- information exchange between providers andpatient,
- hospital access,
- waiting time,
- general comfort,
- satisfaction
EORTC
Inpatient care
Cancer - Decision regret scale2
5 items
Cancer - Patient preference2
Standard gamble method
Patient chooses between a definite outcome, anda gamble defined as the probability of the bestpossible outcome (ie, optimal health) vs theprobability of the worst possible outcome (ie,death).
2
Cancer
Cancer - Patient preference2
Cancer
195
AHRQ
EORTC
Inpatient care
Cancer
Cancer

196
Outcome
Specialist care Uro
Hospital Nursing Cancer
Health caresystem
Generic
Specialist care Mental health(cf Koen)
Health System Performance Report 2012
Time trade off
Patient choose an intervention that may decreaseoverall life expectancy with a trade off of higherquality of life during that shorter life span.
2
- % in-center hemodialysis patients who reportedhow often they were satisfied with the quality ofdialysis center care and operations.
33
AHRQ
Cancer Patients questionnaire19
- Trust in nurse
- Authentic self-representation;
- Cancer optimism;
- Fortitude;
- Well being : Mental Health inventory 5 (in RAND30)
Generic - mean score on six items asking about thehelpfulness of counseling among young adultswho received counseling on selected topics.
33
AHRQ
Mental health(cf Koen)
- N of complaints received by complaintsCommissioner, Mental Health Advocate,Ombudsperson (or equivalent offices), consumeradvocacy associations, regional health authority,etc. concerning mental health services andsupports. (Nature of complaints received shouldalso be reported)
- Average time between receipt of complaint andsatisfactory resolution
- % consumer (and families) satisfied with
KCE Report 196 S3
AHRQ
AHRQ

KCE Report 196S3
Outcome
Physician(specialists)
Breastcancer
Physician(specialists)
Breastcancer
Physician(specialists)
Breastcancer
Mixed Process &outcome
Mental retardedfacility
Mental health
Mixed Centeredness,Continuity, Access,Quality of care…
Health caresystem
Chronicillness
Nursing hospital Surgery
Nursing hospital Surgery
Health System Performance Report 2012
resolution of complaints.
- % complaints closed within 30 days
Breastcancer
- Satisfaction with the decision scale74
6 item
Breastcancer
- Satisfaction with the consultation74
25 item
- amount and quality of information received
- communication skills of the clinician
- level of patient participation throughout theconsultation
Breastcancer
- Satisfaction with the doctor SDM skills74
12 item purpose-designed measure
Mental health - Instrument of 6 process indicators & 9 outcomesindicators
88Not detailed in the articles
Chronicillness
- NS-CSHCN : National survey of Children withspecial health care needs questionnaire.
89
Surgery - BTMS 786
7 item in 3 subscales : purchase intention; qualityof services; satisfaction with services.
Surgery - SPNCS86
15 item in 4 subscales (seeing the individualpatient; explaining action; responding to needs;watching over patient.
197
Not detailed in the articles

198
4. REFERENCES1. Vlayen J, Vanthomme K, Camberlin C, Piérart J, Walckiers D, Kohn
L, et al. [A first step towards measuring the performance of theBelgian healthcare system]. Health Services Research (HSR).Brussels: Belgian Health Care Knowledge Centre (KCE); 201005/07/2010. KCE reports 128 Available from:http://kce.fgov.be/index_en.aspx?SGREF=14851&CREF=16558
2. Oliver A, Greenberg CC. Measuring outcomes in oncologytreatment: the importance of patient-centered outcomes. Surg ClinNorth Am. 2009;89(1):17-25 vii.
3. Arah OA, Westert GP, Hurst J, Klazinga NS.framework for the OECD Health Care Quality Indicators Project. Int.J. Qual. Health Care. 2006;18(SUPPL. 1):5
4. Haggerty JL, Reid RJ, Freeman GK, Starfield BH, Adair CE,McKendry R. Continuity of care: a multidisciplinary review.2003;327(7425):1219-21.
5. van Walraven C, Oake N, Jennings A, Forster AJ.between continuity of care and outcomes: a systematic and creview. J Eval Clin Pract. 2010;16(5):947-56.
6. Salisbury C, Sampson F, Ridd M, Montgomery AA. How shouldcontinuity of care in primary health care be assessed?Pract. 2009;59(561):e134-41.
7. Berendsen AJ, Groenier KH, de Jong GM, Meybooder Veen WJ, Dekker J, et al. Assessment of patient's experiencesacross the interface between primary and secondary care:Consumer Quality Index Continuum of care. Patient Educ Couns.2009;77(1):123-7.
8. van Servellen G, Fongwa M, Mockus D'Errico E. Continuity of careand quality care outcomes for people experiencing chronicconditions: A literature review. Nurs Health Sci. 2006;8(3):185
9. Reid R, Haggerty J, McKendry R. Defusing the confusion : Conceptsand measures of continuity of healthcare. March 2002. Final report.Canadian Health Services Research Foundation. 2002.
Health System Performance Report 2012
Vlayen J, Vanthomme K, Camberlin C, Piérart J, Walckiers D, KohnL, et al. [A first step towards measuring the performance of theBelgian healthcare system]. Health Services Research (HSR).Brussels: Belgian Health Care Knowledge Centre (KCE); 2010
010. KCE reports 128 Available from:http://kce.fgov.be/index_en.aspx?SGREF=14851&CREF=16558
Oliver A, Greenberg CC. Measuring outcomes in oncologycentered outcomes. Surg Clin
Arah OA, Westert GP, Hurst J, Klazinga NS. A conceptualframework for the OECD Health Care Quality Indicators Project. Int.J. Qual. Health Care. 2006;18(SUPPL. 1):5-13.
RJ, Freeman GK, Starfield BH, Adair CE,McKendry R. Continuity of care: a multidisciplinary review. BMJ.
van Walraven C, Oake N, Jennings A, Forster AJ. The associationbetween continuity of care and outcomes: a systematic and critical
56.
Salisbury C, Sampson F, Ridd M, Montgomery AA. How shouldcontinuity of care in primary health care be assessed? Br J Gen
Berendsen AJ, Groenier KH, de Jong GM, Meyboom-de Jong B, vanAssessment of patient's experiences
across the interface between primary and secondary care:Consumer Quality Index Continuum of care. Patient Educ Couns.
D'Errico E. Continuity of careand quality care outcomes for people experiencing chronicconditions: A literature review. Nurs Health Sci. 2006;8(3):185-95.
Reid R, Haggerty J, McKendry R. Defusing the confusion : Conceptshealthcare. March 2002. Final report.
Canadian Health Services Research Foundation. 2002.
10. Haggerty J, Fortin M, Beaulieu MD, Hudon C, Loignon C, Preville M,et al. At the interface of community and healthcare systems: alongitudinal cohort study on evolving health and the impact ofprimary healthcare from the patient's perspective. BMC HealthServices Research. 2010;10(258):2010.
11. Weinberg DB, Gittell JH, Lusenhop RW, Kautz CM, Wright J.Beyond our walls: impact of patient and provider coordinatiothe continuum on outcomes for surgical patients. Health Serv Res.2007;42(1 Pt 1):7-24.
12. Coleman EA, Mahoney E, Parry C. Assessing the quality ofpreparation for posthospital care from the patient's perspective: thecare transitions measure. Me
13. Vlayen J, Van De Water G, Camberlin C, Paulus D, Leys M,Ramaekers D, et al. Indicateurs de qualité cliniques. ObjectiveElements - Communication (OEC). Bruxelles: Centre fédérald'expertise des soins de santé (KCE); 2006.(D/2006/10.273/44))
14. Institute of Medicine Committee on Quality of Health Care inAmerica. Crossing the Quality
Chasm: A New Health System for the 21st Century. . 2001.
15. Agency for Healthcare Research and Quality. National HealthQuality Report 2010. [[cited 12 october 2011].
16. National Institute for Public Health and the Environment. Dutchhealth care performance report 2010. Bilthoven. The Netherlands:2010.
17. Robb G, Seddon M, Effective Practice Informatics and Q. Quimprovement in New Zealand healthcare. Part 6: keeping the patientfront and centre to improve healthcare quality. N Z Med J.2006;119(1242):U2174.
18. Davis K, Stremikis K. Family medicine: Preparing for a highperformance health care system. J. Am.2010;23:S11-S6.
KCE Report 196 S3
Haggerty J, Fortin M, Beaulieu MD, Hudon C, Loignon C, Preville M,et al. At the interface of community and healthcare systems: a
evolving health and the impact ofprimary healthcare from the patient's perspective. BMC HealthServices Research. 2010;10(258):2010.
Weinberg DB, Gittell JH, Lusenhop RW, Kautz CM, Wright J.Beyond our walls: impact of patient and provider coordination acrossthe continuum on outcomes for surgical patients. Health Serv Res.
Coleman EA, Mahoney E, Parry C. Assessing the quality ofpreparation for posthospital care from the patient's perspective: the
Med Care. 2005;43(3):246-55.
Vlayen J, Van De Water G, Camberlin C, Paulus D, Leys M,Indicateurs de qualité cliniques. Objective
Communication (OEC). Bruxelles: Centre fédérald'expertise des soins de santé (KCE); 2006. KCE reports ( 41B
Institute of Medicine Committee on Quality of Health Care inAmerica. Crossing the Quality
Chasm: A New Health System for the 21st Century. . 2001.
Agency for Healthcare Research and Quality. National HealthcareQuality Report 2010. [[cited 12 october 2011].
National Institute for Public Health and the Environment. Dutchhealth care performance report 2010. Bilthoven. The Netherlands:
Robb G, Seddon M, Effective Practice Informatics and Q. Qualityimprovement in New Zealand healthcare. Part 6: keeping the patientfront and centre to improve healthcare quality. N Z Med J.
Davis K, Stremikis K. Family medicine: Preparing for a high-performance health care system. J. Am. Board Fam. Med.

KCE Report 196S3
19. Radwin LE, Cabral HJ, Wilkes G. Relationships between patientcentered cancer nursing interventions and desired health outcomesin the context of the health care system. Res Nurs Health.2009;32(1):4-17.
20. Groene O, Lombarts MJ, Klazinga N, Alonso J, Thompson A, SunolR. Is patient-centredness in European hospitals related to existingquality improvement strategies? Analysis of a cross(MARQuIS study). Quality & Safety in Health Care. 2009;18(1).
21. Jee SH, Cabana MD. Indices for continuity of care: a systematicreview of the literature. Med Care Res Rev. 2006;63(2):158
22. Loukanova SN, Bridges JFP. Empowerment in medicine: Ananalysis of publication trends 1980-2005. Cent. Eur. J. Med.2008;3(1):105-10.
23. Mead N, Bower P, Hann M. The impact of general practitioners'patient-centredness on patients' post-consultation satisfaction andenablement. Soc Sci Med. 2002;55(2):283-99.
24. Mead N, Bower P. Patient-centredness: a conceptual frameand review of the empirical literature. Soc Sci Med.2000;51(7):1087-110.
25. Davies E, Shaller D, Edgman-Levitan S, Safran DG, Oftedahl G,Sakowski J, et al. Evaluating the use of a modified CAHPS survey tosupport improvements in patient-centred carimprovement collaborative. Health Expect. 2008;11(2):160
26. Reti SR, Feldman HJ, Ross SE, Safran C. Improving personalhealth records for patient-centered care. J Am Med Inform Assoc.2010;17(2):192-5.
27. Sofaer S, Firminger K. Patient perceptions of the quality of healthservices. Annu. Rev. Public Health. 2005;26:513
28. de Silva A, Valentine N. Measuring responsiveness: results of a keyinformants survey in 35 countries. WHO; 2000. GPE DiscussionPaper Series: N° 21 (EIP/GPE/FAR)
29. Davis S, Byers S, Walsh F. Measuring personacute health care setting. Aust Health Rev. 2008;32(3):496
30. Redman RW, Lynn MR. Assessment of patient expectations forcare. Res Theory Nurs Pract. 2005;19(3):275
Health System Performance Report 2012
Radwin LE, Cabral HJ, Wilkes G. Relationships between patient-centered cancer nursing interventions and desired health outcomesin the context of the health care system. Res Nurs Health.
ombarts MJ, Klazinga N, Alonso J, Thompson A, Sunolcentredness in European hospitals related to existing
quality improvement strategies? Analysis of a cross-sectional survey(MARQuIS study). Quality & Safety in Health Care. 2009;18(1).
ee SH, Cabana MD. Indices for continuity of care: a systematicreview of the literature. Med Care Res Rev. 2006;63(2):158-88.
Loukanova SN, Bridges JFP. Empowerment in medicine: An2005. Cent. Eur. J. Med.
Mead N, Bower P, Hann M. The impact of general practitioners'consultation satisfaction and
99.
centredness: a conceptual frameworkand review of the empirical literature. Soc Sci Med.
Levitan S, Safran DG, Oftedahl G,Sakowski J, et al. Evaluating the use of a modified CAHPS survey to
centred care: lessons from a qualityimprovement collaborative. Health Expect. 2008;11(2):160-76.
Reti SR, Feldman HJ, Ross SE, Safran C. Improving personalcentered care. J Am Med Inform Assoc.
K. Patient perceptions of the quality of healthservices. Annu. Rev. Public Health. 2005;26:513-59.
de Silva A, Valentine N. Measuring responsiveness: results of a keyinformants survey in 35 countries. WHO; 2000. GPE Discussion
Davis S, Byers S, Walsh F. Measuring person-centred care in a sub-acute health care setting. Aust Health Rev. 2008;32(3):496-504.
Redman RW, Lynn MR. Assessment of patient expectations forcare. Res Theory Nurs Pract. 2005;19(3):275-85.
31. Goldberg DG, Kuzel AJ. Elements of the patienthome in family practices in Virginia.[Erratum appears in Ann FamMed. 2009 Sep-Oct;7(5):467]. Ann Fam Med. 2009;7(4):301
32. Schoen C, Osborn R, Huynh PT, Doty M, Peugh J, Zapert K.front lines of care: primary care doctors' office systems, experiences,and views in seven countries. Health Aff (Millwood).2006;25(6):w555-71.
33. Agency for Healthcare Research and Quality. National QualityMeasure Clearinghouse. [[cited 12 Octo
34. Wenger NS, Young RT. Quality indicators for continuity andcoordination of care in vulnerable elders. Journal of the AmericanGeriatrics Society. 2007;55(2).
35. Tourigny A, Aubin M, Haggerty J, Bonin L, Morin D, Reinharz D, etal. Patients' perceptions of the quality of care after primary carereform: Family medicine groups in Quebec. Can. Fam. Phys.2010;56(7):e273-e82.
36. Australian Council on Healthcare Standards. Australasian ClinicalIndicator Report: 2001 – 2008 Determining the PotenQuality of Care: 10th Edition. 2008.
37. Radley A, Millar B, Hamley J. Development of patientperformance indicators to guide the delivery of pharmaceutical carein a district general hospital. Pharm World Sci. 2001;23(3):111
38. JCAHO. Specifications Manual for Joint Commission NationalQuality Measures (v2011A). Hospital Based Inpatient PsychiatricServices (HBIPS). [2011 [cited 12 October ].
39. Vlayen J, Verstreken M, Mertens C, Van Eycken E, Penninckx FKwaliteit van rectale kankerzorgeen set van kwaliteitsindicatoren [Good Clinical Practice (GCP)].Brussel: Federaal Kenniscentrum voor de Gezondheidszorg(KCE);2008 [updated 03/07/2008; cited A].http://kce.fgov.be/index_nl.aspx?SGREF=10500&CREF=11254
40. Schoen C, Davis K, How SK, Schoenbaum SC. U.S. health systemperformance: a national scorecard. Health Aff (Millwood).2006;25(6):w457-75.
199
Goldberg DG, Kuzel AJ. Elements of the patient-centered medicalhome in family practices in Virginia.[Erratum appears in Ann Fam
Oct;7(5):467]. Ann Fam Med. 2009;7(4):301-8.
Schoen C, Osborn R, Huynh PT, Doty M, Peugh J, Zapert K. On thefront lines of care: primary care doctors' office systems, experiences,and views in seven countries. Health Aff (Millwood).
Agency for Healthcare Research and Quality. National QualityMeasure Clearinghouse. [[cited 12 October 2011].
Wenger NS, Young RT. Quality indicators for continuity andcoordination of care in vulnerable elders. Journal of the AmericanGeriatrics Society. 2007;55(2).
Tourigny A, Aubin M, Haggerty J, Bonin L, Morin D, Reinharz D, et' perceptions of the quality of care after primary care
reform: Family medicine groups in Quebec. Can. Fam. Phys.
Australian Council on Healthcare Standards. Australasian Clinical2008 Determining the Potential to Improve
Quality of Care: 10th Edition. 2008.
Radley A, Millar B, Hamley J. Development of patient-centredperformance indicators to guide the delivery of pharmaceutical carein a district general hospital. Pharm World Sci. 2001;23(3):111-5.
JCAHO. Specifications Manual for Joint Commission NationalHospital Based Inpatient Psychiatric
Services (HBIPS). [2011 [cited 12 October ].
Vlayen J, Verstreken M, Mertens C, Van Eycken E, Penninckx Fale kankerzorg – Fase 2: ontwikkeling en test van
een set van kwaliteitsindicatoren [Good Clinical Practice (GCP)].Brussel: Federaal Kenniscentrum voor de Gezondheidszorg(KCE);2008 [updated 03/07/2008; cited A]. Available from:http://kce.fgov.be/index_nl.aspx?SGREF=10500&CREF=11254
Schoen C, Davis K, How SK, Schoenbaum SC. U.S. health systemperformance: a national scorecard. Health Aff (Millwood).

200
41. Cabana MD, Jee SH. Does continuity of care improve patientoutcomes? Journal of Family Practice. 2004;53(12):974
42. Saultz JW. Defining and measuring interpersonal continuity of care.Ann Fam Med. 2003;1(3):134-43.
43. Greenberg GA, Rosenheck RA, Seibyl CL. Coclinical effectiveness: outcomes following residential treatment forsevere substance abuse. Med Care. 2002;40(3):246
44. Parchman ML, Burge SK, Residency Research Network of SouthTexas I. Continuity and quality of care in type 2Residency Research Network of South Texas study. J.2002;51(7):619-24.
45. De Maeseneer JM, De Prins L, Gosset C, Heyerick J. Providercontinuity in family medicine: does it make a difference for totalhealth care costs? Ann Fam Med. 2003;1(3):
46. Boss DJ, Timbrook RE, Fort Wayne Medical Education Research G.Clinical obstetric outcomes related to continuity in prenatal care. JAm Board Fam Pract. 2001;14(6):418-23.
47. Bower P, Roland M, Campbell J, Mead N. Setting standards basedon patients' views on access and continuity: secondary analysis ofdata from the general practice assessment survey. BMJ.2003;326(7383):258.
48. Harley C, Adams J, Booth L, Selby P, Brown J, Velikova G. Patientexperiences of continuity of cancer care: developmmedical care questionnaire (MCQ) for oncology outpatients. ValueHealth. 2009;12(8):1180-6.
49. Sturmberg JP, Schattner P. Personal doctoring. Its impact oncontinuity of care as measured by the comprehensiveness of carescore. Aust Fam Physician. 2001;30(5):513
50. Dolovich LR, Nair KM, Ciliska DK, Lee HN, Birch S, Gafni A, et al.The Diabetes Continuity of Care Scale: the development and initialevaluation of a questionnaire that measures continuity of care fromthe patient perspective. Health Soc Care Community.2004;12(6):475-87.
Health System Performance Report 2012
, Jee SH. Does continuity of care improve patientoutcomes? Journal of Family Practice. 2004;53(12):974-80.
Saultz JW. Defining and measuring interpersonal continuity of care.
Greenberg GA, Rosenheck RA, Seibyl CL. Continuity of care andclinical effectiveness: outcomes following residential treatment forsevere substance abuse. Med Care. 2002;40(3):246-59.
Parchman ML, Burge SK, Residency Research Network of SouthTexas I. Continuity and quality of care in type 2 diabetes: aResidency Research Network of South Texas study. J.
De Maeseneer JM, De Prins L, Gosset C, Heyerick J. Providercontinuity in family medicine: does it make a difference for totalhealth care costs? Ann Fam Med. 2003;1(3):144-8.
Boss DJ, Timbrook RE, Fort Wayne Medical Education Research G.Clinical obstetric outcomes related to continuity in prenatal care. J
Bower P, Roland M, Campbell J, Mead N. Setting standards basedients' views on access and continuity: secondary analysis of
data from the general practice assessment survey. BMJ.
Harley C, Adams J, Booth L, Selby P, Brown J, Velikova G. Patientexperiences of continuity of cancer care: development of a newmedical care questionnaire (MCQ) for oncology outpatients. Value
Sturmberg JP, Schattner P. Personal doctoring. Its impact oncontinuity of care as measured by the comprehensiveness of care
ian. 2001;30(5):513-8.
Dolovich LR, Nair KM, Ciliska DK, Lee HN, Birch S, Gafni A, et al.The Diabetes Continuity of Care Scale: the development and initialevaluation of a questionnaire that measures continuity of care from
alth Soc Care Community.
51. Stordeur S, Vrijens F, Beirens K, Vlayen J, Devriese S, Van EyckenE. Quality indicators in oncology: breast cancer. Good ClinicalPractice (GCP). Brussels: Belgian Health Care Knowledge Centre(KCE); 2010. KCE reports 150C (D/2010/10.273/101) Availablefrom:http://kce.fgov.be/index_en.aspx?SGREF=5211&CREF=18847
52. Borowsky SJ, Nelson DB, Fortney JC, Hedeen AN, Bradley JL,Chapko MK. VA community-based outpatient clinics: performancemeasures based on patient perceptions of care. Med Care.2002;40(7):578-86.
53. Temmink D, Hutten JB, Francke AL, AbuQuality and continuity of care in Dutch nurse clinics for people witrheumatic diseases. Int J Qual Health Care. 2000;12(2):89
54. Gulliford MC, Naithani S, Morgan M. Measuring continuity of care indiabetes mellitus: an experience2006;4(6):548-55.
55. Grimmer K, Moss J. The development,new instrument to assess the quality of discharge planning activitiesfrom the community perspective. International Journal for Quality inHealth Care April. 2001;13(2):109
56. Singh SP, Paul M, Ford T, Kramer T, Weaver T,Process, outcome and experience of transition from child to adultmental healthcare: multiperspective study. Br J Psychiatry.2010;197(4):305-12.
57. Gyldenvang H, Mertz BG, Ankerson L. Quality managementimproving the clinical pathwayONCOL NURS. 2005;9(1):79
58. Manser T, Foster S, Gisin S, Jaeckel D, Ummenhofer W. Assessingthe quality of patient handoffs at care transitions.Care. 2010;19(6):e44.
59. Vanhaecht K, De Witte K, DepreProost K, et al. Development and validation of a care process selfevaluation tool. Health Serv Manage Res. 2007;20(3):189
KCE Report 196 S3
Stordeur S, Vrijens F, Beirens K, Vlayen J, Devriese S, Van EyckenE. Quality indicators in oncology: breast cancer. Good ClinicalPractice (GCP). Brussels: Belgian Health Care Knowledge Centre
CE reports 150C (D/2010/10.273/101) Available
http://kce.fgov.be/index_en.aspx?SGREF=5211&CREF=18847
Borowsky SJ, Nelson DB, Fortney JC, Hedeen AN, Bradley JL,based outpatient clinics: performance
measures based on patient perceptions of care. Med Care.
Temmink D, Hutten JB, Francke AL, Abu-Saad HH, van der Zee J.Quality and continuity of care in Dutch nurse clinics for people withrheumatic diseases. Int J Qual Health Care. 2000;12(2):89-95.
Gulliford MC, Naithani S, Morgan M. Measuring continuity of care indiabetes mellitus: an experience-based measure. Ann Fam Med.
Grimmer K, Moss J. The development, validity and application of anew instrument to assess the quality of discharge planning activitiesfrom the community perspective. International Journal for Quality inHealth Care April. 2001;13(2):109-16.
Singh SP, Paul M, Ford T, Kramer T, Weaver T, McLaren S, et al.Process, outcome and experience of transition from child to adultmental healthcare: multiperspective study. Br J Psychiatry.
Gyldenvang H, Mertz BG, Ankerson L. Quality management--improving the clinical pathway for breast cancer patients. EUR JONCOL NURS. 2005;9(1):79-82.
Manser T, Foster S, Gisin S, Jaeckel D, Ummenhofer W. Assessingthe quality of patient handoffs at care transitions. Qual Saf Health
Vanhaecht K, De Witte K, Depreitere R, Van Zelm R, De Bleser L,Development and validation of a care process self-
evaluation tool. Health Serv Manage Res. 2007;20(3):189-202.

KCE Report 196S3
60. Schoen C, Osborn R, How SK, Doty MM, Peugh J. In chroniccondition: experiences of patients with complex health care needs,in eight countries, 2008. Health Aff (Millwood). 2009;28(1):w1
61. Schoen C, Osborn R, Doty MM, Bishop M, Peugh J, Murukutla N.Toward higher-performance health systems: adults' health careexperiences in seven countries, 2007. Health Aff (Millwood).2007;26(6):w717-34.
62. Malouin RA, Starfield B, Sepulveda MJ. Evaluating the tools used toassess the medical home. Manag Care. 2009;18(6):44
63. Parry C, Mahoney E, Chalmers SA, Coleman EA. Assessing thequality of transitional care: further applications of the care transitionsmeasure. Med Care. 2008;46(3):317-22.
64. Weiner M, Perkins AJ, Callahan CM. Errors in completion ofreferrals among older urban adults in ambulatory care. J Eval ClinPract. 2010;16(1):76-81.
65. OECD. Health at a glance: Europe 2010. 2010.
66. Department of Health. National Standards, Local Action: Health andSocial Care Standards and Planning Framework 2005/06Leeds, U.K.: 2004.
67. Trute B, Hiebert-Murphy D, Wright A. Familycoordination in childhood health and disability services: the searchfor meaningful service outcome measures. Child Care Health Dev.2008;34(3):367-72.
68. Greenberg GA, Rosenheck RA. Continuity of care and clinicaloutcomes in a national health system. Psychiatr Serv.2005;56(4):427-33.
69. Mathieu C, Nobels F, Peeters G, Van Royen P, Dirven K, Wens J, etal. [Quality and organization of the care for diabetes 2]. GoodClinical Practice (GCP). Brussels: Belgian Health Care KnowledgeCentre (KCE); 2006 12/05/2006. KCE reports 27 Available from:http://kce.fgov.be/index_en.aspx?SGREF=5220&CREF=9314
70. Franks P, Jerant AF, Fiscella K, Shields CG, Tancredi DJ, EpsteinRM. Studying physician effects on patient outcomes: physicianinteractional style and performance on quality of care indicators. SocSci Med. 2006;62(2):422-32.
Health System Performance Report 2012
Schoen C, Osborn R, How SK, Doty MM, Peugh J. In chronics with complex health care needs,
in eight countries, 2008. Health Aff (Millwood). 2009;28(1):w1-16.
Schoen C, Osborn R, Doty MM, Bishop M, Peugh J, Murukutla N.performance health systems: adults' health care
es, 2007. Health Aff (Millwood).
Malouin RA, Starfield B, Sepulveda MJ. Evaluating the tools used toassess the medical home. Manag Care. 2009;18(6):44-8.
Parry C, Mahoney E, Chalmers SA, Coleman EA. Assessing thensitional care: further applications of the care transitions
Weiner M, Perkins AJ, Callahan CM. Errors in completion ofreferrals among older urban adults in ambulatory care. J Eval Clin
OECD. Health at a glance: Europe 2010. 2010.
Department of Health. National Standards, Local Action: Health andSocial Care Standards and Planning Framework 2005/06–2007/08.
Family-centred servicecoordination in childhood health and disability services: the searchfor meaningful service outcome measures. Child Care Health Dev.
Greenberg GA, Rosenheck RA. Continuity of care and clinicalPsychiatr Serv.
Mathieu C, Nobels F, Peeters G, Van Royen P, Dirven K, Wens J, et[Quality and organization of the care for diabetes 2]. Good
Clinical Practice (GCP). Brussels: Belgian Health Care Knowledgeentre (KCE); 2006 12/05/2006. KCE reports 27 Available from:
http://kce.fgov.be/index_en.aspx?SGREF=5220&CREF=9314
Franks P, Jerant AF, Fiscella K, Shields CG, Tancredi DJ, EpsteinStudying physician effects on patient outcomes: physician
interactional style and performance on quality of care indicators. Soc
71. Stewart M, Brown JB, Donner A, McWhinney IR, Oates J, WestonWW, et al. The impact of patientJournal of Family Practice. 2000;49(9):796
72. Brownson CA, Miller D, Crespo R, Neuner S, Thompson J, Wall JC,et al. A quality improvement tool to assess selfin primary care. Jt Comm J Qual Patient Saf.
73. Weiss MC, Peters TJ. Measuring shared decision making in theconsultation: a comparison of the OPTION and Informed DecisionMaking instruments. Patient Educ Couns. 2008;70(1):79
74. Smith A, Juraskova I, Butow P, Miguel C, LopezSharing vs. caring--the relative impact of sharing decisions versusmanaging emotions on patient outcomes. Patient Educ Couns.2011;82(2):233-9.
75. Elwyn G, Hutchings H, Edwards A, Rapport F, Wensing M, CheungWY, et al. The OPTION scale: measuring the extent that cliniciansinvolve patients in decision-making tasks. Health Expect.2005;8(1):34-42.
76. Butow P, Juraskova I, Chang S, Lopez AL, Brown R, Bernhard J.Shared decision making coding systems: how do they compare inthe oncology context? Patient Educ Couns. 2010;78(2):261
77. Charmel PA. Defining and evaluating excellence in patientcare. Front Health Serv Manage. 2010;26(4):27
78. Schmittdiel J, Mosen DM, Glasgow RE, Hibbard J, Remmers C,Bellows J. Patient Assessment of Chronic Illness Care (PACIC) andimproved patient-centered outcomes for chronic conditions. J GenIntern Med. 2008;23(1):77-80.
79. Carmen S, Teal S, Guzzetta CE. Development, testing, and nationalevaluation of a pediatric Patientbenchmarking survey. Holist Nurs Pract. 2008;22(2):61
80. Suhonen R, Valimaki M, Katajisto J. Developing and testing aninstrument for the measurement of individual care. J Adv Nurs.2000;32(5):1253-63.
81. Suhonen R, Gustafsson ML, KatIndividualized care scale - nurse version: a Finnish validation study.J Eval Clin Pract. 2010;16(1):145
201
Stewart M, Brown JB, Donner A, McWhinney IR, Oates J, WestonWW, et al. The impact of patient-centered care on outcomes.Journal of Family Practice. 2000;49(9):796-804.
Brownson CA, Miller D, Crespo R, Neuner S, Thompson J, Wall JC,et al. A quality improvement tool to assess self-management supportin primary care. Jt Comm J Qual Patient Saf. 2007;33(7):408-16.
Weiss MC, Peters TJ. Measuring shared decision making in theconsultation: a comparison of the OPTION and Informed DecisionMaking instruments. Patient Educ Couns. 2008;70(1):79-86.
Smith A, Juraskova I, Butow P, Miguel C, Lopez AL, Chang S, et al.the relative impact of sharing decisions versus
managing emotions on patient outcomes. Patient Educ Couns.
Elwyn G, Hutchings H, Edwards A, Rapport F, Wensing M, Cheungle: measuring the extent that cliniciansmaking tasks. Health Expect.
Butow P, Juraskova I, Chang S, Lopez AL, Brown R, Bernhard J.Shared decision making coding systems: how do they compare in
context? Patient Educ Couns. 2010;78(2):261-8.
Charmel PA. Defining and evaluating excellence in patient-centeredcare. Front Health Serv Manage. 2010;26(4):27-34.
Schmittdiel J, Mosen DM, Glasgow RE, Hibbard J, Remmers C,sment of Chronic Illness Care (PACIC) and
centered outcomes for chronic conditions. J Gen80.
Carmen S, Teal S, Guzzetta CE. Development, testing, and nationalevaluation of a pediatric Patient-Family-Centered Carebenchmarking survey. Holist Nurs Pract. 2008;22(2):61-74; quiz 5-6.
Suhonen R, Valimaki M, Katajisto J. Developing and testing aninstrument for the measurement of individual care. J Adv Nurs.
Suhonen R, Gustafsson ML, Katajisto J, Valimaki M, Leino-Kilpi H.nurse version: a Finnish validation study.
J Eval Clin Pract. 2010;16(1):145-54.

202
82. Glasgow RE, Wagner EH, Schaefer J, Mahoney LD, Reid RJ,Greene SM. Development and validation of the Patieof Chronic Illness Care (PACIC). Med Care. 2005;43(5):436
83. Bokhour BG, Pugh MJ, Rao JK, Avetisyan R, Berlowitz DR, KazisLE. Improving methods for measuring quality of care: a patientcentered approach in chronic disease. Med Care Res2009;66(2):147-66.
84. Fleming G, McKenna M, Murchison V, Wood Y, Nixon J, Rogers T,et al. Using self-efficacy as a client-centred outcome measure. NursStand. 2003;17(34):33-6.
85. Paterson C, Britten N. In pursuit of patient-centred outcomes: aqualitative evaluation of the 'Measure Yourself Medical OutcomeProfile'. J Health Serv Res Policy. 2000;5(1):27
Health System Performance Report 2012
Glasgow RE, Wagner EH, Schaefer J, Mahoney LD, Reid RJ,Greene SM. Development and validation of the Patient Assessmentof Chronic Illness Care (PACIC). Med Care. 2005;43(5):436-44.
Bokhour BG, Pugh MJ, Rao JK, Avetisyan R, Berlowitz DR, KazisLE. Improving methods for measuring quality of care: a patient-centered approach in chronic disease. Med Care Res Rev.
Fleming G, McKenna M, Murchison V, Wood Y, Nixon J, Rogers T,centred outcome measure. Nurs
centred outcomes: alitative evaluation of the 'Measure Yourself Medical Outcome
Profile'. J Health Serv Res Policy. 2000;5(1):27-36.
86. Wolf D, Lehman L, Quinlin R, Rosenzweig M, Friede S, Zullo T, etal. Can nurses impact patient outcomes using a patientcare model? J Nurs Adm. 2008;38(12):532
87. Van der Heyden J, Gisle L, Demarest S, Drieskens S, Hesse E,Tafforeau J. Enquête de santé, 2008.Direction Opérationnelle Santé publique et surveillance, 2010;Bruxelles, Institut Scientifique de Santé Publique, ; 2010.
88. Holburn S, Jacobson JW, Vietze PM, Schwartz AA, Sersen E.Quantifying the process and outcomes of personAm J Ment Retard. 2000;105(5):402
89. Spears AP. The Healthy People 2010children with special health care needs: an effective national policyfor meeting mental health care needs? Matern Child Health J.2010;14(3):401-11.
KCE Report 196 S3
Wolf D, Lehman L, Quinlin R, Rosenzweig M, Friede S, Zullo T, etal. Can nurses impact patient outcomes using a patient-centered
l? J Nurs Adm. 2008;38(12):532-40.
Van der Heyden J, Gisle L, Demarest S, Drieskens S, Hesse E,Tafforeau J. Enquête de santé, 2008. Rapport I - Etat de santé.Direction Opérationnelle Santé publique et surveillance, 2010;
Institut Scientifique de Santé Publique, ; 2010.
Holburn S, Jacobson JW, Vietze PM, Schwartz AA, Sersen E.Quantifying the process and outcomes of person-centered planning.Am J Ment Retard. 2000;105(5):402-16.
Spears AP. The Healthy People 2010 outcomes for the care ofchildren with special health care needs: an effective national policyfor meeting mental health care needs? Matern Child Health J.

