performance of friction piled raft with cement deep mixing … papers... · ·...
TRANSCRIPT

6th International Conference on Earthquake Geotechnical Engineering 1-4 November 2015 Christchurch, New Zealand
Performance of Friction Piled Raft with Cement Deep Mixing Walls
in Soft Ground During the 2011 East Japan Earthquake
K. Yamashita1, J. Hamada2 and T. Tanikawa 3
ABSTRACT The static and seismic behaviour of a friction piled raft foundation, supporting a seven-storey
building, is investigated by monitoring the soil-foundation-structure system over eleven years from the beginning of the construction. Since the building is constructed on liquefiable sandy soil, underlain by very soft clayey soil, grid-form cement deep mixing walls (DMWs) were employed as a countermeasure of liquefaction with the piled raft. At the time of the 2011 East Japan earthquake, the seismic response of the soil-foundation system was successfully recorded. Although small changes in the foundation settlement and the load sharing between the raft and the piles were observed after the earthquake, it was confirmed that the friction piled raft with the grid-form DMWs showed a good performance in the soft ground.
Introduction
In recent years, piled raft foundations have been used in many countries as building foundations (Katzenbach et al., 2000; Poulos, 2001; Mandolini et al., 2005; Yamashita et al., 2011a). It has become necessary to develop more reliable seismic design methods for piled raft foundations, particularly in highly seismic areas such as Japan. However, only a few case histories on monitoring seismic soil-pile-structure interaction behaviour exist (Mendoza et al., 2000; Yamashita et al., 2012; Yamashita et al., 2014). This paper offers a case history of a friction piled raft with ground improvement, supporting a 7-storey building, in soft ground in Tokyo. To confirm the validity of the foundation design, field monitoring on the foundation settlement and the load sharing between the piles and the raft was performed both statically and dynamically. At the time of the 2011 East Japan earthquake, the seismic response of the soil-foundation system was successfully recorded. The observed seismic response, as well as the static behaviour, of the friction piled raft is presented.
Soil Conditions and Foundation Design The seven-storey office building is located in Shinsuna, Tokyo. The building is a steel-frame structure; it was completed in 2004. Figure 1 shows a schematic view of the structure and the foundation with a soil profile. The project site is in flatland, and the soil profile down to a depth of 6 m consists of fill and very soft silt. Between the depths of 6 and 11 m, there is liquefiable silty sand. Below the depth of 11 to 42 m, there are very-soft to medium alluvial silt layers where the silt between the depths of 11 and 18 m is nearly normally consolidated with an OCR of 1.1. Below a depth of 48 m, there are very dense sand strata. The ground water table appears 1Dr. Eng., R&D Institute, Takenaka Corporation, Chiba, Japan, [email protected] 2Dr. Eng., R&D Institute, Takenaka Corporation, Chiba, Japan, [email protected] 3Mr. Eng., R&D Institute, Takenaka Corporation, Chiba, Japan, [email protected]

approximately 1.5 m below the ground surface. The shear wave velocities derived from a downhole technique were 140 to 240 m/s between the depths of 11 and 42 m, and those in the sand strata below the depth of 48 m were 310 to 350 m/s. A total load in the structural design was 378 MN which corresponds to the sum of the dead load and the live load of the building. The average contact pressure over the raft was 100 kPa. The foundation level was at a depth of 2.2 m in the central part and at a depth of 1.6 m in both ends. To reduce the overall and differential settlement due to consolidation of the very soft silt layers to an acceptable level, seventy friction piles were employed as settlement reducers. The piles are 30 m long, 0.6 to 0.9 m in diameter, PHC (pretensioned spun high-strength concrete) piles. An assessment of the potential for liquefaction during earthquakes was carried out using the simplified method (Tokimatsu and Yoshimi, 1983). It indicated that the silty sand between depths of 6 and 11 m had the potential for liquefaction with PGA of 2.0 m/s2. As a countermeasure of liquefaction of the silty sand below the raft, grid-form cement deep mixing walls (DMWs) were employed with the piled raft. Figure 2 shows the layout of the piles and the grid-form DMWs. Further details on the soil conditions and foundation design were reported by Yamashita et al. (2011b).
Figure 1. Schematic view of building and foundation with soil profile
SPT
N-Value
Undrained shear
Strength
qu/2 (kPa) Consolidation yield
stress py (kPa) Wave velocity
VP,VS (m/s)
2.2m
31.3m
1.6m
Grid-form D.M.W.
32m
PHC pile
3.0m
11.6m
20.4m
46.0m Diff. settlement gauges
4.3m
15.3m
Strain gauges
120m
12m
Dining hall
29.4
m
31.3m
0 500 1000 0 1000 2000
VPVS
0 50 0 100 200
Effective overburdenpressure
σv0’
Accelerometer GL±0
10
20
30
50
40
60
Depth
(m)
70
FillSilt
Sand
Sandy silt
Sand andgravel
Silty sand
Silt
Silt
Silt
Sand
Figure 2. Layout of piles and grid-form DMWs with locations of monitoring
① ② ③ ④ ⑤ ⑥ ⑦ ⑧ ⑨ ⑩ ⑪ ⑫
10.8m 10.8m 10.8m 10.8m 10.8m 10.8m 10.8m 10.8m 10.8m 10.8m 10.8m
118.8m
10.8
m10.8
m10.8
m
32.4
m
A
B
C
D ◎ ◎
○
○
○
○
◎ ◎
● ●
○
○
● ●
○
●
●
○○
●
○● ●
● ●
○
○
○
●
●
●
●○
●
○
●
○
●
○●●
○
○
●●○○
○○
○○
◎◎
○ ○
○ ○
○○
○
○ ○
○ ○
○
●
Grid-form DMWs
●
●
☆
Tributary area ●
●
Office building
○○
○
N
WE1
E2
Dining hall
◎
○ ●
d=0.9m
d=0.7m d=0.6m
Pile diameter
○ d=0.8m
□
△
☆
Instrumented pileEarth pressure cellPiezometerSettlement gauges
○○ ○
Monitoring devices
Accelerometer
X
Y

Instrumentation Field measurements on the foundation settlement and the load sharing between the piles and the raft were performed over eleven years from the beginning of the construction. The locations of the monitoring devices are shown in Figure 2. Two piles near the centre of the raft, 7A and 7B, were installed with a couple of LVDT-type strain gauges at a depth of 4.3 m (pile head). Pile 7B was installed with other couples of strain gauges at depths of 15.3 and 31.3 m (pile toe). Unfortunately, no data were obtained from one of the two strain gauges at the pile head of Pile 7A and that at the pile toe of Pile 7B due to disconnection. An earth pressure cell and a piezometer were installed beneath the raft near the instrumented piles while another earth pressure cell was installed near the south end. The vertical ground displacements below the raft were measured using differential settlement gauges as shown in Figure 1. The settlements at column positions on the first floor were measured by an optical level, where a bench mark was set to the monitoring point of the vertical ground displacements. In addition, triaxial servo accelerometer was installed on the first floor of the building. The two horizontal components of the triaxial accelerometers were oriented to the longitudinal direction (Y) and the transverse direction (X) of the building, which are identical to north-south and east-west directions, respectively. Here in this paper, the X and Y directions refer to the EW and NS directions, respectively. The triggering acceleration was set to 15.7 mm/s2 and the sampling rate was 100 Hz.
Static and Seismic Behaviour of Piled Raft Seismic Response during the 2011 East Japan Earthquake On March 11, 2011, 75 months after the end of the construction (E.O.C.), the 2011 East Japan earthquake struck the building site. Figure 3 shows the time histories of the acceleration recorded on the 1st floor of the building. The duration of the seismic motion was longer than 600 s. The peak accelerations were 1.07, 1.21, 0.72 m/s2 in the NS, EW and UD directions, respectively. Yamashita et al. (2012) reported that the peak ground accelerations recorded at the site of a 12-storey building, which is located 700 m west of the seven-storey building, were 1.44, 1.75 and 0.75 m/s2 in the NS, EW and UD directions, respectively, which were slightly larger than, but similar to the accelerations on the first floor of the building. Figure 4 shows the Fourier spectra of the response acceleration on the first floor in the NS, EW and UD directions, which were smoothed by a 0.05 Hz Parzen window. It can be seen that components of the periods of 1-2 s in the EW and NS directions were predominant. Meanwhile, the natural period of the superstructure in design was 0.85 and 1.04 s in the NS and EW directions, respectively, and the predominant period of the alluvial clayey strata at the site of the 12-storey building was recognized around 1.0 s (Yamashita et al., 2012). Although small sand boil was observed at the point 150 m east of the building, no evidence of liquefaction was found around the building under the PGA of about 1.8 m/s2. This is likely that the liquefiable silty sand layer was overlain by the non-liquefiable fill and silt layers of 6 m in thickness. Foundation Settlement Figure 5 shows the measured vertical ground displacement at three depths relative to that at a depth of 46.0 m. The ground displacement at a depth of 3.0 m was approximately equal to the

settlement of the raft when it was initialized just before the casting of the raft. In this paper, the ground displacement at the depth of 3.0 m refers to raft settlement. The raft settlement increased slightly after E.O.C. and reached 22.3 mm on March 10, 2011, just before the earthquake. After the earthquake, on March 15, 2011, the raft settlement increased by 1.1 mm to 23.4 mm. It can be seen that the increase in the ground displacement occurred mostly in the soil layers between depths of 3.0 and 11.6 m. Figure 6 shows the time history of the incremental vertical ground displacement between the depths of 3.0 and 11.6 m. Unfortunately, the increment in the ground displacement between the depths of 11.6 and 46.0 m was not measured dynamically. The displacement increased abruptly around 100 s after the start of the event, and reached residual value of 0.7 mm about 600 s. Figure 7 shows the settlement distributions on the first floor before and after the earthquake and the incremental settlements. Although the latest measurement
Figure 3. Time histories of acceleration recorded on the 1st floor
Acce
lera
tion
(m
/s2
) A
cce
lera
tion
(m
/s2
)
Time (s) (b) EW direction
Time (s) (c) UD direction
Figure 4. Fourier spectra of response acceleration on the 1st floor
(b) EW acceleration (a) NS acceleration (c) UD acceleration
Min=-1.205m/s2 Max=1.134m/s2
Min=-1.073m/s2 Max=0.983m/s2
Min=-0.536m/s2 Max=0.722m/s2
Time (s) (a) NS direction
0
100
200
300
0.1 1 10
Ampl
itude
(cm
/s2 s
)
Period (s)
0
100
200
300
0.1 1 10
Ampl
itude
(cm
/s2 s
)
Period (s)
0
100
200
300
0.1 1 10
Ampl
itude
(cm
/s2 s
)
Period (s)
Acce
lera
tion
(m
/s2
)
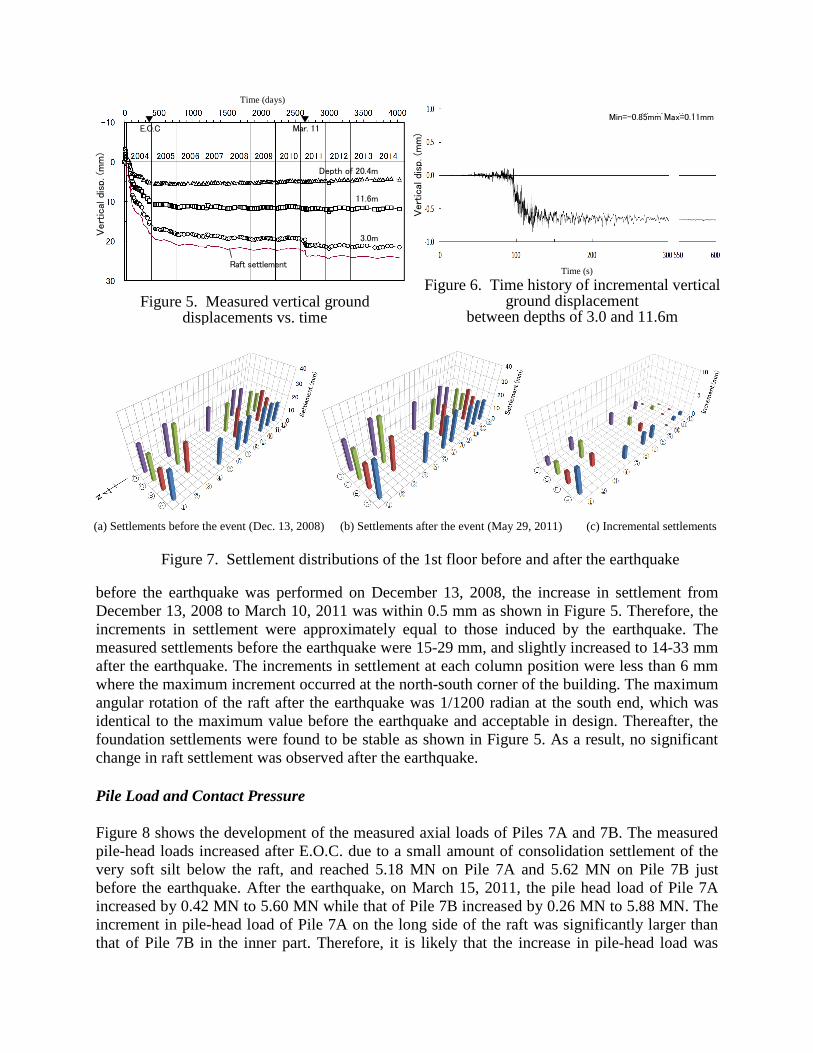
before the earthquake was performed on December 13, 2008, the increase in settlement from December 13, 2008 to March 10, 2011 was within 0.5 mm as shown in Figure 5. Therefore, the increments in settlement were approximately equal to those induced by the earthquake. The measured settlements before the earthquake were 15-29 mm, and slightly increased to 14-33 mm after the earthquake. The increments in settlement at each column position were less than 6 mm where the maximum increment occurred at the north-south corner of the building. The maximum angular rotation of the raft after the earthquake was 1/1200 radian at the south end, which was identical to the maximum value before the earthquake and acceptable in design. Thereafter, the foundation settlements were found to be stable as shown in Figure 5. As a result, no significant change in raft settlement was observed after the earthquake. Pile Load and Contact Pressure Figure 8 shows the development of the measured axial loads of Piles 7A and 7B. The measured pile-head loads increased after E.O.C. due to a small amount of consolidation settlement of the very soft silt below the raft, and reached 5.18 MN on Pile 7A and 5.62 MN on Pile 7B just before the earthquake. After the earthquake, on March 15, 2011, the pile head load of Pile 7A increased by 0.42 MN to 5.60 MN while that of Pile 7B increased by 0.26 MN to 5.88 MN. The increment in pile-head load of Pile 7A on the long side of the raft was significantly larger than that of Pile 7B in the inner part. Therefore, it is likely that the increase in pile-head load was
Figure 5. Measured vertical ground displacements vs. time
Time (s)
▼ E.O.C
▼ Mar. 11
Raft settlement
Vert
ical
dis
p. (m
m)
Figure 6. Time history of incremental vertical ground displacement
between depths of 3.0 and 11.6m
Depth of 20.4m
11.6m
3.0m
Min=-0.85mm Max=0.11mm
Vert
ical
dis
p. (m
m)
Time (days)
Figure 7. Settlement distributions of the 1st floor before and after the earthquake
(b) Settlements after the event (May 29, 2011) (c) Incremental settlements (a) Settlements before the event (Dec. 13, 2008)

caused by the settlements of the piles due to the rotational moment from the superstructure. Figure 8(b) indicates that the increment in pile-head load was compensated almost entirely by the increment in the frictional resistance of a lower part of the pile shaft. Thereafter, the loads of both piles were substantially stable, though the pile-head load of Pile 7A increased and decreased slightly while the loads of Pile B at the pile head and the intermediate depth increased slightly and seemed to become constant. Figure 9 shows the time histories of the incremental axial load of Pile 7B. The maximum amplitude at the pile head was 0.48 MN in both compression and tension, and the ratio of the maximum amplitude to the pre-earthquake pile-head load was less than 0.1. Meanwhile, the maximum amplitude at the depth of 15.3 m was 0.52 MN in compression which was a little larger than that at the pile head. The increment in pile-head load observed about 600 s was 0.12 MN which was less than the measured value of 0.26 MN on March 15, 2011, i.e., the pile-head load increased very slightly after the event. Figure 10 shows the development of the measured contact pressure between the raft and the unimproved soil together with the pore water pressure beneath the raft. The contact pressure seemed to reach a state of equilibrium in early stage of construction despite of the successive construction loads. The contact pressure from the earth pressure cell near the centre of the raft (E1) was larger than that from the earth pressure cell in the end (E2), where the installed depth of E1 was larger than that of E2. Figure 10 indicates that the increase in effective stress in the soil under the raft was around 50% of the decrease in effective overburden pressure (22-32 kPa) due to the excavation.
Figure 8. Measured axial load of Piles 7A and 7B vs. time
(b)Pile 7B (a)Pile 7A
E.O.C ▼
Mar. 11 ▼
E.O.C ▼
Mar. 11 ▼
Axi
al load
(M
N)
Axi
al load
(M
N)
Time (days) Time (days)
Depth of 4.3m Depth of 4.3m
15.3m
31.3m
Time (s)
Figure 9. Time histories of incremental axial load of Pile 7B
Figure 10. Measured contact pressure and pore water pressure
E.O.C ▼
Mar. 11 ▼
Time (days)
Depth of 4.3m
Depth of 15.3m
Min=-0.477MN Max=0.475MN
Min=-0.414MN Max=0.522MN
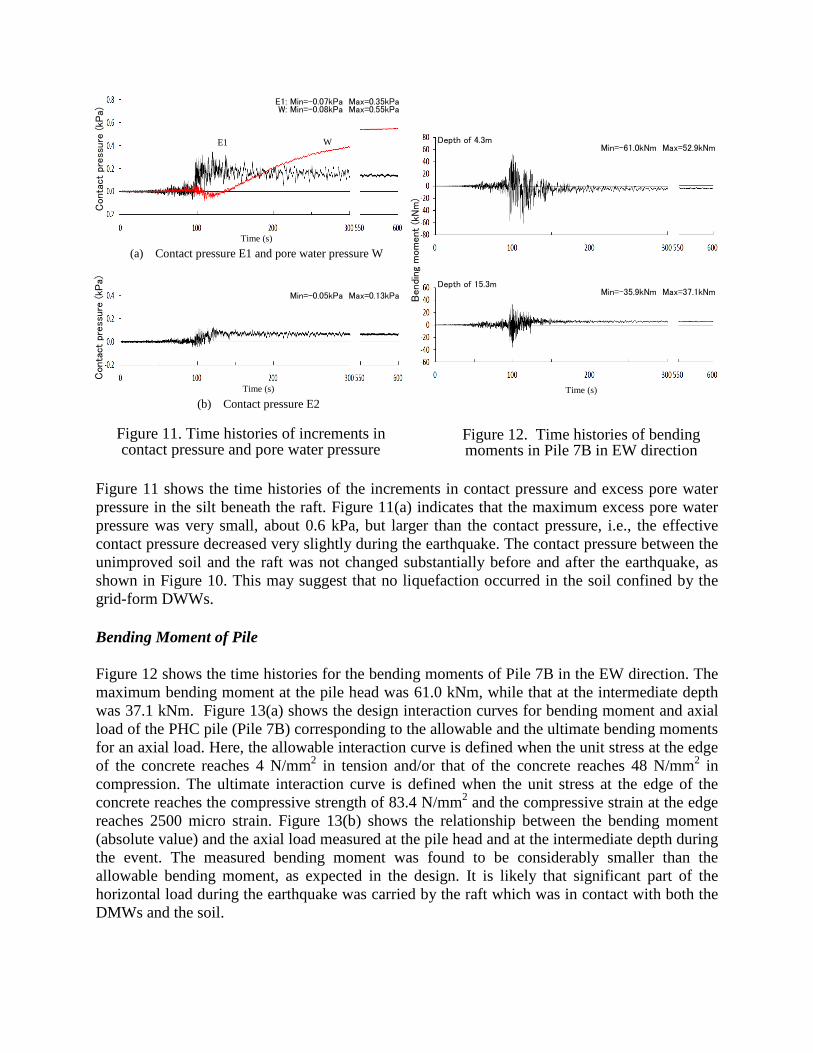
Figure 11 shows the time histories of the increments in contact pressure and excess pore water pressure in the silt beneath the raft. Figure 11(a) indicates that the maximum excess pore water pressure was very small, about 0.6 kPa, but larger than the contact pressure, i.e., the effective contact pressure decreased very slightly during the earthquake. The contact pressure between the unimproved soil and the raft was not changed substantially before and after the earthquake, as shown in Figure 10. This may suggest that no liquefaction occurred in the soil confined by the grid-form DWWs. Bending Moment of Pile Figure 12 shows the time histories for the bending moments of Pile 7B in the EW direction. The maximum bending moment at the pile head was 61.0 kNm, while that at the intermediate depth was 37.1 kNm. Figure 13(a) shows the design interaction curves for bending moment and axial load of the PHC pile (Pile 7B) corresponding to the allowable and the ultimate bending moments for an axial load. Here, the allowable interaction curve is defined when the unit stress at the edge of the concrete reaches 4 N/mm2 in tension and/or that of the concrete reaches 48 N/mm2 in compression. The ultimate interaction curve is defined when the unit stress at the edge of the concrete reaches the compressive strength of 83.4 N/mm2 and the compressive strain at the edge reaches 2500 micro strain. Figure 13(b) shows the relationship between the bending moment (absolute value) and the axial load measured at the pile head and at the intermediate depth during the event. The measured bending moment was found to be considerably smaller than the allowable bending moment, as expected in the design. It is likely that significant part of the horizontal load during the earthquake was carried by the raft which was in contact with both the DMWs and the soil.
Figure 11. Time histories of increments in contact pressure and pore water pressure
Ben
ding
mom
ent
(kN
m)
Time (s)
Figure 12. Time histories of bending moments in Pile 7B in EW direction
Con
tact
pre
ssure
(kP
a)
Time (s) (b) Contact pressure E2
Con
tact
pre
ssure
(kP
a)
W
E1
Time (s) (a) Contact pressure E1 and pore water pressure W
E1: Min=-0.07kPa Max=0.35kPa W: Min=-0.08kPa Max=0.55kPa
Min=-0.05kPa Max=0.13kPa Depth of 15.3m
Min=-35.9kNm Max=37.1kNm
Depth of 4.3m Min=-61.0kNm Max=52.9kNm

Concluding Remarks The static and seismic behaviour of a friction piled raft with the grid-form DMWs, supporting a seven-storey building, was investigated by monitoring the soil-foundation-structure system. At the time of the 2011 East Japan earthquake, the seismic response of the soil-foundation system was successfully recorded. Although small changes in the foundation settlement and the load sharing between the raft and the piles were observed after the earthquake, it was confirmed that the friction piled raft showed a good performance in the soft ground.
Acknowledgement The authors are grateful to Mr. A. Miyashita of Takenaka Corporation and Messrs. N. Nakayama and T. Yamada (formerly of Takenaka Corporation) for their efforts in the field measurements.
References Katzenbach, R., Arslan, U. and Moormann, C.: Piled raft foundation projects in Germany, Design applications of raft foundations, Hemsley J.A. Editor, Thomas Telford, 323-392, 2000.
Mandolini, A., Russo, G. and Viggiani, C.: Pile foundations: Experimental investigations, analysis and design, Proc. of the 16th ICSMGE,2005; Vol. 1, 177-213.
Mendoza, M.J., Romo, M.P., Orozco, M., Dominguez, L.: Static and seismic behavior of a friction pile-box foundation in Mexico City clay, Soils & Foundations 2000; 40 (4), 143-154.
Poulos, H.G.: Piled raft foundations: design and applications, Geotechnique 2001; 51(2), 95-113.
Tokimatsu, K. and Yoshimi, Y. Empirical correlation of soil liquefaction based on SPT N-value and fines content, Soils & Foundations, 1983; 23(4), 56-74.
Yamashita, K., Yamada, T. and Hamada, J.: Investigation of settlement and load sharing on piled rafts by monitoring full-scale structures, Soils & Foundations, 2011a; 51(3):513-532.
Figure 13. Design interaction curves for bending moment and axial load, and the measured
values in Pile 7B in EW direction
(a) Interaction curves of PHC pile
Measured
Allowable
Ultimate
(b) Measured bending moment vs. axial load
Depth of 15.3m
Depth of 4.3m (Pile head)
Start End

Yamashita, K., Hamada, J. and Yamada, T.: Field measurements on piled rafts with grid-form deep mixing walls on soft ground, Geotechnical Engineering Journal of the SEAGS & AGSSEA, 2011b; 42(2), 1-10.
Yamashita, K., Hamada, J., Onimaru, S. and Higashino, M.: Seismic behavior of piled raft with ground improvement supporting a base-isolated building on soft ground in Tokyo, Soils & Foundations, 2012; 52(5), 1000-1015.
Yamashita, K., Hashiba, T., Ito, H. and Tanikawa, T.: Performance of piled raft foundation subjected to strong seismic motion, Geotechnical Engineering Journal of the SEAGS & AGSSEA, 2014; 45(2): 33-39.