performance modelling and tapering iñigo mujika department of research and development athletic...
TRANSCRIPT

Performance modelling and tapering
Iñigo MujikaDepartment of Research and Development
ATHLETIC CLUB BILBAO

Mathematical modelling and systems theory
Athlete = System
Fitness
Fatigue
ΣTraining-
+
Performance
Banister & Fitz-Clarke J. Therm. Biol. 18: 587-597, 1993

Modelling the effects of training
Mujika et al. Med. Sci. Sports Exerc. 28: 251-258, 1996
Time
Training
Performance
Initial
NegativeInfluence
Positive influence
tn tg

Characterisation of a dynamical process
Busso & Thomas Int. J. Sports Physiol. Perf. 1: 400-405, 2006
?
tt
Input OuputSystem
. . . . .
Goodness-of-fit

Weeks of Training
90
92
94
96
98
100
102
0
1
2
3
4
PINI
020406080
100120
45403530252015105085
90
95
100
105
Modeled PerformanceActual Performance
454035302520151050
454035302520151050
Performance (% PB)
Positive Influence (PI) Negative Influence (NI)
Training Load (A.U. wk-1).
Mujika et al. Med. Sci. Sports Exerc. 28: 251-258, 1996
Modelling application in swimming

Mathematical modelling and taper duration
Mujika et al. Med. Sci. Sports Exerc. 28: 251-258, 1996
Time
Training
Performance
tg = 32 ± 12 days
tn = 12 ± 6 days
tn tg

Mujika et al. Med. Sci. Sports Exerc. 28: 251-258, 1996
T39293949596979899
100
Positive Influence (PI)
Early Season Pre-Taper Post-Taper
T1 T2ES0,51,01,52,02,53,03,5
***
Negative Influence (NI)
T1 T2 T3ES
Modelling the effects of the taper

Varying adaptation profiles
Time
Training
10
Performance
24
Swimmer HR
14 38
Swimmer CJ

Limitations and model evolution
“The theoretical analysis based on the original model of Banister et al. (1975) is possibly flawed because of the underlying linear formulation. The response to a given training dose was independent of the accumulated fatigue with past training. This implies that the taper duration should be identical whatever the severity of the training preceding the taper ”
“This led us to propose a formulation of a new non-linear model. This non-linear model implied that the magnitude and duration of the fatigue produced by a given training dose increased with the repetition of exercise bouts, and was reversed when training was reduced (Busso, 2003)”
Thomas et al. J. Sports Sci. 26: 643-652, 2008

Prediction of system’s behaviour from previous observation
Busso & Thomas Int. J. Sports Physiol. Perf. 1: 400-405, 2006
Model&
Parameters?
tt
Input Ouput
Model&
Parameters?
tt
Input Ouput
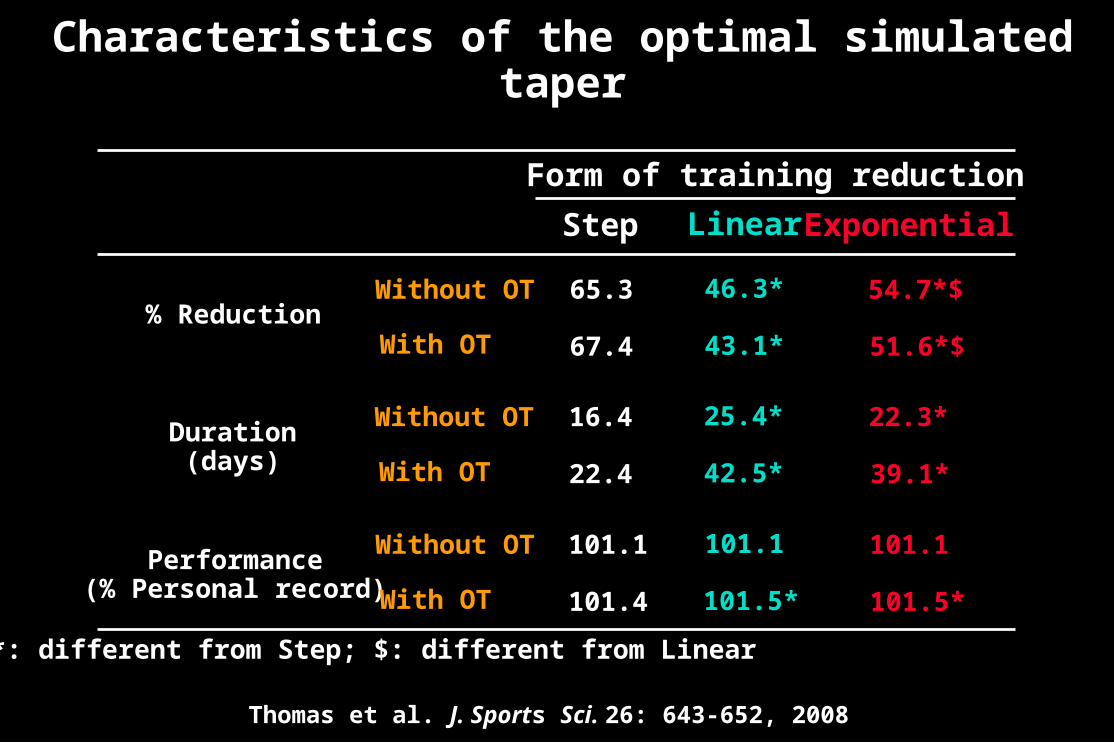
Characteristics of the optimal simulated taper
% Reduction
Form of training reduction
Step Exponential
65.3
67.4
54.7*$
51.6*$
Without OT
With OT
Linear
46.3*
43.1*
Duration(days)
16.4
22.4
22.3*
39.1*
Without OT
With OT
25.4*
42.5*
Performance(% Personal record)
101.1
101.4
101.1
101.5*
Without OT
With OT
101.1
101.5*
*: different from Step; $: different from Linear
Thomas et al. J. Sports Sci. 26: 643-652, 2008

Effects of previous training on optimal taper characteristics
Without OT With OT0
1
2
3
4
5
6 *
Optimal Training Load(Training Units)
Without OT With OT0
20
40
60
80
100
Optimal Reduction(% Pre-Taper Training)
Without OT With OT0
5
10
15
20
25
30 *
Optimal Duration(Days)
Without OT With OT0
1
2
3
4
5 **
Performance Improvement(% Pre-Taper Performance)
Thomas et al. J. Sports Sci. 26: 643-652, 2008

Effects of optimal taper on NI, PI and performance
Pre Post0
1
2
3
4
5
*
Negative Influence
Pre Post97
98
99
100
101
102
Positive Influence
Pre Post97
98
99
100
101
102 *
Performance(% Personal Record)
WITHOUT OT
Pre Post0
1
2
3
4
5
*
Negative Influence
Pre Post97
98
99
100
101
102
Positive Influence
Pre Post97
98
99
100
101
102
Performance(% Personal Record)
WITH OT
$
* $
*
$
$
Thomas et al. J. Sports Sci. 26: 643-652, 2008

Changes in training load during optimal two-phase taper
0
20
40
60
80
100
120
Weeks of Taper
Training Load (%NT)
0 1 2 3 4 5 6
Thomas et al. J. Strength Cond. Res. Submitted
* $
NT
OT

Performance changes during optimal two-phase taper
96
97
98
99
100
101
102
Weeks of Taper
Performance (%NT)
0 1 2 3 4
103
104
NT
OT2726 28 29 30
103,40
103,45
103,50
103,55
Days of Taper
Performance
Optimal linear taper
Optimal two-phase taper
Thomas et al. J. Strength Cond. Res. Submitted
Conclusions

Conclusions
The available data on performance modelling confirm the relevance of the modelling approach in the study of individual responses to training and the optimisation of tapering strategies
Computer simulations based on mathematical modelling offer new prospects for further investigation into innovative tapering strategies and performance optimisation

ESKERRIK ASKO!(“Thank you very much!” in Basque Language)