performance measures toolbox - compendium measures toolbox_sept2016 (1).pdfperformance measures...
TRANSCRIPT
PERFORMANCE MEASURES TOOLBOXSEPTEMBER 2016
PE
RFO
RM
AN
CE
ME
ASU
RE
S TO
OLB
OX
2
PERFORMANCEMEASURES TOOLBOX
SEPTEMBER 2016
PREPARED BYKITTELSON & ASSOCIATES, INC.www.kittelson.com
GOROVE/SLADE ASSOCIATES, INC. www.goroveslade.com
PE
RFO
RM
AN
CE
ME
ASU
RE
S TO
OLB
OX
3
CONTENTSBACKGROUND .......................................................6
PERFORMANCE MEASURES TOOLBOX......6
85TH PERCENTILE SPEED ..............................12
BICYCLE AND PEDESTRIAN CRASHES ........14
CRASH FREQUENCY ....................................16
CRASH RATE .................................................18
CRASH SEVERITY..........................................20
LEVEL OF TRAFFIC STRESS ..........................22
AUTOMOBILE DELAY ...................................24
PEDESTRIAN CROSSING TIME .....................26
PROGRESSION SPEED..................................28
TRAVEL TIME ................................................30
TRAVEL TIME INDEX ....................................32
AUTOMOBILE VOLUME ...............................34
BICYCLE VOLUME ........................................36
PEDESTRIAN VOLUME .................................38
BUS RIDERSHIP .............................................40
JOBS AND DESTINATIONS SERVED ............42
RESIDENTS SERVED .....................................44
AIR QUALITY ................................................46
GREEN SPACE ..............................................48
IMPERVIOUS SURFACE ................................50
TRAFFIC NOISE ............................................52
TRAFFIC DIVERSION ....................................54
TREE COVERAGE .........................................56
ON-TIME PERFORMANCE ............................58
PLANNING TIME INDEX ..............................60
BICYCLE NETWORK CONNECTIVITY ...........62
BUS OVERCROWDING .................................64
TRANSIT FREQUENCY ..................................66
PEDESTRIAN NETWORK CONNECTIVITY ...68
PERSON THROUGHPUT ...............................70


PE
RFO
RM
AN
CE
ME
ASU
RE
S TO
OLB
OX
5
BACKGROUND

PE
RFO
RM
AN
CE
ME
ASU
RE
S TO
OLB
OX
6
BACKGROUNDThe District Department of Transportation (DDOT) is continually planning, designing, and constructing new and updated facilities across the District of Columbia. Most projects are rooted in enhancing the quality of life of residents by improving safety and mobility, ensuring a range of transportation options are available and convenient, and addressing ongoing transportation concerns in the community. DDOT is committed to working with communities to identify issues, develop solutions, and implement changes to the street network. However, a final step is necessary for ensuring changes on the ground address the original issues identified by community members and stakeholders: a post-construction evaluation. For example, if a roadway improvement was intended to reduce automobile speeds, are measured speeds actually lower now that the roadway improvement has been constructed? Likewise, if a cycling project was constructed to make the street more attractive to a variety of cyclists, are more cyclists actually using the facility and are residents and commuters choosing to bike instead of using other modes of transportation?
Because DDOT is prioritizing safer, more livable streets and connected neighborhoods through street enhancement projects, it is imperative that impacts are measured after construction so that future projects can be informed by lessons from past efforts and that future designs can be modified to better address issues at all scales. DDOT’s first comprehensive look at projects in this way was a Post-Construction Analysis in 2016 of three recently constructed projects:
• M STREET NW CYCLE TRACK: a 1.3-mile cycle track with paint and flex-post buffers between parked vehicles, intersection “turning zones” and relevant signing and pavement markings, bike signals at some locations, and the elimination of one travel lane (completed in 2014). Limits of the study are 28th Street NW to the west and Thomas Circle to the east.
• SHERMAN AVENUE NW STREETSCAPE: a 0.85-mile traffic calming and streetscaping project that eliminated one travel lane in each direction, allowing for widened sidewalks and trees, lighting, landscaped median, and left-turn lanes at intersections (completed in 2013). Limits of the study are Barry Place NW to the south and New Hampshire Avenue/Park Road NW to the north.
• NAYLOR ROAD SE TRAFFIC CALMING: a 0.4-mile project with several median pedestrian refuge areas at unsignalized crossing locations, a painted median, upgraded sidewalks, and speed camera (completed in 2012).
The Post-Construction Analysis presented a comparison of the pre- and post-construction conditions of these corridors to assess overall network changes and how well project goals were addressed. Specifically, the results were used to inform DDOT and stakeholders how each of these projects performs in comparison to stated project goals. Three key elements were detailed in this report: data collection, analysis methodologies and results, and performance goals and measures.
As DDOT plans, funds, and implements various transportation projects that promote goals and strategies from moveDC, a need exists for methods to aid in objectively planning and prioritizing these investments, in addition to conducting before-after analyses of constructed facilities. It is critical that we are able to identify the projects and investments that will provide the highest level of benefits to residents. Performance measures are needed to track progress, develop effective solutions to project needs, prioritize needs and investments, and assess the effectiveness of a number of activities. Generally, a number of measures are required to fully describe transportation conditions for all users and modes. As a result, this Performance Measures Toolbox was developed as a Guide for DDOT staff and consultants to choose appropriate performance measures for specific project types and transportation modes. Many of these measures are often used in DDOT planning studies, while some are used less frequently and may be oriented to specific types of projects. Ultimately, this toolbox will provide necessary context, direction, data needs, and best practices so the measures are consistently applied for all projects, allowing for reliable project comparisons, decisionmaking, and a means for measuring progress.
PERFORMANCE MEASURES TOOLBOXThe Performance Measures Toolbox is organized according to Priority Measures and Project-Specific Measures across various moveDC goals. Priority Measures are identified as measures that should be evaluated for all DDOT project development efforts. These measures represent the foundation for understanding and assessing multimodal conditions for various user types on our City streets. By using the guidance within the Toolbox for these measures, the context, data needs, and evaluation methods should be relatively straightforward to follow, collect, and analyze. Project-Specific Measures are identified as measures that may be appropriate for specific types of projects and can be used in addition to Priority Measures. The Project-Specific Measures should be considered on a case-by-case basis for unique conditions detailed during public outreach activities, Purpose and Need statements, and other circumstances where they may be appropriate to address specific issues.

PE
RFO
RM
AN
CE
ME
ASU
RE
S TO
OLB
OX
7
COMMUNITY GOALS No single performance measure describes the full picture of a transportation system. The goals and objectives of a neighborhood or community are typically determined through a project development process and should be identified through public outreach. Citywide goals were developed through DC’s Multimodal Long Range Transportation Plan, moveDC. These goals include:
• Sustainability and Health
• Citywide Accessibility and Mobility
• Neighborhood Accessibility and Connectivity
• Safety and Security
• Public Space
• Preservation
• Funding and Financing
While these broad goals are considered to be consistent city-wide, additional variation of these goals may be identified through specific project studies. In these cases, the new goals should fall within some of these moveDC goals and best judgment should be used to determine appropriate measures. Two goals from moveDC, Preservation and Funding and Financing are not included in this Toolbox. These two goals are primarily system-wide and are not typically used in planning, operations, and design projects.
During the development of this matrix, DDOT was actively completing District Mobility, a Districtwide multimodal congestion management study and web-based dashboard. The Council-mandated study identifies a range of performance measures that will be routinely updated to provide updates on congestion in the District. For the most part, these congestion management measures are Districtwide measures and are not necessarily appropriate for project development studies, including corridor and neighborhood studies. However, a few congestion management measures may be appropriate for some planning-level studies, including travel time, travel time index, bus ridership, on-time performance, planning time index, and bus overcrowding. These measures are described herein but will also be available through District Mobility’s web-based dashboard, which will be continually updated to assist with ongoing monitoring of project impacts and to provide a baseline of data for projects.
USING THE PERFORMANCE MEASURES TOOLBOXThe Performance Measures Toolbox is a tool that can be used by a range of users under various scenarios. It provides guidance on appropriate performance measures to be used under specific project scenarios, including context, applicable goals, assessment modes, data needs, evaluation methods, best practices, and local examples. It provides general direction but does not provide detailed steps on analysis methodologies.
1. Who should use this Toolbox? The Toolbox should be used by DDOT planning staff and consultants supporting DDOT planning projects.
2. When should the Toolbox be used? The Toolbox can be used at various key project decision points, including project scoping (e.g., development of RFPs, project-specific scoping, budgeting), development of Purpose and Need statements, and before-after studies.
3. Why should the Toolbox be used? The Toolbox should be used to provide a consistent evaluation methodology for planning studies, including data collection, analysis, and best practices.
4. How should the Toolbox be used? The Toolbox should be used as a guide for choosing specific performance measures for a range of projects, including the appropriate data to collect and important considerations and “lessons learned” that provide appropriate context. The Priority Measures are ideally used for all projects and the Project-Specific Measures should be consulted on an “as needed” basis depending on project specifics.


PE
RFO
RM
AN
CE
ME
ASU
RE
S TO
OLB
OX
9
PERFORMANCE MEASURES TOOLBOX

PE
RFO
RM
AN
CE
ME
ASU
RE
S TO
OLB
OX
10
PERFORMANCE MEASURE
SUSTAINABILITY & HEALTH
CITYWIDE ACCESSIBILITY
& MOBILITY
NEIGHBORHOOD ACCESSIBILITY
& CONNECTIVITYSAFETY
& SECURITY PUBLIC SPACE
PRIORITY MEASURES Safety and Comfort 85th Percentile Speed
Bicycle and Pedestrian Crashes
Crash Frequency
Crash Rate
Crash Severity
Level of Traffic Stress
Mobility and Congestion Automobile Delay
Pedestrian Crossing Time
Progression Speed
Travel Time
Travel Time Index
Mode Share Automobile Volume
Bicycle Volume
Pedestrian Volume
Bus Ridership
PROJECT-SPECIFIC MEASURES Access to Jobs and Community Destinations Jobs and Destinations Served
System Coverage Residents Served
Environment Air Quality
Green Space
Impervious Surface
Traffic Noise
Traffic Diversion
Tree Coverage Travel Time Reliability
On-time Performance
Planning Time Index
Quality of Service
Bicycle Network Connectivity
Bus Overcrowding
Transit Frequency
Pedestrian Network Connectivity
System Utilization Person Throughput

PE
RFO
RM
AN
CE
ME
ASU
RE
S TO
OLB
OX
11
PERFORMANCE MEASURE
SUSTAINABILITY & HEALTH
CITYWIDE ACCESSIBILITY
& MOBILITY
NEIGHBORHOOD ACCESSIBILITY
& CONNECTIVITYSAFETY
& SECURITY PUBLIC SPACE
PRIORITY MEASURES Safety and Comfort 85th Percentile Speed
Bicycle and Pedestrian Crashes
Crash Frequency
Crash Rate
Crash Severity
Level of Traffic Stress
Mobility and Congestion Automobile Delay
Pedestrian Crossing Time
Progression Speed
Travel Time
Travel Time Index
Mode Share Automobile Volume
Bicycle Volume
Pedestrian Volume
Bus Ridership
PROJECT-SPECIFIC MEASURES Access to Jobs and Community Destinations Jobs and Destinations Served
System Coverage Residents Served
Environment Air Quality
Green Space
Impervious Surface
Traffic Noise
Traffic Diversion
Tree Coverage Travel Time Reliability
On-time Performance
Planning Time Index
Quality of Service
Bicycle Network Connectivity
Bus Overcrowding
Transit Frequency
Pedestrian Network Connectivity
System Utilization Person Throughput
AUTOMOBILE TRANSIT BICYCLE PEDESTRIAN
PE
RFO
RM
AN
CE
ME
ASU
RE
S TO
OLB
OX
12
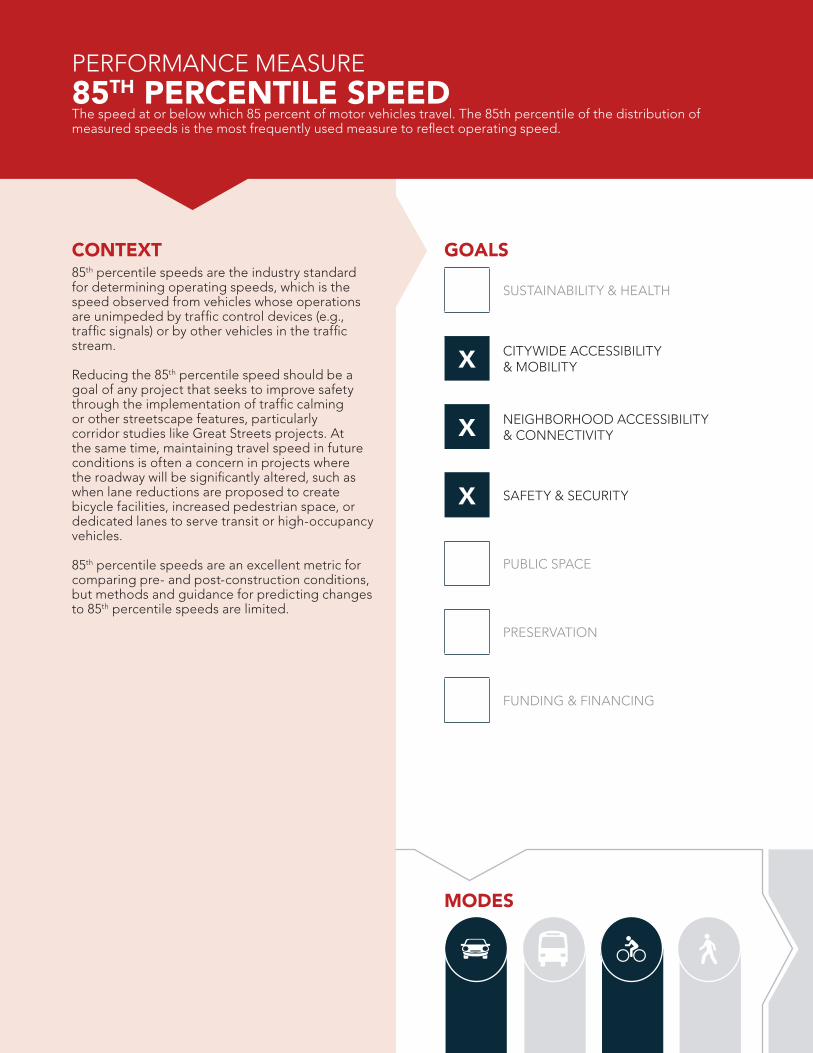
CONTEXT85th percentile speeds are the industry standard for determining operating speeds, which is the speed observed from vehicles whose operations are unimpeded by traffic control devices (e.g., traffic signals) or by other vehicles in the traffic stream.
Reducing the 85th percentile speed should be a goal of any project that seeks to improve safety through the implementation of traffic calming or other streetscape features, particularly corridor studies like Great Streets projects. At the same time, maintaining travel speed in future conditions is often a concern in projects where the roadway will be significantly altered, such as when lane reductions are proposed to create bicycle facilities, increased pedestrian space, or dedicated lanes to serve transit or high-occupancy vehicles.
85th percentile speeds are an excellent metric for comparing pre- and post-construction conditions, but methods and guidance for predicting changes to 85th percentile speeds are limited.
85TH PERCENTILE SPEEDThe speed at or below which 85 percent of motor vehicles travel. The 85th percentile of the distribution of measured speeds is the most frequently used measure to reflect operating speed.
MODES
PERFORMANCE MEASURE
GOALS
SUSTAINABILITY & HEALTH
X CITYWIDE ACCESSIBILITY & MOBILITY
X NEIGHBORHOOD ACCESSIBILITY & CONNECTIVITY
X SAFETY & SECURITY
PUBLIC SPACE
PRESERVATION
FUNDING & FINANCING
PE
RFO
RM
AN
CE
ME
ASU
RE
S TO
OLB
OX
13
DATA NEEDS AND SOURCES• Radar Measurement (more accurate, difficult to collect on high volume roadways)
• Automated Traffic Recorders / Pneumatic Tubes (cheap and provides large amounts of data)
• Vehicle Probe Data (INRIX / Google Maps / Waze)
EVALUATION METHODS• Utilize Existing Data ( e.g., Vehicle Probe Data, 85th percentile speeds from previous study)
• Estimate Speeds ( e.g., Microsimulation)
• Collect New Data ( e.g., Radar, ATR, Travel Time Runs)
• Plots of speeds, tables
NOTES/BEST PRACTICES• Speed data should be collected when the weather or conditions do not influence prevailing
speeds.
• If using radar guns, data should be collected during non-peak hours to reduce the chance of congestion and placed in an inconspicuous location to avoid being seen by approaching drivers. Data from ATRs should be collected for at least a week to account for weekday and weekend travel patterns and should be collected in both directions.
• Ensure that tubes are located clear of stopped and queuing traffic.
• Ensure that before/after data are collected under comparable traffic conditions (time of year), locations, and weather.
• Do not record speed data near automated speed enforcement or other constraints that could compromise the data.
• Tube counts can also be used to get automobile volume, classification, and speed data at the same time and can be used to investigate daily/hourly fluctuations. Under some circumstances, it may be necessary to collect data for individual travel lanes to account for varying lane utilizations, bus lanes, and other unique circumstances.
LOCAL EXAMPLE STUDIES• The Analysis of 2010 Speed Data in the District of Columbia Report aimed at evaluating and
comparing speeds on roadways where various safety and traffic improvements projects were implemented in order to improve traffic flow and increase motorist compliance with speeding since 2006.
• The Speed Limit and Safety Nexus Studies for Automated Speed Enforcement for the District of Columbia Report (2014) conducted speed and volume studies, performed field assessments, reviewed speed data and analyzed crash data at the 295 speed camera locations in the District of Columbia.
RELATED MEASURESCRASH RATEAUTOMOBILE DELAYTRAVEL TIME
TRAVEL TIME INDEXAIR QUALITYTRAFFIC NOISE

PE
RFO
RM
AN
CE
ME
ASU
RE
S TO
OLB
OX
14
CONTEXTBicycle and pedestrian crashes are one method to explore the safety impacts of a project on bicycle and pedestrian safety.
Bicycle and pedestrian crashes are typically much lower than automobile crashes; therefore it may be difficult to discern a trend in bicycle and pedestrian crash data. Consequently, bicycle and pedestrian crashes are often used to identify problem areas but should be combined with other measures, such as level of traffic stress and network accessibility, to compare before-and-after conditions. The presence of existing specific infrastructure should be considered as a surrogate data point in situations with limited crash data.
In addition to raw crash data, consideration must also be given to the perception of safety because pedestrians and bicyclists are more likely to use facilities that evoke feelings of safety. For example, a street with no sidewalk on one side of the street may have limited or no available pedestrian crash data over a specific period of time. This should not be construed as an area with no safety issues, but can likely be interpreted as an area that feels unsafe to pedestrians and therefore is not used by pedestrians.
Bicycle and pedestrian crash data can be compiled at an intersection, neighborhood, or District-wide. At the same time, crash data is compiled by the District of Columbia Metropolitan Police Department (MPD) and DDOT, and is thus limited to by the variable nature of detail in each individual report.
BICYCLE AND PEDESTRIAN CRASHESThe number or rate of bicycle and pedestrian crashes over a designated period of time, typically separated into individual modes and severity (i.e., fatalities, injuries, property damage only).
MODES
PERFORMANCE MEASURE
GOALS
X SUSTAINABILITY & HEALTH
CITYWIDE ACCESSIBILITY & MOBILITY
NEIGHBORHOOD ACCESSIBILITY & CONNECTIVITY
X SAFETY & SECURITY
PUBLIC SPACE
PRESERVATION
FUNDING & FINANCING

PE
RFO
RM
AN
CE
ME
ASU
RE
S TO
OLB
OX
15
DATA NEEDS AND SOURCES• DDOT Traffic Accident Reporting & Analysis
System (TARAS)
• Shapefile from DC GIS Open Data
• Turning Movement Counts (see Bicycle Volumes / Pedestrian Volumes)
EVALUATION METHODS• Historical crash data along a corridor or at an
intersection
• Crash trends over time
• Effective reliance on proven safety countermeasures (e.g., HAWK signals, median refuge islands, physically protected bike lanes).
NOTES/BEST PRACTICES• It is widely accepted best practice to use at least three years of crash data, preferably the most
recent. Changes in roadway geometry and operation should be noted as they may affect results
• It can be difficult to use as a post-construction evaluation metric since crashes are infrequent and it takes time to see effects of any changes
• It is helpful to cross-reference bicycle / pedestrian crashes with traffic operations (signalized/unsignalized), crosswalk markings, and other safety treatments.
• Although crash report formats do support detailed assessments of crashes in the field, they are completed by police officers in the field and may be subject to various approaches in thoroughness, bias, and perspective. As a result, some areas of specificity may not be available or may be misleading.
• Crash rates are difficult to obtain due to a lack of exposure data since pedestrian and bicycle counts are not widely available. Moreover, rates may not be reliable for bicycle and pedestrian crash analysis because the total number of crashes may be too low for meaningful trends or results.
LOCAL EXAMPLE STUDIES• The Florida Avenue NE Multimodal Transportation Study included a review of bicycle and
pedestrian crash data for 35 intersections in the study area for the three-year period from 2010 to 2012.
RELATED MEASURES85TH PERCENTILE SPEEDCRASH FREQUENCYCRASH RATECRASH SEVERITYLEVEL OF TRAFFIC STRESSPEDESTRIAN CROSSING TIME
AUTOMOBILE VOLUMEBICYCLE VOLUMEPEDESTRIAN VOLUMEBICYCLE NETWORK CONNECTIVITY PEDESTRIAN NETWORK CONNECTIVITY

PE
RFO
RM
AN
CE
ME
ASU
RE
S TO
OLB
OX
16
CONTEXTCrash frequency is one of the simplest forms of crash-related data. It is defined as the number of crashes occurring within a specific jurisdiction, roadway segment, or intersection, and is often used as an input for other crash metrics. Multiple crashes occurring at the same location over a period of time may be an indication of a safety issue and should be investigated and addressed appropriately.
Crash frequency can be measured in before-after studies to determine the impact of a project on safety. However, due to the need to have a robust data set – typically at least three years of crash data is desired – crash frequency for before-after studies can prove challenging because of the need to wait three years until data is available for the after condition.
Crash frequency is typically expressed in crashes per year.
Crash data is relatively easy to obtain, is a good indicator for safety goals/targets, and can be compiled at an intersection, neighborhood, or District-wide basis.
Crash data is compiled by the District of Columbia Metropolitan Police Department (MPD) and DDOT. Requests for crash data for a DDOT project can be made through DDOT’s Traffic Operations Administration (TOA).
CRASH FREQUENCYThe number of crashes that occur over a period of time within a set geographic parameter (e.g., intersection, corridor). Typically broken down into individual transportation modes.
MODES
PERFORMANCE MEASURE
GOALS
X SUSTAINABILITY & HEALTH
CITYWIDE ACCESSIBILITY & MOBILITY
NEIGHBORHOOD ACCESSIBILITY & CONNECTIVITY
X SAFETY & SECURITY
PUBLIC SPACE
PRESERVATION
FUNDING & FINANCING

PE
RFO
RM
AN
CE
ME
ASU
RE
S TO
OLB
OX
17
DATA NEEDS AND SOURCES• DDOT Traffic Accident Reporting & Analysis
System (TARAS)• Shapefile from DC GIS Open Data
EVALUATION METHODS• Trends over time
• Used as input for other metrics such as crash rate
• Used with application of proven crash modification factors.
NOTES/BEST PRACTICES• It is a widely accepted best practice to use at least three years of crash data, preferably the most
recent three years.
• Crash data can be broken down by crash type/severity depending on data availability.
• Crash data can be combined with volume data to produce crash rates.
• Crash data can be misleading on low-volume roadways because crashes are infrequent and it may take aggregation over multiple years to observe potential trends.
• Although crash report formats do support detailed assessments of crashes in the field, they are completed by police officers in the field and may be subject to various approaches in thoroughness, bias, and perspective. As a result, some areas of specificity may not be available or may be misleading (e.g., crash location).
• This method of identifying high hazard locations has some limitations, since it does not consider traffic exposure, location characteristics, and contributing factors. Locations with high traffic volumes could experience a higher frequency of crashes but represent a low to moderate risk for road users. In contrast, a low volume location with fewer crashes could present much greater risk to road users.
• Hypothesis testing for statistical significance should be used in before-and-after studies to account for the randomness of crash occurrences (see Highway Safety Manual critical crash analysis). Additionally, regression to the mean, the natural variation in crash data, must be considered when assessing crash frequency and rates over a specific period of time.
LOCAL EXAMPLE STUDIES• The Traffic Safety Statistic Report for the District of Columbia is an annual review traffic of crash
statistics and information on high crash frequency locations in the District.
• The C Street NE Multimodal Corridor Study used a crash frequency analysis to identify intersections with potential speed-related issues.
RELATED MEASURESBICYCLE AND PEDESTRIAN CRASHESCRASH RATE
CRASH SEVERITY

PE
RFO
RM
AN
CE
ME
ASU
RE
S TO
OLB
OX
18
CONTEXTCrash rate is an often-used safety measure that combines crash frequency and volume. It may however, be limited by the availability of volume data.
A high intersection crash rate (industry standard is typically greater than 1.0 crash per million entering vehicles) may be an indication of a safety issue to be investigated and addressed appropriately.
Crash rates are relatively easy to compile, are good indicators for safety goals and targets, and can be compiled at an intersection and corridor-wide basis. Compared to the crash frequency method of identifying hazardous locations, the crash rate method can be more appropriate since it takes traffic volumes and/or segment lengths (exposure) into account.
The disadvantage of using crash rates is that comparatively high crash rates could be computed for locations with low traffic volumes, which could lead to erroneous interpretation.
CRASH RATEAt an intersection, crash rate is defined as the average number of crashes per year divided by the volume of traffic entering the intersection per year, and is generally reported in crashes per Million Entering Vehicles (MEV). Over a roadway segment, crash rate is typically expressed in crashes per 100 million vehicle miles traveled (VMT).
MODES
PERFORMANCE MEASURE
GOALS
X SUSTAINABILITY & HEALTH
CITYWIDE ACCESSIBILITY & MOBILITY
NEIGHBORHOOD ACCESSIBILITY & CONNECTIVITY
X SAFETY & SECURITY
PUBLIC SPACE
PRESERVATION
FUNDING & FINANCING
PE
RFO
RM
AN
CE
ME
ASU
RE
S TO
OLB
OX
19
DATA NEEDS AND SOURCES• DDOT Traffic Accident Reporting & Analysis
System (TARAS)
• Shapefile from DC GIS
• Tube counts, DDOT AADT maps, and Turning Movement Counts (see Automobile Volumes)
EVALUATION METHODS• Combine crash frequency with volume data,
typically presented as a rate (MEV).
• Trends over time
• Used with application of proven crash modification factors.
NOTES/BEST PRACTICES• It is widely accepted best practice to use at least three years of data, preferably the most recent.
Changes in roadway geometry and operation should be noted as they may affect results
• Can be difficult to use as a post-construction evaluation metric since crashes are infrequent and it may take a few years to see effects of any changes
• Compared to the crash frequency method of ranking hazardous locations, the crash rate method can be more appropriate since it takes traffic volumes (exposure) into account.
• Hypothesis testing for statistical significance should be used in before-and-after studies to account for the randomness of crash occurrences (see Highway Safety Manual critical crash analysis). Additionally, regression to the mean, the natural variation in crash data, must be considered when assessing crash frequency and rates over a specific period of time. If regression to the mean is not taken into account, a location may selected for evaluation when crashes are at a randomly high fluctuation or overlooked when a location is at a randomly low fluctuation.
LOCAL EXAMPLE STUDIES• The Florida Avenue NE Multimodal Transportation Study included a review of crash data for
35 intersections in the study area for the three-year period from 2010 to 2012. Crash data was expressed as both crash frequency and crash rate and the intersections with crash rates over 1.0 MEV were evaluated more closely by reviewing individual crash reports and developing safety countermeasures to address specific safety issues.
RELATED MEASURESBICYCLE AND PEDESTRIAN CRASHESCRASH FREQUENCYCRASH SEVERITY
AUTOMOBILE VOLUMEBICYCLE VOLUMEPEDESTRIAN VOLUME
PE
RFO
RM
AN
CE
ME
ASU
RE
S TO
OLB
OX
20
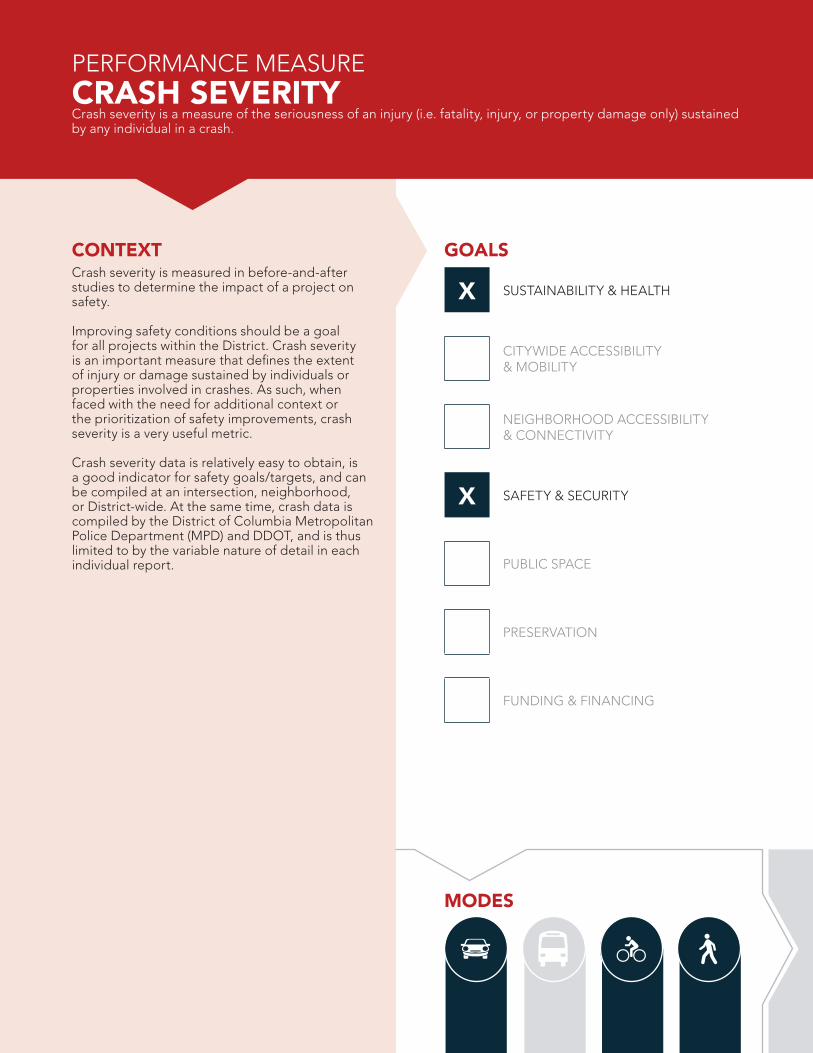
CONTEXTCrash severity is measured in before-and-after studies to determine the impact of a project on safety.
Improving safety conditions should be a goal for all projects within the District. Crash severity is an important measure that defines the extent of injury or damage sustained by individuals or properties involved in crashes. As such, when faced with the need for additional context or the prioritization of safety improvements, crash severity is a very useful metric.
Crash severity data is relatively easy to obtain, is a good indicator for safety goals/targets, and can be compiled at an intersection, neighborhood, or District-wide. At the same time, crash data is compiled by the District of Columbia Metropolitan Police Department (MPD) and DDOT, and is thus limited to by the variable nature of detail in each individual report.
CRASH SEVERITYCrash severity is a measure of the seriousness of an injury (i.e. fatality, injury, or property damage only) sustained by any individual in a crash.
MODES
PERFORMANCE MEASURE
GOALS
X SUSTAINABILITY & HEALTH
CITYWIDE ACCESSIBILITY & MOBILITY
NEIGHBORHOOD ACCESSIBILITY & CONNECTIVITY
X SAFETY & SECURITY
PUBLIC SPACE
PRESERVATION
FUNDING & FINANCING

PE
RFO
RM
AN
CE
ME
ASU
RE
S TO
OLB
OX
21
DATA NEEDS AND SOURCES• DDOT Traffic Accident Report & Analysis
System (TARAS)• Shapefile from DC GIS Open Data
EVALUATION METHODS• Crash severity is often expressed using a
weighted score to reflect crash costs to society. For example, Virginia DOT uses a weight of 1 for property damage only (PDO) crashes, 3 for injury crashes, and 12 for fatal crashes.
• Generally presented as number of crashes with injuries/fatalities
• Trends over time
NOTES/BEST PRACTICES• It is widely accepted best practice to use the three most recent three years of crash data. Changes
in roadway geometry and operation should be noted as they may affect results.
• May be difficult to use as a post-construction evaluation metric since crashes are infrequent and it may take a few years to see effects of any changes.
• May not be useful at low-speed locations such as local streets due to the low frequency of fatal and injury crashes.
LOCAL EXAMPLE STUDIES• The Florida Avenue NE Multimodal Transportation Study included a review of crash data for 35
intersections in the study area for the three-year period from 2010 to 2012. Crash severity data was obtained from DDOT and expressed as a ratio of injury crashes out of total crashes.
RELATED MEASURES85TH PERCENTILE SPEEDBICYCLE AND PEDESTRIAN CRASHESCRASH FREQUENCYCRASH RATE

PE
RFO
RM
AN
CE
ME
ASU
RE
S TO
OLB
OX
22
CONTEXTLevel of traffic stress (LTS) is an effective measure for assessing the completeness of the bicycle network, particularly because it highlights all streets that are appropriate for the “interested, but concerned” bicycling demographic (i.e. LTS values of 1 and 2). LTS also highlights areas of concern where the network is not complete and uncomfortable for less experienced bicyclists (i.e., LTS values of 3 and 4).
Can be used to compare different project alternatives, particularly to determine the impact of investments in bicycle infrastructure that improve network connections.
In the LTS procedure, each roadway or bicycle facility segment is assigned a value from 1 (representing the least amount of stress) to 4 (representing the most amount of stress). Each value is assigned a percentage of the potential bicyclist demographic that would be comfortable cycling on the facility.
Factors that may influence the LTS for a particular segment include the type of bicycle facility (e.g. sharing lanes with automobiles, a painted/buffered bike lane, or a separated bike lane), the speed of adjacent automobile traffic, the width of the street, and the presence of on-street parking.
LTS mapping is used to illustrate the effective bicycle network for each stress level. This highlights the existing network of low stress local streets and helps identify key gaps and barriers. Following this method, planners can identify projects that would bridge relatively small gaps to significantly expand the low-stress accessible reach of a given point.
LEVEL OF TRAFFIC STRESSA bicycle suitability methodology that measures the relative comfort of bicycling on a given street.
MODES
PERFORMANCE MEASURE
GOALS
SUSTAINABILITY & HEALTH
X CITYWIDE ACCESSIBILITY & MOBILITY
X NEIGHBORHOOD ACCESSIBILITY & CONNECTIVITY
SAFETY & SECURITY
PUBLIC SPACE
PRESERVATION
FUNDING & FINANCING

PE
RFO
RM
AN
CE
ME
ASU
RE
S TO
OLB
OX
23
DATA NEEDS AND SOURCES• Roadway characteristic data, such as number
of lanes, lane width, and speeds.
• Bicycle facility data, such as the type (protected bicycle facilities, trails, and bike lanes) and width of the facilities.
• Width of on-street parking adjacent to bicycle facilities
• DDOT maintains a city-wide LTS database so information should be readily available for all projects within the District of Columbia.
EVALUATION METHODS• GIS
NOTES/BEST PRACTICES• LTS relies on a small amount of easily obtained data. It is more appropriate as a network tool for
measuring the quality of streets than for analysis of a specific project or design situation.
LOCAL EXAMPLE STUDIES• The National Highway Traffic Safety Administration (NHTSA) conducts surveys of bicyclist
behaviors and attitudes, which creates a basis for LTS values.
• The Crosstown Multimodal Study used the LTS to perform a high-level analysis of the bicycle improvements proposed along the study corridor.
• LTS was completed for the entire city for the District Mobility project (2016).
RELATED MEASURES85TH PERCENTILE SPEEDAUTOMOBILE VOLUME
BICYCLE VOLUMEBICYCLE NETWORK CONNECTIVITY

PE
RFO
RM
AN
CE
ME
ASU
RE
S TO
OLB
OX
24
CONTEXTAutomobile delay is a long-time industry standard performance measure, typically used to estimate the change in amount of time a vehicle spends at an intersection due to changes in traffic volumes, roadway geometry, or operations.
Typically, automobile delay is expressed as the average amount of delay experienced by each driver traveling through an intersection or along a particular crossing. Average automobile intersection delay is measured in seconds per vehicle, and is also used to determine automobile level-of-service (LOS).
Delay is rarely measured directly in practice; typically traffic volumes, intersection geometry, intersection control type, and signal timing information are used to predict delay using Highway Capacity Manual (HCM) procedures or microsimulation.
There are several levels of analysis and software programs that employ HCM methodologies to calculate delay. For planning-level analyses such as evaluating alternatives, these software programs can be employed using default values for many variables. For an operational level of analysis such as developing signal-timings plans, using non-default values measured in the field is important to get refined results. For complex projects, microsimulation traffic models are used when traditional HCM methodologies fall short. This usually occurs in corridor analyses, with complicated signal timings, short distances between intersections, and pedestrian conflicts. Automobile delay, and in turn LOS, is one of the basic measurements used in before-and-after studies to determine the impact of a project on traffic operations.
Reducing automobile delay may be a goal of any project that seeks to improve traffic flow, travel times, and minimize vehicle emissions that result from stop-and-go conditions and idling. However, balancing mobility and safety of a range of user types (e.g., pedestrians, bicyclists, and transit users) must also be considered when evaluating projects, and as such automobile delay may increase in order to accommodate the movement of other users.
AUTOMOBILE DELAYDelay is defined as the amount of additional automobile travel time incurred due to the presence of a traffic control device such as a traffic signal or stop sign. The delay for a vehicle is the difference between the vehicle’s actual travel time and its free-flow travel time if there were no other traffic present.
MODES
PERFORMANCE MEASURE
GOALS
SUSTAINABILITY & HEALTH
X CITYWIDE ACCESSIBILITY & MOBILITY
X NEIGHBORHOOD ACCESSIBILITY & CONNECTIVITY
SAFETY & SECURITY
PUBLIC SPACE
PRESERVATION
FUNDING & FINANCING

PE
RFO
RM
AN
CE
ME
ASU
RE
S TO
OLB
OX
25
DATA NEEDS AND SOURCES• Roadway geometric data, such as number of
lanes, lane widths, grades, vehicle speed
• Traffic control type (stop-control, yield-control, signal control, etc.)
• Traffic signal timing information (if applicable)
• Automobile turning movement volumes including the percent of heavy vehicles, and bicycle and pedestrian volumes
• Travel time runs for microsimulation model calibration (if applicable)
EVALUATION METHODS• Highway Capacity Manual 2010 Chapter
18 (delay is often expressed with the corresponding LOS)
• Microsimulation (SimTraffic, VISSIM)
• Macroscopic Analysis Software (Synchro, Vistro, HCS)
• Vehicle Probe Data
NOTES/BEST PRACTICES• Automobile delay is typically reported for an hour-long period, usually during the AM and PM
peak periods; however, other evaluation periods may be appropriate given the project, such as school peak hours, shift change peak hours (i.e. for a hospital), retail peak hours, midday peaks or weekend peak hours.
• When evaluating multiple intersections in the same study, individual peak hours may be used, and during others the overall peak hour across all intersections – the system peak – is used. System peak is typically used when there are closely spaced intersections and the interaction between intersections is a desired factor to include in the evaluation.
• Traffic volume data should be collected during the morning and afternoon peak hours for a typical mid-week day (Tuesday, Wednesday, or Thursday). In some cases, such as the development of signal timing plans, other weekday or weekend periods may be considered.
• The data should exclude days where weather, incidents, and holidays influence the traffic. For example, in the District of Columbia, traffic data should not be collected during summer months, when schools and universities are on breaks, and when Congress is not in session.
• Since delay is not typically measured in the field, it is not the most useful evaluation measure for a before/after comparison. When used for before/after comparisons, a new traffic model is built after construction and compared to both the pre-construction existing conditions to see what changes have occurred, and to the pre-construction future build conditions to see how well the changes were predicted.
LOCAL EXAMPLE STUDIES• The Florida Avenue NE Multimodal Transportation Study used peak hour automobile delay at
a series of intersections along the study corridor to compare the potential impacts of various alternative cross sections.
• The C Street NE Multimodal Corridor Study used peak hour automobile delay at five intersections along the study corridor to compare the potential impacts of three alternatives that would eliminate one or more lanes along the corridor.
• The Post-construction Analysis compared the calculated delays at multiple intersections along the M Street NW corridor before and after one travel lane was replaced by a protected bicycle lane.
RELATED MEASURESPROGRESSION SPEEDTRAVEL TIMETRAVEL TIME INDEXAUTOMOBILE VOLUME
AIR QUALITYTRAFFIC NOISEPERSON THROUGHPUT

PE
RFO
RM
AN
CE
ME
ASU
RE
S TO
OLB
OX
26
CONTEXTPedestrian crossing times are often measured or calculated during the comparison of alternatives to ensure that pedestrians, especially the elderly and disabled, have sufficient time to cross an intersection. “Sufficient” time may be crossing the entire street in a single phase or crossing the street in two phases if an adequate median refuge is provided.
Providing sufficient pedestrian crossing time should be the goal of any project that seeks to improve safety at intersections that have infrequent opportunities to cross or lack traffic calming or streetscape features that reduce the overall crossing width.
Signalized intersections should provide sufficient pedestrian crossing time for all movements, while keeping overall signal cycle lengths as short as possible. Longer pedestrian crossing times potentially add more delay to all intersection users. The effective crossing distance can be reduced through geometry changes and lane reductions.
PEDESTRIAN CROSSING TIMEThe amount of time required by pedestrians to travel across an intersection. Pedestrian crossing time may also refer to the amount of programmed signal timing provided at signalized intersections.
MODES
PERFORMANCE MEASURE
GOALS
SUSTAINABILITY & HEALTH
X CITYWIDE ACCESSIBILITY & MOBILITY
X NEIGHBORHOOD ACCESSIBILITY & CONNECTIVITY
X SAFETY & SECURITY
PUBLIC SPACE
PRESERVATION
FUNDING & FINANCING
PE
RFO
RM
AN
CE
ME
ASU
RE
S TO
OLB
OX
27
DATA NEEDS AND SOURCES• Roadway geometric data, such as street width • Pedestrian walking speeds (if available)
EVALUATION METHODS• Minimum pedestrian crossing time can be calculated by dividing the crossing distance by the
15th-percentile walking speed, often taken to be 3.5 feet per second. This effectively determines the “Flash Don’t Walk” phase on pedestrian signals, with an additional 4-7 seconds provided for the “Walk” phase.
• The total pedestrian crossing distance should include all areas of the roadway surface where vehicles could potentially travel, including travel lanes, bicycle lanes, and parking lanes.
NOTES/BEST PRACTICES• Consider one-stage crossings at all intersection crossing movements unless it is not feasible.
Multi-stage crossings typically add substantially more delay to pedestrians but can be achieved successfully if the median refuge area is comfortable and ADA compliant.
• Longer pedestrian crossing times/distances are associated with additional exposure to conflicts with vehicles.
• In some cases, minor street green times are dictated by the required pedestrian crossing time on the adjacent approach. Pedestrian signals on major streets should rest in “Walk” for the corresponding green phase.
• Pedestrian crossing times longer than the minimum calculated “Flash Don’t Walk” and “Walk” may be warranted in locations with high pedestrian volumes or unusual geometric conditions (e.g., angled streets, intersections with more than four approaches).
LOCAL EXAMPLE STUDIES• Multiple cross section alternatives were developed for the following studies in order to reduce
pedestrian crossing distances:
– Florida Avenue Multimodal Study
– Maryland Avenue Multimodal Study
– C Street Multimodal Corridor Study
– Far Southeast II Livability Study
RELATED MEASURESBICYCLE AND PEDESTRIAN CRASHESAUTOMOBILE DELAYPEDESTRIAN VOLUME
PEDESTRIAN NETWORK CONNECTIVITYPERSON THROUGHPUT

PE
RFO
RM
AN
CE
ME
ASU
RE
S TO
OLB
OX
28
CONTEXTProgression speeds may vary by mode, but in general, maintaining consistent speeds across all vehicles helps facilitate a safer environment and bicyclists will perceive a facility as more comfortable the closer their speeds are to automobile speeds.
Poor signal progression is a source of delay for buses operating in mixed traffic at intersections.
Progression speeds can be controlled by modifying signal timing and offsets.
PROGRESSION SPEEDThe operating speed of a corridor as allowed by signal timing over a series of signalized intersections. In simpler terms, signal progression is when signals turn green as a user approaches them at a uniform progression speed.
MODES
PERFORMANCE MEASURE
GOALS
SUSTAINABILITY & HEALTH
X CITYWIDE ACCESSIBILITY & MOBILITY
X NEIGHBORHOOD ACCESSIBILITY & CONNECTIVITY
SAFETY & SECURITY
PUBLIC SPACE
PRESERVATION
FUNDING & FINANCING
PE
RFO
RM
AN
CE
ME
ASU
RE
S TO
OLB
OX
29
DATA NEEDS AND SOURCES• Vehicle Probe Data (INRIX / Google maps/
Waze)
• Bluetooth/cell phones
• Manual travel time runs using GPS
• Traffic volume, traffic signal timing data, and origin-destination data (for predictive calculation of travel time)
EVALUATION METHODS• 85th percentile speeds
• Time-space diagrams
• Estimates via macroscopic or microsimulation software
NOTES/BEST PRACTICES• Ensure that comparable start and end locations will be available in before and after conditions.
• Consider the effect of driveways, lost time at signals, and other impedances on progression speed.
• Predicting travel times can be done for all modes, though predictive tools are only available for vehicular modes of travel.
LOCAL EXAMPLE STUDIES• The Post-Construction Analysis compared the progression speed of both automobiles and
bicycles along a 1.3-mile signalized corridor on M Street NW. The study also compared the progression speeds before-and-after construction of the protected bicycle lane and found that conversion of one travel lane to the protected bicycle lane resulted in an automobile progression speed that was more similar to bicycle speeds, thereby creating a safer, more comfortable experience for bicyclists.
RELATED MEASURES85TH PERCENTILE SPEEDLEVEL OF TRAFFIC STRESSTRAVEL TIME
TRAVEL TIME INDEXAIR QUALITY

PE
RFO
RM
AN
CE
ME
ASU
RE
S TO
OLB
OX
30
CONTEXTThe advantages of using travel time as a performance measure is that it is a simple concept understood and communicated by a wide variety of audiences, it is a general indicator of traffic conditions, and it can help identify if a project or alternative will impact existing conditions.
Balancing modal travel times are often at odds with each other. For example, a decrease in pedestrian travel time may result in an increase auto and transit travel times.
Project objectives and thresholds for travel time impacts should be defined at the beginning of a project.
Travel time can be measured in before-and-after reports to determine the impact of a project on traffic operations for all modes.
The disadvantage of using travel time as a performance measure is that it only offers usable results along corridors or long segments, industry standard methodologies do not account for interaction between modes, and it may not align with perceived travel time (e.g. corridors with many stops are less favorable than corridors with few stops, even though the actual travel time may be less).
TRAVEL TIMEThe time required to traverse a route between any two points of interest. A fundamental transportation measure, this measure is typically reported as an average for specific routes or corridors over a period of time, but it can also be averaged for a system.
MODES
PERFORMANCE MEASURE
GOALS
SUSTAINABILITY & HEALTH
X CITYWIDE ACCESSIBILITY & MOBILITY
X NEIGHBORHOOD ACCESSIBILITY & CONNECTIVITY
SAFETY & SECURITY
PUBLIC SPACE
PRESERVATION
FUNDING & FINANCING

PE
RFO
RM
AN
CE
ME
ASU
RE
S TO
OLB
OX
31
DATA NEEDS AND SOURCES• Vehicle Probe Data (INRIX / Google maps/
Waze / Bluetooth / GPS)• Traffic volume, traffic signal timing data,
and origin-destination data (for predictive calculation of travel time)
EVALUATION METHODS• Percentile Travel Times: 50th, 85th, 90th, or
95th Percentile Travel Times
• Time-space diagrams
• Estimates via macroscopic or microsimulation software
• Collect New Data (e.g., Probe Data, License Plate Matching, Bluetooth/GPS)
• Utilize Existing Data
NOTES/BEST PRACTICES• Travel time data are best used when the route reflects a typical trip route.
• Travel time data should be collected when the weather or conditions do not influence prevailing speeds
• Ensure that comparable start and end locations will be available in before and after conditions.
• Ensure to make a number of runs that meet statistical significance thresholds.
• Automated data collection ensures larger sample size
• Predicting travel times can be done for all modes, though prediction tools are only available for vehicular modes of travel.
LOCAL EXAMPLE STUDIES• The 16th Street NW Transit Priority Planning Study included a travel time evaluation for buses
traversing multiple routes on 16th Street. Using WMATA’s Automatic Vehicle Location (AVL) data, existing average travel time for four routes was calculated for six different times of day. The study estimated new travel times for transit and vehicles using VISSIM.
• Travel time is routinely calculated District-wide and is detailed in District Mobility, the District of Columbia's multimodal congestion web-based dashboard.
RELATED MEASURES85TH PERCENTILE SPEEDAUTOMOBILE DELAYPROGRESSION SPEED TRAVEL TIMETRAVEL TIME INDEX
AIR QUALITYTRAFFIC DIVERSIONON-TIME PERFORMANCEPLANNING TIME INDEXTRANSIT FREQUENCY

PE
RFO
RM
AN
CE
ME
ASU
RE
S TO
OLB
OX
32
CONTEXTTypical congested roadways and intersections during peak conditions are measured in travel time index. This serves as a baseline for peak hour travel in comparison to off-peak travel conditions.
Using travel time index as a performance measure allows for congested areas to be identified on a network-level without the detailed inputs required for a level of service / delay analysis.
Through the District Mobility project, the travel time index will be calculated for major arterials within the District of Columbia.
TRAVEL TIME INDEXA measure of travel time reliability representing the average additional time experienced during a peak period and is defined as the ratio of a weekday peak period travel time to the free-flow travel time (i.e. the travel time during unimpeded conditions such as overnight).1
MODES
PERFORMANCE MEASURE
GOALS
SUSTAINABILITY & HEALTH
X CITYWIDE ACCESSIBILITY & MOBILITY
NEIGHBORHOOD ACCESSIBILITY & CONNECTIVITY
SAFETY & SECURITY
PUBLIC SPACE
PRESERVATION
FUNDING & FINANCING
1 USDOT. Travel Time Reliability: Making it There On Time, All the Time. 2015.

PE
RFO
RM
AN
CE
ME
ASU
RE
S TO
OLB
OX
33
DATA NEEDS AND SOURCES• Vehicle Probe Data (INRIX / Google maps/
Waze)• Traffic volume, traffic signal timing data,
and origin-destination data (for predictive calculation of travel times)
EVALUATION METHODS• 50th Percentile Travel Times
• Estimates via macroscopic or microsimulation software
• Collect New Data (e.g., Probe Data)
• Utilize Existing Data
NOTES/BEST PRACTICES• Travel time index is used to determine average roadway conditions during traditional peak
periods. This is a proxy for congestion levels for a given corridor.
• Travel time index can be compared to other traffic conditions as a point of reference for corridor reliability or trip travel times.
LOCAL EXAMPLE STUDIES• The District Mobility project calculated travel time index for major arterials in the District of
Columbia. This measure will be calculated regularly.
• Travel time is routinely calculated District-wide and is detailed in District Mobility, the District of Columbia's multimodal congestion web-based dashboard.
RELATED MEASURESAUTOMOBILE DELAYPROGRESSION SPEED
TRAVEL TIMEPLANNING TIME INDEX

PE
RFO
RM
AN
CE
ME
ASU
RE
S TO
OLB
OX
34
CONTEXTCollecting automobile volumes is considered to be the first step in determining the usage of a roadway as it is easily measured and understood; it is also used as an input for many other measures. While collecting volume data, additional data points such as vehicle classification, speed, directionality, and gap/headway can be collected depending on the medium used to count. The period and length of data collection should also depend on the type of study being performed.
Automobile volumes can be measured in before-and-after studies to determine the impact of a project on automobiles. They are best applied at intersection, corridor, neighborhood, and Citywide studies.
AUTOMOBILE VOLUMEThe measured (i.e., counted) number of automobiles in a specified area for a designated period of time.
MODES
PERFORMANCE MEASURE
GOALS
SUSTAINABILITY & HEALTH
X CITYWIDE ACCESSIBILITY & MOBILITY
X NEIGHBORHOOD ACCESSIBILITY & CONNECTIVITY
SAFETY & SECURITY
PUBLIC SPACE
PRESERVATION
FUNDING & FINANCING

PE
RFO
RM
AN
CE
ME
ASU
RE
S TO
OLB
OX
35
DATA NEEDS AND SOURCES• DDOT AADT maps
• ATRs (pneumatic tubes, radar, microwave, laser, ultrasonic, infrared, metal loops, video)
• Turning movement counts (counted manually,
in person or off video)
• Future projections – MWCOG model
• Development programs
• Trip Generation
EVALUATION METHODS• Traffic volume is often expressed as an hourly
flow rate, but can be evaluated using daily or weekly profiles.
• Industry practice is to utilize the average annual daily traffic (AADT) volume and/or the peak hour volume for the 30th-highest hour of the year to evaluate traffic operations.
• Volume trends from year to year are often used to develop historical growth rates and used to project volumes into the future.
• Future traffic volumes can also be projected using travel demand models, which account for changes in land use, geometry, demographics, and future development.
NOTES/BEST PRACTICES• Volume data should be collected in “typical” or “average” conditions, which in the District is
during times that Congress and DCPS are in session. If the timeframe for data collection is short, data should be collected during middle weekdays (i.e., Tuesday, Wednesday, and Thursday). Depending on the study area, avoid collecting data during “special events” like holidays, parades, concerts, and sporting events.
• Using ATRs in urban areas can be difficult in conditions where vehicles do not operate at constant speed, where vehicles follow very closely, or where stop and go traffic occurs.
• For a corridor, consider counting all parallel corridors that may also be impacted (through diverted trips)
LOCAL EXAMPLE STUDIES• DDOT’s Traffic Volume Maps are assembled using volume data that is collected at pre-selected
locations on Highway Performance Monitoring System Sections on a three year cycle; counts are converted to Annual Average Daily Traffic. Counters are also placed for 24 hours during weekdays on a sample of 100 local links annually; counts are adjusted to Average Annual Weekday Traffic.
RELATED MEASURESCRASH RATEAUTOMOBILE DELAYPROGRESSION SPEEDAIR QUALITY
TRAFFIC NOISETRAFFIC DIVERSIONPERSON THROUGHPUT
PE
RFO
RM
AN
CE
ME
ASU
RE
S TO
OLB
OX
36
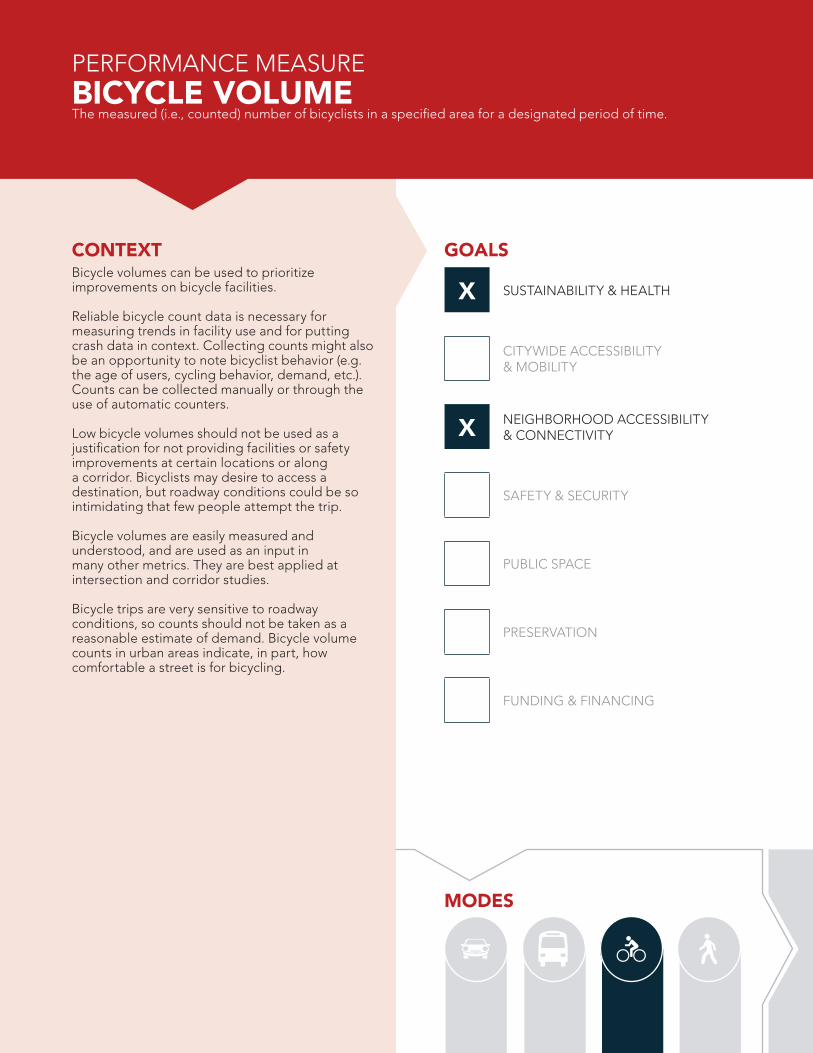
CONTEXTBicycle volumes can be used to prioritize improvements on bicycle facilities.
Reliable bicycle count data is necessary for measuring trends in facility use and for putting crash data in context. Collecting counts might also be an opportunity to note bicyclist behavior (e.g. the age of users, cycling behavior, demand, etc.). Counts can be collected manually or through the use of automatic counters.
Low bicycle volumes should not be used as a justification for not providing facilities or safety improvements at certain locations or along a corridor. Bicyclists may desire to access a destination, but roadway conditions could be so intimidating that few people attempt the trip.
Bicycle volumes are easily measured and understood, and are used as an input in many other metrics. They are best applied at intersection and corridor studies.
Bicycle trips are very sensitive to roadway conditions, so counts should not be taken as a reasonable estimate of demand. Bicycle volume counts in urban areas indicate, in part, how comfortable a street is for bicycling.
BICYCLE VOLUMEThe measured (i.e., counted) number of bicyclists in a specified area for a designated period of time.
MODES
PERFORMANCE MEASURE
GOALS
X SUSTAINABILITY & HEALTH
CITYWIDE ACCESSIBILITY & MOBILITY
X NEIGHBORHOOD ACCESSIBILITY & CONNECTIVITY
SAFETY & SECURITY
PUBLIC SPACE
PRESERVATION
FUNDING & FINANCING
PE
RFO
RM
AN
CE
ME
ASU
RE
S TO
OLB
OX
37
DATA NEEDS AND SOURCES• Inductive Loops
• Infrared Sensors (Passive or Active)
• Manual Observation (in person or video)
• Utilize Existing Data (permanent stations and annual count locations, previous studies)
EVALUATION METHODS• Trends from year to year, or any desired time
period
• Analysis of seasonal and weather-related
variations
• Volumes as input to other multimodal measures
NOTES/BEST PRACTICES• Bicycle volumes are more variable and sensitive to weather and seasonal conditions than
automobile volumes. As such, data collection efforts should be mindful of these conditions and plan accordingly.
• Long-term, fixed bicycle counters can offer important insights into trends and fluctuation, which can be used to calibrate short-term manual counts.
• Automobile volumes are easier to detect than bicycle volumes, which often travel together in close groups, could possibly travel on sidewalks/outside the roadway or designated bicycle lane, or potentially cross at unmarked locations. Familiarity with the study area will ensure that the data collection accounts for bicycle behavior such as shortcuts and compliance with signal control devices.
• No industry standard for projecting bicycle trips or changes to volumes based on land use and infrastructure improvements exists today.
• For corridor studies, consider counting parallel corridors that may also be impacted through diverted bicycle trips.
• The Guidebook on Pedestrian and Bicycle Volume Data Collection (NCHRP Report 797) and the Traffic Monitoring Guide (FHWA) both offer comprehensive details on non-motorized counting.
LOCAL EXAMPLE STUDIES• The Georgetown Transportation Study included an assessment of the level of bicycle activity
through data collected at 25 locations.
• The DDOT Bicycle Facility Evaluation included the collection of bicycle volumes at locations between intersections along the three study corridors. Bicycle volumes were collected through manual observation, and included counts of bicycles traveling inside and outside of the designated bicycle facilities.
RELATED MEASURESBICYCLE AND PEDESTRIAN CRASHESAUTOMOBILE DELAY
BICYCLE NETWORK CONNECTIVITYPERSON THROUGHPUT
PE
RFO
RM
AN
CE
ME
ASU
RE
S TO
OLB
OX
38
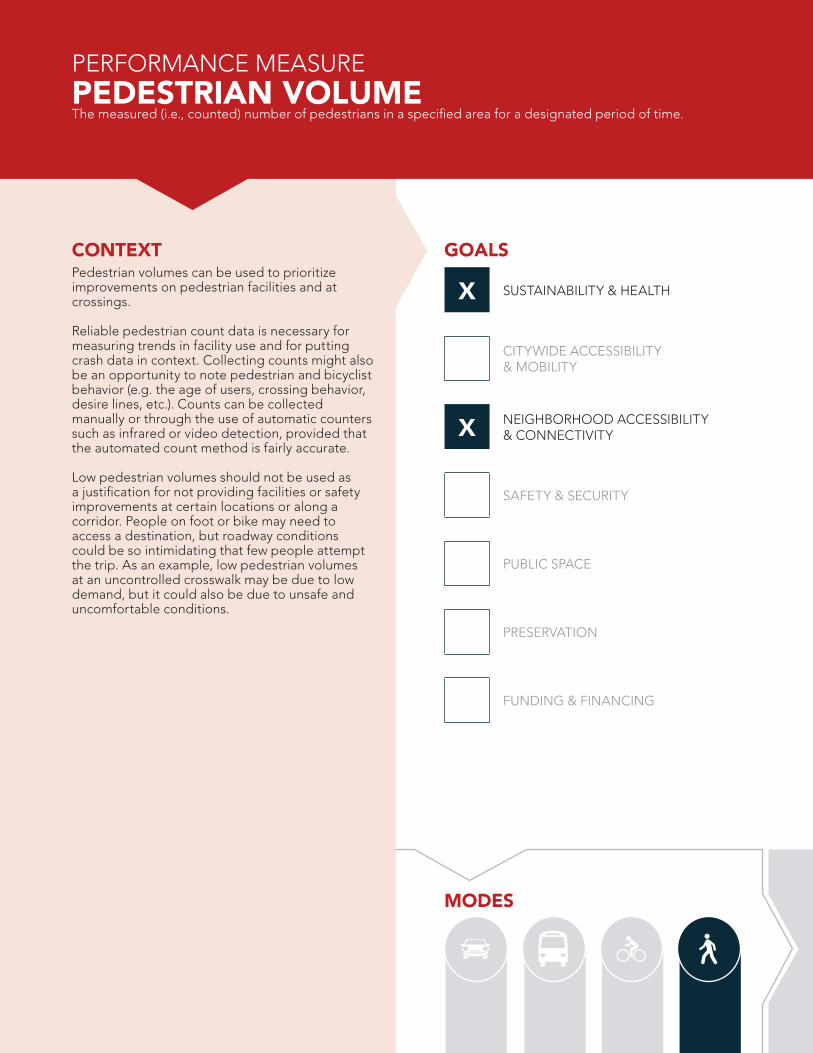
CONTEXTPedestrian volumes can be used to prioritize improvements on pedestrian facilities and at crossings.
Reliable pedestrian count data is necessary for measuring trends in facility use and for putting crash data in context. Collecting counts might also be an opportunity to note pedestrian and bicyclist behavior (e.g. the age of users, crossing behavior, desire lines, etc.). Counts can be collected manually or through the use of automatic counters such as infrared or video detection, provided that the automated count method is fairly accurate.
Low pedestrian volumes should not be used as a justification for not providing facilities or safety improvements at certain locations or along a corridor. People on foot or bike may need to access a destination, but roadway conditions could be so intimidating that few people attempt the trip. As an example, low pedestrian volumes at an uncontrolled crosswalk may be due to low demand, but it could also be due to unsafe and uncomfortable conditions.
PEDESTRIAN VOLUMEThe measured (i.e., counted) number of pedestrians in a specified area for a designated period of time.
MODES
PERFORMANCE MEASURE
GOALS
X SUSTAINABILITY & HEALTH
CITYWIDE ACCESSIBILITY & MOBILITY
X NEIGHBORHOOD ACCESSIBILITY & CONNECTIVITY
SAFETY & SECURITY
PUBLIC SPACE
PRESERVATION
FUNDING & FINANCING

PE
RFO
RM
AN
CE
ME
ASU
RE
S TO
OLB
OX
39
DATA NEEDS AND SOURCES• Infrared Sensors (Passive or Active)
• Manual Observation (in person or video)
• Pedestrian volumes are often counted at
intersections along with automobile turning movement counts.
• Use existing volume data from previous studies
EVALUATION METHODS• Trends from year to year, or any desired time
period
• Volumes as inputs to other multimodal measures
• Highway Capacity Model Pedestrian Level of Service
• Daily and annual trends
NOTES/BEST PRACTICES• Pedestrian volumes are more variable and sensitive to weather and seasonal conditions than
automobile volumes. As such, data collection efforts should be mindful of these conditions and plan accordingly. Weather conditions should be noted during all data collection efforts. A combination of long and short duration counts can also provide geographic coverage and seasonal insights to more accurately understand demand and travel patterns.
• Pedestrians often travel together in close groups and/or outside designated walkways or marked crosswalks. Familiarity with the study area will ensure that the data collection accounts for pedestrian behavior such as walking patterns and compliance with signal control devices.
• For before-and-after corridor studies, consider counting pedestrian volumes on parallel facilities that may also be impacted (through diverted trips).
• Key resources for pedestrian volume data collection include NCHRP Report 797: Guidebook on Pedestrian and Bicycle Volume Data Collection and FHWA’s Traffic Monitoring Guide.
• Estimating pedestrian demand can be a useful exercise to compare volumes with expected volumes, which may point to a deficiency in the quality of the pedestrian environment.
LOCAL EXAMPLE STUDIES• The Georgetown Transportation Study aimed to assess the level of pedestrian activity 25
locations throughout the study area. Pedestrian volumes were collected through manual observations at intersections during the morning and afternoon periods on an average weekday as well as during midday Saturday.
RELATED MEASURESBICYCLE AND PEDESTRIAN CRASHESAUTOMOBILE DELAYPEDESTRIAN CROSSING TIME
PEDESTRIAN NETWORK CONNECTIVITYPERSON THROUGHPUT
PE
RFO
RM
AN
CE
ME
ASU
RE
S TO
OLB
OX
40
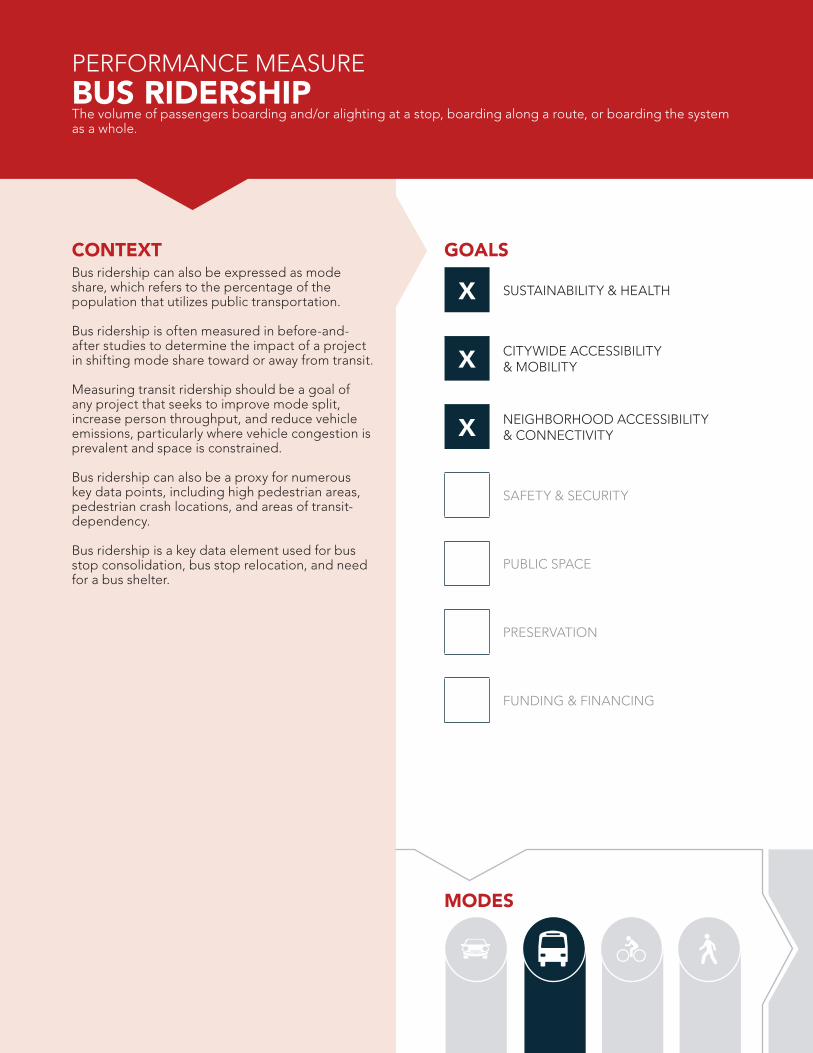
CONTEXTBus ridership can also be expressed as mode share, which refers to the percentage of the population that utilizes public transportation.
Bus ridership is often measured in before-and-after studies to determine the impact of a project in shifting mode share toward or away from transit.
Measuring transit ridership should be a goal of any project that seeks to improve mode split, increase person throughput, and reduce vehicle emissions, particularly where vehicle congestion is prevalent and space is constrained.
Bus ridership can also be a proxy for numerous key data points, including high pedestrian areas, pedestrian crash locations, and areas of transit-dependency.
Bus ridership is a key data element used for bus stop consolidation, bus stop relocation, and need for a bus shelter.
BUS RIDERSHIPThe volume of passengers boarding and/or alighting at a stop, boarding along a route, or boarding the system as a whole.
MODES
PERFORMANCE MEASURE
GOALS
X SUSTAINABILITY & HEALTH
X CITYWIDE ACCESSIBILITY & MOBILITY
X NEIGHBORHOOD ACCESSIBILITY & CONNECTIVITY
SAFETY & SECURITY
PUBLIC SPACE
PRESERVATION
FUNDING & FINANCING

PE
RFO
RM
AN
CE
ME
ASU
RE
S TO
OLB
OX
41
DATA NEEDS AND SOURCES• Automatic passenger counters (APCs),
obtained from transit agencies.
• Transit station access mode share, obtained from transit agencies.
• The American Community Survey (ACS), obtained from the U.S. Census Bureau.
EVALUATION METHODS• Project-specific bus ridership data collected
along a corridor or area can be used to estimate the mode share by counting the number of people traveling by each mode.
• Travel mode choice for commute trips is also available via the American Community Survey (ACS).
NOTES/BEST PRACTICES• Bus ridership can be sensitive to weather or seasonal conditions and data should be collected
on typical weekdays to the extent possible. In many cases, ridership data is an average of several days, thus balancing out days with inclement weather.
LOCAL EXAMPLE STUDIES• The North-South Corridor Planning Study utilized transit ridership data along prominent north-
south corridors such as Georgia Avenue NW to identify potential transit alignments.
• Bus ridership is routinely calculated District-wide and is detailed in District Mobility, the District of Columbia's multimodal congestion web-based dashboard.
RELATED MEASURESTRAVEL TIMETRAVEL TIME INDEXJOBS AND DESTINATIONS SERVEDRESIDENTS SERVED
ON-TIME PERFORMANCEBUS OVERCROWDINGTRANSIT FREQUENCYPERSON THROUGHPUT

PE
RFO
RM
AN
CE
ME
ASU
RE
S TO
OLB
OX
42
CONTEXTThe percentage of jobs/destinations served can be used as a measure to compare different project alternatives, particularly if the alternatives represent different infrastructure investment options for accessing jobs/destinations.
The percentage of jobs/destinations served can also be used to prioritize investments in filling gaps in the transit, bicycle, or pedestrian network. For instance, projects that will allow for continuous access to a high number of jobs/destinations can be prioritized over projects that are not critical for access to jobs/destinations.
Transportation investments that enable people to access a greater number and variety of employment opportunities, destinations, and services, can have significant impact on communities.
DC residents are limited in job choice by the travel time between home and potential employers. Travel time in excess of 45 minutes is generally considered a detriment to job choice and/or mode selection.2
JOBS AND DESTINATIONS SERVEDThe employment and/or activity centers that may be accessed by transit, bicycle, or walking. The measure is most commonly represented as a percentage.
MODES
PERFORMANCE MEASURE
GOALS
SUSTAINABILITY & HEALTH
CITYWIDE ACCESSIBILITY & MOBILITY
X NEIGHBORHOOD ACCESSIBILITY & CONNECTIVITY
SAFETY & SECURITY
PUBLIC SPACE
PRESERVATION
FUNDING & FINANCING
2 USDOT. Guidebook for Developing Pedestrian & Bicycle Performance Measures. 2016.

PE
RFO
RM
AN
CE
ME
ASU
RE
S TO
OLB
OX
43
DATA NEEDS AND SOURCES• GIS transportation network for all modes.
• Local transportation costs (e.g., fuel prices, transit fares).
• U.S. Census demographic and jobs data.
• U.S. Bureau of Labor and Statistics
EVALUATION METHODS• Using housing, employment, and transportation data, measure the total number of jobs/
destinations that may be accessed in less than 30 or 45 minutes. These measurements can be reported in terms of job type (sectors) to offer more detail.
NOTES/BEST PRACTICES• Buffer calculations can provide a rough idea of access, but this method does not account for
barriers that do not have a crossing for people on for or bike (e.g. freeways, rivers)
• Consider only high-frequency transit lines (e.g. with service every 15 minutes or less).
LOCAL EXAMPLE STUDIES• The North-South Corridor Planning Study identified several transit alternatives for north-south
connections in the District. Population and employment areas were two measures used to identify possible deficiencies in transportation options and desirability for a new north-south connection.
RELATED MEASURESLEVEL OF TRAFFIC STRESSTRAVEL TIMETRAVEL TIME INDEXON-TIME PERFORMANCE
BICYCLE NETWORK CONNECTIVITYTRANSIT FREQUENCYPEDESTRIAN NETWORK CONNECTIVITY
PE
RFO
RM
AN
CE
ME
ASU
RE
S TO
OLB
OX
44
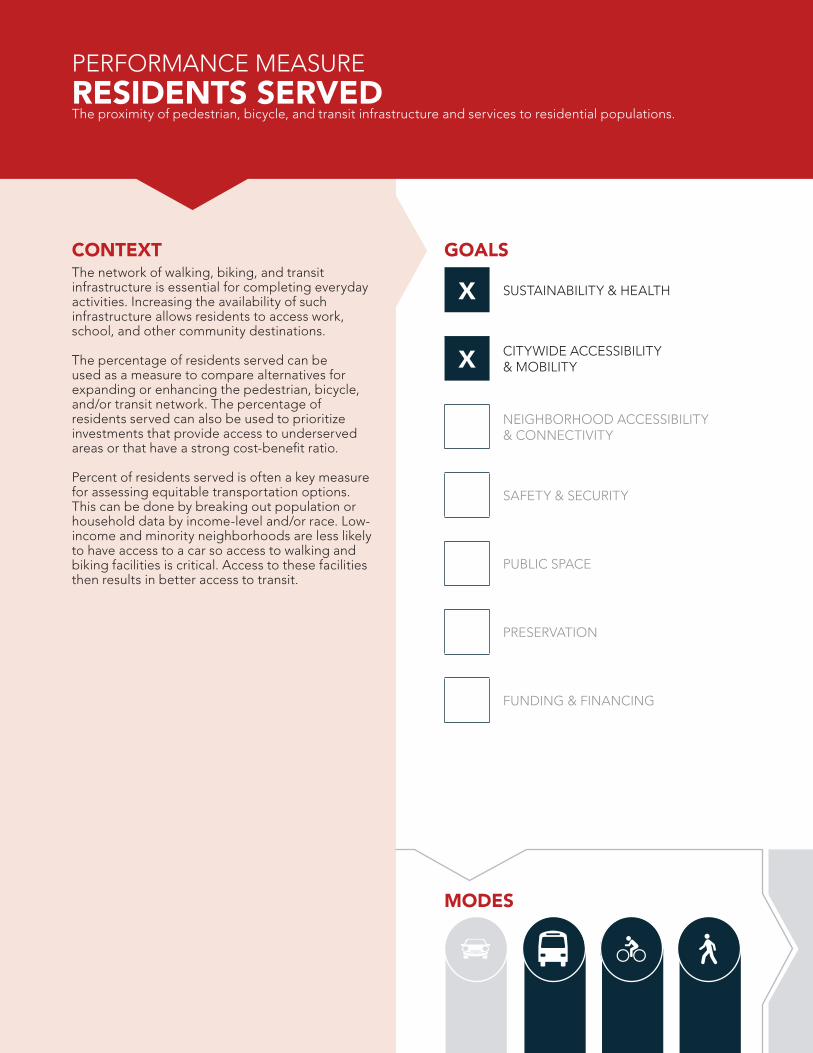
CONTEXTThe network of walking, biking, and transit infrastructure is essential for completing everyday activities. Increasing the availability of such infrastructure allows residents to access work, school, and other community destinations.
The percentage of residents served can be used as a measure to compare alternatives for expanding or enhancing the pedestrian, bicycle, and/or transit network. The percentage of residents served can also be used to prioritize investments that provide access to underserved areas or that have a strong cost-benefit ratio.
Percent of residents served is often a key measure for assessing equitable transportation options. This can be done by breaking out population or household data by income-level and/or race. Low-income and minority neighborhoods are less likely to have access to a car so access to walking and biking facilities is critical. Access to these facilities then results in better access to transit.
RESIDENTS SERVEDThe proximity of pedestrian, bicycle, and transit infrastructure and services to residential populations.
MODES
PERFORMANCE MEASURE
GOALS
X SUSTAINABILITY & HEALTH
X CITYWIDE ACCESSIBILITY & MOBILITY
NEIGHBORHOOD ACCESSIBILITY & CONNECTIVITY
SAFETY & SECURITY
PUBLIC SPACE
PRESERVATION
FUNDING & FINANCING

PE
RFO
RM
AN
CE
ME
ASU
RE
S TO
OLB
OX
45
DATA NEEDS AND SOURCES• U.S. Census demographic data
• GIS transportation network for all modes
• Transit frequency and route data
• Level of traffic stress street network
EVALUATION METHODS• Percent of population within a ½-mile walking
distance or 2-mile biking distance to a transit stop.
• Percent of population within a ¼-mile network distance to sidewalk, trail, bike facility, or low traffic stress street.
• Percent of transit stops or sidewalks that are ADA compliant.
• Percent of population within walking distance of high-frequency transit service.
NOTES/BEST PRACTICES• Whenever possible, calculate distances along an existing or planned network.
• Buffer calculations can provide a rough idea of access, but this method does not account for barriers that do not have a crossing for people on foot or bike (e.g. freeways, rivers)
• Consider only high-frequency transit lines (e.g. with service every 15 minutes or less).
LOCAL EXAMPLE STUDIES• The North-South Corridor Planning Study identified several transit alternatives for north-south
connections in the District. Population and employment areas were two measures used to identify possible deficiencies in transportation options and desirability for a new north-south connection.
RELATED MEASURESLEVEL OF TRAFFIC STRESSTRAVEL TIMETRAVEL TIME INDEXON-TIME PERFORMANCE
BICYCLE NETWORK CONNECTIVITYTRANSIT FREQUENCYPEDESTRIAN NETWORK CONNECTIVITY

PE
RFO
RM
AN
CE
ME
ASU
RE
S TO
OLB
OX
46
CONTEXTPer the federal 1990 Clean Air Act, transportation investments must not compromise an area’s progress towards attainment of the federal health-based air quality standards. To demonstrate this, non-exempt transportation improvement projects must at a minimum be included in a conforming Transportation Improvement Program and Plan. The federal conformity regulation (40 CFR 93.11) also requires a project level conformity determination for non-exempt transportation projects (DDOT, 2013). The District of Columbia is currently designated by the United States Environmental Protection Agency (EPA) as a nonattainment area for O3 and PM2.5 and a maintenance area for CO. Hence, a project level conformity determination must be completed before a DDOT project may progress beyond the planning stage to ensure that National Environmental Policy Act (NEPA) requirements have been satisfied.
EPA and DDOT guidelines state that a hot spot analysis for air quality shall be conducted for any intersection that is projected to operate at level of service D (LOS D) or worse.
Vehicle Emissions are often measured in Hot Spot Analyses of multimodal corridor studies to determine the impact of efforts to reduce vehicle miles traveled, improve traffic flow, and support multimodal transportation alternatives.
Reducing vehicle emissions should be the goal of any project that seeks to improve air quality through the implementation of multi-modal transportation systems that offer low-emission travel choices and strategies focused on reducing congestion.
AIR QUALITYA measure of airborne pollutants most often associated with carbon-burning motor vehicles and accelerated by increased levels of congestion, traffic volume, and idling.
MODES
PERFORMANCE MEASURE
GOALS
X SUSTAINABILITY & HEALTH
CITYWIDE ACCESSIBILITY & MOBILITY
NEIGHBORHOOD ACCESSIBILITY & CONNECTIVITY
SAFETY & SECURITY
X PUBLIC SPACE
PRESERVATION
FUNDING & FINANCING

PE
RFO
RM
AN
CE
ME
ASU
RE
S TO
OLB
OX
47
DATA NEEDS AND SOURCES• 85th Percentile Speed
• 95th Percentile Queue
• Automobile Delay
• Truck Volume
• Transit Frequency
• Vehicle Miles Traveled (VMT)
• Carbon Monoxide (CO) Emission Rates
EVALUATION METHODS• Regional travel demand model
• Synchro traffic operations analysis
• Roadside monitors
• Vehicle emissions dispersion model (CAL3QHC model recommended by DDOT)
NOTES/BEST PRACTICESConcentrations of primary pollutants are estimated using a dispersion model. Based on the federal regulations, DDOT recommends the CAL3QHC model be used for analyzing effects of CO and PM2.5 concentrations at roadway intersections.
LOCAL EXAMPLE STUDIES• C Street NE Hot-Spot Analysis • Florida Avenue Hot-Spot Analysis
RELATED MEASURES85TH PERCENTILE SPEEDAUTOMOBILE DELAYPROGRESSION SPEED
AUTOMOBILE VOLUMEBICYCLE VOLUMEPEDESTRIAN VOLUME
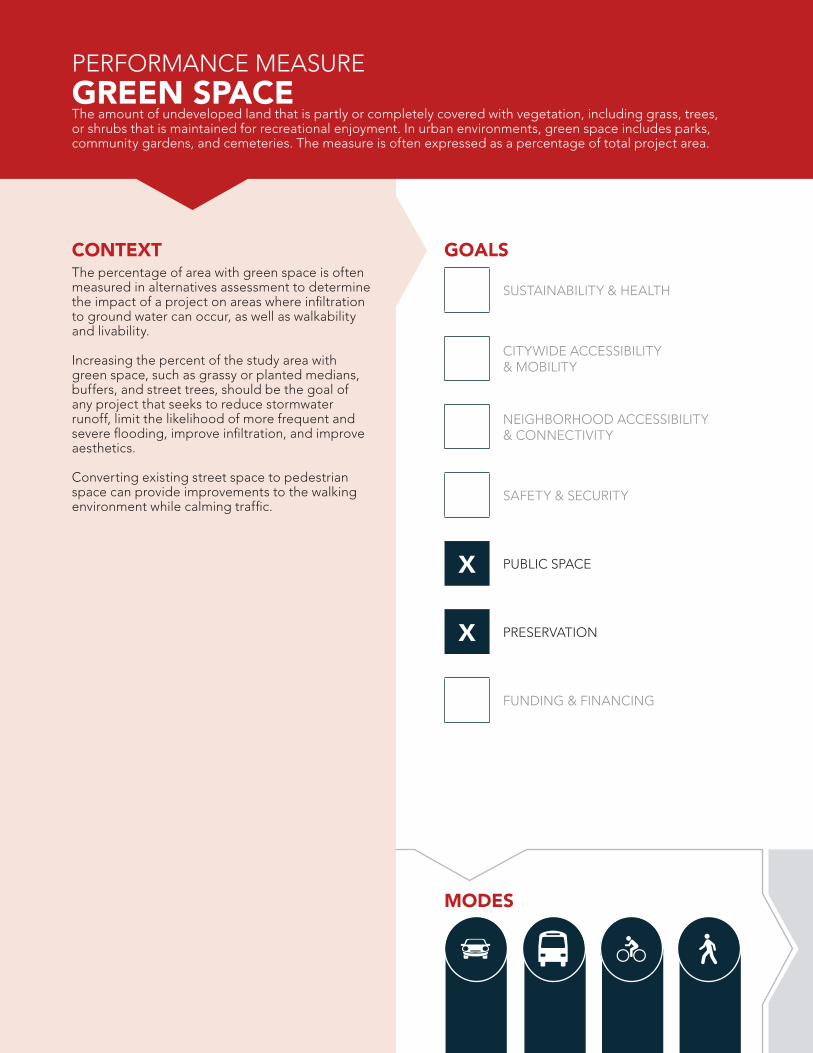
PE
RFO
RM
AN
CE
ME
ASU
RE
S TO
OLB
OX
48
CONTEXTThe percentage of area with green space is often measured in alternatives assessment to determine the impact of a project on areas where infiltration to ground water can occur, as well as walkability and livability.
Increasing the percent of the study area with green space, such as grassy or planted medians, buffers, and street trees, should be the goal of any project that seeks to reduce stormwater runoff, limit the likelihood of more frequent and severe flooding, improve infiltration, and improve aesthetics.
Converting existing street space to pedestrian space can provide improvements to the walking environment while calming traffic.
GREEN SPACEThe amount of undeveloped land that is partly or completely covered with vegetation, including grass, trees, or shrubs that is maintained for recreational enjoyment. In urban environments, green space includes parks, community gardens, and cemeteries. The measure is often expressed as a percentage of total project area.
MODES
PERFORMANCE MEASURE
GOALS
SUSTAINABILITY & HEALTH
CITYWIDE ACCESSIBILITY & MOBILITY
NEIGHBORHOOD ACCESSIBILITY & CONNECTIVITY
SAFETY & SECURITY
X PUBLIC SPACE
X PRESERVATION
FUNDING & FINANCING

PE
RFO
RM
AN
CE
ME
ASU
RE
S TO
OLB
OX
49
DATA NEEDS AND SOURCES• Land Use Data
• Roadway Characteristic Data (e.g. number of travel lanes, driveway inventory)
• Bodies of Water
• Public Space
EVALUATION METHODS• GIS
NOTES/BEST PRACTICES• Prioritize the preservation of green space near wetlands and near storm drains to minimize the
effect of stormwater runoff in these areas.
LOCAL EXAMPLE STUDIES• In the C Street Multimodal Corridor Study, the amount of paved surface converted to green space
was used to compare different alternative cross sections for the corridor.
RELATED MEASURESIMPERVIOUS SURFACE TREE COVERAGE
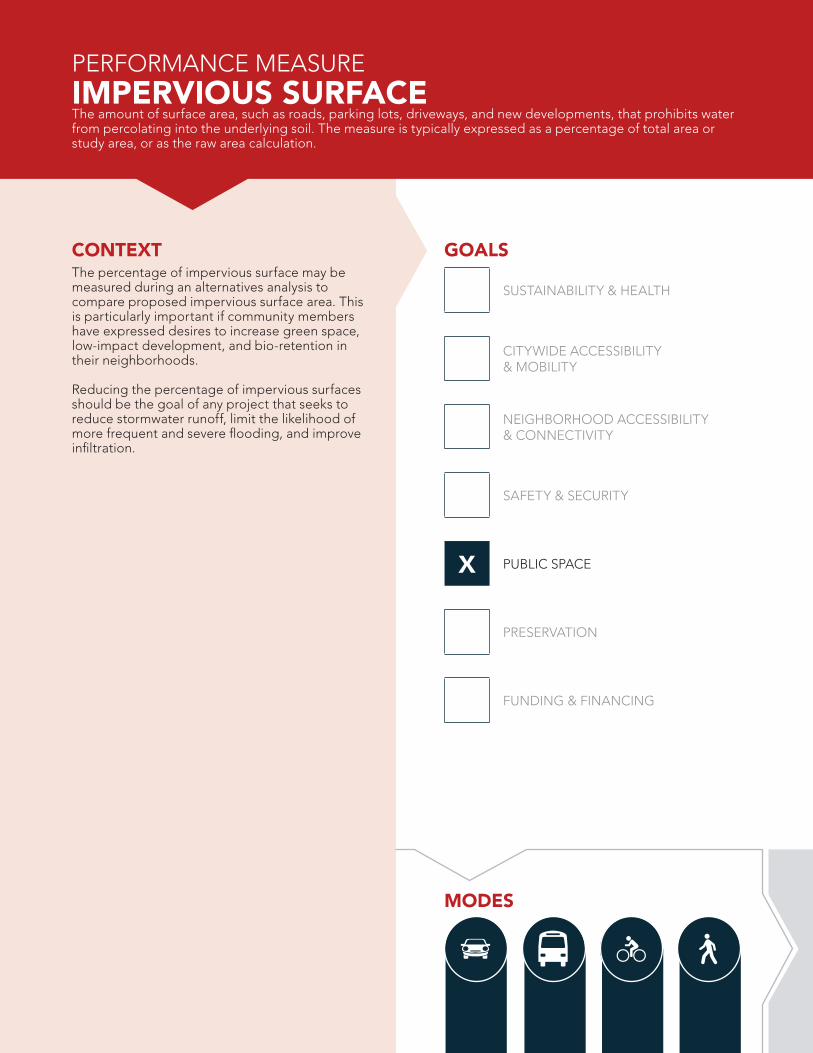
PE
RFO
RM
AN
CE
ME
ASU
RE
S TO
OLB
OX
50
CONTEXTThe percentage of impervious surface may be measured during an alternatives analysis to compare proposed impervious surface area. This is particularly important if community members have expressed desires to increase green space, low-impact development, and bio-retention in their neighborhoods.
Reducing the percentage of impervious surfaces should be the goal of any project that seeks to reduce stormwater runoff, limit the likelihood of more frequent and severe flooding, and improve infiltration.
IMPERVIOUS SURFACEThe amount of surface area, such as roads, parking lots, driveways, and new developments, that prohibits water from percolating into the underlying soil. The measure is typically expressed as a percentage of total area or study area, or as the raw area calculation.
MODES
PERFORMANCE MEASURE
GOALS
SUSTAINABILITY & HEALTH
CITYWIDE ACCESSIBILITY & MOBILITY
NEIGHBORHOOD ACCESSIBILITY & CONNECTIVITY
SAFETY & SECURITY
X PUBLIC SPACE
PRESERVATION
FUNDING & FINANCING

PE
RFO
RM
AN
CE
ME
ASU
RE
S TO
OLB
OX
51
DATA NEEDS AND SOURCES• Land Use Data
• Roadway Characteristic Data (e.g. number of travel lanes, driveway inventory)
• Bodies of Water
• Public Space
EVALUATION METHODS• GIS
NOTES/BEST PRACTICES• Prioritize the reduction in impervious surfaces near wetlands and near storm drains to minimize
the effect of stormwater runoff in these areas.
LOCAL EXAMPLE STUDIES• In the C Street Multimodal Corridor Study, the amount of paved surface converted to green space
was used to compare different alternative cross sections for the corridor.
RELATED MEASURESGREEN SPACE TREE COVERAGE
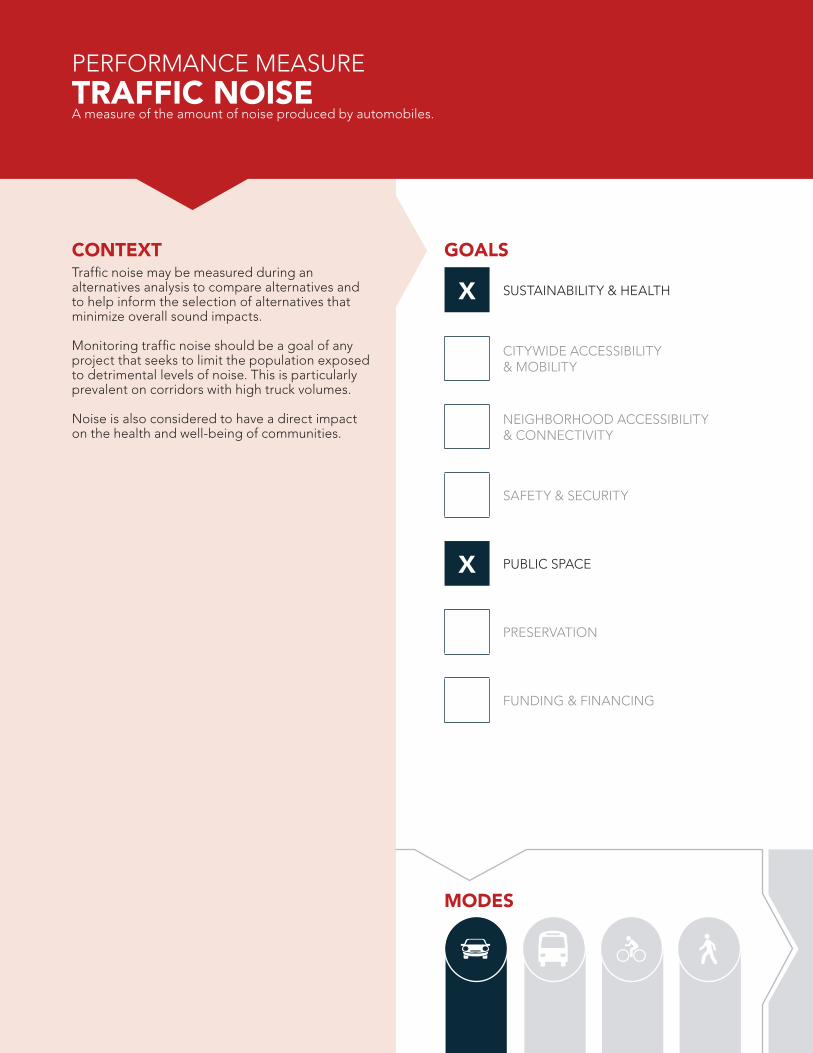
PE
RFO
RM
AN
CE
ME
ASU
RE
S TO
OLB
OX
52
CONTEXTTraffic noise may be measured during an alternatives analysis to compare alternatives and to help inform the selection of alternatives that minimize overall sound impacts.
Monitoring traffic noise should be a goal of any project that seeks to limit the population exposed to detrimental levels of noise. This is particularly prevalent on corridors with high truck volumes.
Noise is also considered to have a direct impact on the health and well-being of communities.
TRAFFIC NOISEA measure of the amount of noise produced by automobiles.
MODES
PERFORMANCE MEASURE
GOALS
X SUSTAINABILITY & HEALTH
CITYWIDE ACCESSIBILITY & MOBILITY
NEIGHBORHOOD ACCESSIBILITY & CONNECTIVITY
SAFETY & SECURITY
X PUBLIC SPACE
PRESERVATION
FUNDING & FINANCING
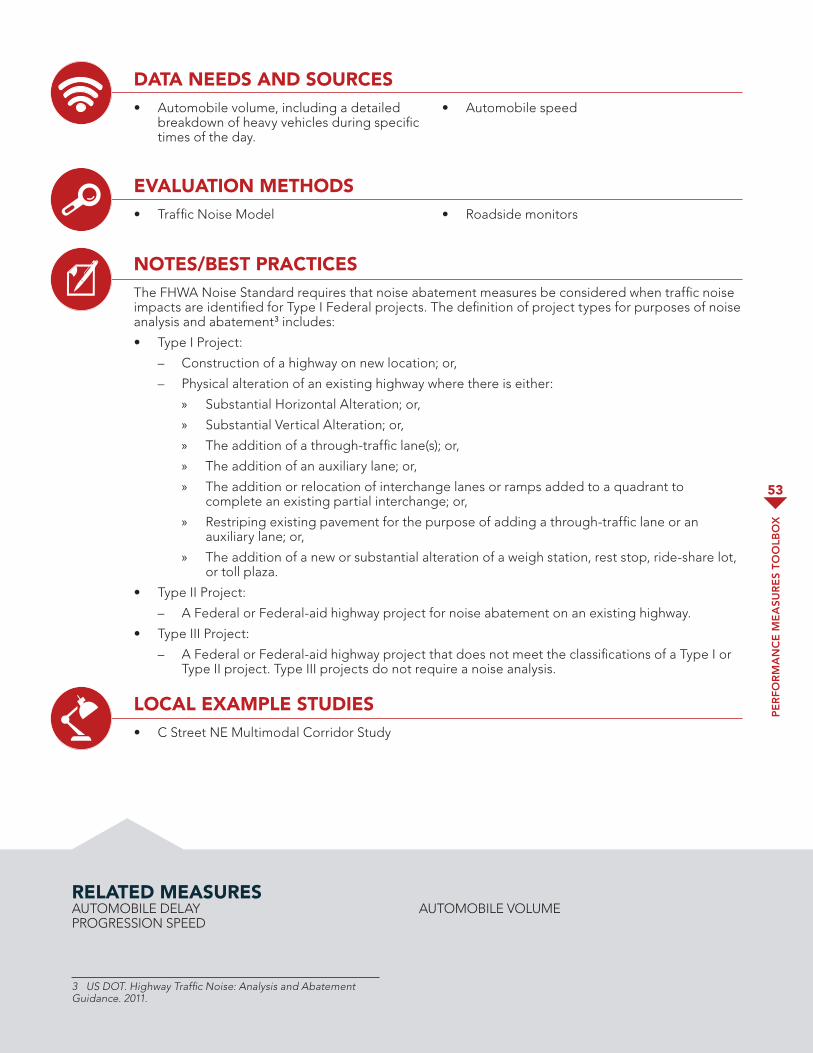
PE
RFO
RM
AN
CE
ME
ASU
RE
S TO
OLB
OX
53
DATA NEEDS AND SOURCES• Automobile volume, including a detailed
breakdown of heavy vehicles during specific times of the day.
• Automobile speed
EVALUATION METHODS• Traffic Noise Model • Roadside monitors
NOTES/BEST PRACTICESThe FHWA Noise Standard requires that noise abatement measures be considered when traffic noise impacts are identified for Type I Federal projects. The definition of project types for purposes of noise analysis and abatement3 includes:
• Type I Project:
– Construction of a highway on new location; or,
– Physical alteration of an existing highway where there is either:
» Substantial Horizontal Alteration; or,
» Substantial Vertical Alteration; or,
» The addition of a through-traffic lane(s); or,
» The addition of an auxiliary lane; or,
» The addition or relocation of interchange lanes or ramps added to a quadrant to complete an existing partial interchange; or,
» Restriping existing pavement for the purpose of adding a through-traffic lane or an auxiliary lane; or,
» The addition of a new or substantial alteration of a weigh station, rest stop, ride-share lot, or toll plaza.
• Type II Project:
– A Federal or Federal-aid highway project for noise abatement on an existing highway.
• Type III Project:
– A Federal or Federal-aid highway project that does not meet the classifications of a Type I or Type II project. Type III projects do not require a noise analysis.
LOCAL EXAMPLE STUDIES• C Street NE Multimodal Corridor Study
RELATED MEASURESAUTOMOBILE DELAYPROGRESSION SPEED
AUTOMOBILE VOLUME
3 US DOT. Highway Traffic Noise: Analysis and Abatement Guidance. 2011.
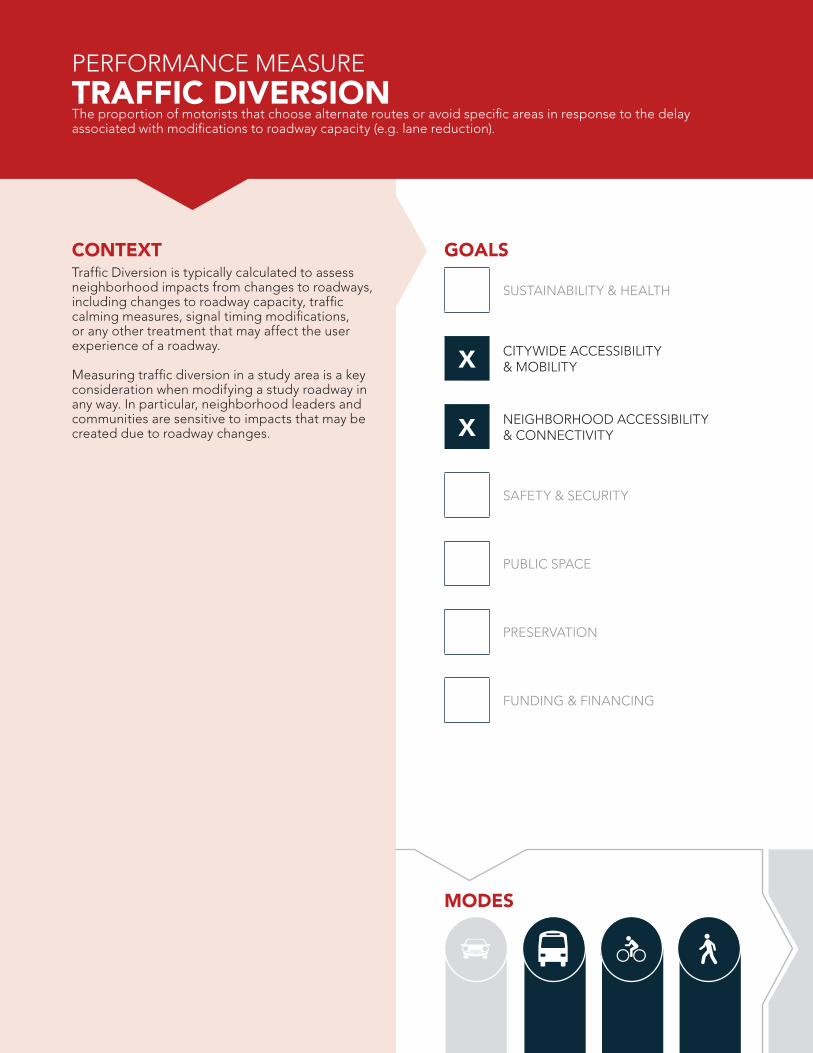
PE
RFO
RM
AN
CE
ME
ASU
RE
S TO
OLB
OX
54
CONTEXTTraffic Diversion is typically calculated to assess neighborhood impacts from changes to roadways, including changes to roadway capacity, traffic calming measures, signal timing modifications, or any other treatment that may affect the user experience of a roadway.
Measuring traffic diversion in a study area is a key consideration when modifying a study roadway in any way. In particular, neighborhood leaders and communities are sensitive to impacts that may be created due to roadway changes.
TRAFFIC DIVERSIONThe proportion of motorists that choose alternate routes or avoid specific areas in response to the delay associated with modifications to roadway capacity (e.g. lane reduction).
MODES
PERFORMANCE MEASURE
GOALS
SUSTAINABILITY & HEALTH
X CITYWIDE ACCESSIBILITY & MOBILITY
X NEIGHBORHOOD ACCESSIBILITY & CONNECTIVITY
SAFETY & SECURITY
PUBLIC SPACE
PRESERVATION
FUNDING & FINANCING

PE
RFO
RM
AN
CE
ME
ASU
RE
S TO
OLB
OX
55
DATA NEEDS AND SOURCES• Automobile volumes
• Time-of-day travel lanes
• Speed limits
EVALUATION METHODS• Travel demand model
• Automobile volumes
• Synchro operations analysis
NOTES/BEST PRACTICES• Local streets may not be reflected in the travel demand model, and as such, diversion impacts
may not be assessed on those streets.
• Engineering judgment will be required to assess traffic diversion, particularly because existing travel demand model volumes may not exactly reflect field collected traffic volumes or roadway network connections.
LOCAL EXAMPLE STUDIES• Florida Avenue Multimodal Study – traffic diversion was anticipated after the elimination of some
travel lanes within the Florida Avenue NE corridor in NoMa. A travel demand model was used to quantify potential traffic diversion to other parallel corridors. Additionally, turning movement counts were conducted at multiple intersections outside the corridor study area in order to compare traffic operations at these intersections before and after lanes are eliminated on Florida Avenue.
• C Street Multimodal Corridor Study – this project also contained alternatives which would eliminate one or more lanes along the C Street corridor near RFK Stadium. Turning movement counts were conducted at multiple intersections on parallel corridors in order to compare traffic operations at these intersections before and after lanes are eliminated on C Street.
• North-South Corridor Planning Study – this transit planning project analyzed multiple north-south corridors to gauge the impact of dedicating one or more lanes along one major north-south corridor (such as Georgia Avenue NW) to exclusive transit use. Travel demand model volumes at multiple alternative north-south corridors were used to predict traffic diversion to these corridors.
RELATED MEASURESAUTOMOBILE DELAYTRAVEL TIME
TRAVEL TIME INDEXPERSON THROUGHPUT

PE
RFO
RM
AN
CE
ME
ASU
RE
S TO
OLB
OX
56
CONTEXTStreet trees have numerous environmental benefits, including retaining stormwater, reducing emissions, improving air quality, and habitat for wildlife. The presence of street trees creates a buffering element and provides a comfortable walking space. They also visually narrow the roadway, which has a traffic calming effect that improves livability and safety outcomes for all roadway users.
Tree Coverage can be used as an evaluation measure to compare alternatives that include trees and/or streetscaping as part of the project.
TREE COVERAGEThe number of trees on a street or other area. Typically measured as number of trees, percent of street tree canopy coverage, number of trees per mile, and tree spacing.
MODES
PERFORMANCE MEASURE
GOALS
SUSTAINABILITY & HEALTH
CITYWIDE ACCESSIBILITY & MOBILITY
NEIGHBORHOOD ACCESSIBILITY & CONNECTIVITY
SAFETY & SECURITY
X PUBLIC SPACE
PRESERVATION
FUNDING & FINANCING
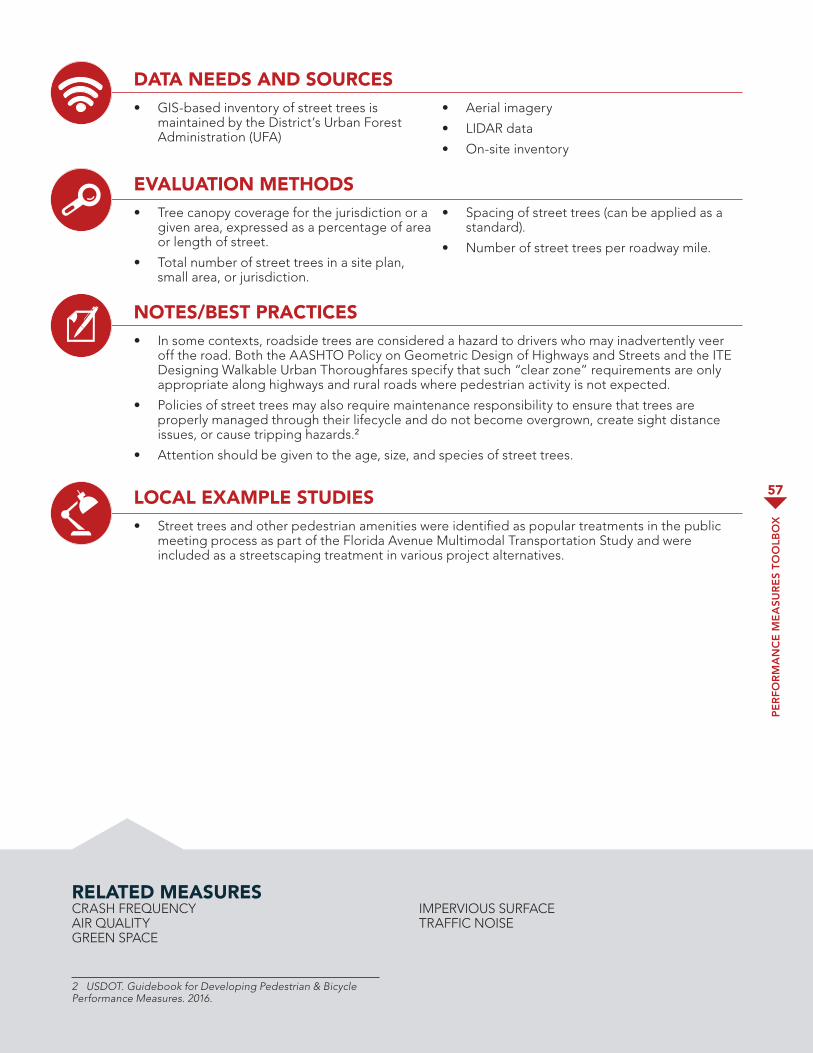
PE
RFO
RM
AN
CE
ME
ASU
RE
S TO
OLB
OX
57
DATA NEEDS AND SOURCES• GIS-based inventory of street trees is
maintained by the District’s Urban Forest Administration (UFA)
• Aerial imagery
• LIDAR data
• On-site inventory
EVALUATION METHODS• Tree canopy coverage for the jurisdiction or a
given area, expressed as a percentage of area or length of street.
• Total number of street trees in a site plan, small area, or jurisdiction.
• Spacing of street trees (can be applied as a standard).
• Number of street trees per roadway mile.
NOTES/BEST PRACTICES• In some contexts, roadside trees are considered a hazard to drivers who may inadvertently veer
off the road. Both the AASHTO Policy on Geometric Design of Highways and Streets and the ITE Designing Walkable Urban Thoroughfares specify that such “clear zone” requirements are only appropriate along highways and rural roads where pedestrian activity is not expected.
• Policies of street trees may also require maintenance responsibility to ensure that trees are properly managed through their lifecycle and do not become overgrown, create sight distance issues, or cause tripping hazards.2
• Attention should be given to the age, size, and species of street trees.
LOCAL EXAMPLE STUDIES• Street trees and other pedestrian amenities were identified as popular treatments in the public
meeting process as part of the Florida Avenue Multimodal Transportation Study and were included as a streetscaping treatment in various project alternatives.
RELATED MEASURESCRASH FREQUENCYAIR QUALITYGREEN SPACE
IMPERVIOUS SURFACETRAFFIC NOISE
2 USDOT. Guidebook for Developing Pedestrian & Bicycle Performance Measures. 2016.

PE
RFO
RM
AN
CE
ME
ASU
RE
S TO
OLB
OX
58
CONTEXTTransit on-time performance is often a standard established by transit agencies to assess service reliability and reflects the importance of providing reliable and predictable service. Poor levels of on-time performance are indicative of a lower level of service reliability.
On-time performance is often measured in before-and-after studies to determine the impact of a project on travel time reliability.
On-time performance should be a goal of any project that seeks to increase transit ridership, meanwhile decreasing the mode share of single occupancy vehicles.
On-time performance is often used with other transit reliability measures, including headway adherence, excess wait time, missed trips, percent of scheduled time in operation, and distance traveled between mechanical breakdowns.
ON-TIME PERFORMANCEThe percentage of transit vehicles departing or arriving at a location on time. The industry standard for "on time" is generally considered to be 1 minute early to 5 minutes late4, although WMATA currently uses 2 minutes early and 7 minutes late.
MODES
PERFORMANCE MEASURE
GOALS
SUSTAINABILITY & HEALTH
X CITYWIDE ACCESSIBILITY & MOBILITY
NEIGHBORHOOD ACCESSIBILITY & CONNECTIVITY
SAFETY & SECURITY
PUBLIC SPACE
PRESERVATION
FUNDING & FINANCING
4 TCRP Report 100: Transit Capacity and Quality of Service Manual, 3rd Edition.

PE
RFO
RM
AN
CE
ME
ASU
RE
S TO
OLB
OX
59
DATA NEEDS AND SOURCES• Transit Schedule
• Data on actual arrivals
• Existing Services Routes and Stops
• Mobile Data Terminals (MDT)
• Automated Vehicle Location (AVL)
EVALUATION METHODS• The reliability of transit service is most often measured by on-time performance, which reflects
how closely the delivery of transit service matches the published schedule. Evaluation methods include the following:
– percent of transit that reaches pre-specified points on time in different time periods, where on time is defined as arriving in a pre-specified time window;
– variance in travel times between two points
– average minutes transit delay measured at specific locations; and
– regularity of service (schedule adherence) at specific locations.5
• In cases where transit is frequent (e.g., less than 10 minutes) or where a transit agency is maintaining specific headways instead of scheduled stops, on-time performance may not be the best measure. In these cases, measures for headway adherence, such as the coefficient of variation of headways, is a more appropriate measure. More information on calculating headway adherence is found in the Transit Capacity and Quality of Service Manual, 3rd Edition.
NOTES/BEST PRACTICES• Transit on-time performance is most valuable as a measure of customer experience for bus routes
with less frequent service (i.e., routes that run less frequently than every 10 minutes). For less frequent routes, customers are more likely to check a printed schedule before heading to a bus or rail stop.
• On-time performance is highly dependent on how “on time” is defined, particularly how early departures are treated.
LOCAL EXAMPLE STUDIES• The 16th Street NW Transit Priority Planning Study set out to improve transit service reliability and
travel times by identifying and addressing sources of potential issues. One of the proposed transit service improvements common to all three alternatives focused on adding running and recovery to the schedule to improve on-time performance and subsequently the reliability of the service.
• The North-South Corridor Planning Study set out to evaluate transit service along the North-South Corridor to enhance current transit service and support existing and future growth. The Project focused on improving transit reliability and decreasing transit travel times.
RELATED MEASURESTRAVEL TIMETRAVEL TIME INDEXBUS RIDERSHIP
PLANNING TIME INDEXBUS OVERCROWDINGTRANSIT FREQUENCY
5 TCRP Report 47: A Handbook for Measuring Customer Satisfaction and Service Quality.
PE
RFO
RM
AN
CE
ME
ASU
RE
S TO
OLB
OX
60
CONTEXTTypically, the planning time index is computed at the 95th-percentile confidence level. For example, someone who uses the planning time index to determine when to begin their trip will arrive by the desired time for approximately 95 percent of trips.
Congested roadways and intersections are associated with an increase in planning time index, and some routes in the District may experience a peak hour travel time that is two to three times higher than the free-flow travel time.
Using planning time index as a performance measure allows for congested areas to be identified on a network-level without the detailed inputs required for a level of service / delay analysis.
PLANNING TIME INDEXThe total travel time necessary to ensure on-time arrival during a particular time divided by the free-flow travel time (i.e. the travel time during unimpeded conditions such as overnight).1
MODES
PERFORMANCE MEASURE
GOALS
SUSTAINABILITY & HEALTH
X CITYWIDE ACCESSIBILITY & MOBILITY
NEIGHBORHOOD ACCESSIBILITY & CONNECTIVITY
SAFETY & SECURITY
PUBLIC SPACE
PRESERVATION
FUNDING & FINANCING
1 USDOT. Travel Time Reliability: Making it There On Time, All the Time. 2015.

PE
RFO
RM
AN
CE
ME
ASU
RE
S TO
OLB
OX
61
DATA NEEDS AND SOURCES• Vehicle Probe Data (INRIX / Google maps/ Waze)
EVALUATION METHODS• 90th, 95th or 99th Percentile Travel Times
• Collect New Data (e.g., Probe Data, Test Vehicle, License Plate Matching, Bluetooth/GPS)
• Estimates via macroscopic or microsimulation software
• Utilize Existing Data
NOTES/BEST PRACTICES• Planning time index is used to determine trip reliability, which can be for both auto and transit.
This includes buffer time accounting for expected and unexpected delay.
LOCAL EXAMPLE STUDIES• Planning time index was calculated for major arterials in the District as part of the District Mobility
project. This measure will be routinely measured District-wide.
• Planning time index is routinely calculated District-wide and is detailed in District Mobility, the District of Columbia's multimodal congestion web-based dashboard.
RELATED MEASURESAUTOMOBILE DELAYPROGRESSION SPEED TRAVEL TIME
TRAVEL TIME INDEXTRANSIT FREQUENCY

PE
RFO
RM
AN
CE
ME
ASU
RE
S TO
OLB
OX
62
CONTEXTProjects in the District should strive to achieve improved bicycle network connectivity in order to provide safer conditions and improved connectivity between neighborhoods.
Opportunities to increase network connectivity through development, one-way conversions (or contraflow lanes), and connecting dead-ends can improve conditions for bicycling in the District.
Transportation investments that enable people to access a greater number and variety of employment opportunities, destinations, and services, can have significant impact on communities.
Bicycle network connectivity may be useful in comparing alternatives to maximize investment potential.
BICYCLE NETWORK CONNECTIVITYThe ability of bicyclists to reach various origins and destinations comfortably, safely, directly, and reliably on District streets. Higher levels of network connectivity provide bicyclists with more options and diminish the need for out-of-direction travel which can increase the time and distance of a given trip.
MODES
PERFORMANCE MEASURE
GOALS
SUSTAINABILITY & HEALTH
CITYWIDE ACCESSIBILITY & MOBILITY
X NEIGHBORHOOD ACCESSIBILITY & CONNECTIVITY
SAFETY & SECURITY
PUBLIC SPACE
PRESERVATION
FUNDING & FINANCING
PE
RFO
RM
AN
CE
ME
ASU
RE
S TO
OLB
OX
63
DATA NEEDS AND SOURCES• GIS transportation network
• Aerial imagery
• Results from level of traffic stress analysis
EVALUATION METHODS• Percent of streets that include parallel bicycle
facilities
• Number of bicycle network gaps in the study area
• Intersection density
• Intersections per linear mile
• Network density of streets suitable for bicycling
• Connected node ratio
NOTES/BEST PRACTICES• Consider bicycle movements at intersections and whether certain geometry may create a barrier
for some cyclists.
LOCAL EXAMPLE STUDIES• The Crosstown Multimodal Transportation Study identified areas that act as barriers to bicycle
connectivity, such as streets with high automobile speeds, long crossings with multiple travel lanes, high speeds, and lack of intersection control.
RELATED MEASURES85TH PERCENTILE SPEEDBICYCLE AND PEDESTRIAN CRASHESLEVEL OF TRAFFIC STRESS
JOBS AND DESTINATIONS SERVEDPEDESTRIAN NETWORK CONNECTIVITY

PE
RFO
RM
AN
CE
ME
ASU
RE
S TO
OLB
OX
64
CONTEXTBus overcrowding is often a standard established by transit agencies to assess ridership demand and service reliability. These reflect the importance of providing adequate transit capacity, as well as reliable and predictable service.
Bus overcrowding may impact bus travel times and on-time performance due to delays at bus stops related to boarding and alighting.
Bus overcrowding may be measured in comparison studies to determine the impact of a project on travel time reliability.
Any project that seeks to increase transit ridership and on-time performance should set a goal of reducing or eliminating overcrowded buses.
Bus overcrowding ultimately has a system-wide effect where increased boarding and alighting times affect overall reliability, resulting in poor on-time performance, bus bunching, and/or buses that do not stop to pick up passengers due to limited space on board.
BUS OVERCROWDINGA situation under which the number of people on a bus exceeds the available capacity. In most instances, policies determine a peak load factor that represent a level of crowding that passengers are normally willing to tolerate.
MODES
PERFORMANCE MEASURE
GOALS
SUSTAINABILITY & HEALTH
CITYWIDE ACCESSIBILITY & MOBILITY
X NEIGHBORHOOD ACCESSIBILITY & CONNECTIVITY
SAFETY & SECURITY
PUBLIC SPACE
PRESERVATION
FUNDING & FINANCING
PE
RFO
RM
AN
CE
ME
ASU
RE
S TO
OLB
OX
65
DATA NEEDS AND SOURCES• Transit Schedule
• Data on actual arrivals
• Existing Services Routes and Stops
• Bus ridership and demand through Automatic Passenger Counter (APC) data.
• Bus speed and tracking data through Automatic Vehicle Location (AVL) data.
EVALUATION METHODS• Evaluation Methods:
• Bus overcrowding is typically reported as the percentage of load (capacity) on a bus. This is often reported as the maximum load for a bus route during a time period.
NOTES/BEST PRACTICES• Bus overcrowding can be a complicated measure if taken at face value, particularly on high
frequency routes. As a standalone measure it may be most useful for assessing conditions on bus routes with less frequent service (i.e., routes that run less frequently than every 10-15 minutes) where there is limited chance that buses may have overlapping service.
• More frequent routes have a greater tendency for bus bunching during busier times of the day, and as a result bus overcrowding could be a likely result on lead buses while buses that are following the lead bus may have very few passengers, resulting in skewed system results of bus overcrowding. In cases with more frequent headways, measures for headway adherence, such as the coefficient of variation of headways, should also be considered as a supplemental measure. More information on calculating headway adherence is found in the Transit Capacity and Quality of Service Manual, 3rd Edition.
LOCAL EXAMPLE STUDIES• The 16th Street NW Transit Priority Planning Study and the North-South Corridor Planning Study
both assessed overcrowding conditions along two of the busiest bus corridors in the City, 16th Street NW and Georgia Avenue NW.
RELATED MEASURESTRAVEL TIMETRAVEL TIME INDEXBUS RIDERSHIP
ON-TIME PERFORMANCEPLANNING TIME INDEXTRANSIT FREQUENCY

PE
RFO
RM
AN
CE
ME
ASU
RE
S TO
OLB
OX
66
CONTEXTTransit frequency can be expressed during peak hours or as an hourly profile over the entire day.
Improving transit frequency should be a goal of any project that seeks to improve mode split, increase person throughput, and reduce vehicle emissions, particularly in areas with fewer transportation options.
TRANSIT FREQUENCYThe number of transit vehicles serving a particular route over a specific period of time.
MODES
PERFORMANCE MEASURE
GOALS
SUSTAINABILITY & HEALTH
CITYWIDE ACCESSIBILITY & MOBILITY
X NEIGHBORHOOD ACCESSIBILITY & CONNECTIVITY
SAFETY & SECURITY
PUBLIC SPACE
PRESERVATION
FUNDING & FINANCING
PE
RFO
RM
AN
CE
ME
ASU
RE
S TO
OLB
OX
67
DATA NEEDS AND SOURCES• Transit schedules, available from transit agencies such as WMATA.
EVALUATION METHODS• Project-specific transit frequency data collected along a route or corridor can be used to estimate
transit demand or identify network deficiencies.
• Transit frequency is often a valuable communication tool with agencies, stakeholder, and the community, particularly because streets with higher bus frequencies or specific routes that have higher bus frequencies implies greater transit demand, a higher likelihood that the area is walkable, and also that land uses and densities support a high number of buses.
NOTES/BEST PRACTICES• Generally, bus routes with frequencies above 5 vehicles per hour are considered high-frequency
routes.
LOCAL EXAMPLE STUDIES• The North-South Corridor Planning Study utilized transit frequency data along prominent north-
south corridors such as Georgia Avenue NW to identify potential transit alignments.
RELATED MEASURESAUTOMOBILE DELAYTRAVEL TIMEJOBS AND DESTINATIONS SERVEDRESIDENTS SERVEDAIR QUALITY
ON-TIME PERFORMANCEBUS OVERCROWDINGTRANSIT FREQUENCYPERSON THROUGHPUT

PE
RFO
RM
AN
CE
ME
ASU
RE
S TO
OLB
OX
68
CONTEXTProjects in the District should strive to achieve improved pedestrian network accessibility in order to provide safer conditions and improved connectivity between neighborhoods.
Opportunities to increase network connectivity through development, off-street connections, and connections through dead-ends can improve conditions for walking in the District.
Transportation investments that enable people to access a greater number and variety of employment opportunities, destinations, and services, can have significant impact on communities.
Pedestrian network connectivity may be useful in comparing alternatives to maximize investment potential. For example, future transit stop locations may be evaluated based on the connectivity of the surrounding network. An alternative with high connectivity would help to maximize the catchment area
PEDESTRIAN NETWORK CONNECTIVITYThe ability of pedestrians to reach various origins and destinations comfortably, safely, and reliably on District streets. Higher levels of network connectivity provide pedestrians with more options and diminish the need for out-of-direction travel which can increase the time and distance of a given trip.
MODES
PERFORMANCE MEASURE
GOALS
SUSTAINABILITY & HEALTH
CITYWIDE ACCESSIBILITY & MOBILITY
X NEIGHBORHOOD ACCESSIBILITY & CONNECTIVITY
SAFETY & SECURITY
PUBLIC SPACE
PRESERVATION
FUNDING & FINANCING

PE
RFO
RM
AN
CE
ME
ASU
RE
S TO
OLB
OX
69
DATA NEEDS AND SOURCES• GIS transportation network • Aerial imagery
EVALUATION METHODS• Percent of streets with sidewalks on both
sides
• Intersection density
• Intersections per linear mile
• Network density
• Connected node ratio
NOTES/BEST PRACTICES• Consider the pedestrian network that is accessible to pedestrians of all abilities.
LOCAL EXAMPLE STUDIES• The C Street Multimodal Corridor Study identified areas that acted as a barrier to pedestrian
accessibility, such as wide crossings with high automobile speeds.
RELATED MEASURES85TH PERCENTILE SPEEDBICYCLE AND PEDESTRIAN CRASHESLEVEL OF TRAFFIC STRESS
PEDESTRIAN CROSSING TIMEJOBS AND DESTINATIONS SERVEDBICYCLE NETWORK CONNECTIVITY

PE
RFO
RM
AN
CE
ME
ASU
RE
S TO
OLB
OX
70
CONTEXTComparing person throughput across alternatives helps illustrate how well various alternatives move people through an intersection, corridor, or the network. Assessing future conditions can be challenging however, because there are limited reliable tools for estimating future non-auto person trips.
Increasing person throughput should be a goal of any project that seeks to improve mobility, efficiently utilize capacity, and reduce congestion.
PERSON THROUGHPUTThe number of people that move through a given intersection or corridor during a specific period. The fundamental unit of measure is a person and it includes motor and transit vehicles, pedestrians, and bicyclists.
MODES
PERFORMANCE MEASURE
GOALS
X SUSTAINABILITY & HEALTH
CITYWIDE ACCESSIBILITY & MOBILITY
NEIGHBORHOOD ACCESSIBILITY & CONNECTIVITY
SAFETY & SECURITY
PUBLIC SPACE
PRESERVATION
FUNDING & FINANCING

PE
RFO
RM
AN
CE
ME
ASU
RE
S TO
OLB
OX
71
DATA NEEDS AND SOURCES• Traffic volume data, including automobiles, buses, trucks, pedestrians, cyclists. Turning movement
volumes that include this information can often be obtained from previous studies but may need to be re-counted to match the desired time period / conditions.
• Transit ridership, if available. Transit ridership can generally be obtained by local transit agencies such as WMATA.
• Transit schedules from local transit agencies such as WMATA.
• Regional commuter data from the FHWA’s National Household Travel Survey can be used to estimate the average number of passengers in private automobiles and buses. Similar data is often available through regional planning agencies for use in travel demand modeling.
EVALUATION METHODS• Person Throughput can be measured or estimated in a number of ways depending on the
availability of data and the complexity of a corridor, but ultimately includes the combination of the following modal elements:
– Persons in private vehicles: A common method is to estimate average vehicle occupancy and then apply that to the number of counted vehicles over a period of time.
– Persons in transit vehicles: if transit ridership data is not available, then estimate transit vehicle capacity based on time of day and apply to the frequency of transit vehicles over a period of time.
– Pedestrians: pedestrians are typically counted at intersection crosswalks, but can also be counted midblock.
– Cyclists: cyclists are typically counted at intersections, similar to motor vehicles but can also be counted midblock or on trails.
• The aforementioned approach to measuring person throughput is demand based (i.e., used to measure existing conditions), but with enough detail it can potentially be used to determine projected person throughput tied to population growth, increase in density, and modifications to existing infrastructure.
NOTES/BEST PRACTICES• Person throughput is calculated for the AM and PM peak hours in each direction.
• Utilize the maximum vehicular throughput capacity from peak-hour counts.
• In many instances, shuttle services complement existing local bus routes. Shuttle transit frequency should be factored into the transit throughput calculation.
• Estimates for average vehicle occupancy for private automobiles and local bus service should be determined through consultation of a number of sources, including WMATA data, the National Household Travel Survey, and data from moveDC.
LOCAL EXAMPLE STUDIES• To better assess the current person carrying capacity of 16th Street NW, a busy north-south
commuter route, the person throughput assessment revealed nearly 50% of morning commuters were actually in buses.
RELATED MEASURESAUTOMOBILE VOLUMEBICYCLE VOLUME
PEDESTRIAN VOLUMEBUS RIDERSHIP