performance measurement for non-profit organizations
TRANSCRIPT

Performance Measurement for Non-Profit Organizations UNIVERSITY CANADA Cam Scholey • Kurt Schobel
MANAGEMENT ACCOUNTING GUIDELINE CASE STUDY
CONTENTS
Background 1
Vision 1
Mission 2
Stage 1: Plan 2
Stage 2: Strategy Map 3
Stage 3: Balanced Scorecard 6
Stage 4: Review and Assess 9
Strategic Review 15
The Way Ahead 16
Background University Canada (UC) is a Canadian online university offering undergraduate and graduate education to public service employees. UC is a new business unit at an established Ontario university and it relies on the university’s online library and back-office support. Its instructors are new and existing faculty from the established university. Integration of these resources will be a key issue for UC.
When the university decided to enter the online educational arena, the dean and principal held a strategic planning session and agreed on the following vision and mission for UC.
Vision An educational environment that is flexible, affordable, and accessible.

2
Management Accounting Guideline Case Study
-
Mission To be the educator of choice for members of the public service, in both official languages.
With a clear vision and mission, UC’s dean met with his management team to identify a strategic framework for the future. The team identified four keys success factors (KSF): • KSF1 – Staff and faculty committed to online learning • KSF2 – The right technology • KSF3 – A high level of accountability • KSF4 – Self-sustaining operations
UC needed to be self-sustaining and not draw resources away from other university programs, however, the university agreed to a baseline level of funding to get UC started. The dean and his man-agement team developed a performance measurement and management system using the four-stage process found in the Performance Measurement for Non-Profits Organizations (PM4NPO) Manage-ment Accounting Guideline (MAG)®.
Stage 1: Plan
Step 1: Review mission, vision, and strategy Having already defined a new mission and vision, no further action was necessary.
Step 2: Identify value proposition Using the university’s market research, UC determined that the most important factor for a member of the public service pursuing higher education was cost. Members of the public service receive reim-bursement for online courses, but their employers’ budgets are limited and thus course cost is often the determining factor when reimbursement requests are submitted. In addition, the management team recognized that with online education, interaction between students and faculty must be easy, accessible and high-quality because most students are not located in the same geographic location as UC. With this in mind, UC identified its primary and secondary value propositions: • Primary: Operational excellence • Secondary: Customer intimacy
Given the requirement for self-sufficiency, UC deemed operational excellence to be the primary value discipline. UC would approach all activities from a customer perspective but when conflicts arose, operational excellence would prevail as the primary value proposition.
Step 3: Balance efficiency versus effectiveness At the onset of planning, it became clear that efficiency measures would be relatively easy to identify while effectiveness measures would be more difficult. Efficiency measures would tend to be lag mea-sures that focus on cost per student. Effectiveness measures, meanwhile, would be a combination of lag and lead measures looking at throughput and employer satisfaction.
Performance Measurement for Non Profit Organizations

3
Management Accounting Guideline Case Study
-
Stage 2: Strategy Map
Step 1: Start with the organization’s mission UC’s overriding objective is to be the educator of choice for members of the public service, in both official languages.
Step 2: Choose (or confirm) the value proposition • Primary: Operational excellence • Secondary: Customer intimacy
Step 3: Choose the look for the map The management team struggled with where to place the financial perspective. With the desire for self-sufficiency it seemed appropriate to position the financial perspective at the top of the strategy map. However, since UC operated within a government financial framework, the team debated placing finance at the bottom. In the end, the team agreed the stakeholders were the highest priority in edu-cation. They also agreed that, ultimately, finance was more of an input than an output and they placed finance at the bottom of the map. As a result, the team reordered Steps 4-7 of the strategy map stage to reflect a top-to-bottom map progression.
To ensure that everyone was speaking the same language, the team created a lexicon to explain each of the strategic objectives in the strategy map. They coded each perspective as follows: • Stakeholder: S1, S2, S3, S4 • Business process: P1, P2, P3, P4, P5, P6 • Learning and growth: L1, L2, L3, L4 • Financial: F1, F2
Step 4: Choose the key stakeholder strategies UC recognized three types of stakeholders: students, employers, and government agencies. Each stakeholder group had different expectations, which made balancing their needs a challenge. The team identified the following strategic objectives:
TABLE 1: STAKEHOLDER STRATEGIES
STAKEHOLDER STRATEGIC OBJECTIVE
Students s1 – Attract students
s2 – Meet student service expectations
Public service employers s3 – Graduate critical thinkers
Government agencies s4 – Foster support for UC programs
Performance Measurement for Non Profit Organizations

4
Management Accounting Guideline Case Study
-
Step 5: Choose the key internal process strategies Sound business processes are a key success factor for UC. The only interaction students have with UC is through its electronic systems. For these systems to work effectively, UC required well-defined business processes. Using this logic, the team identified the cause-and-effect relationships between the stakeholder and process perspectives as linkages.
TABLE 2: INTERNAL PROCESS STRATEGIES
STRATEGIC OBJECTIVE LINKAGE
P1 – Promote UC offerings s1, s4
P2 – Maintain quality s1, s2, s3, s4
P3 – Engage public service organizations s4
P4 – Administer students s2
P5 – Develop programs strategically s1, s3
P6 – Manage university dependencies s3
Step 6: Choose the key learning and growth strategies The management team referred to learning and growth strategies as renewal objectives. For UC to achieve its strategic objectives, having the right people and the right technology was paramount. Fac-ulty turnover in an online environment is quite high. Similarly, technological changes occur on a regular basis and the management team wanted to ensure UC wasn’t chasing technology, but rather was using the best technology to support learning objectives. With this as the basis for strategic objective development, the team created the following learning and growth objectives:
TABLE 3: LEARNING AND GROWTH STRATEGIES
STRATEGIC OBJECTIVE LINKAGE
L1 – Improve IM/ITcapability P4
L2 – Prioritize innovations P4, P5
L3 – Attract, develop, retain quality staff P2
L4 – Attract, develop, retain quality faculty P2
L5 – Improve knowledge management P6
Performance Measurement for Non Profit Organizations

5
Management Accounting Guideline Case Study
VISION: an educational environment that is flexible, affordable, and accessible.
MISSION: to be the educator of choice for members of the public service, in both official languages.
S1
Attract Students
S2
Meet student service expectations
S3
Graduate critical thinkers
S4
Foster support for online UC programs
P1
Promote online UC offerings
P2
Maintain quality
P3
Engage public service organizations
L1
Improve IM/IT capability
L3
Attract, develop, retain
quality staff
L2
Prioritize innovations
L5
Improve knowledge
management
L4
Attract, develop, retain quality faculty
P4
Administrer students
P5
Develop programs strategically
F1
Ensure fiscal responsibility
F2
Enable program financial self suffi ciency
P6
Manage university dependencies
Adapted from Schobel and Scholey, (2012)
-
Step 7: Choose the key financial strategies Determining the location of the financial strategic objectives had proved very challenging. The team placed it at the bottom of the map with only general upward linkages because financial resources are an input that drive all of the other perspectives. The two financial objectives reflect both efficiency and effectiveness.
TABLE 4: FINANCIAL STRATEGIES
STRATEGIC OBJECTIVE
F1 – Ensure fiscal responsibility
F2 – Enable program financial self-sufficiency
Because UC operates within a government context, KSF 3 drove the strategic objective “ensure fiscal responsibility.” Figure 1 illustrates UC’s completed strategy map.
FIGURE 1: UC STRATEGY MAP
Performance Measurement for Non Profit Organizations

6
Management Accounting Guideline Case Study
-
Stage 3: Balanced Scorecard
Step 1: Identify measures With a strategy map completed, the management team held several performance measurement sessions with staff, faculty, and stakeholders to identify the most appropriate measures. Working groups were asked to brainstorm two to three potential performance indicators for each strategy map objective. The idea was to come up with a broad range of ideas and to fully involve employees in the process to ensure they recognized the need for balancing efficiency and effectiveness as well as lead measures and lag measures.
At this early stage, UC felt it could develop the Balanced Scorecard (BSC) using Microsoft Excel, given the business development manager’s experience with the program and his understanding of the PM4NFP process.
Step 2: Assign weights With measures identified, management set weights to demonstrate the importance of each perspec-tive. Management worked with the relevant UC departments to develop the appropriate weighting for each perspective.
Step 3: Balance the measures The business development manager of UC had an understanding of the PM4NFP process and stressed to the dean the importance of maintaining a balance between efficient and effective measures as well as lead and lag measures.
Step 4: Set specific targets Staff developed targets, which supervisors and managers reviewed to ensure they were reasonable. UC decided to use target and stretch goals with the target representing expected results and stretch targets representing the best possible outcome.
The management team tried to limit each strategic objective to a single measure, but occasionally had to settle for having two to fully capture what was occurring.
Table 5 shows UC’s final measures.
Performance Measurement for Non Profit Organizations

7
Management Accounting Guideline Case Study
-
TABLE 5: FINAL UC MEASURES
Objective/ Goal Code Weight Measure
Efficiency/ Effectiveness
Lead/ Lag Target
Stretch Target
Attract new students
s1
30%
% increase in num-ber of students by program
effectiveness Lead 10% 15%
Meet stu-dent service expectations
s2
Percentage of satisfied students
effectiveness Lag 75% 90%
Number of stu-dent’s complaints
efficiency Lag 100 75
Graduate crit-ical thinkers
s3 Graduation rate effectiveness Lag 90% 95%
Foster support for online UC programs s4
Number of new contacts
effectiveness Lead 75
100
Number of con-tacts per existing supporter
effectiveness Lag 1 2
Performance Measurement for Non Profit Organizations

8
Management Accounting Guideline Case Study
-
Objective/ Goal Code Weight Measure
Efficiency/ Effectiveness
Lead/ Lag Target
Stretch Target
Promote online UC offerings
P1
25%
Attendance at promotional activities
efficiency Lead 25 50
Maintain quality
P2
Percentage of internal reviews completed
effectiveness Lag 20% 25%
Percentage of external pro-gram reviews completed
effectiveness Lag 20% 25%
Engage public service organizations
P3 Number of committees/ working groups with public service organization
effectiveness Lag 10 20
Effectively administer students
P4 Percentage of services standards that are met
effectiveness Lag 85% 95%
Develop programs strategically
P5 Probability of delivering pro-grams without use of internal faculty
effectiveness Lead 75% 100%
Manage university dependencies
P6
Number of planning meetings with university staff and faculty
efficiency Lead 10 15
Number of critical errors in program delivery
efficiency Lag 5 2
Performance Measurement for Non Profit Organizations

9
Management Accounting Guideline Case Study
-
Objective/ Goal Code Weight Measure
Efficiency/ Effectiveness
Lead/ Lag Target
Stretch Target
Improve IM/IT capability
L1
20%
Percentage of completed programming requirements
efficiency Lag 75% 80%
Prioritize innovations
L2 Percentage of initiatives mapped to strategy map
effectiveness Lag 90% 100%
Attract, develop, retain quality staff
L3 Staff turnover efficiency Lag 15% 10%
Attract, develop, retain quality faculty L4
Faculty retention rate
efficiency Lag 60% 75%
Number of new hires
efficiency Lead 10 20
Improve knowledge management
L5 Percentage of business pro-cesses formalized as operating policies
efficiency Lead 50% 75%
Ensure fiscal responsibility
F1
25%
Percentage variance from business plan
efficiency Lag 5% 2%
Enable program self-suffi-ciency
F2 Per course revenue less incre-mental costs
efficiency Lead $100K $250K
Stage 4: Review and Assess
Step 1: Manage with the BSC After completing the BSC, staff began collecting data on all the different measures. Simultaneously, management mapped UC’s many initiatives to the strategy map. Table 6 summarized the results. Examination of the results yielded several observations and questions, including:
1. Looking at the stakeholder strategic objectives (S1-S4), the large number of initiatives supporting students and other stakeholders demonstrates UC’s stakeholder focus. There are more Xs support-ing stakeholder objectives than any other perspective.
2. Within the internal process perspective (P1-P6), only one initiative addressed managing orga-nizational dependencies. At the beginning of the performance management process, UC saw
Performance Measurement for Non Profit Organizations

10
Management Accounting Guideline Case Study
-
organizational dependencies as critical to success. Management immediately deemed it necessary to determine whether this sole initiative was sufficient to address organizational dependencies or whether additional initiatives were necessary.
3. Attracting and developing quality staff (L3) is a strategic objective within the learning and growth perspective. For the past few years, staff turnover on campus had been quite high and UC felt that having staff appreciation activities would help build camaraderie and increase the likelihood of retaining staff. Management noted that the phrase “maintain quality” appeared in the strategic objective, which required greater attention to training. The only initiative currently in place for attracting and retaining quality staff focused on staff appreciation. Recognizing the lack of initia-tives in support of L4, management decided that additional training activities were necessary.
4. Regarding the strategic objective “attract and retain quality faculty,” the dean felt that joining the Canadian Virtual University (CVU) association would increase UC’s presence and attract faculty.
TABLE 6: BSC WITH INITIATIVES
Objective/ Goal Code Weight Measure
Efficiency/ Effectiveness
Lead/ Lag Target
Stretch Target
Attract new students
s1
30%
% increase in num-ber of students by program
effectiveness Lead 10% 15%
Meet stu-dent service expectations
s2
Percentage of satisfied students
effectiveness Lag 75% 90%
Number of stu-dent’s complaints
efficiency Lag 100 75
Graduate critical thinkers
- s3 Graduation rate effectiveness Lag 90% 95%
Foster support for online UC programs s4
Number of new contacts
effectiveness Lead 75 100
Number of contacts per existing supporter
- effectiveness Lag 1 2
Performance Measurement for Non Profit Organizations

11
Management Accounting Guideline Case Study
-
Objective/ Goal Code Weight Measure
Efficiency/ Effectiveness
Lead/ Lag Target
Stretch Target
Promote online UC offerings
P1
25%
Attendance at promotional activities
efficiency Lead 25 50
Maintain quality
P2
Percentage of internal reviews completed
effectiveness Lag 20% 25%
Percentage of external pro-gram reviews completed
effectiveness Lag 20% 25%
Engage public service organizations
P3 Number of committees/ working groups with public service organization
effectiveness Lag 10 20
Effectively administer students
P4 Percentage of services standards that are met
effectiveness Lag 85% 95%
Develop programsstrategically
P5 Probability of delivering pro-grams without use of internal faculty
effectiveness Lead 75% 100%
Manage university dependencies
P6
Number of planning meetings with university staff and faculty
efficiency Lead 10 15
Number of critical errors in program delivery
efficiency Lag 5 2
Performance Measurement for Non Profit Organizations

12
Management Accounting Guideline Case Study
-
Objective/ Goal Code Weight Measure
Efficiency/ Effectiveness
Lead/ Lag Target
Stretch Target
Improve IM/ ITcapability
L1
20%
Percentage of completed programming requirements
efficiency Lag 75% 80%
Prioritize innovations
L2 Percentage of initiatives mapped to strategy map
effectiveness Lag 90% 100%
Attract, develop, retain quality staff
L3 Staff turnover efficiency Lag 15% 10%
Attract, develop, retain quality faculty L4
Faculty retention rate
efficiency Lag 60% 75%
Number of new hires
efficiency Lead 10 20
Improve knowledge management
L5 Percentage of business pro-cesses formalized as operating policies
efficiency Lead 50% 75%
Ensure fiscal responsibility
F1
25%
Percentage variance from business plan
efficiency Lag 5% 2%
Enable program self-suffi-ciency
F2 Per course revenue less incre-mental costs
efficiency Lead $100K $250K
Performance Measurement for Non Profit Organizations

13
Management Accounting Guideline Case Study -
TABLE 6: BSC WITH INITIATIVES CONT. N
ew m
arke
ting
ca
mp
aig
n
Att
end
ance
at
educ
a -ti
on
fair
s
Bec
om
e m
emb
ers
of
Can
adia
n vi
rtua
l un
iver
sity
Spo
nso
r an
nua
l se
min
ar o
n C
anad
ia n
Pub
lic A
dm
inis
trat
ion
Stud
ent
Sup
po
rt—
Wri
ting
Hel
p C
ente
r an
d T
uto
ring
Elim
inat
e re
d t
ape
Staff
Ap
pre
ciat
ion
Act
ivit
ies
Cre
ate
qua
lity
wo
rk-
ing
gro
up
Op
erat
ions
wo
rkin
g
gro
up
Co
mp
arat
ive
fee
s st
udy
Performance Measurement for Non Profit Organizations
x x x x
x
x
x
x
x
x
x
x
x
x
x
x
x
x
x
x
x
x
x x
x
14
Management Accounting Guideline Case Study
-
Step 2: Evaluate results versus targets The management team decided to report results on a quarterly basis. Many indicators were not avail-able during the first quarter, but by the end of the fiscal year all indicators had results. The fiscal year for UC coincided with the end of the spring semester (April 30).
UC decided to measure goal attainment using green, yellow, and red indicators (where green denoted an achieved target, red denoted unacceptable rd performance, and yellow denoted performance between unacceptable and target). UC employed targets and stretch targets such that the stretch tar-get was the goal. Therefore, while achieving the target was good, it wasn’t ultimately what UC wanted. Ratings were defined as follows: • Green – 15 percent above the target or better • Yellow – 80 percent of the target, but less than the score of the green level • Red – less than 80 percent of the target
Thus, it was possible for UC to hit its target and receive a yellow indicator. The entire team was focused on continuous improvement and wanted to reflect that desire in their BSC.
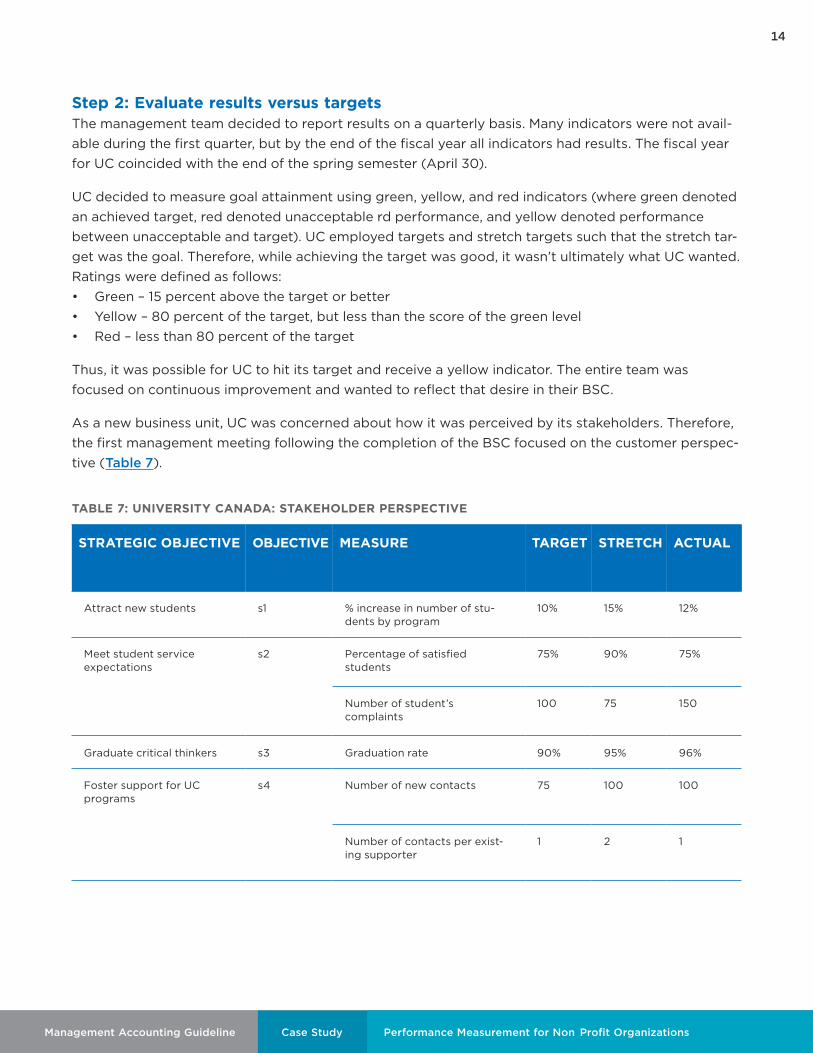
As a new business unit, UC was concerned about how it was perceived by its stakeholders. Therefore, the first management meeting following the completion of the BSC focused on the customer perspec-tive (Table 7).
TABLE 7: UNIVERSITY CANADA: STAKEHOLDER PERSPECTIVE
STRATEGIC OBJECTIVE OBJECTIVE MEASURE TARGET STRETCH ACTUAL
Attract new students s1 % increase in number of stu-dents by program
10% 15% 12%
Meet student service expectations
s2 Percentage of satisfied students
75% 90% 75%
Number of student’s complaints
100 75 150
Graduate critical thinkers s3 Graduation rate 90% 95% 96%
Foster support for UC programs
s4 Number of new contacts 75 100 100
Number of contacts per exist-ing supporter
1 2 1
Performance Measurement for Non Profit Organizations

15
Management Accounting Guideline Case Study
-
Steps 3 and 4: Examine results and outcomes and adjust as necessary With the BSC on the table, the dean opened the discussion. Overall, he was happy with the results because they indicated that, in general, UC was achieving its objectives. At the onset of the perfor-mance management exercise, the management team agreed to discuss all yellow and red indicators along with any green indicators that were trending downward.
Student attraction and graduation rates were exceeding the target. The dean congratulated every-one on their efforts in support of these objectives, but also cautioned that they should be careful when interpreting the results because this was UC’s first BSC. While UC achieved a high level of success in S3, the question was: can we do even better? The dean asked the management team to review targets and stretch targets to see if UC should expect a higher level of performance. He noted that over the course of the following year, UC would evaluate all of the indicators against the expected outcomes to test the relevance of the target and stretch targets.
The next point of discussion involved student service expectations. Even though UC achieved its target for percentage of satisfied students, the score received a yellow indicator because it was less than 85 percent and declining. The manager in charge of this objective noted that there had been a spike in complaints when the learning management software (LMS) crashed for two days near the end of the term. The dean asked the operations manager to set up a meeting with the universi-ty’s chief information officer to determine the root cause and to prevent recurrence.
The conversation then turned to student complaints. With an indicator of red, it was clear UC received significantly more complaints than expected. Many of the complaints had to do with the LMS crash, but the student education counsellors also noted many student complaints had to do with the lack of a reading week during the winter term. The Deans’ Council had decided to forego a reading week because the cost of keeping part-time professors on the payroll for an extra week seemed unnecessary. The dean stated that while there would be no change to the policy, UC should better communicate the rationale behind it to students.
Finally, contacts with existing supporters were on target but declining. The chief of operations noted that in the prior period they had made the requisite two contacts with UC supporters and found that, for the most part, two contacts was unnecessary and specifically planned to reduce the number to one because they did not want to become a nuisance to supporters.
Strategic Review With year one completed, UC’s dean deemed it appropriate to review the strategy map and BSC to ensure the cause-and-effect relationships remained relevant and provided meaningful feedback. Accordingly, the Dean called a strategic planning meeting with the management team. The dean reminded the management team that they would be reviewing all indicators, including those where the results surpassed expectations. Given how competitive the online education sector is, the dean emphasized that UC had to continually improve to remain self-sustaining (KSF 4).
The chief of operations began the discussion and noted that graduation rates (S3) remained con-sistent over the past 10 years and that changing the stretch target was not necessary. He further noted that increasing the expected graduation rate beyond traditional norms might simply result in
Performance Measurement for Non Profit Organizations

16
Management Accounting Guideline Case Study Performance Measurement for Non Profit Organizations
-
marking scheme changes to reflect the new target. The management team agreed that the current target was acceptable, and no change was necessary.
The manager of the education delivery cell noted a discrepancy with P1. His counsellors had only attended half the number of expected promotional events due to budgetary constraints, yet student attraction was up. Attendance at promotional events was used as a leading indicator of student interest and, with attendance down, there had to be another driver of student interest. After much discussion and investigation, the team discovered that UC’s special interest article in Maclean’s mag-azine’s annual university rankings issue caused the welcome but unexpected outcome of spiking enrolment applications. To ensure this type of outcome was accounted for in the future, UC decided to include special interest stories and advertisements under the BSC definition of promotional activi-ties and include specific admission codes to identify the success level of each activity.
UC’s IT specialist noted an issue with L1 (Improve IM/IT capability). UC had surpassed the expected number of outstanding programming issues yet P4 (Effectively administer students) was in decline. The operations manager noted that both L1 and L2 (Prioritize Innovations) affected P4 and that the newly-implemented online marking module negatively impacted P4 so much that it overrode the benefits from L1. After discussion, the management team agreed that it was necessary to monitor L1 and L2 closely, but no action would be required at this time.
The Way Ahead The dean printed revised versions of the strategy map as posters and had them displayed throughout UC. He made a copy of the map available on UC’s website and he carries around a smaller version to demonstrate to university administrators and stakeholders how UC is putting their valuable resources to use. The BSC is now the basis for discussion at UC’s monthly operational meetings.
This publication is one in a series on Performance Measurement for Non -Profit Organizations. The entire series of overview, guideline and case study are available on our website. For additional information or for general inquiries, please contact us at [email protected].
© 2019 Chartered Professional Accountants of Canada
All rights reserved. This publication is protected by copyright and written permission is required to reproduce, store in a retrieval system or transmit in any form or by any means (electronic, mechanical, photocopying, recording, or otherwise).
For information regarding permission, please contact [email protected]
DISCLAIMERThe material contained in this management accounting guideline series is designed to provide illustrative information of the subject matter covered. It does not establish standards or preferred practices. This material has not been considered or acted upon by any senior or technical committees or the board of directors of CPA Canada and does not represent an official opinion or position of CPA Canada.
.