performance measurement and incentive compensation… · performance measurement and incentive...
TRANSCRIPT
Performance Measurement andIncentive Compensation: AnEmpirical Analysis and Comparisonof Chinese and Western Firms’Practices
KENNETH A. MERCHANT∗, WIM A. VAN DER STEDE∗∗,THOMAS W. LIN∗ and ZENGBIAO YU†
∗University of Southern California, USA ∗ ∗London School of Economics, UK and†Tsinghua University China
(Received: November 2009; accepted May 2011)
ABSTRACT This paper describes the findings of a study aimed at providing a replicationand extension in China of studies focused on incentive compensation practices ofautomobile retailers in the USA and the Netherlands. Rich, detailed data-sets from allthree countries are analysed together and in comparison. As theory is not welldeveloped at the level of detail of the data collected, the purpose of this study wasprimarily exploratory, to provide empirics that can lead to the development of theory.The findings show that Chinese firms are much more likely to provide incentivecompensation than are Dutch firms, and they are even somewhat more likely to providethem than are US firms. But Chinese bonus plans are more likely to be subjective,rather than formula-based. In the situations where incentive payments are based on pre-set formulas, the Chinese firms’ systems are more like those used in the Netherlandsthan in the USA, with bonuses based on non-financial performance measures and withmore complex performance–reward functions. Like managers in the US firms, butunlike managers in the Dutch firms, Chinese managers who receive some form ofincentive compensation are more satisfied with their pay. The paper concludes withtentative explanations of the findings and suggestions for future research.
European Accounting Review
Vol. 20, No. 4, 639–667, 2011
Correspondence Address: Wim A. Van der Stede, Department of Accounting, London School of
Economics, Houghton Street, London WC2A 2AE, UK. Tel.: +44 020 7955 6695. Email: w.van
European Accounting Review
Vol. 20, No. 4, 639–667, 2011
0963-8180 Print/1468-4497 Online/11/040639–29 # 2011 European Accounting Associationhttp://dx.doi.org/10.1080/09638180.2011.593293Published by Routledge Journals, Taylor & Francis Ltd on behalf of the EAA.
Dow
nloa
ded
by [
LSE
Lib
rary
] at
07:
26 2
8 N
ovem
ber
2011
1. Introduction
Globalisation of business has created a greater need to understand how, or
whether, to adapt management practices to fit salient aspects of the local situ-
ation. Some ‘best practices’ seem universal, and managers in all countries are
well advised both to learn about them and to consider them. Other practices
have to be adapted to the local national culture or situation (e.g. Shen, 2004;
Bhimani, 1999; Harrison and McKinnon, 1999; Schuler and Rogovsky, 1998).
But we are only in the early stages of understanding which adaptations should
be made when they are needed (Hexter and Woetzel, 2007; Allen et al., 2004;
Bjorkman and Lu, 1999; Milkovich and Bloom, 1998). Better knowledge as to
whether to adopt global ‘best’ practices, or to adapt certain practices to local con-
ditions, should be useful both to local managers and to managers of multinational
organisations.
Some amount of logical, armchair theorising is possible, but issues regarding
what specific management practices should be used in any particular setting are
to a large extent empirical questions. Empirical evidence, which in the early
stages of research can be called ‘stubborn facts’ (Lindsay, 2007), can provide foun-
dations on which theoretical contributions can be made. But because of the inherent
difficulty in conducting cross-national studies, research progress in this area has
been slow (Budhwar and Sparrow, 2002). This study was designed, first and fore-
most, to provide a base of empirics that can lead to the development of theory.
We focused our cross-national comparison study on one important, related set
of management practices – those relating to the design and implementation of
performance measurement and incentive systems. These practices are a key
factor in determining the success of firms because they form a critical part of
the relationship between employers and employees. Theory and research in
this area is dominated by assumptions and values prevalent in the USA, where
most of this research is done (Tsui, 2009; Barney and Zhang, 2009; Tosi and
Greckhamer, 2004; Awasthi et al., 2001). But quite possibly any of a number
of social, political and economic factors that vary across countries shape
measurement and incentive practices and their effects. For example, Zhang
et al. (2006) argue that many of the assumptions underlying expectancy
theory-based prescriptions of performance management practices may not hold
in the Chinese context. Many factors descriptive of national settings will even-
tually have to be considered in the development of theory in this area.
We conducted a replication in China of two studies – Gibbs et al. (2004, 2009)
and Jansen et al. (2009) – that collected comparable sets of data from US and
Dutch firms, respectively, in the automobile retail sector. These studies were
chosen for replication because they provide rich descriptive detail about the
complex systems of incentives used at management levels in these firms. The
measured variables included the mix between salary (fixed) and incentive (vari-
able) compensation; the balance between formula-based and subjectively
assigned bonuses; the measures used to assign formula bonuses; and the shape
640 K.A. Merchant et al.
Dow
nloa
ded
by [
LSE
Lib
rary
] at
07:
26 2
8 N
ovem
ber
2011
of the performance–reward function. No prior study conducted in China has
reported data descriptive of firms’ measurement and incentive practices at man-
agement levels as detailed and inclusive as those reported here. Combining the
data collected in China with the data from the Gibbs et al. (2004, 2009) and
Jansen et al. (2009) studies allowed all of the data from the three countries to
be analysed together.
Gibbs et al. (2004, 2009), conducted in US firms, found that the vast majority
of general and department managers (in excess of 70%) in these firms were eli-
gible to earn incentive compensation. The incentive packages offered to many of
these managers were complex systems of interrelated rewards. Most of the firms
seemed to base their largest incentives on a performance measure deemed to be
‘best’ (in terms of risk, distortion and lack of potential for manipulation). Some of
the firms also used smaller second, and sometimes third, formula bonuses to reba-
lance multitask incentives when the ‘best’ available measure, often net or gross
profit, was deemed to distort the managers’ incentives. As compared to the largest
(first) contract, the supplemental (second and third) contracts were more likely to
be defined with performance thresholds (floors) and caps. And some managers
were also given implicit promises of rewards in the form of potentials for discre-
tionary bonuses, promotions, salary increases and ‘spiffs’ (e.g. short-term sales
contests providing special awards, such as vacation trips). The incentives paid
to these managers were quite lucrative, often totalling over 100% of salary.
In contrast, and as documented in the Jansen et al. (2009) study, only a small
number of the Dutch managers were provided with incentive compensation in
any form. Even where incentives were given in the Dutch firms, the magnitude
of the rewards was significantly lower than those in the US firms. In the Dutch
firms that offered incentives, the bonus awards were significantly more likely
to be based on non-financial performance measures such as, most commonly,
sales measured in units. But when the Dutch firms used incentives, their perform-
ance–reward functions were more complex, often defining both performance
thresholds and caps, rather than just being unbounded, linear functions.1
China was chosen for the additional empirical investigation because it is an
unquestionably important Asian-based, developing economy. The Chinese
setting also promised the potential for providing some interesting contrasts
with the Westernised American and Dutch settings. China’s political ideology,
institutions, economic history and culture are, in many ways, quite different
from those prevalent in the USA and the Netherlands, and evidence exists to
show that Western models of behaviour do not reflect accurately Chinese
employees’ desires and behaviours (Bailey et al., 1997; Schneider, 1988). For
example, Shenkar and Ronen (1987) found that Chinese employees have work
goals that are significantly different from employees in other countries. Chen
(1995) found significant differences between Chinese and US employees’ prefer-
ences for allocating rewards. Bailey et al. (1997) found that Chinese employees
differed significantly from both US and Japanese employees in their preferences
for performance-related feedback. O’Connor et al. (2004) found that employees
Performance Measurement and Incentive Compensation 641
Dow
nloa
ded
by [
LSE
Lib
rary
] at
07:
26 2
8 N
ovem
ber
2011
in Chinese state-owned enterprises (SOEs) tended to resist management practices
that threaten the ‘Chinese way of doing things’. And Bjorkman and Lu (1999)
found that multinational corporations’ policies governing the compensation of
local employees operating in China diverged the most from the multinationals’
global policies.
Our research sample and method provide for relatively pure tests of the effects
of the national settings. The one-industry setting allows us to control for many
potentially relevant factors that vary across industries to facilitate the focus on
the cross-national differences in practices. Virtually all of the firms in the auto-
mobile retailing industry have local owners, so we are less likely to be studying
practices that are possibly shaped by the homogenising effects of foreign owner-
ship (Dong and Glaister, 2007; Van der Stede, 2003; Chow et al., 1999). Finally,
firms in the automobile retailing industry are primarily privately owned. This is a
particularly important characteristic in China because it has been shown that
Chinese SOEs tend to make significantly less use of incentive pay (Tsui et al.,
2007; Firth et al., 2006; Bodmer, 2003; Cauley et al., 1999).
So, then, how do Chinese firms’ incentive compensation practices compare
with those of US and Dutch firms? Are they similar or different in whole or in
part to the practices used in any or both of the other two countries? Are their
effects similar or different?
Our findings show that the Chinese automobile retailers are much more likely
to provide incentive compensation than are the Dutch firms and even somewhat
more likely to provide it than are the US firms. But Chinese bonuses are signifi-
cantly more likely to be assigned subjectively rather than formulaically. Where
incentive payments are based on pre-set formulas, the Chinese firms’ systems
are more like those used in the Netherlands than in the USA, with bonuses
based more heavily on non-financial performance measures and with more
complex performance–reward functions. Incentive systems appear to be well
received in China. Managers in Chinese firms, like those in US firms but
unlike those in Dutch firms, are more satisfied with their pay when they
receive some form of incentive compensation.
Section 2 sets up the framing of the analyses and discussions following.
Section 3 details the empirical design, sample characteristics and measures.
Section 4 presents the univariate, descriptive results of the key differences
between the incentive compensation packages in the three countries. Section 5
presents the findings of the multivariate analyses of the data. Section 6 offers ten-
tative explanations of the findings, discusses limitations and offers directions for
future research.
2. Framing
Prior to conducting our empirical study in China, we did not have strong expec-
tations as to what measurement and incentive system practices we would find in
use in the Chinese automobile retailing firms. We did expect to find some use of
642 K.A. Merchant et al.
Dow
nloa
ded
by [
LSE
Lib
rary
] at
07:
26 2
8 N
ovem
ber
2011
performance-dependent incentives, as a number of prior studies in China had
found evidence of their use (e.g. Chen, 2004; Mengistae and Xu, 2004; Li and
Zhou, 2005; O’Connor et al., 2006; Firth et al., 2006; Zheng and Morrison,
2006).
We also expected the incentive systems in China to be less sophisticated in
design because Chinese managers have less experience with incentive systems,
which has been argued to depend on the stage of economic development
(Bhimani, 1999). China’s political and economic transformation is relatively
recent. Before the Chinese economic reforms began in 1978, near equality of
pay among Chinese managers and workers was enforced, and Chinese managers
were not allowed to share in the wealth or profits generated by their enterprises.
Incentive schemes began to appear in China in the 1980s with the rise of foreign
joint ventures and as the profit objective took hold in Chinese SOEs (Groves
et al., 1994, 1995). A large-scale study of executive compensation practices in
Chinese SOEs in the 1980s found that pay–performance sensitivities were of a
similar order of magnitude to those found in regulated industries in the USA,
which is lower than those in unregulated US firms (Mengistae and Xu, 2004).
Hence, we also expected incentives in China to be less lucrative.
However, some Chinese firms have attempted to adopt ‘market’ approaches to
compensation practices since at least the late 1990s (Firth et al., 2006; Chen,
2004). One study found statistically significant pay–performance sensitivities
in some ownership conditions (Firth et al., 2006). Chinese firms that had a
state bureaucratic agency as the major shareholder did not appear to use incentive
compensation, but firms that were either predominantly owned by private block-
holders or SOEs owned by a Chinese central government agency (not a local gov-
ernment) did relate their CEO’s pay to performance (either increases in
shareholder wealth or increases in profitability). Companies incorporated in
mainland China that trade on the Hong Kong Stock Exchange (H-shares) were
shown to have average bonuses for top executives that exceed fixed pay levels.
This led one Towers Perrin consultant to conclude that ‘overseas-listed
Chinese enterprises are more similar to U.S. companies than they are to listed
companies in Japan and Hong Kong’ (Chen, 2004, p. 8). Moreover, the use of
incentives in larger Chinese firms may accelerate and broaden because in
January 2006 the China Security Regulatory Commission passed new regulations
allowing stock option grants to directors, managers, core technicians and other
key employees.
But has the spread of incentive compensation practices reached the smaller, pri-
vately held, domestic firms in the automobile retailing industry studied here? Many
observers have noted that China has a significant shortage of well-qualified and
experienced managers (e.g. Firth et al., 2006). This is likely to affect firms’ offer-
ings of competitive compensation packages, which the literature commonly propa-
gates to include incentive pay. However, the relatively few managers who would
be aware of global incentives-related best practices are more likely to be working at
large firms than the ones we studied. Even if the smaller firms have implemented
Performance Measurement and Incentive Compensation 643
Dow
nloa
ded
by [
LSE
Lib
rary
] at
07:
26 2
8 N
ovem
ber
2011
incentive compensation systems, it is a reasonable prediction that they will be rela-
tively simple. Research in organisational evolution has suggested that manage-
ment systems of all types tend to become more complex and sophisticated over
time (e.g. Sandino, 2007; Greiner, 1998).
Based on this limited evidence, we began our empirical study with just three
general expectations. As compared to the US firms particularly, we expected
that (1) fewer Chinese firms in the automobile retailing industry are using perform-
ance-dependent incentives, and where they are used, the incentive schemes used in
Chinese firms are, on average, (2) less lucrative and (3) less sophisticated.
Beyond that we considered our empirical study in China to be exploratory. No
Chinese performance measurement and incentives study has measured the
characteristics of incentive compensation systems at the level of detail considered
by the Gibbs et al. (2004, 2009) and Jansen et al. (2009) studies. Thus, we found
it impossible to make highly specific predictions regarding the findings we might
expect in the Chinese firms. Predictions even at a general level were difficult
because theories based on subsets of the many cross-national differences, includ-
ing culture, history, regulations, tax structures and market conditions, can lead to
conflicting predictions.
Therefore, we used the following research questions to guide our explorations:
(1) How does the use (incidence, magnitude) of incentive compensation in
Chinese firms compare with that in US and Dutch firms?
(2) Where incentives are used, how does their design in Chinese firms compare
with those in US and Dutch firms in terms of:
(a) the magnitude of the rewards;
(b) the bases on which the rewards are given (e.g. the use of profit vs.
revenue measures, financial vs. non-financial measures, individual vs.
group measures);
(c) the styles used to allocate the rewards (i.e. relative importance of objec-
tive vs. subjective reward allocations); and
(d) the shape of the performance–reward function used for assigning
formula bonuses (e.g. linear vs. curved (convex or concave); use of
thresholds and/or caps)?
(3) Are Chinese firms’ practices more or less effective than those used in US and
Dutch firms?
3. Method
3.1. Data Collection
We began our study with field visits to four automobile retailers in the greater
Beijing area. At these sites we conducted interviews with the general manager
and department managers and toured the facilities. We used these visits to
develop an understanding of these companies as well as the automobile retailing
644 K.A. Merchant et al.
Dow
nloa
ded
by [
LSE
Lib
rary
] at
07:
26 2
8 N
ovem
ber
2011
industry in China and the specialised terminology in use. Later we used our field
sites also for pilot testing of the questionnaires.
During these site visits we found that the Chinese dealerships are involved pri-
marily with vehicle sales. The service and parts functions, which are integral
parts of almost all US dealerships and also contained in some Dutch dealerships,
are run by other organisations in China. But the Chinese dealerships sell most of
the same types of vehicles as are sold in the other countries, and their organis-
ations are comprised of multiple departments. Like the US and Dutch firms,
the Chinese firms are almost exclusively privately owned.
We collected data from Chinese automobile dealerships that could be com-
pared directly with those in Gibbs et al. (2004, 2009) and Jansen et al. (2009).
We employed the survey research method because the data sought are not avail-
able from public sources. We developed two different questionnaires in English
(one for dealership general managers and one for sales department managers) and
submitted them to three management accounting faculty colleagues for pre-
testing. We asked a Chinese accounting professor and his graduate student to
translate both questionnaires into Chinese. After a back translation step and a
pilot test, we made a few revisions of the translated Chinese instruments.
Then we approached the China Automobile Dealership Association (CADA)
for support. With CADA’s cooperation, we mailed sets of survey questionnaires,
one for the general managers and one for the sales department managers, to 300
firms. We received usable samples of 127 (42%) from the general managers and
132 (44%) from the sales department managers. The sample firms are located in
13 of the 30 Chinese provinces, mostly in the relatively highly economically
developed coastal areas.
In each firm, we administered one survey to the general manager and one to the
sales department manager. Both surveys asked about the elements of the man-
agers’ compensation package, management practices and manager demographics.
The general manager survey also included questions about the dealership’s econ-
omic and competitive environment, dealership strategy and management prac-
tices, general manager delegation of decision rights, and various dealership and
general manager demographics.
3.2. Primary Measures
As in Gibbs et al. (2004, 2009) and Jansen et al. (2009), we captured measures
describing the following four compensation elements where those elements
were used:
(1) BASE SALARY, which typically increases each year for most employees;
(2) FORMULA BONUSES, which are based on quantitative performance measures
(e.g. department profit);
(3) DISCRETIONARY BONUSES, which are based on an evaluator’s subjective
judgment of the manager’s performance; and
Performance Measurement and Incentive Compensation 645
Dow
nloa
ded
by [
LSE
Lib
rary
] at
07:
26 2
8 N
ovem
ber
2011
(4) SPIFFS, which are miscellaneous rewards, such as the use of promotional
vehicles and certain incentives typically provided by the car manufacturers
but often allocated to employees by the dealerships (e.g. vacation trips).
For each of these potential elements of compensation, we assessed the INCI-
DENCE of the use of the element plus, where a compensation element is used,
the MAGNITUDE of the rewards and, for the formula bonuses only, the BASES
ON WHICH THE REWARDS ARE GIVEN (i.e. measures) and the SHAPE OF THE PER-
FORMANCE – REWARD FUNCTION (e.g. thresholds, caps). To facilitate comparisons,
we annualised all monetary awards.
Our primary independent variables were categorical variables indicating the
home country of each of the automobile dealerships. As in Jansen et al.
(2009), we were unable to measure variables that might explain more specific rel-
evant differences between the countries.
4. Univariate Analyses
4.1. Incidence and Magnitude of Incentives
Table 1 provides descriptive statistics regarding the key elements of the incentive
compensation practices used in the Chinese, US and Dutch automobile retailers.
These data show many significant differences between the Chinese practices and
both the US and Dutch practices at the general manager and department manager
levels of analysis. In the Chinese firms, both the incidence of use of formula
bonuses and the magnitude of the bonuses are significantly greater than in the
Dutch firms, but they tend to be significantly less than in the US firms.
However, the Chinese firms make significantly greater use of discretionary
bonuses than do either the US or Dutch firms.
4.2. Shape of the Performance–Reward Function
Table 2 provides statistics regarding two key elements of the formula bonus plans
used: the performance measures used for assigning formula bonuses and the
shape of the performance–reward function. These data also show many signifi-
cant contrasts between Chinese practices and both US and Dutch practices. At
the dealership level (i.e. for general managers), the Chinese firms are less
likely to base the bonuses on profits, choosing instead to allocate them based
on performance measured in terms of revenue or one or more non-financial
measures. They are also much more likely to pay a fixed (lump sum) amount
rather than providing bonuses that vary continuously with performance over at
least some relevant range. At the department level, most of the Chinese firms’
practices are between those of the US and Dutch firms in terms of the measures
used, but they are again more likely to provide lump sum bonuses rather than
those that are more continuously variable with performance.
646 K.A. Merchant et al.
Dow
nloa
ded
by [
LSE
Lib
rary
] at
07:
26 2
8 N
ovem
ber
2011
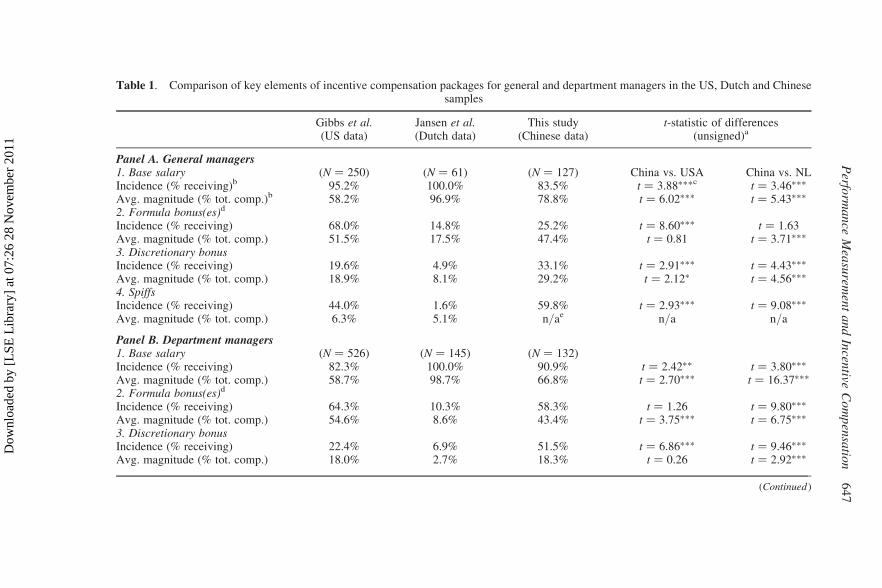
Table 1. Comparison of key elements of incentive compensation packages for general and department managers in the US, Dutch and Chinesesamples
Gibbs et al.(US data)
Jansen et al.(Dutch data)
This study(Chinese data)
t-statistic of differences(unsigned)a
Panel A. General managers1. Base salary (N ¼ 250) (N ¼ 61) (N ¼ 127) China vs. USA China vs. NLIncidence (% receiving)b 95.2% 100.0% 83.5% t ¼ 3.88∗∗∗c t ¼ 3.46∗∗∗
Avg. magnitude (% tot. comp.)b 58.2% 96.9% 78.8% t ¼ 6.02∗∗∗ t ¼ 5.43∗∗∗
2. Formula bonus(es)d
Incidence (% receiving) 68.0% 14.8% 25.2% t ¼ 8.60∗∗∗ t ¼ 1.63Avg. magnitude (% tot. comp.) 51.5% 17.5% 47.4% t ¼ 0.81 t ¼ 3.71∗∗∗
3. Discretionary bonusIncidence (% receiving) 19.6% 4.9% 33.1% t ¼ 2.91∗∗∗ t ¼ 4.43∗∗∗
Avg. magnitude (% tot. comp.) 18.9% 8.1% 29.2% t ¼ 2.12∗ t ¼ 4.56∗∗∗
4. SpiffsIncidence (% receiving) 44.0% 1.6% 59.8% t ¼ 2.93∗∗∗ t ¼ 9.08∗∗∗
Avg. magnitude (% tot. comp.) 6.3% 5.1% n/ae n/a n/a
Panel B. Department managers1. Base salary (N ¼ 526) (N ¼ 145) (N ¼ 132)Incidence (% receiving) 82.3% 100.0% 90.9% t ¼ 2.42∗∗ t ¼ 3.80∗∗∗
Avg. magnitude (% tot. comp.) 58.7% 98.7% 66.8% t ¼ 2.70∗∗∗ t ¼ 16.37∗∗∗
2. Formula bonus(es)d
Incidence (% receiving) 64.3% 10.3% 58.3% t ¼ 1.26 t ¼ 9.80∗∗∗
Avg. magnitude (% tot. comp.) 54.6% 8.6% 43.4% t ¼ 3.75∗∗∗ t ¼ 6.75∗∗∗
3. Discretionary bonusIncidence (% receiving) 22.4% 6.9% 51.5% t ¼ 6.86∗∗∗ t ¼ 9.46∗∗∗
Avg. magnitude (% tot. comp.) 18.0% 2.7% 18.3% t ¼ 0.26 t ¼ 2.92∗∗∗
(Continued)
Perfo
rma
nce
Mea
surem
ent
an
dIn
centive
Co
mp
ensa
tion
64
7
Dow
nloa
ded
by [
LSE
Lib
rary
] at
07:
26 2
8 N
ovem
ber
2011
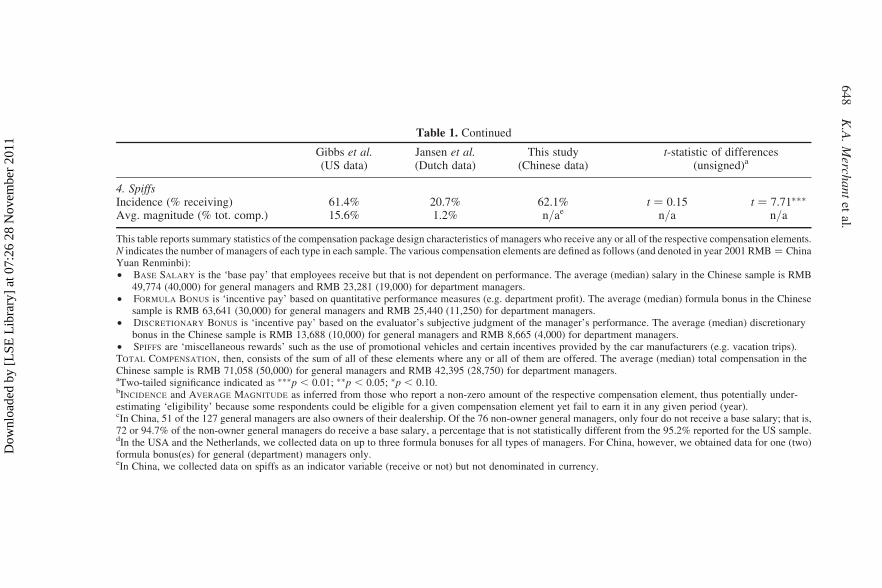
Table 1. Continued
Gibbs et al.(US data)
Jansen et al.(Dutch data)
This study(Chinese data)
t-statistic of differences(unsigned)a
4. SpiffsIncidence (% receiving) 61.4% 20.7% 62.1% t ¼ 0.15 t ¼ 7.71∗∗∗
Avg. magnitude (% tot. comp.) 15.6% 1.2% n/ae n/a n/a
This table reports summary statistics of the compensation package design characteristics of managers who receive any or all of the respective compensation elements.N indicates the number of managers of each type in each sample. The various compensation elements are defined as follows (and denoted in year 2001 RMB ¼ ChinaYuan Renminbi):† BASE SALARY is the ‘base pay’ that employees receive but that is not dependent on performance. The average (median) salary in the Chinese sample is RMB
49,774 (40,000) for general managers and RMB 23,281 (19,000) for department managers.† FORMULA BONUS is ‘incentive pay’ based on quantitative performance measures (e.g. department profit). The average (median) formula bonus in the Chinese
sample is RMB 63,641 (30,000) for general managers and RMB 25,440 (11,250) for department managers.† DISCRETIONARY BONUS is ‘incentive pay’ based on the evaluator’s subjective judgment of the manager’s performance. The average (median) discretionary
bonus in the Chinese sample is RMB 13,688 (10,000) for general managers and RMB 8,665 (4,000) for department managers.† SPIFFS are ‘miscellaneous rewards’ such as the use of promotional vehicles and certain incentives provided by the car manufacturers (e.g. vacation trips).TOTAL COMPENSATION, then, consists of the sum of all of these elements where any or all of them are offered. The average (median) total compensation in theChinese sample is RMB 71,058 (50,000) for general managers and RMB 42,395 (28,750) for department managers.aTwo-tailed significance indicated as ∗∗∗p , 0.01; ∗∗p , 0.05; ∗p , 0.10.bINCIDENCE and AVERAGE MAGNITUDE as inferred from those who report a non-zero amount of the respective compensation element, thus potentially under-estimating ‘eligibility’ because some respondents could be eligible for a given compensation element yet fail to earn it in any given period (year).cIn China, 51 of the 127 general managers are also owners of their dealership. Of the 76 non-owner general managers, only four do not receive a base salary; that is,72 or 94.7% of the non-owner general managers do receive a base salary, a percentage that is not statistically different from the 95.2% reported for the US sample.dIn the USA and the Netherlands, we collected data on up to three formula bonuses for all types of managers. For China, however, we obtained data for one (two)formula bonus(es) for general (department) managers only.eIn China, we collected data on spiffs as an indicator variable (receive or not) but not denominated in currency.
64
8K
.A.
Merch
an
tet
al.
Dow
nloa
ded
by [
LSE
Lib
rary
] at
07:
26 2
8 N
ovem
ber
2011
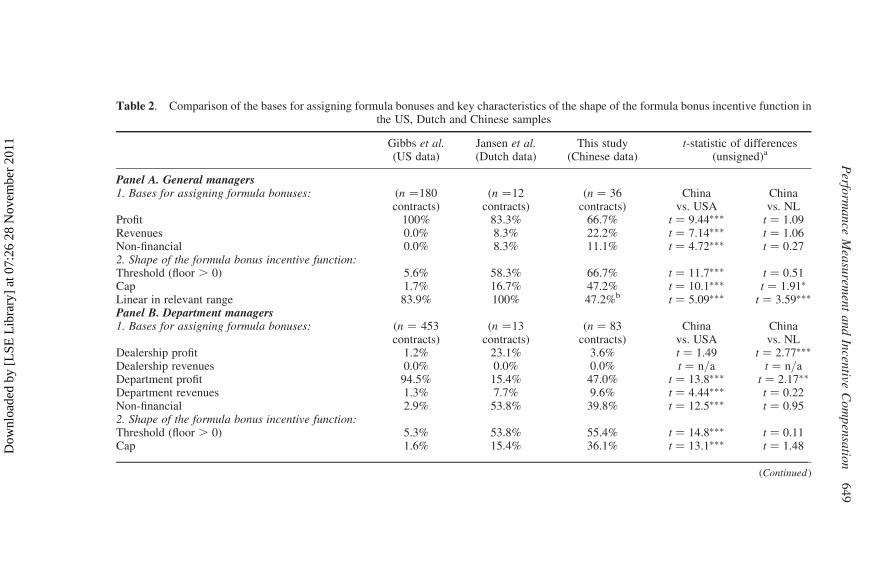
Table 2. Comparison of the bases for assigning formula bonuses and key characteristics of the shape of the formula bonus incentive function inthe US, Dutch and Chinese samples
Gibbs et al.(US data)
Jansen et al.(Dutch data)
This study(Chinese data)
t-statistic of differences(unsigned)a
Panel A. General managers1. Bases for assigning formula bonuses: (n ¼180
contracts)(n ¼12
contracts)(n ¼ 36
contracts)China
vs. USAChinavs. NL
Profit 100% 83.3% 66.7% t ¼ 9.44∗∗∗ t ¼ 1.09Revenues 0.0% 8.3% 22.2% t ¼ 7.14∗∗∗ t ¼ 1.06Non-financial 0.0% 8.3% 11.1% t ¼ 4.72∗∗∗ t ¼ 0.272. Shape of the formula bonus incentive function:Threshold (floor . 0) 5.6% 58.3% 66.7% t ¼ 11.7∗∗∗ t ¼ 0.51Cap 1.7% 16.7% 47.2% t ¼ 10.1∗∗∗ t ¼ 1.91∗
Linear in relevant range 83.9% 100% 47.2%b t ¼ 5.09∗∗∗ t ¼ 3.59∗∗∗
Panel B. Department managers1. Bases for assigning formula bonuses: (n ¼ 453
contracts)(n ¼13
contracts)(n ¼ 83
contracts)China
vs. USAChinavs. NL
Dealership profit 1.2% 23.1% 3.6% t ¼ 1.49 t ¼ 2.77∗∗∗
Dealership revenues 0.0% 0.0% 0.0% t ¼ n/a t ¼ n/aDepartment profit 94.5% 15.4% 47.0% t ¼ 13.8∗∗∗ t ¼ 2.17∗∗
Department revenues 1.3% 7.7% 9.6% t ¼ 4.44∗∗∗ t ¼ 0.22Non-financial 2.9% 53.8% 39.8% t ¼ 12.5∗∗∗ t ¼ 0.952. Shape of the formula bonus incentive function:Threshold (floor . 0) 5.3% 53.8% 55.4% t ¼ 14.8∗∗∗ t ¼ 0.11Cap 1.6% 15.4% 36.1% t ¼ 13.1∗∗∗ t ¼ 1.48
(Continued)
Perfo
rma
nce
Mea
surem
ent
an
dIn
centive
Co
mp
ensa
tion
64
9
Dow
nloa
ded
by [
LSE
Lib
rary
] at
07:
26 2
8 N
ovem
ber
2011
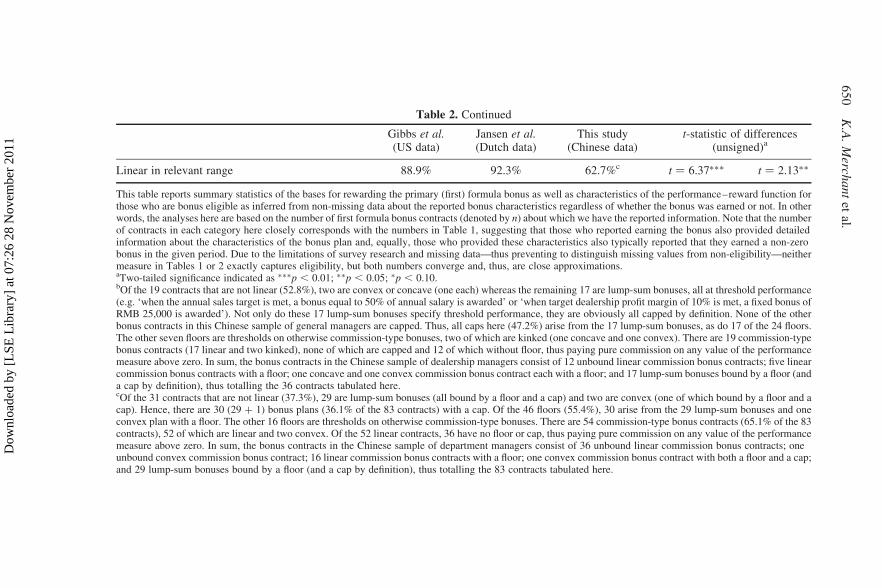
Table 2. Continued
Gibbs et al.(US data)
Jansen et al.(Dutch data)
This study(Chinese data)
t-statistic of differences(unsigned)a
Linear in relevant range 88.9% 92.3% 62.7%c t ¼ 6.37∗∗∗ t ¼ 2.13∗∗
This table reports summary statistics of the bases for rewarding the primary (first) formula bonus as well as characteristics of the performance–reward function forthose who are bonus eligible as inferred from non-missing data about the reported bonus characteristics regardless of whether the bonus was earned or not. In otherwords, the analyses here are based on the number of first formula bonus contracts (denoted by n) about which we have the reported information. Note that the numberof contracts in each category here closely corresponds with the numbers in Table 1, suggesting that those who reported earning the bonus also provided detailedinformation about the characteristics of the bonus plan and, equally, those who provided these characteristics also typically reported that they earned a non-zerobonus in the given period. Due to the limitations of survey research and missing data—thus preventing to distinguish missing values from non-eligibility—neithermeasure in Tables 1 or 2 exactly captures eligibility, but both numbers converge and, thus, are close approximations.aTwo-tailed significance indicated as ∗∗∗p , 0.01; ∗∗p , 0.05; ∗p , 0.10.bOf the 19 contracts that are not linear (52.8%), two are convex or concave (one each) whereas the remaining 17 are lump-sum bonuses, all at threshold performance(e.g. ‘when the annual sales target is met, a bonus equal to 50% of annual salary is awarded’ or ‘when target dealership profit margin of 10% is met, a fixed bonus ofRMB 25,000 is awarded’). Not only do these 17 lump-sum bonuses specify threshold performance, they are obviously all capped by definition. None of the otherbonus contracts in this Chinese sample of general managers are capped. Thus, all caps here (47.2%) arise from the 17 lump-sum bonuses, as do 17 of the 24 floors.The other seven floors are thresholds on otherwise commission-type bonuses, two of which are kinked (one concave and one convex). There are 19 commission-typebonus contracts (17 linear and two kinked), none of which are capped and 12 of which without floor, thus paying pure commission on any value of the performancemeasure above zero. In sum, the bonus contracts in the Chinese sample of dealership managers consist of 12 unbound linear commission bonus contracts; five linearcommission bonus contracts with a floor; one concave and one convex commission bonus contract each with a floor; and 17 lump-sum bonuses bound by a floor (anda cap by definition), thus totalling the 36 contracts tabulated here.cOf the 31 contracts that are not linear (37.3%), 29 are lump-sum bonuses (all bound by a floor and a cap) and two are convex (one of which bound by a floor and acap). Hence, there are 30 (29 + 1) bonus plans (36.1% of the 83 contracts) with a cap. Of the 46 floors (55.4%), 30 arise from the 29 lump-sum bonuses and oneconvex plan with a floor. The other 16 floors are thresholds on otherwise commission-type bonuses. There are 54 commission-type bonus contracts (65.1% of the 83contracts), 52 of which are linear and two convex. Of the 52 linear contracts, 36 have no floor or cap, thus paying pure commission on any value of the performancemeasure above zero. In sum, the bonus contracts in the Chinese sample of department managers consist of 36 unbound linear commission bonus contracts; oneunbound convex commission bonus contract; 16 linear commission bonus contracts with a floor; one convex commission bonus contract with both a floor and a cap;and 29 lump-sum bonuses bound by a floor (and a cap by definition), thus totalling the 83 contracts tabulated here.
65
0K
.A.
Merch
an
tet
al.
Dow
nloa
ded
by [
LSE
Lib
rary
] at
07:
26 2
8 N
ovem
ber
2011
5. Multivariate Analyses
5.1. Control Variables
To augment the confidence that our findings are possibly attributable to cross-
national differences, we control for the effects of a number of variables that
have been argued to also affect incentive practices. As in Jansen et al. (2009),
we include:
(1) DEALERSHIP SIZE (log of dealership revenues);
(2) GENERAL MANAGER EXPERIENCE (number of years that the general manager
has been in the general manager position);
(3) GENERAL MANAGER DELEGATION OF DECISION RIGHTS (5-item Likert
scale; see Table 3);
(4) DEALERSHIP COMPETITION (3-item Likert scale; see Table 3);
(5) DEALERSHIP ENVIRONMENTAL UNCERTAINTY (5-item Likert scale; see Table
3);
(6) DEALERSHIP CUSTOMER SERVICE ORIENTATION (6-item Likert scale; see
Table 3);
(7) DEALERSHIP DIFFERENTIATION STRATEGY (general manager’s assessment of
the dealership’s predominant strategic focus, ranging from cost leadership to
differentiation; see Table 3);
(8) BONUS RECIPIENT EXPERIENCE (number of years that the incentive-eligible
manager has been working at the car dealership).
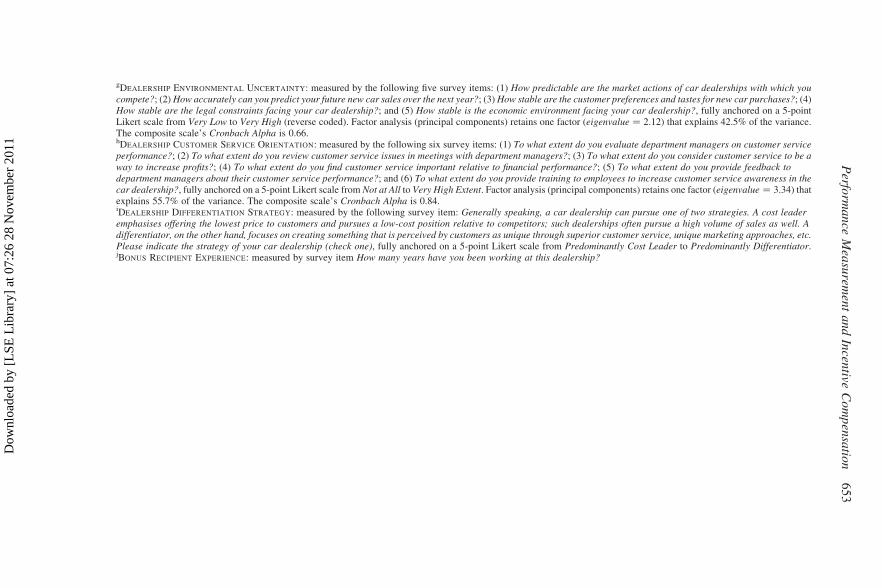
Table 3 shows the detailed scales for each of these measures and descriptive
statistics for each country sample, as well as a test of statistical differences
between the USA and China, and between the Netherlands and China, respect-
ively. These data show that while the Chinese firms are larger than the Dutch
firms, on average, they are smaller than the US firms. As compared to the
firms in the other two countries, the Chinese firms are more centralised, as
reflected in the general manager delegation scores, and their managers are
less experienced. These differences suggest the desirability of controlling for
the possible influence of these variables on various incentive system design
elements.
Table 4 shows the correlations between all of these variables using the data
from the Chinese survey. Two of the three types of incentive use (formula
bonuses and discretionary bonuses) are not significantly correlated, suggesting
that they operate independent of one another in Chinese dealerships. The third
type (spiffs) are weakly positively correlated with both of the other types of
incentives, suggesting that when managers receive any of these two types of
incentives, they may also receive spiffs. The correlation data also suggest that
larger dealerships tend to decentralise decision-making and employ experienced
managers; they also tend to operate in more uncertain environments and pursue
differentiation strategies. Dealerships that face more competition and uncertainty
Performance Measurement and Incentive Compensation 651
Dow
nloa
ded
by [
LSE
Lib
rary
] at
07:
26 2
8 N
ovem
ber
2011
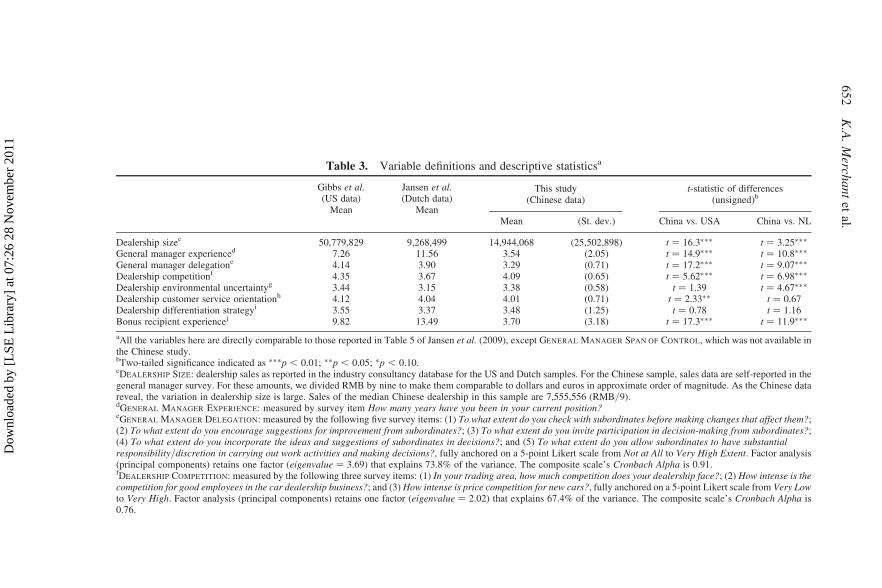
Table 3. Variable definitions and descriptive statisticsa
Gibbs et al.(US data)
Mean
Jansen et al.(Dutch data)
Mean
This study(Chinese data)
t-statistic of differences(unsigned)b
Mean (St. dev.) China vs. USA China vs. NL
Dealership sizec 50,779,829 9,268,499 14,944,068 (25,502,898) t ¼ 16.3∗∗∗ t ¼ 3.25∗∗∗
General manager experienced 7.26 11.56 3.54 (2.05) t ¼ 14.9∗∗∗ t ¼ 10.8∗∗∗
General manager delegatione 4.14 3.90 3.29 (0.71) t ¼ 17.2∗∗∗ t ¼ 9.07∗∗∗
Dealership competitionf 4.35 3.67 4.09 (0.65) t ¼ 5.62∗∗∗ t ¼ 6.98∗∗∗
Dealership environmental uncertaintyg 3.44 3.15 3.38 (0.58) t ¼ 1.39 t ¼ 4.67∗∗∗
Dealership customer service orientationh 4.12 4.04 4.01 (0.71) t ¼ 2.33∗∗ t ¼ 0.67Dealership differentiation strategyi 3.55 3.37 3.48 (1.25) t ¼ 0.78 t ¼ 1.16Bonus recipient experiencej 9.82 13.49 3.70 (3.18) t ¼ 17.3∗∗∗ t ¼ 11.9∗∗∗
aAll the variables here are directly comparable to those reported in Table 5 of Jansen et al. (2009), except GENERAL MANAGER SPAN OF CONTROL, which was not available inthe Chinese study.bTwo-tailed significance indicated as ∗∗∗p , 0.01; ∗∗p , 0.05; ∗p , 0.10.cDEALERSHIP SIZE: dealership sales as reported in the industry consultancy database for the US and Dutch samples. For the Chinese sample, sales data are self-reported in thegeneral manager survey. For these amounts, we divided RMB by nine to make them comparable to dollars and euros in approximate order of magnitude. As the Chinese datareveal, the variation in dealership size is large. Sales of the median Chinese dealership in this sample are 7,555,556 (RMB/9).dGENERAL MANAGER EXPERIENCE: measured by survey item How many years have you been in your current position?eGENERAL MANAGER DELEGATION: measured by the following five survey items: (1) To what extent do you check with subordinates before making changes that affect them?;(2) To what extent do you encourage suggestions for improvement from subordinates?; (3) To what extent do you invite participation in decision-making from subordinates?;(4) To what extent do you incorporate the ideas and suggestions of subordinates in decisions?; and (5) To what extent do you allow subordinates to have substantialresponsibility/discretion in carrying out work activities and making decisions?, fully anchored on a 5-point Likert scale from Not at All to Very High Extent. Factor analysis(principal components) retains one factor (eigenvalue ¼ 3.69) that explains 73.8% of the variance. The composite scale’s Cronbach Alpha is 0.91.fDEALERSHIP COMPETITION: measured by the following three survey items: (1) In your trading area, how much competition does your dealership face?; (2) How intense is thecompetition for good employees in the car dealership business?; and (3) How intense is price competition for new cars?, fully anchored on a 5-point Likert scale from Very Lowto Very High. Factor analysis (principal components) retains one factor (eigenvalue ¼ 2.02) that explains 67.4% of the variance. The composite scale’s Cronbach Alpha is0.76.
65
2K
.A.
Merch
an
tet
al.
Dow
nloa
ded
by [
LSE
Lib
rary
] at
07:
26 2
8 N
ovem
ber
2011
gDEALERSHIP ENVIRONMENTAL UNCERTAINTY: measured by the following five survey items: (1) How predictable are the market actions of car dealerships with which youcompete?; (2) How accurately can you predict your future new car sales over the next year?; (3) How stable are the customer preferences and tastes for new car purchases?; (4)How stable are the legal constraints facing your car dealership?; and (5) How stable is the economic environment facing your car dealership?, fully anchored on a 5-pointLikert scale from Very Low to Very High (reverse coded). Factor analysis (principal components) retains one factor (eigenvalue ¼ 2.12) that explains 42.5% of the variance.The composite scale’s Cronbach Alpha is 0.66.hDEALERSHIP CUSTOMER SERVICE ORIENTATION: measured by the following six survey items: (1) To what extent do you evaluate department managers on customer serviceperformance?; (2) To what extent do you review customer service issues in meetings with department managers?; (3) To what extent do you consider customer service to be away to increase profits?; (4) To what extent do you find customer service important relative to financial performance?; (5) To what extent do you provide feedback todepartment managers about their customer service performance?; and (6) To what extent do you provide training to employees to increase customer service awareness in thecar dealership?, fully anchored on a 5-point Likert scale from Not at All to Very High Extent. Factor analysis (principal components) retains one factor (eigenvalue ¼ 3.34) thatexplains 55.7% of the variance. The composite scale’s Cronbach Alpha is 0.84.iDEALERSHIP DIFFERENTIATION STRATEGY: measured by the following survey item: Generally speaking, a car dealership can pursue one of two strategies. A cost leaderemphasises offering the lowest price to customers and pursues a low-cost position relative to competitors; such dealerships often pursue a high volume of sales as well. Adifferentiator, on the other hand, focuses on creating something that is perceived by customers as unique through superior customer service, unique marketing approaches, etc.Please indicate the strategy of your car dealership (check one), fully anchored on a 5-point Likert scale from Predominantly Cost Leader to Predominantly Differentiator.jBONUS RECIPIENT EXPERIENCE: measured by survey item How many years have you been working at this dealership?
Perfo
rma
nce
Mea
surem
ent
an
dIn
centive
Co
mp
ensa
tion
65
3
Dow
nloa
ded
by [
LSE
Lib
rary
] at
07:
26 2
8 N
ovem
ber
2011
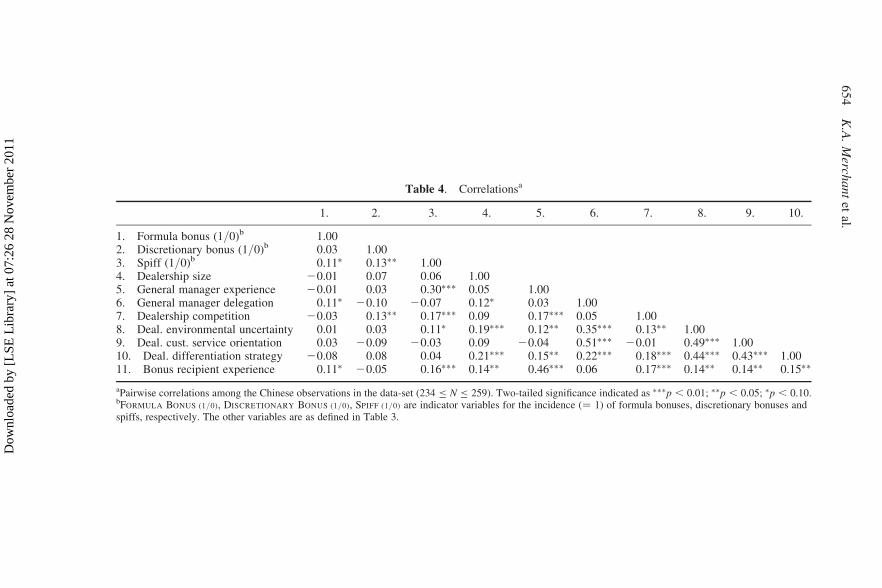
Table 4. Correlationsa
1. 2. 3. 4. 5. 6. 7. 8. 9. 10.
1. Formula bonus (1/0)b 1.002. Discretionary bonus (1/0)b 0.03 1.003. Spiff (1/0)b 0.11∗ 0.13∗∗ 1.004. Dealership size 20.01 0.07 0.06 1.005. General manager experience 20.01 0.03 0.30∗∗∗ 0.05 1.006. General manager delegation 0.11∗ 20.10 20.07 0.12∗ 0.03 1.007. Dealership competition 20.03 0.13∗∗ 0.17∗∗∗ 0.09 0.17∗∗∗ 0.05 1.008. Deal. environmental uncertainty 0.01 0.03 0.11∗ 0.19∗∗∗ 0.12∗∗ 0.35∗∗∗ 0.13∗∗ 1.009. Deal. cust. service orientation 0.03 20.09 20.03 0.09 20.04 0.51∗∗∗ 20.01 0.49∗∗∗ 1.0010. Deal. differentiation strategy 20.08 0.08 0.04 0.21∗∗∗ 0.15∗∗ 0.22∗∗∗ 0.18∗∗∗ 0.44∗∗∗ 0.43∗∗∗ 1.0011. Bonus recipient experience 0.11∗ 20.05 0.16∗∗∗ 0.14∗∗ 0.46∗∗∗ 0.06 0.17∗∗∗ 0.14∗∗ 0.14∗∗ 0.15∗∗
aPairwise correlations among the Chinese observations in the data-set (234 ≤ N ≤ 259). Two-tailed significance indicated as ∗∗∗p , 0.01; ∗∗p , 0.05; ∗p , 0.10.bFORMULA BONUS (1/0), DISCRETIONARY BONUS (1/0), SPIFF (1/0) are indicator variables for the incidence (¼ 1) of formula bonuses, discretionary bonuses andspiffs, respectively. The other variables are as defined in Table 3.
65
4K
.A.
Merch
an
tet
al.
Dow
nloa
ded
by [
LSE
Lib
rary
] at
07:
26 2
8 N
ovem
ber
2011
appear to make more use of spiffs (such as prizes for sales contests). Finally, the
magnitudes of the correlations reported in Table 4, as well as the untabulated cor-
relations for the entire data-set combining all of the country observations (900 ≤N ≤ 1241), indicate that multicollinearity is not a threat to the interpretation of
our subsequent multivariate results.
5.2. Analysis of the Determinants of the Incidence and Magnitude of
Incentives
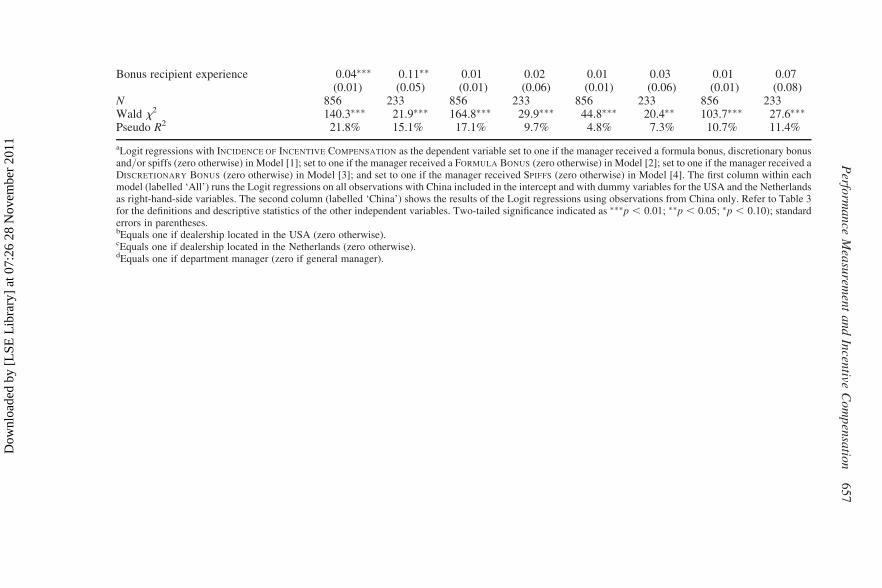
Table 5(a) shows a Logit analysis of the determinants of the incidence of incen-
tives in any form (formula bonuses, discretionary bonuses and/or spiffs – Model
[1]) as well as separately for each type of incentive in Models [2][3][4], respect-
ively. The first column within each model (labelled ‘All’) runs the Logit
regression on all observations with China included in the intercept and with
dummy variables for the USA and the Netherlands as right-hand-side variables.
The second column (labelled ‘China’) shows the results of the Logit regressions
using observations from China only.
Because Tables 1 and 2 suggest that the incentive practices may differ across
general managers and department managers, we also include a dummy variable to
control for this possible effect in addition to all the other control variables dis-
cussed above. Because the data include multiple observations from the same
dealership, we report the results with Huber–White cluster-corrected (‘robust’)
standard errors to allow relaxing the assumption of independence within
groups (i.e. dealerships).2
After incorporating the effects of all of the control variables, the results suggest
that the Chinese managers are more likely to receive some type of incentive com-
pensation than are the Dutch managers (as shown by the significant negative coef-
ficients for the Dutch dummy variable across all the models in Table 5(a)).
Compared to the US managers, the Chinese managers are less likely to receive
formula bonuses but more likely to receive discretionary bonuses, whereas the
use of spiffs is not significantly different across US and Chinese dealerships.
Overall, then, and as shown in Model [1] of Table 5(a), Chinese managers are
significantly more likely to get some form of incentive compensation than are
managers in either of the other two countries. Whereas the Chinese firms make
relatively less use of formula bonus plans, more of the Chinese managers
receive some form of incentive compensation because many of them are given
a discretionary bonus payout (see also Table 1 above).
Looking at the effects of the control variables, larger firms are more likely to
use some form of incentive compensation (Model [1]), and managers who have
worked longer for their firm are more likely to earn incentives (Model [1]).
Formula bonuses appear to go hand in hand with delegation (Model [2]) as incen-
tive logic would suggest. Discretionary bonuses appear to be more relied upon in
dealerships that place greater emphasis on customer service (Model [3]). Finally,
spiffs seem to be used more when competition is fiercer (Model [4]), which
Performance Measurement and Incentive Compensation 655
Dow
nloa
ded
by [
LSE
Lib
rary
] at
07:
26 2
8 N
ovem
ber
2011
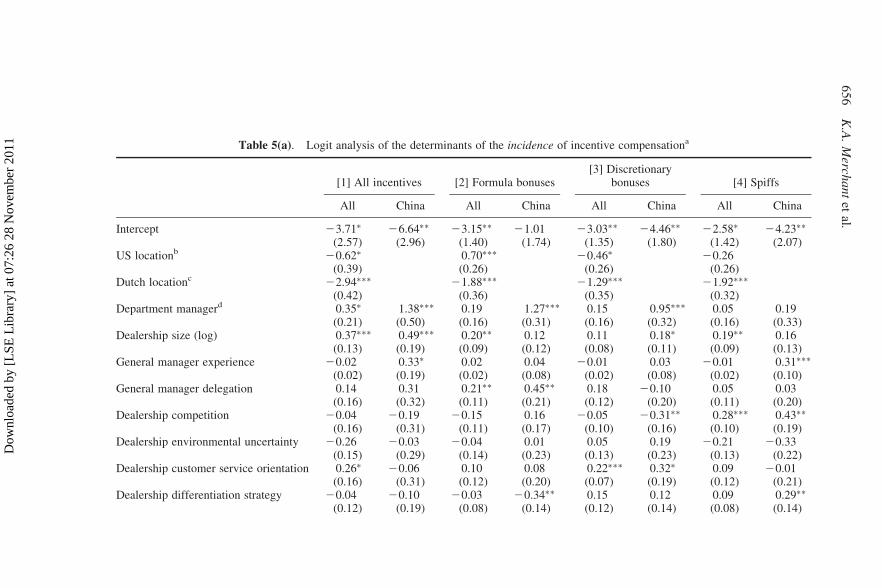
Table 5(a). Logit analysis of the determinants of the incidence of incentive compensationa
[1] All incentives [2] Formula bonuses[3] Discretionary
bonuses [4] Spiffs
All China All China All China All China
Intercept 23.71∗
(2.57)26.64∗∗
(2.96)23.15∗∗
(1.40)21.01
(1.74)23.03∗∗
(1.35)24.46∗∗
(1.80)22.58∗
(1.42)24.23∗∗
(2.07)US locationb 20.62∗
(0.39)0.70∗∗∗
(0.26)20.46∗
(0.26)20.26
(0.26)Dutch locationc 22.94∗∗∗
(0.42)21.88∗∗∗
(0.36)21.29∗∗∗
(0.35)21.92∗∗∗
(0.32)Department managerd 0.35∗
(0.21)1.38∗∗∗
(0.50)0.19(0.16)
1.27∗∗∗
(0.31)0.15(0.16)
0.95∗∗∗
(0.32)0.05(0.16)
0.19(0.33)
Dealership size (log) 0.37∗∗∗
(0.13)0.49∗∗∗
(0.19)0.20∗∗
(0.09)0.12(0.12)
0.11(0.08)
0.18∗
(0.11)0.19∗∗
(0.09)0.16(0.13)
General manager experience 20.02(0.02)
0.33∗
(0.19)0.02(0.02)
0.04(0.08)
20.01(0.02)
0.03(0.08)
20.01(0.02)
0.31∗∗∗
(0.10)General manager delegation 0.14
(0.16)0.31(0.32)
0.21∗∗
(0.11)0.45∗∗
(0.21)0.18(0.12)
20.10(0.20)
0.05(0.11)
0.03(0.20)
Dealership competition 20.04(0.16)
20.19(0.31)
20.15(0.11)
0.16(0.17)
20.05(0.10)
20.31∗∗
(0.16)0.28∗∗∗
(0.10)0.43∗∗
(0.19)Dealership environmental uncertainty 20.26
(0.15)20.03
(0.29)20.04
(0.14)0.01(0.23)
0.05(0.13)
0.19(0.23)
20.21(0.13)
20.33(0.22)
Dealership customer service orientation 0.26∗
(0.16)20.06
(0.31)0.10(0.12)
0.08(0.20)
0.22∗∗∗
(0.07)0.32∗
(0.19)0.09(0.12)
20.01(0.21)
Dealership differentiation strategy 20.04(0.12)
20.10(0.19)
20.03(0.08)
20.34∗∗
(0.14)0.15(0.12)
0.12(0.14)
0.09(0.08)
0.29∗∗
(0.14)
65
6K
.A.
Merch
an
tet
al.
Dow
nloa
ded
by [
LSE
Lib
rary
] at
07:
26 2
8 N
ovem
ber
2011
Bonus recipient experience 0.04∗∗∗
(0.01)0.11∗∗
(0.05)0.01(0.01)
0.02(0.06)
0.01(0.01)
0.03(0.06)
0.01(0.01)
0.07(0.08)
N 856 233 856 233 856 233 856 233Wald x2 140.3∗∗∗ 21.9∗∗∗ 164.8∗∗∗ 29.9∗∗∗ 44.8∗∗∗ 20.4∗∗ 103.7∗∗∗ 27.6∗∗∗
Pseudo R2 21.8% 15.1% 17.1% 9.7% 4.8% 7.3% 10.7% 11.4%
aLogit regressions with INCIDENCE OF INCENTIVE COMPENSATION as the dependent variable set to one if the manager received a formula bonus, discretionary bonusand/or spiffs (zero otherwise) in Model [1]; set to one if the manager received a FORMULA BONUS (zero otherwise) in Model [2]; set to one if the manager received aDISCRETIONARY BONUS (zero otherwise) in Model [3]; and set to one if the manager received SPIFFS (zero otherwise) in Model [4]. The first column within eachmodel (labelled ‘All’) runs the Logit regressions on all observations with China included in the intercept and with dummy variables for the USA and the Netherlandsas right-hand-side variables. The second column (labelled ‘China’) shows the results of the Logit regressions using observations from China only. Refer to Table 3for the definitions and descriptive statistics of the other independent variables. Two-tailed significance indicated as ∗∗∗p , 0.01; ∗∗p , 0.05; ∗p , 0.10); standarderrors in parentheses.bEquals one if dealership located in the USA (zero otherwise).cEquals one if dealership located in the Netherlands (zero otherwise).dEquals one if department manager (zero if general manager).
Perfo
rma
nce
Mea
surem
ent
an
dIn
centive
Co
mp
ensa
tion
65
7
Dow
nloa
ded
by [
LSE
Lib
rary
] at
07:
26 2
8 N
ovem
ber
2011
typifies the conditions under which such rewards are typically given (such as
prizes in contests for best sales).
Overall, these results support the inferences from the univariate analyses as
shown in Table 1. The findings also show that the use of each of these forms
of incentives is not solely attributable to the presence of any of the control vari-
ables, or even all of them in combination. Even after controlling for a range of
differences in firm characteristics, the national setting has a significant effect.
However, some results appear to be particularly driven by the Chinese obser-
vations. For example, incentive practices in Chinese firms are ostensibly more
different for general managers and department managers, which one could specu-
late to be consistent with notions of ‘hierarchy’ in Asian cultures, although that
remains an observation for further study.
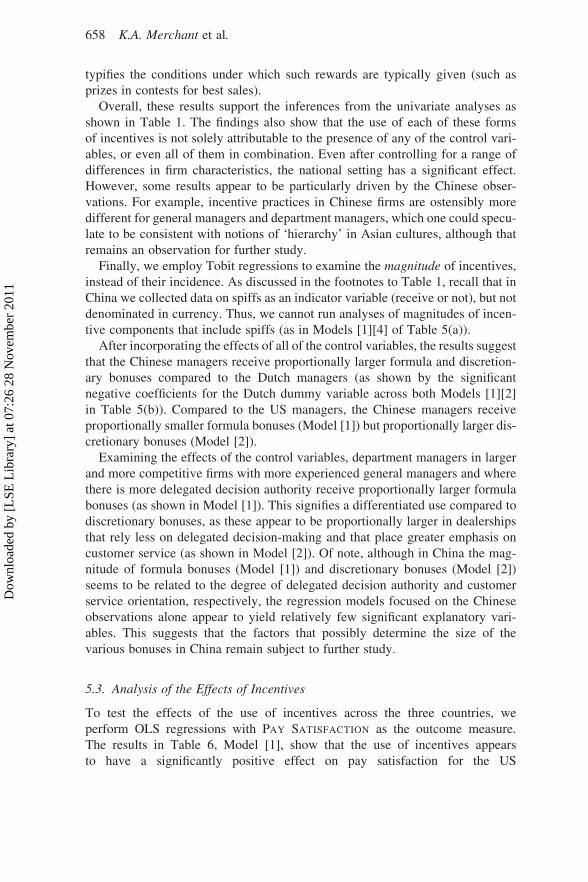
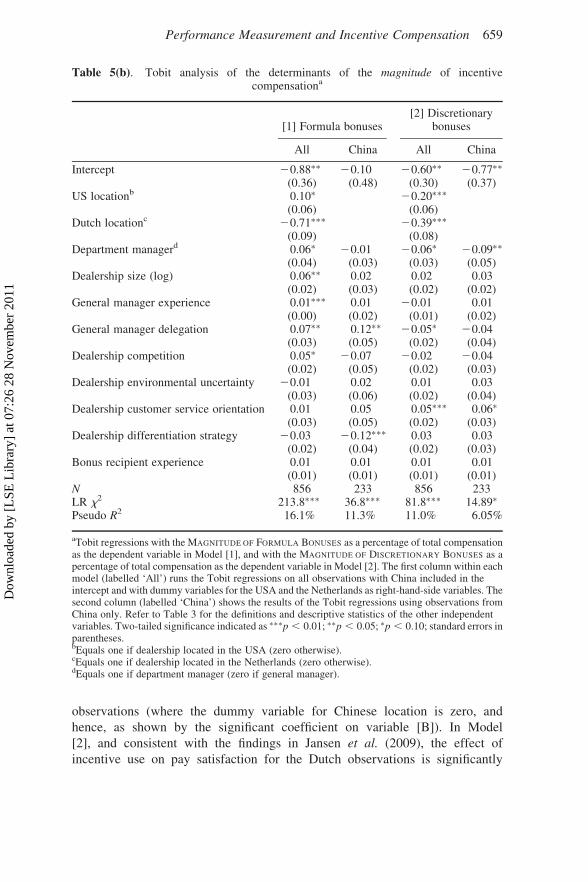
Finally, we employ Tobit regressions to examine the magnitude of incentives,
instead of their incidence. As discussed in the footnotes to Table 1, recall that in
China we collected data on spiffs as an indicator variable (receive or not), but not
denominated in currency. Thus, we cannot run analyses of magnitudes of incen-
tive components that include spiffs (as in Models [1][4] of Table 5(a)).
After incorporating the effects of all of the control variables, the results suggest
that the Chinese managers receive proportionally larger formula and discretion-
ary bonuses compared to the Dutch managers (as shown by the significant
negative coefficients for the Dutch dummy variable across both Models [1][2]
in Table 5(b)). Compared to the US managers, the Chinese managers receive
proportionally smaller formula bonuses (Model [1]) but proportionally larger dis-
cretionary bonuses (Model [2]).
Examining the effects of the control variables, department managers in larger
and more competitive firms with more experienced general managers and where
there is more delegated decision authority receive proportionally larger formula
bonuses (as shown in Model [1]). This signifies a differentiated use compared to
discretionary bonuses, as these appear to be proportionally larger in dealerships
that rely less on delegated decision-making and that place greater emphasis on
customer service (as shown in Model [2]). Of note, although in China the mag-
nitude of formula bonuses (Model [1]) and discretionary bonuses (Model [2])
seems to be related to the degree of delegated decision authority and customer
service orientation, respectively, the regression models focused on the Chinese
observations alone appear to yield relatively few significant explanatory vari-
ables. This suggests that the factors that possibly determine the size of the
various bonuses in China remain subject to further study.
5.3. Analysis of the Effects of Incentives
To test the effects of the use of incentives across the three countries, we
perform OLS regressions with PAY SATISFACTION as the outcome measure.
The results in Table 6, Model [1], show that the use of incentives appears
to have a significantly positive effect on pay satisfaction for the US
658 K.A. Merchant et al.
Dow
nloa
ded
by [
LSE
Lib
rary
] at
07:
26 2
8 N
ovem
ber
2011
observations (where the dummy variable for Chinese location is zero, and
hence, as shown by the significant coefficient on variable [B]). In Model
[2], and consistent with the findings in Jansen et al. (2009), the effect of
incentive use on pay satisfaction for the Dutch observations is significantly
Table 5(b). Tobit analysis of the determinants of the magnitude of incentivecompensationa
[1] Formula bonuses[2] Discretionary
bonuses
All China All China
Intercept 20.88∗∗
(0.36)20.10
(0.48)20.60∗∗
(0.30)20.77∗∗
(0.37)US locationb 0.10∗
(0.06)20.20∗∗∗
(0.06)Dutch locationc 20.71∗∗∗
(0.09)20.39∗∗∗
(0.08)Department managerd 0.06∗
(0.04)20.01
(0.03)20.06∗
(0.03)20.09∗∗
(0.05)Dealership size (log) 0.06∗∗
(0.02)0.02(0.03)
0.02(0.02)
0.03(0.02)
General manager experience 0.01∗∗∗
(0.00)0.01(0.02)
20.01(0.01)
0.01(0.02)
General manager delegation 0.07∗∗
(0.03)0.12∗∗
(0.05)20.05∗
(0.02)20.04(0.04)
Dealership competition 0.05∗
(0.02)20.07
(0.05)20.02
(0.02)20.04(0.03)
Dealership environmental uncertainty 20.01(0.03)
0.02(0.06)
0.01(0.02)
0.03(0.04)
Dealership customer service orientation 0.01(0.03)
0.05(0.05)
0.05∗∗∗
(0.02)0.06∗
(0.03)Dealership differentiation strategy 20.03
(0.02)20.12∗∗∗
(0.04)0.03(0.02)
0.03(0.03)
Bonus recipient experience 0.01(0.01)
0.01(0.01)
0.01(0.01)
0.01(0.01)
N 856 233 856 233LR x2 213.8∗∗∗ 36.8∗∗∗ 81.8∗∗∗ 14.89∗
Pseudo R2 16.1% 11.3% 11.0% 6.05%
aTobit regressions with the MAGNITUDE OF FORMULA BONUSES as a percentage of total compensationas the dependent variable in Model [1], and with the MAGNITUDE OF DISCRETIONARY BONUSES as apercentage of total compensation as the dependent variable in Model [2]. The first column within eachmodel (labelled ‘All’) runs the Tobit regressions on all observations with China included in theintercept and with dummy variables for the USA and the Netherlands as right-hand-side variables. Thesecond column (labelled ‘China’) shows the results of the Tobit regressions using observations fromChina only. Refer to Table 3 for the definitions and descriptive statistics of the other independentvariables. Two-tailed significance indicated as ∗∗∗p , 0.01; ∗∗p , 0.05; ∗p , 0.10; standard errors inparentheses.bEquals one if dealership located in the USA (zero otherwise).cEquals one if dealership located in the Netherlands (zero otherwise).dEquals one if department manager (zero if general manager).
Performance Measurement and Incentive Compensation 659
Dow
nloa
ded
by [
LSE
Lib
rary
] at
07:
26 2
8 N
ovem
ber
2011
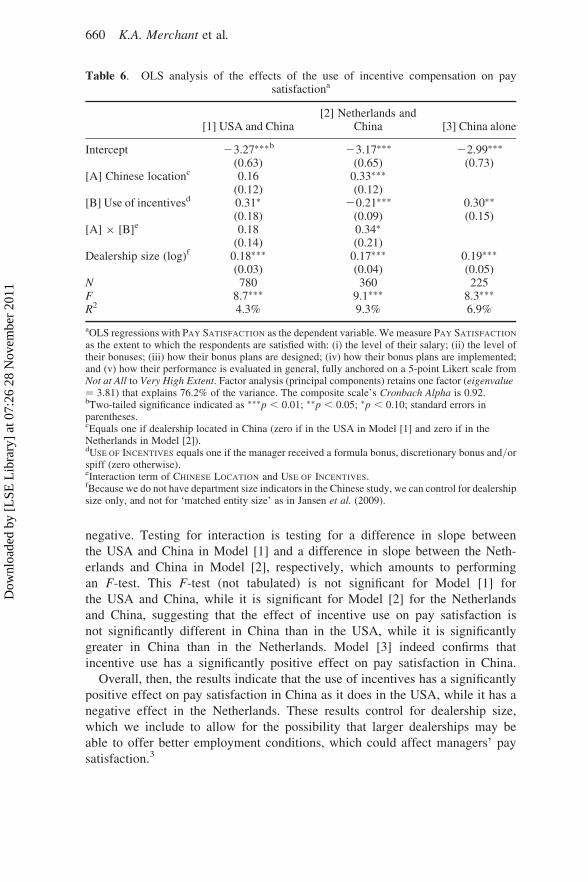
negative. Testing for interaction is testing for a difference in slope between
the USA and China in Model [1] and a difference in slope between the Neth-
erlands and China in Model [2], respectively, which amounts to performing
an F-test. This F-test (not tabulated) is not significant for Model [1] for
the USA and China, while it is significant for Model [2] for the Netherlands
and China, suggesting that the effect of incentive use on pay satisfaction is
not significantly different in China than in the USA, while it is significantly
greater in China than in the Netherlands. Model [3] indeed confirms that
incentive use has a significantly positive effect on pay satisfaction in China.
Overall, then, the results indicate that the use of incentives has a significantly
positive effect on pay satisfaction in China as it does in the USA, while it has a
negative effect in the Netherlands. These results control for dealership size,
which we include to allow for the possibility that larger dealerships may be
able to offer better employment conditions, which could affect managers’ pay
satisfaction.3
Table 6. OLS analysis of the effects of the use of incentive compensation on paysatisfactiona
[1] USA and China[2] Netherlands and
China [3] China alone
Intercept 23.27∗∗∗b
(0.63)23.17∗∗∗
(0.65)22.99∗∗∗
(0.73)[A] Chinese locationc 0.16
(0.12)0.33∗∗∗
(0.12)[B] Use of incentivesd 0.31∗
(0.18)20.21∗∗∗
(0.09)0.30∗∗
(0.15)[A] × [B]e 0.18
(0.14)0.34∗
(0.21)Dealership size (log)f 0.18∗∗∗
(0.03)0.17∗∗∗
(0.04)0.19∗∗∗
(0.05)N 780 360 225F 8.7∗∗∗ 9.1∗∗∗ 8.3∗∗∗
R2 4.3% 9.3% 6.9%
aOLS regressions with PAY SATISFACTION as the dependent variable. We measure PAY SATISFACTION
as the extent to which the respondents are satisfied with: (i) the level of their salary; (ii) the level oftheir bonuses; (iii) how their bonus plans are designed; (iv) how their bonus plans are implemented;and (v) how their performance is evaluated in general, fully anchored on a 5-point Likert scale fromNot at All to Very High Extent. Factor analysis (principal components) retains one factor (eigenvalue¼ 3.81) that explains 76.2% of the variance. The composite scale’s Cronbach Alpha is 0.92.bTwo-tailed significance indicated as ∗∗∗p , 0.01; ∗∗p , 0.05; ∗p , 0.10; standard errors inparentheses.cEquals one if dealership located in China (zero if in the USA in Model [1] and zero if in theNetherlands in Model [2]).dUSE OF INCENTIVES equals one if the manager received a formula bonus, discretionary bonus and/orspiff (zero otherwise).eInteraction term of CHINESE LOCATION and USE OF INCENTIVES.fBecause we do not have department size indicators in the Chinese study, we can control for dealershipsize only, and not for ‘matched entity size’ as in Jansen et al. (2009).
660 K.A. Merchant et al.
Dow
nloa
ded
by [
LSE
Lib
rary
] at
07:
26 2
8 N
ovem
ber
2011
6. Discussion and Conclusions
The aim of this study was to provide empirical evidence of the differences in
incentive compensation practices in Chinese car dealerships compared to those
in use in US and Dutch dealerships. We began our study with three tentative
expectations that, as compared to US firms particularly, (1) relatively few
Chinese firms would be using performance-dependent incentives, and where
they are used, the incentive schemes used in Chinese firms would be, on
average, (2) less lucrative and (3) less sophisticated. Our findings do not
support either the first or second expectations. Our results show that, as compared
to both the US and Dutch firms, the Chinese firms are more likely to provide
incentive compensation in some form to their managers. As a percentage of
base salary, the Chinese bonuses are significantly larger than those paid in the
Dutch firms and comparable to those provided in the US firms.
Our evidence, however, seems to support the third expectation. The bonus pay-
ments in China are much more likely to be allocated on a discretionary basis,
rather than by a predetermined formula. This could be interpreted as evidence
that the Chinese incentive plans are less sophisticated, as evaluation subjectivity
is often used where measurement systems are not well developed (Gibbs et al.,
2004).
Our results also reveal a number of other significant cross-national differences.
Where formula bonuses are used, the Chinese firms’ practices are more like those
of the Dutch firms than the US firms in that the bonuses tend to be based on non-
financial measures of performance and the performance–reward functions are
more likely to use upper and lower payout constraints and more likely to be
non-linear. But the Chinese managers’ attitudes toward incentive pay resemble
those of US managers: managers in Chinese and US firms who receive some
form of incentive compensation are more satisfied with their pay, while this
appears not to be the case for the Dutch managers.
Findings like those presented here provide an essential first step towards build-
ing refined understandings. But what explains these findings? Since we did not
measure any explanatory variables of national differences except by country
dummy, the explanations we can provide are inevitably exploratory. Nonetheless,
we provide some conjectures to perhaps help guide others who wish to work in
this area of study.
We suggest that three types of variables that vary across national boundaries –
national culture, income tax rates and experience with incentives – might have
direct effects on the cross-national relative use of incentives. Much research
has focused on cultural differences across countries and their effects on manage-
ment practices (e.g. see reviews by Gelfand et al., 2007; Tsui et al., 2007;
Kirkman et al., 2006; Werner, 2002). The term culture is used to refer to any
stable characteristic of groups, such as traditions, values or beliefs that differen-
tiates it from other groups. Many such characteristics have been identified to
describe cultural differences across nations.
Performance Measurement and Incentive Compensation 661
Dow
nloa
ded
by [
LSE
Lib
rary
] at
07:
26 2
8 N
ovem
ber
2011
The culture characteristic that appears best to explain our findings regarding
the relative use of incentives is the dimension typically referred to as ‘masculi-
nity–femininity’ (e.g. see Hofstede, 1980a, 2001; Newman and Nollen, 1996;
Smith et al., 2002; Fischer and Smith, 2004). Masculinity refers to preferences
for competitiveness, achievement and material success (traits labelled as ‘mascu-
line’), as opposed to an emphasis on relationships and quality of life (traits
labelled as ‘feminine’). Hofstede (1980a, 1980b, 1991) argued that people high
in masculinity tend to prefer basing rewards on performance, while those low
in masculinity (high in femininity) prefer allocations based on need. Newman
and Nollen (1996) supported Hofstede’s theory, as they found that work units
in more masculine countries were higher performing when reward practices
were more merit-based, with the opposite occurring in feminine countries.
Hofstede (1980a, 2001) reported that scores on the masculinity dimension of
culture in the USA, the Netherlands and China were 62, 14 and 66, respectively.
This suggests that both the USA and China are similar in their degree of mascu-
linity, on average, whereas the Netherlands appears to be relatively ‘feminine’ as
measured by this cultural trait. These differences in masculinity cultural dimen-
sion scores seem to reflect the differences we found in the use of incentive com-
pensation in firms in these three countries.
The high use of discretion used to allocate bonuses in China could be derived
from a dimension of culture indicative of greater respect for authority, which
various researchers refer to as power distance (Hofstede, 1980a, 2001), hierarch-
ical differentiation (Tinsley, 2001) or egalitarianism-hierarchy (Schwartz, 1994).
For example, Hofstede (1980a, 2001) reported power distance scores that were
essentially equal in the USA and the Netherlands (40 and 38), but significantly
higher in China (80). This pattern of scores reflects the relative use of discretion
in the assignment of incentive payments that we found in these three countries.
The three countries’ income tax structures might also explain the different
emphases placed on incentive compensation use. At the compensation levels of
most of the general and department managers, the Chinese managers pay a mar-
ginal income tax rate of 20–30% – and even the highest earners are unlikely to
pay more than 35%. Most of their counterparts in US dealerships pay a marginal
rate of 33% or lower, not including state income taxes, if any. But the managers in
the Dutch car dealerships pay a marginal income tax rate of 42% or even 52%. In
addition, higher income in the Netherlands can reduce some government subsi-
dies to families, thus increasing the effective marginal tax rate. High marginal
tax rates tend to discourage the use of cash-based incentive compensation. The
after-tax benefits of cash incentives are significantly lower in the Netherlands
than in the other two countries.
Finally, it is well known that the Chinese economy and its firms’ management
practices are still in a developing state. Chinese managers’ relative lack of experi-
ence with incentive systems could explain some of the variance in practice we
observed, such as the high use of discretion in assigning bonuses, which might
also be associated with measurement systems that are not as well developed.
662 K.A. Merchant et al.
Dow
nloa
ded
by [
LSE
Lib
rary
] at
07:
26 2
8 N
ovem
ber
2011
The relatively lower experience with these systems might also explain the rela-
tively higher use of thresholds and caps on the bonus payouts, as use of these fea-
tures has been shown to reflect lack of confidence in the design of the incentive
contracts (Merchant, 1989).
These explanations are tentative. Certainly the practice patterns we observed
could be shaped by other variables that are not yet well understood or by inter-
actions among a number of these and other relevant variables. That said, we
believe that this study makes a contribution by providing detailed data about
cross-national incentive practices and by documenting some significant differ-
ences among them. Equally, we should acknowledge some limitations of this
study. First, we focused only on cash incentives. Incentives must be understood
in the contexts in which they are used, and part of that context includes other
incentives that are offered to employees, such as stock awards, promotions, rec-
ognition and job security. Stock-based compensation is not a concern for the
firms studied here because virtually all of the automobile dealerships studied
are privately owned, but the findings might be different in publicly traded
firms that provide stock-based compensation.
Second, these findings might not be generalisable to other settings. The
research method was intentionally designed to control for a number of contextual
variables that if allowed to vary might affect the results. For example, the study
focused on only one industry: automobile retailing. And as is particularly appar-
ent in this industry, the time period of the study is one obvious factor that likely
shaped the findings. The data from this study and the two studies that were repli-
cated were collected during relatively good economic times. The results might be
quite different in difficult times, such as those that were faced by US automobile
retailers in the latter part of the first decade of the twenty-first century.
Third, individual national differences were not measured in this study or, for
that matter, in the US or Dutch studies being replicated or even most cross-
cultural research (Tsui et al., 2007). Many such differences exist. Chinese man-
agement practices appear to differ, for example, in the importance placed on
personal relationships (guanxi), rather than rules and contracts. They differ in
the extent to which private firms are asked to share the responsibilities for
social stabilisation. For example, in Chinese firms layoffs of more than 20
employees or 10% of the workforce may require a written proposal to the govern-
ment and formal approval. Leadership styles are also said to differ, as a paterna-
listic leadership style is much more common in China than in Western countries
(Cheng et al., 2004). Researchers will eventually have to isolate these variables to
determine their individual effects on the performance measurement and incentive
characteristics studied here.
Acknowledgements
This paper has benefited from comments by the Editors (Mahmoud Ezzamel and
Jason Xiao) and two reviewers, as well as from Shannon Anderson, Margaret
Performance Measurement and Incentive Compensation 663
Dow
nloa
ded
by [
LSE
Lib
rary
] at
07:
26 2
8 N
ovem
ber
2011
Christ, David Erkens, Matt Hall, Christo Karuna, Tatiana Sandino and workshop
participants at the American Accounting Association Annual Meeting, China
Accounting and Finance Review Symposium, Manchester Business School,
Taiwan Chang-Gung University, Taiwan Chung-Cheng University, Taiwan
National Chung-Hsing University, Turku School of Economics, University of
Auckland and Vienna University of Economics and Business. The authors also
appreciate the helpful research assistance from Fei Du, Yiming Hu, Zhiyuan
Liu, Melissa Martin and Pingxin Wang.
Notes
1Rich descriptive details of the incentive contracts in the USA and the Netherlands can be gleaned
from the published articles (Gibbs et al., 2004, 2009; Jansen et al., 2009). The tables in the later
sections of this paper also present some of the key features of these incentive contracts along with
comparisons and contrasts with the newly collected data from China.2The results with and without the feature of robust standard errors are qualitatively similar.
However, another way in which the assumption of independence may be violated is through
the influence of the manufacturers on dealership practices. Further examination of this possibility
revealed that many dealerships sell multiple brands. Specifically, 40/41/26% of the Chinese/
US/Dutch dealerships sell more than one brand, which likely mitigates the concern that any
one manufacturer’s influence on a given dealership might cause a threat to the independence
of observations. Moreover, focusing on the Chinese sample, the following brands were rep-
resented: Cherry, Toyota, Jinbei, Santana, Jetta, Fukang, Audi, Xiali and ‘other’. Taking Audi
as a ‘luxury’ brand among these (Audi coded as 1, zero otherwise), we find that ‘luxury
brand’ correlates positively and significantly with DEALERSHIP CUSTOMER SERVICE ORIEN-
TATION (r ¼ 0.24, p , 0.01) and DEALERSHIP DIFFERENTIATION STRATEGY (r ¼ 0.44, p ,
0.01), which is encouraging in terms of data validity. Moreover, correlations of this magnitude
in the expected direction provide reasonable comfort that any possible variation in the results due
to manufacturer (brand) influence is captured to some extent by two variables included in the
analyses (customer service and dealership strategy). Given that the results that include these
two variables are qualitatively similar with and without the feature of robust standard errors,
there is no reason to believe that our results are unduly affected by the threat of lack of indepen-
dence of observations across multiple respondents within dealerships as well as across multiple
dealerships due to manufacturers’ influence.3We were unable to obtain measures of profit or other financial outcomes from the Chinese firms.
References
Allen, R., White, C., Takeda, M. and Helms, M. (2004) Rewards and organizational performance in
Japan and the United States: a comparison, Compensation and Benefits Review, 36(1), pp. 7–14.
Awasthi, V., Chow, C. and Wu, A. (2001) Cross-cultural differences in the behavioral consequences
of imposing performance evaluation and reward systems: an experimental investigation, The
International Journal of Accounting, 36(3), pp. 291–309.
Bailey, J., Chen, C. and Dou, S. (1997) Conceptions of self and performance-related feedback in the
U.S., Japan and China, Journal of International Business Studies, 28(3), pp. 605–625.
Barney, J. and Zhang, S. (2009) The future of Chinese management research: a theory of Chinese
management versus a Chinese theory of management, Management and Organization Review,
5(1), pp. 15–28.
Bhimani, A. (1999) Mapping methodological frontiers in cross-national management control research,
Accounting, Organizations and Society, 24(5/6), pp. 413–440.
664 K.A. Merchant et al.
Dow
nloa
ded
by [
LSE
Lib
rary
] at
07:
26 2
8 N
ovem
ber
2011
Bjorkman, I. and Lu, Y. (1999) A corporate perspective on the management of human resources in
China, Journal of World Business, 34(1), pp. 16–25.
Bodmer, F. (2003) On the use of incentive pay in Chinese state-owned enterprises: the role of hier-
archy, Labour, 17, pp. 299–314.
Budhwar, P. and Sparrow, P. (2002) An integrative framework for understanding cross-national
human resource management practices, Human Resource Management Review, 12, pp. 377–403.
Cauley, J., Cornes, R. and Sandler, T. (1999) Stakeholder incentives and reforms in China’s state-
owned enterprises: a common-property theory, China Economic Review, 10(2), pp. 191–206.
Chen, C. (1995) New trends in rewards allocation preferences: a Sino-US comparison, Academy of
Management Journal, 38, pp. 408–428.
Chen, N. (2004) Executive compensation in Hong Kong-listed Chinese companies, China Staff, 10(8),
pp. 6–10.
Cheng, B., Chou, L., Wu, T., Huang, M. and Farh, J. (2004) Paternalistic leadership and subordinate
responses: establishing a leadership model in Chinese organizations, Asian Journal of Social Psy-
chology, 7(1), pp. 89–117.
Chow, C., Shields, M. and Wu, A. (1999) The importance of national culture in the design of and pre-
ference for management controls for multi-national operations, Accounting, Organizations and
Society, 24(5/6), pp. 441–461.
Dong, L. and Glaister, K. (2007) National and corporate culture differences in international strategy
alliances: perceptions of Chinese partners, Asia Pacific Journal of Management, 24, pp. 191–205.
Firth, M., Fung, P. and Rui, O. (2006) Corporate performance and CEO compensation in China,
Journal of Corporate Finance, 12, pp. 693–714.
Fischer, R. and Smith, P. (2004) Values and organizational justice: performance- and seniority-based
allocation criteria in the United Kingdom and Germany, Journal of Cross-Cultural Psychology,
35(6), pp. 669–688.
Gelfand, M., Erez, M. and Aycan, Z. (2007) Cross-cultural organizational behavior, Annual Review of
Psychology, 58, pp. 479–514.
Gibbs, M., Merchant, K., Van der Stede, W. and Vargus, M. (2004) Determinants and effects of sub-
jectivity in incentives, The Accounting Review, 79(2), pp. 409–436.
Gibbs, M., Merchant, K., Van der Stede, W. and Vargus, M. (2009) Performance measure properties
and incentive system design, Industrial Relations, 48(2), pp. 237–264.
Greiner, L. (1998) Evolution and revolution as organizations grow, Harvard Business Review, 76(3),
pp. 55–66.
Groves, T., Hong, J., McMillan, J. and Naughton, B. (1994) Autonomy and incentive in Chinese state
enterprises, Quarterly Journal of Economics, 109, pp. 181–209.
Groves, T., Hong, J., McMillan, J. and Naughton, B. (1995) China’s evolving managerial labor
market, Journal of Political Economy, 103, pp. 873–892.
Harrison, G. and McKinnon, J. (1999) Cross-cultural research in management control system design: a
review of the current state, Accounting, Organizations and Society, 24(5/6), pp. 483–506.
Hexter, J. and Woetzel, J. (2007) Operation China: From Strategy to Operations (Boston, MA:
Harvard Business School Press).
Hofstede, G. (1980a) Culture’s Consequences: International Differences in Work-Related Values
(Beverly Hills, CA: Sage).
Hofstede, G. (1980b) Motivation, leadership and organization: do American theories apply abroad?
Organizational Dynamics, 8, pp. 42–63.
Hofstede, G. (1991) Cultures and Organizations: Software of the Mind (New York: McGraw-Hill).
Hofstede, G. (2001) Culture’s Consequences: Comparing Values, Behaviors, Institutions and Organ-
izations Across Nations, 2n edn (Thousand Oaks, CA: Sage).
Jansen, P., Merchant, K. and Van der Stede, W. (2009) National differences in incentive compensation
practices: the differing roles of financial performance measurement in the United States and the
Netherlands, Accounting, Organizations and Society, 34(1), pp. 58–84.
Performance Measurement and Incentive Compensation 665
Dow
nloa
ded
by [
LSE
Lib
rary
] at
07:
26 2
8 N
ovem
ber
2011
Kirkman, B., Lowe, K. and Gibson, C. (2006) A quarter century of culture’s consequences: a review of
empirical research incorporating Hofstede’s cultural values framework, Journal of International
Business Studies, 37(3), pp. 285–320.
Li, H. and Zhou, L. (2005) Political turnover and economic performance: the incentive role of person-
nel control in China, Journal of Public Economics, 89(9/10), pp. 1743–1762.
Lindsay, R. M. (2007). Making progress in theory development in management accounting research
by focusing on both context and pattern: toward a broader and more respectable role for case
study research. Paper presented at the 6th European Conference on Research Methodology for
Business and Management Studies, Lisbon, Portugal.
Mengistae, T. and Xu, L. (2004) Agency theory and executive compensation: the case of Chinese
state-owned enterprises, Journal of Labor Economics, 22(3), pp. 615–637.
Merchant, K. A. (1989) Rewarding Results: Motivating Profit Center Managers (Boston, MA:
Harvard Business School Press).
Milkovich, G. and Bloom, M. (1998) Rethinking international compensation, Compensation and
Benefits Review, 3(1), pp. 15–23.
Newman, K. and Nollen, S. (1996) Culture and congruence: the fit between management practices and
national culture, Journal of International Business Studies, 27, pp. 753–779.
O’Connor, N., Chow, C. and Wu, A. (2004) The adoption of ‘Western’ management accounting/con-
trols in China’s state-owned enterprises during economic transition, Accounting, Organizations
and Society, 29(3/4), pp. 349–375.
O’Connor, N., Deng, J. and Luo, Y. (2006) Political constraints, organization design and performance
measurement in China’s state-owned enterprises, Accounting, Organizations and Society, 31(2),
pp. 157–177.
Sandino, T. (2007) Introducing the first management control systems: evidence from the retail sector,
The Accounting Review, 82(1), pp. 265–293.
Schneider, S. (1988) National vs. corporate culture: implications for human resource management,
Human Resource Management, 27(2), pp. 231–246.
Schuler, R. and Rogovsky, N. (1998) Understanding compensation practice variations across firms:
the impact of national culture, Journal of International Business Studies, 29(1), pp. 159–177.
Schwartz, S. (1994) Beyond individualism/collectivism: new cultural dimensions of values, in: U.
Kim, H. Triandis, C. Kagitcibasi, S. Choi and G. Yoon (Eds) Individualism & Collectivism:
Theory, Method and Application, pp. 85–199 (Thousand Oaks, CA: Sage).
Shen, J. (2004) Compensation in Chinese multinationals, Compensation and Benefits Review, 36(1),
pp. 15–25.
Shenkar, O. and Ronen, S. (1987) Structure and importance of work goals among managers in the
People’s Republic of China, Academy of Management Journal, 30(3), pp. 564–576.
Smith, P., Peterson, M. and Schwartz, S. (2002) Cultural values, sources of guidance, and their rel-
evance to managerial behavior, Journal of Cross-Cultural Psychology, 33(2), pp. 188–208.
Tinsley, C. (2001) How negotiators get to yes: predicting the constellation of strategies used across
cultures to negotiate conflict, Journal of Applied Psychology, 86, pp. 583–593.
Tosi, H. and Greckhamer, T. (2004) Culture and CEO compensation, Organization Science, 15(6), pp.
657–670.
Tsui, A. (2009) Autonomy of inquiry: shaping the future of emerging scientific communities, Manage-
ment and Organization Review, 5(1), pp. 1–14.
Tsui, A., Nifadkar, S. and Ou, A. (2007) Cross-national cross-cultural organizational behavior
research: advances, gaps and recommendations, Journal of Management, 33(3), pp. 426–478.
Van der Stede, W. (2003) The effect of national culture on management control and incentive system
design in multi-business firms: evidence of intra-corporate isomorphism, European Accounting
Review, 12(2), pp. 263–285.
Werner, S. (2002) Recent developments in international management research: a review of 20 top
management journals, Journal of Management, 28(3), pp. 277–305.
666 K.A. Merchant et al.
Dow
nloa
ded
by [
LSE
Lib
rary
] at
07:
26 2
8 N
ovem
ber
2011
Zhang, K., Song, L., Hackett, R. and Bycio, P. (2006) Cultural boundary of expectancy theory-based
performance management: a commentary on DeNisi and Pritchard’s Performance Improvement
Model, Management and Organization Review, 2(2), pp. 279–294.
Zheng, C. and Morrison, M. (2006) An empirical study of high performance HRM practice in Chinese
SMEs, The International Journal of Human Resource Management, 17(10), pp. 1772–1803.
Performance Measurement and Incentive Compensation 667
Dow
nloa
ded
by [
LSE
Lib
rary
] at
07:
26 2
8 N
ovem
ber
2011