performance management using audit trail
DESCRIPTION
bbcon 2013TRANSCRIPT

10/7/2013 #bbcon 1
Performance Management using Audit Trail PRESENTED BY
DAVID ZEIDMAN AND MOHAMMED DASSER

10/7/2013 #bbcon 2
IF YOU ARE TWEETING…
@ZEIDDEV
@MOHAMMEDDASSER

10/7/2013 #bbcon 3
• Introductions
• Overview of Audit Trail
• What can be Recorded?
• Audit Trail – Tracking the Detail
• Audit Trail – The Bigger Picture
WHAT WE WILL COVER

10/7/2013 #bbcon 4
INTRODUCTIONS

10/7/2013 #bbcon 5
INTRODUCTIONS
David Zeidman, Zeidman Development
http://www.zeidman.info
Mohammed Dasser, University of Central Florida Foundation Inc.
http://ucffoundation.org/
www.ucf.edu
10/7/2013 #bbcon 6
OVERVIEW OF AUDIT TRAIL

10/7/2013 #bbcon 7
RECORD CHANGES

10/7/2013 #bbcon 8
RECORD CHANGES

10/7/2013 #bbcon 9
Changes are Made
to the Record
RECORD CHANGES

10/7/2013 #bbcon 10
RECORD CHANGES

10/7/2013 #bbcon 11
RECORD CHANGES

10/7/2013 #bbcon 12
DIFFERENCES?
Change 1
Change 2
Change 3
Change 4
Change 5

10/7/2013 #bbcon 13
WHAT HAPPENS IF YOU ARE NOT THERE?

10/7/2013 #bbcon 14
AUDIT TRAIL VIEWER

10/7/2013 #bbcon 15
AUDIT VIEWER

10/7/2013 #bbcon 16
WHAT CAN BE TRACKED?

10/7/2013 #bbcon 17
• 30 Record types
• 907 Different Fields
• On Manual Save
• On Import
• On Batch
• On Global Change
• A Lot of Data
AUDIT TRAIL CAN COLLECT:

10/7/2013 #bbcon 18
Training
Protecting Group Data
Data Conversion
Data Validation / Protecting Data Entry
Data Correction
Resource Planning
Performance Analysis
HOW IS AUDIT TRAIL USED?

10/7/2013 #bbcon 19
PROTECTING GROUP DATA

10/7/2013 #bbcon 20
PROTECTING GROUP DATA

10/7/2013 #bbcon 21
PROTECTING GROUP DATA

10/7/2013 #bbcon 22
PROTECTING GROUP DATA
10/7/2013 #bbcon 23
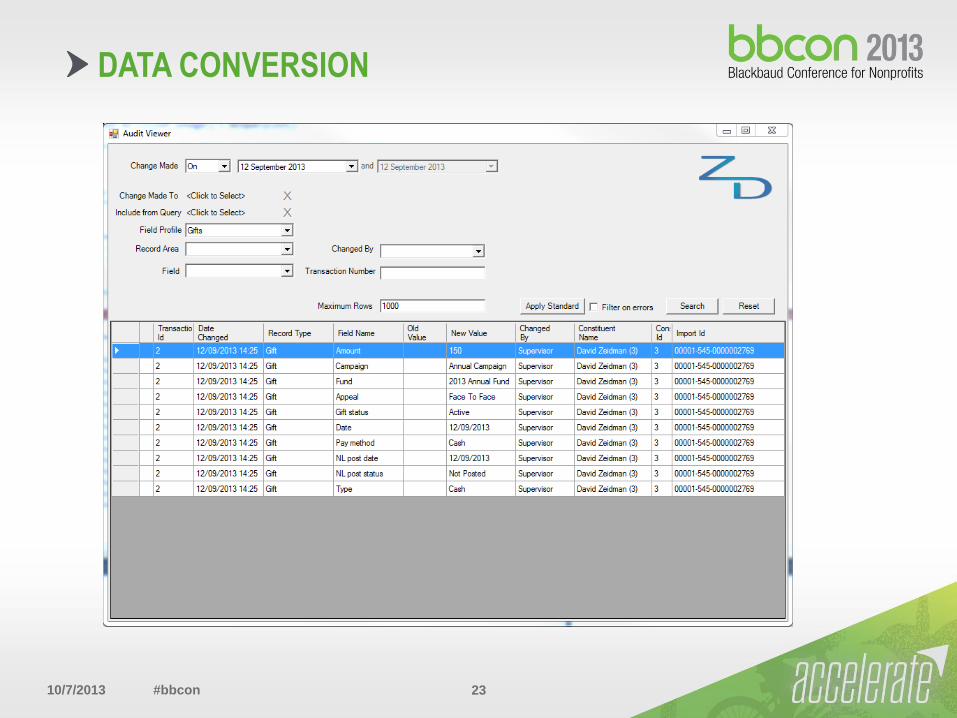
DATA CONVERSION

10/7/2013 #bbcon 24
• Use Field Profiles to get exactly the fields that we want:
DATA CONVERSION

10/7/2013 #bbcon 25
DATA CONVERSION

10/7/2013 #bbcon 26
• When you need to restore a record or part of a record with ease.
BACKUP

10/7/2013 #bbcon 27
BACKUP

10/7/2013 #bbcon 28
TRAINING

10/7/2013 #bbcon 29
TRAINING
10/7/2013 #bbcon 30
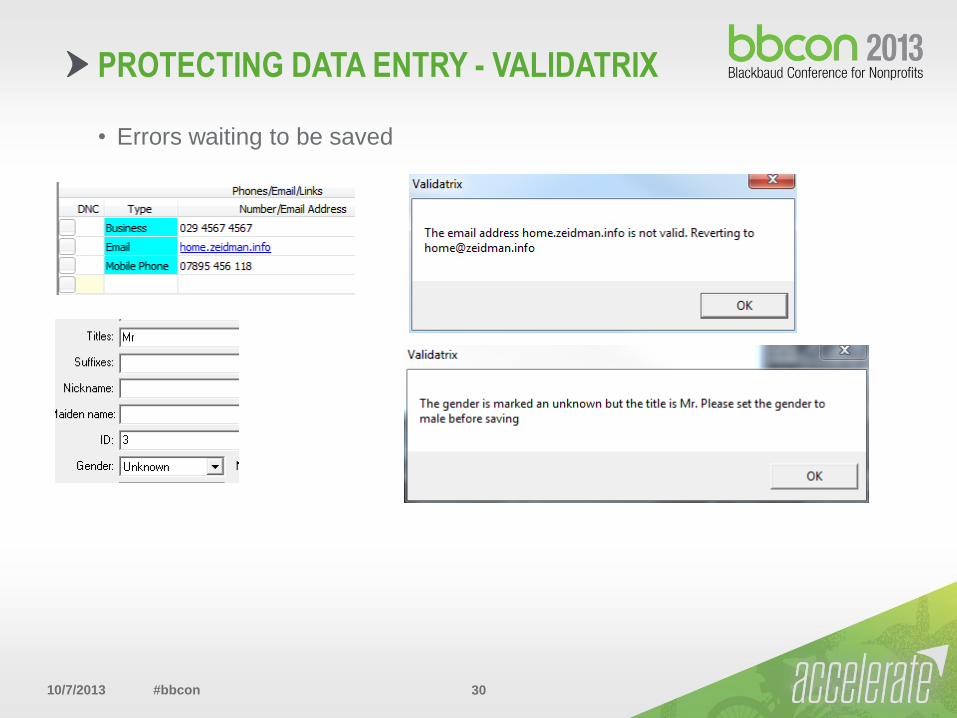
• Errors waiting to be saved
PROTECTING DATA ENTRY - VALIDATRIX

10/7/2013 #bbcon 31
USING COLLECTED TRANSACTIONS
FOR
PERFORMANCE MANAGEMENT

10/7/2013 #bbcon 32
• From The “ZD_Audit” Table: (15 columns + PK)
- Over 5 millions transactions collected in 12 months .
- Updates included 146 fields of 32 record types.
- 98 users participated in generating 198K unique transactions against 109k
constituent’s records.
• From The “Records” Table:
- Total constituent count in the database is over 425K.
Initial Observations:
Total of constituents edited in 12 months is only 25% of the entire database.
Users that participated in the editing is over 80% of the total workforce.
ACTUAL CIRCUMSTANCES:

10/7/2013 #bbcon 33
• To look for symptoms of process deficiency in over 5M rows of data.
• To understand the challenges and the trends.
• To propose enhancements to the data management operation.
• To convince leaders of possibility of better performance.
Solution:
• Build a solution outside of Raiser’s Edge and the “Audit Trail Viewer”
plugin to Analyze Audited transactions.
• Use a basic implementation of multidimensional database for better
performance.
UNDERSTANDING THE CIRCUMSTANCES

10/7/2013 #bbcon 34
• Business Intelligence Solution using the Microsoft BI Stack:
- Integration Services: SSIS
- Analysis Services: SSAS
- Reporting Services: SSRS
- Excel
• Other visualization or reporting tools that can be utilized:
- PerformancePoint on the SharePoint platform
- Tableau
- Business Objects / Crystal report
- Any other tool that support a connection to Microsoft Analysis Services
THE SOLUTION
10/7/2013 #bbcon 35
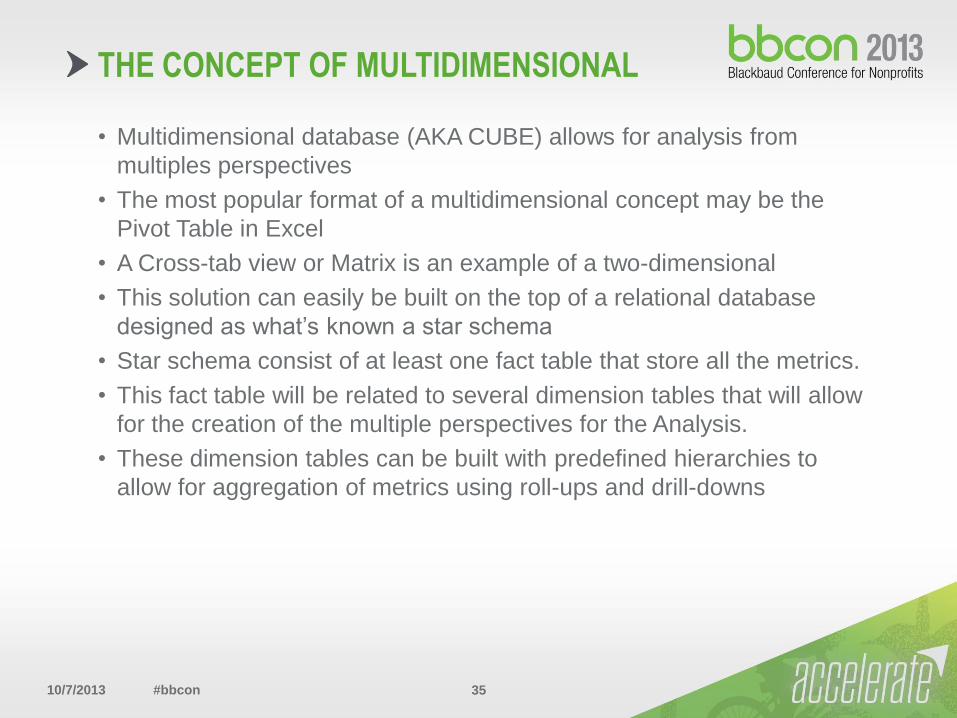
• Multidimensional database (AKA CUBE) allows for analysis from
multiples perspectives
• The most popular format of a multidimensional concept may be the
Pivot Table in Excel
• A Cross-tab view or Matrix is an example of a two-dimensional
• This solution can easily be built on the top of a relational database
designed as what’s known a star schema
• Star schema consist of at least one fact table that store all the metrics.
• This fact table will be related to several dimension tables that will allow
for the creation of the multiple perspectives for the Analysis.
• These dimension tables can be built with predefined hierarchies to
allow for aggregation of metrics using roll-ups and drill-downs
THE CONCEPT OF MULTIDIMENSIONAL

10/7/2013 #bbcon 36
• Multidimensional database (AKA CUBE) allows for analysis from
multiples perspectives
THE CONCEPT OF MULTIDIMENSIONAL
Source: msdn.com

10/7/2013 #bbcon 37
• The most popular format of a multidimensional concept is the Pivot
Table in Excel
• A Cross-tab view or Matrix is an example of a two-dimensional
THE CONCEPT OF MULTIDIMENSIONAL
Source: msdn.com

10/7/2013 #bbcon 38
• This solution can easily be built on the top or a relational database
designed as a star schema.
THE CONCEPT OF MULTIDIMENSIONAL
Source: msdn.com

10/7/2013 #bbcon 39
• This solution can easily be built on the top or a relational database
designed as a star schema.
THE CONCEPT OF MULTIDIMENSIONAL

10/7/2013 #bbcon 40
• Star schema consist of at least one fact table that store all the metrics.
THE CONCEPT OF MULTIDIMENSIONAL

10/7/2013 #bbcon 41
• This fact table will be related to several dimension tables that will allow
for the creation of the multiple perspectives for the Analysis.
THE CONCEPT OF MULTIDIMENSIONAL

10/7/2013 #bbcon 42
• These dimension tables can be built with predefined hierarchies to
allow for aggregation of metric using roll-ups and drill-downs
THE CONCEPT OF MULTIDIMENSIONAL

10/7/2013 #bbcon 43
CONCEPTUAL DESIGN
Fact_Transactions
PK id
FK2 SysIdType
TransactionId
FK6 Fieldid
FK4 ConSysId
FK1 UserChangedId
FK3 Action_ID
FK5 RecordTypeId
FK7 DateDimID
Dim_Date
PK DateDimID
DateChanged
FiscalYear
FiscalQuater
FiscalQuaterName
FiscalMonth
FiscalMonthName
CalendarYear
CalendarQuater
CalendarQuaterName
CalendarMonth
CalendarMonthName
Dim_users
PK UserChangedId
Logon
DisplayName
Departement
JobTitle
SupervisorName
SupervisorAccount
Dim_Constituent
PK ConSysId
ConstituentDescr
ConstituentID
KeyIndicator
FullName
Gender
MaritalStatus
State
Country
ConstituentCode
ConstituentCodeDesc
Age
IsHeadofHousehold
NoValidAddress
NoEmail
IsProspect
IsDeceased
ProspectStatus
Dim_SystemRecordName
PK SysIdType
SystemRecordName
Dim_ActionType
PK Action_ID
ActionType
Dim_RecordType
PK RecordTypeId
RecordType
MetaData
Dim_FieldName
PK fieldId
FieldName

10/7/2013 #bbcon 44
ANALYSIS SERVICES IMPLEMENTATION

10/7/2013 #bbcon 45
ANALYSIS SERVICES IMPLEMENTATION

10/7/2013 #bbcon 46
ANALYSIS SERVICES IMPLEMENTATION

10/7/2013 #bbcon 47
ANALYSIS SERVICES IMPLEMENTATION

10/7/2013 #bbcon 48
ANALYSIS SERVICES IMPLEMENTATION

10/7/2013 #bbcon 49
ANALYSIS SERVICES IMPLEMENTATION

10/7/2013 #bbcon 50
ANALYSIS SERVICES IMPLEMENTATION

10/7/2013 #bbcon 51
ANALYSIS SERVICES IMPLEMENTATION

10/7/2013 #bbcon 52
EXPLORING RESULTS WITH EXCEL

10/7/2013 #bbcon 53
PIVOT TABLE FIELD LIST

10/7/2013 #bbcon 54
USING FILTERS AND DRILL DOWN

10/7/2013 #bbcon 55
USING SORT DIMENSIONS BY METRICS

10/7/2013 #bbcon 56
There are several opportunities for the collected data and here are
some examples:
• User based performance:
Focus on transactions count by user or department
• Constituent based performance:
Focus on transactions on constituent records and constituent type
• Record based performance:
Focus on transactions of each record type and fields
• Fundraising based performance
Focus in the effect of transactions on fundraising
PERFORMANCE MANAGEMENT

10/7/2013 #bbcon 57
There are several opportunities for the collected data and here are
some examples:
• User based performance:
Focus on transactions count by user or department
• Constituent based performance:
Focus on transactions on constituent records and constituent type
• Record based performance:
Focus on transactions of each record type and fields
• Fundraising based performance
Focus in the effect of transactions on fundraising
PERFORMANCE MANAGEMENT

10/7/2013 #bbcon 58
EXPLORING THE RESULTS WITH TABLE
Department
All Transactions
Count Transaction
Distinct Count Constituent
Distinct Count
User Distinct Count
Record Type Distinct Count
Field Distinct Count
Advancement Services 4883699 109035 60382 8 27 144 Information Technology 139816 38161 37711 4 21 130
Alumni Relations 638182 24848 15089 23 22 102
Prospect Research 83145 10986 4814 3 19 80
Development 167032 10400 4475 40 22 96
Comm/Mktg/DR 11880 2507 1537 6 19 95
Operations 14238 976 682 4 15 96 College of Health & Public Affairs 12506 600 490 1 2 18
Athletics Development 3392 245 146 7 10 75
College of Medicine 3691 183 90 1 2 19
Executive 925 110 41 1 6 46
Grand Total 5958506 198039 108637 98 32 146

10/7/2013 #bbcon 59
PLOT OF TWO METRICS
60382
37711
15089
4814 4475 1537 682 490 146 90 41
Transaction Distinct Count Constituent Distinct Count

10/7/2013 #bbcon 60
TOP 5 DEPARTMENTS BY TRANSACTIONS
0 20000 40000 60000 80000 100000 120000
Advancement Services
Information Technology
Alumni Relations
Prospect Research
Development

10/7/2013 #bbcon 61
There are several opportunities for the collected data and here are
some examples:
• User based performance:
Focus on transactions count by user or department
• Constituent based performance:
Focus on transactions on constituent records and constituent type
• Record based performance:
Focus on transactions of each record type and fields
• Fundraising based performance
Focus in the effect of transactions on fundraising
PERFORMANCE MANAGEMENT

10/7/2013 #bbcon 62
TOP 5 CONSTITUENCY BY TIMELINE
0%
10%
20%
30%
40%
50%
60%
70%
80%
90%
100%
Sep 2012 Oct 2012 Nov 2012 Dec 2012 Jan 2013 Feb 2013 Mar 2013 Apr 2013 May 2013 Jun 2013 Jul 2013 Aug 2013
Q3 2012 Q4 2012 Q1 2013 Q2 2013 Q3 2013
2012 2013
Alumni Parent Individual/Friend Student Employee

10/7/2013 #bbcon 63
TOP 10 CONSTITUENTS BY USER COUNT
Constituent ID User Distinct Count Transaction Distinct Count
0000069399 19 47
0000062433 17 41
2008002291 16 45
0000066600 16 32
0000037567 16 43
0000025743 15 44
0000077315 15 57
9100000578 15 35
0000000927 15 33
0000065892 15 53
Grand Total 48 430

10/7/2013 #bbcon 64
There are several opportunities for the collected data and here are
some examples:
• User based performance:
Focus on transactions count by user or department
• Constituent based performance:
Focus on transactions on constituent records and constituent type
• Record based performance:
Focus on transactions of each record type and fields
• Fundraising based performance
Focus in the effect of transactions on fundraising
PERFORMANCE MANAGEMENT

10/7/2013 #bbcon 65
RECORD HIERARCHY UPDATES
Records Transaction Distinct Count Constituent Distinct Count Field Distinct Count
ACTION 150908 90582 39
Action 148796 90347 35
Action Attribute 125347 85335 4
Action Notepad 123228 84567 9
CONSTITUENT 124126 66466 86
GIFT 58934 28095 108
RELATION_SOLICITOR 52850 28523 5
Constituent Solicitor 52850 28523 5
Amount 48181 25822 3
Campaign ID 25 25 1
Solicitor Type 4722 3643 1
RELATION_INDIVIDUAL 6617 3918 23
PARTICIPANT 5460 3308 39
RELATION_ORGANIZATION 1927 1653 4
RELATION_EDUCATION 429 353 13
Grand Total 196114 106913 146

10/7/2013 #bbcon 66
There are several opportunities for the collected data and here are
some examples:
• User based performance:
Focus on transactions count by user or department
• Constituent based performance:
Focus on transactions on constituent records and constituent type
• Record based performance:
Focus on transactions of each record type and fields
• Fundraising based performance
Focus in the effect of transactions on fundraising
PERFORMANCE MANAGEMENT

10/7/2013 #bbcon 67
RECENCY: GIVING VS. LAST UPDATED
Constituent Distinct Count Giving Recency
Last updated 0 - 3 Months 3 - 6 Months 6 - 12 Months 12 - 18 Months 18 - 24 Months 24 - 36 Months 36 - 48 Months 48 - 60 Months 60+ Months Non Donor Grand Total
30 days or less 4309 4853 10420 1310 1499 1656 1782 1455 11753 23612 62649
30-60 days 416 95 231 47 115 88 73 60 327 10310 11762
60-90 days 1116 227 72 96 37 57 59 40 301 1303 3308
90-120 days 114 214 199 214 387 769 778 716 6119 7744 17254
120-180 days 390 900 1129 195 239 321 259 211 1636 5105 10385
180-360 days 47 47 341 14 16 10 20 8 216 294 1013
over a year 84 90 70 19 9 7 5 3 79 176 542
Grand Total 6476 6426 12462 1895 2302 2908 2976 2493 20431 48544 106913
Constituent Distinct Count Giving Recency
Last updated 0 - 3 Months 3 - 6 Months 6 - 12 Months
30 days or less 4309 4853 10420
30-60 days 416 95 231
60-90 days 1116 227 72
90-120 days 114 214 199
120-180 days 390 900 1129
180-360 days 47 47 341
over a year 84 90 70
Grand Total 6476 6426 12462
60+ Months Non Donor
11753 23612
327 10310
301 1303
6119 7744
1636 5105
216 294
79 176
20431 48544

10/7/2013 #bbcon 68
• 3 types of dashboard can be produced:
- Operational,
- Tactical
- Strategic
• Before you begin:
- Need a culture of measurement
- Define your metrics
- Decide your goals / Target
- Set you baseline
• Build your KPI: Key performance Indicator
- Operational: Number of Address updates vs Goal every month
- Tactical: percentage of Alumni records updated vs Goal every semester
• Build your Dashboard / Scorecard
- Multiple Metrics/KPIs on the same page/screen
- Provide filtering capabilities and drill down to detail
- Define thresholds for Alerts
PERFORMANCE DASHBOARD

10/7/2013 #bbcon 69
SAMPLE PERFORMANCE DASHBOARD

10/7/2013 #bbcon 70
• Solution Design and Implementation Considerations:
- Audit data is not available from Raiser’s Edge database
- Audit data will need to be combined with Raiser’s Edge data
for better understanding of the events
- The OLAP/Cube can be deployed on the same SQL server
database that host Raiser’s Edge database
• How to be successful:
- Create a prototype
- Secure strong sponsorship
- Deliver it as a tactical tool
- Use what you already have (Excel, SharePoint, ETC)
TO CONCLUDE

10/7/2013 #bbcon 71
QUESTIONS
David Zeidman, Zeidman Development
http://www.zeidman.info
Mohammed Dasser, University of Central Florida Foundation
http://ucffoundation.org/
www.ucf.edu
ANY QUESTIONS?