performance management system€¦ · performance management system is in its second year. ......
TRANSCRIPT

Performance Management System
Motor Vehicle AdministrationQuarterly Report
October 2017

i
State of Maryland

ii
A Message From the Governor
“Our administration is committed to developing innovative solutions that deliver what Marylanders want – an affordable and reliable transportation system. By implementing
a comprehensive program of accountability and continual improvements, we will deliver a better transportation system for the citizens of Maryland.”
“This is another step our administration is taking to Change Maryland for the Better!”
– Larry Hogan, Governor

iii
Our Mission
The Maryland Department of Transportation and its Transportation Business Units proudly present the official mission statement.
MISSION STATEMENT“The Maryland Department of Transportation is a
customer-driven leader that delivers safe, sustainable,intelligent, and exceptional transportation solutions
in order to connect our customers to life’s opportunities.”
MISSION STATEMENT“The Maryland Department of Transportation is a
customer-driven leader that delivers safe, sustainable,intelligent, and exceptional transportation solutions
in order to connect our customers to life’s opportunities.”

iv
A Message From the Secretary
My Fellow Marylanders,
I am proud that the Maryland Department of Transportation (MDOT) Excellerator Performance Management System is in its second year. We have made great strides in developing and implementing performance measures, refining strategies and focusing on delivering results for our customers.
Over the past year, we have created more than 150 individual performance measures that touch every aspect of our business throughout the organization. Whether we are building and maintaining our roads and bridges, running safe and efficient bus and rail systems, operating an international port and airport or improving the vehicle and driver registration process for Marylanders, we stand strong in our commitment and responsibility to deliver the best transportation products and services for our customers.
Every quarter we review our progress and share our results online for public inspection and within the organization through a live stream of our quarterly review meeting. This allows all 11,000 MDOT employees the opportunity to see the impact of the work they do each day and how they contribute to running a safe and secure transportation system.
Most importantly, we are delivering results. As we respond faster to customer inquiries, become increasingly efficient in using our resources wisely and provide a stronger foundation for economic development for the state, we will continue to deliver exceptional customer service and create more value for those who live and travel throughout Maryland.
I invite you to continue to review our MDOT Excellerator program as we continue down the path of constant progress towards outstanding results.
Pete K. Rahn Secretary

v

vi
A Message From the Administrator
Dear Valued Customer,
On behalf of the proud men and women of the Motor Vehicle Administration (MVA), it is my honor and privilege to provide you with the MDOT Excellerator MVA Quarterly Report. The MDOT Excellerator Performance Management System is a customer-focused program developed and led by Transportation Secretary Pete K. Rahn for the entire organization. It is designed to inspire peak performance through unified responsibility to enable us to better serve all who live and travel throughout the State of Maryland.
The MDOT Excellerator Performance Management System contains 10 Tangible Results designed to exceed customer’s expectations. Throughout MDOT, performance measures will focus on using transportation resources wisely, providing safe and secure transportation experiences and providing exceptional customer service. There are many other Tangible Results MDOT leadership considers important to improve our performance, and all may be viewed within the MDOT Excellerator Performance Management System Quarterly Report.
Here at the MVA, we have identified 11 specific performance measures which directly align with the MDOT-wide Tangible Results. Our measures focus on reducing customer wait times, saving taxpayer money and safeguarding the personal information of our customers.
We are excited to continue on the path of improving our products and services. Each quarter, we will report our results and share with you our performance. While we constantly strive for excellence, we realize that some quarters may fail to meet the high standards we have established in each of our measures. If this occurs, I can assure you we will develop and implement strategies to positively influence the direction of our performance. Our goal is to continually evaluate our products and services and to look for every opportunity to prove we are truly a customer-driven agency.
It is not lost on me that MVA employees are often the face of state government and every single customer interaction is an opportunity to demonstrate our commitment to exceptional service. The MDOT Excellerator Performance Management System will help drive our decisions to exceed our customer’s expectations. Thank you for your interest and time to explore our latest performance results and we look forward to serving you here at the MVA.
Christine Nizer MVA Administrator

vii
Message from Governor Larry Hogan .................................................................................................................................... ii
Maryland Department of Transportation Mission Statement ............................................................................................... iii
Message from Secretary Pete K. Rahn ................................................................................................................................... iv
Message from Administrator Christine Nizer ........................................................................................................................ vi
Table of Contents .................................................................................................................................................................. vii
Performance Measure Index ............................................................................................................................................... viii
Tangible Result 1: Provide Exceptional Customer Service ...................................................................................................... 1
Tangible Result 2: Use Resources Wisely .............................................................................................................................. 15
Tangible Result 3: Provide a Safe and Secure Transportation Infrastructure ........................................................................ 21
Tangible Result 5: Provide an Efficient, Well-Connected Transportation Experience ........................................................... 29
Glossary ................................................................................................................................................................................ 34
Table of Contents
Please refer to the MDOT wide Quarterly Performance Management Report for more performance measures for each of the 10 Tangible Results across all of the Transportation Business Units.

viii
Performance Measures Index
Tangible Results Frequency Driver
Tangible Result # 1: Provide Exceptional Customer Service Sharon Rutzebeck, MVA
MVA 1.1 Percent of Customers Returning to the MVA After a Transaction Has Been Started for a Driver’s License/Identification Card (DL/ID) Product Quarterly Rhashad Johnson, MVA
MVA 1.2 Percent of Transactions Completed From Initial Email (DL/ID Renewals, Vehicle Renewals, VEIP Tests) Prior to Paper Notices Sent Quarterly Patricia Valez, MVA
MVA 1.3 Average Days to Mail Maryland’s Secure DL/ID Products Quarterly Bernie Cumberland, MVA
MVA 1.4 Percent of Electronic Registration and Titling (ERT) Titling Transactions as Compared to Vehicles Sold Quarterly Deborah Rogers, MVA
Tangible Result # 2: Use Resources Wisely Sharon Rutzebeck, MVA
MVA 2.1 Annual Customer Savings Based on VEIP Self-Service Kiosk Usage Quarterly Paul Taylor, MVA
Tangible Result # 3: Provide a Safe and Secure Transportation Infrastructure Sharon Rutzebeck, MVA
MVA 3.1 Percent Increase in Ignition Interlock Program Participants Quarterly Helen Kelly, MVA
MVA 3.2 Percent of Medical Related Cases Closed within 60 Days Quarterly Helen Kelly, MVA
MVA 3.3 Number of Out-of-State Title Fraud Cases Quarterly Eric Danz, MVA
MVA 3.4 Number of Maryland Driver’s License Cancellations Due to Fraud Quarterly Eric Danz, MVA
Tangible Result # 5: Provide An Efficient, Well Connected Transportation Experience Sharon Rutzebeck, MVA
MVA 5.1 Average Branch Visit Time Quarterly Rhashad Johnson, MVA
MVA 5.2 Average Driver’s License Skills Appointment Lead Time (CDL and Non-CDL, in days) Quarterly Rhashad Johnson, MVA

1
Every MDOT employee is responsible for delivering exceptional customer service by providing customers with respectful, timely and knowledgeable responses to all inquiries and interactions.
RESULT DRIVER:
Leslie Dews Motor Vehicle Administration (MVA)
Provide Exceptional Customer Service
TANGIBLE RESULT #1

2
Provide Exceptional Customer Service
TBU COORDINATOR:Sharon Rutzebeck Motor Vehicle Administration (MVA)
PERFORMANCE MEASURE DRIVER:Rhashad Johnson Motor Vehicle Administration (MVA)
PURPOSE OF MEASURE:To track the completion of DL/ID transactions which are completed in one visit.
FREQUENCY:Quarterly
DATA COLLECTION METHODOLOGY:Track and monitor those DL/ID transactions that are completed after more than 12 hours.
NATIONAL BENCHMARK:TBD
PERFORMANCE MEASURE MVA 1.1Percent of Customers Returning to the MVA After a Transaction Has Been Started for a Driver’s License/Identification Card (DL/ID) ProductThe MDOT is continually improving its ability to be responsive to customers because most would like to complete all of their transactions with one trip to the MVA. The MVA endeavors to reduce any impediments by offering various technology enhancements and policy changes.
This measure is important because it can help the Administration better understand the reasons why customers have to make multiple trips to a branch location. This measure is not complete, however, in that it only captures customers that are seen at a counter and an application is started. This measure also only covers the Driver’s License side of the MVA. Customers that complete transactions for Title/ Registrations are not captured in this measure.
This measure offers an opportunity to review process changes that would limit the percentage of customers who return to the MVA to complete their transaction and receive their products. The desired trend for this performance measure is downward.

3
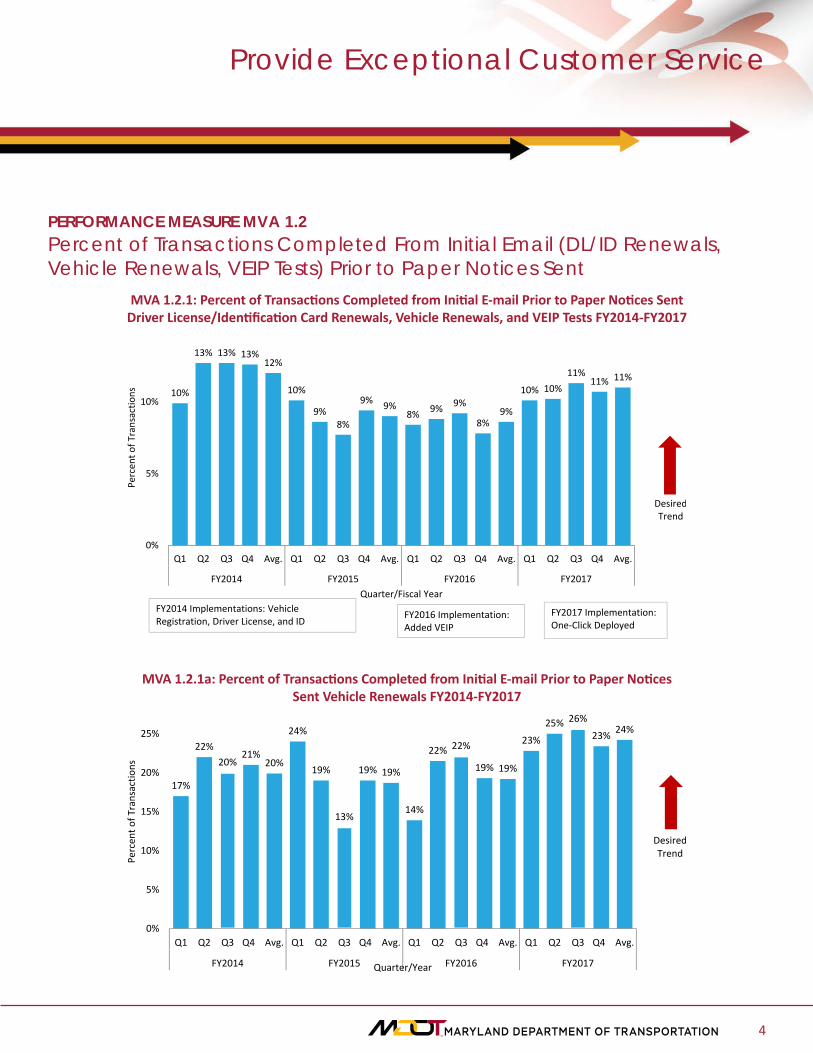
PERFORMANCE MEASURE MVA 1.2Percent of Transactions Completed From Initial Email (DL/ID Renewals, Vehicle Renewals, VEIP Tests) Prior to Paper Notices SentMVA is continuously striving to provide timely communication to customers, quickly and at their convenience. As the collection of customer e-mails increase, MVA can communicate with our customers quickly and efficiently using a variety of methods.
For the period April 1, 2017 – June 30, 2017, the “One Click” feature for registration renewal notices was instrumental in MVA increasing the number of customers completing their transactions after receiving an email renewal notice.
Beginning in March 2017, the MVA began the process of revising the format and template of the emails using best practices. In April 2017, the DL renewal notices were sent using the new format. The format for the remaining emails have been developed , reviewed and scheduled to be sent to customers.
MVA is constantly reevaluating strategies to improve performance such as sending email notifications closer to the expiration date, sending email notifications more often, modifying the message of the email and most recently sending registration renewal notices with “One Click”. With “One Click”, a link placed in the notice which is embedded with vehicle information. When a customer clicks on the link, they are taken directly to the shopping cart, where all the vehicle registration information has been pre-populated.
Provide Exceptional Customer Service
TBU COORDINATOR:Sharon Rutzebeck Motor Vehicle Administration (MVA)
PERFORMANCE MEASURE DRIVER:Patricia Velez Motor Vehicle Administration (MVA)
PURPOSE OF MEASURE:To identify if MVA is meeting its customer needs by providing an opportunity for customers to complete their transactions at their convenience.
FREQUENCY:Quarterly
DATA COLLECTION METHODOLOGY:MVA uses DB2 data collected on the mainframe computer and then the data is analyzed and post processed in MS Excel.
NATIONAL BENCHMARK:TBD
4
PERFORMANCE MEASURE MVA 1.2Percent of Transactions Completed From Initial Email (DL/ID Renewals, Vehicle Renewals, VEIP Tests) Prior to Paper Notices Sent
MVA 1.2.1: Percent of Transactions Completed from Initial E‐mail Prior to Paper Notices SentDriver License/Identification Card Renewals, Vehicle Renewals, and VEIP Tests FY2014‐FY2017
Provide Exceptional Customer Service
10%
13% 13% 13%12%
10%
9%8%
9% 9%8% 9% 9%
8%9%
10% 10%11%
11% 11%
0%
5%
10%
15%
Q1 Q2 Q3 Q4 Avg. Q1 Q2 Q3 Q4 Avg. Q1 Q2 Q3 Q4 Avg. Q1 Q2 Q3 Q4 Avg.
FY2014 FY2015 FY2016 FY2017
Percen
t of T
ransactio
ns
Quarter/Fiscal Year
MVA 1.2.1: Percent of Transactions Completed from Initial E‐mail Prior to Paper Notices SentDriver License/Identification Card Renewals, Vehicle Renewals, and VEIP Tests FY2014‐FY2017
DesiredTrend
FY2016 Implementation: Added VEIP
FY2017 Implementation:One‐Click Deployed
FY2014 Implementations: Vehicle Registration, Driver License, and ID
17%
22%20%
21%20%
24%
19%
13%
19% 19%
14%
22% 22%
19% 19%
23%
25% 26%
23% 24%
0%
5%
10%
15%
20%
25%
30%
Q1 Q2 Q3 Q4 Avg. Q1 Q2 Q3 Q4 Avg. Q1 Q2 Q3 Q4 Avg. Q1 Q2 Q3 Q4 Avg.
FY2014 FY2015 FY2016 FY2017
Percen
t of T
ransactio
ns
Quarter/Year
Chart 1.2.1a: Percent of Transactions Completed from Initial E‐mail Prior to Paper Notices SentVehicle Renewals FY2014‐FY2017
DesiredTrend
MVA 1.2.1a: Percent of Transactions Completed from Initial E‐mail Prior to Paper Notices Sent Vehicle Renewals FY2014‐FY2017

5
3%3%
5%
5%4% 4%
6%
5% 5%4%
4%4%
3%
4%
7%
6%6%
7%
6%
0%
1%
2%
3%
4%
5%
6%
7%
8%
Q1 Q2 Q3 Q4 Avg. Q2 Q3 Q4 Avg. Q1 Q2 Q3 Q4 Avg. Q1 Q2 Q3 Q4 Avg.
FY2014 FY2015 FY2016 FY2017
Percen
t of T
ransactio
ns
Quarter/Year
Chart 1.2.1b: Percent of Transactions Completed from Initial E‐mail Prior to Paper Notices Sent for Driver Licenses FY2014‐FY2017
DesiredTrend
3,345
27,975
21,805 21,557 23,588
27,013
36,591
33,070
‐
5,000
10,000
15,000
20,000
25,000
30,000
35,000
40,000
0%
2%
4%
6%
8%
10%
12%
14%
16%
18%
20%
Q1 Q2 Q3 Q4 Q1 Q2 Q3 Q4
FY2017 FY2017
Volume Co
mpleted
Prio
r to Pa
per M
ailin
g
Percen
t Com
pleted
Quarter/Year
Chart 1.2.1c: Percent of Transactions Completed from Initial E‐mail Prior to Paper Notices Sent for Vehicle Emissions FY2016‐FY2017
DesiredTrend
PERFORMANCE MEASURE MVA 1.2Percent of Transactions Completed From Initial Email (DL/ID Renewals, Vehicle Renewals, VEIP Tests) Prior to Paper Notices Sent
MVA 1.2.1b: Percent of Transactions Completed from Initial E‐mail Prior to Paper Notices Sent for Driver Licenses FY2014‐FY2017
Provide Exceptional Customer Service
MVA 1.2.1c: Percent of Transactions Completed from Initial E‐mail Prior to Paper Notices Sent for VehicleEmissions FY2016‐FY2017

6
PERFORMANCE MEASURE MVA 1.3Average Days to Mail Maryland’s Secure DL/ID ProductsIn an effort to continually modernize and ensure the security of products and services that are provided by the MVA, newly designed secure driver’s licenses and identification cards were issued throughout Maryland beginning in July 2016. These new cards have embedded security features to protect personal information and to reduce fraudulent reproduction of these products. In addition, to further protect personal information, the new cards are printed and mailed from a high-security MVA facility.
With the implementation of Maryland’s Secure ID, MVA customers would like timely receipt of their DL/ID in the postal mail. MVA will monitor the average number of days that it takes to mail all Maryland Secure DL/ID products from the central issuance facility. Currently, the MVA has set a goal of 4 days to process and mail Maryland’s Secure DL/ID products. DL/ID mailings are completed in 4.2 days in Quarter 4, which includes an average of 3 days for sorting and First Class USPS processing.
Provide Exceptional Customer Service
TBU COORDINATOR:Sharon Rutzebeck Motor Vehicle Administration (MVA)
PERFORMANCE MEASURE DRIVER:Bernie Cumberland Motor Vehicle Administration (MVA)
PURPOSE OF MEASURE:To identify the timeliness in processing and mailing customer DL/IDs.
FREQUENCY:Quarterly
DATA COLLECTION METHODOLOGY:Comparison of customer visit date to actual date product provided to U.S. Postal Service (USPS) for processing and mailing. Reporting period started July 1, 2016.
NATIONAL BENCHMARK:MVA will issue DL/ID products within 4 days for processing by the USPS. Data from other states depict a 7-10 average delivery to the customer.

7
PERFORMANCE MEASURE MVA 1.3Average Days to Mail Maryland’s Secure DL/ID ProductsMVA 1.3.1: Average Number of Days to Mail Centrally‐Issued Driver Licenses/Identification Cards (Regular Mail) FY2017
Provide Exceptional Customer Service
Chart 1.3.2: Average Days to Mail Centrally‐Issued Driver Licenses/Identification Cards (Expedited Mail) FY2017
4.1 4 4.1 4.2
Goal, 7 days
323,317 309,092
376,693 371,442
‐
50,000
100,000
150,000
200,000
250,000
300,000
350,000
400,000
0
1
2
3
4
5
6
7
8
Q1 Q2 Q3 Q4
FY2017
Volume Mailed
Num
ber o
f Days
Quarter/Year
Chart 1.3.1: Average Number of Days to Mail Centrally‐Issued Driver Licenses/Identification Cards (Regular Mail) FY2017
Number of Days Goal Volume
0.80.9 0.9
0.8
Goal, 1‐2 days
24,232
21,164
22,226 22,351
19,500
20,000
20,500
21,000
21,500
22,000
22,500
23,000
23,500
24,000
24,500
0
0.2
0.4
0.6
0.8
1
1.2
1.4
1.6
1.8
2
Q1 Q2 Q3 Q4
FY2017
Volume Mailed
Num
ber o
f Days
Quarter/Year
Chart 1.3.2: Average Days to Mail Centrally‐Issued Driver Licenses/Identification Cards (Expedited Mail) FY2017
Total Number of Days Goal Volume Mailed

8
PERFORMANCE MEASURE MVA 1.3Average Days to Mail Maryland’s Secure DL/ID Products
MVA 1.3.3: Average Number of Days to Produce a Centrally‐Issued Driver License/Identification Card CY2016‐CY2017
Provide Exceptional Customer Service
1.2
1 1 1.1
1.1
0.9
1 1 1.3
1.2
1.1
1.3
0.4
0.3
0.3
0.4
0.4
0.3
0.4
0.3
0.5
0.4
0.3
0.3
96
137
115122
96
112
127122
150
134143
149
0
20
40
60
80
100
120
140
160
0
0.2
0.4
0.6
0.8
1
1.2
1.4
Jul Aug Sep Oct Nov Dec Jan Feb Mar Apr May Jun
CY2016 CY2017
Volume Prod
uced
(tho
usands)
Num
ber o
f Days
Month/Year
Chart 1.3.3: Average Number of Days to Produce a Centrally‐Issued Driver License/Identification Card CY2016‐CY2017
Non‐Expedited Expedited Volume

9
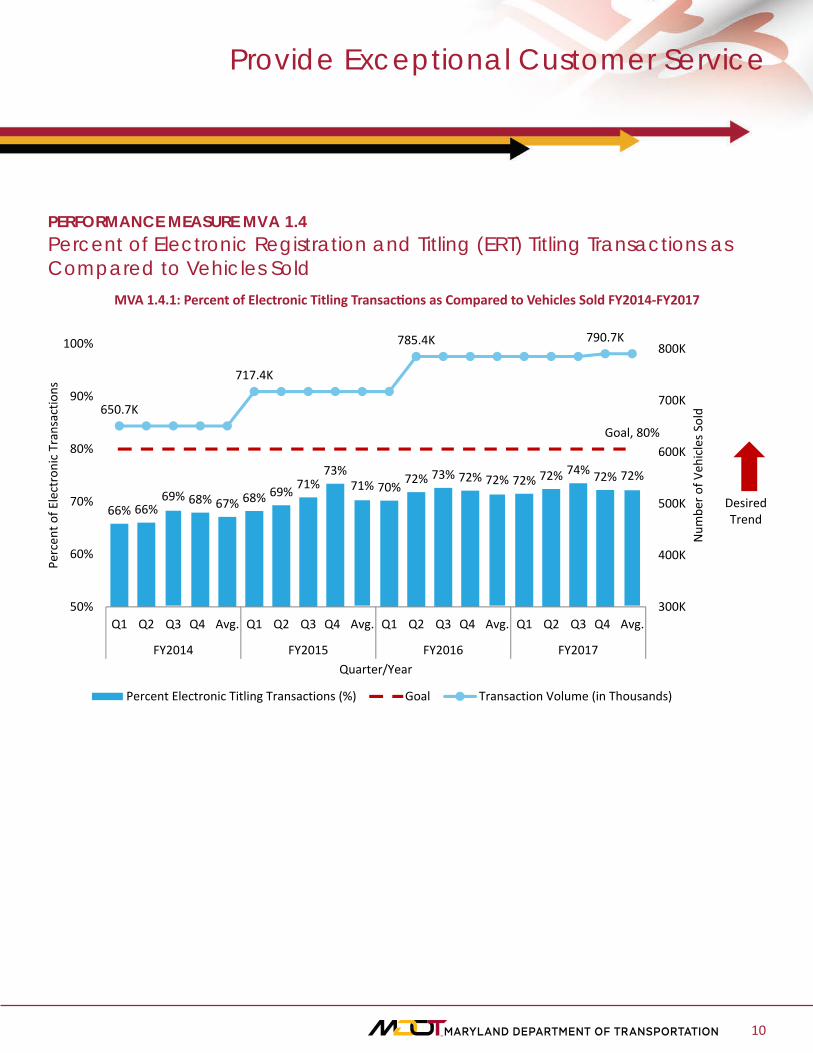
PERFORMANCE MEASURE MVA 1.4Percent of Electronic Registration and Titling (ERT) Titling Transactions as Compared to Vehicles SoldThis measure will monitor the percent of titling transactions completed using ERT as compared to new and used vehicles sold. The comparison to new and used vehicles sold shows those titling transactions which are most eligible for ERT.
Over 96% of all new car dealers in Maryland are using ERT to process registration and title transactions. Participating ERT partners can electronically submit title and registration transactions to MVA. Submitting electronically through ERT is a convenience and time savings to our customers. The current data shows a trend upwards as is desired. MVA has taken a collaborative effort to meet and train dealerships in boarder states (Delaware, Pennsylvania) in using ERT to process MD titling transactions. Regulations have been implemented to have all eligible dealerships using ERT over the next 2 years.
Provide Exceptional Customer Service
TBU COORDINATOR:Sharon Rutzebeck Motor Vehicle Administration (MVA)
PERFORMANCE MEASURE DRIVER:Deborah Rogers Motor Vehicle Administration (MVA)
PURPOSE OF MEASURE:To identify the ability for customers to complete titling transactions conveniently.
FREQUENCY:Quarterly
DATA COLLECTION METHODOLOGY:MVA uses TARIS, SR320, MTR (compiled) databases to determine the ERT transactions and walk-in Vehicle Registration and Titling transactions.
NATIONAL BENCHMARK:TBD
10
PERFORMANCE MEASURE MVA 1.4Percent of Electronic Registration and Titling (ERT) Titling Transactions as Compared to Vehicles Sold
MVA 1.4.1: Percent of Electronic Titling Transactions as Compared to Vehicles Sold FY2014‐FY2017
Provide Exceptional Customer Service
66% 66%69% 68% 67% 68% 69% 71%
73%71% 70% 72% 73% 72% 72% 72% 72% 74% 72% 72%
Goal, 80%
650.7K
717.4K
785.4K 790.7K
300K
400K
500K
600K
700K
800K
50%
60%
70%
80%
90%
100%
Q1 Q2 Q3 Q4 Avg. Q1 Q2 Q3 Q4 Avg. Q1 Q2 Q3 Q4 Avg. Q1 Q2 Q3 Q4 Avg.
FY2014 FY2015 FY2016 FY2017
Num
ber o
f Veh
icles S
old
Percen
t of E
lectronic Transactions
Quarter/Year
Chart 1.4.1: Percent of Electronic Titling Transactions as Compared to Vehicles Sold FY2014‐FY2017
Percent Electronic Titling Transactions (%) Goal Transaction Volume (in Thousands)
DesiredTrend

11
MDOT receives resources from customers and they expect products and services in return. To better serve customers, MDOT must maximize the value of every dollar we spend.
RESULT DRIVER:
Corey Stottlemyer The Secretary’s Office (TSO)
Use Resources Wisely
TANGIBLE RESULT #2
12
TBU COORDINATOR:Sharon Rutzebeck Motor Vehicle Administration (MVA)
PERFORMANCE MEASURE DRIVER:Paul Taylor Motor Vehicle Administration (MVA)
PURPOSE OF MEASURE:To monitor how lower fees for VEIP self-service kiosk have been a benefit to customers.
FREQUENCY:Quarterly
DATA COLLECTION METHODOLOGY:MVA uses VenDoc, IntelliTrack database to determine the VEIP kiosks usage.
NATIONAL BENCHMARK:VEIP kiosk usage goal, 14% of eligible vehicles; there are currently 900k eligible vehicles in Maryland.
PERFORMANCE MEASURE MVA 2.1Annual Customer Savings Based on VEIP Self-Service Kiosk UsageLower taxes and fees represent a cost savings to the public, which puts money back into their pockets. Customers appreciate whenever there is an added savings to the regulatory products that they are required to complete. As part of the Governor’s fee reduction initiatives, there was a $4 savings for using the self-service VEIP kiosks. Maryland is one of only two states to have introduced the technology to self-test at VEIP kiosks. MVA started a pilot in August of 2015 with only 2 kiosks. The program expanded in February 2016 to include additional kiosks and more access to savings for the public.
There are currently ten kiosk locations across the VEIP testing areas. With sixty percent of the 1.5 million annual testable population eligible to use this technology, this makes for a huge cost savings to Maryland residents. MVA is at the forefront of technology to offer efficiency in services for customers.
The trend for this performance measure is desired as upward for both cost savings and number of self-service VEIP kiosk transactions. Over the past Fiscal Year FY2017, MDOT added 8 VEIP kiosks for a total of 10 VEIP kiosks.
Use Resources Wisely

13
PERFORMANCE MEASURE MVA 2.1Annual Customer Savings Based on VEIP Self-Service Kiosk Usage
MVA 2.1.1: VEIP Self‐Service Kiosk Tests & Customer Savings February 2016 ‐ February 2017
Use Resources Wisely
$972
$1,200
$2,780
$4,216
$5,596
$8,048
$8,452
$8,976
$11,60
8
$10,00
0
$9,560
$12,15
6
$11,36
4
243 300
695
1,054
1,399
2,012 2,113
2,244
2,902
2,500 2,390
3,039
2,841
‐
500
1,000
1,500
2,000
2,500
3,000
3,500
$0
$5,000
$10,000
$15,000
Feb Mar Apr May Jun Jul Aug Sep Oct Nov Dec Jan Feb
CY2016 CY2017
Num
ber o
f Kiosks T
ests
Savings ($)
Month/Calendar Year
MVA 2.1.1: VEIP Self‐Service Kiosks Test & Customer Savings February 2016 ‐ February 2017
Savings ($) Number of Kiosks Tests
DesiredTrend
87%92% 91% 90% 90% 90% 91% 91% 91% 90% 91% 90% 91% 91% 90%
Goal, 100%
0%
10%
20%
30%
40%
50%
60%
70%
80%
90%
100%
110%
May Jun Jul Aug Sep Oct Nov Dec Jan Feb Mar Apr May Jun Jul
CY2016 CY2017
Satisfaction Ra
ting
Month/Calendar Year
MVA 2.1.2 : VEIP Self‐Service Customer Satisfaction Rating May 2016 ‐ July 2017
Satisaction Rating Goal
MVA 2.1.2 : VEIP Self‐Service Customer Satisfaction Rating May 2016 ‐ July 2017

14
PERFORMANCE MEASURE MVA 2.1Annual Customer Savings Based on VEIP Self-Service Kiosk Usage
MVA 2.1.3: Kiosk Usage by Time of Day October 2016 ‐ July 2017
Use Resources Wisely
1 3 2 4 9
67
255
394
574
768
731 699
472
414
289
226
184
128
7
5
0
500
1,000
1,500
2,000
2,500
3,000
3,500
4,000
Num
ber o
f Kiosk Tests
Time of Day
MVA 2.1.3: Kiosk Usage by Time of Day October 2016 ‐ July 2017
Sun Mon Tue Wed Thu Fri Sat

15
MDOT will not compromise on the commitment to continually improve the safety and security of customers and partners in everything we do.
RESULT DRIVER:
Sarah Clifford Maryland Transportation Authority (MDTA)
Provide a Safe and Secure Transportation Infrastructure
TANGIBLE RESULT #3

16
Provide a Safe and Secure Transportation Infrastructure
TBU COORDINATOR:Sharon Rutzebeck Motor Vehicle Administration (MVA)
PERFORMANCE MEASURE DRIVER:Helen Kelly Motor Vehicle Administration (MVA)
PURPOSE OF MEASURE:To monitor the number of participants in the Ignition Interlock Program.
FREQUENCY:Quarterly
DATA COLLECTION METHODOLOGY:MVA uses DIWS, Excel (compiled) database to determine the Ignition Interlock Program participants. Data reporting to begin Winter 2016.
NATIONAL BENCHMARK:TBD
PERFORMANCE MEASURE MVA 3.1Percent Increase in Ignition Interlock Program ParticipantsMVA has adopted the “Towards Zero Death” campaign to reduce highway deaths until they reach zero. This campaign covers some of Maryland’s most dramatic highway safety problems including impaired driving, seatbelt use, and speeding.
The purpose of this measure is to monitor the increase of persons into the Ignition Interlock Program which will help to reduce the number of unsafe drunk drivers on the road. The Ignition Interlock Program is designed to track and monitor those persons who are charged with an alcohol related offense. Inclusion can be voluntary (pre-conviction) or mandatory (post-conviction). Recent legislation has made the Ignition Interlock Program mandatory for those persons who are stopped with alcohol related offenses (including pre-conviction). MVA is one of the most robust and defined Ignition Interlock Programs in the country.
As this dataset is currently being refined based on new legislation, the efforts have been on defining the data definitions and scrubbing the data to reflect the performance measure more accurately. Data collection and reporting is anticipated to begin Fall 2017.

17
PERFORMANCE MEASURE MVA 3.2Percent of Medical Related Cases Closed within 60 DaysMVA through the Office of Driver Wellness and Safety is responsible for reviewing medical related cases and referrals. These are cases that have been referred to the MVA because the driver was deemed to have a medical stipulation which may hinder their ability to drive. Maryland’s medical case review process has been tailored to other DMVs across the country; however, MVA is different because nurses and doctors are on staff to support in the review and recommendation of medical cases.
As shown in Chart 3.2.1, this measure monitors the number of medical related cases which are closed within 60 days. As this is a dynamic process that requires the customer to provide required legal, physician or other official documentation; for optimal efficiency, it has been determined that the cases should be closed within the 60-day timeframe. At the end of Q4 FY2017, 98% of medical cases reflected closed within 60 days. The average 82% FY2017 overall result reflects a positive trend from the average 65% result of FY2016.
The MVA has implemented several processes which allow for the medical staff to have a more balanced case load, giving the ability to focus on customers who require more critical attention. As these processes have been implemented and maintained, the result has been an overall reduction in the total amount of medical cases open for review.
Provide a Safe and Secure Transportation Infrastructure
TBU COORDINATOR:Sharon Rutzebeck Motor Vehicle Administration (MVA)
PERFORMANCE MEASURE DRIVER:Helen Kelly Motor Vehicle Administration (MVA)
PURPOSE OF MEASURE:To monitor the customer medical case processing rate.
FREQUENCY:Quarterly
DATA COLLECTION METHODOLOGY:MVA DIWS, Excel (compiled) database to collect the data.
NATIONAL BENCHMARK:60 days

18
PERFORMANCE MEASURE MVA 3.2Percent of Medical Related Cases Closed within 60 Days
MVA 3.2.1: Percent of Medical‐Related Cases Closed Within 60 Days Q2 FY2014‐Q4 FY2017
Provide a Safe and Secure Transportation Infrastructure
100%
94%
92%
95%
77%
62%
61%
79%
70%
71%
70%
56%
63%
65%
68%
77%
84%
98%
82%
Benchmark, 100%
43,227
52,564
34,973
-
10,000
20,000
30,000
40,000
50,000
60,000
0%
20%
40%
60%
80%
100%
Q2 Q3 Q4 Avg. Q1 Q2 Q3 Q4 Avg. Q1 Q2 Q3 Q4 Avg. Q1 Q2 Q3 Q4 Avg.
FY2014 FY2015 FY2016 FY2017
Num
ber o
f Med
ical
-Rel
ated
Cas
es
Perc
ent o
f Med
ical
-Rel
ated
Cas
es
Quarter/Year
Chart 3.2.1: Percent of Medical-Related Cases Closed Within 60 Days Q2 FY2014-Q4 FY2017
Percent Benchmark Volume of Cases
FY2016 Implementation: Electronic Referrals
FY16 Implementation: Electronic Referrals

19
PERFORMANCE MEASURE MVA 3.3Number of Out-of-State Title Fraud CasesThe safety and security of the transportation infrastructure is dependent on the comprehensive management and oversight of Maryland’s transportation regulatory processes. This measure will monitor vehicles titled in Maryland for possible fraudulent, altered and/or counterfeit out-of-state vehicle titles.
The MVA is the only motor vehicle agency in the nation that has investigators who “touch” every out of state title used to title a vehicle in Maryland; the investigators are experts in detecting counterfeit and altered titles. The staff was awarded the 2016 Fraud Prevention and Detection Award from the American Association of Motor Vehicle Administrators (AAMVA) for their work in these efforts.
The fraudsters use out of state titles because they are harder to detect by front line MVA employees and therefore easier to pass or conceal an alteration. The fraudulent titles are used to “wash” liens, salvage brands and re-plate stolen vehicles. The MVA receives grant funding from the Vehicle Theft Prevention Council (VTPC) to pay for a second investigator and to offset the costs of separating the thousands of foreign titles that come into Maryland each year. Unfortunately, the investigator paid by the VTPC resigned for another state position in May 2017 and as of October 1, 2017 the position remains vacant.
The desired trend for this performance measure is downward. The MVA will continue to positively influence this downward trend by training MVA’s front line staff; tag and title employees, and eventually performing real time queries of NMVTIS.
Provide a Safe and Secure Transportation Infrastructure
TBU COORDINATOR:Sharon Rutzebeck Motor Vehicle Administration (MVA)
PERFORMANCE MEASURE DRIVER:Eric Danz Motor Vehicle Administration (MVA)
PURPOSE OF MEASURE:To monitor the number of out-of-state title fraud cases.
FREQUENCY:Quarterly
DATA COLLECTION METHODOLOGY:MVA uses an MS Excel spreadsheet and a Case Management System to track and monitor out-of-state title fraud cases. Total out-of-state titles compared to identified title fraud cases.
NATIONAL BENCHMARK:Developing

20
PERFORMANCE MEASURE MVA 3.3Number of Out-of-State Title Fraud Cases
MVA 3.3.1: Number of Out of State Title Fraud Cases CY2012‐CY2016
Provide a Safe and Secure Transportation Infrastructure
60.0K
412.3K
682.5K
250.5K
390.0K
424 705 264 325
0.15%
0.10% 0.10%0.11%
0.08%
Goal, 0.15%
0.00%
0.05%
0.10%
0.15%
0.20%
0K
100K
200K
300K
400K
500K
600K
700K
CY2012 (Inception) CY2013 CY2014 CY2015 CY2016
Percen
t of C
ases
Num
ber o
f Cases
Year
Chart 3.3.1: Number of Out of State Title Fraud Cases CY2012‐CY2016
Number of Titles Examined Number of Title Fraud Cases Found
Percent of Title Fraud Cases Found Goal
DesiredTrend

21
PERFORMANCE MEASURE MVA 3.4Number of Maryland Driver’s License Cancellations Due to FraudProtecting the identity for Maryland residents is important, therefore MVA is aware of the significance of reviewing documents when submitted to obtain a driver’s license. The document review process requires that customer agents are trained to detect and preempt when there are potential inconsistencies with any documents. Over time, MVA finds most of the fraudulent documents are related to residency.
Over 95% of Maryland’s driver’s license cancellations are related to address or residency fraud where residents from other states travel to Maryland to obtain a driver’s license. Customers may provide false address documents to certify that they reside in Maryland. MVA Investigators learn about the possible fraud activity from various sources including returned MVA mail, awareness of customer agents or a third party complaint.
Cancellations due to fraud have been increasing due to better detection methods and techniques. The Investigations Division is now receiving a list from the Comptroller’s Office which provides the names and assigned letters from the Comptroller which verify payment of taxes and address. This is a process identifying Comptroller Letters that are being used by more than one individual. This will increase the number of instances where fraud is detected.
In April 2017, the MVA created a database of addresses listed to fifteen (15) or more driver’s licenses and/or ID cards, i.e., bad address database. Fifteen or more MVA products associated with one address is an indicator of possible fraudulent activity. Any MVA transactions associated with that address requires the customer to meet personally with an investigator who verifies the customer’s address. Through August of 2017, the MVA cancelled 170 licenses after interviewing customers identified through the bad address database.
Although, the desired trend is to decrease DL fraud, these changes in strategies have resulted in an increase in the number of driver license cancellations due to fraud, because we are detecting fraud that previously went undetected.
Provide a Safe and Secure Transportation Infrastructure
TBU COORDINATOR:Sharon Rutzebeck Motor Vehicle Administration (MVA)
PERFORMANCE MEASURE DRIVER:Eric Danz Motor Vehicle Administration (MVA)
PURPOSE OF MEASURE:To assess MVA’s ability to detect driver’s license fraud by monitoring the number of driver’s licenses (DL) cancelled for fraud.
FREQUENCY:Quarterly
DATA COLLECTION METHODOLOGY:MVA uses an MS Excel spreadsheet and a Case Management System to track and monitor DL fraud cases and cancellations.
NATIONAL BENCHMARK:TBD

22
PERFORMANCE MEASURE MVA 3.4Number of Maryland Driver’s License Cancellations Due to Fraud
MVA 3.4.1: Number of Driver’s License Cancellations Due to Fraud FY2014‐FY2017
Provide a Safe and Secure Transportation Infrastructure
30
156
281
344
0
50
100
150
200
250
300
350
FY2014 FY2015 FY2016 FY2017
Num
ber o
f Cancellatio
ns
Fiscal Year
MVA 3.4.1: Number of Driver's License Cancellations Due to Fraud FY2014‐FY2017

23
MDOT will provide an easy, reliable transportation experience throughout the system. This includes good connections and world class transportation facilities and services.
RESULT DRIVER:
Phil Sullivan Maryland Transit Administration (MTA)
Provide an Efficient, Well-Connected Transportation Experience
TANGIBLE RESULT #5

24
Provide an Efficient, Well-Connected Transportation Experience
PERFORMANCE MEASURE MVA 5.1Average Branch Visit TimeBranch visit time is important to our customers and the MVA because it looks at the measurable time each customer spends in a branch. It accounts for the both the wait time and transaction service time each customer experiences after receiving their Customer Traffic Management (CTM) system ticket.
MVA continues to leverage technology by increasing the amount of services that are offered via the MVA website and kiosk. This will reduce the number of customers that must invest their time, effort and money visiting a branch. While increasing the number of available Customer Agents to handle new or complex transactions.
Initiatives implemented include using greeters to electronically screen customers as they enter the building to identify if they are eligible to complete their transaction using a kiosk, Internet Kiosk, or online versus waiting in-line. In addition, MVA added the ability to use handheld tablets to complete tag return transactions eliminating the need to wait in-line. These new initiatives assisted in reducing visit times during MVA’s busiest time period.
TBU COORDINATOR:Sharon Rutzebeck Motor Vehicle Administration (MVA)
PERFORMANCE MEASURE DRIVER:Rhashad Johnson Motor Vehicle Administration (MVA)
PURPOSE OF MEASURE:To monitor total visit time a customer spends in a branch office to complete their transaction.
FREQUENCY:Quarterly
DATA COLLECTION METHODOLOGY:MVA uses CTM to collect this data.
NATIONAL BENCHMARK:22 Min Visit Time
MVA Goal 21 Min

25
PERFORMANCE MEASURE MVA 5.1Average Branch Visit Time
MVA 5.1.1 Average Branch Visit Time (VT) FY2014‐FY2017
Provide an Efficient, Well-Connected Transportation Experience
33.8
24.730.0
23.828.1
23.917.6
21.0 23.9 21.627.6
20.5 23.2 22.5 23.5 23.7 21.2 20.5 20.5 21.5
7.5
7.6
7.7
8.4
7.7
7.4 8.69.2
9.18.7
9.4
9.79.8 9.8 9.6 9.6
9.4 9.4 9.9 9.6Benchmark,
22.0
0
5
10
15
20
25
30
35
40
45
Q1 Q2 Q3 Q4 Avg. Q1 Q2 Q3 Q4 Avg. Q1 Q2 Q3 Q4 Avg. Q1 Q2 Q3 Q4 Avg.
FY2014 FY2015 FY2016 FY2017
Time in M
inutes
Quarter/Fiscal Year
MVA 5.1.1 Average Branch Visit Time (VT) FY2014‐FY2017
Wait Time Service Time Benchmark
VT 35.8VT 30.3
VT 33.1VT 31.1
DesiredTrend

26
PERFORMANCE MEASURE MVA 5.2Average Driver’s License Skills Appointment Lead Time (CDL and Non-CDL, in days)Customers would like to have a quick turnaround time when scheduling their driving skills test as compared to the completion of their law knowledge testing (learner’s permit).
The availability of driver’s skills test appointments is part of the seamless processing to ensure that MDOT customers can complete their transactions efficiently. This is a measure of the lead time it takes to schedule a Driver’s Skills test appointment, as the customer would like to schedule their test appointment as close to their eligibility date as possible.
Overall the current trend shows a decrease in the average days to obtain a driving skills appointment, which is in-line with the desired outcome. Present performance results for non-CDL lead time appointments are continuing to reduce to meet the target of 1 day. CDL appointment lead times remain within the identified target of 10 days.
Provide an Efficient, Well-Connected Transportation Experience
TBU COORDINATOR:Sharon Rutzebeck Motor Vehicle Administration (MVA)
PERFORMANCE MEASURE DRIVER:Rhashad Johnson Motor Vehicle Administration (MVA)
PURPOSE OF MEASURE:To monitor how responsive MVA is to customers by offering the CDL and non-CDL appointments at the customer’s convenience.
FREQUENCY:Quarterly
DATA COLLECTION METHODOLOGY:MVA uses CSS database to track and monitor driver’s license test appointments for Commercial Driver’s License (CDL) and Non-Commercial Driver’s License (non-CDL) skills tests.
NATIONAL BENCHMARK:Non CDL – 10 days
CDL – 21 days
*MVA target

27
Provide an Efficient, Well-Connected Transportation Experience
PERFORMANCE MEASURE MVA 5.2Average Driver’s License Skills Appointment Lead Time (CDL and Non-CDL, in days)
MVA 5.2.1: Average Driver’s Skills Appointment Lead Time in DaysCommercial Driver Licenses FY2016‐FY2017
MVA 5.2.2: Average Driver’s Skills Appointment Lead Time in Days for Non‐Commercial Driver Licenses FY2014‐FY2017
21
18
Benchmark, 10 days
7.7K
8.0K
0K
2K
4K
6K
8K
10K
1
6
11
16
21
26
FY2016 FY2017
Num
ber o
f App
ointmen
ts Sched
uled
Lead
Tim
e (days)
Fiscal Year
MVA 5.2.1: Average Driver's Skills Appointment Lead Time in DaysCommercial Driver Licenses FY2016‐FY2017
Lead Time Benchmark Number of Appointments Scheduled
Desired Trend
17
53
23
5
65.2K
56.7K
54.6K
61.5K
40K
45K
50K
55K
60K
65K
70K
0
10
20
30
40
50
60
FY2014 FY2015 FY2016 FY2017
Num
ber o
f App
ointmen
ts Set
Lead
Tim
e (days)
Fiscal Year
MVA 5.2.2: Average Driver's Skills Appointment Lead Time in Days for Non‐Commercial Driver Licenses FY2014‐FY2017
Lead Time Days Number of Appointments Scheduled
Benchmark: 1 day

28
Glossary
All Electronic Tolling (AET) – Collection of tolls at highway speeds using E-ZPass transponders or video tolling; no toll booths or cash collection.
Annual Attainment Report on Transportation System Performance – Pursuant to Transportation Article Section 2-103.1 of the Annotated Code of Maryland, the State is required to develop or update an annual performance report on the attainment of transportation goals and benchmarks in the Maryland Transportation Plan (MTP) and Consolidated Transportation Program (CTP). The Attainment Report must be presented annually to the Governor and General Assembly before they may consider the MTP and CTP.
Calendar Year (CY) – The period of 12 months beginning January 1 and ending December 31 of each reporting year.
Coordinated Highways Action Response Team (CHART) – CHART is an incident management system aimed at improving real-time travel conditions on Maryland’s highway system. CHART is a joint effort of the State Highway Administration, Maryland Transportation Authority and the Maryland State Police, in cooperation with other federal, state and local agencies.
Consolidated Transportation Program (CTP) – A six-year program of capital projects, which is updated annually to add new projects and reflect changes in financial commitments.
Fiscal Year (FY) – A yearly accounting period covering the time frame between July 1 and June 30 of each reporting year.
MPA General Cargo – Foreign and domestic waterborne general cargo handled at the public (MPA) terminals.
Port of Baltimore Foreign Cargo – International (Foreign) cargo handled at public and private terminals within the Baltimore Port District. This includes bulk cargo (e.g., coal, sugar, petroleum, ore, etc. shipped in bulk) and all general cargo (e.g., miscellaneous goods shipped in various packaging).
MAA – Maryland Aviation Administration operates Baltimore/Washington International Thurgood Marshall Airport (BWI Marshall) and Martin State Airport, a general aviation/reliever airport northeast of Baltimore.
MDTA – Maryland Transportation Authority operates and maintains the State’s eight toll facilities.
Mode - Form of transportation used to move people or cargo (e.g., truck, rail, air).
MPA – Maryland Port Administration promotes the Port of Baltimore as a leading east coast hub for cargo and cruise activity.
MTA – Maryland Transit Administration provides Local Bus, Light Rail, Metro Rail, Paratransit services and regional services through commuter rail (MARC) and Commuter Bus, as well as grant funding and technical assistance.
MVA – Motor Vehicle Administration serves as the gateway to Maryland’s transportation infrastructure, providing a host of services for drivers and vehicles, including registration, licensing and highway safety initiatives.
SHA – State Highway Administration manages the State’s highway system which includes 17,117 lane miles of roads and 2,564 bridges
TBU – Transportation Business Unit
TSO – The Secretary’s Office
Vehicle Miles of Travel (VMT) – A measurement of the total miles traveled by all vehicles.

Printed on 100% Recycled Paper
7201 Corporate Center Drive, Hanover, Maryland 21076 Local 410.865.1000 • Toll Free 1.888.713.1414 • Maryland Relay TTY 1.800.735.2258
This document can be found at www.mdot.maryland.gov/MDOTExcellerator and is available in alternative formats upon request.
The data contained herein is impacted by a number of variables and may vary and evolve depending on those variables.
Boyd K. RutherfordLt. Governor
Pete K. RahnSecretary of Transportation
Larry HoganGovernor