performance evaluation of the usaid/timor …pdf.usaid.gov/pdf_docs/pdacx381.pdf ·...
TRANSCRIPT

PERFORMANCE EVALUATION OF THE USAID/TIMOR-LESTE CONSOLIDATING COOPERATIVE AND AGRIBUSINESS RECOVERY PROJECT
March 2013
This publication was produced at the request of the United States Agency for International Development. It was prepared independently by Mendez, England & Associates.
PERFORMANCE EVALUATION OF THE
USAID/TIMOR-LESTE CONSOLIDATING
COOPERATIVE AND AGRIBUSINESS RECOVERY
(COCAR) PROJECT
Final Report
30 March 2013
Prepared under Task Order No: AID-486-TO-13-00001
Submitted to:
USAID/Timor-Leste
Submitted by: Conrad Fritsch (Team Leader) Peter Jarvis (Monitoring and Evaluation Specialist) Allison Brown (Value Chain Specialist) Acacio Amaral (Agriculture Specialist) Contractor: Mendez England & Associates 4300 Montgomery Avenue, Suite 103 Bethesda, MD 20814 Tel: 301- 652 -4334 www.mendezengland.com
DISCLAIMER
The authors’ views expressed in this publication do not necessarily reflect the views of the United States Agency for International Development or the United States Government

MID-TERM PERFORMANCE EVALUATION OF THE COCAR PROJECT 1
CONTENTS
ACRONYMS ....................................................................................................................... 3
EXECUTIVE SUMMARY .................................................................................................. 1
EVALUATION PURPOSE AND EVALUATION QUESTIONS .............................................................. 1
PROJECT BACKGROUND ............................................................................................................................. 1
EVALUATION METHODS .............................................................................................................................. 2
EVALUATION LIMITATIONS ........................................................................................................................ 2
FINDINGS ............................................................................................................................................................ 2
CONCLUSIONS AND RECOMMENDATIONS... .................................................................................... 4
1.0 EVALUATION PURPOSE & EVALUATION QUESTIONS ............................... 9
1.1 EVALUATION PURPOSE ................................................................................................................. 9
1.2 EVALUATION GUIDING QUESTIONS ..................................................................................... 10
2.0 PROJECT BACKGROUND ................................................................................... 10
3.0 EVALUATION METHODS AND LIMITATION ................................................ 11
4.0 FINDINGS, CONCLUSIONS & RECOMMENDATIONS ................................. 12
4.1 PROJECT INTERVENTION EFFECTIVENESS IN INCREASING INCOMES AND IMPROVING WELL BEING, INCLUDING FOOD SECURITY, OF TARGET BENEFICIARIES .................................................................................................................................. 12
4.2 IMPORTANCE OF PROJECT INTERVENTIONS ON TARGET GROUPS AND SUBGROUPS (WOMEN) AND THE EXTENT THAT THEIR NEEDS AND INTERESTS ARE MET ...................................................................................................................... 20
4.3 CCT ORGANIZATIONAL AND INSTITUTIONAL SUSTAINABILITY IN THE ABSENCE OF DONOR FUNDING ............................................................................................. 23
4.4 COMMODITY VALUE CHAIN FINANCIAL SUSTAINABILITY ......................................... 29
4.5 PROJECT IMPLEMENTATION EFFECTIVENESS AND ABILITY TO ATTAIN COOPERATIVE AGREEMENT OBJECTIVES ............................................................................. 43
4.6 MONITORING SYSTEM EFFECTIVENESS FOR ACCURATELY REFLECTING PROJECT PROGRESS TOWARDS DESIRED OBJECTIVES AND USAID SUPPORTING REQUIREMENTS .................................................................................................. 44
ANNEXES
Annex 1: Individuals Contacted Annex 2: Evaluation Scope of Work Annex 3: Performance Monitoring Plan Annex 4: Cooperative Café Timor (CCT) Development 1992-2012 Annex 5: Business Cooperative Development Models Annex 6: NCBA Long Term Commitment to Post Donor Funded Southeast Asian Business
Cooperatives Annex 7: Alternative Timorese Coffee Marketing Models Annex 8: CCT Cassava Program Results 2011-2012 Annex 9: Focus Group Questionnaire Annex 10: Household Survey Questionnaire (English)

MID-TERM PERFORMANCE EVALUATION OF THE COCAR PROJECT 2
Annex 11: Household Survey Questionnaire (TETUM) FIGURES: Figure 1: Income per Household and Yield per Hectare (2002 – 2012) Figure 2: Distribution of Individuals Living Together in Households Figure 3: Age Distribution of Male and Female Household Residents Figure 4: Educational Distribution of Household Residents Figure 5: Household Satisfactions with COCAR Training Activities Figure 6: Food Crops Most Frequently Grown by CCT Member Households Figure 7: Households Facing Own Food Crop Production Shortage, by District Figure 8: Duration of Farm Produced Food Crop Deficiency Figure 9: Household Strategies to Combat Farm Grown Food Crop Deficiency Figure 10: Source of Funds to Buy Maize or Rice to Attain Food self-Sufficiency Figure 11: Change in Food Security Status Since Working With CCT Figure 12: CCT Impact on Positive Food Security Change Figure 13: Preferred Use of Extra Household Funds Figure 14: Coffee Subsector Map, CCT Business Model Figure 15: Program Development and Implementation Cycle, Cocoa Figure 16: Program Development and Implementation Cycle, Cassava TABLES: Table 1: Prices Paid by CCT for Cherry Table 2: Distribution of Households Working With CCT, by Activity and Duration Table 3: Change in Perceived Food Security Since 2002, Aileu District Table 4: CCT Coffee Cherry Purchases by District and by GG, 2012 Table 5: Variation in Annual Average CCT Coffee Purchases, 2002 to 2012 Table 6: Coffee Monitoring Data Through March 2012 Table 7: Summary for Gross Margin per Hectare and per Labor Day for Unimproved and Improved Coffee Garden Management Table 8: Cocoa Monitoring Data Through March 2012 Table 9: Benchmarks and End of Project Status Table 10: Monitoring Data for the Cassava Activity as of September, 2012 Table 11: HCN Content of Selected Cassava Varieties 2009 (ppm) Table 12: Summary of Gross Margin and Return per Labor Day for Cassava Table 13: Coffee Activity During the Year

MID-TERM PERFORMANCE EVALUATION OF THE COCAR PROJECT 3
ACRONYMS AGM Annual General Meeting CBI Cooperative Business International CCO Cooperativa Café Organico CCT Cooperativa Café Timor CCT Health Clinic Café Timor —The CCT health care program CIAT International Center for Tropical Agriculture CIGIAR Consultative Group on International Agriculture CLUSA Cooperative League of the USA COCAR Consolidating Cooperative Agribusiness Recovery Project COP Chief of Party CRS CSCE
Catholic Relief Services Coffee, Sugar and Cocoa Exchange
CSET East Timor Cooperative and Small Enterprise Training Center Established by TERADP Project: CSET is known as “Klibur” in Timor-Leste
CUC Control Union Certifications the company auditing organic and other certifications for CCT.
EDF Enterprise Development Fund EGT USAID Economic Growth Team EOP End of Project ETIB East Timor Institute of Business ETICA East Timor Coffee Academy FAO Food and Agriculture Organization of the United Nations FGD Focus Group Discussion FLO Fair Trade Labeling Organization GG CCT Geographic Group GOI Government of Indonesia HA (ha) Hectare HCN Hydrogen Cyanide ICCRI Indonesia Coffee and Cocoa Research Institute ICS Internal Control System ICT COCAR In-Country Training Program IETDP Indonesian Enterprise and Trade Development Project Klibur Klibur Mata Dalan Ba Cooperative no Fila Limon: The East Timor Cooperatives
and Small Enterprise Training Center initiated by the TERADP Project LIFFE London International Financial Futures and Options Exchange LOE Level of Effort MCEA Movemento Cooperativo Economico Agricula M&E Monitoring and Evaluation MAF Ministry of Agriculture and Fisheries ME&A Mendez, England & Associates MED Ministry of Economics and Development MMSC Management and Marketing Service Company MOH Ministry of Health MT (mt) Metric Tons NCBA National Cooperative Business Association NY “C” Market New York Commodity Exchange that trades in Arabica coffees NZ Aid New Zealand Agency for International Development NGO Non-Governmental Organization NOP National Organic Program: The organic certification program of the USDA PMP Performance Monitoring Plan POC Point of Contact PUSKUD Indonesian Provincial Federation of Cooperatives RMT Results Measurement Table

MID-TERM PERFORMANCE EVALUATION OF THE COCAR PROJECT 4
SKAL Skal International SoL Seeds of Life SO Strategic Objective SOW Scope of Work STTA Short Term Technical Assistance TL Team Leader TLDHS Timor-Leste Demographic Health Survey TERADP Timor Economic Rehabilitation and Development Project UNTAET United Nations Transitional Administration in East Timor UNTL National University of Timor-Leste USAID United States Agency for International Development

MID-TERM PERFORMANCE EVALUATION OF THE COCAR PROJECT 1
EXECUTIVE SUMMARY EVALUATION PURPOSE AND EVALUATION QUESTIONS
This is a report on the mid-term evaluation of the Consolidating Cooperative and Agribusiness Recovery (COCAR) project funded by the United States Agency for International Development (USAID) Mission in Timor-Leste. The evaluation was conducted during the period December 2012 – February 2013, by a team assembled by Mendez, England & Associates (ME&A) with headquarters in Bethesda, Maryland.
The purpose of the evaluation was to examine the technical and managerial performance of the COCAR project, including the implementing partner National Cooperative Business Association (NCBA), and the partner organization Cooperativa Café Timor (CCT), in order to provide a comprehensive overview of the activities and interventions being implemented under COCAR, as well as identify project’s strengths and areas for improvement. The evaluation also assessed the current capacity level of CCT and its ability to function in the absence of donor funding.
At the request of the USAID Mission, the evaluation did not address the community health extension and cattle fattening activities implemented under the project.
The evaluation was guided by USAID’s criteria for evaluation, including: a) Relevance; b) Effectiveness and Efficiency; c) Impact; d) Monitoring; and e) Sustainability. As per the Scope of Work (SOW), the evaluation considered the following guiding questions:
Have project interventions been effective in increasing incomes and improving the well-being, including food security, of targeted beneficiaries?
How important are the interventions for the target groups and subgroups (women) and to what extent does it meet their needs and interests1?
To what extent are COCAR activities, including various value chains, sustainable from a financial and institutional perspective?
How well has NCBA/CCT implemented the project, and are they on target for reaching the objectives outlined in the Cooperative Agreement?
How can the monitoring system be modified to more accurately reflect the project’s progress towards the desired objectives and reporting requirements of USAID?
PROJECT BACKGROUND
COCAR is a follow-on project to the Timor Economic Rehabilitation and Development Project (TERADP), which was initiated by USAID/Indonesia and evolved from earlier projects implemented prior to independence. TERADP resulted in the formation of a highly efficient small farmer producer organization, Cooperativa Café Timor (CCT) in 2000, which replaced the national farmer cooperative operating during Indonesian times. Over the years, CCT has grown to be one of the largest employers - more than 500 full time employees and up to 3,000 seasonal, part time, and indirect jobs - and a major generator of export earnings in the country. The cooperative has an effective membership of more than 21,500.
COCAR was awarded to NCBA, as a $7.2 million cooperative agreement, in order to provide additional time and resources for NCBA/CCT to reach a definitive stage in the advancement of activities started under TERADP. These activities include: (i) the rehabilitation of coffee plantations; (ii) cattle fattening and fodder; (iii) development of an agro-forestry industry; and (iv) community extension health services. In addition, COCAR introduced cocoa and cassava as new small-farmer income expanding commodities. The project started in October 2010. In April of 2012, the funding was increased by an additional $3 million in order to accommodate a buy-in by New Zealand Aid
1 For the purpose of this section the target groups included the beneficiary farm household with particular emphasis on women.

MID-TERM PERFORMANCE EVALUATION OF THE COCAR PROJECT 2
Programme (NZ Aid) to support the expansion of COCAR’s coffee rehabilitation efforts. This brought the total funding for the project to $10.2 million.
EVALUATION METHODS
To collect data and obtain the necessary information for the development of the findings, conclusions, and recommendations, the evaluation team used a combination of qualitative and quantitative methods. These methods included: 1) open-ended interviews with the technical and managerial staff of the two organizations being evaluated, project household beneficiaries, other stakeholders including non-governmental organizations (NGOs) who have complementary or other relevant development experiences, government officials, and CCT competitors who provided comparative insights into the coffee, cassava and cocoa production and processing subsectors; 2) focus group discussions (FGD) with more than 250 small-scale farmers who are among the +21,500 CCT members that benefit from COCAR activities; and 3) a household survey of 114 rural households in 6 districts where COCAR activities are located. These three evaluation methods were conducted in parallel and their results have been consolidated into this final report.
Over the course of the evaluation, different team members and survey enumerators visited 23 project locations and interviewed project partners, project competitors, household beneficiaries, and stakeholders in Aileu, Bacau, Bobonaro, Covalima, Ermera, and Manufahi districts in western Timor-Leste.
The individual survey questions were designed to address food security issues and CCT working relationships with emphasis on training experiences. The FGDs questions complemented these questions and, in addition, addressed specific gender issues.
EVALUATION LIMITATIONS
The limitations for this evaluation included: Poor mountain roads, bad weather conditions and widely scattered project field locations,
limited the number of individual household survey contacts that could be made within the time allocated for this evaluation;
The non-availability of some of the agribusinesses and implementation partners with whom the team wished to interview due to the seasonal nature of the coffee processing business;
The lack of comparative sample of non-CCT coffee growers; The small number of female headed households in the overall CCT membership lists
precluded selection of a sufficient number of female headed households in the sample to carry out a comparative analysis with male headed households;
The shortage of baseline studies produced from COCAR, TERADP and other development projects, as well as the national government;
The relatively small budget for the survey activity constrained its size and the robustness of some of the survey data analysis. Consequently, the results cannot be interpreted as a statistically valid interpretation of the overall CCT member population or COCAR project participants.
FINDINGS
1. Intervention Effectiveness in Increasing Incomes and Improving Well-being, Including Food Security, of Target Beneficiaries
As of January 2013, more than 21,500 members sell coffee and other farm products to CCT. CCT administrative records show an increasing farm income trend from coffee sales between 2002 and 2012 despite poor yields due to adverse weather conditions in 2007, 2009, and 2011. Overall, a declining trend in coffee yields over the period was identified. Despite the reduction in average yields, average income per coffee farm from sales to CCT increased from $139 to $224 over the period as farm gate coffee prices increased from 22-23 cents per kg from 2002 to 2006 to 27 cents in 2007, reaching a peak of 50 cents in 2011 and dropping back to 40 cents in 2012.

MID-TERM PERFORMANCE EVALUATION OF THE COCAR PROJECT 3
Individual survey data reveals relatively large households with an average of about 7 members per household. Data showed that over half of the household members above 45 years of age reported having had no formal education; however, the educational profile of the remaining population is consistent with slowly improving educational opportunities up through high school levels.
CCT implements a complex technical training program that is free of charge to participating members. The purpose is to train farmers in technologies to improve product quality and yields.
Farmers reported that maize is the most frequently grown food crop followed by rice and cassava. On average, about two/thirds of the survey respondents reported that they did not grow sufficient food to meet year-round family requirements. Southern districts reported fewer food security problems than did northern districts. Two thirds of all respondents reported either two or three months per year when they were unable to grow sufficient food for household consumption. The most common method for obtaining additional food was to purchase additional rice or maize using own savings.
2. Importance of Project Interventions on Target Groups and Subgroups (Women) and the Extent that Their Needs Are Met
FGDs and survey data responses (in the crops under discussion coffee, cocoa, and cassava) indicate that men did jobs requiring more physical strength while women did the more exacting and less physically strenuous work. For example, women most often do weeding while men do tree-pruning and land preparation.
From a gender perspective, project income earning activities have improved the economic well-being of women over time. FGDs did not identify any adverse change in traditional male/female roles, but where change did occur it was because the women now feel more involved in the farming activities as a result of CCT providing new opportunities.
Men and women put a high priority on increasing educational opportunities for their children but differ in the intensity of this expression with 71% of women and 59% of men indicating that if they could earn extra income their first priority would be to use it to pay school fees for their children.
3. CCT Organizational and Institutional Sustainability in the Absence of Donor Funding
CCT, as a national “primary” or first level cooperative, is unique for a developing country in that it follows the US and international top down organizational model. This model, developed in the US and Europe, is designed to support the commercialization of small farmer agriculture. It enables small-scale farmers to be part of a national or regional marketing organization able to capture significant marketing economies of size that are essential to minimize marketing costs and strengthen farmer marketing power when negotiating with large, often multinational, buyers.
Since 2002, all major CCT capital investments have been funded from coffee sales to high quality international niche markets and, in 2008, USAID funds were used to develop a joint venture with CCT and a NCBA-supported international management and marketing company that enables CCT to sell coffee and other farm products into world markets.
4. Commodity Value Chain Financial Sustainability
CCT, through the coffee rehabilitation program, has distributed free of charge more than 1.2 million new coffee seedlings from project startup through 2012, and has trained farmers who pruned an additional 900,000 coffee trees.
CCT sets the initial coffee price at the start of the season and maintains this price throughout the season. Competitors use this as a price guide for setting their own farm gate prices.
The cocoa activity has almost 200 registered members and CCT is introducing a new hybrid cultivar selected because of its disease resistance. This is the first time that small-scale farmers in Timor-Leste are growing cocoa as a commercial crop. Cocoa is a good crop to interplant with coffee and

MID-TERM PERFORMANCE EVALUATION OF THE COCAR PROJECT 4
with shade and timber trees and requires minimum maintenance. CCT provides a market for the product to be sold in international markets.
The cassava program has about 450 registered members. CCT is introducing a research recommended commercial variety with yields at least double that of existing varieties now used for home consumption. Farmers have been quick to adopt the new variety, which can provide an important cash crop, especially for farmers in southern districts. While CCT recommends that farmers grow the crop by itself, the evaluation team found that many farmers prefer to intercrop cassava with maize.
CCT has started construction of a cassava processing facility using its own funds. It will be functional by late 2013.
5. Project Implementation Effectiveness and Ability to Attain Cooperative Agreement Objectives
From 2000, when CCT was first organized, until 2012 coffee growers received almost $40 million in cash from the sale of coffee. In addition, CCT is one of the largest employers in Timor-Leste, with more than 500 full time employees and up to 300 seasonal and other workers. CCT has been effective in creating additional small-farmer income producing enterprises including vanilla, cattle fattening, and under COCAR it is initiating cocoa and cassava enterprises.
6. Monitoring System Effectiveness for Accurately Reflecting Project Progress Toward Desired Objectives and USAID Supporting Requirements
COCAR monitoring requirements are complex and details are set out in the Project PMP. Separate indicators are required by USAID and by NZ Aid, which provided an add-on in 2012 of US$3 million to expand the coffee rehabilitation activities.
CONCLUSIONS AND RECOMMENDATIONS
1. Project Intervention Effectiveness in Increasing Incomes and Improving Well Being, Including Food Security, of Target Beneficiaries
Conclusions:
Average household farm income from coffee sales to CCT increased by 61% between 2002 and 2012;
More than 90% of participants, both men and women, indicated that they were either “satisfied” or “very satisfied” with CCT training activities;
Sales of farm products to CCT had a positive long-run effect on improving farm family food security. The positive food security impacts were quantified by survey results for households participating with CCT only since October 2010 (at the start of the COCAR project) but the impact was considerably stronger for households with longer-term history of selling coffee to CCT;
With higher disposable incomes, households are moving beyond subsistence as a greater number of them are able to buy rice or maize to supplement their homegrown food supply than was the case ten years ago.
2. Importance of Project Interventions on Target Groups and Subgroups (Women) and the Extent that Their Needs Are Met
Conclusions:
CCT-promoted agriculture practices are generally gender-neutral, with men doing jobs requiring more physical strength while women do the more exacting and less physically strenuous work associated with taking on additional crop production activities resulting from CCT training, which is provided equally to men and women;
FGDs consistently indicated that women manage household finances with most household financial decisions made by consensus;

MID-TERM PERFORMANCE EVALUATION OF THE COCAR PROJECT 5
The direct effects of COCAR's agriculture activities result in increased household incomes and thus support a general increase in family quality of life;
CCT has a limited number of women field extension specialists.
Recommendations:
COCAR's gender neutral approach to training is appropriate to supporting the expansion of commercial agricultural cash producing enterprises and should be continued as it has the positive result of bringing women more directly into the commercial activities of the farm household and supports increased farm family income generation;
CCT should introduce a pro-active hiring policy to increase the number of female extension specialists, with special emphasis on cassava and cocoa production, which are attractive new income sources for rural women.
3. CCT Organizational and Institutional Sustainability in the Absence of Donor Funding
Conclusions:
Since 2002, CCT has been a profitable self-contained small-farmer producer organization providing gradually increasing income and income generating opportunities to its more than 21,500 farmer-members. It has been profitable each year with the exception of 2011, when coffee production dropped precipitously due to bad weather;
Using profits from its coffee and other income generating activities, CCT has significantly upgraded and expanded its coffee production and processing assets and, in addition, it has provided significant funds to offer health care services to some of its members;
CCT has used its position as an Organic, Fair Trade and Starbuck’s Café Practices certified producer organization to improve member income, productivity, and access to free health care services;
CCT has created a sustainable coffee marketing organization by partnering with an NCBA-supported international cooperative marketing and management service company (MMSC);
It can be expected, based on past experience in other countries where donor-supported farmer cooperatives have graduated to full self-sustaining status, that the relationship developed over the past 20 years between NCBA and CCT will continue into the future, thus providing CCT with international business management, marketing and international product quality certification expertise to ensure its long-run successful operation;
CCT has judiciously and efficiently used donor funding to improve farmer productivity and undertake applied research and farmer training to support these efforts;
CCT can, in its role as a well-managed producer organization, continue to efficiently utilize donor funding to expand and deepen small-farmer productivity and income generating options;
While CCT is a well-managed and profitable business, some cooperative governance issues warrant attention in order to improve Annual General Meeting (AGM) member representation.
Recommendations:
Cooperative governance practices can be improved by reinstituting earlier procedures whereby representatives from the 18 Geographic Groups (GGs), as successor entities to the CCO community level organizations, can be associated directly with selecting representatives to the CCT AGM. The current system whereby AGM representatives are elected for five-year terms is not well understood by members, and seems not to have any relationship to the GGs, which in the past provided the formal linkage between farmer members and their national leadership.
4. Commodity Value Chain Financial Sustainability
Coffee Rehabilitation

MID-TERM PERFORMANCE EVALUATION OF THE COCAR PROJECT 6
Conclusions:
Implementation of the coffee activity is proceeding according to plan and is on time; The coffee rehabilitation program followed by CCT that includes pruning and new seedling
plantings has the potential to more than double farmer per hectare income; Improved dissemination of coffee prices has the potential for increasing and stabilizing coffee
farmer income beyond the May to September farm level coffee buying season; The soils of Timor-Leste are slowly becoming nutrient depleted by the lack of systematic
fertility management in the production of organic coffee.
Recommendations:
Donor funding for the successful CCT coffee rehabilitation programs, especially those associated with tree replanting, should continue after the completion of the COCAR project in 2014 for small farmers who do not have available investment capital to meet startup costs;
Donor consideration should be given for including an organic-based soil fertility management component as part of any new or existing coffee rehabilitation program;
There is a need for increasing the amount and availability of viable farm level domestic price information within the coffee sector. To be accepted, this system should not be managed by a market competitor but by an objective third party public or private sector entity.
Cocoa
Conclusions:
Implementation of the cocoa activity is proceeding according to plan and is on time; Cocoa production technology introduced by the COCAR project is in accord with existing
best practices; The technical and economic analysis supporting introduction and development of the cocoa
activity is based on Indonesian research results as Timor-Leste has, to date, had no small-farmer experience with commercial cocoa production;
The experience to date suggests that the current cocoa applied research and development activity will successfully increase family farm incomes as cocoa trees come into full production.
Recommendation:
Small-farmer commercial cocoa development projects that cover the initial startup costs of establishing cocoa tree gardens should be considered a good candidate for further donor support for cash poor farmers lacking investment capital needed to cover these initial costs.
Cassava
Conclusions:
Implementation of the cassava activity is proceeding according to plan and is on time; The COCAR cassava technical assessment does not specify whether the projected cassava
yield (which is more than double recent farm experienced yields) is obtained with or without application of fertilizer, and CCT promotion of cassava monocropping technologies without identifying a procedure to maintain soil fertility over the long-run can potentially lead to serious environmental soil degradation problems;
Gross margin analysis prepared by the evaluation team suggests that per hectare income is greater for cassava intercropped with maize than for monocropped cassava under low-input technology conditions similar to those prevailing in Covalima district;
The current COCAR activity to introduce the cassava variety Ca 109 for predominately industrial production does not conflict with the USAID Food Security definition that recognizes the inclusion of commercial crop production that provides income to meet food security needs;

MID-TERM PERFORMANCE EVALUATION OF THE COCAR PROJECT 7
On a modest scale, the COCAR cassava promotion activity has already demonstrated its potential to generate income. As it is scaled up over time, it will most likely be a successful income generator and improve food security primarily by providing additional income with which to buy food;
The CCT cassava processing facility will be built at the CCT Tibar site and is expected to be operational by late 2013.
Recommendations:
COCAR should clarify fertilizer use assumptions under which projected cassava yields are obtained, and should consider promoting cassava-maize intercropping technologies in addition to cassava monocropping technologies;
COCAR should work with the SoL research team in developing and testing extension packages designed to win farmers’ compliance with a good fertility maintenance practices;
Semi-annual project reports prepared for USAID should include more discussion of the technical aspects of cassava program implementation, especially farmer adoption of soil fertility maintenance programs.
5. Project Implementation Effectiveness and Ability to Attain Cooperative Agreement Objectives
Conclusion:
CCT provides a highly cost effective small farmer commercial development vehicle as donor funds are used to cover the cost of important startup investment inputs for targeted resource poor farmers, including planting material and technical training. The CCT coffee processing and marketing enterprise is commercially self-sustaining with leadership dedicated to promoting small-farmer commercial enterprise by providing guaranteed markets for products meeting Organic and Fair Trade quality requirements.
6. Monitoring System Effectiveness for Accurately Reflecting Project Progress Toward Desired Objectives and USAID Supporting Requirements
Conclusions:
The Results Measurement Table (RMT), agreed between NZ Aid and USAID, provides an adequate means for monitoring project progress for the coffee activity. This results table also provides a range of indicators which may be used to measure the impact of COCAR, such as yield per hectare, number of farmers participating in the program;
The NZ Aid performance indicators are incorporated into the COCAR table of indicators as reported by CCT;
The PMP covers all the COCAR activities of coffee, cocoa, agro-forestry, cattle fattening, cassava, and health;
The PMP indicators for the non-coffee activities, provide an adequate means for recording project progress, and a range of indicators which may be used for evaluation of project benefits;
The indicators for coffee do not disaggregate the results of the expenditure by NZ Aid from the overall expenditure on coffee rehabilitation activities; however, this is not of concern;
Training of CCT staff is a significant achievement under COCAR but CCT employee training and capacity building is not reflected in the COCAR indicators;
The COCAR monitoring data is collected by the CCT technicians in the course of their normal working activities; in this respect, the monitoring is practical and sustainable.
Recommendations:
In the COCAR table of indicators, it would be helpful to include as sub-headings the objectives intended to be monitored, such as: – Improved household income of coffee farmers (with indicators listed below);

MID-TERM PERFORMANCE EVALUATION OF THE COCAR PROJECT 8
– Increased production of better quality of coffee cherry (with indicators listed below); The indicator below is redundant and should be removed;
– Number of farmers implemented pruning technique; Indicator for coffee rehabilitation “Coffee cherry price returned per hectare” should be
changed to “Coffee cherry yield per hectare.” This indicator is intended to measure the objective of “Increase in Value of Rehabilitated Farm” (refer to nr. 13 under Findings in Section 4.6);
COCAR’s primary objective of improving farm incomes, the income per hectare, or the average coffee farm, should be included as an indicator. If COCAR fails to achieve an improvement in incomes when yield per hectare increases, then justifiable reasons can be developed for not achieving the target;
For training, there is an indicator in NZ Aid Results Table “Number of farmers coping with training.” This should be changed (as suggested by CCT in the PMP) to “Number of farmers adopting technologies”;
There are a number of indicators which could be more explicitly stated in the table of indicators, including: – Training: There are several types of training and technologies in which COCAR
conducts training; these are measured using the numbers of farmers attending training or adopting technologies. It would be helpful to list by name the actual trainings/technologies and to state the result for each training or technology;
– Training for nursery growers. This training is not reflected in the indicators but it would be helpful if it were included under the indicator for “Satellite nurseries established”;
Different types of seedlings are distributed within the Agroforestry activity (teak, mahogany, beech, fruit trees etc.). These are disaggregated in the COCAR’s semi-annual report (end Sept 2012). It would be beneficial to have the tree types which are distributed disaggregated in the indicator table;
Under “Shade and pest control” (4th indicator on page 3 of the COCAR indicators) there is an indicator “Percentage of program area covered by medium and high canopy shade trees.” Because shade trees are important for the survival of coffee, an indicator such as “% of area planted in the recommended density of shade trees” could be used. The original target is 80% to be covered in medium or high canopy shade trees;
Indicators that exceed their target should be reported as overachievement rather than the indicators revised to reflect the overachievement as achievement against the original targets will be better measured;
A customized database should be developed for the COCAR activities of cassava, cattle fattening, cocoa and agro-forestry to complement the one that already exists for the coffee rehabilitation activity;
There are some additional and significant milestones that are part of COCAR (refer to nr. 24 under Findings in Section 4.6) that should be listed and reported against in the COCAR results table;
Training of CCT staff is a significant COCAR achievement and should be reflected in the COCAR indicators.
MID-TERM PERFORMANCE EVALUATION OF THE COCAR PROJECT 9
1.0 EVALUATION PURPOSE & EVALUATION QUESTIONS 1.1 EVALUATION PURPOSE
This is a report on an independent, external mid-term evaluation of the COCAR project funded by the USAID Mission in Timor-Leste, Economic Growth Office. The evaluation was carried out by a team of experts assembled by ME&A.
The purpose of the evaluation was to examine the technical and managerial performance of the COCAR project, including implementing partner NCBA and partner organization CCT, in order to provide a comprehensive overview of the activities and interventions being implemented under COCAR and identify project’s strengths and areas for improvement. The evaluation also assessed the current capacity level of CCT and verified its ability to function in the absence of donor funding.
Key criteria contained in the SOW, which is attached as Annex 2 of this report, include:
Relevance Information was to be gathered from a variety of key stakeholders, such as NCBA, CCT,
civil society NGOs working in the agriculture sector, and representatives from the local and national government, to gauge their perspectives and opinions on the project’s importance and relevance at household, local and national levels.
Effectiveness & Efficiency Assess the effectiveness of the project in terms of planning, ability to track the
implementation of the project activities and reporting. Analyze the overall efficiency of project implementation and cost effectiveness of project
activities taking into consideration country specific constraints. Impact
Evaluate the impact over time that NCBA/USAID interventions have had on rural livelihoods, including food security.
Determine the extent to which USAID’s long-term interventions have had a real impact on alleviating poverty for target groups including coffee rehabilitation programs started in 2008 under TERADP.
Monitoring Assess the current monitoring system and provide recommendations for improving its ability
to collect disaggregated data by source funding and to improve the evidence-base for evaluating project impact and progress towards project objectives.
Make certain that monitoring systems are disaggregated sufficiently to track the impact of $3 million in additional funding from NZ Aid.
Sustainability Analyze NCBA’s approach to building capacity among local institutions and people to
implement project activities and continue these activities in the absence of donor technical and financial assistance.
Identify potential weaknesses or threats to sustainability and provide recommendations for addressing them.
Take into account the commercial viability, financial sustainability and cost structures of value chains to analyze their current and/or potential profitability for both the farmers and CCT. Examine the financial and technical capacity of CCT to continue working in these areas after the project’s completion.

MID-TERM PERFORMANCE EVALUATION OF THE COCAR PROJECT 10
The audience for this evaluation includes USAID/Timor-Leste Mission, specifically the USAID Economic Growth Team. Key findings will be shared with the implementing partner NCBA, its partner CCT and NZ Aid. The evaluation will be used to document and assess the relevance, effectiveness, efficiency, sustainability, and impact of the current project and provide insight for future projects.
1.2 EVALUATION GUIDING QUESTIONS
The evaluation was guided by the following questions, provided in the SOW:
Have project interventions been effective in increasing incomes and improving the well-being, including food security, of targeted beneficiaries?
How important are the interventions for the target groups and subgroups (women) and to what extent does it meet their needs and interests?
To what extent are COCAR activities, including various value chains, sustainable from a financial and institutional perspective?
How well has NCBA/CCT implemented the project, and are they on target for reaching the objectives outlined in the Cooperative Agreement?
How can the monitoring system be modified to more accurately reflect the project’s progress towards the desired objectives and reporting requirements of USAID?
2.0 PROJECT BACKGROUND COCAR is a follow-on project to TERADP, which was initiated by USAID/Indonesia and evolved from earlier projects implemented prior to independence. The project had two phases, TERADP I & II, which covered the years 2000 to 2008, and an extension to TERADP II that covered years 2008 to 2010. The TERADP projects were funded through a series of grants awarded to NCBA that totaled $17.5 million by the project’s end in 2010. The project supported the formation of CCT, in 2000. This highly efficient small farmer producer organization replaced the national farmer cooperative system operating during Indonesian times. Over the years, CCT has grown to be one of the largest Timor-Leste employers (more than 500 full time employees and up to 3,000 seasonal, part time, and indirect jobs) and generator of export earnings in the country. The cooperative has an effective membership of more than 21,500. In September 2010, NCBA was awarded a $7.2 million cooperative agreement for its unsolicited proposal to fund the COCAR project whose objectives include increasing farmer incomes by improving coffee yields through implementation of a coffee rehabilitation program, and expanding farmer income generating options by introducing cassava and cocoa plantings. COCAR was awarded to NCBA in order to provide additional time and resources for NCBA/CCT to reach a definitive stage in the advancement of activities started under TERADP-II. These activities include: (i) the rehabilitation of coffee plantations; (ii) cattle fattening and fodder; (iii) development of an agro-forestry industry; and (iv) community extension health services. The new activities introduced under COCAR include: (v) the introduction of cocoa, which includes the development of a cocoa value chain; and (vi) the introduction of cassava to address food insecurity either by direct product consumption or by increasing incomes to enable purchase of other food products. In April of 2012, the award was increased by an additional $3 million in funding in order to accommodate a buy-in by NZ Aid that will support the expansion of the COCAR project’s coffee rehabilitation efforts, bringing the total award to $10.2 million. Like TERADP before it, COCAR's agriculture interventions include applied research and development activities to promote the commercial development of resource poor farm families. The CCT development approach generally recommends low resource technologies requiring few, if any, purchased inputs. Donor funds are used to cover initial startup investment costs including
MID-TERM PERFORMANCE EVALUATION OF THE COCAR PROJECT 11
planting materials and technical training, while CCT provides a guaranteed market for products meeting Organic and Fair trade quality requirements.
Cassava should start providing significant commercial returns near the end of the COCAR project but the impact of the proposed processing facilities will not be seen until after the project closes. The other new agriculture production activities addressed in this evaluation will not reach their full economic potential until after the COCAR’s end of project (EOP), which is September 30, 2014.
During the course of this evaluation, which included discussions with the Ministry of Agriculture and Fisheries (MAF) and with several NGOs, the team concluded that CCT has the most effective private-sector research and development program for agriculture in Timor-Leste and, indeed, is more efficient and effective than existing MAF field and applied research activities. Through the COCAR project, NCBA, an international NGO providing technical, management, marketing, and research support to many small-farmer cooperatives in developing countries, provides CCT with valuable access to these resources. CCT, with its permanent staff of technicians and its efficient logistics, can then undertake applied research needed to test new crops, adapt generic planting and husbandry recommendations to local conditions and compete effectively in international high value coffee markets.
3.0 EVALUATION METHODS AND LIMITATION The evaluation team used a combination of qualitative and quantitative methods to collect data and obtain information that informed the evaluation’s findings, conclusions, and recommendations. These methods included: 1) open-ended interviews with the technical and managerial staff of implementing partners of the two organizations being evaluated as well as project household beneficiaries, other stakeholders including NGOs who have complementary or other relevant development experiences, government officials, and CCT competitors who provided comparative insights into the coffee, cassava and cocoa production and processing subsectors; 2) FGDs with more than 250 small-scale farmers in 23 communities across six districts who are among the more than 21,500 CCT members that benefit from COCAR project activities; and 3) a household survey of 114 rural households in 6 districts (Aileu, Bacau, Bobonaro, Covalima, Ermera, and Manufahi districts) in western Timor-Leste where COCAR project activities are located. These three evaluation approaches were conducted in parallel, and their results have been consolidated into this final report.
Fieldwork for the evaluation was carried out over a seven-week period from early January to the end of February 2013. Over the course of the evaluation, different team members and survey enumerators visited 23 project locations and interviewed more than 70 project partners, competitors, household beneficiaries, and stakeholders.
The sample includes a cross section of CCT members in districts with differing climatic, soil and topographic conditions including relatively flat lands suitable for field crop production and mountainous areas represented largely by coffee farmers. Thirty four percent of the individual survey respondents had worked with CCT only since the start of the COCAR project in October 2010, while the remainder had sold farm produce to CCT for up to 12 years. Women represented 20% of the population. CCT is primarily an income-generating project that works through farm household heads, the vast majority of whom are men. Sixty-six percent of survey respondents worked with CCT prior to the start of the COCAR project in September 2010. However, women have a greater representation in the sample segment containing individuals working with CCT only

MID-TERM PERFORMANCE EVALUATION OF THE COCAR PROJECT 12
since the start of the COCAR. Overall, the coffee and cassava production activities represent 52% and 29% respectively, of the sampled households.
The questionnaire for the individual household survey was designed to measure food security status and working relationships with CCT, especially training activities. The FGD questions and discussion points were designed to complement the individual sample survey and separately addressed gender issues.
Evaluation limitations included:
The existence of poor mountain roads, bad weather conditions and widely scattered project field locations limited the number of individual household survey contacts that could be made within the available time allocated for the field work of the evaluation;
The non-availability of some of the agribusinesses and implementation partners with whom the team wished to interview due to the seasonal nature of the coffee processing business.
The lack of comparative sample of non-CCT coffee growers; The small number of female headed households in the overall CCT membership lists
precluded selection of a sufficient number of female headed household in the sample to carry out a comparative analysis with male headed households;
The shortage of baseline studies from COCAR, TERADP and other development projects and from the national government;
The relatively small budget for the survey activity constrained its size and the robustness of some of the survey data analysis. Consequently, the results cannot be interpreted as a statistically valid interpretation of the overall CCT member population or COCAR project participants.
4.0 FINDINGS, CONCLUSIONS & RECOMMENDATIONS 4.1 PROJECT INTERVENTION EFFECTIVENESS IN INCREASING
INCOMES AND IMPROVING WELL BEING, INCLUDING FOOD SECURITY, OF TARGET BENEFICIARIES
4.1.1 Findings
This section addresses issues associated with COCAR and CCT’s short- and long-term impacts on household incomes and household food security. Data used for the analysis includes CCT administrative records of purchases and prices paid, FGD results, and individual sample survey information gathered during the evaluation.
Changes in CCT Member Household Incomes: As of January 2013, CCT records identify more than 21,500 members who sell coffee to the cooperative. Figure 1, next page, shows gross income per farm from the sale of coffee cherry2 to CCT and the associated yield per hectare
2 “Cherry” refers to the fruit of the coffee tree because when ripe it is bright red and resembles a cherry. Generally, the cherry contains two beans that are encased by a soft pulp that must be removed shortly after harvest to preserve the bean flavor as fermentation begins almost immediately afterwards. Delay of more than 12 hours negatively impacts on the taste of the fully processed bean. After removing the pulp, beans remain encased in a husk and an additional silver colored light skin and at this stage the product is called “parchment.” Parchment is a storable product but most be further processed by removing the husk and the silver skin after which the remaining “green bean” is graded, bagged, and sold on local and international markets. While CCT only buys cherry, other Timor traders buy mostly parchment.

MID-TERM PERFORMANCE EVALUATION OF THE COCAR PROJECT 13
expressed as the average across all CCT coffee farmer members. It is noted that the income recorded from this data source most likely understates actual farm income, as some farmers sell other produce in addition to coffee and some CCT farmers may sell cherry or parchment to additional buyers. The reasons for not selling all coffee to CCT is discussed in detail in Section 4.4 and is not further developed here.
Figure 1 shows an increasing farm income trend from sales to CCT, from $139 in 2002 to $224 in 2012, despite poor yields in 2007, 2009, and 2011 due to adverse climatic conditions and an overall declining trend in coffee yields over the same period.
Table 1: Prices Paid by CCT for Cherry Year 2002 2003 2004 2005 2006 2007 2008 2009 2010 2011 2012 Cents/Kg 23 23 23 23 22 27 30 30 30 50 40 Source: CCT Administrative Records
Part of the yield reduction is due to coffee rehabilitation efforts that began in 2008 because of the fact that coffee production declines immediately after pruning as newly planted trees do not bear fruit (coffee) for about 3 years after planting. In addition, the low fertilizer input use associated with organic coffee production, as well as the gradual dying-out of the shade trees needed to maintain yields of the dominant Arabica coffee grown by most CCT members may also be two contributing factors to the downward yield trend.
To reverse this trend, CCT, with USAID’s financial support, has strengthened its comprehensive coffee rehabilitation program that involves pruning existing coffee trees and planting new seedlings (provided free of charge to participating farmers) in order to close gaps in existing or new coffee gardens. They also encourage the use of organic mulch to improve soil fertility and provide members with free shade tree seedlings to support the replanting of existing species.
The price per kg paid by CCT for coffee increased from an average of 22-23 cents3 between 2002 and 2006 to 27 cents in 2007, peaked at 50 cents 2011 (a year of very poor production), and then dropped back to 40 cents for the 2012 season.
Focus Group (FG) and Farm Household Survey Results: This evaluation included the collection of household-level data from CCT members using FGDs and individual survey approaches. The objectives were to obtain current information to assess changes in food security over time and household strategies used to address deficiencies, satisfaction with the CCT technical support program, and measure changes in household income over time and the association of these changes with CCT activities. Given time and funding constraints, it was not possible to implement a comprehensive data collection effort to measure total household income changes of CCT members and compare this information with a statistically valid control group of non- members.
3 Timor-Leste uses the US dollar as its trade currency so further conversion is not required.
0
200
400
600
800
0
100
200
300
2002 2003 2004 2005 2006 2007 2008 2009 2010 2011 2012
Yield Kg/H
a
Income $/Farm
Figure 1: Income per Household and Yield per Hectare (2002 - 2012)
Avg. Income $/Farm Avg. Yield Kg/Ha
Linear (Avg. Income $/Farm) Linear (Avg. Yield Kg/Ha)

MID-TERM PERFORMANCE EVALUATION OF THE COCAR PROJECT 14
0%
10%
20%
30%
40%
50%
60%Figure 4: Educational Distribution of Household Residents
Age 18 ‐ 30
Age 31 ‐ 45
Age Over 45
Consequently, the FGDs and individual surveys placed major emphasis on food security and household opinions regarding the CCT training program. FGD data was collected from some 250 individuals located in 23 project locations across 6 districts. Individual survey data was collected from 114 respondents.
Demographic Profile of Individually Surveyed Households: The 114 interviewed households ranged in size from 1-25 individuals, with a mode of six to eight members per household (see Figure 2). This data supports other surveys in Timor-Leste that show average rural household size of about 7 individuals.
Figure 3, below, indicates a near equal division of household occupants over and under 18 years of age. However, a review of household head age distributions indicates that the sample is weighted toward mature family units rather than younger family units as 94% of all household heads are above 30 years of age, including 52% of household heads above the age of 45.
Figure 4, below, suggests that educational opportunities have been increasing in the sampled rural areas since 1975, when the Portuguese relinquished their colonial rule, as there has been a sharp decline in household members under 45 year of age reporting no educational attainment.
0%
10%
20%
1 2 3 4 5 6 7 8 9 10 11 12 13 17 25
Percentage of
Households
No. of People
Figure 2: Distribution of Individuals Living Together in Households
0%
10%
20%
30%
Malesover 18
Males 5 ‐17
Malesunder 5
Femalesover 18
Females5 ‐ 17
Femalesunder 5
Percentage of those living
and eating
Age Class
Figure 3: Age Distribution of Male and Female Household Residents

MID-TERM PERFORMANCE EVALUATION OF THE COCAR PROJECT 15
More than half of the household members above 45 reported no formal education while less than 20% of individuals from 31- 45 reported not having received any formal education. The educational profile for younger household members is roughly consistent with slowly improving educational opportunities though the high school level.
Household Experiences Working with CCT: All FGD and individual survey respondents participated in at least one of the CCT enterprise activities supported by COCAR, including: coffee rehabilitation; cassava, cocoa, and cattle fattening production; and agroforestry tree planting. As seen in Table 2, two-thirds of the individual survey sample had worked with CCT prior to COCAR, which began in October 2010, with the remaining one-third beginning work with CCT as part of the COCAR project. As expected, Table 2 shows that coffee and cassava growers dominate the total sample and account for 80% of the survey respondents.
Table 2: Distribution of Households Working With CCT, by Activity and Duration
Activity COCAR only since
2010 Worked with CCT
before 2010 Total %
Agroforestry 2 3 5 4% Cassava 19 7 26 23% Cassava/Agroforestry 0 2 2 2% Cattle 1 9 10 9% Cocoa 7 1 8 7% Cocoa/Cassava 2 2 4 4% Coffee 8 44 52 46% Coffee/Cocoa 0 7 7 6%
Total 39 75 114 100% % 34% 66% 100%
CCT implements a complex training program, free of charge, for each of the activities that it promotes, including soil preparation, seed and seedling planting, and harvesting. Trainings are conducted on both an individual and group basis and are adapted for specific crops.
FGDs indicated that participants are quite eager to participate in these training programs as they have learned from experience that yields can be increased and, more importantly, that CCT trucks will arrive on the farm to pick up and buy the crop. In all cases, farmers are paid cash at the time of sale.
For example, the coffee rehabilitation training program includes techniques for pruning mature and overgrown trees to facilitate productive growth and for planting new seedlings. CCT also maintains over 440 small- and large-scale nurseries throughout the coffee producing areas, which are under contract to private entrepreneurs who provide seed and free distribution of seedlings to farmers participating in CCT’s coffee programs. Seeding material is also provided to farmers participating in the cassava and cocoa programs, as discussed in Section 4.5.
As shown in Figure 5, next page, the CCT training program received high marks from survey respondents, with close to 95% either satisfied or very satisfied with group trainings, and a slightly higher percentage with individual trainings. No respondents expressed dissatisfaction and only a few responded neutrally about their training experience. Furthermore, FGDs revealed that women were satisfied with the trainings received and did not feel left out of them. Asked to suggest additional training approaches, FG participants had few new suggestions but commonly responded that some training courses needed to be repeated.

MID-TERM PERFORMANCE EVALUATION OF THE COCAR PROJECT 16
Several cassava growers indicated that additional training was needed regarding soils best suited to cassava production.
Although the NCBA Cooperative Agreement indicates that CCT uses demonstration plots as a teaching tool, with the exception of one demonstration coffee rehabilitation plot, the FGDs identified no other formal demonstration plots but did uncover the widespread use of local group leader plots as demonstration areas. In this regard, the common procedure is for the CCT trainer to provide a general overview with individual training taking place at the group leader plot.
CCT training coverage is at or near 100% for all CCT crops of sampled households except cassava, where over 60% of respondents indicated that they have not received formal CCT training. As further discussed in Section 4.5, the commercial cassava production program has become very popular and appears to be a major new source of farm income. As a note of caution, however, cassava, like maize is a heavy user of soil nutrients and, with low fertilizer use technologies, can eventually cause a major depletion of soil nutrients.
Changes in Food Security: The most important farm-produced food crops are maize, rice (in areas where paddy rice is grown), traditional sweet cassava, and bananas (in low-land areas). As seen in Figure 6, cassava ranks the highest of these three food crops as being grown by CCT member households, followed by maize and rice, with sweet potato and taro mentioned. However, when asked to identify the single most frequently grown food crop, 40% of respondents stated maize, followed by 31% for rice, and 25% for sweet cassava. Intercropping sweet cassava with maize is a common practice.
During the survey, enumerators found that respondents had difficulty understanding the meaning of “food security” because, in the context of rural farm households, food security relates to “the ability
0%
20%
40%
60%
80%
100%
VerySatisfied
Satisfied Neutral Dissatisfied
Figure 5: Household Satisfactions with COCAR Training Activities
Group Training
Individual Training
0%
20%
40%
60%
80%
100%
As One of the 3 Most Important Ranked Most Important Overall
Figure 6: Food Crops Most Frequently Grown by CCT Member Households
Rice
Maize
Cassava
Sweet Potato
Taro
Other
MID-TERM PERFORMANCE EVALUATION OF THE COCAR PROJECT 17
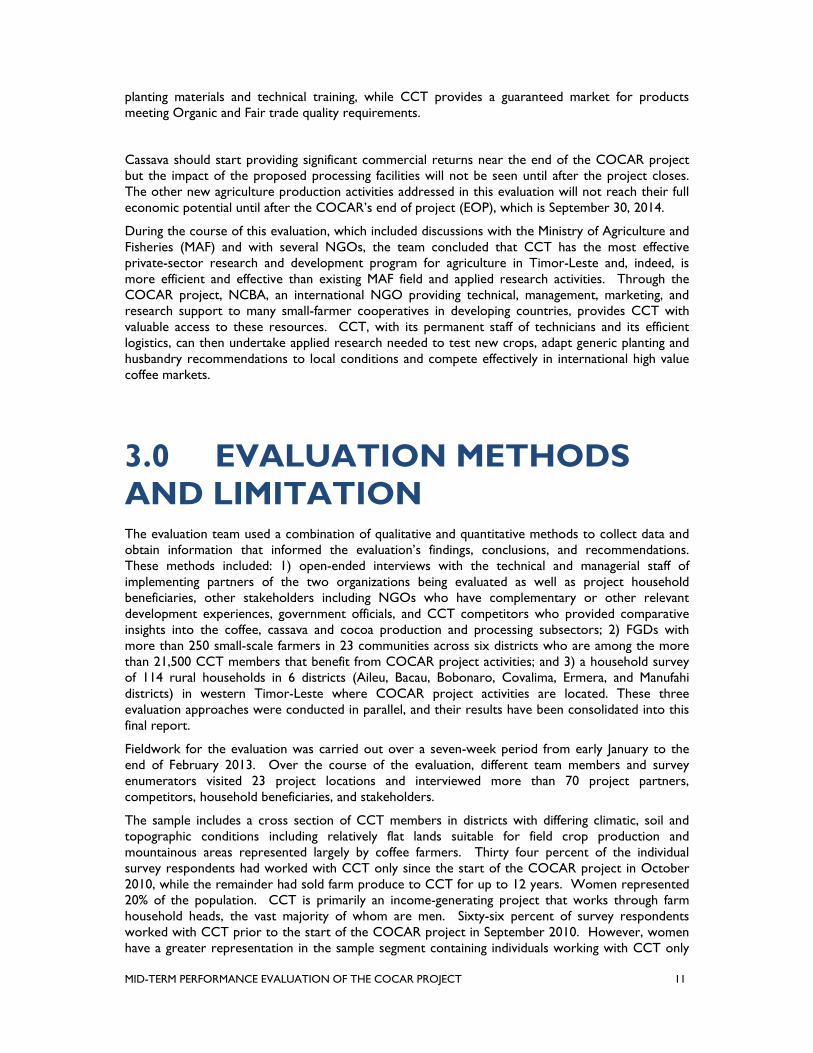
to buy or otherwise gain access to rice in the event that the household is short of homegrown staple foods.” Since CCT member households were the target population for this evaluation, food security was approached from the perspective that the primary household food security objective was to produce sufficient homegrown food to meet year-round family requirements4. Figure 7 illustrates the different impacts of this definition across the 6 districts included in the survey.
Nearly all respondents in Ermera and Baucau were unable to grow sufficient amounts of food on their land to meet basic needs throughout the year. At the other extreme, all Bobonaro respondents, and 95% of those from Covalima, indicated that they could be food self-sufficient from their land throughout the year. These differences illustrate the importance of local agronomic and climatic conditions on crop production. Bobonaro and Covalima lie to the south of a major mountain range and enjoy a low population density combined with large areas of relatively flat farmland suitable for food crop production. By contrast, the coffee growing regions, including Ermera, are mountainous and with limited flat land for food crop cultivation.
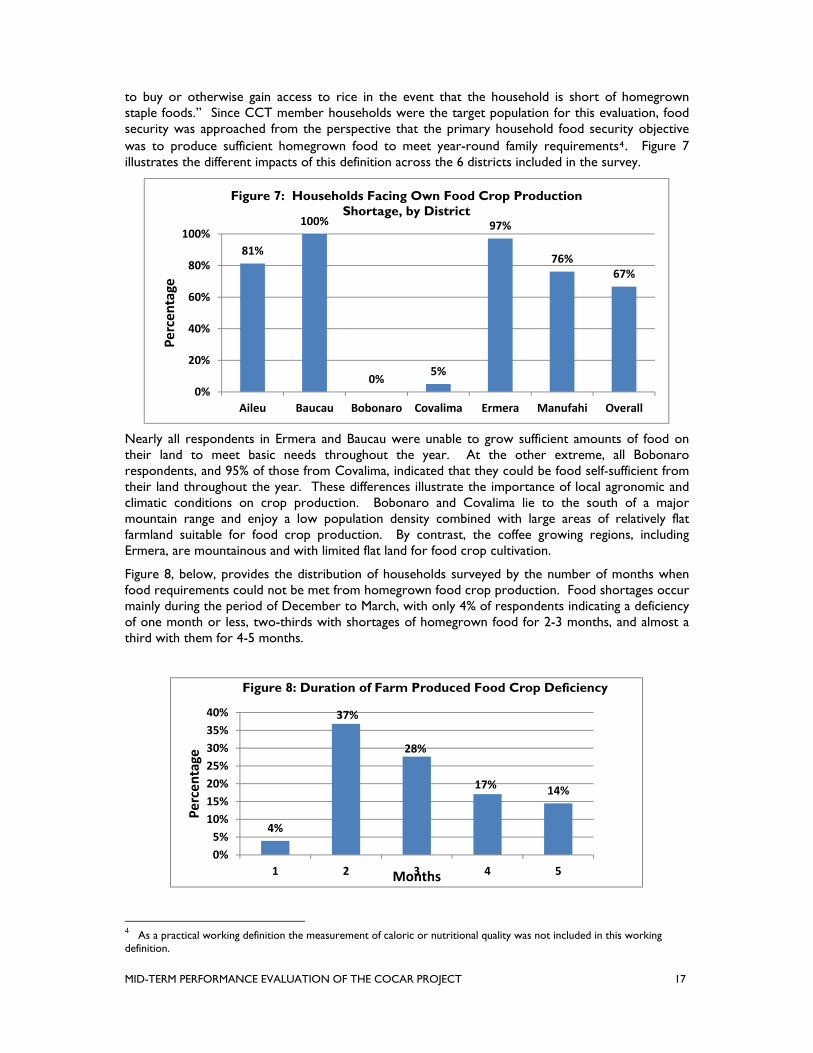
Figure 8, below, provides the distribution of households surveyed by the number of months when food requirements could not be met from homegrown food crop production. Food shortages occur mainly during the period of December to March, with only 4% of respondents indicating a deficiency of one month or less, two-thirds with shortages of homegrown food for 2-3 months, and almost a third with them for 4-5 months.
4 As a practical working definition the measurement of caloric or nutritional quality was not included in this working definition.
81%
100%
0%5%
97%
76%67%
0%
20%
40%
60%
80%
100%
Aileu Baucau Bobonaro Covalima Ermera Manufahi Overall
Percentage
Figure 7: Households Facing Own Food Crop Production Shortage, by District
4%
37%
28%
17% 14%
0%
5%
10%
15%
20%
25%
30%
35%
40%
1 2 3 4 5
Percentage
Months
Figure 8: Duration of Farm Produced Food Crop Deficiency

MID-TERM PERFORMANCE EVALUATION OF THE COCAR PROJECT 18
Eat less, 0 Switch to alternative food, 18%
Aid from NGOs, 8%
Eat more vegetables, 0%
Purchased rice or maize, 72%
Other, 2%
Figure 9: Household Strategies to Combat Farm Grown Food Crop Deficiency
Sold livestock, 37%
Borrowed money, 11%
Own cash / savings, 52%
Figure 10: Source of Funds to Buy Maize or Rice to Attain Food self-Sufficiency
During FGDs, farmers stated that purchasing rice or maize was the most important strategy for coping with food insecurity. This was confirmed with the individual household survey when 72% of those surveyed also cited purchasing rice or maize as the most important strategy (see Figure 9, below). An additional 18% of survey respondents indicated that they switched to alternative foods,
only 8% said that they received help from NGO’s, and none reported that they would eat less.
Across the entire sample of farmers who purchased additional food to enhance their food security, the average amount spent on purchasing rice and/or maize in 2012 was $117.
In order to purchase additional food needed to supplement homegrown food crop shortages, just over half of survey respondents used personal cash savings, 37% sold livestock, and the remaining 11% borrowed money (see Figure 10).
The above analysis suggests that most CCT members did not suffer undue financial strain to maintain their perceived food security needs. To gain an indication of the
respondents’ opinion regarding the importance of
CCT activities toward improving access to food during periods of limited or complete lack of homegrown supplies, two additional questions were asked. Reponses are summarized in Figures 11 and 12 (next page).
As noted previously in Table 2, many of the survey respondents had worked with CCT for many years, with some having started in the late 1990s, while others had started work only since 2010 under COCAR. Food security improvements since working with COCAR are greater for those households with a long-term relationship with CCT: almost 50% of respondents with a long-term CCT association indicated that their perceived change in food security as somewhat improved or much improved, whereas of those with a short-term association, only 30% provided such a response and almost 20% were not sure they experienced a change. As noted above, two-thirds of newcomers are in the cassava program, which has had a major short-term impact on household incomes, thus increasing their available cash to purchase food supplies, and likely accounts for CCT’s highly positive impact on improving food security.

MID-TERM PERFORMANCE EVALUATION OF THE COCAR PROJECT 19
A similar conclusion can be drawn from Figure 12, which includes responses only from those individuals who had indicated that their food security situation was somewhat or much improved. 40% of all households with a long-term CCT association expressing positive food security changes since working with the cooperative attributed all of the gains to CCT activities. By comparison, only 15% of respondents with a short-term association attributed all gains to CCT activities.
Comparison with Earlier Survey Results: In 2002, farmers in the Aileu district were asked a nearly identical set of food security questions5. The current survey results for Aileu are compared to those of the earlier survey in Table 3.
Table 3: Change in Perceived Food Security since 2002, Aileu District
Household Characteristic Aileu 2002
n = 175
Aileu 2012 (COCAR)
n=16
% of households not having enough food produced from their own land 97% 78% No. of months without enough food (% of sample)
2 2.9 77 3 35.4 8
5 Baseline Survey of Farm Households in Project Locations, district and Suco Level Data, Aileu district; Australia East Timor Rural Development Programme Phase 1; ACIL Consultants, July 2002
0%
10%
20%
30%
40%
50%
60%
Don't Know Worse thanBefore
About theSame
Somewhatimproved
MuchImproved
Figure 11: Change in Food Security Status Since Working With CCT
Before COCAR
Only COCAR
0%
20%
40%
60%
80%
100%
Don't know All Some None
Figure 12: CCT Impact on Positive Food Security Change
Before COCAR
Only COCAR

MID-TERM PERFORMANCE EVALUATION OF THE COCAR PROJECT 20
Table 3: Change in Perceived Food Security since 2002, Aileu District
Household Characteristic Aileu 2002
n = 175
Aileu 2012 (COCAR)
n=16
4 38.2 8 5 13.5 7
More than 5 months 10.0 0 Most important strategy adopted for coping without enough food (% of sample)
Ate less food 22 Switched to alternative staple food crops 39 38%
Ate more vegetables 1 Received aid 0
Purchased rice or maize 38 62% Other 0
Purchased food by: % of sample Selling livestock 75 28%
Borrowing money 11 71% From own cash/savings 65 0%
Although the current survey included only 16 households and, consequently, cannot be interpreted with a high degree of statistical significance, the results do not contradict conclusions suggested by the above analysis. Comparison between the two surveys suggests that:
More farmers are now producing sufficient food from their land than in 2002; A larger proportion of farmers now buy rice or maize to cope with food shortages instead
of switching to another food crop; Fewer farmers now sell livestock to buy rice or maize; A higher proportion of farmers now borrow money to purchase rice or maize.
4.1.2 Conclusions
Average household farm income from coffee sales to CCT increased by 61% between 2002 and 2012;
More than 90% of participants, both men and women, indicated that they were either “satisfied” or “very satisfied” with CCT training activities;
Sales of farm products to CCT had a positive long run effect on improving farm family food security. The positive food security impacts were felt by households participating with CCT only since 2010 (at the start of the COCAR Project) but the impact was considerably stronger for households with longer-term associations with CCT;
With higher disposable incomes because of CCT, households are moving beyond subsistence farming and a higher proportion are able to buy rice or maize to supplement their homegrown food supply than were able to ten years ago.
4.2 IMPORTANCE OF PROJECT INTERVENTIONS ON TARGET GROUPS AND SUBGROUPS (WOMEN) AND THE EXTENT THAT THEIR NEEDS AND INTERESTS ARE MET
4.2.1 Findings
According to the COCAR Cooperative Agreement, the project’s gender goal is:

MID-TERM PERFORMANCE EVALUATION OF THE COCAR PROJECT 21
"To develop and implement programs that support women’s personal, professional and social objectives. COCAR’s programs will be designed to insure that they are relevant to women in Timor-Leste and that women have an equal opportunity to benefit from the project." 6
Its summarized gender objective is for the full community participation and inclusion of women and youth in COCAR activities7.
FGDs and survey data responses reflect general equality in the division of agricultural work and the sharing of household money. The division of agricultural work for the crops under discussion (coffee, cocoa, and cassava) tends to be gender-neutral, meaning that men perform tasks requiring more physical strength while women performed those that are more exacting and less physically strenuous. For example, women most often weed while men prune trees and prepare the land.
In this regard, it is important to note that increasing gender-neutral agriculture workloads can negatively affect women because it will require them to spend more time on fieldwork and, unless there is a change in traditional household gender roles, they will still have the same amount of housework to complete. During both FGDs and informal discussions, the evaluation team did not identify any changes in traditional male/female roles to suggest that men have increased their participation in traditionally female household activities. However, to ensure that women are becoming active in crop production activities and are not overburdened with work, training and technical assistance activities should address gender-neutral production activities in the context of male and female daily responsibilities and workloads. FGDs did not identify any adverse change in traditional male/female roles as a result of CCT; however, where changes did occur, they resulted in women feeling more involved in farming activities as a result of CCT providing them with new opportunities.
Several studies cite shortages of seasonal agricultural workers 8 as a limiting factor in the development of commercial agriculture. However, FGDs indicated that, apart from Ermera, few farmers reported hiring much labor, relying instead on family members or sharing labor with other CCT group members. Hiring extra labor when needed was not reported as a problem. Daily wage rates varied from $2 - $5 per day and were generally higher in areas closer to urban and more commercially developed towns and cities and lower in more distant locations.
Project activities seem likely to improve the economic well-being of women participants.
FGDs and individual survey results indicate that women participate equally with men during group training sessions. However, for some one-on-one trainings in coffee gardens a less optimal approach, whereby men receive formal training and then relate the information to women, is utilized. If both men and women are asked to participate in trainings based on availability, or when only one person’s schedule can be accommodated, men and women should participate equally. Individual survey responses to questions regarding training satisfaction indicated the high degrees of satisfaction with trainings were not significantly different between men and women.
Women’s representation and interest in the new CCT cassava and cocoa activities is high in part because women actively participate in the production of sweet cassava, which is a major food staple, and cocoa, which provides a potential new source of income and does not require strenuous production.
The FGDs organized by the evaluation team required the presence of at least two women. Outside of the coffee producing districts of Aileu and Ermera, it was common to have at least four, and frequently more, women participants as part of a group of a total of six to ten. In two of the FGs held in Manufahi district, women comprised the majority of participants. In the vast majority of cases, and especially in Manufahi, Covalima, and Bobonaro districts, women participated in
6 COCAR Cooperative Agreement page 11. 7 COCAR Cooperative Agreement page 15. 8 Particularly, the quarterly reports issued by the Inter-Ministerial Task Force on Food and Nutrition

MID-TERM PERFORMANCE EVALUATION OF THE COCAR PROJECT 22
discussions equally with men and did not appear hesitant to disagree with the views expressed by men. While it was common that the local group leader, usually a male, would make initial comments when addressing a new discussion point, women generally expressed their disagreement, suggesting a reasonable degree of equality between men and women in these rural communities.
One women-only FGD was conducted in each Bobonaro and Covalima with individuals involved in cassava and cattle fattening activities. The discussions, led by a female Timorese that was a member of the evaluation team, addressed an identical set of topics to those of the mixed-gender FGDs and reached conclusions that were similar to those of the other FGDs. The FGD questionnaire included several questions related to the control of household money and financial decision-making processes that were asked in groups with a large number of women participants after male participants had left. Responses to these questions consistently indicated that although both men and women make purchasing decisions and that consensus is preferred and common, the man’s view dominates when consensus cannot be reached.
In more than 50% of the communities in which FGDs were held, participants indicated that credit was not only available but was used to support small business endeavors and to pay school fees. In communities where credit had not been used for these purposes, women frequently expressed the desire for additional access to credit to be used for these purposes.
Both men and women FGD participants strongly supported CCT’s approach to provide free technical trainings and free coffee, cocoa and shade tree seedlings. Most households that have worked with CCT indicated that income from CCT enabled them to build extensions on their homes and purchase items such as TVs and cell phones and radios.
Men and women put a high priority on increasing educational opportunities for their children but differ in the intensity of this expression. Figure 13, below, provides responses to the question “If you had the opportunity to earn additional cash income, how would you spend it?” This was an open ended question to which only one response was requested without prompting.
Both men and women, when asked this question, placed the highest priority on using extra funds for school fees for their children but women displayed a greater intensity of support. Similarly, the second most frequent response for both men and women was that extra funds should be used to cover basic household needs. Again, women responded with greater intensity. The third most frequent response for each subgroup was home improvement, but in this case, men displayed the greater intensity of support.
Women are minimally represented on the CCT field extension staff that are paid with project funds with only six women technical extension training and supervisory staff, including two coffee rehabilitation specialists, three livestock laborers, and one cassava technical specialist, out of a total of 77 (Annex 5). During the course of the field survey, one member of the evaluation team had the opportunity to meet with one of the two female coffee rehabilitation specialists and found her to be highly competent and receiving a higher salary than her male counterpart. She had been employed
0%
20%
40%
60%
80%
School fees Home imp Basic needs Other
Figure 13: Preferred Use of Extra Household Funds
Male
Female

MID-TERM PERFORMANCE EVALUATION OF THE COCAR PROJECT 23
in this position since 2008. While not provided with a motorbike on a full time basis, CCT provided one for her during the most intensive part of the training period.
4.2.2 Conclusions
CCT-promoted agriculture practices are generally gender-neutral, with men performing jobs requiring more physical strength and women performing those requiring more exacting and less physically strenuous labor;
CCT trainings were generally provided equally to men and women; FGDs consistently indicated that women manage household finances, with most household
financial decisions made by consensus between men and women; COCAR's agriculture activities directly result in increased household incomes and thus
support a general increase in family quality of life; CCT has a limited number of women field extension specialists.
4.2.3 Recommendations
COCAR's gender-neutral training approach is appropriate for supporting the expansion of commercial agricultural cash producing enterprises as it has the positive result of involving women more directly into the commercial activities of the farm and supports increased farm family income generation. This approach should be continued;
CCT should introduce a pro-active hiring policy to increase the number of female extension specialists, with special emphasis on cassava and cocoa production that are attractive new income sources for rural women;
Project training activities should address farm vs. household responsibilities and workload levels so that the more active inclusion of women does not lead to overburdening them.
4.3 CCT ORGANIZATIONAL AND INSTITUTIONAL SUSTAINABILITY IN THE ABSENCE OF DONOR FUNDING
4.3.1 Findings
Organization: CCT is the successor national business cooperative to the Indonesian Provincial Federation of Cooperatives (PUSKUD) that operated under Indonesian law prior to the Timorese National Referendum of Independence in August 1999. PUSKUD was reorganized as CCT in early 2000 and registered as a business cooperative under the Trade Law in effect during the UN Transition Administration for East Timor (UNTAET). At the time, the country did not yet have a Cooperative Law in place.
CCT inherited the basic organizational structure developed within the PUSKUD organic coffee unit, formed in 1994 when the NCBA-managed Indonesian Enterprise and Trade Development Project (IETDP) started working in Timor-Leste with USAID grant funding. Work started with two primary cooperatives, one in Ermera district, and one in Ainaro district (Maubisse subdistrict), that together had nearly 800 members. The main project office was located at its current site in Dili. A major coffee production and marketing study was undertaken during the first year to verify the coffee production and marketing potential with emphasis on these two districts. Conclusions and recommendations from this report provided inputs for the NCBA implementation strategy.
The CCT organizational model as a national “primary” or first level cooperative is quite unique in a developing country because it follows the US and international top down organizational model. This model, developed in the US and Europe to support the commercialization of small farmer agriculture, enables small-scale farmers to be part of a national or regional marketing organization able to capture significant marketing economies of size essential to minimize marketing costs and strengthen farmer marketing power when negotiating with large, often multinational buyers9. In
9 The formation and growth of US farmer business cooperatives, the role of NCBA in this development and the relevance for CCT is developed in detail in Annex 4.

MID-TERM PERFORMANCE EVALUATION OF THE COCAR PROJECT 24
contrast, the grass roots cooperative model most common in developing economies, while effective in building local member management and democratic decision-making skills, is almost always unable to take advantage of size economies that are essential to the objective of having a major economic impact at the national level while at the same time increasing the incomes of small-scale farmer members. As a result of CCT’s organizational format, members participate at regional or national meetings indirectly through elected representatives rather than directly, as is common with cooperatives formed at the local community or village level.
Prior to the NCBA project, farmers had picked ripe cherry and processed it into parchment by field-drying the berry and then removing the outer pulp by hand. The resulting parchment was of low quality and sold in low quality markets.
NCBA introduced a system that involved first buying ripe cherry only from farmers and then carefully managing the processing into green bean themselves to maintain tight quality control. The result was a much higher quality final product. The equivalent price paid to farmers for cherry during the first year of operation was four times higher than the equivalent price previously paid for parchment.
Following the NCBA implementation strategy, the PUSKUD organic coffee unit had grown, by 1999, to almost 17,000 members operating through 16 primary cooperatives that bought coffee cherry directly from farmers and sold it to the PUSKUD organic coffee division. Organic certification was received in 1995 with initial sales of high-grade Arabica coffee made to Starbucks. Organic high-grade coffee was sold to three main buyers: Starbucks and Royal Coffee in the USA, and H. A. Bennett & Sons in Australia and New Zealand. These three companies today remain the major buyers of CCT high-grade green bean coffee. CCT staff indicated that about 90% of all CCT coffee sales are to the premium Grade Arabica market with the rest (most of it Robusta), primarily to Europe for blending.
With PUSKUD restructuring as CCT in early 2000, the 16 primary cooperatives from the PUSKUD era assumed the name of Cooperativas Café Organicos (CCO) and served as community level cooperatives. Although never legally registered, these community organizations continued to use the CCO identification and serve the same functions as they had under the Indonesian system, including the election of local member representatives to attend the CCT AGM and serving as the sub-district buying point for farmers. When reregistering CCT in 2005 after enactment of the Cooperative Law Decree No 4 of 2004, CCT was registered as a primary cooperative and the CCOs were renamed Geographic Groups (GGs). They continue to serve as the sub-district level buying point but no longer elect representatives to the CCT AGM.
Farm Gate Coffee Purchases and Farmer Production: Coffee membership growth increased rapidly from 1994 to 1999 but at a more moderate pace than after the initial years of Timor Independence. Since 2005, membership has remained stable near the 21,500 mark. The original 16 GGs, plus two additional, continue to serve as the primary organizational point for buying farmer cherry. Table 4, next page, summarizes CCT cherry purchases during 2012 by district and by GG.
According to the table:
Coffee garden holdings are highly clustered between .75 and 1.3 hectares. Ermera district (including Aifu) accounts for almost 2/3 of the total cherry purchases.
Adding Ainaro and Manufahi districts accounts for fully 90% of total coffee purchases. Stated yields per hectare are quite variable.
Farmers in Ermera and Manufahi recorded the highest stated yields, which are three times greater than in Ainaro and Aileu10. Of the three remaining districts, Aileu appears to remain commercially competitive while Liquica and Bobonaro are at best marginal CCT coffee producers. It is important
10 The stated yield data as derived from CCT purchases most likely understate actual yields per hectare as some CCT member farmers sell part of their crop to other buyers.

MID-TERM PERFORMANCE EVALUATION OF THE COCAR PROJECT 25
to note that CCT coffee purchases in 2012 resulted in a direct cash infusion of almost $4.5 million to rural Timorese farmers, with $2.85 million (about two-thirds) distributed in Ermera alone.
Table 4: CCT Coffee Cherry Purchases by District and by GG, 2012
Per hectare yield variability between GGs is also quite large with Liquica yields and sales particularly low. Letefoho GG in Ermera and Turesci in Manufahi register yields considerably higher than other GGs. When interpreting this data, it is important to note that many farmers do not sell all of their coffee to CCT because it cannot legally require members to do so, nor would CCT have an interest in so doing as it prefers to purchase only high quality cherry. This was confirmed in the FGDs. Furthermore, farmers may also want to hold back some product and convert it to parchment for sale later in the season to more evenly spread out sales over the year.
Low purchases in Liquica and Bobonaro are most likely the result of additional factors specific to their locations. CCT prefers to buy the higher quality Arabica varieties that grow at higher elevations where road access is often difficult. While Liquica is a major coffee producing area, much of it lies in the lowlands dominated by Robusta varieties which are not purchased in quantity by CCT. Project staff also noted that road conditions in Liquica have deteriorated in recent years, making it more difficult to gain access to the more preferred Arabica varieties. They explained that low 2012 sales from Bobonaro district were also due to poor road conditions.
The 2005 farm sale distributions using the same data source indicates that Liquica was a significant seller of coffee to CCT in 2005 (4.6 million kgs) with Ermera, Ainaro and Manufahi together accounting for about 67% of total purchases, and Liquica 28%. By 2006, sales from Liquica had dropped to 700,000 kgs and have never recovered. Although Ermera and Manufahi consistently sell the largest amount to CCT and generally have the highest yield, year-to-year production variations can be very large, as shown in Table 5, next page.
District & GG Farmer
Members
(No)
Area *
Harvested
(ha)
Cherry
Purchased
(kg)
Farm Gate
Value
($)
Average
Price Paid
($)
Average Area/Farm
(ha)
Average Yield/ ha
(kg)
Average Sales/Farm
($)
Ermera District 7,702 8,406 6,955,963 2,782,385 0.40 1.09 827 361
GG Ermera – Hotino 1,406 1,872 1,071,740 428,696 0.40 1.34 573 307
GG Hatolia 1,422 1,522 1,009,525 403,810 0.40 1.07 663 284 GG Lauana 990 1,321 601,969 240,788 0.40 1.34 456 244 GG Letefoho 1,344 980 2,376,759 950,704 0.40 0.73 2,426 708 GG Atsabe 1,644 2,099 1,574,295 629,718 0.40 1.28 750 384 GG Railaco 896 613 321,675 128,670 0.40 0.69 525 145Ainaro District 5,193 5,993 1,634,232 653,693 0.40 1.15 273 126
GG Ainaro 695 713 586,225 234,490 0.40 1.03 822 339 GG Hatubuilico 1,194 1,520 368,092 147,237 0.40 1.28 242 124
GG Maubisse 3,304 3,760 679,915 271,966 0.40 1.14 181 82Liquica District 2,267 3,541 72,330 28,932 0.40 1.73 26 18
GG Liquica 755 1,093 39,035 15,614 0.40 1.45 36 21 GG Bazartete 293 423 0 0 0.40 1.45 0 0 GG Leorema 843 1,676 33,295 13,318 0.40 1.45 20 12Manufahi District 1,579 2,416 1,465,395 586,158 0.40 1.53 607 371
GG Same 632 1,557 276,205 110,482 0.40 2.47 177 175 GG Turiscai 947 858 1,189,190 475,676 0.40 0.91 1,385 504 Aileu District (GG) 2,996 2,300 841,535 336,614 0.40 0.77 366 113
Ermera‐ Aifu GG 1,478 1,337 166,695 66,678 0.40 0.91 125 45
Bobonaro (GG) 343 666 0 0 0.40 1.94 0 0
Total 21,558 24,660 11,136,150 4,454,460 0.40 1.14 452 207
* Assumes that all hectares are harvested and sold to CCT
Aileu, Ermera ‐ Aifu, and Bobonaro have only one GG per district
Source: CCT administrative records

MID-TERM PERFORMANCE EVALUATION OF THE COCAR PROJECT 26
Table 5: Variation in Annual Average CCT Coffee Purchases, 2002 to 2012
Year Cherry Yield per Average Average Farm
Sales $
Purchased (kg)
Hectare (kg)
Price / kg $
2012 11,136,150 451.0 0.40 224
2011 2,480,825 100.5 0.50 62
2010 17,042,700 690.3 0.30 257
2009 10,172,808 412.0 0.30 153
2008 18,716,347 758.1 0.30 282
2007 6,587,908 266.8 0.27 89
2006 14,358,027 597.7 0.22 146
2005 16,989,362 707.3 0.23 181
2004 16,125,674 671.3 0.23 171
2003 11,990,130 499.2 0.23 127
2002 13,100,178 545.4 0.18 139 Annual CCT cherry purchases since 2002 varied from a high of 18.7 million kgs in 2008 with 2011 being a disaster year at 2.5 million kgs. Purchases were low in 2007 but annual purchases were steadier during the 2002 - 2006 period. However, farm gate prices remained quite constant over the period with a slight price increase as the high grade premium coffee sold by CCT is subject to much less intra season variation in response to total production changes than is lower grade coffee.
CCT is not the largest Timorese coffee buyer and COCAR project staff estimate that its purchase by volume ranges from 30% to 50%. Other sources suggest that CCT’s purchases may drop below 30% by volume.11. However, CCT is the only buyer that exclusively purchases cherry as opposed to parchment, and at least 90% of its export sales are to high-end niche market buyers. As the start of the season price setter, this relationship has the effect of keeping farm gate prices higher than they would otherwise be if the market leader was a Timorese-based coffee buyer selling primarily to the low-end market.
World Coffee Prices and Risk Management: World coffee prices are determined on two commodity boards: the London International Financial Futures and Options Exchange (LIFFE) in London, which trades in Robusta coffees, and the NY “C” (Commodities) Market for Arabica in New York. Premium coffee sales are based on the NY “C” price, either above or below, depending on quality relative to that being priced on the exchange. The better the coffee (or the more scarce it is), the higher its differential will be above the “C.” The worse it is (or more readily available), the greater its differential below the “C.”
CCT green bean prices are negotiated based on the NY “C” but are not actually finalized until 6-9 months after CCT farm gate purchase prices are announced. Since CCT holds, in the name of its growers, International Organic, Fair Trade, and Starbucks Café Practices certifications, its negotiated price is usually well above the NY “C” and additionally, qualifies for a $.20 Fair Trade Premium. However, sharp intra season fluctuations in the “C” market require professional hedging skills to enable CCT to guarantee a fixed price for its members at the start of the season while the price received for their own product is not finalized until the follow March or April.
A marketing and management services company (MMSC), trading as “CCT – CBI Global Management Inc.,” was formed in 2008 with USAID funding as a joint venture between Cooperative Business International (CBI) and CCT. Its mandate is to provide long-term technical, marketing, financial, and management assistance to CCT within the framework of the new Timor-Leste Investment Law
11 MAF Directorate of Industrial Crops and Agribusiness, “Commodity Profile Series: No 9 Version 1 – Coffee.”

MID-TERM PERFORMANCE EVALUATION OF THE COCAR PROJECT 27
supporting the formation of joint ventures between Timor-Leste and international companies12. This access to international marketing and management support enables CCT to remain viable in international coffee markets and to maintain an international revolving fund credit line against which to draw funds to make up front cash payments to farmers upon purchasing the crop.
By providing CCT with access to international management and marketing expertise, as well as international credit lines, the MMSC also makes them liable to international audits and financial transparency laws in the same way that membership in the International Organic, Fair Trade, and Starbucks Café Practices ties them into international best employment and quality practices.
Long-Run Financial Sustainability: Although USAID has continually funded NCBA’s project activities since 1994, NCBA leadership maintains that the coffee production and processing activities have been self-sustaining since 2002 and that USAID funding has been used for expanding health care services and for the development of new income generating activities, including applied research to adapt new products to Timorese conditions. As evidence of the self-sustaining nature of the coffee enterprise they cite numerous capital investments financed from CCT profits, including: upgrading or renovating all district level wet processing facilities and the dry processing facility in Dili; buying land outside of Dili for use as a coffee drying field and the site of a new storage warehouse; building veterinary facilities to support the livestock fattening program; buying several new large trucks to transport cherry quickly to initial processing sites and to the second stage drying and warehouse site; major investment in health care services provided in selected districts, including an annual injection of operating costs from Fair Trade premiums; covering all costs of maintaining Organic, Fair Trade and Starbucks Café Practices Certification (some $300,000 annually for both direct and indirect costs); and all site acquisition and construction costs for the new Railaco training and demonstration farm and training center (in Ermera District), including installation of the new environmentally friendly Brazilian first stage cherry processing facility.
CCT is a successful and thriving business enterprise. Its success is based heavily on its ability to maintain a high quality niche market status that is dependent on retaining the Organic, Fair Trade, and Starbuck’s Café Practices certifications by continually proving that members meet the required organic and production and processing standards. In this regard, CCT has benefitted immensely from its association with NCBA, which is different from the direct USAID funding it has received since 1994.
Performing a detailed financial analysis of CCT was outside the scope of this evaluation, but analysis of project budget documents, and discussions with CCT expatriate and Timorese staff suggest that its technical coffee production and processing activities are managed completely by Timorese staff and would be sustainable in the event that donor funds are withdrawn. However, the project COP, based in Jakarta, Indonesia, and funded only part time by the project, is instrumental in marketing CCT coffee in international markets, and the project Deputy COP, based in Dili, maintains close oversight of the Organic, Fair Trade, and Starbucks’s Practices certification process, which is estimated to take about 15% of his allocated time. Moreover, USAID provides funding for an expatriate Financial Manager plus six Timorese accounting and bookkeeping support staff. These individuals provide overhead management support to the coffee processing activity, as well as to other CCT programs and activities. Senior Expatriate and Timorese NCBA and CCT management staff expressed their view that coffee marketing and oversight of the certification processes requires expertise not currently found in Timor-Leste.
12 CBI, a U.S. cooperative-owned trade and investment enterprise with a number of large U.S. cooperatives, including NCBA, as its primary shareholders, has since 1984 assumed a leading role in assisting development of international commercial activities focusing on the processing and export of a number of high value, labor-intensive tropical agricultural products. This formal commercial linkage between CCT and CBI enables CCT to gain access to professional marketing and management skills that are available to many other business cooperatives operating in developing countries and in the US. While providing access to top-level international management and marketing personnel it also makes CCT subject to relevant international business law requirements.

MID-TERM PERFORMANCE EVALUATION OF THE COCAR PROJECT 28
Anticipating the eventual withdrawal of donor funds led Timorese and NCBA management in 2008 to develop a joint venture management and marketing company between CCT and CBI to, for a fee, sell and market CCT export products on international markets including coffee, vanilla, and other spices. Moreover, NCBA has a well-respected reputation for continuing its technical, management and marketing support services for its international member cooperatives. This point is developed further in Annex 6 as it relates to work in Southeast Asia where business cooperatives continue to thrive well after the withdrawal of donor funds. In Timor-Leste, NCBA’s formal 20-year commitment to the development of the Railaco Demonstration Farm in association with CCT is another example of NCBA’s long-term outlook. Consequently, it is reasonable to expect that NCBA, as an international business cooperative technical support, management services, and lobbying group, will continue to support and nurture CCT as a part of its large family of farmer-supported business cooperatives.
This leaves the issues of financial management and certification process oversight to be addressed as a part of post donor operating procedures. It is accepted by project and CCT senior management that these positions should remain staffed by expatriate personnel, at least for the foreseeable future. It is suggested that certification oversight can be subsumed within the MMSC scope of work, and that the MMSC can provide such services on a contractual basis, because, similar to selling coffee and other CCT products on international markets, oversight of the Organic, Fair Trade, and Starbuck’s Café Practices certification requires knowledge of international developments and a sufficient understanding of procedural details to effectively manage these processes.
An analysis of expenditures by the project shows that undistributed management and overhead costs amount to about $1.5 million for the USAID contribution to the COCAR budget. Of this amount, about 25% is allocated to the project funded financial management and support staff (the latter are all Timorese). Given the wide range of activities now undertaken by CCT, including health care services, livestock fattening, cassava and cocoa research and development, coffee rehabilitation, shade tree and hardwood reforestation, etc. it is reasonable to conclude that no more than 25% of the financial management team time would be allocated to the coffee production, processing and marketing activity. This works out, at maximum to about $30,000 per year and is an amount that should quite easily be absorbed into the CCT general budget given its history of successful growth and expansion of its stock of capital assets.
4.3.2 Conclusions
Since 2002, CCT has been a profitable self-contained small-farmer producer organization providing gradually increasing levels of income and income generating opportunities to its more than 21,500 farmer-members. It has been profitable each year with the exception of 2011, when coffee production dropped precipitously due to bad weather;
Using profits from its coffee and other income generating activities, CCT has significantly upgraded and expanded its coffee production and processing assets and, in addition, has provided significant funds for health care services for its members;
CCT has used its position as an Organic, Fair Trade, and Starbuck’s Café Practices certified producer organization to improve member income, productivity, and access to free health care services;
CCT has created a sustainable coffee marketing organization by partnering with an NCBA-supported international cooperative marketing and management organization;
With minor adjustments, CCT, using the MMSC to coordinate Organic, Fair Trade, and Starbucks Café Practices, should remain financially viable in the event that donor funding is withdrawn, assuming the absence of recurring precipitous weather related crop production reversals or loss of its premium niche market status;
It can be expected, based on past experience in other countries where donor supported farmer cooperatives have graduated to full self-sustainable status, that the relationship developed over the past 20 years between NCBA and CCT will continue into the future, providing CCT with international business management, marketing and international product quality certification expertise to ensure its long run successful operation;

MID-TERM PERFORMANCE EVALUATION OF THE COCAR PROJECT 29
CCT has judiciously and efficiently used donor funding to improve farmer productivity and undertake applied research and farmer training to support these efforts;
CCT can, in its role as a well-managed producer organization, continue to efficiently utilize donor funding to expand and deepen small farmer productivity and income generating options;
While CCT is a well-managed and profitable business, some cooperative governance issues warrant attention in order to improve AGM member representation.
4.3.3 Recommendations:
Cooperative governance practices can be improved by reinstituting earlier procedures whereby representatives from the 18 GGs, as successor entities to the CCO community level organizations, can be associated directly with selecting representatives to the CCT AGM. The current system, whereby AGM representatives are elected for five-year terms, is not well understood by members and seems not to have any relationship to the GGs, which in the past provided the formal linkage between farmer members and their national leadership.
4.4 COMMODITY VALUE CHAIN FINANCIAL SUSTAINABILITY
COCAR's technical activities include coffee rehabilitation, expansion of cassava cultivation, introduction of cocoa and several improved tree species as potential commercial crops, expansion of cattle fattening activities, and expansion of CCT’s health service delivery activities. All activities, except for cassava and cocoa, were initiated under the earlier TERADP projects. The USAID Mission chose to include coffee rehabilitation, cassava cultivation, and the introduction of cocoa in the current evaluation. Agroforestry is viewed as an activity integrated with coffee rehabilitation and cocoa and will, therefore, be included as appropriate in the assessment of these two crops.
Like TERADP before it, COCAR's agriculture interventions include applied research and development activities to promote the commercial development of resource poor farm families. The CCT development approach generally recommends low resource technologies requiring few if any purchased inputs. Donor funds are used to cover initial startup investment costs including planting materials and technical training, while CCT provides a guaranteed market for products meeting Organic and Fair trade quality requirements.
4.4.1 Coffee Rehabilitation
Findings:
USAID funding for coffee rehabilitation represents 6% of the COCAR’s implementation budget, and NZ Aid funding represents 28%.
The COCAR Cooperative Agreement goal for the coffee subproject is13:
"Coffee Farm Development: … COCAR [will build] on successful past programs to train farmers to optimize plant populations, manage shade, improve fertility and take other measures to increase yields and maximize farm gate income."
The objectives summarized from the COCAR Cooperative Agreement are14 to:
Increase rural incomes through the rehabilitation of existing coffee farms. Initiate coffee farm production activities in the Ainaro and Hatubalico sub districts.
The activities of the coffee subproject, drawn from the COCAR Cooperative Agreement,15 include:
Farmer training in the several rehabilitation technologies.
13 COCAR Cooperative Agreement page 9. 14 COCAR Cooperative Agreement page 9, 11 and 14. 15 The COCAR Cooperative Agreement does not contain a log frame so these activities are drawn from the text.

MID-TERM PERFORMANCE EVALUATION OF THE COCAR PROJECT 30
Production of coffee and shade tree seedlings in CCT and farmer owned nurseries. Plant distribution. Equipment importation and distribution.
Progress to Date: Table 6, below, summarizes planned and actual implementation results and indicates that the program is meeting or exceeding all of its planned targets. Through September 2012, 1.2 million seedlings were distributed against a target of 1.4 million, and 3,626 coffee farms were rehabilitated against a target of 3,600. The apparent major decrease in pruning activity in 2011 – 2012 is because the pruning season runs from September to December and the 2011-2012 data only reflect the trees pruned through September 31. The full 2012 seasonal total was 722,095, bringing the total number of trees pruned for the two-year period up to 922,066 against a target of 720,000.
Table 6: Coffee Monitoring Data Through March 2012
Sector and
Indicator
Target Year 1
2010-2011
Target Year 2
2011-2012
Target Year 3
2012-2013
Target Year 4
2013-2014
EOP Totals
Plan Done Plan Done Plan Done Plan Done Plan Done
Total Coffee Seedlings Distributed
500,000 142,872 980,000 1,094,000 1,700,000 1,700,000 4,800,000
Coffee Farms Rehabilitated
1,200 1,226 2,400 2,400 3,600 4,800 12,000
Coffee Trees Pruned
240,000 272,066 480,000 84,833 720,000 960,000 960,000
Source: NCBA’s internal monitoring system
Using USAID funding, CCT has built up an impressive structure of nurseries that grow coffee, cocoa, shade and timber tree seedlings for free distribution to participating members. This network currently includes 30 large, private sector contractors that grow an average of 20,000 seedlings, and an additional 400 small-scale local nurseries that average 500 seedlings each. Using project funding, CCT trains the nursery workers and pays them for providing seedlings to farmers.
Technical Assessment: Coffee is Timor-Leste's number one non-petroleum export. Over 51,000 families, or about one-third of the country’s population, are involved in coffee farming. Coffee rehabilitation is perhaps the most important current Timor-Leste agriculture intervention because it will make a profound difference in the future incomes of thousands of families and in the local and national economy. In addition to COCAR, MAF and several Timorese and international NGOs are engaged in promoting coffee rehabilitation and are using the same renovation program.
The pruning system being introduced is a modified Beaumont-Fukunaga Vertical Pruning System, which has been used in Hawaii, among other locations, and shown to be particularly easy to manage. According to the system, the main tree trunk is cut to a height of about 30 cm (one foot), and all but three of the new branches that emerge are pruned to keep the tree about 1.8 meters (6 feet) tall. Based on experience with farmers adopting pruning practices in 2008, this technology is expected to more than double the yields of individual trees, both by breaking the alternate year production cycle associated with unpruned trees, and by providing new growth that supports increased yields.
Weeding, increasing tree planting densities, removal of old, diseased, and inappropriate shade tree species, and the introduction of leguminous shade trees, all represent new technologies for Timorese farmers. Gross margin analysis completed by the evaluation team (shown in Table 7) suggests that the new management system, while requiring additional labor, will increase per hectare yield by a factor of three and makes harvesting safer due to the reduced need to climb trees as the fruit can now be reached from the ground.
Table 7, next page, shows gross margin per family labor-day increase marginally with good agricultural practices from $6.49 to $6.61 after tree replacement.

MID-TERM PERFORMANCE EVALUATION OF THE COCAR PROJECT 31
Table 7: Summary for Gross Margin per Hectare and per Labor Day for Unimproved and Improved Coffee Garden Management
Model: Unimproved Improved Trees per hectare 1,479 2,000 % of trees replaced annually 0% 3% Yield per tree (kg) 0.7 1.65 Yield cherry per ha (kg) 1,036 3,003 Yield of parchment Not applicable Yield of green bean per ha (kg) 179 519 Gross income $/Ha $412 $1,195 Cash input costs $0 $90 Cash gross margin $/Ha $412 $1,105 Total family labor days (FLD) 64 167 GM per FLD $6.49 $6.61 Tree replacement 60 trees/yr/ha 30.00
Gross margin after tree replacement Per Ha. - $1,094 Per FLD - 6.52 Organic inputs No Yes Pruning No Yes Weeding Partial Yes
Simply picking coffee from an unproductive coffee garden that requires little other than labor input, can provide a reasonable return to time spent on harvesting but the technology is unproductive per unit area. There is a much greater improvement in gross margin per hectare in the improved management technology - from $412 to $1,094 per ha (a 265% increase). While the efficiency of coffee harvesting is improved with better coffee tree management, the labor involved from better agricultural practices increases from an average of 64 to 167 labor days. FGDs suggested that these increased labor requirements could be met by most rural households or by sharing work with other CCT local group members.
Coffee Market Impact on Farmer Profits: NCBA's business model is based on buying only cherry in order to control quality throughout the processing and marketing value chain, as shown in Figure 14. CCT is generally acknowledged to drive the annual price setting process for the larger traders16 who primarily purchase the parchment that is processed by individual farmers and sold later in the season. CCT's cherry buying provides several advantages to farmers, including cash payments at the time of sale and trucks sent to local communities, saving farmers the time and trouble of delivering crop to the buyer17.
As shown in Figure 14, next page, CCT buys cherry from more than 21,500 farmers directly from designated village buying points, with initial purchases starting in May.
Within 12 hours of being picked-up, the crop is usually delivered to one of three wet processing facilities: one in the central mountain region of Maubisse; and two in the primary coffee growing area in Ermera. After the initial pulp is removed, the resulting parchment is trucked to a CCT drying site in Tibar outside of Dili, where it is sun dried and then stored in a manner to equalize its moisture content.
16 The manager of one of CCT's competitors explained to one evaluation team member that he and his staff calculate their preferred price each year but then they always wait for CCT to set the price before they announce theirs. 17 A discussion of alternative Timorese business models is found in Annex 6

MID-TERM PERFORMANCE EVALUATION OF THE COCAR PROJECT 32
Figure 14: Coffee Subsector Map, CCT Business Model
Beginning in June, and generally lasting through August or early September, the parchment is taken to the dry processing plant in Dili where the outer husk and silver skin is removed. The green bean is then machine and hand sorted, bagged, and sold. Nearly 90% of the green bean is sold to high quality niche market buyers including Starbucks and Royal Coffee in the US and H. A. Bennett & Sons in Australia and New Zealand. Farmers selling parchment to other buyers are generally unable to consistently attain the high quality required to meet quality market standards. While the market price for parchment is higher than that for cherry, extra labor is required to produce parchment and not all buyers pay cash at the time of purchase. However, some farmers who live off the main roads often have no choice but to process cherry into parchment and then hire someone to deliver it to the buyer. Since cherry that is processed into parchment is a storable commodity, some CCT farmers, in addition to others who are unable to sell to CCT, keep a supply of parchment to sell throughout the season in order to have cash on hand to meet regular and unexpected household expenses.
Market Information Considerations: CCT broadcasts its prices over the radio on a limited basis at the start of each season and expects that word of the current price will then spread quickly among farmers. Moreover, except for 2012, prices are held constant throughout the season and in the future, CCT will continue to follow this price policy because lowering the price in the middle of the 2012 season caused a major panic among members who had not yet sold their cherry, resulting in CCT increasing prices to the previous level. Timor Global Corporation, a CCT competitor, does not broadcast prices however, because sales occur only at the factory, they believe that their price, which does vary over the season, becomes known very quickly.
While both of these competitors are acting within their perceived self-interest, the overall development goal for the coffee sector of maximizing farmer profits is best served by ensuring that

MID-TERM PERFORMANCE EVALUATION OF THE COCAR PROJECT 33
the prices of all competitors are freely disseminated. Addressing the problem of market information will help coffee farmers, and, if a broad market information system is introduced, farmers in other sectors as well.
There are many models worldwide for cost-effective market information systems. Oxfam in Timor-Leste is now testing a pilot text message service for coffee prices called MobileKafe, implemented through the Timorese NGO Kdadalak Sulimutuk Institute (KSI).
Environmental Assessment: There are no known negative environmental impacts from the coffee rehabilitation activity. On the contrary, numerous environmental benefits are expected, including the: reduction of erosion; creation of check dams and small terraces on the slopes; and planting of millions of trees over 20 years.
However, intensive cultivation places higher demands on soil resources and the coffee industry reports that the yields on organic coffee plantations in some regions are declining, suggesting that Timor-Leste may face depleted soil fertility in the coming years. NCBA's distribution of leguminous shade trees and experimentation with leguminous ground covers are steps in the right direction to address this problem.
Conclusions:
Implementation of the coffee activity is proceeding according to plan and schedule; The coffee rehabilitation program followed by CCT that includes pruning and new seedling
plantings has the potential to more than double farmer per hectare income; Improved dissemination of coffee prices has the potential to increase and stabilize coffee
farmer income beyond the May to September farm level coffee buying season; The soils of Timor-Leste are slowly being depleted of nutrients due to the lack of systematic
fertility management in the production of organic coffee.
Recommendations:
To capitalize on progress to date and to expand the potential impact of the project, donor funding for the successful CCT coffee rehabilitation programs, especially those associated with tree replanting, should continue after completion of COCAR in 2014 for small farmers who do not have available investment capital to meet startup costs;
Future funding should include consideration of the need to include an organic based soil fertility management component as part of any new or existing coffee rehabilitation program;
There is a need for increasing the amount and availability of viable farm level domestic price information within the coffee sector. To be accepted, this system should not be managed by a market competitor, but by an objective third party public or private sector entity.
4.4.2 Cocoa
Findings:
The cocoa activity represents about 3% of the COCAR implementation budget.
The COCAR Cooperative Agreement goal for the cocoa subproject is18:
"The COCAR project will work with researchers, extension specialists, and farmers to develop cocoa as a commercial crop and tap into the world markets."
The objectives summarized from the COCAR Cooperative Agreement are to:
Test the potential of a modern cocoa industry to increase rural incomes through the introduction of modern cultivars and cultivation methods, village-level and factory processing and export19;
18 COCAR Cooperative Agreement page 9.

MID-TERM PERFORMANCE EVALUATION OF THE COCAR PROJECT 34
Develop local and export markets for Timorese cocoa beans.
Activities of the cocoa subproject, drawn from the COCAR Cooperative Agreement include:20
Identifying cultivars for testing, obtaining and importing seeds; Developing a pilot activity with 350 farmers21 using plot sizes of approximately ¼ to ½
hectares; Selecting and planting demonstration plots; Farmer production training at least 3 times per cycle; Repurposing existing plant nurseries and developing new farmer-owned nurseries; Plant distribution; Farmer post-harvest handling and pulp production training; Building and operating, at NCBA/CCT’s own expense, a facility to process fermented cocoa
pulp into high quality cocoa beans; Using its own resources, NCBA will create an international market for Timorese cocoa
beans.
Technical Assessment and Progress to Date: The COCAR Cooperative Agreement22 cocoa development goal statement indicates that "Indonesia is one of the world’s leading cocoa producers. Currently, Timor-Leste has no commercial cocoa production although its climate and soils are capable of viably producing a crop. The COCAR project will work with researchers, extension specialists and farmers to develop cocoa as a commercial crop and tap into the world markets."
Figure 15, next page, provides an outline of the required implementation steps in the cocoa development process, and Table 8, below, shows monitoring data that traces the actual progress to date and suggests that the program is proceeding on schedule. Through September 2012, 47,600 seedlings were distributed against a planned distribution of 50,000; 250 farmers have been trained against a planned 200; and 63.5 hectares have been planted against a planned 50. An initial harvest of five mt is targeted for the October 2013 – September 2014 project year.
Table 8: Cocoa Monitoring Data Through March 2012
Sector and
Indicator
Target Year 1
2010-2011
Target Year 2
2011-2012
Target Year 3
2012-2013
Target Year 4
2013-2014
Totals as at EOP
2014
Plan Done Plan Done Plan Done Plan Done Plan Done
Seedlings distributed to participants
25,000 22,600 25,000 25,000 25,000 12,000 87,000
Households trained & planting cocoa
100 126 100 126 100 50 350
Ha. cocoa planted by participants
25 32 25 31.5 25 12.5 87.5
Mt. cocoa harvested
0 0 0 0 0 5 5
19 COCAR Cooperative Agreement page 11 and page 14. 20 The COCAR Cooperative Agreement does not contain a log frame so these activities are drawn from the text. 21 The COCAR Cooperative Agreement page 14 says there will be 1000 pilot farmers and later says 350 farmers. The Indicator Benchmarks Table on page 71 and in the semi-annual reports says 350. 22 COCAR Cooperative Agreement page 9.

MID-TERM PERFORMANCE EVALUATION OF THE COCAR PROJECT 35
Table 8: Cocoa Monitoring Data Through March 2012
Sector and
Indicator
Target Year 1
2010-2011
Target Year 2
2011-2012
Target Year 3
2012-2013
Target Year 4
2013-2014
Totals as at EOP
2014
Plan Done Plan Done Plan Done Plan Done Plan Done
USD farm gate value of cocoa sales
0 0 0 0 0 12,500 12,500
Source: NCBA Semi-Annual report
Figure 15: Program Development and Implementation Cycle, Cocoa
The science and technology being used is in accord with best practices and the technical analysis contained in the Cooperative Agreement is generally appropriate. As noted in Table 7 initial commercial production is not expected until the 2013-2014 project year – three years after the initial planting.

MID-TERM PERFORMANCE EVALUATION OF THE COCAR PROJECT 36
COCAR is introducing a new proprietary F1 type hybrid cocoa obtained in Indonesia further identified here as CCT-CT123. This hybrid was selected by COCAR staff because of its disease resistance and perceived potential for performance under Timorese conditions.
Test yields from the Indonesian F1 hybrid are consistent with other new varieties being introduced in Indonesia, but yields under actual Timorese conditions are not yet available. However, the cocoa trees in the CCT demonstration farm in Railaco are now setting pods, and by the end of the project, results from the demonstration trees can be compared with those in the Indonesian trial plots in order to make performance comparisons. Indonesian experience suggests that small farmer yields would be around of 400 to 800 kg per hectare, with maximum yields under ideal conditions going as high as 1.5 mt per hectare24. COCAR staff estimated the anticipated average initial year three yields to be 150 kg per hectare, increasing to 350 kg per hectare in year four, and to 500 kg per hectare in year five, with annual 200 kg per hectare yield increases up to year 15. These projected yields through year five are in line with farm level yields reported in Indonesia, but it is questionable if Timorese farmers will, on average be able to increase yields by 200 kg per year up though year 15.
The perceived resistance to disease, which was a major reason for selecting this particular variety, and the fact planting materials are being grown from seed and not grafted onto existing root stock, suggests that they will be strong enough to withstand the high winds that have uprooted cocoa trees in other countries.
Production Cost Considerations: Similar to coffee, farmers participating in the cocoa program have no direct input cost expenditures because CCT, using COCAR project funds, covers the cost of growing and distributing seedlings and provides salaries for extension training staff. The only farm family input required labor. FGDs with individuals now engaged in cocoa production indicated that existing family labor supplies were sufficient to meet expected short run labor requirements.
Market and marketing considerations: CCT's expectation that well-processed Timorese cocoa beans will be competitive is based on existing market conditions and assumes that that farmers will be Fair Trade and Organic Certified, thus providing them with access to the higher end niche market advantages enjoyed by coffee producers. Under existing development plans, farmers are expected to harvest, open, and store the cocoa pods, and then transport them to a central CCT buying point. The projected farm gate price is $2.50 per kg. By comparison, the 2012 – 2013 minimum Fair Trade Labeling Organization (FLO) Fair Trade price is $2.30 per kg, suggesting that the budgeted price may be a bit high. However, the international cocoa market is expected to remain strong over the near future as cocoa yields in many major cocoa-producing countries are declining as existing trees are subject to numerous diseases and yields as from mature trees decline. As noted above, the CT1 cultivar was selected because of the fact that in Indonesian research trials it has shown resistance to many diseases that are currently affecting trees in Indonesia and West Africa.
Environmental Considerations: The low input technology approach recommended by COCAR, including using shade cover plantations and no commercial fertilizers minimizes negative environmental impacts associated with high-fertilizer high-yield technology practices.
Conclusions:
Implementation of the cocoa activity is proceeding according to plan and schedule; The cocoa production technology introduced by COCAR is in accordance with existing best
practices; The technical and economic analysis supporting the introduction and development of the
cocoa activity is based on Indonesian research results, because to date, Timor-Leste has had no small farmer experience with commercial cocoa production;
23 CCT-Cocoa Test 1 24 I. W Yasa “Indonesian Cocoa Bean Current Situation” Indonesian Cocoa Farmer Association, Indonesian Cocoa Board (ICB), 2008

MID-TERM PERFORMANCE EVALUATION OF THE COCAR PROJECT 37
The experience to date suggests that the current cocoa applied research and development activity will successfully increase family farm incomes as cocoa trees come into full production.
Recommendation:
Small-farmer commercial cocoa development projects that cover the initial startup costs of establishing cocoa tree gardens should be considered for further donor support for cash poor farmers lacking the investment capital needed to cover these initial costs.
4.4.3 Cassava
Findings:
The cassava subproject represents 22% of the COCAR Implementation Budget.
The COCAR Cooperative Agreement goal for the cassava subproject is:25
"This activity will focus on the introduction of high yielding varieties and improving cultural practices resulting in improved food security. Additionally, the project will develop value-added processing and develop a local market for raw cassava and finished product (cassava flour and fiber) for both the local and export markets."
The objectives summarized from the COCAR Cooperative Agreement are to:
Improve food security through better varieties, cultivation, and processing of cassava; Develop local and export markets for cassava tubers, cassava chips, processed starch
(flour26), and fiber.
Implementation benchmarks and end of project status are summarized in Table 9 below.
Table 9: Benchmarks and End of Project Status Activity Expected End of Project Status
1. Replicate about 8 cultivars of cassava, sweet and bitter
Magnitude of the activity not specified
2. Establish commercial small farmer cassava cultivation
4,400 participating farmers
3. Develop a domestic market for sweet cassava tubers
Magnitude not specified
4. Develop a domestic market for bitter cassava chips
Magnitude not specified
5. CCT using own funds, construct a cassava chip processing facility to produce flour/starch
One completed processing facility
6. Sell part of the processed cassava flour to the domestic market
Magnitude not specified
7. Export cassava products, concentrating on cassava flour which would normally command the highest price of the various cassava products in trade
Magnitude not specified
Source: COCAR Cooperative Agreement
Progress to Date: Figure 16, next page, outlines the steps involved in setting up and implementing the cassava activity, and Table 10 summarizes actual progress to date. 25 COCAR Cooperative Agreement page 9. 26 Cassava has three major components: starch, fiber and water. Processed cassava contains varying proportions of these, with water eliminated from dried products. The terms "cassava starch" and "cassava flour" are used interchangeably in the common literature.

MID-TERM PERFORMANCE EVALUATION OF THE COCAR PROJECT 38
Figure 16: Program Development and Implementation Cycle, Cassava
Source: COCAR Semi-Annual Reports
Table 10: Monitoring Data for the Cassava Activity as of September, 2012
Cassava sector development
Base-line
Year 1 (2010 - 2011)
Year 2 (2011 - 2012)
Year 3 (2012 – 2013)
Year 4 (2013 – 2014)
End of project
Plan Done Plan Done Plan Done Plan Done Plan Done
Cuttings produced
0 500,000 1,091,200 500,000 1,787,807 500,000 500,000 2,000,000
Cuttings distributed to famers (stakes)
0 0 129,904 2,500,000 1,787,807 2,500,000 2,500,000 7,500,000

MID-TERM PERFORMANCE EVALUATION OF THE COCAR PROJECT 39
Table 10: Monitoring Data for the Cassava Activity as of September, 2012
Cassava sector development
Base-line
Year 1 (2010 - 2011)
Year 2 (2011 - 2012)
Year 3 (2012 – 2013)
Year 4 (2013 – 2014)
End of project
Plan Done Plan Done Plan Done Plan Done Plan Done
Households trained and planting cassava
0 200 874 1,400 2,596 1,400 1,400 4,400
Fresh cassava harvested (mt)
0 0 52.9 1,500 12,59727 12,000 24,000 37,500
Through September 2012, COCAR monitoring data indicate that 2.9 million improved stalk cuttings were produced for distribution to farmers against a target of 1 million; 1.9 million cuttings were distributed to farmers for planting against a target of 2.5 million; 3,500 households were trained against a target of 1,600; and 12,650 mt were harvested against a target of 1,500 mt. The figures indicate that cuttings produced for planting exceeded the target while the actual number distributed to farmers was just over half of the targeted figure. Actual fresh weight cassava harvested greatly exceeded the planned amount, although this number needs to be interpreted with caution because the figure is derived from the yield of 26 mt per hectare, used by Project staff to develop the activity budget. At least in the short run, it is not clear if this yield assumption is realistic as field data collected by the evaluation team in Covalima and Bobonaro from cassava activity participants did not exceed 7.5 mt per hectare28 (fresh weight). Applying this figure to the recorded monitoring data suggests that the actual harvested crop did not exceed 3,600 mt although this figure does still exceed the target.
CCT administrative data (see Annex 8) further indicates that 546 farmers, including 134 women, are enrolled in the CCT Cassava program sold cassava chips, stems, and skins to CCT in 2011, the first year of the program, valued at $27,130. In 2012, CCT paid $79,545 to these farmers including 56% for dried cassava, 39% for stems for replanting by other farmers, and 4% for skins used for cattle fattening at the CCT feedlot in Dili.
Varietal Selection and Food Security Considerations: As discussed in Section 4.1, sweet cassava is a major Timorese staple food that is grown and consumed by almost all farm families. It is also a staple food crop for non-farm Timorese as well and is readily available in local markets. However, the sweet cassava variety grown for human consumption in Timor-Leste is not economically viable when grown for the commercial production of starch or flour. Consequently, COCAR Project staff, when developing this project activity, decided to use an Indonesian developed variety known in Timor-Leste as Ca 10929. This decision was supported by the research findings of the Ministry of Agriculture/Seeds of Life (MAF/SoL) from 2001-2007, indicating that Ca 109 ranked second of all cassava cultivars tested, yielding an average of 88% above average. Moreover, Ca 109 has been shown in other countries to be widely adaptable to existing conditions and to be resistant to cassava blight and red mite.
Although the COCAR Cooperative Agreement indicated that up to eight varieties of commercial cassava would be introduced along with sweet varieties 30 , only the Ca 109 cultivar, which is
27 Based on planted area of 484.5 hectares and average yield of 26 mt per hectare
28 These yields were obtained for cassava intercropped with maize. Higher yields are possible under monocropping technologies using fertilizers and were used to develop the original project budgets.
29 Ca 109 is the SoL research designation of a cassava cultivar developed in Thailand named KU50. In Indonesia, it is named UG 5. 30 COCAR Cooperative Agreement p 3

MID-TERM PERFORMANCE EVALUATION OF THE COCAR PROJECT 40
designated as a bitter variety, is being used31. As noted above, the decision to use Ca 109 as the preferred cultivar for commercial processing is research driven and supported by Timorese cassava research specialists. An issue among some donor community observers is that COCAR has not introduced a sweet cassava variety that can be directly used to meet household food security requirements because Ca 109 does not have a particularly sweet taste and consequently, will not be widely accepted for human consumption. This lack of acceptance was confirmed during the evaluation team FGDs when an overwhelming majority of households participating in the cassava activity indicated that they prefer to use the current varieties for their own consumption. Only a small minority found the taste of Ca 109 to be sweet and would substitute it for their current variety if necessary. When asked to associate the cassava activity with food security, COCAR Project staff explained that the primary objective is to provide farm households with an additional source of income with which to purchase food as needed. This response is consistent with the USAID formal food security definition: "when all people at all times have both physical and economic access to sufficient food to meet their dietary needs for a productive and healthy life32,” suggesting that the current cassava activity is consistent with prevailing food security definitions.
Human Health and Safety Considerations: Ca 109 has been criticized by some that its toxic hydrogen cyanide (HCN) levels are too high to be safe for human consumption. SoL, as part of their cassava research program addressed this issue with results shown in Table 9.
Similar to other varieties, Ca 109 exhibits a considerable range of HCN levels year over year and between different locations. In 2009, for example, as shown in Table 11, the HCN content of Ca 109 was below that of the sweet variety in Loes, although generally above the sweet varieties in other districts.
Table 11: HCN Content of Selected Cassava Varieties 2009 (ppm)
Designation (name) Perceived taste
Aileu Betano Baucau Loes Average
Ca 015, (TL Ai-Luka 4) sweet 50 130 43 50 68.25
Ca 016, (TL Manetego) sweet 50 217 43 50 90
Ca 026, (TL Ai-Luka 2) sweet 37 75 43 23 44.5
Ca 109, (TH KU50) mixed 100 125 60 35 80
Source: SoL research trials
Given the research results and extensive Timorese experience with cassava as a food staple, Ca 109 should present no danger to humans or livestock if handled properly. Chemicals found in the cassava cells themselves break down the cyanide precursors in cassava. Any processing, such as grating, that breaks down cell walls releases the chemicals that break down cyanide and in a few hours, the poison is dispelled into the air. Cyanide is water-soluble and can be washed away and also dissipates during drying. Timorese cooks parboil the roots once or twice, discarding the water. The simplest animal feeds are prepared with grated dried cassava, but cooked cassava feeds also exist.
31 The designations of “sweet” and “bitter” varieties refer to the perceived taste after preparation. However, different varieties of cassava contain differing amounts of toxic hydrogen cyanide (HCN) which can be eliminated by using proper boiling procedures prior to consumption. Sweet varieties generally contain lower HCN levels than bitter varieties and so are generally considered “safer” for human consumption, while “bitter” varieties tend to be higher yielding and thus used for industrial production. 32 USAID Policy Determination PD-19, April 13, 1992.

MID-TERM PERFORMANCE EVALUATION OF THE COCAR PROJECT 41
Technical Assessment: The COCAR technical specifications for the cassava activity are reasonable and meet best practices criteria. However FGDs held with farmers participating in the cassava activity indicated that farm level yields for the Ca 109 variety are at least double those of existing sweet varieties even though Ca 109 observed farm level yields did not exceed 7.5 mt/hectare.
Overall, the cassava program is progressing according to plan with a few minor problems reported during the initial implementation phase. The COCAR cassava team reports weeds, lodging from too much water, and shade as the main problems. Other issues seem to result from the overly enthusiastic adoption of Ca 109 by farmers who choose not to sell the stems to CCT as agreed, potentially resulting in a shortage of stems for replanting. However, the cassava team reported that farmers are planting many stems on farms near CCT extension sites so the COCAR planting targets for the activity are almost on target (as shown in Table 11). The COCAR cassava team also reported that they were pleased with this response and were modifying their outreach plan to accommodate farmer activity.
Economic Assessment: The COCAR commercial cassava activity assumes that some farmers will purchase production inputs that can include fertilizer and machinery for land preparation and recommends that farmers use monocropping rather than intercropping technology packages. As a result, the cassava activity is a departure from previous CCT activities in which the initial investment risk (cost of seedlings, training, etc) was carried by CCT rather than by the participating farmer. Although growing cassava as a monocrop is the CCT recommended practice, project documents do not clearly state whether the projected yield of 26 mt per hectare is with or without the use of fertilizer. Since CCT does not provide credit to buy fertilizer and most farmers do not have sufficient cash for the purchase, most farmers will likely not use fertilizers. During the field visits in the major cassava growing districts of Manufahi, Covalima and Bobonaro, farmers did not use fertilizers and most intercropped the Ca 109 cassava with maize (corn), as is the traditional practice with sweet varieties used for food consumption.
Table 12: Summary of Gross Margin and Return per Labor Day for Cassava
Table 12, above, shows gross margin per hectare and gross margin per labor-day for cassava production scenarios including monocropping with and without fertilizer, and intercropping with maize using a recommended crop rotation to maintain soil fertility33. The model (discussed in detail in Annex 8) indicates that growing maize with cassava provides a higher gross margin per hectare (for both crops) than monocropping growing cassava which yields about 12 mt per hectare, even
33 The data is representative of 2013 conditions in Covalima District and models exclude transport cots to market as CCT collects the cassava at the farm gate, or at pickup points in rural areas. The cassava stem for planting are assumed to be retained by farmers at no cost.
CassavaIntercropped with
Maize1. Using MAF tractors Cassava 7.5 MT (fuel costs only) 12 MT /ha 26 MT /ha Maize 1.3 MT Gross Margin/Ha 895 1,580 1,174 Gross Margin/Labor Day 4.34 4.64 4.06
2. MAF tractor at full cost Gross Margin/Ha 846 1,531 1,125 Gross Margin/Labor Day 4.10 4.493. Excluding sale of cassava sticks full tractor operating costs Gross Margin/Ha 446 774 Gross Margin/Labor Day 2.16 2.67
US$Cassava as a Monocrop
Other Scenarios

MID-TERM PERFORMANCE EVALUATION OF THE COCAR PROJECT 42
though the return per labor-day is slightly lower at $4.06 for the intercropping compared to $4.34 for mono-cropping cassava at 12 mt per hectare. Growing cassava and achieving a yield of 26 mt per hectare results in a higher return per hectare and per labor day than either of the other models. However, if the application of fertilizer should be necessary to produce cassava at 26 mt per hectare, then the relative profitability advantage would be negated by the costs of fertilizer.
Traditional intercropping rotations include maize followed by mung beans or peanuts, which are planted between the rows of maize prior to harvesting. Indicative gross margin for this rotation is $1,080 per ha ($740 from maize and $340 for mung beans) and a return per labor day of $2.56. This is a lower return than the cassava options. However, the real attraction for farmers to grow cassava is that CCT guarantees to purchase the entire production, thus providing a market for farmers and income from their crop. This guaranteed market is the primary reason farmers commit to increasing the area of land they cultivate.
Environmental Assessment: The potential for negative environmental consequences of an industrial cassava industry in a low resource economy were not addressed in the initial project documents and discussion of these risks with COCAR project staff suggests that they are being pushed off to the future. Cassava is well adapted to the poor soil fertility conditions common in Timor-Leste and also responds well to fertilizer when monocropping technologies are used. As discussed in the previous section, the Cooperative Agreement is unclear about whether the projected 26 mt per hectare yield includes the application of fertilizer. Low resource farmers, however, tend not to apply fertilizer and, if cassava is monocropped without fertilizer for a sufficiently long time, the soil completely degrades and becomes unfit for farming. Therefore, SoL staff is deeply concerned about the risks to soil fertility from industrial cassava cultivation. While basic soil management techniques are available to maintain long run soil fertility, extension implementation techniques need to be developed and utilized by resource poor farmers considering monocropping cassava on an industrial scale.
Marketing Considerations: The world market for cassava flour and starch is growing rapidly because the range of uses for cassava is growing. For example, cassava can substitute as a biofuel input to replace higher priced maize and molasses34. The various world markets for cassava, while not as volatile as the markets for coffee and cacao, are nonetheless complex and should provide NCBA/CCT, with its experience maneuvering world commodity markets, to derive some advantage from market arbitrage.
COCAR’s expectation for well-processed Timorese modified cassava flour to be competitive in a mature industry appears justified based on the expected increases in demand as noted above. The evaluation team believes that the COCAR proposal to sell a portion of high-grade modified cassava flour on the local market has considerable merit. as cassava flour may be substituted for up to 1/3 of wheat flour in common bread and noodle products. Cassava flour is also widely used in sweets and as a gelling agent. These uses will offset wheat flour imports. Nutrient differences between cassava flour and wheat flour should be considered when recommending this substitution.
As noted in the summary of activity benchmarks, CCT is committed to building a modified cassava flour processing facility during the COCAR implementation period. The processing machinery has already been purchased, the installation contract has been signed, construction on the facility, located at the CCT warehouse in Tibar, is scheduled to start in April 2013, and the plant is expected to be operational for the upcoming 2013 harvest season.
Conclusions:
Implementation of the cassava activity is proceeding according to plan and schedule; The COCAR cassava technical assessment does not specify whether the projected cassava
yield (which is more than double recent yields) is obtained with or without the application of fertilizer and CCT’s promotion of monocropping technologies. Furthermore, it does not
34 Prakash, Adam. Cassava: International market profile. World Bank 2007 and many other reports

MID-TERM PERFORMANCE EVALUATION OF THE COCAR PROJECT 43
identify a procedure to maintain soil fertility over the long to prevent serious environmental soil degradation problems;
Gross margin analysis prepared by the evaluation team suggests that per hectare income is greater for cassava that is intercropped with maize than for monocropped cassava under low input technology conditions similar to those prevailing in Covalima district;
The current COCAR activity to introduce cassava variety Ca 109 for predominately industrial production does not conflict with the USAID Food Security definition that recognizes the inclusion of commercial crop production that provides income to meet food security needs;
On a modest scale, the COCAR cassava promotion activity has already demonstrated its potential to generate income. As it is scaled up, it will most likely be a successful income generator and improve food security primarily by providing additional income with which to buy food;
The CCT cassava processing facility will be built at the CCT Tibar site and is expected to be operational by late of 2013.
Recommendations:
COCAR should clarify fertilizer use assumptions and recommendations under which projected cassava yields are obtained and should consider promoting cassava-maize intercropping technologies in addition to cassava monocropping technologies;
COCAR should work with the SoL research team in developing and testing extension packages designed to win farmer compliance with a good fertility maintenance practices;
Semi-annual project reports prepared for USAID should include more discussion of the technical aspects of cassava program implementation, especially farmer adoption of soil fertility maintenance programs.
4.5 PROJECT IMPLEMENTATION EFFECTIVENESS AND ABILITY TO ATTAIN COOPERATIVE AGREEMENT OBJECTIVES
4.5.1 Findings
Over the years, the NCBA/CCT led development projects have provided USAID with good value for its money invested in small-farmer income producing enterprises. NCBA, both through the TERADP and the COCAR periods, has served as an outstanding donor development and investment vehicle for generating and expanding farm level income for small-scale coffee farmers and for supporting new small farmer commercial initiatives including vanilla, livestock fattening, agroforestry, cassava, and cocoa.
USAID provided $17.5 million in grant funding for the TERADP Project during the period July 2000 to September 2010, during which time CCT members earned a total income of $33.6 million from coffee sales. Moreover, since 2000, CCT has been one of the largest employers in Timor-Leste with 500 full time employees and up to 3,000 additional seasonal and indirect laborers per year. Conservative earnings assumptions suggest that USAID received a return of almost 160% over the 11 year period35 during which it funded the TERADP Project. Using the same approach to estimate returns for the COCAR Project yields a projected return on investment over the four-year period of 270%36.
35 The calculation assumes that full time workers in 2012 earned on average 1.5 times the minimum wage of $115 per month and that on average over the 11 year period, CCT employed 2,000 seasonal and indirect workers each year (including employees of companies providing services and supplies to CCT) for an average of 100 days per year at the minimum wage and then reducing this total by 9% per year to account for an annual inflation impact.
36 Removing the Health Services direct and allocated overhead costs results in COCAR estimated funding for the agriculture components of $5.62 million. CCT payments to coffee growers in 2013 and 2014 are assumed equal to those made in 2011 and 2012. Previously calculated 2011 and 2012 CCT payroll is taken from the earlier calculation forward by a 4% inflation factor for 2013 and 2014.

MID-TERM PERFORMANCE EVALUATION OF THE COCAR PROJECT 44
The CCT coffee collection, processing, and marketing activities are commercially viable and self-supporting, with all related capital investment funds coming from CCT profits since 2002. As a result, USAID funds dedicated to the agricultural development components are used to conduct research and development activities and most importantly, to provide startup investment inputs to CCT members, most of whom are cash and resource poor family farmers. Hence, the calculation of return on investment is a viable indicator of CCT’s successful use of donor funds.
This evaluation has further identified CCT as an effective private sector applied research implementation agent. Its recent investment in the new training and research center in Railaco (Ermera district) has the potential to conduct high quality applied research that is needed to field test new commercial and food security crop cultivars, and to develop, field test, and demonstrate to farmers the advantages of Timorese best practices and approaches.
The specific technical activities addressed by this evaluation: coffee rehabilitation; cassava; and cocoa, are meeting or exceeding PMP monitoring requirements. The coffee rehabilitation activity is also expected to provide significant long run income enhancing opportunities based on the experiences of farmers that participated in this program since 2008. Similarly, test results from areas outside of Timor-Leste with similar climatic and soil conditions suggest that the cocoa activity can provide increased income to small-farmer implementers. As a small tree crop, grown under a low input technology management system this activity also has positive environmental sustainability characteristics which make it a potentially attractive farmer investment opportunity.
Should USAID decide not to fund a new income generating research and development farmer investment support program after the completion of COCAR, the evaluation team expects that the positive and commercially viable working relationship between NCBA and CCT will continue following a path similar to those followed with other NCBA small holder farmer cooperative coffee projects located in Sulawesi (PUSPETA Luwu), North Sumatra (PUSKUD Sumatra Utara), and Aceh (Koperasi BQB). These cooperative ventures, all with early seed capital investments involving USAID, are now collectively among the largest processor/exporters of specialty Arabica coffee in Asia and have introduced other small-grower crop income generating activities that can serve as a model for future NCBA/CCT development.
4.5.2 Conclusions:
CCT provides a highly cost effective small farmer commercial development vehicle as donor funds are used to cover the cost of important farmer startup investment inputs for targeted resource poor farmers, including planting material and technical training. The CCT coffee processing and marketing enterprise is commercially self-sustaining with leadership dedicated to promoting small farmer commercial enterprise by providing guaranteed markets for products meeting Organic and Fair Trade quality requirements.
4.6 MONITORING SYSTEM EFFECTIVENESS FOR ACCURATELY REFLECTING PROJECT PROGRESS TOWARDS DESIRED OBJECTIVES AND USAID SUPPORTING REQUIREMENTS
This section uses a numbering format to more easily reference recommendations to conclusions and findings and to provide more easy reference to the matrix formatted monitoring tables
4.6.1 Findings
1. COCAR has a responsibility to monitor indicators in the PMP for USAID and the RMT for NZ Aid;
2. The NZ Aid RMT only covers the coffee activity for which it provides funding; 3. The monitoring indicators specified in the RMT are reported primarily to meet the
requirements of NZ Aid. They are not considered needed by CCT for its internal monitoring or planning purposes;

MID-TERM PERFORMANCE EVALUATION OF THE COCAR PROJECT 45
4. NCBA/CCT consider only four indicators to be sufficient for internal monitoring of the coffee activity37, including:
Number of coffee seedlings distributed, planted, and surviving Number of shade trees distributed, planted, and surviving Number of pruned coffee trees Number of farm family participants in the coffee activity
5. The RMT agreed between NZ Aid and USAID provides an adequate means for monitoring project progress which is not over-burdensome;
6. The RMT provides a number of indicators that can be used for an evaluation of COCAR’s impact, such as yield per hectare, and number of farmers participating in the program;
7. All the NZ Aid performance indicators are incorporated into the COCAR table of indicators; 8. The PMP, prepared for the original USAID-funded components, covers all the COCAR activities
including cocoa, agro-forestry, cattle fattening, cassava, and health; 9. The PMP indicators for the non-coffee activities provide an adequate means for recording
project progress and also provide some indicators which may be used for evaluation of project benefits;
10. Some of the indicators in the NZ Aid RMT have no targets specified but this is remedied in the COCAR indicators, where targets are specified;
11. One indicator, “number of farmers implementing pruning technique,” appears twice on the CCT indicator table, so CCT recommended that the duplicate be removed;
Note: Perhaps in the NZ Aid results measurement table this indicator was included several times as a means for measuring a) Provision of proper pruning and maintenance techniques by training and mentoring, and b) Training in the use of organic compost (rather than as a duplicated indicators).
12. The “coffee cherry price returned per hectare” indicator for coffee rehabilitation should be changed to “coffee cherry yield per hectare.” This indicator, specified by NZ Aid, is intended to measure the objective of ‘Increase in Value of Rehabilitated Farm’; The unit of measurement (baseline 400 kg per ha) for the existing indicator is also replicated in the first indicator in the table, which measures yield instead of the actual the indicator (income).
13. The indicators for the coffee activity do not disaggregate the result achieved from NZAid and from USAID share of the budget. (The NZ Aid share of the budget for coffee rehabilitation is 4.7 times larger than the USAID share). However, should NZ Aid wish to somehow disaggregate the results according to the budget, this can be done by multiplying the total achievement of COCAR in the coffee activity by the relative share of the NZ budget for this component38;
14. For training there is an indicator in NZ Aid RMT “Number of farmers coping with training.” Coping appears to be a misprint;
15. Training: There are several types of training and technologies mentioned and these are measured using numbers of farmers attending training or adopting technologies; however, the actual trainings/technologies are not clear, and the numbers by type are not shown;
16. Training is mentioned for nursery growers. This training is not reflected in the indicators; 17. For agro forestry, there are different types of seedlings distributed (Teak, Mahogany, Beech, fruit
trees etc.). These are disaggregated in the COCAR semi-annual report (end Sept 2012) but are not shown explicitly in the monitoring table of indicators;
18. Environmental training is mentioned, but the scope of this training is not clear; 19. Under shade and pest control (4th indicator on page 3 of the COCAR indicators) there is an
indicator “Percentage of program area covered by medium and high canopy shade trees.” CCT suggest deleting this indicator as it is difficult to measure;
20. CCT makes revisions to the targets when COCAR exceeds the original targets;
37 Meeting with COCAR Chief of Party at CCT offices 8 February 2013
38 In a team meeting with NZ Aid on 8 February, they indicated that this was not an issue of concern.

MID-TERM PERFORMANCE EVALUATION OF THE COCAR PROJECT 46
21. Cattle: The model has been changed for the cattle activity in two respects. First, cattle are no longer exported, but are sold on the domestic market in Dili. Second, whereas initially only young bulls were distributed to CCT members for fattening, now females are distributed as part of a breeding component. Changing the model is a valid strategy and is more suited to Timor-Leste’s needs. However, only the cattle fattening is funded from the COCAR budget so the monitoring indicators only need to monitor the cattle fattening;
22. Database: A number of databases are maintained under COCAR. For coffee rehabilitation a customized database (apparently written in SQLOG software) captures all data collected in the coffee monitoring data sheets. This database can produce customized reports disaggregated by districts. For the health activity a database is currently being constructed 2 (this report does not cover the health activity, which will be the focus of a separate evaluation). For the other COCAR activities of agro-forestry, cocoa, cassava and cattle fattening, the data records are stored in Excel files. While Excel can be used as a database and may be adequate in a single-user environment, it is unsuited to a multiple-user environment because the data can easily be corrupted by inappropriate sorting of the data or accidental deletion of data – i.e. rows and columns in the sheets. Excel is also not a relational database, so it can be clumsy to produce disaggregated reports (by district, sub-district, or by group, as an example) and to produce reports which use variables stored in different sheets; this is because the intermediate tables must be created manually in Excel, whereas in a relational database (such as Access) this intermediate table is created automatically by the software. In Access, the data is also more robust because it is more difficult to accidentally delete or corrupt the data, and a user-friendly interface may be constructed for use by multiple users. The evaluation team observed that for the coffee rehabilitation activity it was quite easy for CCT to produce the tables requested by the team for disaggregated data; however, for cattle fattening and for cassava it was more time consuming to produce the requested information;
23. Other milestones are not mentioned in the COCAR indicators, but merit mention explicitly in the results measurement table, these include: Building the Railaco Training Center, a cassava processing factory, a marketing protocol for cassava, a beef cattle export protocol with Indonesia (possibly now abandoned, but still needed), major items of procurement, staff recruitment, possibly the organic and fair trade certifications or auditing;
24. The COCAR objectives are: 1. Improved food security; 2. Improved incomes; 3. Reduced environmental degradation; 4. Enhanced health care; and 5. Build human capacity;
Indicators for the environmental objective are not identified; Food security is not measured in the table of indicators and is only an indirect benefit of
improved incomes. Mention is made in the semi-annual reports of food security enhancements through cassava production, but COCAR produces cassava predominantly for processing, not as a food crop;
Training for farmers is expressed in good results for the enterprise activities. However, there is also training for CCT staff. This CCT employee training seems not to be reflected in the results measurement table (or in the COCAR indicators).
25. For coffee farmers monitored, data is captured firstly by registering all the farmers who will participate in the coffee rehabilitation activities during the year. This is the base number of coffee farmers; subsequent activities are monitored for all these participating farmers. So for each activity monitored the number of records should equal the number of registered farmers. For coffee, the important steps during the year are as follows:
Table 13: Coffee Activity During the Year
Jun Jul Aug Sep Oct Nov Dec Jan Feb Mar Apr May
Registration Pruning Distribute seedlings
Maintenance /1
Harvesting
1/ sucker removal, organic fertilizer, weeding, soil molding, etc.
MID-TERM PERFORMANCE EVALUATION OF THE COCAR PROJECT 47
26. The four districts in which coffee rehabilitation is undertaken (Aileu, Ermera, Manufahi, and Ainaro) include 13 farmer geographic groups (formerly CCOs). For each geographic group there are 8 to 12 CCT technical staff, or 123 technicians in all. Since there are four months over which pruning is carried out, there are 120 day over which to collect the monitoring data on pruning. With 2,400 farmers entering the COCAR coffee rehabilitation in year 2, this is around 20 farmers to be monitored per technician for new entrants in year 2, 30 new entrants per technician in year 3, and 40 new entrants per technician in year 4 (at 100 farmers per technician over the life of the program). The collection of the monitoring data with the staff resources available appears to be a manageable task.
4.6.2 Conclusions
The RMT, agreed between NZ Aid and USAID, provides an adequate means for monitoring project progress for the coffee activity;
This results table also provides a range of indicators which may be used to measure the impact of COCAR, such as yield per hectare, number of farmers participating in the program.
The NZ Aid performance indicators are incorporated into the COCAR table of indicators as reported by CCT;
The PMP covers all the COCAR activities of coffee, cocoa, agro-forestry, cattle fattening, cassava, and health;
The PMP indicators, for the non-coffee activities, provide an adequate means for recording project progress, and also provide a range of indicators which may be used for evaluation of project benefits;
The indicators for coffee do not disaggregate the results of the expenditure by NZ AID from the overall expenditure on coffee rehabilitation activities; however, this is not of concern;
Training of CCT staff is a significant achievement under COCAR, but CCT employee training and capacity building is not now reflected in the COCAR indicators;
The COCAR monitoring data is collected by the CCT technicians in the course of their normal working activities; in this respect the monitoring is practical and sustainable.
4.6.3 Recommendations
In the COCAR table of indicators, it would be helpful to include as sub-headings the objectives intended to be monitored, such as: – Improved household income of coffee farmers (with indicators listed below) – Increased production of better quality of coffee cherry (with indicators listed below);
The two duplicate indicators, which CCT suggest are redundant, should be removed. These are: – Number of farmers implemented pruning technique (half way down page 2 of the
indicator table) – Number of farmers implemented pruning techniques (at the bottom of the table, page
2); Indicator for coffee rehabilitation “Coffee cherry price returned per hectare” should be
changed to “Coffee cherry yield per hectare.” This indicator is intended to measure the objective of ‘Increase in Value of Rehabilitated Farm’ (refer 13 above in Findings);
COCAR has a primary objective of improving farm incomes, the income per hectare, or of the average coffee farm, should be included as an indicator. If COCAR fails to achieve an improvement in incomes, when yield per hectare increases then justifiable reasons can be developed for not achieving the target;
For training, there is an indicator in NZ Aid Results Table “Number of farmers coping with training.” This should be changed (as suggested by CCT in the PMP) to number of farmers adopting technologies;
There are a number of indicators which could be more explicitly stated in the table of indicators, including:

MID-TERM PERFORMANCE EVALUATION OF THE COCAR PROJECT 48
– Training: There are several types of training and technologies in which COCAR conducts training; these are measured using numbers of farmers attending training or adopting technologies. It would be helpful to list by name the actual trainings/technologies and to state the result for each training or technology.
– Training for nursery growers. This training is not reflected in the indicators, but it would be helpful if it were included under the indicator for satellite nurseries established;
Different types of seedlings distributed within the Agroforestry activity (teak, mahogany, beech, fruit trees etc.). These are disaggregated in the COCAR semi-annual report (end Sept 2012). It would be beneficial to have the tree types which are distributed disaggregated in the indicator table;
Under shade and pest control (4th indicator on page 3 of the COCAR indicators) there is an indicator “Percentage of program area covered by medium and high canopy shade trees.” Because shade trees are important for the survival of coffee an indicator such as “% of area planted in the recommended density of shade trees” could be used. The original target is 80% to be covered in medium or high canopy shade trees;
Indicators that exceed their target should be reported as overachievement rather than the indicators revised to reflect the overachievement as achievement against the original targets will be better measured;
A customized database should be developed for the COCAR activities of cassava, cattle fattening, cocoa and agro-forestry to complement the one that already exists for the coffee rehabilitation activity;
There are some additional and significant milestones that are part of COCAR (refer 24 in findings above) that should be listed and reported against in the COCAR results table;
Training of CCT staff is a significant achievement under COCAR and should be reflected in the COCAR indicators.
MID-TERM PERFORMANCE EVALUATION OF THE COCAR PROJECT 49
ANNEXES

MID-TERM PERFORMANCE EVALUATION OF THE COCAR PROJECT 50
ANNEX 1: INDIVIDUALS CONTACTED

MID-TERM PERFORMANCE EVALUATION OF THE COCAR PROJECT 51
Individuals Contacted: 1 Abel Ximenes Vice-Minister, Ministry of Commerce, Industry & Environment 2 Abrani Manuel NZ Aid Development Programme Coordinator 3 Adelino do Rego Senior Lecturer, Agricultural Economics, University of Timor- Leste 4 Aleixo Cardosa CCT Technical Staff for cassava Suai 5 Alfredo Soares Chief Dept. Technical Support, MAF Maliana 6 Angela Rodrigues Project Management Specialist 7 Anna Mosley Manager, NZ Aid 8 Annie Major Project Coordinator, Financial Literacy Project Phase III, World Education, Moris Rasik 9 Antonieta Maria dos Santos Director, Kdadalak Sulimutuk Institute (KSI) 10 Antonio Campos dos Santes Business Advisor, Cardno MDF 11 Antonio Maia MAF Food Security Officer, Bobonaro 12 Antonio Rego Owner, Café Crystal 13 Arcanjo da Silva Cooperative Advisor, Ministry of Commerce, Industry & Environment 14 Ariana Almeida Founder, Empreza Diak 16 Aris Wibawa Cacao and Coffee Rehabilitation leader, COCAR Project 16 Beatriz Prego Coffee Rehabilitation Specialist, Manufahi District 17 Bency Issac Enterprise Development Officer, COCAR Project 18 Bobby Lay Director, Timor Global 19 Carlos Berek MAF Extension Coordinator Tilomar Suco, Suai 20 Cipriana Soares Cacao staff, GIZ Cacao Program 21 Crystal Johnson Program Support Manager, Oxfam 22 David Boyce DCOP COCAR Project 23 Elfrieda Sinaga Early Childhood Care & Development Specialist, World Vision, Maliana 24 Eusebio dias Quintas Manager, Coffee Processing Facility, CCT 25 Felisberto Pinto Cocoa and Agroforestry Manager, CCT 26 Filipe Suspiro Monitoring Specialist, GIZ RDP4 27 Francisco Lopes Extension Supervisor, Aileu District 28 Geraldine Zwack Country Director, CARE 29 Gerard Choeng Rural Development, AusAID 30 Germinino Amaral dos Reis Chairman, CCT Board of Directors 31 Heinz-Josef Heile Cacao leader, GIZ Cacao 32 Irene Pereira Santos Coordinator, GIZ, Maliana 33 Ito Junko Country Representative, PARCIC 34 Januario de Neri CCT Technical Staff for cassava Suai 35 Jessie Snaza Agriculture Officer, USAID/Dili 36 John Dalton Director, Seeds of Life 37 Jose Goncalves Director, MCE&A 38 Jouquim Sousa MAF Livestock Officer, Suai 39 Kimberly Bostwick Deputy Program Officer, USAID/Dili 40 Koes Hartojo Cassava and Agro-forestry Adviser COCAR Project 41 Leopoldina do Santos Finance Officer OHM, Maliana 42 Lomelino Salsinha Rehabilitation Coffee Manager, CCT 43 Luc Spyckerelle M&E Advisor, Seeds of Life 44 Manual Gusaml Soils, Univ of TL 45 Manuel da Costa Project Officer, CARE Maliana 46 Manuel Morares Project director, GIZ RDP4 47 Maria de Araujo Dos Reis Project Manager, Oxfam 48 Mario Moseno Extension Agent, Aileu District
MID-TERM PERFORMANCE EVALUATION OF THE COCAR PROJECT 52
49 Mautinho Bere Coordinator Oxfam Suai 50 Miguel Soares Extension Agent, Manufahi District 51 Moises Dorego Manager, Maubisse Wet processing Facility, CCT 52 Muhammad Rosedi Cattle Management Adviser CCT 53 Mujaddid Mohsin Results Measurement Specialist, Cardno MDF 54 Naoki Nawa Business Division, Alter Trade Japan 55 Nicolau Vasconselo Cattle Program Manager, CCT 56 Nicole Seibel School Dropout Prevention Program, CARE 57 Nuno Tolentino Project Coordinator FSP, World Vision, Maliana 58 Osorio Verdial Postharvest, Univ of TL 59 Rick Scott Mission Director, USAID/Dili 60 Rince Nipu Managing Director, OHM, Maliana 61 Robert Williams Research Advisor, Seeds of Life 62 Roberto Florindo Managing Director, ELSAA Café 63 Ryder Rogers Private Enterprise Officer, USAID/Dili 64 Ryou Nagai Country Representative, Peace Winds Japan 65 Samuel Filiaci Chief of Party, COCAR Project 66 Shigehito Takahasi Staff, PARCIC 67 Silvino Lopes Head Dept. Information, Data Management and Dissemination, National Statistics Directorate 68 Sisto Moniz Piedade General Manager, CCT 69 Terence McCaughen Country Director, PLAN International 70 Vincente de Jesus Treasurer, CCT Board of Directors 71 Vincente Paolo Sr. Lecturer Marketing, Timor-Leste University 72 Zefecino Amuel Guterres MAF Agronomy Officer, Suai
MID-TERM PERFORMANCE EVALUATION OF THE COCAR PROJECT 53
ANNEX 2: EVALUATION SCOPE OF WORK

MID-TERM PERFORMANCE EVALUATION OF THE COCAR PROJECT 54
SECTION C – STATEMENT OF WORK C.1 TITLE Mid-Term Evaluation of Consolidating Cooperative and Agribusiness Recovery (COCAR) C.2 INTRODUCTION The United States Agency for International Development (USAID) and the National Cooperative Business Association (NCBA) have a long history of support for Timor-Leste’s coffee sector. The first coffee project was implemented in 1994, long before Timor-Leste became a recognized independent nation. Through more than a decade of work, NCBA developed the Cooperativa Café Timor (CCT)—a national- level, member-owned cooperative—through grants provided by USAID. CCT is now the nation’s largest cooperative and the leading exporter of coffee, Timor-Leste’s primary non-petroleum export. NCBA continues to work closely with CCT in implementing the Consolidating Cooperative and Agribusiness Recovery (COCAR) project in order to build the capacity of CCT and achieve project objectives. C.3 EVALUATION PURPOSE USAID/Timor-Leste seeks an independent mid-term performance evaluation of the COCAR project that will also look more broadly into USAID/NCBA’s long-term involvement in Timor-Leste. The evaluation will cover the entire COCAR agreement from 2010 to date, but will also utilize data available from previous projects and CCT records to establish or reconstruct baseline data as needed. The selected evaluation team will examine the technical and managerial performance of the COCAR project, including implementing partner NCBA and partner organization CCT. The evaluation will provide a comprehensive overview of the activities and interventions being implemented under COCAR and identify project strengths and areas for improvement. The evaluation will also assess the current capacity level of CCT and verify its ability to function in the absence of donor funding. The evaluation will be used by USAID/Timor-Leste to inform decisions on project adjustments needed to ensure achievement of the project objectives and maximize results while informing future decisions on project interventions. While the evaluation is intended to serve as a mid-term evaluation of the COCAR project, it is important to remember that the current activity is, in reality, the most recent version of a series of interventions that have supported coffee and other value-chains in Timor-Leste. Since 1994, NCBA served as the implementing partner for USAID funded activities to strengthen CCT and they continue in this role to date. Key criteria to be looked at by the evaluation include the following: Relevance The evaluation team should gather information from a variety of key stakeholders, such as NCBA, CCT, civil society NGOs working in the agriculture sector and representatives from the local and national government, to gauge their perspectives and opinions on the project’s importance and relevance at household, local and national levels. Effectiveness & Efficiency The evaluation team will assess the effectiveness of the project in terms of planning, ability to track the implementation of the project activities and reporting. In addition to this, the team will analyze the overall efficiency of project implementation and cost effectiveness project activities.
MID-TERM PERFORMANCE EVALUATION OF THE COCAR PROJECT 55
These analyses should take into consideration country specific constraints and provide recommendations or alternatives to improve effectiveness and efficiency. Impact The development of CCT as the nation’s preeminent exporter of organic coffee should be considered to evaluate the impact interventions have had on rural livelihoods and to determine the extent to which USAID’s long-term interventions have had a real impact on alleviating poverty for target groups. Many of the project’s interventions are intended to have long-term benefits, which may not be fully realized during the time frame of the current project; however, NCBA in collaboration with CCT has been working in some of these areas for many years. COCAR is a follow on project to the Timor Economic Rehabilitation Development Project, (TERADP) that was initiated by USAID/Indonesia and evolved from earlier projects implemented prior to independence. All of the COCAR activities, with the exception of cassava and cocoa, are being continued from earlier projects. Therefore, the benefits of interventions from past projects should now be apparent. For example, coffee rehabilitation began in 2008 under the TERADP project, and it would be useful to understand to what extent this intervention has improved the productivity of targeted coffee farms, and what impact this ultimately had on the livelihoods of rural households. More generally, USAID has been supporting Timor-Leste’s coffee sector since 1994, and would like to have a better understanding of the impact that this involvement has had on beneficiaries. Due to the importance of coffee to CCT and its member farmers, a particular focus should be placed on assessing the effectiveness of coffee rehabilitation efforts in improving production and its potential and effectiveness for increasing farmer incomes and alleviating poverty. Additionally, the evaluation should assess the impact that the project has had on improving household-level food security and nutrition. While improved nutrition is not an objective explicitly outlined in the cooperative agreement, it is an important indicator of the intervention’s progress towards the desired outcome of improved well-being. Monitoring The evaluation team should assess the current monitoring system and provide recommendations for improving its ability to collect disaggregated data by source funding and to improve the evidence-base for evaluating project impact and progress towards project objectives. With the addition of $3 million in funding from the New Zealand Aid Programme, USAID also needs to make certain that monitoring systems are sufficiently disaggregated to track the impact of this additional funding. Sustainability The evaluation should analyze NCBA’s approach to build capacity among local institutions and people to implement project activities and continue these activities in the absence of technical and financial assistance. The evaluation team should identify potential weaknesses or threats to sustainability and provide recommendations for addressing them. The evaluation should also take into account the commercial viability, financial sustainability and cost structures of value chains to analyze their current and/or potential profitability for both the farmers and CCT, and the financial and technical capacity of CCT to continue working in these areas after the project’s completion. a. Audience and Intended Uses
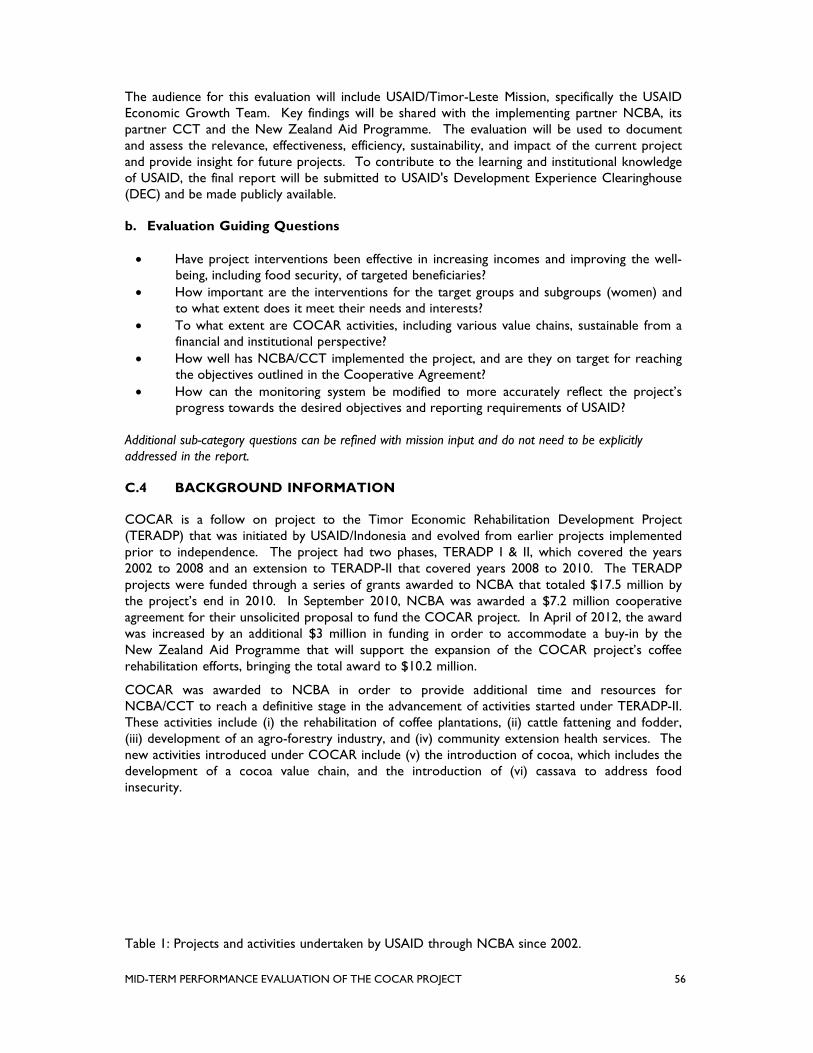
MID-TERM PERFORMANCE EVALUATION OF THE COCAR PROJECT 56
The audience for this evaluation will include USAID/Timor-Leste Mission, specifically the USAID Economic Growth Team. Key findings will be shared with the implementing partner NCBA, its partner CCT and the New Zealand Aid Programme. The evaluation will be used to document and assess the relevance, effectiveness, efficiency, sustainability, and impact of the current project and provide insight for future projects. To contribute to the learning and institutional knowledge of USAID, the final report will be submitted to USAID's Development Experience Clearinghouse (DEC) and be made publicly available. b. Evaluation Guiding Questions Have project interventions been effective in increasing incomes and improving the well-
being, including food security, of targeted beneficiaries? How important are the interventions for the target groups and subgroups (women) and
to what extent does it meet their needs and interests? To what extent are COCAR activities, including various value chains, sustainable from a
financial and institutional perspective? How well has NCBA/CCT implemented the project, and are they on target for reaching
the objectives outlined in the Cooperative Agreement? How can the monitoring system be modified to more accurately reflect the project’s
progress towards the desired objectives and reporting requirements of USAID?
Additional sub-category questions can be refined with mission input and do not need to be explicitly addressed in the report. C.4 BACKGROUND INFORMATION COCAR is a follow on project to the Timor Economic Rehabilitation Development Project (TERADP) that was initiated by USAID/Indonesia and evolved from earlier projects implemented prior to independence. The project had two phases, TERADP I & II, which covered the years 2002 to 2008 and an extension to TERADP-II that covered years 2008 to 2010. The TERADP projects were funded through a series of grants awarded to NCBA that totaled $17.5 million by the project’s end in 2010. In September 2010, NCBA was awarded a $7.2 million cooperative agreement for their unsolicited proposal to fund the COCAR project. In April of 2012, the award was increased by an additional $3 million in funding in order to accommodate a buy-in by the New Zealand Aid Programme that will support the expansion of the COCAR project’s coffee rehabilitation efforts, bringing the total award to $10.2 million.
COCAR was awarded to NCBA in order to provide additional time and resources for NCBA/CCT to reach a definitive stage in the advancement of activities started under TERADP-II. These activities include (i) the rehabilitation of coffee plantations, (ii) cattle fattening and fodder, (iii) development of an agro-forestry industry, and (iv) community extension health services. The new activities introduced under COCAR include (v) the introduction of cocoa, which includes the development of a cocoa value chain, and the introduction of (vi) cassava to address food insecurity. Table 1: Projects and activities undertaken by USAID through NCBA since 2002.
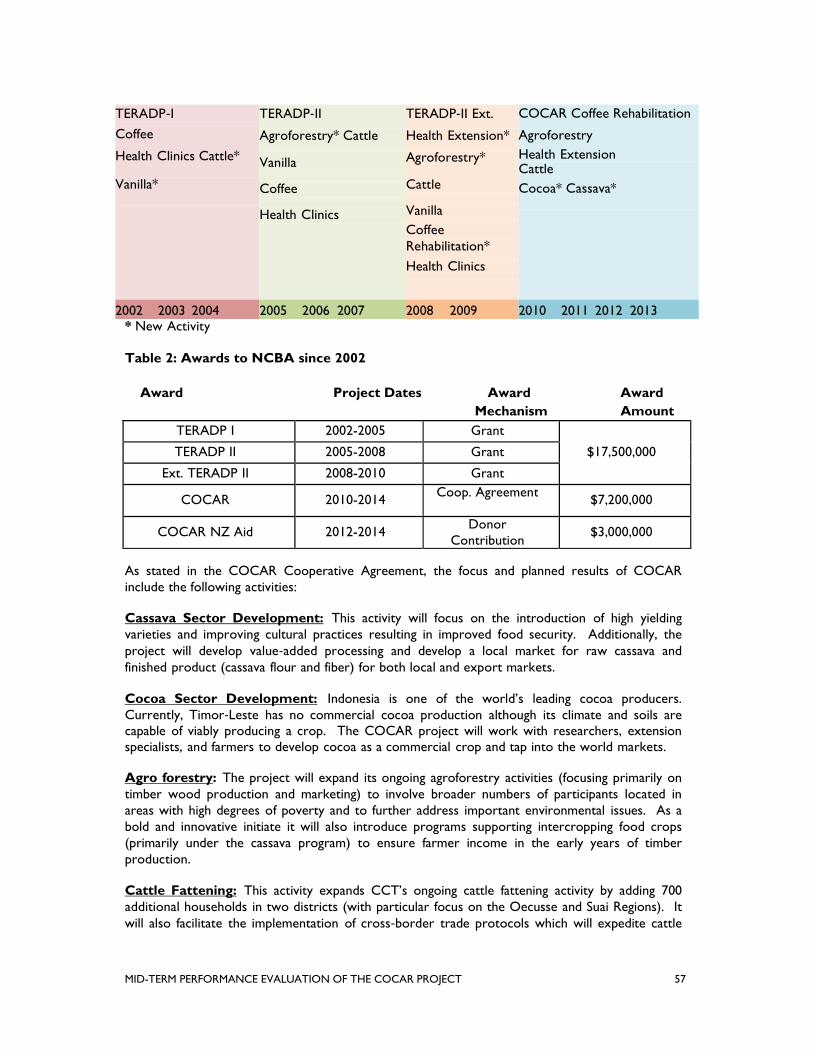
MID-TERM PERFORMANCE EVALUATION OF THE COCAR PROJECT 57
TERADP‐I
Coffee
Health Clinics Cattle*
Vanilla*
TERADP‐II
Agroforestry* Cattle
Vanilla Coffee Health Clinics
TERADP‐II Ext.
Health Extension*
Agroforestry*
Cattle Vanilla Coffee Rehabilitation*
Health Clinics
COCAR Coffee Rehabilitation
Agroforestry Health Extension Cattle Cocoa* Cassava*
2002 2003 2004 2005 2006 2007 2008 2009 2010 2011 2012 2013 * New Activity Table 2: Awards to NCBA since 2002 Award Project Dates Award Award Mechanism Amount
TERADP I 2002-2005 Grant
$17,500,000 TERADP II 2005-2008 Grant
Ext. TERADP II 2008-2010 Grant
COCAR
2010-2014 Coop. Agreement $7,200,000
COCAR NZ Aid
2012-2014 Donor
Contribution
$3,000,000
As stated in the COCAR Cooperative Agreement, the focus and planned results of COCAR include the following activities: Cassava Sector Development: This activity will focus on the introduction of high yielding varieties and improving cultural practices resulting in improved food security. Additionally, the project will develop value‐added processing and develop a local market for raw cassava and finished product (cassava flour and fiber) for both local and export markets. Cocoa Sector Development: Indonesia is one of the world’s leading cocoa producers. Currently, Timor‐Leste has no commercial cocoa production although its climate and soils are capable of viably producing a crop. The COCAR project will work with researchers, extension specialists, and farmers to develop cocoa as a commercial crop and tap into the world markets. Agro forestry: The project will expand its ongoing agroforestry activities (focusing primarily on timber wood production and marketing) to involve broader numbers of participants located in areas with high degrees of poverty and to further address important environmental issues. As a bold and innovative initiate it will also introduce programs supporting intercropping food crops (primarily under the cassava program) to ensure farmer income in the early years of timber production. Cattle Fattening: This activity expands CCT’s ongoing cattle fattening activity by adding 700 additional households in two districts (with particular focus on the Oecusse and Suai Regions). It will also facilitate the implementation of cross‐border trade protocols which will expedite cattle

MID-TERM PERFORMANCE EVALUATION OF THE COCAR PROJECT 58
export and sales from Timor‐Leste to Indonesia. By the project’s end, CCT will be fully sustainable in its cattle operations. Coffee Farm Rehabilitation: Through previous project efforts, Timor‐Leste is among the world’s largest producers of Fair Trade organic coffee, yet it is also known to have some of the lowest yields in the world. Due to a lack of proper farming practices, the long‐term viability of this crop is threatened. To address this, COCAR builds on successful past programs to train farmers to optimize plant populations, manage shade, improve fertility, and take other measures to increase yields and maximize farm gate income. It will also initiate coffee farm production activities in the Ainaro and Hatubalico sub‐districts. Health Services: This program continues Clinic Café Timor health care activities by refocusing clinical and community extension activities to reduce duplication and concentrating on communities directly related to CCT’s agricultural activities. It also further develops its priority rural maternal and child health care and family planning activities. a. Development Context i. Problem or Opportunity Addressed Despite the success of CCT and the coffee industry, Timor-Leste continues to have some of the lowest yields per hectare in the world. This underperformance is primarily due to the fact that many farmers treat coffee as a wild crop, using inadequate farming practices that pose a threat to the long-term viability of the industry. To address this issue, COCAR was designed to build upon the success of past programs that train farmers to optimize plant populations, manage shade, improve fertility, and take other measures to increase yields and maximize farm-gate income. Production of other high-value crops have been introduced to lessen the impact of fluctuations in coffee price and yield by providing diversified sources of income and increased ability to purchase food throughout the year. Cattle fattening and agro-forestry activities are intend to provide farmers with additional livelihood opportunities. The health extension teams work to identify vulnerable households with a special focus on children under 2 years of age, and pregnant and nursing mothers. The health extension teams are trained community volunteers whose purpose is to identify and link vulnerable households with CCT health services and and/or Government services, such as supplemental feeding programs. Health extension teams do not provide medical assistance, but provide information and links to services in remote rural areas and vulnerable households that may have barriers to accessing these services and information. ii. Target Areas Groups COCAR is being implemented in 12 districts. The geographic focus of each commodity is based on a variety of factors, such as strategic location, agro-ecological conditions, availability of land, concentration of farmers, history of production, as well as topographic and climactic conditions. CCT member smallholder farmers, farmer groups, and rural households are the target beneficiaries for the project. Activities are intended to be relevant and accessible to both women and men.

MID-TERM PERFORMANCE EVALUATION OF THE COCAR PROJECT 59
Map of the Democratic Republic of Timor-Leste
Chart of COCAR Activities by District
Cassava
Cocoa
Agroforestry
Cattle
Coffee
Rehabilitation
Health
Ainaro X X
Baucau X X X
Covalima X X X X
Ermera X X X
Lautem X
Liquica X
Bobonaro X X X
Manufahi X X X X X
Oecusse X X
Manatuto X
Dili X X
Aileu X
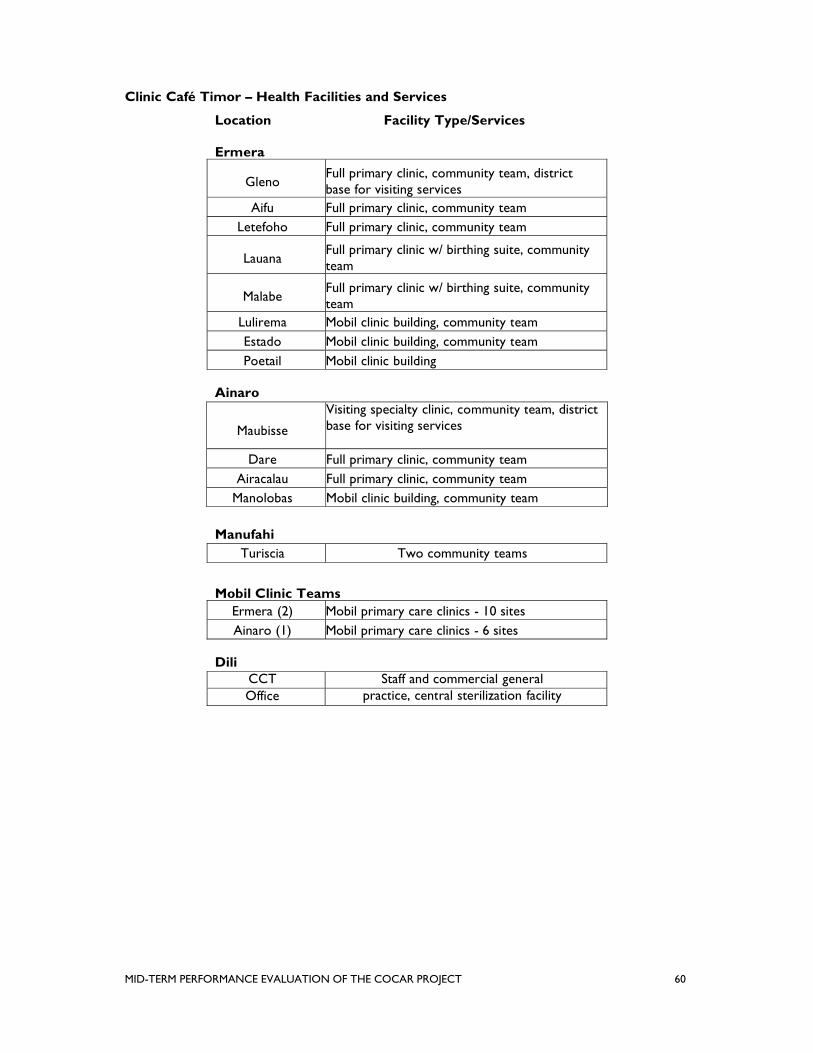
MID-TERM PERFORMANCE EVALUATION OF THE COCAR PROJECT 60
Clinic Café Timor – Health Facilities and Services
Location Facility Type/Services Ermera
Gleno
Full primary clinic, community team, district base for visiting services
Aifu Full primary clinic, community team Letefoho Full primary clinic, community team
Lauana
Full primary clinic w/ birthing suite, community team
Malabe
Full primary clinic w/ birthing suite, community team
Lulirema Mobil clinic building, community team Estado Mobil clinic building, community team Poetail Mobil clinic building
Ainaro
Maubisse
Visiting specialty clinic, community team, district base for visiting services
Dare Full primary clinic, community team Airacalau Full primary clinic, community team
Manolobas Mobil clinic building, community team Manufahi
Turiscia Two community teams
Mobil Clinic Teams Ermera (2) Mobil primary care clinics - 10 sites Ainaro (1) Mobil primary care clinics - 6 sites
Dili
CCT Staff and commercial general Office practice, central sterilization facility

61 PERFORMANCE EVALUATION OF THE COCAR PROJECT
b. Intended Results COCAR has five stated objectives:
1. Improve food security 2. Increase incomes for rural households 3. Reduce environmental degradation and protect natural resources 4. Enhance health care services and health education 5. Build human resource capacity
The development hypothesis infers that farmer participation in COCAR activities should result in increased income to participating rural households, thus contributing to the Mission’s Assistance Objective (AO) of Expanded Opportunities to Combat Poverty. Furthermore, the hypothesis infers that the development of the cassava sector should lead to improved food security for participating households, and that facilitated access to CCT and Government health services through CCT health extension teams should provide rural households with improved health status, thus contributing to the Mission’s Assistance Objective (AO) of Improved Health Status. Many of the intended results of the current activity may not be fully realized until after the project’s completion, similar interventions under previous projects should now have achieved their desired result. Therefore, when examining what the current activity can hope to achieve, it seems logical to look back at previous interventions to see whether or not they have reached their intended results. For example, it is impossible to measure the effect of pruning on coffee yields of farms that underwent rehabilitation last year; however, it may be possible to assess effects on yield by looking at farms rehabilitated during TERADP-II to determine the effectiveness and potential impact of the current intervention. c. Existing Data Government of Timor-Leste: Timor-Leste Strategic Development Plan 2011 – 2030 From USAID: Cooperative Agreement and work plans for COCAR project modification to incorporate New Zealand Aid Programme funding Program descriptions/proposals Semi-annual reports USAID funded assessments and reports:
Sustainability Assessment Of The National Cooperative Business Association East Timor Coffee Activity, Development Alternatives International, Inc. (June 2001)
Cattle fattening activity review conducted by Joyce Turk (Jan 27-Feb 11, 2005); Agroforestry Assessment by Rafael Criencia (July 10-24, 2007); Health assessment by Jenifer Manson (March 2009); Clinic Café Timor Rural Client Satisfaction Survey by Dr. Ross Brandon (April 2009) Sustainable Improvements in Upland Agricultural Productivity and Incomes in Timor-
Leste, Development Alternatives, Inc. (February 2006) An Assessment Of The Condition Of East Timor’s Albizia Coffee-Shade And Its Potential
For Commercial Salvage, J.M Higgs, USDA Forest Service (2005)
62 PERFORMANCE EVALUATION OF THE COCAR PROJECT
From NCBA: Itemized financial breakdown by activity Memorandums of cooperation with various partners Performance management plan Household surveys or assessments conducted Lists of participating farmers for each commodity Training materials Training schedules and records From CCT: Organizational chart Cooperative Bylaws Farm gate purchases on all commodities broken down by farmer Financial data/records on revenues and expenditures for relevant activities Export data and sale records of COCAR commodities NGO and Donor: Overview of the Coffee Sector in Timor-Leste, Oxfam (2003) The Study on Project for Promotion of Agribusiness in Timor-Leste, SANYU Consultants, Inc. (August 2009) Timor-Leste Expanding Near-Term Agricultural Exports Diagnostic Trade Integration Study (DTIS), World Bank (June 2011) Timor-Leste: Raising Agricultural Productivity: Issues and Options, World Bank (January 2010) C.5 EVALUATION DESIGN AND METHODOLOGY The Evaluation will use methods that generate the highest quality and most credible evidence that corresponds to the questions being asked, taking into consideration time, budget, and other practical considerations. Given the nature of development activities, the selection of methods should principally consider the empirical strength of study design as well as the feasibility. Evaluation methods should use sex-disaggregated data and incorporate attention to gender relations in all relevant areas. a. Evaluation Design The evaluation team should assess the best methods and approaches for achieving the objectives of the evaluation and providing the best data to generate answers to the evaluation questions. After discussion with USAID staff, the evaluation team should present an evaluation plan that will be discussed and approved by USAID in consultation with other key stakeholders. The evaluation team should take into consideration the history of USAID’s activities with NCBA and CCT as well as the development context of the country. The evaluation team should use methods that maximize optimal results for the given time and resources. The evaluation team will propose and organize the evaluation process in collaboration with the evaluation point of contact (POC) and the Economic Growth Team. The evaluation design, methodology plan, and work plan will be presented to NCBA and CCT for comments and suggestions. Data Collection Methods The consultants should use a variety of qualitative and quantitative data collection methods to provide answers to the key evaluation questions. The methods can include, but are not limited to:

63 PERFORMANCE EVALUATION OF THE COCAR PROJECT
Desk Review of key documents and records Interviews, questionnaires and/or focus groups with various stakeholders Observation through site visits to key sites
b. Data Analysis Methods The evaluation team should provide a data analysis plan that outlines how qualitative and quantitative data will be collected, transcribed, and analyzed. The analysis plan should outline how data will be disaggregated by gender, activity, region or age when ever relevant. Data analysis should focus on yielding meaningful output and outcomes data and information to provide an in-depth understanding of program progress, assess the project’s importance and relevance, identify opportunities for improved collaboration, challenges faced, if and how problems were resolved, pending issues, necessary changes and directions, as required. c. Methodological Strengths and Limitations Many of the activities of COCAR are continuations of activities from previous grants. The availability and access to financial records and project data for activities prior to the COCAR project are contingent upon availability of data and documents from CCT and NCBA. It may not be possible to obtain complete data sets for all activities. In most cases the baseline will need to be reconstructed. Extra time for the recovery and location of documents and data may be required. Additionally, poor infrastructure, severe weather conditions and remoteness of project sites, may be a constraint in achieving all desired site visits and interviews. C.6 EVALUATION PRODUCTS: a. DELIVERABLES Work plan (including a schedule): a detailed work plan should be submitted in an electronic format to the POC prior to arriving in country. The work plan should include a schedule of the evaluation team’s planned activities from the start of the evaluation process to the submission of the finalized evaluation report. Written evaluation design/ methodology: to be submitted in an electronic format to the POC prior to arriving in country. The evaluation design/methodology should include the identification of key question(s), refined evaluation questions, methods, main features of data collection instruments, data analysis plans, and dissemination plan. The design/methodology will be shared with country-level stakeholders as well as with the implementing partners for comments before being finalized. The evaluation team leader and key staff will have additional support from the USAID POC and Economic Growth Team through conference calls and/or e-mail. Discussion paper for USAID/Timor-Leste: The document should highlight preliminary findings, issues, and observations. The discussion paper should be submitted in an electronic format to the COP at least 24 hours prior to the first scheduled debriefing session with the Economic Growth Team. Key issues and findings summary for partners: a brief and concise summary of the evaluation team findings that is geared towards the needs and interests of partners and key stakeholders. The discussion paper should be submitted in an electronic format to the COP at least 24 hours prior to the first scheduled debriefing session with partners.

64 PERFORMANCE EVALUATION OF THE COCAR PROJECT
Six debriefing sessions: oral presentation on key findings, conclusions reached and recommendations tailored to fit each audience. The presentation will be followed by a question and answer session with the evaluation team. USAID/Timor-Leste Economic Growth team Mission Director USG Mission New Zealand Aid Programme NCBA and CCT Ambassador of the United States of America A draft report in English: prior to departing Timor-Leste, the Team Leader should submit a draft report along with supporting data and records in an organized, electronic format to the POC. A final report with all supporting data and records: completing the assignment a final evaluation report incorporating the criteria outlined in USAID’s Evaluation Policy (http://www.usaid.gov/evaluation) should be submitted to the POC within seven (7) calendar days of receiving the final comments from USAID/Timor-Leste. The final report including all annexes, supporting data and records should be provided to the POC in an organized, electronic format. Recommendations for improving the monitoring system should be included in the annex. It should provide recommendations for improving the ability of the monitoring system to collect disaggregated data by source funding and to improve the evidence-base for evaluating project impact and progress towards project objectives. The final Evaluation Report must meet the following criteria: The evaluation report should represent a thoughtful, well-researched and well organized
effort to objectively evaluate what worked in the project, what did not and why. Evaluation reports shall address all evaluation questions included in the scope of work, and
meet the objectives and purpose of the evaluation. The evaluation report should include the scope of work as an annex. All modifications to
the scope of work, whether in technical requirements, evaluation questions, evaluation team composition, methodology or timeline need to be agreed upon in writing by the technical officer.
Evaluation methodology shall be explained in detail and all tools used in conducting the evaluation such as questionnaires, checklists and discussion guides will be included in an Annex in the final report.
Evaluation findings will assess outcomes and impact on males and females. Limitations to the evaluation shall be disclosed in the report, with particular attention to the
limitations associated with the evaluation methodology (selection bias, recall bias, unobservable differences between comparator groups, etc.).
Evaluation findings should be presented as analyzed facts, evidence and data and not based on anecdotes, hearsay or the compilation of people’s opinions. Findings should be specific, concise and supported by strong quantitative or qualitative evidence.
Conclusions and recommendations need to be supported by a specific set of findings. Recommendations should be action-oriented, practical and specific, with defined
responsibility for the action. The final report should be a maximum of 50 pages, not including annexes.
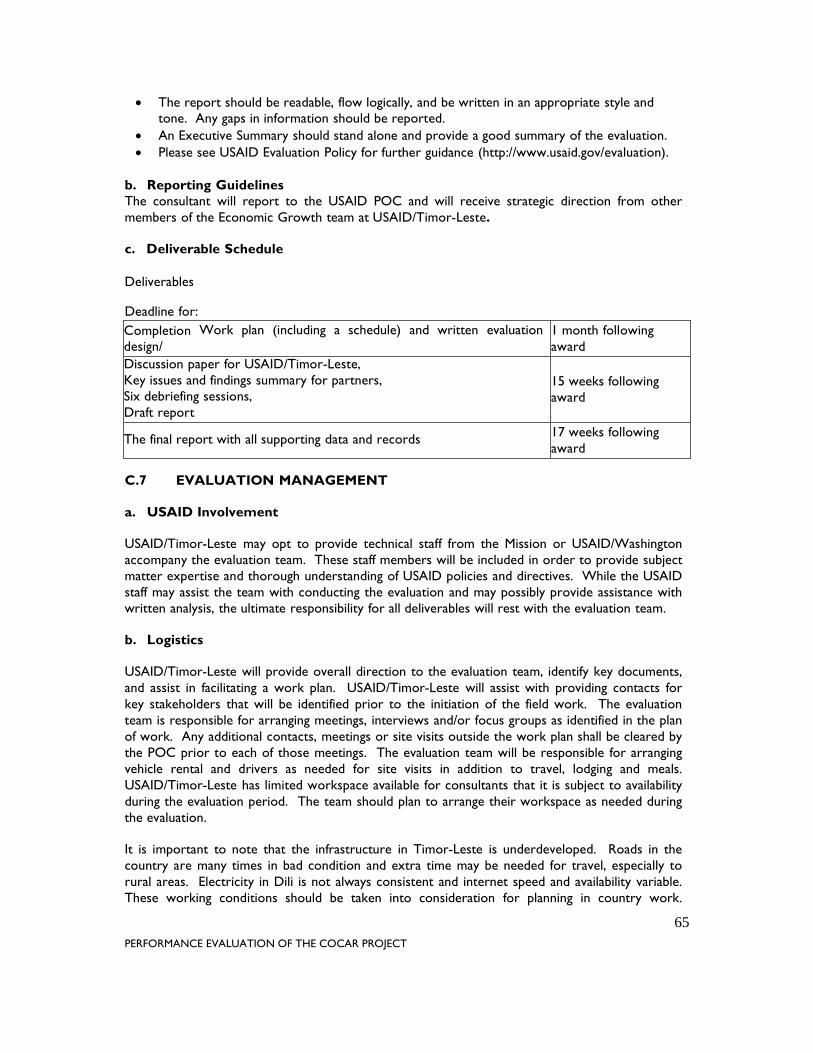
65 PERFORMANCE EVALUATION OF THE COCAR PROJECT
The report should be readable, flow logically, and be written in an appropriate style and tone. Any gaps in information should be reported.
An Executive Summary should stand alone and provide a good summary of the evaluation. Please see USAID Evaluation Policy for further guidance (http://www.usaid.gov/evaluation).
b. Reporting Guidelines The consultant will report to the USAID POC and will receive strategic direction from other members of the Economic Growth team at USAID/Timor-Leste. c. Deliverable Schedule Deliverables Deadline for: Completion Work plan (including a schedule) and written evaluation design/
1 month following award
Discussion paper for USAID/Timor-Leste, Key issues and findings summary for partners, Six debriefing sessions, Draft report
15 weeks following award
The final report with all supporting data and records 17 weeks following
award C.7 EVALUATION MANAGEMENT a. USAID Involvement USAID/Timor-Leste may opt to provide technical staff from the Mission or USAID/Washington accompany the evaluation team. These staff members will be included in order to provide subject matter expertise and thorough understanding of USAID policies and directives. While the USAID staff may assist the team with conducting the evaluation and may possibly provide assistance with written analysis, the ultimate responsibility for all deliverables will rest with the evaluation team. b. Logistics USAID/Timor-Leste will provide overall direction to the evaluation team, identify key documents, and assist in facilitating a work plan. USAID/Timor-Leste will assist with providing contacts for key stakeholders that will be identified prior to the initiation of the field work. The evaluation team is responsible for arranging meetings, interviews and/or focus groups as identified in the plan of work. Any additional contacts, meetings or site visits outside the work plan shall be cleared by the POC prior to each of those meetings. The evaluation team will be responsible for arranging vehicle rental and drivers as needed for site visits in addition to travel, lodging and meals. USAID/Timor-Leste has limited workspace available for consultants that it is subject to availability during the evaluation period. The team should plan to arrange their workspace as needed during the evaluation. It is important to note that the infrastructure in Timor-Leste is underdeveloped. Roads in the country are many times in bad condition and extra time may be needed for travel, especially to rural areas. Electricity in Dili is not always consistent and internet speed and availability variable. These working conditions should be taken into consideration for planning in country work.

66 PERFORMANCE EVALUATION OF THE COCAR PROJECT
Additionally, it is important to note that while Portuguese and Tetum are the official languages, they are not always spoken or understood in rural areas. To ensure accuracy of response from interviews and focus groups it is important to make arrangements for interpreters of local languages c. Scheduling Work is to be carried out over a period of approximately 60 days, beginning on or about (o/a) November 15. The work days do not need to be consecutive and may include an interval between the first set of deliverables (please see deliverable schedule in section C.6 (c)) and the work to be carried out in country. Six day workday weeks are expected while the team is in country. The final report should be completed 17 weeks after award. The maximum level of effort: 60 days per consultant, Travel Days: 6 days, Work Days: 54 days. The tasks listed below under the scope of work (SOW) are the minimum requirements of this assignment. The evaluators may add additional tasks that further strengthen the expected results of this assignment. d. Pre Field-Work Prior to arrival in Timor-Leste, the evaluators will hold a briefing via phone or internet with the POC and USAID/Timor-Leste’s Economic Growth Team in order to ascertain a thorough understanding of the assignment requirements. This briefing will provide an opportunity for questions and answers regarding the evaluation design and clarify expectations and roles of each party. The POC will provide the evaluation team with key documents for review prior to arrival and supply information regarding key contacts and stakeholders. The evaluation team will use the information provided to develop the work plan (including schedule and evaluation design/methodology that shall include the identification of key question(s), refined evaluation questions, methods, main features of data collection instruments, data analysis plans, and dissemination plan. The evaluation team’s logistic coordinator will be responsible for scheduling interviews and meetings with key contacts and stakeholders and shall be working with the team leader prior to arrival to coordinate the needs of the evaluation team, such as travel, lodging, rental vehicles, interpreters and drivers. e. Field-Work Upon arrival, the evaluation team will consult with the POC and Economic Growth Team and share the written evaluation design with country-level stakeholder and implementing partners prior to being finalized. The POC will provide a draft of the project design to NCBA, CCT and the New Zealand Aid Programme for review and comments prior to the team’s arrival. Meet with Timorese counterparts at the Timorese Ministry of Agriculture and Fisheries (MAF), Ministry of Economy and Development (MED), and the Ministry of Tourism Commerce, Industry (MTCI), and the Ministry of Health (MOH). Meet with relevant NGOs and community based interest groups. Conduct meetings and interviews with CCT and NCBA staff. Identify additional stakeholders and value chain actors for interviews. During the time in Timor-Leste, the consultant will make extensive visits to the districts in which the project operates. Specific districts should be proposed as part of the project’s initial work plan. The district of Ermera has seen considerable USAID involvement, and will need to be a
67 PERFORMANCE EVALUATION OF THE COCAR PROJECT
focus. Other districts such as Covalima, Aileu, Ainaro, Bobonaro, and Manufahi have also had considerable project focus and should be considered. During these visits to the districts, the team will conduct site visits, interviews and/or focus groups with beneficiaries, government officials and other key stakeholders.
During the planning of the site, visits the evaluation team should ensure that the data collected will provide a representative sample of farmers working in each of the activities. The evaluation team in consultation with USAID will determine the actual visits. When feasible, visits should be coordinated with NCBA/CCT to maximize efficiency of time, resources and opportunities.
During these visits, the evaluation team should consider site visits, interviews and/or focus groups with: CCT member farmers/beneficiaries involved in each of the activities (coffee rehabilitation,
agro- forestry, cattle fattening, cassava, cocoa and health extension teams). Meet with community level government officials such as district administrators, suco chiefs
and MAF extension agents. CCT centers of operations, such as nurseries, demonstration plots and office. Community stakeholders such as community leaders, local NGOs and other value chain
actors. Other members of households. Farmers that are not CCT members (control group).
(End of Section C)

68 PERFORMANCE EVALUATION OF THE COCAR PROJECT
ANNEX 3: PERFORMANCE MONITORING PLAN

69 PERFORMANCE EVALUATION OF THE COCAR PROJECT
Performance Monitoring Plan:
COCAR began on October 1, 2010 and will continue until September 30, 2014. An amendment to the program, made possible by a $3 million contribution from New Zealand Aid, has significantly increased the reach of coffee rehabilitation activities. The amendment took effect on April 1, 2012 and included an expanded set of output and outcome indicators for coffee. This Performance Monitoring Plan (PMP) includes the original COCAR indicators for the cassava, cocoa, agro-forestry, livestock and health activities, and, as detailed in Grant Modification 3, the revised coffee rehabilitation indicators agreed between USAID and NCBA on April 4, 2012. Cooperativa Café Timor (CCT) and the National Cooperative Business Association (NCBA) have developed a robust system for collecting, verifying, organizing and analyzing data for the 47 COCAR indicators. These indicators fall into two categories, annual performance measures and End of Project (EOP) impact measures. The process begins with field staff recording the details of each activity they carry out with farmers, such as seedling distribution, training or coffee tree pruning. The precise location of program activities, such as tree nurseries and farms that receive seedlings, are captured using GPS. This enables CCT to find the farms easily, when it comes time to market the crops. Accurate farm locations also facilitate verification of field work. Within two weeks, information from field is entered into a database, which can produce various reports, depending on the needs of management. This cloud-based system permits CCT managers to review the progress of field activities within one month of implementation. Two important internal uses for the data are to evaluate the performance of field staff and to estimate future harvests. The system is also the core of the PMP and the source of data for semi-annual reports. Currently, CCT maintains other databases for the information required by Café Practices (Starbucks), Fair Trade and organic certification programs, including farmer demographics and data on agricultural practices for all 22,500 members. In addition, the health component has separate databases on clinic activities. In the future, the cooperative plans to integrate all of this information into the system developed under COCAR, to increase efficiency. Although it is not explicitly discussed in the work plan, a smoothly functioning, integrated database will be a major legacy of COCAR. An innovative feature of the data system is the degree to which data from the field is checked and cross checked. For critical indicators, such as the number of coffee trees pruned, results claimed by the field staff are verified by field supervisors. Finally, CCT’s internal control staff audit a randomly selected sample of farms (using the GPS coordinates) to cross check the results. This degree of rigor is necessary because CCT uses the information to make critical staffing and financial decisions. Because the PMP tracks the progress of each farmer individually, it is possible to allocate farmers to different funding sources. The resources from New Zealand Aid will support an additional 7,200 farmers to rehabilitate their farms. These farmers will be tagged in the database, so that their results can be presented separately, as necessary. Two factors complicate the collection of COCAR data. First, program activities are timed to the agricultural calendar for each crop. This timing sometimes does not align with COCAR’s six monthly reporting periods. For example, the optimum time to prune coffee trees is between the

70 PERFORMANCE EVALUATION OF THE COCAR PROJECT
end of the harvest and the next flowering, which is usually between August and November. To reduce confusion, the PMP will specify the normal implementation period for each indicator. The second complicating factor is that coffee and cocoa seedlings take three years to bear fruit and five years to reach full production. Pruned coffee trees will produce a limited amount of cherry after two years. This means that the economic impact of COCAR’s tree crop activities will only be fully realized by 2019. Fortunately, 1,200 CCT farmers pruned their trees and planted seedlings in 2008. During the 2013 harvest, field staff will monitor the production of a random sample of these seedlings and pruned trees. The increase in production achieved by these farmers will be used to forecast gains for the COCAR farmers. The COCAR PMP does not include baseline, midterm or end line farmer surveys, as is common in many agricultural development programs. There are three reasons for this:
CCT already has detailed information on each of its 22,500 members and their farms, as part of coffee certification requirements such as Fair Trade and organic.
The baseline for commercial cassava and cocoa production is zero, since these are new
crops in East Timor. For coffee rehabilitation, the COCAR baseline is also zero, since CCT members interested in rehabilitating their farms opt in to the program.
CCT needs “real time” information on the activities of its members. Survey data collected
one or two years after implementation would not be useful and would reduce the resources available for field work.
To document baseline conditions for the PMP, NCBA will use existing CCT data to develop a farmer profile for the average un-rehabilitated coffee farm. This will include metrics such as farm size, high and low cherry production, number and condition of coffee trees and number and type of shade trees. NCBA will prepare semi-annual progress reports for the periods April to September and October to March. These reports will be organized as follows:
Executive Summary 1.0 Semester project overview 2.0 Variances and changes 3.0 Coffee sector rehabilitation component 4.0 Cassava sector development component 5.0 Agroforestry component 6.0 Cocoa sector development 7.0 Cattle fattening component 8.0 Healthcare component 9.0 Coordination with the Government of Timor Leste & other organizations
Attachment A: Quarterly Financial Report39 Attachment B: Table of performance indicators
39 The financial report will include an estimate of total expenditures for coffee rehabilitation activities funded by the New Zealand supplemental allocation

71 PERFORMANCE EVALUATION OF THE COCAR PROJECT
At the end of the project, NCBA will prepare a similar profile for the average rehabilitated farm, including projections for future production as the farms reach full production. These projections will be based on the experiences of farmers who pruned their trees in 2008. Data collection plan by program and indicator This section describes the methodology for collecting data for each indicator, as well as the baselines and annual targets. In a few cases, NCBA is proposing changes to the indicator wording and/or targets to increase clarity and to reflect reality on the ground. These proposals are shown in italics, while current indicators are shown in bold face. Training the staff of CCT NCBA is building the capacity of CCT staff in two ways: formal training and mentoring. All CCT field staff have received a series of trainings in the agronomy of coffee, cassava, cocoa and tree crops. This technical training is supported by pedagogical training on meeting facilitation and training through demonstration. Senior CCT technical and administrative staff is paired with NCBA staff for one-on-one mentoring, which continues over the life of the program. Farmer training Utilizing their training, CCT field staff conducts two types of farmer training, one-on-one sessions with individual farmers and group sessions. Once the Training Center at Railaco is completed in November 2012, the number of group training sessions will increase. The date, number and gender of training participants, as well as the topic are recorded for each session. Three forms, covering staff training, farmer training and technology adoption are used to collect this information. All farmers who receive seedlings or other inputs, such as pruning saws, also receive training. The training courses follow a progression, beginning with basic topics such as the reasons for farm rehabilitation. As CCT members join the various programs, additional topics are covered, following the agricultural calendar. Coffee sector rehabilitation component Coffee trees in Timor Leste flower with the first rains, which typically fall in early October through late November, depending on altitude. The harvest occurs between May and July. This production calendar dictates the timing of coffee rehabilitation activities. Pruning can begin after the harvest in July, in the lower altitudes. After the flowers appear, farmers are extremely reluctant to prune because their short term losses are readily apparent. This “pruning window” straddles the September 30 reporting deadline. To avoid confusion, NCBA proposes to include pruning which occurs in October in the previous semi-annual report. Coffee seedlings are best planted in December, when the soil is moist. Distribution of tools follows the agricultural calendar. For example, pruning saws are distributed to new farmers in July, while crow bars for digging planting holes are distributed in November, prior to the coffee seedlings. After three years of re-growth, pruned coffee trees yield more than un-pruned trees. However, a confounding factor is that the yield of all rain-fed coffee trees varies considerably from year to year, whether they are pruned or not. The yield variations are caused by weather patterns and other factors which promote either leaf or fruit growth. “Off” years with heavy leaf growth may produce only 10 percent as much cherry as “on” years with heavy fruit growth. In Timor Leste, extended

72 PERFORMANCE EVALUATION OF THE COCAR PROJECT
rains from the El Nino caused off years in 2007 and 2011 and on years in 2008, 2010 and 2012. During “off” years, farmers may place less attention on their coffee farms, in search of other income generating activities. Over relatively short time frames, such as the four year COCAR program, natural yield variations will both positively and negatively impact the effect of pruning, in a particular year. Eight forms are used to collect data for the rehabilitation indicators, not including production of coffee seedlings, which is tracked by the agroforestry division. These forms include demographic and farm data on each participant, distribution of tools, coffee trees pruned, shade and coffee trees planted, farm maintenance and cherry production. The following coffee rehabilitation indictors and targets were set in April, 2012, just prior to the signing of Grant Modification #3. These indicators subsume the previous coffee indicators. Percent increase in farmer’s income: NCBA proposes to change this indicator to “Percent increase in participating farmers’ yield”, as changes in international coffee prices could obscure the program impact. This indicator will be evaluated in 2014, by comparing the cherry yields of a random sample of trees pruned in 2010 with un-pruned trees on the same farm.
Baseline 2010-2011 2011-2012 2012-2013 2013-2014 Total
600 kg/ha N/A N/A N/A 50% 50%
Number of households gaining benefit directly from the coffee rehabilitation activity: This indicator includes households who receive coffee and shade tree seedlings, as well as those with income increases from additional coffee production. Farmers will see economic benefits in 2014, coffee trees pruned in 2010 and 2011 regain full production.
Baseline 2010-2011 2011-2012 2012-2013 2013-2014 Total
0 1,200 2,400 3,600 4,800 12,000
Number of people employed in the industry (disaggregated by gender): Increased employment is expected at four points in the value chain – seedling production, pruning, coffee transport and processing at CCT facilities. These positions will be a combination of full and part-time work. Gains in transport and processing will continue to increase until 2019, as the rehabilitated farms reach full production. This indicator will be measured through interviews with seedling and coffee farmers, plus CCT employment records. Baseline 2010-2011 2011-2012 2012-2013 20132014 Total
2,500
1,750 men
750 women
N/A N/A 3,400
2,380 men
1,020 women
3,820
2,674 men
924 women
1,320
924 men
396 women
Number of tons of coffee cherry procured: Propose changing the wording of the indicator to “Number of additional tons of coffee cherry procured due to COCAR activities”. By the 2019 season,

73 PERFORMANCE EVALUATION OF THE COCAR PROJECT
when all the seedlings and pruned trees have attained full production, the total increase in cherry production is expected to reach 11,000 MT per annum.
Baseline 2010-2011 2011-2012 2012-2013 2013-2014 Total
0 0 0 0 240 MT 240 MT
Number of tons of coffee beans exported: Propose changing the wording of the indicator to “Number of additional tons of coffee beans exported due to COCAR activities”. By the 2019 season, when all the seedlings pruned trees have attained full production, the total increase in green beans exported by CCT is expected to reach 1,980 MT.
Baseline 2010-2011 2011-2012 2012-2013 2013-2014 Total
0 0 0 0 40 MT 40 MT
Number of plants per hectare: The average farm currently has 1,200 coffee trees per hectare. After 4.8 million seedlings are distributed to 12,000 farmers (average farm size 1 ha), the number of plants per hectare will increase to 1,600. Seedling mortality is expected to reduce the planting density to 1,500 trees per hectare.
Baseline 2010-2011 2011-2012 2012-2013 2013-2014 Total
1,200 1,275 1,350 1,425 1,500 300
Coffee cherry price returned per hectare: NCBA recommends dropping this indicator for the following reasons: Between the baseline in 2009 and the 2012 season, cherry yields from un-pruned trees have
varied from less than 200 kg/ha to more than 600 kg/ha, due to the “on” year “off” year dynamic.
Over the same period, the benchmark price for Arabica coffee (New York “C”) varied from
$1.10 to $6.73 per kilogram, mainly due to the same phenomenon operating at a global level. Farmgate cherry and parchment prices in Timor Leste track the “C” price.
Many CCT members do not sell their entire harvest to CCT as cherry, even though this
provides the highest return per hectare with the least labor. Farmers often process a portion of their coffee and store the dried parchment as a form of “bank account”. The amount stored depends on prices. Any calculation of returns per hectare would need to include this factor as well.
With so much variation in external factors, it is impossible to calculate accurate returns per hectare.
Baseline 2010-2011 2011-2012 2012-2013 2013-2014 Total
N/A N/A N/A 50% 50%

74 PERFORMANCE EVALUATION OF THE COCAR PROJECT
Number of new technologies made available for transfer as a result of the coffee rehabilitation activity: This is a new indicator, so some technologies, such as those related to pruning, that were introduced in 2010 will be counted in 2011. The technologies and techniques to be introduced include:
1. Effect of pruning on coffee trees 2. Optimum pruning cycle for maximum farm productivity 3. Identifying trees for pruning based on productivity 4. Procedure for stump pruning 5. Procedure for selective pruning (three up, three down) 6. Removal of suckers (extra small branches) 7. High quality pruning saw utilization 8. Construction of coffee seedling nurseries 9. Production of seedling media from composted coffee pulp 10. Coffee seedling production using poly bags and compost 11. Correct density of coffee trees 12. Importance of planting coffee trees in rows 13. Digging planting holes for coffee seedlings 14. Removing weeds and undergrowth 15. Mulching with leaf litter
Baseline 2010-2011 2011-2012 2012-2013 2013-2014 Total
0 0 5 5 5 15
Percent of participating farmers implementing pruning techniques: Based on the number of farmers who prune their trees, divided by the target of 12,000 coffee rehabilitation participants.
Baseline 2010-2011 2011-2012 2012-2013 2013-2014 Total
0 N/A 30% 70% 100% 100%
Number of coffee farms rehabilitated: The best practice is to prune 20 percent of the farm each year, over a five year cycle. However, given that pruning is a new practice in Timor Leste and with the constraints imposed by the extreme topography of production areas, it is expected that initially farmers will only prune 10 to 15 percent of their trees over a 7 to 10 year cycle. Therefore, at this stage, COCAR will count a farm as rehabilitated if at least 10 percent of the trees have been pruned. As farmers see the benefits of pruning, it is expected that the percentage pruned per year will increase. The original COCAR work plan envisioned that 1,200 farmers would rehabilitate their farms each year, for a total of 4,800 farms. Grant modification 3, expanded this program by 7,200 farms, for a total of 12,000 over four years.
Baseline 2010-2011 2011-2012 2012-2013 2013-2014 Total
0 1,200 2,400 3,600 4,800 12,000

75 PERFORMANCE EVALUATION OF THE COCAR PROJECT
Number of new seedlings planted: It is recommended that this indicator be changed to “Number of new coffee seedlings distributed”, since shade trees are covered separately. Also, the targets should be increased as shown.
Baseline 2010-2011 2011-2012 2012-2013 2013-2014 Total
0 0 230,000 230,000 230,000 690,000
0 500,000 500,000 1,000,000 1,000,000 3,000,000
Percent of planted seedlings survived: Coffee seedling survival depends primarily on factors beyond the farmer’s control, such as amount and distribution of rain. Therefore, survival rates are not expected to change. Survival rates will be measured in for the first time in 2012.
Baseline 2010-2011 2011-2012 2012-2013 2013-2014 Total
0 N/A 80% 80% 80% N/A
Number of shade trees planted and survived: The targets for this indicator should be increased as shown. The same survival rate of 80 percent is applied for shade trees. Per the original Cooperative Agreement, the figures included coffee shade trees, cocoa shade trees, livestock fodder trees and construction timber trees. The numbers below reflect these totals plus the additional coffee shade trees produced under the amendment.
Baseline 2010-2011 2011-2012 2012-2013 2013-2014 Total
0 0 58,000 58,000 58,000 174,000
200,000
160,000
250,000
200,000
300,000
240,000
750,000 600,000
Percent of existing healthy coffee plantation pruned and maintained: Based on the number of farmers who prune and maintain their trees, divided by the target of 12,000 coffee rehabilitation participants. NCBA recommends that this indicator be dropped, since it duplicates the previous Number of coffee farms rehabilitated.
Baseline 2010-2011 2011-2012 2012-2013 2013-2014 Total
0 10% 30% 70% 100% N/A
Number of farmers implemented pruning technique: NCBA recommends that this indicator be dropped, since it duplicates the previous Number of coffee farms rehabilitated.
Baseline 2010-2011 2011-2012 2012-2013 2013-2014 Total
0 1,200 2,400 3,600 4,800 12,000

76 PERFORMANCE EVALUATION OF THE COCAR PROJECT
Number of farmers (disaggregated by gender) attending training: This indicator focuses on organic farming techniques to increase soil fertility, such as planting nitrogen fixing shade trees and mulching. All participating farmers will be provided with this training. Baseline 2010-2011 2011-2012 2012-2013 2013-2014 Total
0
N/A
2,400
Men 1,680
Women 720
3,600
Men 2,520
Women 1,080
4,800
Men 3,360
Women 1,440
12,000
Men 8,400
Women 3,600
Number of farmers coped with the training methods: Recommend changing the wording to “Number of farmers adopting techniques to improve soil fertility”. All participating farmers are expected to plant nitrogen fixing shade trees and begin mulching.
Baseline 2010-2011 2011-2012 2012-2013 2013-2014 Total
0 1,200 2,400 3,600 4,800 12,000
Number of farmers implemented pruning techniques. NCBA recommends that this indicator be dropped, since it duplicates the previous Number of coffee farms rehabilitated.
Baseline 2010-2011 2011-2012 2012-2013 2013-2014 Total
0 1,200 2,400 3,600 4,800 12,000
Number of coffee and environmental related training delivered to participating farmers. The 18 trainings will match the coffee rehabilitation technologies listed on page 6 and the shade tree management techniques listed below.
Baseline 2010-2011 2011-2012 2012-2013 2013-2014 Total
0 0 6 6 6 18
Number of farmers (disaggregated by gender) attended the environmental training: All participating farmers are expected to attend training sessions on environmental topics. Baseline 2010-2011 2011-2012 2012-2013 2013-2014 Total
0
N/A 2,400
Men 1,680
Women 720
3,600
Men 2,520
Women 1,080
4,800
Men 3,360
Women 1,440
12,000
Men 8,400
Women 3,600
Number of shade tree management techniques introduced: The techniques will include:
1. Importance of shade to protect coffee trees

77 PERFORMANCE EVALUATION OF THE COCAR PROJECT
2. Constructing nurseries for shade tree production 3. Coffee shade tree seedling production using organic compost 4. Correct density of shade trees in coffee farms 5. Planting shade tree seedlings 6. Use of nitrogen-fixing tree crops to improve soil fertility 7. Use of high canopy Cassuarina shade trees 8. Use of medium canopy PG 79 shade trees 9. Using shade trees to support black pepper plants
Baseline 2010-2011 2011-2012 2012-2013 2013-2014 Total
0 0 3 3 3 9
Percent coverage of area using techniques: NCBA recommends dropping this indicator because it is not possible to measure the area covered by shade trees.
2010-2011 2011-2012 2012-2013 2013-2014 Total
0 N/A
Number of coffee seedlings produced per year: The targets should be increased as shown.
Baseline 2010-2011 2011-2012 2012-2013 2013-2014 Total
0 0 230,000 230,000 230,000 690,000
0 500,000 980,000 1,700,000 1,700,00 4,880,000
Number of seedlings planted and survived: Recommend that this indicator be changed to “Number of coffee seedlings planted by nurseries and survived” to distinguish it from the seedlings planted by farmers. The targets should be increased. Eighty percent survival is expected.
Baseline 2010-2011 2011-2012 2012-2013 2013-2014 Total
0 0 230,000 230,000 230,000 690,000
0 500,000
450,000
1,000,000
800,000
2,000,000
1,600,000
2,000,000
1,600,000
5,500,000
4,400,000
Number of satellite nurseries established:
Baseline 2010-2011 2011-2012 2012-2013 2013-2014 Total
0 30
0 0 0 30
Cassava sector development component

78 PERFORMANCE EVALUATION OF THE COCAR PROJECT
In Timor Leste, cassava is planted in December, once the rainy season is well underway. Farmers use cuttings (called stems), saved from the previous season. One cassava stem can be cut into an average of five stakes, each yielding a new stem for the next season. The mature tubers are harvested in August and September. A portion of the harvest is consumed by the household and sold in local markets or to itinerant traders as fresh cassava. The remaining tubers are peeled and dried, with the marketing season concluding in November. Currently, CCT is the only buyer of dried cassava. This progression matches the COCAR reporting calendar well, because stake distribution is covered in the October to March report and the harvest (measured in tons of fresh tubers) falls into the April to September period. At the outset of COCAR, NCBA assumed that farmers would mono-crop the new cassava varieties. Instead, the prevailing practice has been to inter-crop cassava and maize in some of the production areas. This reduces fresh cassava yields from the anticipated 40 tons/ha to 26 tons per/ha. However, from the farmer’s perspective, the reduction in cassava revenue is more than compensated by revenue from the quicker yielding maize. Food security is also enhanced by producing two food crops on the same land. CCT uses five forms to track each aspect of the cassava production cycle: distribution and production of cassava stakes: a monthly garden survey used during production, production estimate for fresh weight, sales receipts for dried tubers and an annual analysis of costs and revenues. The information is collected for each farmer and includes the GPS location of the field. Some farmers produce small quantities of local cassava, but they are rapidly switching to the improved varieties. This production is tracked, but not reported. Initially, there was a plan to establish separate cassava nurseries, which would only produce stems. However, distributing the stems from central locations to thousands of farmers proved costly. Instead, every farmer who receives stems must “pay” the project back with an equal number. In addition, COCAR purchases any surplus stems that the farmer does not plan to use or sell to other farmers. These are distributed to neighboring farmers, to reduce transport costs. Therefore, multiplication farms and production farms have become the same thing. Improved cassava cuttings produced or provided to multiplication farms (stems)
Baseline 2010-2011 2011-2012 2012-2013 2013-2014 Total
0 500,000 500,000 500,000 500,000 2,000,000
Improved cassava cuttings distributed to production farmers (stakes). NCBA proposes to revise the 2011 target to 1,250,000, as many of the initial farmers opted to keep some of their stems in order to expand their own fields in excess of project interventions.
Incremental households trained, planting improved cultivars (avg. 0.25 ha per farmer)
Baseline 2010-2011 2011-2012 2012-2013 2013-2014 Total
0 200 900 1,400 1,400 4,400
Baseline 2010-2011 2011-2012 2012-2013 2013-2014 Total
0 0 1,250,000 2,500,000 2,500,000 6,250,000

79 PERFORMANCE EVALUATION OF THE COCAR PROJECT
Cassava harvested under program (MT wet weight). NCBA proposes to revise these targets as shown, to reflect revised plantings of cassava per the above tables.
Baseline 2010-2011 2011-2012 2012-2013 2013-2014 Total
0 0 1,000 4,000 15,000 26,000
Agroforestry component CCT produces six species of tree seedlings at its central nursery in Dili and under contract at 36 farmer-owned nurseries distributed throughout the program area. These species are coffee (Hybrido de Timor variety), cocoa (improved clones), Cassuarina (tall shade tree), PG 79 (medium shade tree), teak and mahogany. CCT staff at the central nursery track all aspects of seedling production and survival. Farmer owned nurseries are monitored by field staff on a monthly basis to identify problems and maintain an accurate count of healthy seedlings. Seedlings are distributed to farmers in December and their survival rate is tracked on an annual basis. Six forms are used to collect information on each step of this process. Hectares of agroforestry seedlings are calculated using the planting densities for each tree species. Seedlings distributed to farmers – all types
Baseline 2010-2011 2011-2012 2012-2013 2013-2014 Total
0 500,000 500,000 500,000 500,000 2,000,000
Households trained & planting seedlings: This indicator includes the 12,000 coffee farmers who are planting shade trees.
Baseline 2010-2011 2011-2012 2012-2013 2013-2014 Total
0 4,000 4,000 4,000 4,000 16,000
Hectares of agroforestry seedlings planted. NCBA proposes dropping this indicator, as no agroforestry trees are mono-cropped. Planting of shade trees over coffee is covered in a separate indicator under coffee rehabilitation.
Baseline 2010-2011 2011-2012 2012-2013 2013-2014 Total
0 1,500 1,500 1,500 1,500 6,000
Cocoa sector development component Historically, there has been very limited cocoa production in Timor Leste. However, without a market, farmers abandoned or removed their trees many years ago. Therefore, cocoa is a new crop for nearly all farmers. Until 2014, COCAR is concentrating on seedling production, distribution and farmer training. CCT tracks seedling production at its central nursery in Dili. Field staff record the GPS location of each farmer that receives seedlings. Every farmer who receives seedlings also receives training. Since the planting density is uniform, the number of

80 PERFORMANCE EVALUATION OF THE COCAR PROJECT
seedlings is used to calculate the incremental hectares planted. The seedling survival rate is monitored on an annual basis in July. Cocoa harvests and farm gate value will be recorded for the first time in 2014. Trees planted in 2010 are beginning to flower, indicating that there will be a small harvest in 2013/2014. Seedlings distributed to participants
Baseline 2010-2011 2011-2012 2012-2013 2013-2014 Total
0 25,000 25,000 25,000 12,000 87,000
Households trained and planting cocoa
Baseline 2010-2011 2011-2012 2012-2013 2013-2014 Total
0 100 100 100 50 350
Incremental cocoa planted by participants (hectares)
Baseline 2010-2011 2011-2012 2012-2013 2013-2014 Total
0 25 25 25 12.5 87.5
Cocoa harvested (MT)
Baseline 2010-2011 2011-2012 2012-2013 2013-2014 Total
0 0 0 0 5 5
Farm gate value of cocoa sales ($USD)
Baseline 2010-2012 2011-2012 2012-2013 2013-2014 Total
0 0 0 $12,500 $12,500
Cattle fattening component Cattle fattening occurs year round. CCT purchases or breed calves, which are distributed to farmers. After fattening, CCT transports the cattle to Dili, where they are sold. The cost of the calf and other CCT administrative costs are deducted, with the balance being returned to the member. Because the cattle are valuable assets, and they are provided on loan basis, each calf is branded and tagged. Field staff use 13 forms to record information on the farmers and the cattle at each step in the process. Targets for the cattle fattening program were based on NCBA’s long-standing experience in West Timor and the earlier project phase in East Timor. However, in Timor Leste’s overheated economy and greatly rising demand for beef products, it has proven more difficult to obtain sufficient bull calves of the appropriate age due great pressure from the local market. It also necessitates a longer fattening cycle. Importing calves from Indonesia has also not been possible, due to veterinary regulations. On the positive side, demand for beef in Dili is very strong, so
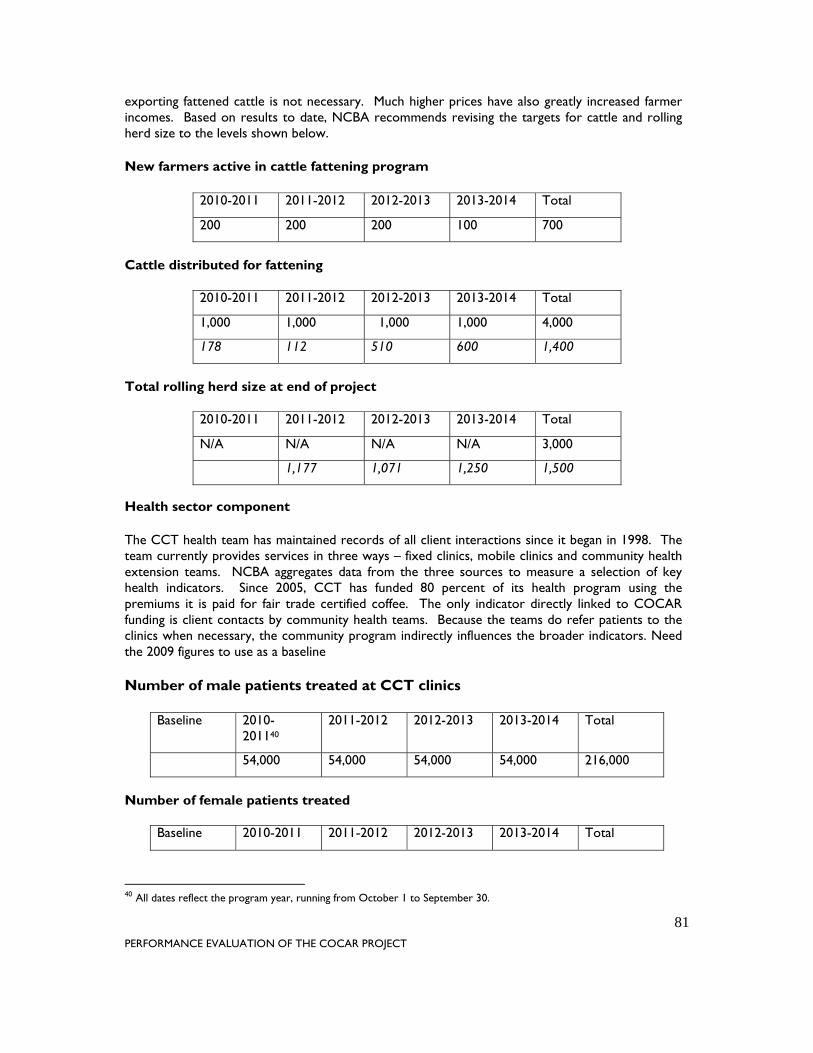
81 PERFORMANCE EVALUATION OF THE COCAR PROJECT
exporting fattened cattle is not necessary. Much higher prices have also greatly increased farmer incomes. Based on results to date, NCBA recommends revising the targets for cattle and rolling herd size to the levels shown below. New farmers active in cattle fattening program
2010-2011 2011-2012 2012-2013 2013-2014 Total
200 200 200 100 700
Cattle distributed for fattening
2010-2011 2011-2012 2012-2013 2013-2014 Total
1,000 1,000 1,000 1,000 4,000
178 112 510 600 1,400
Total rolling herd size at end of project
2010-2011 2011-2012 2012-2013 2013-2014 Total
N/A N/A N/A N/A 3,000
1,177 1,071 1,250 1,500
Health sector component The CCT health team has maintained records of all client interactions since it began in 1998. The team currently provides services in three ways – fixed clinics, mobile clinics and community health extension teams. NCBA aggregates data from the three sources to measure a selection of key health indicators. Since 2005, CCT has funded 80 percent of its health program using the premiums it is paid for fair trade certified coffee. The only indicator directly linked to COCAR funding is client contacts by community health teams. Because the teams do refer patients to the clinics when necessary, the community program indirectly influences the broader indicators. Need the 2009 figures to use as a baseline Number of male patients treated at CCT clinics
Baseline 2010-201140
2011-2012 2012-2013 2013-2014 Total
54,000 54,000 54,000 54,000 216,000
Number of female patients treated
Baseline 2010-2011 2011-2012 2012-2013 2013-2014 Total
40 All dates reflect the program year, running from October 1 to September 30.

82 PERFORMANCE EVALUATION OF THE COCAR PROJECT
66,000 66,000 66,000 66,000 264,000
Community extension teams: client contacts
Baseline 2010-2011 2011-2012 2012-2013 2013-2014 Total
56,000 62,000 67,000 67,000 224,000
Number of supervised births
Baseline 2010-2011 2011-2012 2012-2013 2013-2014 Total
150 180 200 220 750
Number of children under 5 years immunized
Baseline 2010-2011 2011-2012 2012-2013 2013-2014 Total
5,000 5,100 5,100 5,100 20,300
Number of Children Given DPT3
Baseline 2010-2011 2011-2012 2012-2013 2013-2014 Total
500 540 580 600 2,220
Family planning – Total Couple Year protection (CYP)
Baseline 2010-2011 2011-2012 2012-2013 2013-2014 Total
400 559 520 560 1,960

83 PERFORMANCE EVALUATION OF THE COCAR PROJECT
ANNEX 4: COOPERATIVA CAFÉ TIMOR (CCT) DEVELOPMENT 1992-2012

84 PERFORMANCE EVALUATION OF THE COCAR PROJECT
1992 The USA and Indonesian Governments agree in principle to the introduction of a USAID funded coffee development project in Timor-Leste with the objective of marketing Timorese coffee in high quality international markets.
1993 The Indonesian Director General of Cooperatives arranges for the Chairman of Timorese cooperative organization (PUSKUD) in Dili to meet with a representative of NCBA to discuss the feasibility of initiating such a project.
1994 The East Timorese Governor issues a Decree opening up coffee trade to full and fair competition.
1994 Indonesian Enterprise and Trade Development Project (IETDP) started July 1994 The IETDP grant to NCBA included, in addition to Timor-Leste, activities undertaken by NCBA in Aceh and South Sulawesi. USAID Indonesia funded the total Project at $6.8 mln for the period Nov. 1994 to Oct. 1999.
Project Objectives: Technical assistance to improve raw product yield and quality. Introduction of modern coffee processing machinery to improve coffee quality Improve income for PUSKUD coffee producers through access to high value foreign markets
Target activities: Coffee Health Clinics (late 1998) Support development of Institute of Economic in Dili (Sekolah Tinggi Ilmu Ekonomi)
The PUSKUD Cooperative was the Timorese NCBA Project counterpart organization and the project was located within a newly created organic coffee unit organized under PUSKUD. Work started with two primary cooperatives, one in Ermera and one in Ainaro that together had some 800 members. The main project office was located at the current site in Dili. A major coffee production and marketing study was undertaken during the initial year to verify the coffee production and marketing potential with emphasis on Ermera and Maubisse. Conclusions and recommendations from this report provided input into the NCBA implementation strategy.
NCBA explored the potential market sales in the USA with Starbucks and Royal Coffee of the USA and in Australia and New Zealand with H. A. Bennett & sons. Provisional acceptance was gained with Starbucks to buy first year coffee crop.
1994 NCBA rehabilitated the existing wet processing facility in Hotino (Ermera District).
1995 OICA international organic certification received by CCT to export organic coffee to the US. For the first time, East Timor organically certified coffee was exported with initial sales made to Starbucks, USA. Some 220 mt of green cherry was processed and 30 mt of organically certified green beans were sold during the first season.
Prior to the NCBA project, farmers had picked ripe cherry and processed it into parchment by field drying the berry and then removing the outer pulp by hand. The resulting parchment was of low quality and sold in low quality markets.
NCBA introduced the system of buying ripe cherry only and managing the further processing into green bean themselves to maintain tight quality control. The result was a much higher quality final product. The equivalent price paid to farmers for cherry was four times higher than the equivalent price previously paid for parchment
1995- 1997 Aifu (Ermera) wet processing facility was rehabilitated and new wet processing facilities built in Maubisse (Ainaro District) and Liquica District. New facilities were built in Estado
85 PERFORMANCE EVALUATION OF THE COCAR PROJECT
(Ermera District) in 1997. These facilities were renovated or built using project funds based on the NCBA introduced technology. Green bean sales increased to 457 mt in 1996 with sales to Starbucks and Royal Coffee in the USA and H. A. Bennett & Sons in Australia and New Zealand.
1998 Health sub-project started in late 1998 in Ermera District with USAID Project funding of about $100,000 and a similar level of funding from the CCT budget. Initially, coffee drying took place in several rented fields and the current Comoro field office site was acquired in 1998. This area included the primary coffee drying site that was in use until 2000 when the Tibar site, which is now used for coffee drying, was purchased in 2000.
1999 Timor-Leste votes to become independent from Indonesia August 31, 1999 leading to three month-long armed struggle. Troops from Australia and other Asian countries were called in to restore order. Timor-Leste came under UN Transitional Administration UNTAET) from September 1999 to May 2002.
1999 USAID provides no cost extension to NCBA through July 2000.
Due to security concerns, PUSKUD was the sole buyer of Timorese coffee during the 1999 season. Much of processed green bean was sent to West Timor prior to the violence, but approximately 600 mt stored in the Dili warehouse was looted. Large losses were incurred and project offices, warehouses, vehicles etc were destroyed, but the processing facilities in Ermera, Ainaro, Liquica, and Aifu were not touched.
2000 East Timor Economic Rehabilitation and Development Project (TERADP I) started in Nov, 2000 replacing IETDP Project
TERADP I received an initial $5.2 mln funding.
Objectives: Establish Cooperativa Café Timor (CCT) Provide social assistance including emergency food aid, health services, and consumer goods Assisted IMF with dollarization program Provided emergency employment and transport of displaced persons
Target crops Coffee Health care Post violence emergency services
Sixteen sub-district PUSKUD primary cooperatives with almost 17,000 members were renamed Cooperativa Café Organicos (CCO) and become affiliated under the PUSKUD successor organization Cooperativa Café Timor (CCT). It was registered as a cooperative under the UNTAET Trade Law as a formal Cooperative Law did not exist in Timor-Leste at the time.
CCT organized as a marketing and processing cooperative using the international cooperative model whereby individual farmer-members sell farm products to the cooperative and receive cash payment at the time of sale. Title to the product is taken by cooperative, which processes and markets the final product on behalf of its members. Membership cards were issued with each coffee growing member to verify their organic certification. The membership card ID is used as the basis for buying coffee.
In addition to restoring the cooperative facilities and providing emergency support services to rural Timorese, land was purchased in Tibar just outside of Dili where new drying fields were established. A new warehouse was built on the Comoro site using project funds. The Liquica processing facilities built on land leased from the Catholic Church were closed and the first vanilla demonstration project was started. East Timor Cooperative and Small and Medium Business
86 PERFORMANCE EVALUATION OF THE COCAR PROJECT
Enterprise Training Center (Klibur) started as a concept with Project support. Temporary facilities were built in 2001 and courses started. This institution is now self-sustaining. 2001 Fair Trade International Certification FLO-CERT obtained in December 2001. Since this time, CCT has been Fair Trade certified for all but one year through 2012 and is currently Fair Trade Certified through December 4, 2016. 2002 East Timor Economic Rehabilitation and Development Project (TERADP II) USAID funded TERADP II as a three-year grant through September 30, 2005 with new funds of $8 m. It is important to note that the project did not include funds for day to day functioning of CCT coffee operations or to provide cash to acquire capital asset improvements. In effect, the CCT coffee operations have operated on a sustainable basis since this time. Project funds were used to expand health care services to rural areas, introduce new farm level crop technology practices, and new innovative export crop and livestock enterprises.
Objectives: Organize small farmer production and value added processing of specialty crops directed
primarily at the export market; Transfer necessary skills and knowledge to the producers (and to the personnel involved in
the downstream processing and marketing linkages) to enable them to meet volume and quality requirements of the market;
Building and strengthening the rural enterprises that serve as the intermediary businesses between the producers and the world market;
Provide health care services to people in the major coffee production areas; and, Provide a variety of training programs for East Timorese entrepreneurs and management
personnel. Target Activities: Introduce agro-forestry shade tree component to improve coffee yields Health Clinics Livestock production and marketing Vanilla production and marketing Training and Education support to support Klibur and IOB
East Timor Institute of Business (IOB) started with NCBA Project support as an accredited undergraduate business program with Project support as a part of the Klibur Foundation
East Timor Coffee Academy (ETICA) started in Gleno in 2002 with project support. Initially set up as a post-secondary agricultural academy with a three-year degree program it is now an accredited Institute of Agriculture.
2002 SKAL International Organic Certification program initiated with CCT (replacing OICA) and CCT formed the Internal Control System (ICS) consisting of a 40 person CCT extension training team to bring and keep CCT members in compliance with Fair Trade and Organic Certification requirements. (SKAL merged with Central Union Certification (CUC) of Zwolle Holland in 2004 and continues to administer organic audits for EU, USDA NOP and Japanese and ANZ markets.) All extension staff costs are included within the CCT operating budget. “Timor Lorosae” and “Tanzania Timor Peaberry” coffee blend introduced. Timor coffee promotions introduced by Starbucks in Asian and Australian outlets.
2003 Field offices were built at the Comoro site using CCT operating funds.
87 PERFORMANCE EVALUATION OF THE COCAR PROJECT
2004 Starbucks Coffee and Farmer Equity Practices (CAFÉ) organic certification program initiated to audit required best practices for quality production and processing techniques, farmer price transparency, environmental stewardship, appropriate natural resource management, chemical hazzard protection both on and off farm, soil improvement, employee salary and working conditions, etc. The program was created by Conservation International and the annual inspections are done by Scientific Certification Systems (SCS) of California. Vanilla and clove enterprise programs certified organic by CUC. 2005 East Timor Economic Rehabilitation and Development Project (TERADP II) USAID extended from Oct 2005 through September 2008 with an additional $4.3 m. USAID project management shifted from Indonesia to new USAID Mission in Dili
Objectives: Organizing small farmer production and the value-added processing of specialty crops
directed primarily at the export market; Transferring the necessary skills and knowledge to the producers (and to the personnel
involved in the downstream processing and marketing linkages) to enable them to meet the volume and quality requirements of the market;
Building and strengthening the rural enterprises that serve as the primary intermediary businesses between the producers and the world market;
Providing rural health care services to more than 120,000 people in the major coffee production areas; and,
Providing a variety of training programs for East Timorese entrepreneurs and managerial personnel.
Target activities Livestock fattening program introduced in DRTL contiguous districts. Agroforestry nursery and seedling distribution Organic vanilla production and marketing Health care components
2005 CCT restructured into a single primary cooperative with more than 20,000 members and registered as a business cooperative within the framework of the new national Cooperative Law Decree No 4 of 2004. “Starbucks Arabian Mocha Timor” coffee introduced in US and other international markets.
2008 TERADP II Extension TERADP II extended from October 2008 through September 2010 with additional $4.3 mln funding. (Total funding of TERADP I & II from Oct 2000 to Sep 2010 was $17,500) Objectives: Health program expanded to include maternal child health program Introduced cattle fattening and agroforestry activities in Oecusse District Minor coffee rehabilitation program started
Target Activities: Coffee rehabilitation Livestock production and marketing Livestock fattening Organic vanilla and clove production

88 PERFORMANCE EVALUATION OF THE COCAR PROJECT
Community Extension and Maternal Child Health programsinitiated. Health care clinics funded by CCT-primarily using coffee operation Fair Trade premiums.
2008 Marketing and management services company trading as “CCT – CBI Global Management Inc.” formed as a joint venture with Cooperative Business International (CBI) and CCT to provide long-term technical, marketing, financial, and management assistance to CCT within the framework of the new Timor-Leste Investment Law supporting formation of joint ventures between Timor-Leste and international companies. CBI, a U.S. cooperative-owned trade and investment enterprise with a number of large U.S. cooperatives, including NCBA, as its primary shareholders, has since 1984 assumed a leading role in providing marketing and international business management skills to support international business cooperatives, focusing on the processing and export of high value, labor-intensive tropical agricultural products.
2010 Consolidating Cooperative Agribusiness Recovery (COCAR) Project Cooperative Agreement from October 2010 to 2014 with USAID funding at $7.2 million with CCT counterpart funds of $1.5 m. CCT membership exceeds 21,000 with almost 25,000 hectares of coffee under cultivation.
Objectives: Improve Food Security: The project will work to improve food security through the
development of the cassava sector. This will include delivering new genetic materials with higher yields to rural farmers, training them in best production practices, and in post-harvest handling;
Increase Incomes for Rural Households: The project will work to increase incomes of rural farmers by implementing activities in cattle fattening, coffee farm rehabilitation, cacao production/exports, agroforestry cash crops, and value-added cassava processing;
Reduce Environmental Degradation & Protect Natural Resources: The project will work to protect the environment through reforestation, resulting in conservation of soil and water resources, as well as protecting offshore/marine resources and enhancing public safety;
Enhance Health Care Services & Health Education: The project will continue to provide clinical and public health services to Timor-Leste’s rural population. Additionally, the project will deliver;
Build Human Resources Capacity: The project will build human capacity of its employees, stakeholders and partners by mentoring and training individuals regardless of gender, race, or religion.
Target Activities Cassava (546 households, including 412 men and 134 women) Cacao (178 households, including 156 men and 178 women) Agroforestry Livestock production and marketing Coffee rehabilitation
2011 RC Diocese approached NCBA and CCT to develop jointly with them, a 17-hectare block of land that they owned in Railaco in Ermera district. A 20-year MOU was signed in 2011 between the Diocese, NCBA, and CCT to develop and operate a research, training, and demonstration farm on this site. Subsequently, using CCT funds generated from sales of coffee and other high value crops, a new Brazilian designed, ecologically friendly wet coffee cherry processing facility was installed and operational in 2012. A coffee rehabilitation training center will be completed during 2013, again using funds from the CCT operating budget. An applied research demonstration program is being developed to test new tropical fruit and coffee species and varieties, including plans to house the professional research and training staff at the Center.

89 PERFORMANCE EVALUATION OF THE COCAR PROJECT
2012 COCAR New Zealand AID add on component Agreement with the New Zealand AID Programme signed April 2012 continuing through September 2014 with $3 mln new funding
Target Activity: Coffee rehabilitation Fund construction of an agroforestry nursery in Railaco.

90 PERFORMANCE EVALUATION OF THE COCAR PROJECT
ANNEX 5: BUSINESS COOPERATIVE DEVELOPMENT MODELS

91 PERFORMANCE EVALUATION OF THE COCAR PROJECT
Business Cooperative Development Models
Farmer Cooperatives in Timor-Leste
Decree Law No 4/2004 on Cooperatives governs the Cooperative form of business organization in the Timor-Leste. Under this law, a group seeking registration as a cooperative must have no fewer than 15 members and a minimum startup capital of $1,000. Currently there are fewer than 100 cooperatives registered under the law, of which just over 40 are credit unions. Fewer than 20 agricultural cooperatives are registered under the law; and most are of a multi-purpose type whose members provide their own labor to carry out production and processing of agricultural products with some use of hired labor. The products are sold either individually or jointly through the cooperative with member returns based on volume of product contributed to the joint effort after deducting the cooperative operating expenses.
Several international donor organizations including OXFAM, a British based organization, and two Japanese based groups – Peace Winds, and PARC (Pacific Asia Resource Centre) – have worked since the early years of Timor-Leste independence to establish farmer cooperatives for the purpose of introducing improved coffee production and processing technologies. From the organizational perspective, the donor typically works for several years with informal groups prior to formation of a formal cooperative. They provide technical assistance and training to improve coffee yields and have introduced small scale wet processing pulping equipment owned jointly by group members to improve processing of cherry into parchment. The parchment is then dry processed into green bean by Dili based processors.
PARC and Peace Winds farmers are certified organic by the Japanese certification agency AFAS and market green bean to Japanese buyers. In 2008, Peace Winds worked with some 230 households in Letefoho (Ermera District), organized into 18 village groups. They received $1.80 per kg of parchment, equivalent to $.36 per kg cherry. The actual cost of producing the parchment was $2.80 per kg. At the time, Peace Winds estimated that their breakeven export quantity was 100 mt, twice the actual amount exported.
PARC, in 2008 worked with 222 households in Maubisse District organized into seven village groups. PARC has established a Timorese registered trading company “People’s Trade Company” that is managed by PARC through which green bean is exported to Japan.
Oxfam works through a Timorese rural development partner MCEA, in supporting more than 500 coffee growers in Ainaro, Ermera, and Liquica Districts. Similar to Peace Winds and PARC, MCEA provides training and technical assistance in management and organizational aspects of the business cooperative, introduces improved coffee production technology and supports development of value adding processing of cherry into parchment. Unlike the PARC and Peace Winds projects Oxfam works to link farmers with higher quality coffee markets through Fair Trade Certification and provides technical quality control feedback from coffee roasters in New Zealand, which is the destination of most of the green bean sold by MCEA growers exported41.
Small scale, village based business cooperatives have the potential to significantly improve member incomes in the long run as people learn to work together to achieve common economic and social objectives. Initially, members have little experience in working together to make joint business decisions and little if any understanding of the techniques of group business decision making. They need to learn these skills on-the-job. Village based business cooperatives tend to operate in a very participatory democratic manner as members are from the same or neighboring villages. As such, they provide a good learning experience for members to address community improvement and
41 The discussion in this and the previous two paragraphs is taken from: MAF, Directorate of Industrial Crops and Agribusiness, “Commodity Profile Series No. 9 Version 1 – Coffee” , July 2009

92 PERFORMANCE EVALUATION OF THE COCAR PROJECT
related social objectives, but often operate at a disadvantage in making objective business decisions as inter village family and neighbor relationships and rivalries interfere in this process. Consequently, donors involved with forming small-scale business cooperatives generally organize informal working groups of people with the aim of developing high trust profiles among members that encourage efficient and effective group decision-making. In this context long-term success depends on the compatibility of group members to quickly make joint business decisions which, in turn, generally depends on the emergence of a respected and capable leader or small group of leaders who have a developed a strong trust relationship with the group members. An additional problem faced by small-scale business cooperatives is the unwillingness of farmers to sell their product to the cooperative, as by definition, it takes title to the product, and the farmer expects an immediate payment from individual sales. As a result, even after four or five years of working in an informal group context, formation of a profitable business model remains beyond their reach and they remain heavily subsidized by the sponsoring donor. This in fact, has been the experience of the donor supported coffee improvement activities discussed above.
Business cooperatives, to operate successfully, must be able to leverage individual small-farmer production into a sufficiently large volume to: (1) achieve breakeven sales levels, and (2) achieve sufficient volume to negotiate successfully on price, quantity, and quality as an equal with large volume buyers of agricultural products. Experience with primary village level groups and cooperatives across many developing countries suggests that very few are able to effectively aggregate their production to this level, or attain required standardized quality requirements, without outside financial and technical support.
Within the business cooperative structure, economies of size are gained through federation by forming secondary cooperatives, but introduces another level of cost absorbing administrative bureaucracy that itself may be difficult to maintain without additional outside technical and financial support. However, as will be seen in the next section, the success of the large business cooperatives in the United States has been dependent on significant public sector policy and financial support in order to gain economies of size necessary to realize an economic impact at the national level.
Farmer Cooperatives in the United States
When foreign specialists evaluate small farmer business cooperatives in countries such as Timor-Leste it is often done within the context of current conditions in the developed country rather than conditions as they existed when the developed country was at the same development stage. For example, the reason for formation of the Land Grant College system in the US was to combat major soil nutrient depletion caused by farmers using no fertilizers and just moving on when crop production was no longer possible. This practice left large swaths of land in the Northeastern US unproductive as farmers moved west to more fertile land leaving the poorer soils behind. The national response to this problem was an 1860 Act of Congress requiring all states to set aside land for construction of state financed agricultural colleges to teach farmers to better utilize their land and maintain its productivity. This was the formation of the still functioning Land Grant University system funded partially by US Federal finds and partially by individual State level funds.
In the initial decade of the 20th century Land Grant University leaders, in association with other US State and Federal leaders, determined that small-scale subsistence farmers could be lifted out of poverty by teaching them to improve their production technologies. However, to maximize financial returns, they also needed a mechanism to aggregate, process, and efficiently transport their products into the large urban and export markets. Legislation legalizing the formation of processing and marketing cooperatives, having many thousands of members, that enjoyed an exemption from existing anti-trust laws provided the means for small farmers to gain product processing size economies, improved product quality, reduced transportation and other handling

93 PERFORMANCE EVALUATION OF THE COCAR PROJECT
costs, resulting with increased bargaining power associated with large-scale product turnover and sales.
The second and third decades of the 20th century witnessed the passage of several important pieces of agricultural legislation that set American farmers on the road to increased production efficiencies and improved product marketing. Included among this legislation were:
The Smith-Lever Act of 1914 tied vocational education in home economics and agriculture to the land-grant college system. It also led to federal government to support farmer cooperatives, bringing about a system of trained county agents to assist farmers in conducting more efficient and scientific stock-raising and crop-growing;
The Agricultural Extension Act of 1914 authorized federal grants-in-aid to the state agricultural colleges for supporting a program of extension work in farm areas;
The Federal Farm Loan Act of 1916 provided federal credit to small farmers via cooperatives; The Smith-Hughes Vocational Education Act extended the Smith-Lever provisions of 1914,
supported teacher training, and other instruction in industrial occupations, home economics, and agriculture;
The Capper-Volstead Act of 1922 empowered farmers to market, price and sell their products through cooperatives exempt from anti-trust legislation. By granting farmers the legal right to pool their bargaining and marketing resources, the Act placed farmers on an equal footing with the large corporate buyers of raw agricultural products. The Act accomplished this by giving farmers a defined set of legal protections for collective bargaining and marketing of their products. A key aspect of this provision is that the cooperatives took legal ownership of member’s products, in the name of the cooperative, thus gaining market leverage when negotiating on behalf of their members.
Thus, unlike the small Timorese farmers who continue to struggle against adversity with the support of a small number of donor agencies with limited funds, the small-scale US farmer in the second and third decades of the 20th century, received full government legislative and financial support to: Introduce a national publically funded adult rural education system to improve production
efficiencies; Introduce a business cooperative based credit system that provided farmers with favorable
lending conditions; Introduce a business cooperative based input supply and product marketing system whereby
many thousands of small farmers could buy inputs at bulk prices and jointly aggregate their production to gain market power previously enjoyed only by the largest producers.
To summarize, new legislation 1) enabled formation of farmer owned input supply, processing and marketing cooperatives of sufficient size to compete effectively with large-scale private sector competitors; and 2) created a nationwide system of publically financed farmer adult education programs provided training and technical support at the community and county level to strengthen the democratic decision making and business management skills of farmer cooperative members at the local grass roots level. Thus, technical production training, democratic organizational strengthening, and business management skills training were provided to farmer cooperative members, using public funds, at the community and county levels, while the size economies associated with cooperative product processing and marketing enabled farmer cooperative

94 PERFORMANCE EVALUATION OF THE COCAR PROJECT
members to hire capable and well trained individuals to effectively manage these high skill input supply and marketing activities.
A key success element of this public/private sector coordination was the formation of member owned training and lobbying organizations. Key among these organizations is the National Cooperative Business Association (NCBA). Founded in 1916, the NCBA was known as the Cooperative League of America until 1922 and as the Cooperative League of the USA (CLUSA) until 1985. It was the first, and the largest, national organization for cooperatives and for nearly 90 years, NCBA has remained dedicated to developing, advancing and protecting cooperatives. NCBA's founders created the organization to enable farmer and consumer-owned cooperatives to share best practices and management advice. Over time, the organization evolved and expanded its scope to reflect growth of cooperatives in multiple business sectors and today, NCBA's membership includes all types of cooperatives across all industries-consumer, producer, shared services, and worker-owned co-ops. It has a well-deserved reputation for supporting its international business cooperative members after withdrawal of donor funding. This aspect of the NCBA experience as it relates to Southeast Asia is developed further in Annex 5.6
A. The CCT Experience CCT Formation and Early Experience: The Cooperativa Café Timor (CCT) was formed in 2000 as the successor organization to the East Timor Federation of Cooperatives (PUSKUD. The working foundation of CCT had been in place since 1994 at commencement of the NCBA Project when PUSKUD, the Indonesian Provincial level cooperative organization, formed a new organic coffee unit within its organizational structure that included two primary cooperatives in Ermera and Ainaro Districts. These two primary cooperatives had a combined membership of some 800 small-scale coffee growers. These cooperatives benefitted from technical support, training, and marketing skills provided by NCBA specialists. Project staff rehabilitated the existing wet processing facility in Hotino (Ermera District) in 1994 and in Aifu (Ermera District) in 1995. New wet processing facilities also were built in Maubisse (Ainaro District) and Liquica District and a fourth was built in 1997 in Estado (Ermera District). These facilities were renovated or built using project funds following the NCBA introduced technology.
Prior to the NCBA project, farmers had picked ripe cherry and processed it into parchment by field drying the berry and then removing the outer pulp by hand. The resulting parchment was of low quality and sold in low price markets. With upgraded wet processing equipment in place, NCBA introduced the system of buying ripe cherry only and managing the further processing into green bean themselves to maintain tight quality control. By centralizing and controlling all cherry processing activities through to the sale of the green bean, NCBA was able to attain a high quality final product with uniform consistency required to meet quality standard requirements. The equivalent price paid to farmers the first year for cherry was about four times higher than the price previously paid for parchment.
In 1999, the Timorese voted overwhelmingly for political Independence from Indonesia in a national referendum. By that time the NCBA project was working with some 16 community based PUSKUD primary cooperatives with almost 17,000 members. All were organically certified. In early 2000, with Timor-Leste no longer a part of Indonesia and the country under the United Nations Transitional Administration in East Timor (UNTAET) the PUSKUD was reorganized as Cooperativa Café Timor (CCT) and registered as a Cooperative under the existing UNTAET Trade Law, as a Cooperative Law did not exist at the time.
The COCAR predecessor “TERADP Project Final Sustainability Evaluation” report of June 2000, described the organizational structure as:

95 PERFORMANCE EVALUATION OF THE COCAR PROJECT
“Member-Groups: The first level of organization is the farmer-member group. There are currently 473 groups and on average, each group has about 40 members. The member group is the point at which the Coop’s management communicates with the majority of the membership through democratically elected group leaders. Other activities that take place at this level include project administration, the registration for health service, registration for membership ID cards, raw product/quality control, coordination of harvest and transportation of cherry to the CCO wet mills.
CCO: The next level in the Project’s organizational structure is the CCO (Cooperativa Café Organic). This is the local primary cooperatives level of the organization. There are 16 CCO’s, all of which are owned by the 473 member groups. On average, each CCO has 1,177 members. The CCO’s have significant variation in their members’ numbers; the largest CCO is the Cooperativa Café Maubisse with over 3,100 members and the smallest is Cooperativa Café Organic Halibur with 138 members. A democratically elected board of directors manages the CCO’s and each CCO has a full-time local NCBA manager assigned to them to assist in training, coop management, and coordination of harvest. Membership to the CCO is a function of geographic location.
CCT: The umbrella organization is the Cooperativa Café Timor National also called the CCT. The CCT is owned by the 16 CCO’s and like the other levels of the organization, the CCT has a democratically elected board of directors. The CCT also owns most of the fixed capital and liquid assets associated with the coffee activity including the revolving fund equity, three wet mills, five medical clinics, the Dili based parchment processing facilities, green bean sorting and warehouse facilities as well as other assets. The primary function of the CTT is to purchase parchment from the CCO’s. The CCT, then the legal owner of the parchment, processes and exports the finished product (green coffee beans) and returns dividend payments to the CCO for distribution to member-groups and individual members.”
Current CCT National and Sub-District Organization: CCT, at the national and district levels is still structured in much the same way as it was in 2001. In January 2013 there were 18 “Geographic Groups” (GGs), replacing the CCOs, 445 Sub-Groups and 21,560 members. GG membership averaged 1,197 ranging from 3,304 in Maubisse (Ainaro District) to 345 in Lolotoe (Bobonaro District). Average subgroup membership was 48, ranging from 37 to 94 with average coffee growing area owned per member at 1.14 hectares.
The TERADP Evaluation report noted that CCT was owned by the 16 CCOs, but, legally, this was not the case as CCT was registered during the period of the UN Transitional Administration under the existing Trade Law, that did not recognize the legal distinction between a primary and secondary cooperative, as a Cooperative Law did not exist at the time. Consequently, the CCO’s, while operating under assumptions that could have been valid under Indonesian Law were never, under the UNTAET, legally linked to CCT as primary cooperatives affiliated with a secondary cooperative as they were under the PUSKUD structure although they continued to operate informally in this fashion while registered under the UNTAET laws.42
42 The popular view that CCT was a secondary cooperative owned by the 16 primary CCOs prevailed not only in the Evaluation report but also in other papers and articles written at the time. See for example, OXFAM, “An Overview of the Coffee Sector in Timor-Leste” 2003.

96 PERFORMANCE EVALUATION OF THE COCAR PROJECT
Table 1: Cooperativa Café Timor Geographic Groups, Members and Coffee Area Harvested, January 2013
Geographic Group by District
Sub Groups (No.)
Members (No)
Area Harvested
(Ha)
Avg members per sub-group
Avg area per
group (ha)
Ermera 1. Aifu 32 1,478 1,337 46 0.90 2. Hotino 38 1,406 1,872 37 1.33 3. Hatolia 20 1,422 1,522 71 1.07 4. Lauana 16 990 1,321 62 1.33 5. Letefoho 30 1,344 980 45 0.73 6. Atsabe 33 1,644 2,099 50 1.28 7. Railaco 21 896 613 43 0.68 Sub Total Ermera 190 9,180 9,744 48 1.06 Ainaro 8. Ainaro 13 695 713 53 1.03 9. Hatubuilico 16 1,194 1,520 75 1.27 10. Maubisse 69 3,304 3,760 48 1.14 Sub Total Ainaro 98 5,193 5,993 53 1.15 Liquica 11. Liquica 8 755 1,093 94 1.45 12. Bazartete 5 293 423 59 1.44 13. Leorema 11 843 1,676 77 1.99 14. Maubara 14 376 349 27 0.93 Sub Total Liquica 38 2,267 3,541 60 1.56 Manufahi 15. Same 16 632 1,557 40 2.46 16. Turiscai 24 947 858 39 0.91 Sub Total Manufahi 40 1,579 2,415 39 1.53 Aileu 17. Aileu 73 2,996 2,300 41 0.77 Bobonaro 18. Lolotoe 6 345 666 58 1.93 Total 445 21,560 24,659 48 1.14
When CCT was re-registered as a business cooperative following enactment of the Decree Law No 4/2004 on Cooperatives it was as a primary cooperative with no legal association with the former CCO’s which are now simply called Geographic Groups (GGs). The GGs continue to carry out similar product buying functions as the CCOs but technical staff members relate directly to the CCT headquarters management rather than through a lower level primary cooperative structure. In making this decision, CCT followed a common US and international model for direct membership affiliation with a national primary cooperative

97 PERFORMANCE EVALUATION OF THE COCAR PROJECT
The advantage of this structural change is a reduction of formal administrative overhead functions and costs associated with the existence of an intermediate legal organizational structure, thereby streamlining business decision making. The disadvantage is that transparency and direct participation of grass roots members in making business decisions has been reduced. However, as discussed above, the existence of a high level of direct member participation in local level business decision making processes is one of the key reasons that functioning business cooperatives are seldom formed at the this level. In the more centralized business cooperative model, local level members elect one or more of their peers to represent them at Annual General Meetings. For example, during the early CCT years each CCO/GG elected up to five members, each year, as their AGM representatives. Currently, members elect one representative for each 1,000 members with the last election having taken place in 2010. However, during the field interview survey, most CCT members interviewed expressed no knowledge of this election, nor of the individuals who had been elected to represent them at the AGM. Moreover, it is not clear, from information provided by CCT or Project staff how or if the relationship between the GGs, as successors to the CCO’s, is retained as the coordinating point for sub-district level CCT community level sub-groups. It appears that this is not the case.
Based on Focus Group discussions with more than more than 250 CCT members in six Districts, conducted as part of this evaluation, membership cards designating CCO membership identification seem not to have been distributed since CCT was re-registered in 2005 although the respective GG groups retain, in almost all cases, the original CCO geographical place name identification. Only in Ermera did household survey respondents consistently indicate possession of membership cards. NCBA staff explains that membership cards are for the purpose of identifying farmers holding organic certification credentials. Since membership has held quite constant since 2005, new cards have not been issued since that time, but COCAR Project staff indicated that they expect to issue new cards in the near future.
However, Focus Group respondents did not see the lack of membership cards as a reason for not working with. It must be noted also that almost all Focus Group interviewees expressed positive support for CTT as an organization with which to do business. Reasons for this support included statements such as “they always buy my coffee”, “they don’t charge for transportation43”, they come with their trucks to pick up my coffee even if I am on a back road”, “they always pay cash when they pick up my coffee”, “they provide free training”. In 2012, for the first time CCT bought cassava from a small number of growers who joined this experimental program in 2010. Once again, even though none of these individuals have membership cards they strongly support CCT “because they give me a contract that they will buy my cassava,” “they teach me how to grow cassava at no cost to me”, and “they buy my product.” Individual surveys conducted during this evaluation indicated that more than 90%% of the respondents were satisfied or very satisfied with individual and group training provided by CCT.
CCT community group level organization: While member association at the CCT intermediate and national level has weakened from that existing during the Indonesian and early CCT period, it remains strong at the-sub group level where members interact directly with each other and is the level at which training and CCT cherry purchase takes place. Table 1 indicates that in January 2013, CCT had 445 community level sub-groups organized under the 18 GGs compared to 473 in 2001 organized under 16 CCOs. The average (as well as the median) coffee sub-group size is 48 members with the largest and smallest group (94 and 27 respectively) located in Liquica. More than three-fourths of the sub-groups contain fewer than 60 members suggesting
43 It should be noted that CCT pays a $.04 differential above their prevailing price for cherry delivered directly to the wet processing facility.
98 PERFORMANCE EVALUATION OF THE COCAR PROJECT
that they are reasonable sizes for conducting trainings and to serve as local level cherry buying sites.
The Focus Group field survey discussions showed that all but a few of the newest cassava groups had an elected group leader. The overwhelming majority of the leaders were elected by their peers in a formal meeting, most often by consensus rather than by secret ballot. Local CCT staff reportedly appointed a few. Most group leaders were generally well respected and trusted by group members.
A major group leader function is organizing group technical training sessions, led by CCT field staff, and organizing labor-sharing workdays to speed up harvest. This is especially important for coffee for which the initial processing should ideally be started within 12 hours after picking to initiate the quality control chain. Here it is useful to compare the CCT grass roots group experience with those of the non-CCT small-scale processing groups and cooperatives supported by other donors. In the latter case, the unmet objective is usually establishment of a profitable business cooperative. In the CCT model, forming a profitable primary cooperative is not at issue, as this is the role of the national level structure, consequently at the local level members can get on with the job of improving their productivity by working closely with the CCT technical staff to organize training events, and pooling their labor as necessary to facilitate harvest or other tasks that require more than just family labor for completion. As noted above, it is much easier to gain community cooperation around common social and work related activities than it is around business issues involving financial decisions in community groups involving close relatives as well as individuals with strong local level political influence.
As CCT has developed and matured over the years, its strength became its ability to maintain effective management control over all aspects of processing cherry into high quality green bean able to penetrate high priced niche markets. At the farmer level, an intensive educational and training program is in place to improve farmer skills in harvesting cherry, in rehabilitating trees by pruning and planting new rootstock and by replacing the shade trees required to produce high quality Arabica coffee. However, in the process of creating business management efficiencies it lost some member decision-making transparency and participation capacity present earlier in the development process.
CCT, since 1998, with active USAID funding, developed an extensive agroforestry shade tree replacement activity. Under COCAR, this activity expanded its coffee seedling production with some one million seedlings currently in some stage of growth. Some 700,000 are grown in 35 private sector contract nurseries averaging about 20,000 seedlings per nursery with the remainder being grown in 400 small community level nurseries. Using Project funding CCT provides seedlings free of charge to the community level nurseries and then buys them back again at $.10 per seedling when they are sufficiently large for planting in farmer’s gardens. They are distributed free of charge to farmers participating in the coffee rehabilitation program. Twenty-six CCT funded extension staff are responsible for training farmers to engage in regular pruning of existing trees, to increase use of organic fertilizers, remove weeds and noxious grass from the coffee gardens and participate in the seedling rehabilitation program. With the addition of £3 million from the NZ Aid Programme that started in October 2012, total coffee farms expected to be rehabilitated by EOP increased from 4,800 to 12,000.
In addition to the 26 CCT funded extension staff dedicated to maintain member certification status, USAID also funds an additional 77 field level extension and training staff as shown in Table 2. Twelve are dedicated to coffee rehabilitation support, (each located in a separate sub-district) 19 are dedicated to the agroforestry component including 12 plant agroforestry plant nursery laborers, 9 to the cassava program and 2 cocoa extension agents. Thirty staff are dedicated to the

99 PERFORMANCE EVALUATION OF THE COCAR PROJECT
livestock fattening program including 16 laborers and one veterinarian. However, the latter position is vacant at the time of the evaluation. The coffee rehabilitation specialists are located one to each of 12 subgroups and cassava extension specialists are located in four sub-districts plus one in the Comoro site.
Table 3: CCT Field Extension Staff Supported by COCAR Project Funds
Technical Specialty Number
Male
Female Location
Training coordinator 1 1 - Dili Training assistant 1 1 - Gleno Project data manager 1 1 - Dili Coffee rehabilitation asst supervisor
2 2 - Maubisse (Ainaro) and Gleno (Ermera)
Coffee rehabilitation extension agent
12 10 2 Atsabe, Lauana, Letefoho, Hotino, Aifu, Hatolia, Aileu, Maubisse, Turiscai, Ainaro, Dare, Same
Agroforestry supervisor 1 1 - Dili Agroforestry extension agent
6 6 - Baucau, Suai, Oecusse
Agroforestry laborers (plant nurseries)
12 12 - Comoro
Livestock supervisor 1 1 - Dili Livestock extension agent 8 8 - Suai, Oecussi Livestock truck drivers 4 4 - Suai, Oecusse
Livestock veterinarian 1 - -
Position currently vacant. Formally at Suai
Livestock laborers 16 13 3 Comoro, Oecusse, Suai Cassava supervisor 1 1 - Dili Cassava extension agent 8 7 1 Same, Suai, Maliana, Baucau, Comoro Cacao extension agent 2 2 - Same, Dili Total 77 71 6
The comparison between 77 donor funded field extension staff and the 24 funded by CCT initially seems unbalanced with the CCT funded staff seemingly dwarfed by the much larger USAID funded staff. However, the component breakdown suggests a different conclusion as the coffee rehabilitation component accounts for only 14 of the 77 technical positions(less than 20%). The livestock fattening component (that has been ongoing since 2001, accounts for 30 of the 77 employees (almost 40%); agro forestry with 19 employees (about 25% of total Project funded employees) has also been in process since 2001. The new development activities – cassava and cocoa - together account for only 11 extension related staff (less than 15% of the Project funded staff). Thus, the two components that have been ongoing for some 11 years still account for almost two thirds of the extension staff funded under the COCAR Project budget.

100 PERFORMANCE EVALUATION OF THE COCAR PROJECT
Organic, Fair Trade, and Starbucks Café Practice Certifications: CCT has been able to maintain its high quality niche market status by maintaining since 1995 its formal organic certification status, adding Fair Trade Certification in 2001 and Starbucks’s Café Practices certification in 2004.
Organic Certifications: CCT and its predecessor PUSKUD Organic Division have maintained annual organic certification since 1995.
The PUSKUD Cooperative organic coffee unit gained initial OICA organic certification in 1995 for the USA through the efforts of the NCBA Chief of Party. Starbucks bought the initial 30 mt of green bean produced that year on a provisional basis. Subsequently, Royal Café and Starbucks became the primary US buyers with HA Bennett & Sons buying for the Australian and New Zealand markets. These companies remained the primary buyers in 2012.
CCT obtained the Holland based SKAL International Organic Certification in 200244. As part of this program, they formed a completely locally funded Internal Control System (ICS) consisting of 40 extension staff dedicated to maintaining member organic certification status. These teams train farmers to maintain and improve their coffee gardens and to adopt cultivation and harvesting practices that meet organic certification requirements and harvesting only high quality cherry.
Fair Trade Certification: CCT received its initial Fair Trade International Certification FLO-CERT in December 2001. Since this time, CCT has been Fair Trade certified for all but one year through 2012 and is currently Fair Trade Certified through December 4, 2016. Fair Trade Certification is designed to support poorly capitalized small-scale coffee growers working through their Producer Organization to improve product productivity and quality by providing a price premium in the range of $.20 that is dedicated to achieving these objectives. The Fair Trade Certification is available to small-scale farmers through their Producer Organizations who work with them to promote improved production and processing practices.
The FLO-CERT Guidance Document indicates that investments in productivity and quality can be clustered as follows:
1. Creating the conditions for improvements
In order to enable farmers to produce more and better coffee, the Producer Organization will have to create or improve some basic conditions and provide a series of services to its members. These may include: research and validation, technical assistance and extension, training and exchange visits, soil analysis, credit facility or support to access external credit sources, monitoring capacity, environmental conservation (protection of watersheds, adaptation and mitigation of climate change plans and techniques), zoning and profiling of qualities.
2. Investments at farm level Crop rehabilitation (existing trees) and crop renovation (new trees), soil conservation, improved soil fertility, improved husbandry techniques, improved infrastructure for processing (hulling, fermenting, washing, drying) and storage, (waste) water management.
44 SKAL merged with Central Union Certification CUC) of Holland in 2004, which now implements the organic certification program.

101 PERFORMANCE EVALUATION OF THE COCAR PROJECT
3. Investments at Producer Organization level Building or improving processing facilities for coffee (wet and dry mills; improve yields and quality, reduce use of energy and water), laboratories (soil and water analysis), cupping facilities, roads & transport, processing plants for (organic) fertilizers, water treatment plants, and similar investments.
CCT, as the producer organization representing its 21,500 plus members must annually dedicate at least half of the premium to activities or investments that qualify under the program following a plan that is approved annually by the AGM. Moreover, the premium cannot be used to provide a general cash dividend to members. For 2012, the AGM authorized half of the dedicated funds to the CCT Health Program and the other half to the Railaco training and research demonstration farm.
Starbucks Coffee and Farmer Equity Practices (CAFÉ) certification program. This program certifies that CCT and CCT members meet or exceed required best practices and quality production and processing techniques. This includes reduction of environmental footprint; meeting economic transparency criteria, social responsibility and best practice employee working conditions, including minimum salary levels. The program has several levels of certification: Strategic Supplier: Achieved a minimum of 80% in each of the scored subject areas (social
responsibility, environmental leadership-coffee production, environmental leadership-coffee processing;
Preferred Supplier: Achieved a minimum of 60% in each of the scored subject areas; Verified Supplier: Achieved less than 60% in each of the scored subject areas.
While certification under this program does not guarantee purchase of coffee by Starbucks, minimum certification is required in order to sell coffee to Starbucks. Since joining the program in 2004 CCT has attained the Preferred Supplier designation for every inspection with average scores in the mid-70 to high percent range.
To meet the Organic, Fair Trade, and Starbucks Café certification requirements, CTT formed, in 2002 a dedicated field extension team to work with improving farmer productivity and product quality. Initially funded by 40 field extension staff the current figure is 26. Salaries and support costs for this team are covered under CCT general operating expenses and not by donor project funds.
Gaining this range of certification on an annual basis can be time consuming for the Producer Organization and also quite costly, as physical inspections are normally carried out annually on the designated proportion of the member farms that is usually on the order of 10%. CCT management staff indicated that the annual direct costs of the actual certification audits for the three programs are about $100,000, while indirect costs (including the dedicated coffee field extension staff) are an additional $200,000. These costs are all covered from the CCT operating budget and are not charged against the COCAR Project budget.

102 PERFORMANCE EVALUATION OF THE COCAR PROJECT
ANNEX 6: NCBA LONG TERM COMMITMENT TO POST DONOR FUNDED SOUTHEAST ASIAN BUSINESS COOPERATIVES

103 PERFORMANCE EVALUATION OF THE COCAR PROJECT
NCBA Long Term Commitment to Post Donor Funded Southeast Asian Business Cooperatives
NCBA began work in Indonesia at the request of the GOI in 1977. This early work focused on small-scale cooperative manufacturing enterprises and agricultural cooperative development. During the period 1980-87, NCBA used grant funds (from two PL 480 grants totaling 3.8 million USD) to create several agribusiness and light manufacturing activities in central Java and South Sulawesi. These included large furniture-manufacturing cooperatives and other agribusiness cooperatives that now employ over 16,000 people and generate over 100 million USD in annual export sales. These cooperative businesses have not received any funding from USAID since 1987 and their sales have consistently grown. In 1985, using USAID grant funds, NCBA entered the vanilla sector by creating a number of vanilla production cooperatives and a processing/ export coop. The processing coop currently buys vanilla beans from nearly 20,000 farmer-members and then processes and exports the final product. Building upon a vanilla supply relationship developed with US spice company McCormick, NCBA and its subsidiary CBI expanded Indonesian cooperative joint venture farmer processing, supply and export activities to black and white pepper, cinnamon, cloves, nutmeg, mace and several other minor spice products. These ventures are amongst McCormick’s largest suppliers worldwide for more than 20 years. They are also among the largest spice processors and exporters in the world and involve over 20 cooperatives in the region including, CCT. With production operations located on over 80 different islands large and small, it is estimated that nearly 200,000 small farmers are involved in production.
A similar development trajectory has occurred with NCBA/CBI small-holder cooperative coffee operations in the past twenty years. Major partnerships have been established with farmer cooperatives in Sulawesi (PUSPETA Luwu), North Sumatra (PUSKUD Sumatra Utara), Aceh (Koperasi BQB) These cooperative ventures-all with early seed capital investments involving USAID - are now collectively among the largest processor/exporters of specialty Arabica coffees in Asia. They have operated over a long period of time without USAID assistance, are all profitable and all receive loan financing from international financial institutions on commercial terms. They are additionally amongst the largest suppliers to specialty coffee companies such as Starbucks Coffee Company while also supplying other major specialty retailers such as Green Mountain Coffee Company.
Similar, albeit smaller agricultural cooperative ventures have been started by NCBA in several other areas and include sectors such as essential oils (Sumatra), Women’s’ Microfinance Cooperatives (Aceh), beef cattle (W. Timor) and feed milling (Java), and all continue to operate successfully.
Using USAID seed capital (through a 4 million USD, 1988, P.L. 480 monetization project) NCBA has developed similarly successful cooperative owned businesses in the spice and financial services sectors. Using these funds NCBA started the Cooperative Finance Company of Indonesia (COFIDE). Today COFIDE has nearly 20 times its original assets and is one of Indonesia’s highest rated finance companies by its Ministry of Finance. To date, NCBA’s efforts in the region have resulted in the creation of over 20,000 sustainable full time jobs and twice that number of seasonal jobs and have increased the incomes of over hundreds of thousands of farm families.

104 PERFORMANCE EVALUATION OF THE COCAR PROJECT
ANNEX 7: ALTERNATIVE TIMORESE COFFEE MARKETING MODELS

105 PERFORMANCE EVALUATION OF THE COCAR PROJECT
Alternative Timorese Coffee Marketing Models
Several NGOs and boutique coffee houses sell or plan to sell coffee produced in highly specialized markets. For our purposes here, a composite Japanese NGO model will serve to illustrate the model.
Figure 1: Coffee Subsector Map, Japanese NGO Business Model
Often these NGOs operate with a business model that is based on humanitarian and Fair Trade principles and are, as a result, not operating under the same financial models as a commercial firm. Thus the directors, who are usually expatriate Japanese, are paid by an organization. This organization is linked to a Fair Trade organization in Japan that manages marketing through direct sales to consumers or through retail boutiques. Many of the marketing costs are absorbed by special funding mechanisms. The remainder are passed to the consumers in the form of high prices.
The Japanese NGO business model is intended to pass the highest possible profit on to farmers. In 2012, the reported price for green bean to farmers in Timor ranged up to about $3.00. Prices are announced early in the season and farmers may sell any proportion of their crop to other

106 PERFORMANCE EVALUATION OF THE COCAR PROJECT
companies. Some of these groups pay upon receipt of the coffee, others have bureaucratic delays of up to 2 months45.
Figure 2: Coffee Subsector Map, Timorese Business Model
The Timorese trader business model is more difficult to describe because it is more complicated (see Figure 2). Three products are traded: cherry, wet parchment, and dry parchment. Sales transactions take place on-farm, in suco centers, along the road, in a local shop, and at a company's receiving center.
45 It is reported by some observers that sometimes farmers ask not to be paid immediately and use the money owed as a kind of bank account.
107 PERFORMANCE EVALUATION OF THE COCAR PROJECT
While pulpers and other processing equipment might already be available, farmers do not assign the same financial value to their own labor, as would an accountant. So while farmers will consider their time investment, they may still choose to process all or part of their harvest into parchment in order to receive more cash-in-hand. Processing to parchment can be considered to increase risk because the price they receive may be lower or higher than the price they would have realized for cherry, although there are reports of high price for parchment being realized at the end of the calendar year, but this requires further confirmation.

108 PERFORMANCE EVALUATION OF THE COCAR PROJECT
ANNEX 8: CCT CASSAVA PROGRAM RESULTS 2011 – 2012

109 PERFORMANCE EVALUATION OF THE COCAR PROJECT
CCT Cassava Program Results 2011 – 2012
Table 1 shows that 546 farmers were enrolled in the CCT Cassava program in 2012 when $79,545 was paid to farmers: 56% for dried cassava, 39% from stems for replanting by other farmers, and 4% for cassava skins used for cattle fattening at the CCT feedlot in Dili. In the long run, when CCT has sufficiently expanded the cassava program area, demand for planting material will decline as farmers will retain their own planting material. Consequently, income from this source will decline accordingly.
Table 1 Registered Members of the COCAR Cassava Program, Results, 2011 - 2012
The table also shows a significant difference between districts in the number of farmers participating in the program. For example, Bobonaro had 353 farmers, Baucau 53 and Covalima only 12. However, income per farmer averaged only $3.48 in Bobonaro, $30.16 in Baucau, but over $4,000 in Covalima. In large measure, this was due to differences in area harvested. Farmers in Covalima with 1.5 ha of cassava reported sales of over $1,000 to CCT from dried cassava, stems, and skins. One farmer who had started growing 1.5 ha had increased his cassava area to 6 hectares for 2013 by purchasing additional land; this farmer reported sales to CCT of over $4,000 for 2012.
In 2011, an average 188 kg per farmer of dried cassava was sold to CCT; in 2012, the figure was 514 kg as an average across farmers. In contrast, farmers in Covalima (where the income per farmer was highest) the average production per farmer was 2.5 MT in 2011 and 16 MT in 2012. CCT also reports that farmers sell dried or fresh cassava in the local markets because the local market price for cassava is much higher than the price paid by CCT.
For example, when the team investigated the market price in Maliana market (Bobonaro district) fresh cassava sold at $1.00 for about 2 kg (50 cents a kilogram). This equates to a dried cassava
Cooperativa Café TimorRegistered Members of the USAID/COCAR Cassava Program – 11 Feb 13
Gaplek /1 Stems Skins Gaplek Stems Skins
(kg) (pcs) (kg) (kg) (pcs) (kg) 2011 2012 2011 2012
TOTAL 412 134 546 102,473 268,354 0 280,724 778,684 87,048 27,130 79,545 $49.69 $145.69
1/ Gaplek is dried cassava
2/ The totals given are from CCT accounts section. It is assumed that this is for the number of farmers actually harvesting cassava and selling it to CCT.
The data in the monitoring reports indicate the number of farmers participating in the cassava programme as follows: 2011, 874 farmers; 2012, 2,596 farmers.
3/ The calculated income divided by the number of farmers, assuming that the number of farmers selling to CCT was the same in both 2011 and 2012.
All locations:2011 & 2012 Price paid for cleaned and dried Cassava Chips (Gaplek) = 16¢/kg2011 & 2012 Price paid for “Sticks” (Batang/Stems) Cassava = 4¢/batang 2012 Price paid for peeled Cassava skins (Cattle fodder) = 4¢/kg
Lautem
Manufahi
Bobonaro
Covalima
Ermera
Source: CCT. Value of harvest and value per farmer is calculated from the data supplied by CCT.
0 0
0 96 0 0
$3.48
9,339 48,310 $778.27 $4,025.83
4,488 28,314 $35.06 $221.20
Notes:
Calculated from CCT
Data
Value per Farmer/3
935 1,598 $17.63 $30.16
3,392 1,227 $9.61
Men Women Total /2District
599 0 0
No. of Farmers
Calculated from CCT
Data
Value of Harvest USD
78 0
Not
Availabl
Not
Available
Not
Available0 0 0
83,634
CCT Demonstration Farm
(at Railaco)490 0 0 0 0 0
428,355 2,990
103 25 128 56 111,975 0 77,869 312,729
2,290 21,100 424
6 6 12 30,495 111,500 0 194,101
0 5,865 16,500 0
260 93 353 13,591 30,425 0
Harvest 2011 Harvest 2012
Yield Yield
Baucau 43 10 53 2,228 14,454

110 PERFORMANCE EVALUATION OF THE COCAR PROJECT
price of $1.50 a kilogram (at a ratio of 3 kg fresh weight to 1 kg dried weight). The team found the reported price of dried cassava in the Maliana market to be $6 - $7 for a full 35 kg rice sack, and $10 for a full 50 kg hessian sack. Estimating the dried cassava weight in these sacks at 10 kg and 15 kg respectively, yields a price in the local market of 60 – 67 cents per kg. Given this large difference in the local market price for dried cassava compared to the price paid by CCT (CCT price is 16 cents per kg), is an obvious incentive for farmers to sell cassava first in the local market and only to CCT for the volumes they cannot sell in the local market.
However, there is a limited demand for cassava in the local market, so in the long run as marketed volumes increase, CCT, as the only volume buyer of dried cassava will take a very high proportion of the crop.
There is also a possibility unregistered farmers are growing cassava and selling it through the CCT registered farmers; this would inflate the average income per farmer for an area with few farmers but relatively large areas of land planted in cassava. In Covalima and Manufahi there are significant areas of uncultivated land and farmers did report increasing the area cultivated now that they are able to request the use of the MAF tractors for cultivation (MAF provide tractors to cultivate farmers’ land; farmers only have to provide the fuel).
Gross Margins for Cassava Production
Table 2 shows gross margin per hectare and gross margin per labor day for several cassava production scenarios. These models exclude the costs of freight as CCT collects the cassava at the farm gate, or at pickup points in rural areas. The cassava stick for planting are assumed to be retained by farmers at no cost.
The team did not find any farmers who were growing cassava as a monocrop. Growing cassava as a monocrop is the CCT recommended practice; however, farmers grow maize with cassava as it better meets their foods security needs. Maize is the most important food crop for most farmers.
The team did not encounter any farmers achieving yields of 26 MT per hectare, which is the yield that CCT suggests can be achieved in Timor-Leste without the application of fertilizer. Farmers in Covalima (who tend to be the biggest producers of cassava, and plant the largest area of cassava per farmer) indicated that they achieved yields of 7.5 MT per hectare (2.5 MT of dried cassava) when growing cassava as a commercial crop interplanted with maize.
The gross margin models show that growing maize with cassava provides a higher gross margin per hectare than growing cassava as a monocrop and achieving a yield of 12 MT per hectare for cassava. However, the return per labor day is a little lower ($4.06 for the intercropping, compared to $4.34 for mono-cropping cassava at 12 MT/Ha). Growing cassava and achieving a yield of 26 MT per hectare gives a higher return per hectare and per labor day than either of the other models, but has disadvantages for farmers as they would produce less of their main food crop if growing cassava as a monocrop. If the application of fertilizer should be necessary to produce cassava at 26 MT per hectare, then the relative profitability advantage would be negated by the costs of fertilizer.
Traditional rotations include a maize crop followed by mung beans or peanuts, which are planted between the rows of maize prior to harvesting the maize (to extend the time the second crop has to grow during the rainy season). Indicative gross margin for this rotation is $1,080 per ha ($740 from maize and $340 for mung beans) and a return per labor day of $2.56. This is a lower return than the cassava options. However, the real attraction for farmers of growing a crop such as cassava is that CCT guarantee to buy the all the production, so farmers are provided a market and an income from their crop. This guaranteed market is the primary reason why farmers can commit to increasing the area of land they cultivate.

111 PERFORMANCE EVALUATION OF THE COCAR PROJECT
Table 2: Summary of Gross Margin and Return per Labor Day for Cassava
Production
FAO Stat Provides crop yields for cassava for other Asian countries. Figure 1 shows average yields per hectare for Indonesia (ranked 2 in the world for cassava production by total volume), Thailand (rank 3), Vietnam (rank 8), Cambodia (rank 13), and China (rank 15).
Figure 1: Cassava Yield in Other Asian Countries 2002 to 2011 (MT/Ha)
Source: FAO Stat
Indonesia has increased its average yield of cassava from 13 MT/Ha in 2002 to 20 MT in 2011, and this yield is achieved with the use of fertilizers. These are average yields for the country data and do not imply that higher yields cannot be achieved. In Timor-Leste, some farmers may achieve
USD $
Cassava
Interplanted with
Maize
1 Using MAF Tractors (fuel costs
only) 12 MT / Ha 26 MT / Ha
Cassava 7.5 MT;
Maize 1.3 MT
Gross Margin/Ha 894.85 1,579.92 1,174.05
Gross Margin/Labour Day 4.34 4.64 4.06
Other Scenarios:
2 MAF Tractor at full cost
Gross Margin/Ha 845.60 1,530.67 1,124.80
Gross Margin/Labour Day 4.10 4.49 3.89
3 Excluding sale of cassava sticks,
full tractor operating costs
Gross Margin/Ha 445.60 774.05
Gross Margin/Labour Day 2.16 2.67
Cassava as a Monocrop

112 PERFORMANCE EVALUATION OF THE COCAR PROJECT
higher yields, particularly if they apply fertilizer. However, the figures do caution about assuming 26 MT per hectare as a likely production average across all CCT farmers growing cassava without the use of fertilizer.
The availability of MAF tractors for land preparation provides a subsidy on cultivation costs and physically enables farmers to cultivate a larger area of land, which would be difficult without using tractors. The use of subsidized MAF tractors and only paying for fuel increases the gross margin per hectare and per labor day compared to using tractors at full commercial costs (Table 2).
A significant portion of current income for farmers is the sale of cassava stems to CCT for distribution to other farmers. This income stream will disappear once CCT has expanded the area of cassava to meet production and processing requirements, so a long-term analysis of cassava growing profitability must exclude this source of revenue from the model.
When the sale of cassava stems is excluded as a revenue source (and with no subsidy for tractor operation costs) then maize/cassava inter-cropping becomes more profitable, per hectare and per labor day, than cassava monocropping with a yield of 12 MT per hectare (Table 2). If cassava yields of 26 MT per hectare can be achieved without the application of fertilizer, then the cassava monocropping model remains the most profitable.
Harvesting and processing (peeling) of cassava is very labor intensive; 115 labor-days are required for harvesting, peeling and drying 12 MT of fresh cassava46. Therefore, if cassava production is to become established as a commercial crop in Timor-Leste, there is a need for the introduction of on-farm processing equipment to reduce labor requirements if local labor shortages exist.
Issues with Cassava as an Industrial Crop
In Asia, the industrial utilization of cassava in the form of alcohol and ethanol has been the main driver of the 80 percent expansion in the crop’s cultivation throughout the region in the past ten years. The demand for cassava from ethanol sectors, especially in Asia, will again emerge as the major driver of growth in world cassava utilization. Higher international prices for maize, compounded by considerable volatility, combine to boost the demand for cassava as a substitute for maize47.
Thai root producer prices for cassava in 2012 were $78/MT, and reached a high of almost $115/MT in 2011, but averaged $80/MT in 2011. Cassava chips to China (f.o.b. Bangkok) were $263/MT in 2011, and $235 in 2012/2. While cassava is a globally traded commodity (about 12% of global production was traded in 2012), it is a low value commodity.
A number of observations can be made from this study and from field observations.
a. Cassava depletes soil nutrients over time. Therefore, the ability of Timor-Leste to continue producing cassava without the application of imported fertilizer needs to be considered.
b. Timor-Leste roads are in a terrible state and the costs for rehabilitation in a mountainous terrain are high. The road from Suai (Covalima District) to Maliana was almost impassable to the team’s Land cruiser, and may be close to impassable in a 4 mt truck. Given that two of the six districts in which CCT has introduced cassava (Covalima and Manufahi) are also in some of the more remote locations from Timor-Leste’s only export port in Dili, the ability of the road network to continue to handle the cassava transportation requires further review. The team was informed that commercial freight costs for a 4 mt truck from Suai to Dili is $300 - $350 per truck which is $75 per mt, or 47% of the price paid to farmers of $160 per
46 Based on field interviews and on FAO published data for 1999. Based on field interviews and on FAO published data for 1999 (M. Bokanga, Cassava: Post-harvest Operations, International Institute of Tropical Agriculture, Nigeria, October 1999. http://www.cgiar.org/iita/) 47 FAO Food Outlook, Global Market Analysis, November 2012

113 PERFORMANCE EVALUATION OF THE COCAR PROJECT
tonne. Even if CCT can reduce this cost to half the commercial rate by using its own trucks (mainly used to transport coffee at a different time of the year) this is still a significant proportion of the per mt value at the farm gate.
c. Because harvesting, drying, and processing cassava is such a labor-intensive job, on-farm processing options for cassava need to be investigated. The high labor input reduces the attractiveness for farmers to produce cassava and constrains the additional return per labor day from increasing yields of cassava.
d. If cassava is to be promoted as a direct food security crop, the food quality varieties of cassava should be promoted rather than the industrial varieties which contain higher starch levels. CCT is not interested in promoting cassava as a food crop and so food security benefits from growing cassava, is indirect, as a source of income which may be used to buy food. If a farmer has only 0.25 ha in cassava, then at a yield of 26 MT per hectare (if this is indeed achievable) will be 2.17 MT of dried cassava with a value at farm gate of $347. At a yield of 12 MT per hectare, this equates to 1 MT of dried cassava with a farm gate value of $160.
Figure 2 The Main Highway from Suai to Maliana

114 PERFORMANCE EVALUATION OF THE COCAR PROJECT
ANNEX 9: FOCUS GROUP QUESTIONNAIRE

115 PERFORMANCE EVALUATION OF THE COCAR PROJECT
Jan 17, 2013
FOCUS GROUP QUESTIONS
District____________ Suco____________ Aldea____________
CCT Group name___________ Date __/__/__
Initials of International staff_____ Initials of Interpreter_____
CCT Activity (from travel schedule): ___________________________
Name of CCT Extension Officer if present ___________________
[Allow the CCT Extension Officer to complete the list of farmers]
List of focus group participants:
Name Position with CCT (if any)
1.
2.
3.
4.
5.
6.
7.
8.
9.
10.
11.
12.

116 PERFORMANCE EVALUATION OF THE COCAR PROJECT
Focus Group Questions (Revised 13/1/2013)
If CCT Extension Officer present, ask him/her to welcome participants
International Staff (Translated by Interpreter): Explain who we are and the purpose of the discussion: a. Team from donor (USAID) to look at the CCT project progress in villages b. To learn what went well, and what not so well; to ensure success of activities in the future c. Mainly interested in results from October 2010 d. Also interested in lessons from before 2010, for villages working with CCT in earlier times e. We are NOT from CCT, please feel free to say anything you wish so that future work will be as effective as possible
Interpreter to ask questions, then to explain farmers’ responses to international
International to intervene with clarifications and additional questions when appropriate Start Time: _______
General:
1. When did you/village begin working with CCT?
2. Please explain briefly what crop or livestock activities you/village have been working on with CCT ‐ Since Oct 2010
‐ Since you started working with CCT (if working with CCT before October 2010)

117 PERFORMANCE EVALUATION OF THE COCAR PROJECT
3. Are there any other projects working in this community, in addition to CCT?
Name of Project Main activities Start & end date of these
projects
Work with CCT HHs
(Y/N)
1.
2.
3.
4.
‐ Do these activities earn more, less or about the same profit as the CCT activities?
Incomes: 4. What is the main source of income in this village? 5. Since October 2010, have your incomes improved as a result of what CCT has been doing with you?
‐ If yes, please explain what or how your incomes have improved as a result of CCT activities
‐ If no, please explain why incomes have not improved

118 PERFORMANCE EVALUATION OF THE COCAR PROJECT
6. How important is money transferred to families in this village by other family members working somewhere else in Timor-Leste?
7. Since October 2010, have HHs in this community been able to make purchases of significant assets as a result of CCT activities? For example, new farm equipment, or community assets. If yes, what are they?
What about before October 2010? (if the village was working with CCT during earlier times)
What assets?
And was this a result of the earlier CCT activities?
8. Thinking about the future, say in another 3 years, do you think your incomes will continue to improve as a result of CCT activities since October 2010 (even if they may not have already improved)?
Credit
9. Do you currently have access to any credit facilities from CCT?
‐ If yes, what is the credit for, what are the terms, and do you have to provide any security to obtain this credit? Probe to determine if this is in the form of trade credits to be paid back when the crop is sold to CCT?

119 PERFORMANCE EVALUATION OF THE COCAR PROJECT
10. About how much money are you able to borrow?
11. Are there any other organizations from which can you obtain credit?
‐ If yes, who are the other providers of this credit?
‐ For what purposes are these loans?
‐ What are the terms? (e.g. interest, time to repay loans)
12. Do you have to provide any security to borrow money from these other organizations?
Training: 13. Please explain what trainings you have received as a result of the CCT activities, since October 2010.
14. Were these trainings carried out only by CCT staff, or were other organizations also involved in the trainings (such as MAF)?
15. What did you most benefit from during these trainings with CCT since October 2010?

120 PERFORMANCE EVALUATION OF THE COCAR PROJECT
‐ If the HH/village has worked with CCT before October 2010: is the training program since Oct 2010 different than earlier? If yes, probe for differences.
In what areas do you need more training in CCT activities?
16. Was the farm work that women undertake covered by the trainings?
17. Were demonstration plots used during these trainings?
18. Were both individual one-on-one trainings and group trainings carried out?
19. How could the trainings be made better, or improved?

121 PERFORMANCE EVALUATION OF THE COCAR PROJECT
Food Security 20. What are the three most important food crops grown in this village?
21. Since you first started working with CCT, do you feel more or less sure of your food supply throughout the year?
-If yes, why, is it due to the CCT activities, or for some other reason?
22. What traditional methods would you use to store rice, maize and other crops used as family food supply after harvest?
23. Do you have access to any of the following methods for storage of rice and maize:
‐ Metal drums ‐ Metal silos ‐ Grain Pro bags /1 ‐ Plastic drums or plastic containers 1/ Grain Pro bags are special plastic bags, impervious to oxygen, which ensures that insects (weevils) in the grains cannot survive; usually distributed by donor programs.
Food Crop List Tick up to 3 Which is the
most important?
Rice
Maize
Cassava
Taro
Sweet Potato
Irish Potato
Other 1
Other 2

122 PERFORMANCE EVALUATION OF THE COCAR PROJECT
And if you do have access to these, about what percentage of households would have access to these storage methods?
24. What other methods, not being used now, would you suggest for improving the availability of food, and your access to food?
Health
25. Who is the main health care provider to this community? a. CCT, b. MoH, c. Other______
26. Since October 2010, has the community access to health services changed at all? If yes, how have services changed? a. The health service is now closer b. The treatment is better c. There are more treatment services available d. We have better health education e. Other________ And, is this the result of CCT’s health program or someone else’s health program? 27. Is there a fixed clinic within this suco? ‐ If yes, who runs this clinic? __________________
‐ If no, is there a mobile clinic that visits the suco, ad how often does it visit?
‐ Who provides this service?

123 PERFORMANCE EVALUATION OF THE COCAR PROJECT
Relations with CCT 28. How satisfied are you with CCT as an organization to work with?
‐ Why do you sell to CCT? How is it different from other companies who buy your products?
29. What benefits do you get from being a CCT member?
30. To which CCT Membership Group do you belong? ____________ 31. Who is your representative to CCT? _______________________ 32. How was this person selected___________________ 33. Did you have a meeting to select your representative Yes / No 34a. Do you have a CCT membership card? Yes / No
Show example to clarify the question.
34 b. If CCT activity is either coffee or cassava, ask: Do you sell your products to traders other than CCT. Yes / No
If yes - to whom do you sell and ask why they sell to these traders?
End Time: _______
Duration of meeting ________

124 PERFORMANCE EVALUATION OF THE COCAR PROJECT
Additional Questions for Women Only Groups
34. Who physically keeps the money in the household? 35. Who makes final decisions how money is spent in the household? 36. Who contributes to decisions on how money is spent in the household?
37. Is the person who is targeted by CCT trainings, activities, etc, the one who does the actual work on the farm? For example, is your husband trained for work that you usually do? Or are you always trained for the work that you do? 38. Have CCT activities resulted in any changes in work responsibilities between you and your husband either on the farm or in the household? If yes, What are the changes?
End Time: _______
Duration of this set of questions ________

125 PERFORMANCE EVALUATION OF THE COCAR PROJECT
ANNEX 10: HOUSEHOLD SURVEY QUESTIONNAIRE (ENGLISH)

126 PERFORMANCE EVALUATION OF THE COCAR PROJECT
January 17, 2013
Individual Survey Questions
A. Location
1. District: __________ 2. Sub District __________
3. Suco: __________ 4. Aldea: __________
5. Survey form No.__________ 6. Interview date: __________
(Unique number) (dd/mm/YY)
7. Name of Interviewer: _______________________
8. Household Details:
8.0 Head of household (HH) (M) Male (F) Female? ____
8.1 If the HH head is female, what happened to the male head? _____
(a) HH traditionally headed by female (b) Died (c) Divorced (d) Other: specify __________
8.2 Education of the HH head: _____
(a) Primary school (b) Junior High school (c) Senior High school
(d) Undergraduate degree (e) None (f) Others specify: _______
8.3 What is the age of the HH head? (Tick one box)
Less than 18 18 - 30 31-45 Over 45
9. Name of person answering questions? ___________________
10. Is this person the head of the household? ____ (Y / N) If Yes, go to Q. 12
11. Name of household head? ____________________
a. Principal occupation? _____________________
12. Number of people who normally live and eat in this household: ____ No.
13. Composition of HH:
Male Female
Adults over 18 years old
Youth 5 – 17 years
Children under 5 years
Sub-Totals:

127 PERFORMANCE EVALUATION OF THE COCAR PROJECT
Total Persons:
Note: Check total of people eating in this HH is the same as above
B. Working with CCT
1. Do you currently work with CCT’s project, which started in 2010? Yes / No If yes, for what activity(s) ___________________________________________________ 2. Did you work with CCT before 2010? Yes / No If yes, What year did you start working with CCT? ______
3. What membership Group do you belong to? ____________________________ 4. Who is your Membership Group representative? _________________________ 5. How was he/she selected: Tick One Only
Vote Appointed Other:_________________________
C. Training by CCT
1. Did you receive any training from CCT? Yes / No If yes, which of the following trainings did you receive? Tick
(One or both)
Group training One on One training
1.1 And how satisfied, overall, were you with these trainings?
Tick one box for the relevant trainings
Group training One on
One training
a. Very satisfied b. satisfied c. Neither satisfied nor dissatisfied d. Dissatisfied e. Very dissatisfied
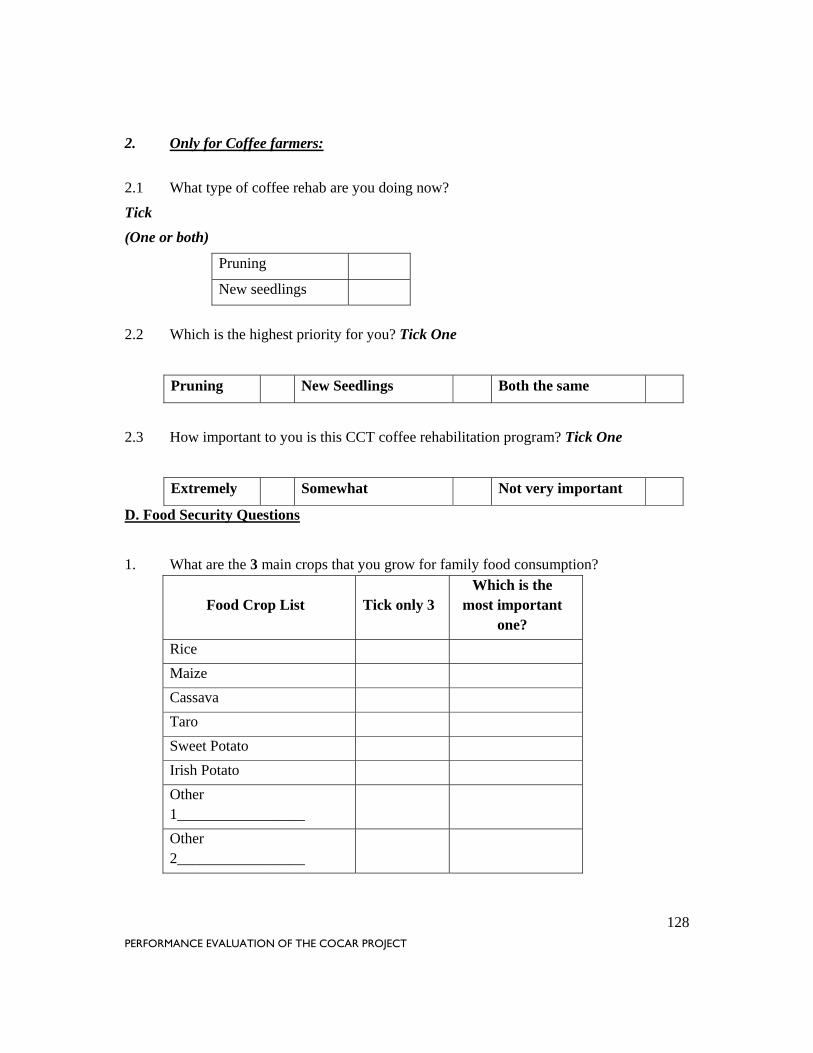
128 PERFORMANCE EVALUATION OF THE COCAR PROJECT
2. Only for Coffee farmers:
2.1 What type of coffee rehab are you doing now?
Tick
(One or both)
Pruning
New seedlings
2.2 Which is the highest priority for you? Tick One
Pruning New Seedlings Both the same
2.3 How important to you is this CCT coffee rehabilitation program? Tick One
Extremely Somewhat Not very important
D. Food Security Questions
1. What are the 3 main crops that you grow for family food consumption?
Food Crop List Tick only 3 Which is the
most important one?
Rice
Maize
Cassava
Taro
Sweet Potato
Irish Potato
Other 1_________________
Other 2_________________

129 PERFORMANCE EVALUATION OF THE COCAR PROJECT
2. In the past 12 months, were there any months in which you did not produce from your own land enough food to feed your family? >> If yes, how many months? Number of months = ______
>> If no (there was enough food produced on the farm), go to Q 3
Note: Check number of months is same as in above response.
What actions did you take to deal with not having enough rice or maize (In those months, above, when food was in short supply)?
Tick
Rank order (for
ticked boxes)
Rank only if more than one strategy
1 Ate less food
2 Switched from rice / maize to other staple food
Most important = Rank 1
3 Ate more meat and vegetables
4 Received aid assistance from NGOs or other people : Check 2 c.
5 Purchased rice or maize: also go to 2 b.
7 Other(_________________________)
2 (b) If PURCHASED rice or maize……
Y/N
1 Did you sell LIVESTOCK to purchase rice or maize?
2 Did you BORROW money to purchase rice or maize?
Which months were these? (Tick relevant months)
Jan Feb Mar Apr
May
Jun Jul Aug Sep Oct Nov
Dec

130 PERFORMANCE EVALUATION OF THE COCAR PROJECT
3 Did you buy from OWN CASH / SAVINGS?
And, how many bags of rice or maize did you buy, and from what source?
A. Rice purchased No. of bags
Total Kilograms1
a. From MTCI through Suco Chief (Subsidized)
b. From MTCI through Private Trader (Subsidized)
c. Other rice sources:(____________________________)
B. Maize purchased
1/ Calculate Kg from number of bags by weight of bags (need to find out the weight of the bags,
MTCI bags can have different weights) 2 (c) If Received aid assistance from NGOs or other people… How many bags were you given?
No. of bags Total Kilograms /1
Rice received Maize received Other (if any)
1/ Calculate Kg from number of bags by weight of bags (need to find out the weight of the bags)
3. Do you have any of the following to store staple foods?
Tick all that apply Silos
200 L drums
Grain Pro bags / 1
Other…
1/ Grain Pro bags are special plastic bags, impervious to oxygen, which ensures that insects (weevils) in the grains cannot survive; usually distributed by donor programs.
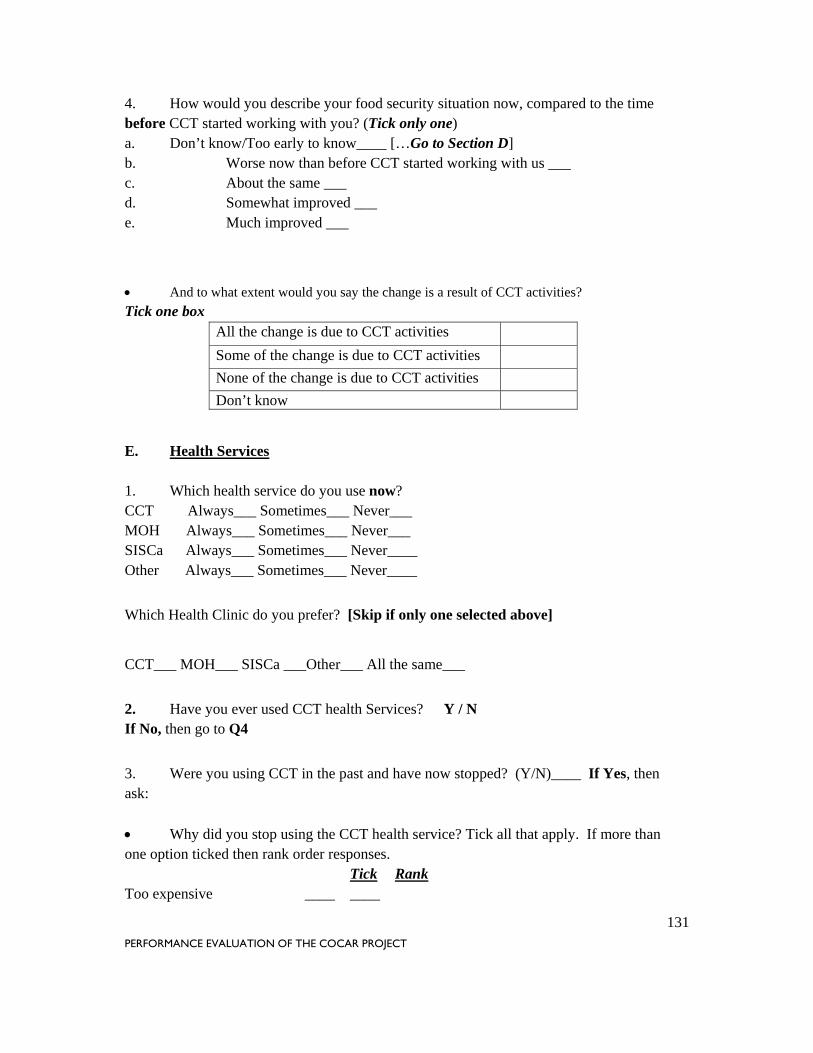
131 PERFORMANCE EVALUATION OF THE COCAR PROJECT
4. How would you describe your food security situation now, compared to the time before CCT started working with you? (Tick only one) a. Don’t know/Too early to know____ […Go to Section D] b. Worse now than before CCT started working with us ___ c. About the same ___ d. Somewhat improved ___ e. Much improved ___
And to what extent would you say the change is a result of CCT activities?
Tick one box All the change is due to CCT activities
Some of the change is due to CCT activities
None of the change is due to CCT activities
Don’t know
E. Health Services 1. Which health service do you use now? CCT Always___ Sometimes___ Never___ MOH Always___ Sometimes___ Never___ SISCa Always___ Sometimes___ Never____ Other Always___ Sometimes___ Never____
Which Health Clinic do you prefer? [Skip if only one selected above]
CCT___ MOH___ SISCa ___Other___ All the same___
2. Have you ever used CCT health Services? Y / N If No, then go to Q4
3. Were you using CCT in the past and have now stopped? (Y/N)____ If Yes, then ask:
Why did you stop using the CCT health service? Tick all that apply. If more than one option ticked then rank order responses. Tick Rank Too expensive ____ ____

132 PERFORMANCE EVALUATION OF THE COCAR PROJECT
Poor quality care ____ ____ Inconvenient location ____ ____ Poor quality medicines ____ ____ Other__________ ____ ____ 4. Have you, or your family, received a visit from a CCT Health Visit Team in the last 12 months? Yes / No If yes, how many visits in the last 12 months? _____
F. Assets
1. Which of the following does your household have?
Tick
1 Radio
2 Mobile phone/ Cell phone
3 Electricity from main supply
4 Solar panel
5 Cooking stove (gas or electric) - NOT a traditional fireplace
6 Television set
7 Pit toilet (not mechanical)
8 Water toilet with drainage (includes mechanical)
9 Refrigerator
10 Bicycle
11 Motor bike
12 Motor vehicle (car, pickup, bus, truck)
13 Boat or canoe
14 Engine for boat
14 None of the above

133 PERFORMANCE EVALUATION OF THE COCAR PROJECT
2. Do you own any of the following animals, if so how many?
Tick if owned
Number owned
Pigs
Sheep
Goats
Cattle
Buffalo
Horses
Chickens
3. Do you own any of the following equipment?
Item Tick if owned
Buffalo
Large tractor
Hand tractor
Rice thresher
Rice mill
Rice weeder
Backpack sprayer
Maize sheller
Coffee pulper
Tractor mounted plough or harrow
Animal plough or harrow
“Timor Kijang”

134 PERFORMANCE EVALUATION OF THE COCAR PROJECT
G. Additional Income Priorities
If you had an opportunity to earn additional cash income, how would you spend it?
[DO NOT PROMPT: Note only one response and then categorize]
1. School fees for children
2. Own education
5. House improvement
6. Invest on the farm
7. Savings
8. Invest in non-farm business (incl. Truck purchase)
9. Spend on basic needs
10. Spend on new non-farm assets (e.g. Bicycle, Motor transport, Radio)
11. Celebrations
12. Other (……………………………………)

135 PERFORMANCE EVALUATION OF THE COCAR PROJECT
ANNEX 11: HOUSEHOLD SURVEY QUESTIONNAIRE (TETUM)
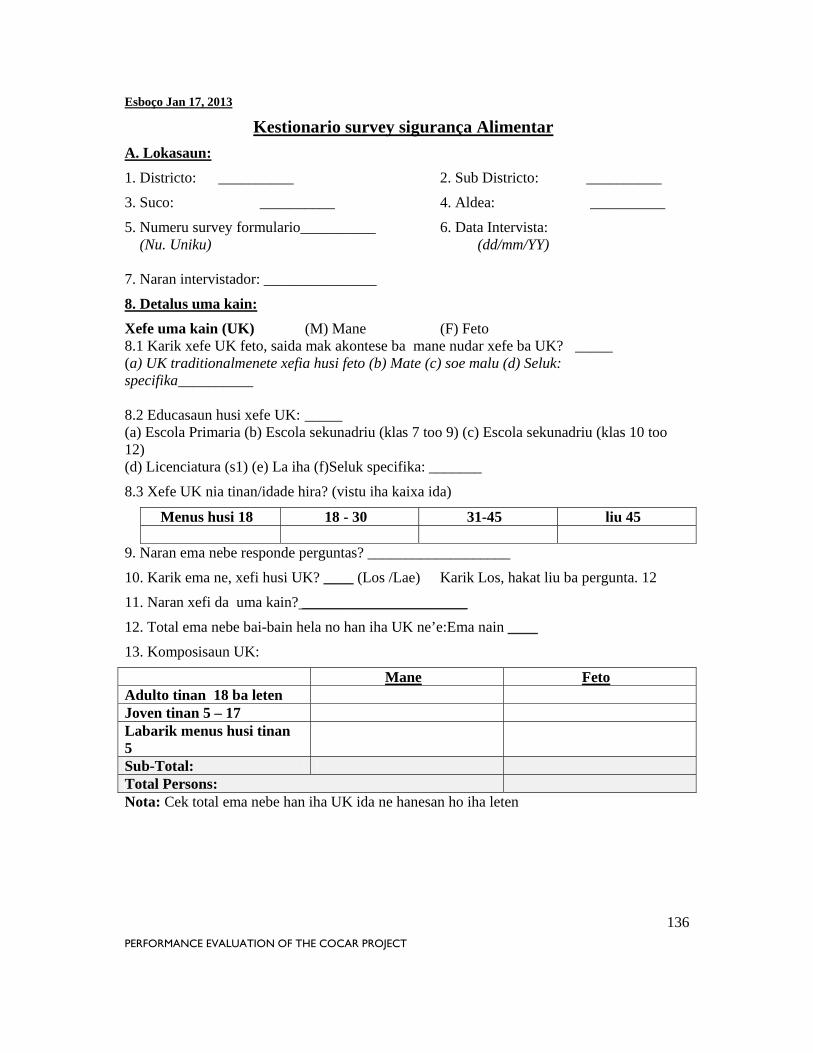
136 PERFORMANCE EVALUATION OF THE COCAR PROJECT
Esboço Jan 17, 2013
Kestionario survey sigurança Alimentar
A. Lokasaun:
1. Districto: __________ 2. Sub Districto: __________
3. Suco: __________ 4. Aldea: __________
5. Numeru survey formulario__________ 6. Data Intervista: (Nu. Uniku) (dd/mm/YY) 7. Naran intervistador: _______________
8. Detalus uma kain:
Xefe uma kain (UK) (M) Mane (F) Feto 8.1 Karik xefe UK feto, saida mak akontese ba mane nudar xefe ba UK? _____ (a) UK traditionalmenete xefia husi feto (b) Mate (c) soe malu (d) Seluk: specifika__________ 8.2 Educasaun husi xefe UK: _____ (a) Escola Primaria (b) Escola sekunadriu (klas 7 too 9) (c) Escola sekunadriu (klas 10 too 12) (d) Licenciatura (s1) (e) La iha (f)Seluk specifika: _______
8.3 Xefe UK nia tinan/idade hira? (vistu iha kaixa ida)
Menus husi 18 18 - 30 31-45 liu 45
9. Naran ema nebe responde perguntas? ___________________
10. Karik ema ne, xefi husi UK? ____ (Los /Lae) Karik Los, hakat liu ba pergunta. 12
11. Naran xefi da uma kain? ______________________
12. Total ema nebe bai-bain hela no han iha UK ne’e:Ema nain ____
13. Komposisaun UK:
Mane Feto Adulto tinan 18 ba leten Joven tinan 5 – 17 Labarik menus husi tinan 5
Sub-Total: Total Persons: Nota: Cek total ema nebe han iha UK ida ne hanesan ho iha leten

137 PERFORMANCE EVALUATION OF THE COCAR PROJECT
B. Servisu ho CCT
1. Daudaun ne’e ita boot servisu hamutuk ho CCT nia projetu komesa/hahu iha 2010? Los/Lae
Karik los, servisu konaba atividade saida?______________________________________
2. Ita boot servisu ona ho CCT antes prejetu ne’e hahu iha 2010 ka lae? Los / Lae
Karik los, sa tinan mak ita boot komesa servisu ho CCT?____________
3. Ita boot tama/partisipa iha grupu ida ne’ebe?____________________________________
4. Se mak ita boot nia grupu nia representante? (Se mak representante ba ita boot nia grupu?)_______________________________________________
5. Oinsa ita boot sira hili ita boot sira nia grupo nia representante/kordenador? Vistu/hili ida deit
Votasaun Hatudu deit
Seluk:_________________________
C. Treinamentu husi CCT
3. Ita boot hetan/simu treinamentu ruma husi CCT? Los / Lae Karik los, treinamentu ida ne’ebe husi treinamentu tuir mai ne’e mak ita boot simu? Tick (One or both)
Treinamentu hamutuk ho grupo Treinamentu ida ho ida / mesak deit
1.1 No oinsa ita boot nia nivel satisfeitu ba treinamentu sira ne’e en geral?
Vistu kaixa ida ba treinamentu sira ne’ebe relevante
Treinamentu hamutuk ho Grupo
Treinamentu ida ho ida
f. Satisfeitu Liu g. Satisfeitu h. Naton deit i. La satisfeitu j. Las satisfeitu Liu

138 PERFORMANCE EVALUATION OF THE COCAR PROJECT
4. Ba Agrikultor Kafe nian deit: 2.1 Tipu kafe nia rehabilitasaun ida ne’ebe mak ita boot uza/halo daudaun hela? Tick (One or both)
Aparu/hamos nia sanak
Kuda foun 2.2 Ida ne’ebe mak preoridade liu ba ita boot? Vistu Ida
Aparu Kuda foun Rua hanesan deit
2.3 Ba ita boot, programa rehabilitasaun ba kafe husi CCT ne’e nia importansia oinsa? Vistu Ida
Importante tebes
Importante/naton La importante liu
D. Perguntas seguranca alimentar
5. Ai-hahan prinsipal 3 ne’ebe mak ita boot kuda atu sustenta ai-hahan ba ita boot nia familia? Lista Ai-hahan nian Vistu (hili 3 deit) Ida ne’ebe mak importante
liu? Hare Batar Ai-farina Talas Fehuk Fehuk Europa/fehukroupa Seluk 1________________ Seluk 2________________

139 PERFORMANCE EVALUATION OF THE COCAR PROJECT
6. Iha fulan 12 pasadu, karik iha fulan ruma/balun nebe imi la produs hare ou batar suficiente husi imi nia rai atu fo han imi nia familia?
>> Karik Los, fulan hira? Total fulan = ______ >> Karik Lae (iha produsaun hare no batar nebe sufisiente iha toós),hakat ba pergunta 3
Nota: Check numeru fulan hanesan ho resposta iha leten ka lae?
Asaun saida deit mak imi halo atu resolve hare no batar nebe la sufisiente? (ihafula/tempu sira ne’ebe temi ona iha letenwainhira ai-hahan menus)?
Vistu estrategia
ordem de clasifiksaun (ba
sira nebe tau vistu)
Tau ordem karik estrategia liu husi 1
1 Han hahan menus/uitoan 2 Troka aihan husi etu/batar ba aihan
seluk (exemplo: Aifarina, talas, kontas?)
Importante liu= tau ordem 1
3 Han naan no modo barak liu 4 Simu ajuda husi ONG ou husi ema
seluk: Check 2 c.
5 Sosan fos ou batar: hakat ba iha 2 b. 7 Seluk(_________________________
_)
2 (b) Karik SOSA fos ou hare...................
Los/Lae
1 Karik imi faan animal atu sosa fos no batar? 2 Karik imi impresta osan atu sosa fos ou batar? 3 Karik sosa husi osan rasik ou poupansa?
No, ita boot sosa fos ou batar hamutuk karon hira no husi fontes ida ne’ebe?
C. Fos ne’ebe Sosa Nu.
Karon
Total Kilograma
/1
d. Husi MTCI liu husi Xefe Suco (fos subsidio)
e. Husi MTCI liu husi Vendedor/ema fila liman sira (fos subsidio)
Fulan saida deit? (Tau vistu iha fulan nebe relevante) Jan Feb Mar Ab
r Maio
Jun Jul Aug Set Out
Nov
Des
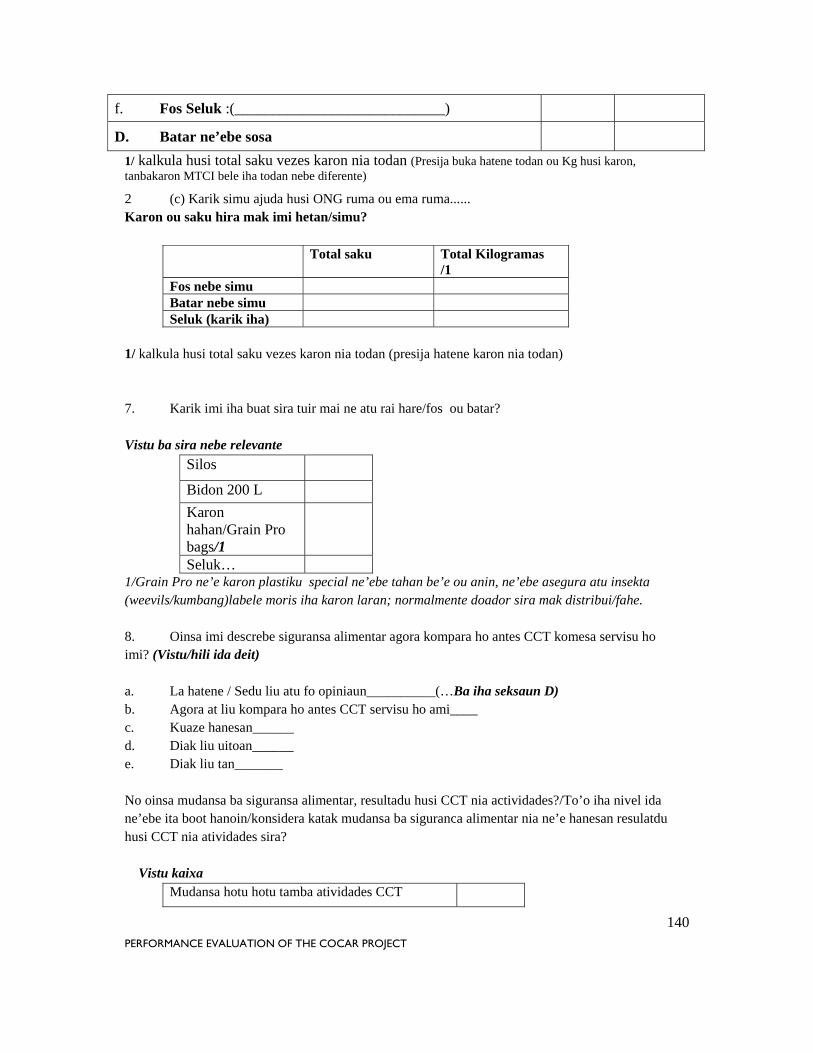
140 PERFORMANCE EVALUATION OF THE COCAR PROJECT
f. Fos Seluk :(____________________________)
D. Batar ne’ebe sosa
1/ kalkula husi total saku vezes karon nia todan (Presija buka hatene todan ou Kg husi karon, tanbakaron MTCI bele iha todan nebe diferente)
2 (c) Karik simu ajuda husi ONG ruma ou ema ruma...... Karon ou saku hira mak imi hetan/simu?
Total saku Total Kilogramas /1
Fos nebe simu Batar nebe simu Seluk (karik iha)
1/ kalkula husi total saku vezes karon nia todan (presija hatene karon nia todan) 7. Karik imi iha buat sira tuir mai ne atu rai hare/fos ou batar? Vistu ba sira nebe relevante
Silos
Bidon 200 L
Karon hahan/Grain Pro bags/1
Seluk… 1/Grain Pro ne’e karon plastiku special ne’ebe tahan be’e ou anin, ne’ebe asegura atu insekta (weevils/kumbang)labele moris iha karon laran; normalmente doador sira mak distribui/fahe. 8. Oinsa imi descrebe siguransa alimentar agora kompara ho antes CCT komesa servisu ho imi? (Vistu/hili ida deit) a. La hatene / Sedu liu atu fo opiniaun__________(…Ba iha seksaun D) b. Agora at liu kompara ho antes CCT servisu ho ami____ c. Kuaze hanesan______ d. Diak liu uitoan______ e. Diak liu tan_______ No oinsa mudansa ba siguransa alimentar, resultadu husi CCT nia actividades?/To’o iha nivel ida ne’ebe ita boot hanoin/konsidera katak mudansa ba siguranca alimentar nia ne’e hanesan resulatdu husi CCT nia atividades sira? Vistu kaixa
Mudansa hotu hotu tamba atividades CCT
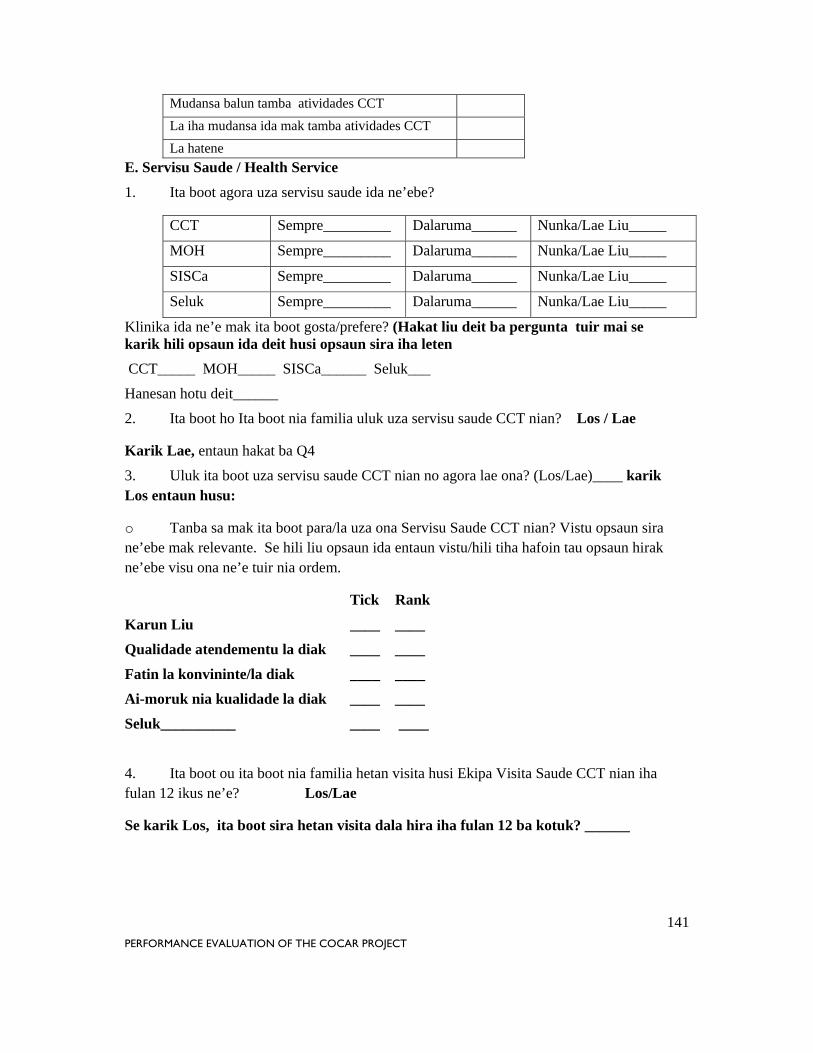
141 PERFORMANCE EVALUATION OF THE COCAR PROJECT
Mudansa balun tamba atividades CCT
La iha mudansa ida mak tamba atividades CCT
La hatene
E. Servisu Saude / Health Service
1. Ita boot agora uza servisu saude ida ne’ebe?
CCT Sempre_________ Dalaruma______ Nunka/Lae Liu_____
MOH Sempre_________ Dalaruma______ Nunka/Lae Liu_____
SISCa Sempre_________ Dalaruma______ Nunka/Lae Liu_____
Seluk Sempre_________ Dalaruma______ Nunka/Lae Liu_____
Klinika ida ne’e mak ita boot gosta/prefere? (Hakat liu deit ba pergunta tuir mai se karik hili opsaun ida deit husi opsaun sira iha leten
CCT_____ MOH_____ SISCa______ Seluk___
Hanesan hotu deit______
2. Ita boot ho Ita boot nia familia uluk uza servisu saude CCT nian? Los / Lae
Karik Lae, entaun hakat ba Q4
3. Uluk ita boot uza servisu saude CCT nian no agora lae ona? (Los/Lae)____ karik Los entaun husu:
o Tanba sa mak ita boot para/la uza ona Servisu Saude CCT nian? Vistu opsaun sira ne’ebe mak relevante. Se hili liu opsaun ida entaun vistu/hili tiha hafoin tau opsaun hirak ne’ebe visu ona ne’e tuir nia ordem.
Tick Rank
Karun Liu ____ ____
Qualidade atendementu la diak ____ ____
Fatin la konvininte/la diak ____ ____
Ai-moruk nia kualidade la diak ____ ____
Seluk__________ ____ ____
4. Ita boot ou ita boot nia familia hetan visita husi Ekipa Visita Saude CCT nian iha fulan 12 ikus ne’e? Los/Lae
Se karik Los, ita boot sira hetan visita dala hira iha fulan 12 ba kotuk? ______
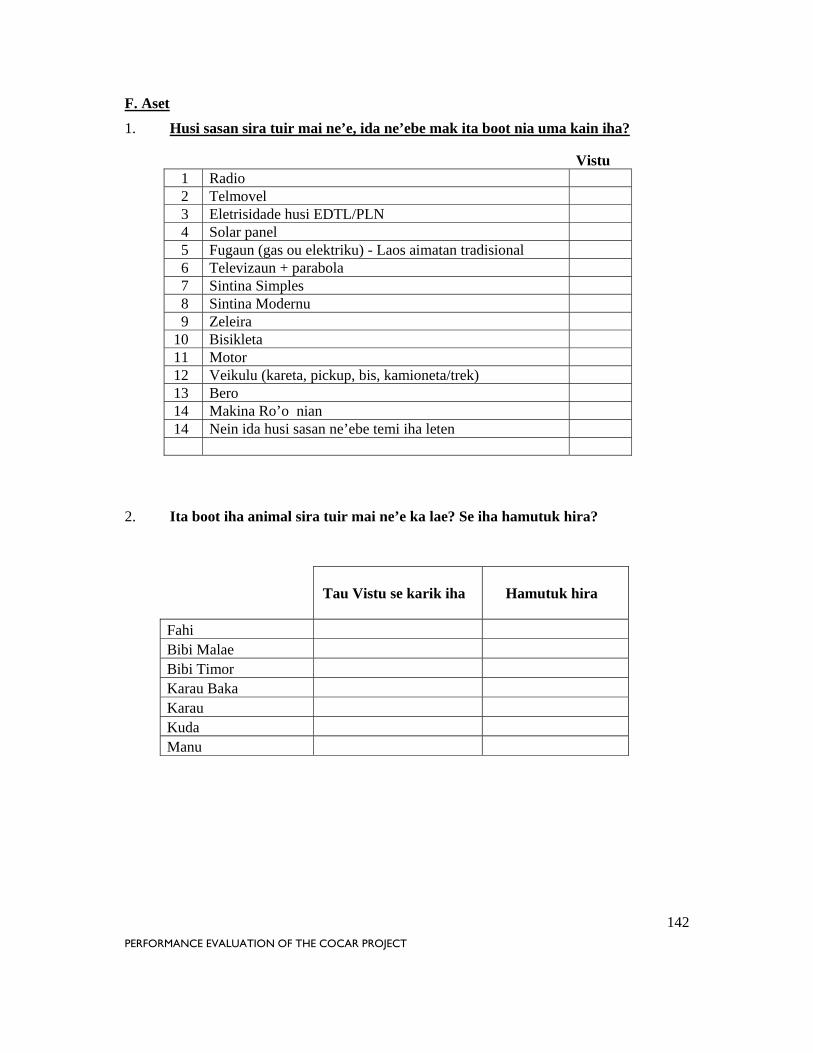
142 PERFORMANCE EVALUATION OF THE COCAR PROJECT
F. Aset
1. Husi sasan sira tuir mai ne’e, ida ne’ebe mak ita boot nia uma kain iha?
Vistu 1 Radio 2 Telmovel 3 Eletrisidade husi EDTL/PLN 4 Solar panel 5 Fugaun (gas ou elektriku) - Laos aimatan tradisional 6 Televizaun + parabola 7 Sintina Simples 8 Sintina Modernu 9 Zeleira
10 Bisikleta 11 Motor 12 Veikulu (kareta, pickup, bis, kamioneta/trek) 13 Bero 14 Makina Ro’o nian 14 Nein ida husi sasan ne’ebe temi iha leten
2. Ita boot iha animal sira tuir mai ne’e ka lae? Se iha hamutuk hira?
Tau Vistu se karik iha Hamutuk hira
Fahi Bibi Malae Bibi Timor Karau Baka Karau Kuda Manu

143 PERFORMANCE EVALUATION OF THE COCAR PROJECT
3. Ita boot iha ekipamentu sira tuir mai ne’e ka lae? G. Prioridade Rendementu Adisional Se ita boot iha opportunidade atu hetan tan osan balu/extra, ita boot sei uza osan ne’e oinsa ou ita boot sei halo said aba osan ne’e? [Labele fo hanoin ou bayangan: hakere deit responde ida no depois kategoriza] 1. Selu Labarik (sira) nia eskola 2. Selu Ita boot nia edukasaun/eskola rasik 3. Hadi’a uman 4. Investe iha Agricultura 5. Poupansa 6. Investe iha business ne’ebe la iha resadaun ho agrikultura (Inklui sosa kamioneta/trek)
7. Gasta ba nesesidade baziku sira 8. Investe iha asset/ sasan foun ne’ebe laiha relasaun ho agrikultura (ezemplu Bisikleta, Motor, Radio)
9. Selebrasaun sira (hanesan festa, Lia mate no lia moris) 10. Seluk (……………………………………)
Item Tau Vistu Se
Karik iha
Karau Trator boot Tartor liman Rice thresher / Makina koileta Hare / mesin perontok padi Makina dulas hare Rice weeder/Penyinaggan Padi Ransel rega be / backpack sprayer Maize sheller / Pemipil Jagung Coffee pulper / Ta’isdor kafe Trator fila rai nian Animal fila rai nian Karosa roda rua ou tolu