performance evaluation of the iot repository
TRANSCRIPT
PERFORMANCE EVALUATION OF THE IOT REPOSITORY
BUCKET, OVER MULTIPLE AMAZON WEB SERVICES’ VM
OFFERS
DAVID CUESTA REDONDO
Director:
Felipe Díaz Sánchez, Ph.D.
UNIVERSIDAD SANTO TOMÁS
FACULTAD DE INGENIERIA DE TELECOMUNICACIONES
BOGOTÁ, 2017

TABLE OF CONTENTS
1 PROJECT OVERVIEW 9
1.1 Objectives 9
1.2 Extent 9
1.3 Methodology 10
2 STATE OF THE ART 11
2.1. Load Tests 12
2.2. Performance tests 19
2.3. Stress tests 21
3 PERFORMANCE TESTING PROCEDURE 26
3.1 Bucket Deployment 26
3.2 JMeter configuration. 27
3.3 Test Procedure 28
3.4 Generation of results 29
4 EXPERIMENTS AND RESULTS 30
4.1 Testbed scenario 30
4.3 Results and analysis 33
4.3.1 GET request evaluation 33
4.3.2 POST request evaluation 38
5 CONCLUSIONS 44
Annex A. Manual of jmeter 46
Annex b. Manual of aws 63

6 REFERENCES 73
TABLE OF FIGURES
Figure 1. Articles found by year ........................................................................................ 11
Figure 2. Articles distributed by topic ............................................................................... 12
Figure 3. Process of load testing ...................................................................................... 14
Figure 4. Implementation Diagram ................................................................................... 17
Figure 5. Architecture of work .......................................................................................... 18
Figure 6. Architecture of project ...................................................................................... 30
Figure 7. Results graph GET Errors. ................................................................................ 34
Figure 8. Results graph GET Latency .............................................................................. 35
Figure 9. Results graph GET CPU use ............................................................................ 36
Figure 10. Results graph GET Memory use ..................................................................... 37
Figure 11.Results graph POST Errors .............................................................................. 39
Figure 12. Results graph POST Latency .......................................................................... 40
Figure 13. esults graph POST CPU use ........................................................................... 41
Figure 14. Results graph POST Memory use .................................................................. 42
TABLE OF TABLES
Table 1 Table of methodology .......................................................................................... 10
Table 2. Segurity group inbound rules. ............................................................................. 31
Table 3. Virtual machines of Amazon ............................................................................... 31
Table 4. Table of coefficients of variation of the indicators in POST requests. ................. 38
Table 5. Table of coefficients of variation of the indicators in GET requests.............. ¡Error!
Marcador no definido.
TABLE OF FIGURES OF ANNEX A.
Figure A 1. Page to download Jmeter .............................................................................. 46
Figure A 2. Page to download the plugin. ......................................................................... 47
Figure A 3. Activation of plugin in Jmeter ......................................................................... 47
Figure A 4. Selection of plugin. ........................................................................................ 48
Figure A 5. Pluggin ready to use ...................................................................................... 49
Figure A 6. Adding Thread Group for the test ................................................................... 50
Figure A 7. Adding the configuration elements of HTTP request ...................................... 50
Figure A 8. Adding the HTTP request .............................................................................. 51
Figure A 9. Adding the listener in the test ......................................................................... 52
Figure A 10. Configuration of HTTP Header Manager ...................................................... 53
Figure A 11. Configuration of HTTP authorization Manager. ............................................ 54
Figure A 12. Configuration of HTTP request for POST request ........................................ 55
Figure A 13. Configuration of HTTP request for Get request ............................................ 56
Figure A 14. Configuration of Pluggin jp@gc- PerfMon Metrics Collector ......................... 57
Figure A 15. Configuration of Thread Group. ................................................................... 58
Figure A 16. Activation of Agent in the Bucket ................................................................. 58
Figure A 17. Starting the test ........................................................................................... 59
Figure A 18 Taking the percentage of error ...................................................................... 60
Figure A 19. Exporting the data of CPU and Memory results ........................................... 61
Figure A 20. Errasing the data of JMeter .......................................................................... 61
TABLE OF FIGURES OF ANNEX B.
Figure B 1. Entering of EC2 ................................................................................................. 63
Figure B 2. Launching the instance .................................................................................. 64
Figure B 3. Selecting the operating system ...................................................................... 65
Figure B 4. Selecting the family of virtual machine ........................................................... 65
Figure B 5. Adding the snapshot. ..................................................................................... 66
Figure B 6. Adding the new security group ....................................................................... 66
Figure B 7. Configuration of inbounds in virtual machine.................................................. 67
Figure B 8. Review of configuration ................................................................................. 68
Figure B 9. Virtual machin running ................................................................................... 68
Figure B 10. Activation of data base mongod ................................................................... 69
Figure B 11. Launching the application. ........................................................................... 69
Figure B 12. Starting the agent ........................................................................................ 69
Figure B 13. Acces to the Bucket ..................................................................................... 70
Figure B 14 Acces to the bucket. Advanced button. ......................................................... 71
Figure B 15 Main page of the Bucket ............................................................................... 72
Figure B 16. Token of user ............................................................................................... 72

ACRONYMS
Acronyms Definition
AWS Amazon Web services
HTTPS Hypertext Transfer Protocol Secure
Iot Internet of Things
JMS Java meter Software
QE Query Expansion
SaaS Software as a service
SLA Service Level Agreement
SOAP Simple Object Acces Protocol
SWAT Session-based Web Application Tester
UID User Identifier
VM Virtual Machine

RESUMEN
En este proyecto se plantea caracterizar y analizar el comportamiento del Bucket en
diferentes máquinas virtuales en la plataforma virtual de Amazon. Con el fin de conocer el
desempeño de la aplicación y de cada una de las máquinas virtuales bajo distinto número
de usuarios. Esto por medio de pruebas de rendimiento y pruebas de carga. Los resultados
se verán reflejados en gráficas y se presentarán tablas de coeficientes de variabilidad de
los distintos indicadores bajo los cuales de decide medir el rendimiento. Llegando a la
conclusión que al momento de seleccionar una máquina virtual para desplegar una
aplicación web se debe tener en cuenta diferentes variables como los recursos y el costo.
Palabras clave: Rendimiento; Carga; Solicitud; GET; POST
ABSTRACT
In this project it is proposed to characterize and analyze the behavior of the Bucket in
different virtual machines in the virtual platform of Amazon. In order to know the
performance of the application and each of the virtual machines under a different number of
users. This is through performance testing and load testing. The results will be reflected in
graphs and will be presented tables of coefficients of variability of the different indicators
under which it decides to measure performance. Arriving at the conclusion that when
selecting a virtual machine to deploy a web application must take into account different
variables such as resources and cost.
Keywords: Performance; Load; Request; GET; POST
INTRODUCTION
Internet of Things (IoT) is a paradigm in which devices (or sensors) can communicate with
each other through the Internet to execute actions autonomously. Implementations of IoT
solutions consist of sensors, which report variables captured from platforms in the cloud.
Once the data is in the cloud, it can be processed using techniques such as data mining or
Big Data. The cloud offers "unlimited" storage and processing capabilities. In the
Infrastructure-as-a-Service (IaaS) model these capabilities are limited in the quality and
quantity of processors, RAM and hard disk. To make efficient use of IaaS resources when
deploying applications in the cloud must be taken into account.
Bucket is a platform of the CEA-IoT USTA Node that allows the collection of data from
sensors connected to the Internet. In this platform it is possible to create a solution, add
devices and at the same time add sensors to these devices. Using REST-type web
services, the sensors send product values from the captures to Bucket. Currently the
Bucket platform is deployed in a virtual machine, in the public cloud of Amazon Web
Services (AWS). And it has been offline on multiple occasions mainly because the demand
for resources by users or sensors exceeds the capabilities offered by the virtual machine.
To date the limits of capabilities offered in the cloud in terms of resources demanded are
unknown.
This proposal considers the performance evaluation of the Bucket repository through
software performance tests. For this, a state of the art of the different methodologies will be
realized for the performance evaluation of a system, in order to define a methodology to
evaluate Bucket performance in different offers of virtual machines in the cloud. The
proposal contemplates the presentation and synthesis of the results of the performance
evaluation.
1 PROJECT OVERVIEW
This chapter presents the objectives and extent of this work. An overview of the testing
procedure is also described.
1.1 Objectives
General Objective
To evaluate the performance of Bucket, a repository of the CEA-IoT, through performance
tests in order to characterize its performance by deploying the repository on different cloud
providers.
Specific Objectives
● To write a state of the art about the different methodologies to evaluate the
performance of a web-based system deployed in a cloud environment.
● To define a test procedure to measure the performance of Bucket.
● To measure the performance of Bucket through software performance tests defined
in the methodology.
● To present the performance evaluation results.
1.2 Extent
The extent of this work includes the definition of a test procedure for evaluating the
performance of Bucket through software performance tests. Also, a performance
assessment will be done using JMeter software and testing at least 3 different types of
servers in Amazon Web Services (AWS).
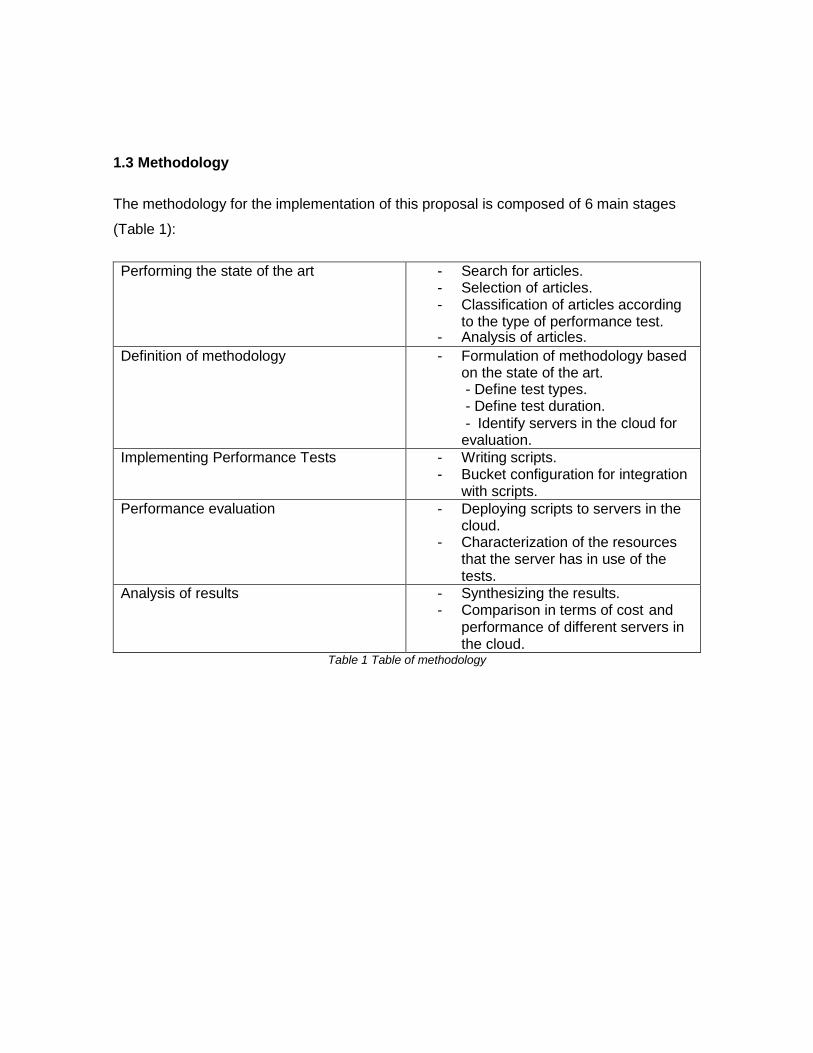
1.3 Methodology
The methodology for the implementation of this proposal is composed of 6 main stages
(Table 1):
Performing the state of the art - Search for articles. - Selection of articles. - Classification of articles according
to the type of performance test. - Analysis of articles.
Definition of methodology - Formulation of methodology based on the state of the art. - Define test types. - Define test duration.
- Identify servers in the cloud for evaluation.
Implementing Performance Tests - Writing scripts. - Bucket configuration for integration
with scripts.
Performance evaluation - Deploying scripts to servers in the cloud.
- Characterization of the resources that the server has in use of the tests.
Analysis of results - Synthesizing the results. - Comparison in terms of cost and
performance of different servers in the cloud.
Table 1 Table of methodology

2 STATE OF THE ART
In order to develop the state of the art, the IEEE database1 was accessed to find the works
related to the subject of software performance tests. To this end an Advanced search, for
the last 20 years, with the keywords: Web application; was done. The search results show
that software performance testing has become a hot topic since 2008 (Figure. 1)
Figure 1. Articles found by year.
The found articles were classified in three main topics, as follows: load, stress and
performance tests (Figure 2).
1 http://ieeexplore.ieee.org

Figure 2. Articles distributed by topic
This chapter presents a state of the art of software performance testing. Typically, software
performance tests are divided in three classes: load, stress and performance tests. For load
tests there are two types of load that are implemented, one is the real load that is generated
by a real user and the other is the induced load that is generated from scripts that will later
be implemented in the system that is going to study
2.1. Load Test
Load testing is a process of evaluating a system under a load. In this type of test, the system
can be characterized and problems can be identified. For this, these types of tests need a
model and parameters, and follow previously defined steps before being executed.
To talk about load tests it should be considered the process presented by Zhen Ming and
Jack Jiang in [1]. In this study the author’s argument that Amazon, Dropbox and all SaaS

companies must provide services to millions of concurrent users every day, so a load test is
a good practice to ensure a good service provisioning. Given this, authors propose a load
testing process as follows (Figure.3). Firstly, the context and objectives of the proposed tests
are defined based in related software testing experiments. Thus the test is designed by
taking into account two types of load: realistic load is a request that a real user seek or
induced load is the one that is generated automatically without the intervention of users.
Then, the load execution is done by taking into account three aspects: the users that
generate the load, the drivers implemented for testing and execution of tests based on
emulation that refers to the platform where the test will be performed. Finally, the load test
results are analyzed taking into account the threshold values are sent to the system, the
patterns or possible problems (e.g. in memory, CPU among others) that arose at the time of
running the test and the detection of anomalies (i.e. all parameters that are outside the
normal operation of the system).

Figure 3. Process of load testing.
Source: Zhen Ming (Jack) Jiang
In other related work [2], software that allows testing in REST-based (Representational state
transfer) web applications and API-documents, generating test scripts, execution tests is
presented. This software is specialized in the design of test cases. A key step in testing is
to build a proper environment. In this case, the test software can analyze the available
applications, possible usage scenarios and the application requirements. Once these
parameters are set up, the test scripts are implemented and run for the different test
cases.Apache Jmeter, Pylot, Grinder test tools have been considered to implement test
scripts in [2], [3], [4], [5]. These tools help to predict the performance of a system by
simulating users accessing to a web application and monitoring the system status. This in

order to find performance problems However, none of these tools support programed
automated performance testing. In the process show a series of steps that relate API
documents and generates a corresponding performance test script relationship in each of
the corresponding parts of the architecture [2]. Thus, when executing the load test script,
different variables such as time, load and even the number of users to be used in the test
are also taken into account the API document outputs to put on the script to execute the
test. For future work it is proposed that the scripts can generate different configurations of
the load work.
In related work Muhammad Arslan et. al [3], it is proposed a method to validate a system by
limiting the simultaneous users that access to a system. In this case the workload is artificial
or induced, and where the users generate requests from a test tool. This process begins
with the test requirements that include number of users, latency time, performance of
application and response time. As in other works previously mentioned exist different type
of tools to do de test, in this case they use “apache jmeter” it’s an application of desk with a
friendly interface that allow create scripts and support different type of requests like
HTTPS(Hypertext Transfer Protocol Secure), SOAP(Simple Object Access Protocol) among
others. In the load testing are taken into account different resources like memory use,
delays, CPU use and others. A load test has concurrent users, response time and
performance as requirements. It is much more efficient to use a cloud-based load test than
a traditional test and for its accuracy.
Ruoyu Gao et. al [6] propose an architecture that evaluates and compares the effectiveness
of different load tests in three open systems: JMS(Java Meter Software),
PetClinic(Framework of software) and DS2(Open Software). It should be borne in mind that
load tests can be done simulating hundreds or thousands of users accessing the system at
the same time, it is estimated that the load lasts a week (in hours) and the developers insert
counters to see the resources consumption (CPU, memory, hard disk usage). However, it is
a great challenge to analyze the data for three reasons. i) In some cases the analysis criteria
are not clear; ii) load tests generate terabytes of data which make results hard to handle
manually and iii) being the last step in the software development cycle, the time for testing
is limited.
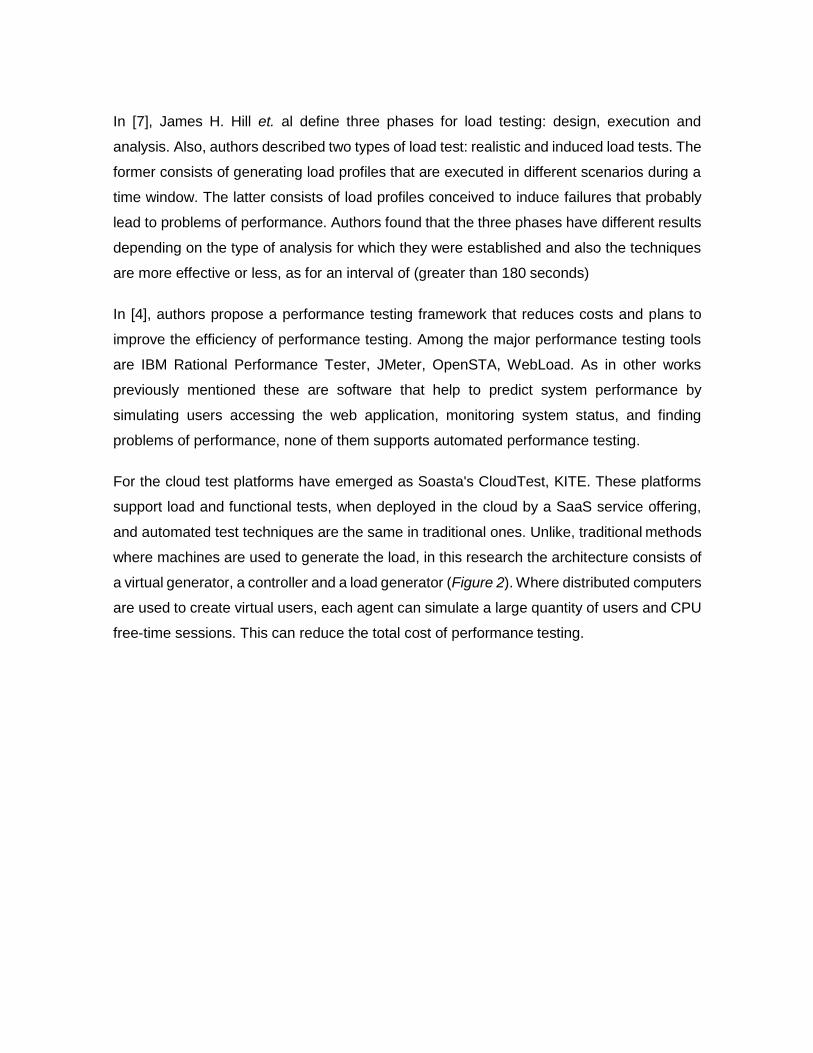
In [7], James H. Hill et. al define three phases for load testing: design, execution and
analysis. Also, authors described two types of load test: realistic and induced load tests. The
former consists of generating load profiles that are executed in different scenarios during a
time window. The latter consists of load profiles conceived to induce failures that probably
lead to problems of performance. Authors found that the three phases have different results
depending on the type of analysis for which they were established and also the techniques
are more effective or less, as for an interval of (greater than 180 seconds)
In [4], authors propose a performance testing framework that reduces costs and plans to
improve the efficiency of performance testing. Among the major performance testing tools
are IBM Rational Performance Tester, JMeter, OpenSTA, WebLoad. As in other works
previously mentioned these are software that help to predict system performance by
simulating users accessing the web application, monitoring system status, and finding
problems of performance, none of them supports automated performance testing.
For the cloud test platforms have emerged as Soasta's CloudTest, KITE. These platforms
support load and functional tests, when deployed in the cloud by a SaaS service offering,
and automated test techniques are the same in traditional ones. Unlike, traditional methods
where machines are used to generate the load, in this research the architecture consists of
a virtual generator, a controller and a load generator (Figure 2). Where distributed computers
are used to create virtual users, each agent can simulate a large quantity of users and CPU
free-time sessions. This can reduce the total cost of performance testing.
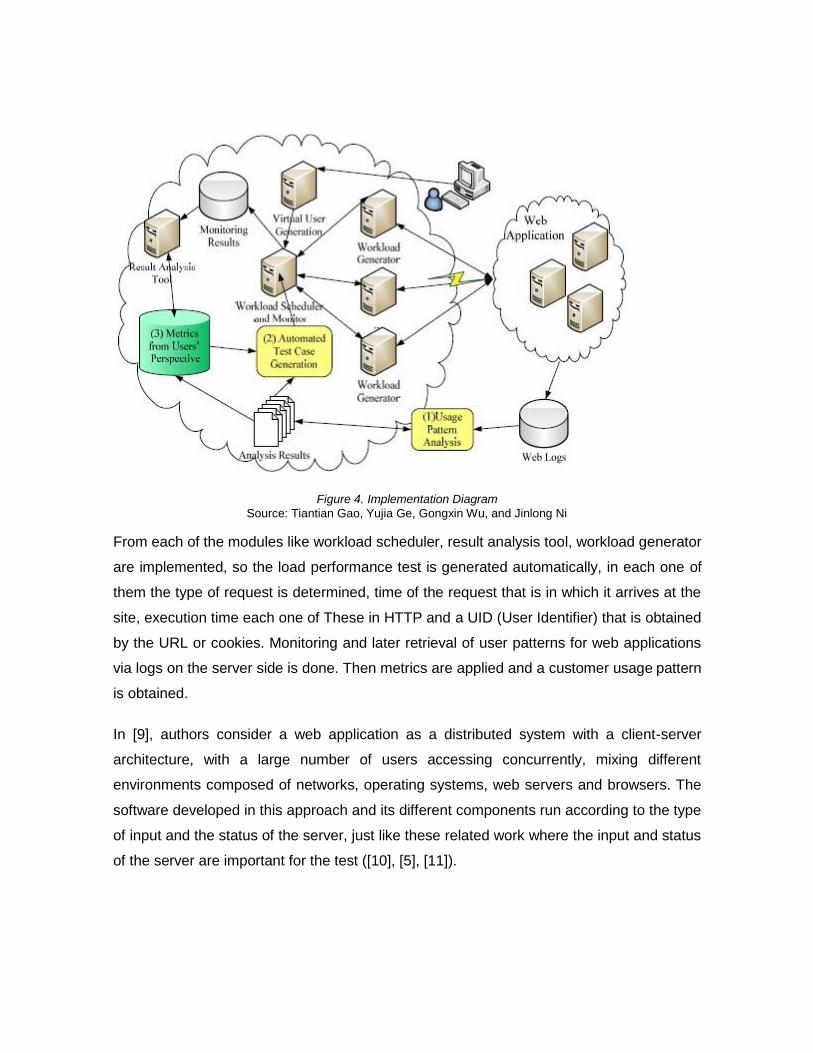
Figure 4. Implementation Diagram
Source: Tiantian Gao, Yujia Ge, Gongxin Wu, and Jinlong Ni
From each of the modules like workload scheduler, result analysis tool, workload generator
are implemented, so the load performance test is generated automatically, in each one of
them the type of request is determined, time of the request that is in which it arrives at the
site, execution time each one of These in HTTP and a UID (User Identifier) that is obtained
by the URL or cookies. Monitoring and later retrieval of user patterns for web applications
via logs on the server side is done. Then metrics are applied and a customer usage pattern
is obtained.
In [9], authors consider a web application as a distributed system with a client-server
architecture, with a large number of users accessing concurrently, mixing different
environments composed of networks, operating systems, web servers and browsers. The
software developed in this approach and its different components run according to the type
of input and the status of the server, just like these related work where the input and status
of the server are important for the test ([10], [5], [11]).
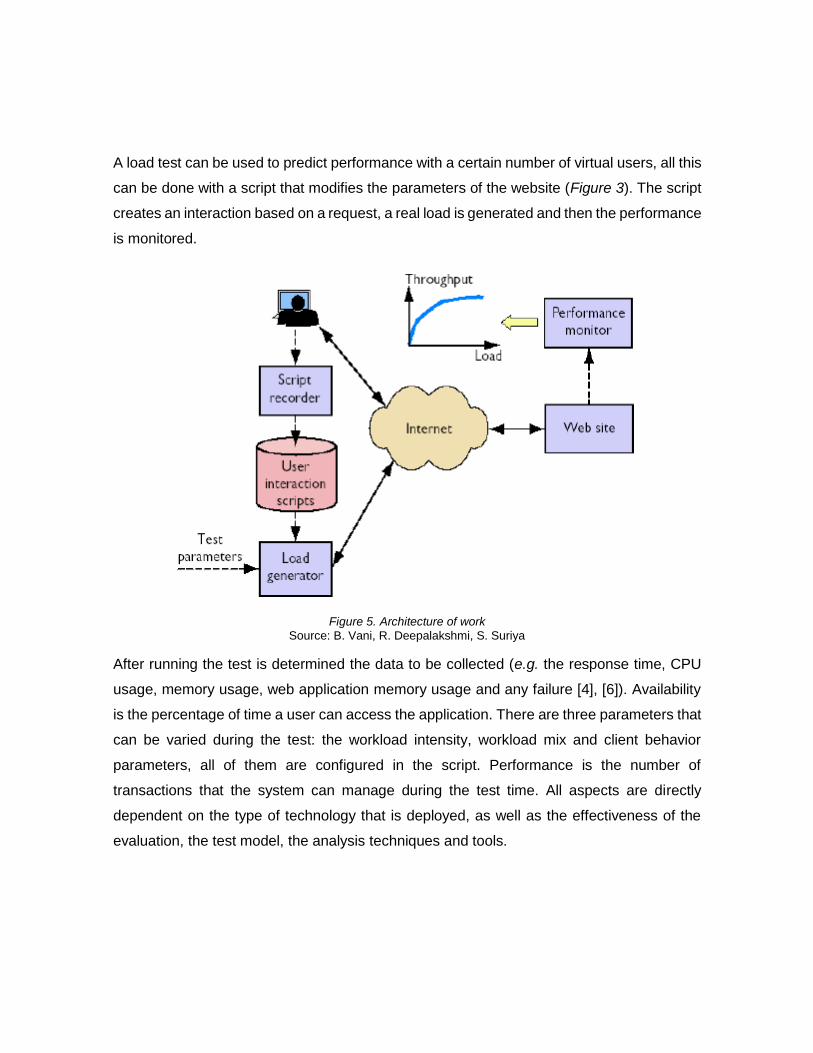
A load test can be used to predict performance with a certain number of virtual users, all this
can be done with a script that modifies the parameters of the website (Figure 3). The script
creates an interaction based on a request, a real load is generated and then the performance
is monitored.
Figure 5. Architecture of work
Source: B. Vani, R. Deepalakshmi, S. Suriya
After running the test is determined the data to be collected (e.g. the response time, CPU
usage, memory usage, web application memory usage and any failure [4], [6]). Availability
is the percentage of time a user can access the application. There are three parameters that
can be varied during the test: the workload intensity, workload mix and client behavior
parameters, all of them are configured in the script. Performance is the number of
transactions that the system can manage during the test time. All aspects are directly
dependent on the type of technology that is deployed, as well as the effectiveness of the
evaluation, the test model, the analysis techniques and tools.
2.2. Performance test
Performance testing is the process of measuring and evaluating performance related
aspects of a software system. These aspects include response time, throughput and
resource consumption. Performance testing also studies the efficiency of various
architectural/designs.
For websites performance tests depend on the speed, scalability and stability of the website,
the number of requests http, and the size of what is going to load and also the time of loading
these on the page, as described by James Hill[12]. The entire analysis of this study is done
in two stages In the first phase the key elements responsible for software performance are
identified. In the second phase a matrix is created that defines a range for parameters, where
ideal values are defined for size, number of requests and response time.
In the key parameters of the website's operation, HTML requests, java scripts, images and
everything related to multimedia are identified. Demonstrating that images are critical factors
affecting the performance of websites. After specifying these values, consist in estimate the
maximum and minimum values recommended for the correct performance of website.
Another performance test study is presented in [13]. In this study has defined three
objectives: to enforce SLA (Service Level Agreements), detect bottlenecks, determine
performance characteristics for different configurations such as changes in applications and
hardware. This article only focuses on the response time since this is one of the crucial
points in implementing the Service Oriented Architecture (SOA) system. Also by response
time is one of the most difficult factors to calculate during the execution of the system.
The analysis of usage patterns and the modeling of the load that the system will assume
must be a well-studied topic to generate importance and analysis of information. An
approach to performance analysis considering the user experience is presented in [15] that
include response time, QoS (Quality of Service) and mistakes. A performance test strategy
with the aim of increasing the chances of discovering failures related to response time.
Preliminary experiments show that the data from the test are better than the randomized
test, although more empirical results should be made and analyzed. In addition,
In other study the researchers propose a software performance testing scheme that
implements virtualization to reduce resource consumption [16]. The work takes into account
the use of memory, download time, CPU usage, download speed as performance indicators.
Also different topologies are tested and a comparison is made between virtual machines
and the physical machine with certain technical specifications like other related works ([12],
[14], [17], [18]).
In another approach [19] VMWARE has been used as a virtual machine and developed
keyboard and mouse automation tools to reduce human resources. The evaluation found
that 4 virtual computers are unstable in 2GB of physical computer memory and 128MB of
virtual machine. Results shown that there is very little difference between physical and virtual
computer for performance testing.
The process of performance test aims to recognize server parameters and their response
to a submitted load [17]. To generate the load, users simulate automatically and begin to
make requests to the website; it is advisable to make request parameters to directly establish
the type of message.
The load models can be classified, the first is the average number of applications, then
comes the average length of the user session and finally the average customer requests.
There are two traditional usage intensity parameters, the number of virtual users and the
average number of requests [13]. In some cases the load test has a greater coverage and
may reveal bottlenecks, as for users, the session that a user initiates must already have a
parameter regarding the load, an advantage of this test model is that regardless of
technology can be applied to respond to build the type of test.
About web test model is a tool used to test a web application, this does it from three different
aspects just like the study of Meng Xiangfeng [20]. The first is to describe the relationship
between each of them; the second is the behavior dependent on the state of the application

at the time of Navigate and the third aspect describing the control flow and data information
of the web application [18].
This tool can be used as a guide to identify strategies to reduce the stresses required for a
test. Objects consist of different attributes and operations, so there are three types of
objects: client pages which are an HTML document with scripts and are represented by the
web browser on the client side, server pages can be common input interfaces, Java pages
or something that is executed by the web server. Components can be HTML, Java, ActiveX
elements or modules that interact with the client page, server page. The types of
relationships that evaluate this tool are response time, request time, navigation time, request
and response.
2.3. Stress test
According with Zhen Ming Jiang and Ahmed E. Hassan [21] stress testing “is a process of
putting a system under extreme conditions to verify the robustness of the system and/or to
detect various load-related problems (memory leaks and deadlocks)”. Stress testing is a
technique that determines if a system meets with the objectives of performance and quality
of service, it involves multiple simulated requests from real users in a controlled
environment. The workload that is implemented in these tests is called synthetic workload,
during the test, data are collected, like response times for users, resource utilization these
are used to characterize the system, to plan capacity and define SLA.
In another study [22], the researchers design an architecture that minimizes the use of CPU
and memory, considering traffic and the size of the file models required for the support of
web application. The architecture takes into account the redundancy and possible errors
that can be found. They considered that a web service composed of three types of servers:
the first the distributing machine, which receives data for its treatment, and gives the
response to customers. The second load target language models, uses remote mapping
tables to finally be the server machine which is the one that designates the host and the
different map files. For the test the following characteristics are evaluated: prediction in the

answers, which is handled depending on the type of charge that has the request. As for the
ability to handle expected traffic it talks about the faces that approach the system and it must
be stable and not suffer degradation of performance beyond a set limit. Lastly is the time
between failures that is caused by memory leaks or fragmentation, a slow rate must occur
in order for the system to continue to run at constant load for extended periods of time. In
conclusion, the test allowed to identify the bottlenecks and to improve the performance of
the system.
In [23], it is described a workload modeling and generation tool for stress testing web
application. The SWAT (Session-based Web Application Tester) is a tool that generates a
workload for testing web applications, in special to facilitate the stress testing process. The
principal attributes of the workload are session length distribution and the time distribution
that affects directly the experience of the client. SWAT is a tool that allows making web
requests through HTTPREF (Testing tool), allows varying one or several parameters of the
load at the same time that the performance of the system can be observed. In this way the
software SWAT increases confidence in the results offered in each test.
The type of load to be executed in the test depends on the type of user session that launches
the test, and also takes into account the time it takes to get the session(s) to the system
under study like other studies ([2], [3], [6], [4]). The duration of the session is also important
because in relation to the activation time of a session can influence the workload, the
thinking time can cause the loads to collapse the system, inter-arrival time is the time
between the Requests that come to the system, mixed loading are different types of requests
that are made to the system that can mean different CPU demand and use of system
resources. Another parameter take into account is the application type.
The type of request that the method uses is HTTPERF consisting of a main HTTP protocol,
modules that generate loads, and a compiler of statistics and data. The HTTP request
arrives at the server to be evaluated, multiple simultaneous sessions are emulated, the
modules generate load with corresponding URLs. The mixed load can have an impact on
the performance of the server; with this test it can deduced the effective capacity of the
system under different load conditions.

In another work [24], it is done a study focused on the problems that can have a multi-user
system, such as bottlenecks, this can occur when there is a delay in the queue of requests.
When the stress tests are going to be executed, a characterization of the requests must be
done, considering the CPU usage in a time interval. Characterize the session and what can
vary the request depending on the type of session or sessions according to the type of load
to be sent. After this, it is made a relation of the explosiveness that can have the server to
receive multiple requests of multiple users, in such a way that it is characterized in which
point a bottleneck can be formed and where failures in this one begin. In the end, the
methodology includes models to generate reference points automatically, which analyze the
performance of the system around the different loads that users make.
In another study [25], some attributes such as scalability, reliability among others of a web
application prototype developed with .NET are evaluated. The performance of this
application depends on different parameters such as response time, performance, errors.
These are evaluated at different levels of stress. Stress tests along with load tests can verify
the performance of the web application under a heavy load. The results analysis of these
tests can be used to determine bottlenecks, memory loss or performance problems related
to the database layer of web application.
The stress test is performed to determine the stability of a system, can be detected memory,
and determine the bandwidth limit, transactional problems, resource blocking hardware
limitations and synchronization problems that are generated when the load goes beyond the
limits of performance. Different tools simulate scenarios and evaluate performance with
established parameters, create an effort in the system and simulate multiple virtual users,
generate graphs that are used to analyze the application. In this work they took into account
different web elements of the application, such as the audience, domain information,
account type (user or administrator) and web specifications to produce an arrangement and
implement it in PReWebD. The parameters to evaluate in the test were: intensity of the load
in terms of the number of virtual users and their level of effort, the mixed load that defines
that a user is doing in each session, parameter of user behavior. The results that were
monitored in the test were: response time in seconds, per-second performance, actions per
second, number of successful virtual users in the transaction, transaction summary including
number of sessions terminated and abandoned and finally the results that shows the
characterization of web application. With the increase of virtual users increase errors and
rejection to the connection, it has an established number of users maximum with a low
percentage of errors that is tolerable, the increase in stress increases the collisions between
requests, it demonstrates scalability and reliability of the web application having multiple
virtual users.
Poor management in buffers is one of the main sources of errors in the development of a
multimedia system so in this work, Jian Zhang et. al [26] propose a study based on putting
a system under specific conditions, to make it susceptible to errors or to decrease it in
performance when many resources are being used. A critical system state can occur when
there is excessive CPU, memory or bandwidth consumption. A heavy request can cause an
overflow in the system and also loss of packets. The use of resources depends on factors
supported by software and hardware and the required quality of services. For the test, total
resource utilization is defined over a defined period of time. The goal is to determine the
interaction time of the user, through two methods to generate evaluation cases with stress
tests.
In practice the audio and video bit rates may vary depending on the different compression
techniques used, in most cases the audio and video stream consumes much more
resources than other multimedia objects.
As it has been highlighted in [27] that there is a lack of techniques to evaluate the
performance of business applications. In this research, a technique to generate the synthetic
load with specific characteristics and the impact of several characteristics on the
performance of a system is presented. The implemented mechanism generates the loads
and allows flexibility on their control by configuring parameters such as the distribution of
sessions, the response time and the requested service.

The development of real-time systems is a very important topic for areas such as aviation,
robotics, and nuclear plants, among others. The challenge lies in developing real-time
testing, running the program at the same time. In [28] authors deal with a scenario for a
stress test in a network with given traffic characterization. The more precise the time to
process the message, the more deterministic the test requirements will be, and then test
cases will be run corresponding to the requirements to maximize network traffic based on
results.
The inputs of the model in the research [28].Will be work under the UML model, and then
go to the test model where the different parameters such as traffic, control, restrictions and
others are designed, the stress test requirements will be presented and the test cases will
be generated To evaluate the system.
In a more recent study, authors find the maximum number of requests that can be supported
by a system. This work is focused on images, a set of tests is done using a folder with
images (PNG, JPG, BMP) regarding a QE(Query Expansion), these "scores" can be made
for other QE whose algorithms are included in the software, the results of the tests are stored
in a Python dictionary. It makes a summary report that is stored in an Excel and the graphics
are also saved as PNG files.
The software is divided into three modules, the first one distorts the image and the input
images are treated as reference and distorted image sets are created depending on the
specific requirements of each analysis, in the second module the calculation of QE, this for
each distorted image, finally a statistical analysis is done and the results are put into an
Excel.
For another work[29]. A new model is presented that when running the stress test does not
present failures, no matter how long the test lasts. Taking into account other models of stress
test presents a much lower percentage and also warns about possible future failures in
different scenarios. Among them is the Clopper-Pearson estimator model, which only
provides the information collected during the test, the bayesian approach model that
provides information and a percentage of errors during the test.
3 PERFORMANCE TESTING PROCEDURE
This chapter describes the details about the performance testing procedure used to
characterize the behavior of Bucket under different loads. Starting with the configuration of
the virtual machines in Amazon, going through the configuration of the software that was
used to implement the tests and ending with the treatment of the data.
3.1 Bucket Deployment
Bucket is a web application developed at the telecommunications engineering department
of Universidad Santo Tomás under the CEA-IoT2 project. The main goal of Bucket is to act
as an IoT repository in order to collect data from devices connected to Internet. For this,
Bucket uses a REST API enabling to consume or to register data through GET and POST
requests, respectively.
Firstly, in this performance testing procedure, Bucket must be installed in an AWS VM as
described in Annex B. After installation, its correct operation must be verified by sending
GET and POST requests to the repository. In order to enable the sending of information
related to CPU and RAM memory resources consumption, it is necessary to install the
JMeter ServerAgent extension (Annex A). Finally, when the VM has been configured and
tested it, a “snapshot" is generated allowing to save and start new VMs with the configuration
described above.
2 Centro de Excelencia y Apropiación for the Internet of Things.
3.2 JMeter configuration.
JMeter is a tool developed by Apache that is used to perform load tests, analyze and
measure the performance of different web application services. In this work, two types of
HTTP requests for the web application are taken into account: GET and POST.
The first step is to download the software from the official Apache website3, the software is
available for Windows and Linux operating systems. In this project is implemented the
Windows version. Once JMeter has been installed it is necessary to configure it (Annex A).
Specifically, to launch requests to any web application three parts must be set up:
● The HTTP request header where the request type is specified some http request
headers are (Content, accept, if, set, access.) for this case the type of header is
Content-type.
● Authorization of the HTTP request, which considers the address of the server, the
user and the password.
● Application related configuration which consists of selecting type of protocol (i.e. http
or https), the type of request (i.e. GET or POST), the ip server address, and the
parameters of the request. In the case of the POST request the message body.
●
To evaluate the performance of Bucket four indicators has been considered for the two types
of requests. These indicators are:
● Percentage of CPU used.
● Percentage of RAM used.
● Percentage of error: it refers to the number of either GET or POST requests that
Bucket cannot process.
● Latency: It corresponds to the delay from just before sending the request to just after
the response has been completely received. Thus, it includes the time to process the
3 Centro de Excelencia y Apropiación for the Internet of Things. 4 http://jmeter.apache.org/

request in bucket, the network delay and the time to create and process the request
once it is received.
● Variability: it corresponds to the coefficient of variation of the tests, as defined in [32].
Each one of these indicators allows to characterize the performance of Bucket making
comparable different VMs offers.
3.3 Test Procedure
The following parameters are taking into account:
● Type of request: GET or POST. In the case of GET requests the number of
parameters to be retrieved must be defined.
● Web service URL: The direction for the request. With the IP direction of VM, token
and the type of request
● Number of requests: The number of request in the test
● Ramp-Up period: Time between sending requests
The test procedure is as follows:
1. A snapshot described in section 3.1 is deployed on a VM.
2. It starts the application bucket and the server agent that sends CPU and memory
information to Jmeter.
3. All the settings related to the request are made in JMeter. Configuring the HTTP
request, the IP address of the virtual machine and the path of the request.
4. Tests are started with each request (GET and POST). Configuring the results to
remain in the CSV file. In the same way export CSV files from CPU and memory
information.
5. After finishing all the tests in a machine. It shuts off and loads the snapshot on the
next virtual machine. Doing the same process with all the machines, changing the IP
address of each of the virtual machines.

3.4 Generation of results
JMeter results are generated in CSV files. These files contain all the indicators mentioned
above but the variability and are treated in order to generate final results. The final results
are displayed in figures showing in the x-axis the number of request per second and in the
y-axis its correspondent indicator value. The variability is presented in tables.
4 EXPERIMENTS AND RESULTS
4.1 Testbed scenario
The configuration that was considered for the development of the project was the following:
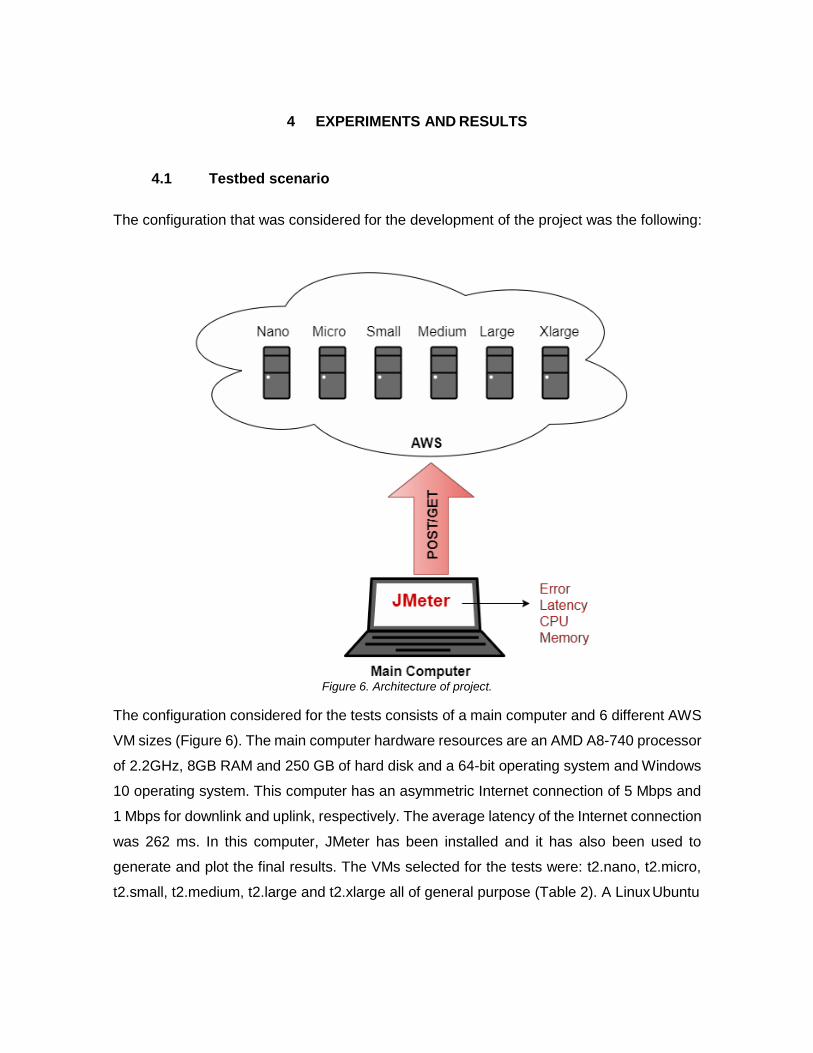
Figure 6. Architecture of project.
The configuration considered for the tests consists of a main computer and 6 different AWS
VM sizes (Figure 6). The main computer hardware resources are an AMD A8-740 processor
of 2.2GHz, 8GB RAM and 250 GB of hard disk and a 64-bit operating system and Windows
10 operating system. This computer has an asymmetric Internet connection of 5 Mbps and
1 Mbps for downlink and uplink, respectively. The average latency of the Internet connection
was 262 ms. In this computer, JMeter has been installed and it has also been used to
generate and plot the final results. The VMs selected for the tests were: t2.nano, t2.micro,
t2.small, t2.medium, t2.large and t2.xlarge all of general purpose (Table 2). A Linux Ubuntu
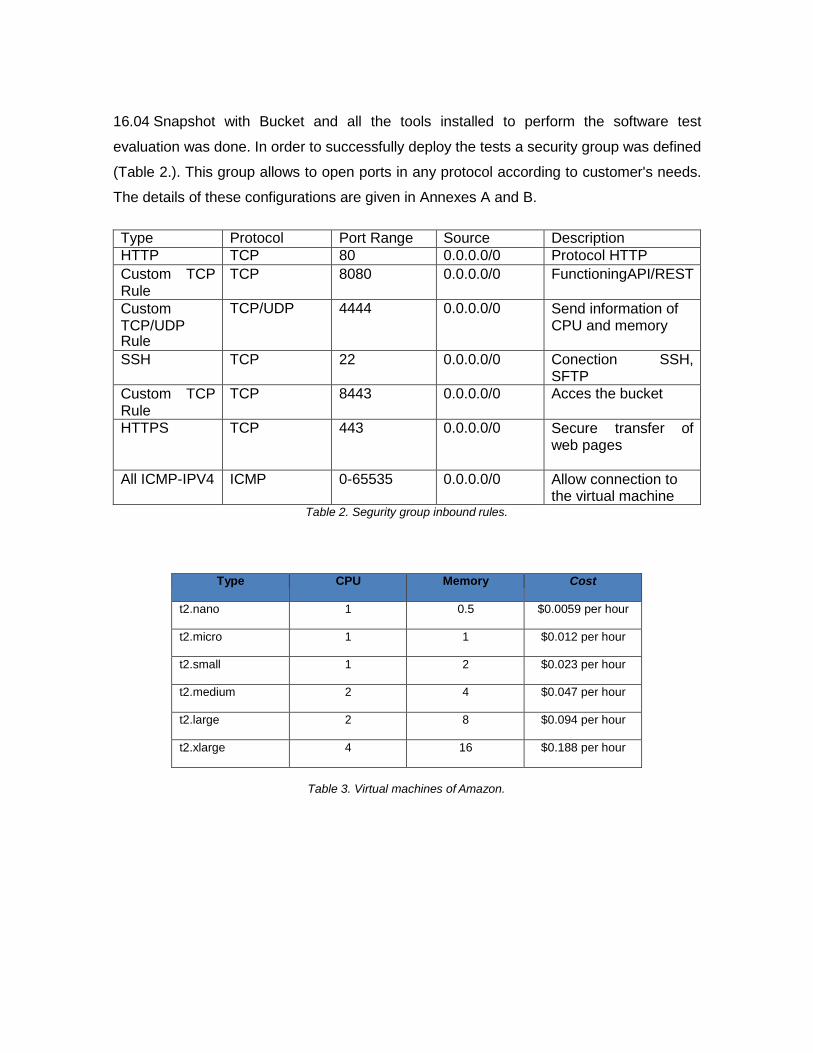
16.04 Snapshot with Bucket and all the tools installed to perform the software test
evaluation was done. In order to successfully deploy the tests a security group was defined
(Table 2.). This group allows to open ports in any protocol according to customer's needs.
The details of these configurations are given in Annexes A and B.
Type Protocol Port Range Source Description
HTTP TCP 80 0.0.0.0/0 Protocol HTTP
Custom TCP Rule
TCP 8080 0.0.0.0/0 FunctioningAPI/REST
Custom TCP/UDP Rule
TCP/UDP 4444 0.0.0.0/0 Send information of CPU and memory
SSH TCP 22 0.0.0.0/0 Conection SSH, SFTP
Custom TCP Rule
TCP 8443 0.0.0.0/0 Acces the bucket
HTTPS TCP 443 0.0.0.0/0 Secure transfer of web pages
All ICMP-IPV4 ICMP 0-65535 0.0.0.0/0 Allow connection to the virtual machine
Table 2. Segurity group inbound rules.
Type CPU Memory Cost
t2.nano 1 0.5 $0.0059 per hour
t2.micro 1 1 $0.012 per hour
t2.small 1 2 $0.023 per hour
t2.medium 2 4 $0.047 per hour
t2.large 2 8 $0.094 per hour
t2.xlarge 4 16 $0.188 per hour
Table 3. Virtual machines of Amazon.
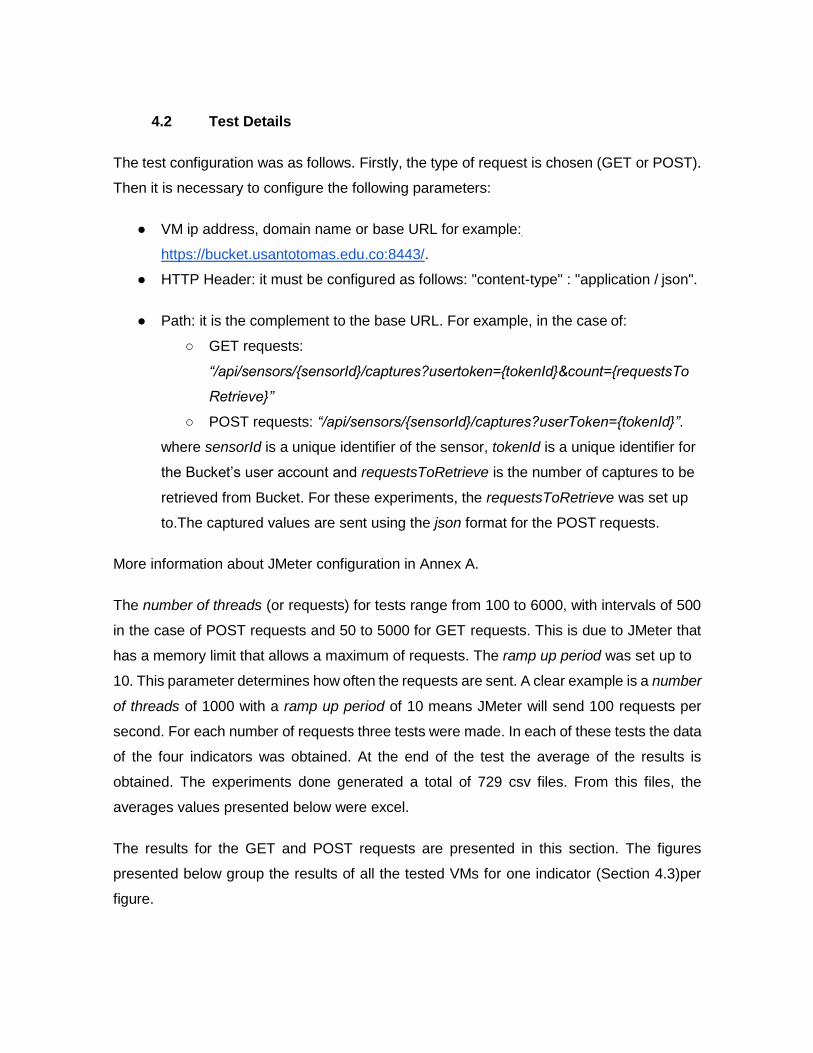
4.2 Test Details
The test configuration was as follows. Firstly, the type of request is chosen (GET or POST).
Then it is necessary to configure the following parameters:
● VM ip address, domain name or base URL for example:
https://bucket.usantotomas.edu.co:8443/.
● HTTP Header: it must be configured as follows: "content-type" : "application / json".
● Path: it is the complement to the base URL. For example, in the case of:
○ GET requests:
“/api/sensors/{sensorId}/captures?usertoken={tokenId}&count={requestsTo
Retrieve}”
○ POST requests: “/api/sensors/{sensorId}/captures?userToken={tokenId}”.
where sensorId is a unique identifier of the sensor, tokenId is a unique identifier for
the Bucket’s user account and requestsToRetrieve is the number of captures to be
retrieved from Bucket. For these experiments, the requestsToRetrieve was set up
to.The captured values are sent using the json format for the POST requests.
More information about JMeter configuration in Annex A.
The number of threads (or requests) for tests range from 100 to 6000, with intervals of 500
in the case of POST requests and 50 to 5000 for GET requests. This is due to JMeter that
has a memory limit that allows a maximum of requests. The ramp up period was set up to
10. This parameter determines how often the requests are sent. A clear example is a number
of threads of 1000 with a ramp up period of 10 means JMeter will send 100 requests per
second. For each number of requests three tests were made. In each of these tests the data
of the four indicators was obtained. At the end of the test the average of the results is
obtained. The experiments done generated a total of 729 csv files. From this files, the
averages values presented below were excel.
The results for the GET and POST requests are presented in this section. The figures
presented below group the results of all the tested VMs for one indicator (Section 4.3)per
figure.

4.3 Results and analysis
The results for the GET and POST requests are presented in this section. The figures
presented below group the results of all the tested VMs for one indicator (Section 3.3)per
figure.
Having the results are plotted in matlab to observe the behavior of each machine in terms
of the number of requests and their response. In this case the six machines are grouped in
a single graph for each of the indicators and for each request (GET and POST) there is a
graph. In total there are eight graphs, four for each request and two for each indicator (Error,
latency memory, CPU).
4.3.1 GET request evaluation
The GET requests are requests that demonstrated a greater effort in capacity and resource
of the virtual machines. This can be seen in the results of the four indicators. In the figure of
errors (Figure. 7 can be observed that there is a balance of errors about 80% with a very
minimal variation in this range. The VM that had the lowest performance was the t2.nano
VM since from the 200 requests had 100% errors in the applications. The VM that had the
best behavior in terms of errors is the t2.xlarge VM with 75.16%. It is also important to
highlight that unlike the other VMs the errors start at 1000 requests for the t2.xlarge.

Figure 7. Results graph GET Errors.
For latency the machines had a very similar behavior up to 2500 requests with a latency
ranging from two seconds to three seconds. After that point each machine had an
independent behavior according to its resources and capabilities. The t2.nano machine had
a very minimal latency but this because all its requests were wrong. Taking into account that
the machine that had more latency in all the tests was the machine t2.small. This VM
reached a latency of up to 5.5 seconds. The lowest latency was the t2.xlarge VM with a
latency of 2.9 seconds
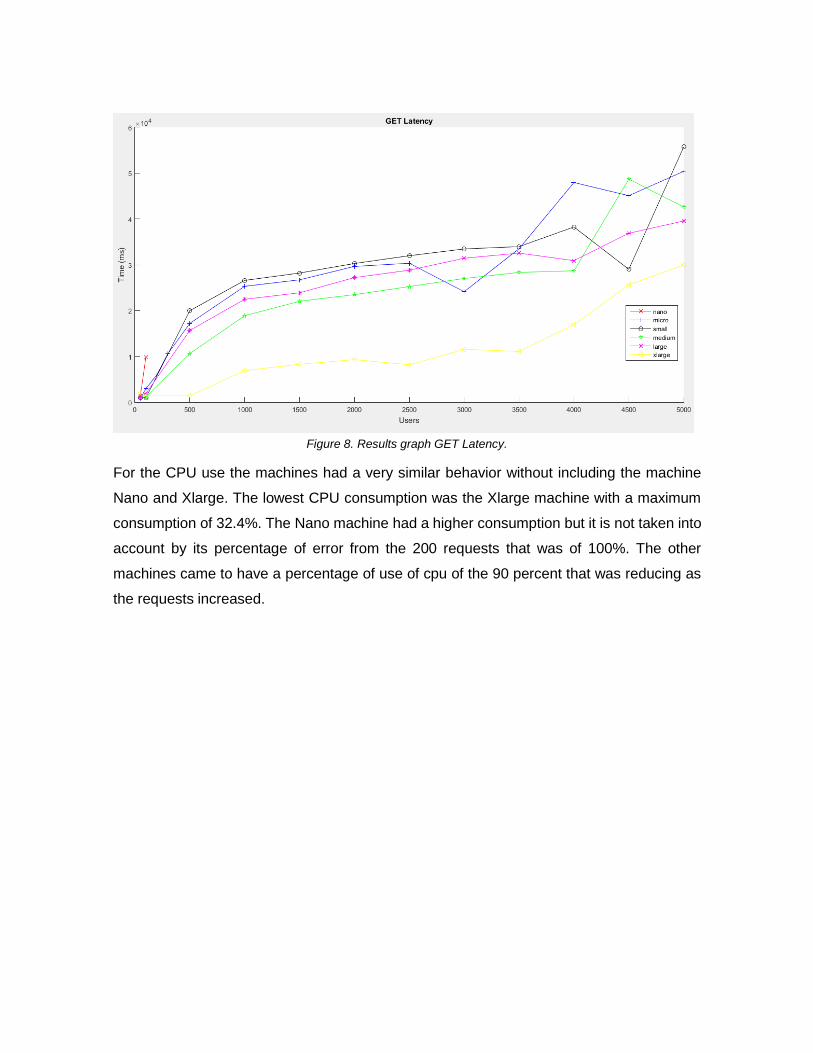
Figure 8. Results graph GET Latency.
For the CPU use the machines had a very similar behavior without including the machine
Nano and Xlarge. The lowest CPU consumption was the Xlarge machine with a maximum
consumption of 32.4%. The Nano machine had a higher consumption but it is not taken into
account by its percentage of error from the 200 requests that was of 100%. The other
machines came to have a percentage of use of cpu of the 90 percent that was reducing as
the requests increased.
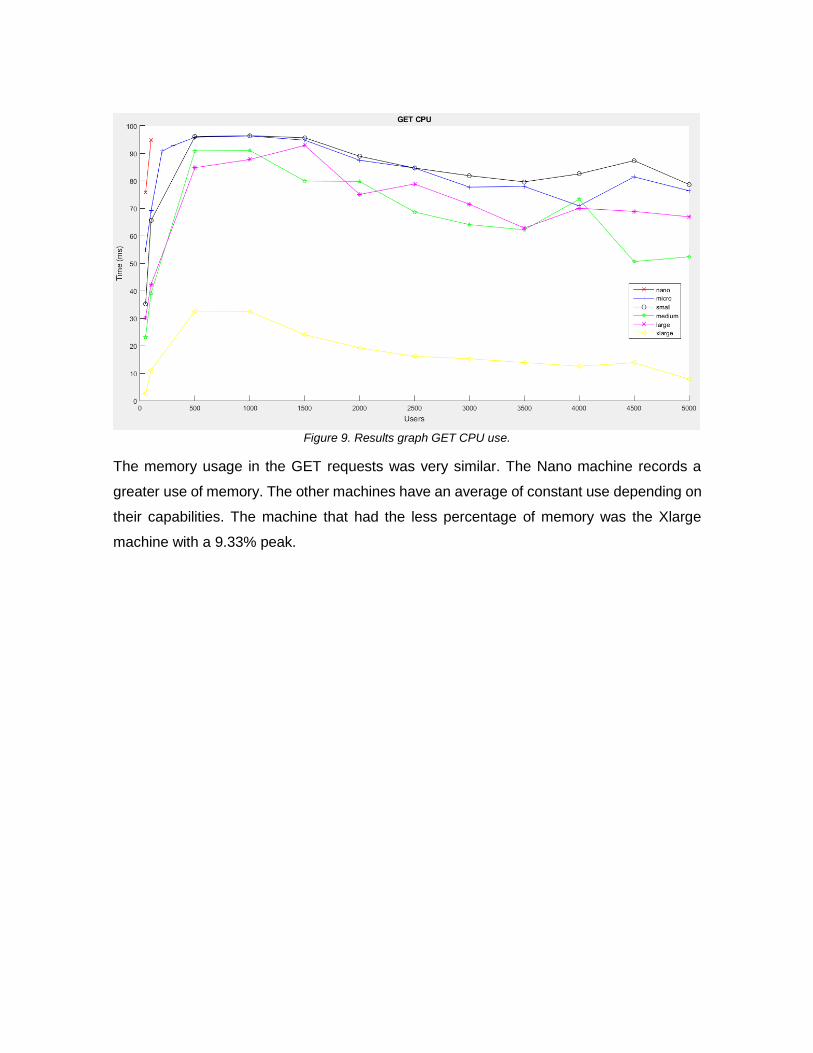
Figure 9. Results graph GET CPU use.
The memory usage in the GET requests was very similar. The Nano machine records a
greater use of memory. The other machines have an average of constant use depending on
their capabilities. The machine that had the less percentage of memory was the Xlarge
machine with a 9.33% peak.
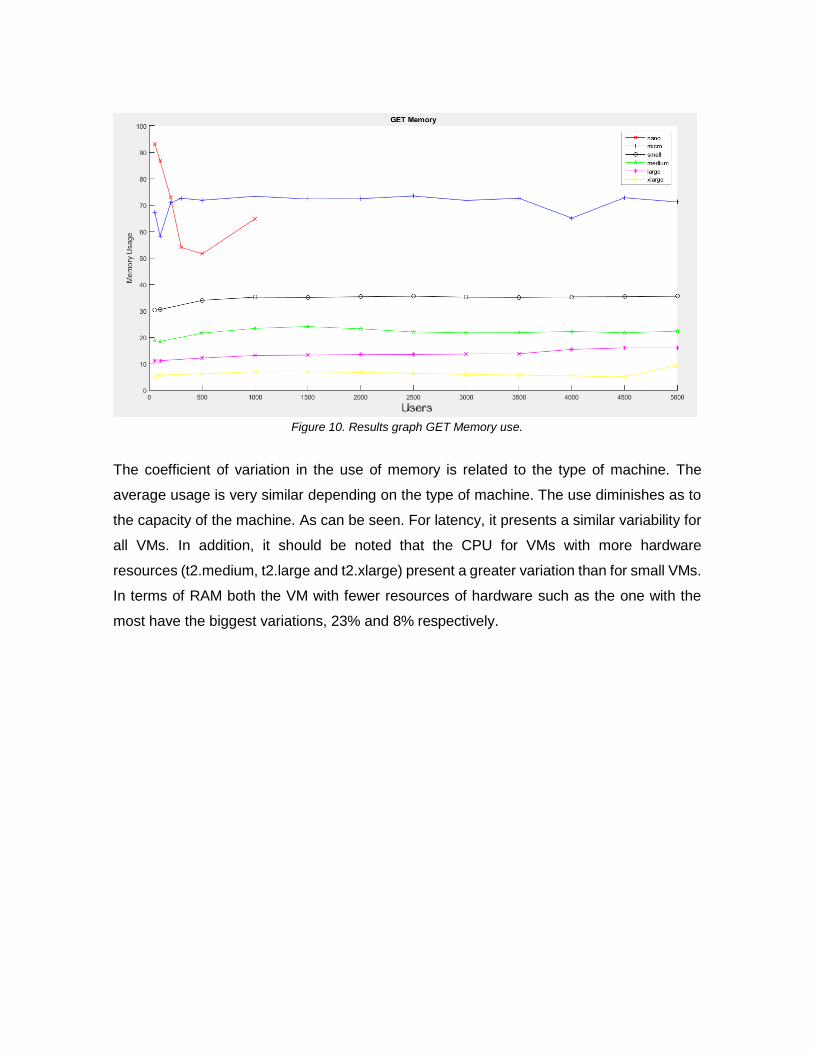
Figure 10. Results graph GET Memory use.
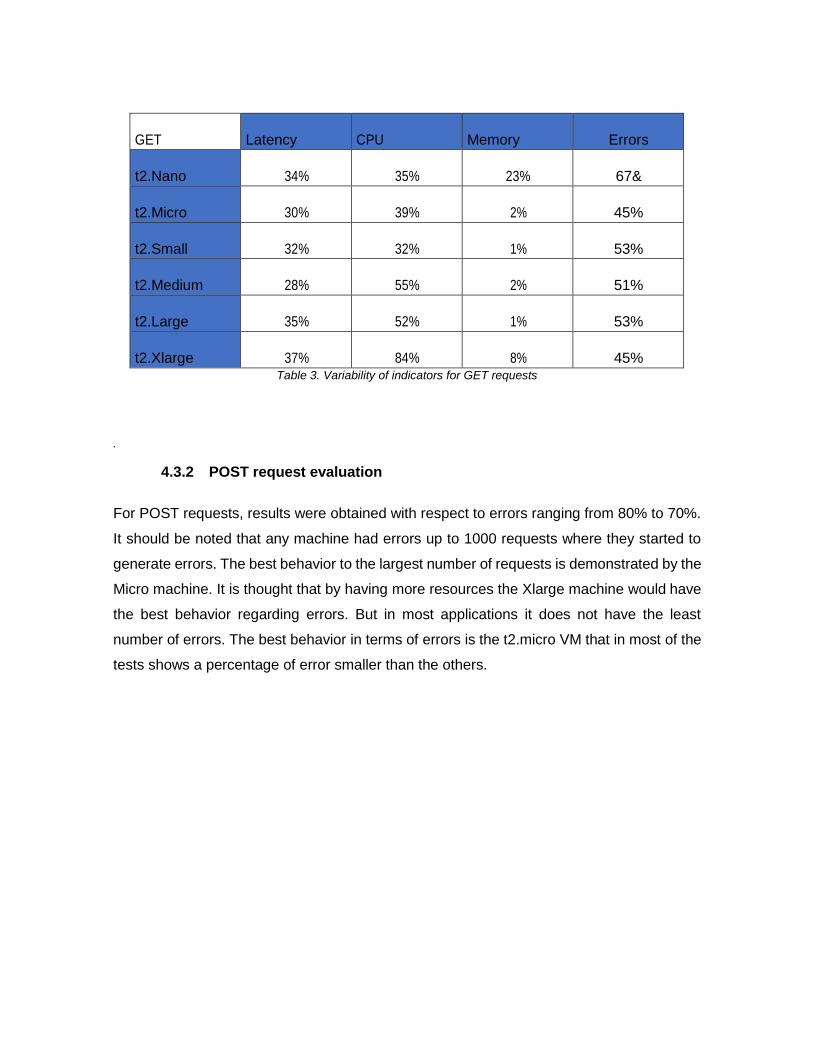
The coefficient of variation in the use of memory is related to the type of machine. The
average usage is very similar depending on the type of machine. The use diminishes as to
the capacity of the machine. As can be seen. For latency, it presents a similar variability for
all VMs. In addition, it should be noted that the CPU for VMs with more hardware
resources (t2.medium, t2.large and t2.xlarge) present a greater variation than for small VMs.
In terms of RAM both the VM with fewer resources of hardware such as the one with the
most have the biggest variations, 23% and 8% respectively.
GET
Latency
CPU
Memory
Errors
t2.Nano
34%
35%
23%
67&
t2.Micro
30%
39%
2%
45%
t2.Small
32%
32%
1%
53%
t2.Medium
28%
55%
2%
51%
t2.Large
35%
52%
1%
53%
t2.Xlarge
37%
84%
8%
45%
Table 3. Variability of indicators for GET requests
.
4.3.2 POST request evaluation
For POST requests, results were obtained with respect to errors ranging from 80% to 70%.
It should be noted that any machine had errors up to 1000 requests where they started to
generate errors. The best behavior to the largest number of requests is demonstrated by the
Micro machine. It is thought that by having more resources the Xlarge machine would have
the best behavior regarding errors. But in most applications it does not have the least
number of errors. The best behavior in terms of errors is the t2.micro VM that in most of the
tests shows a percentage of error smaller than the others.

Figure 11.Results graph POST Errors.
For latency the machines had a very similar behavior. The Nano machine when having
shared resources was the one that had greater latency in the majority of the tests. The best
performance is the Xlarge machine because of its capacity and resources. The latency on
all machines ranges from one to seven seconds. Taking into account that the resources and
capacity of each machine are different.
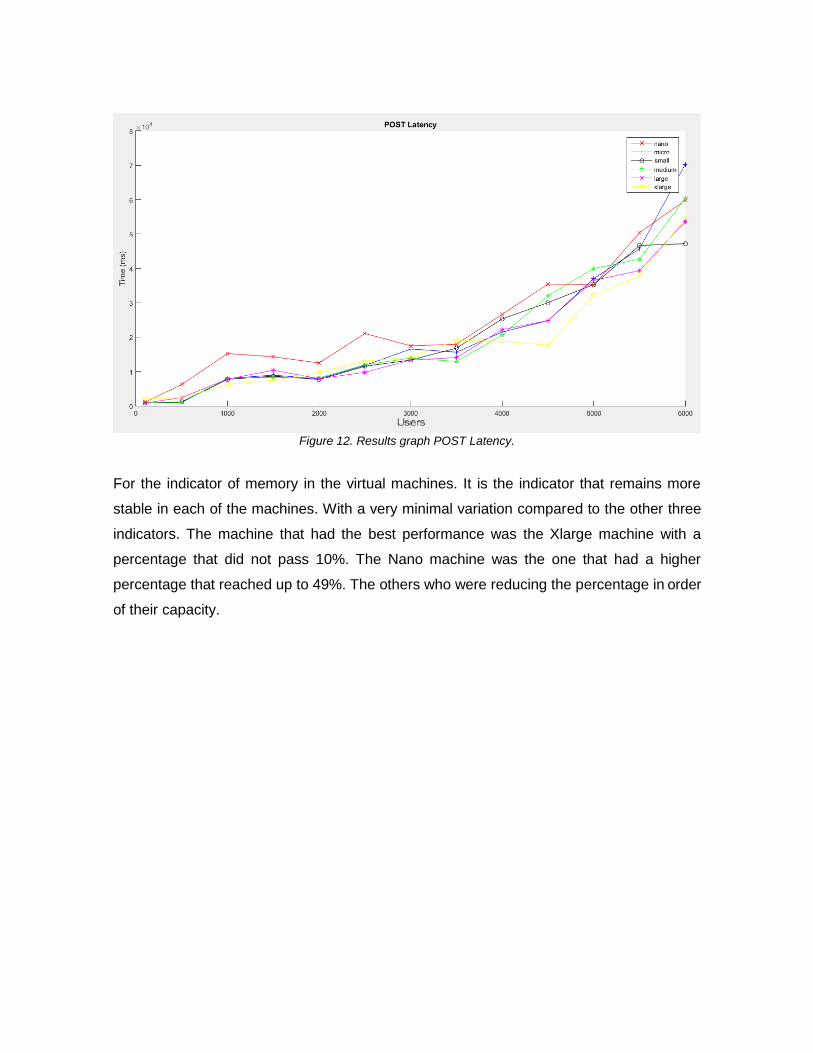
Figure 12. Results graph POST Latency.
For the indicator of memory in the virtual machines. It is the indicator that remains more
stable in each of the machines. With a very minimal variation compared to the other three
indicators. The machine that had the best performance was the Xlarge machine with a
percentage that did not pass 10%. The Nano machine was the one that had a higher
percentage that reached up to 49%. The others who were reducing the percentage in order
of their capacity.

Figure 13. Results graph POST CPU use.
For the indicator of memory in the virtual machines. It is the indicator that remains more
stable in each of the machines. With a very minimal variation compared to the other three
indicators. The machine that had the best behavior was the Xlarge machine. The Nano
machine was the one that had a greater percentage unlike the others that were reducing the
percentage in order of its capacity.

Figure 14. Results graph POST Memory use.
After having the results of the POST requests. It is made a calculation of the variability of
the three indicators that have coefficient of variation (CPU, memory and latency).The
variability of virtual machines has been calculated by averaging the Coefficient of Variation
of all the benchmark results [32].
The coefficient of variation of the table shows that the indicator that most changed was CPU,
with a variation of up to 89%. Latency is the indicator that follows with a variation of 42%. In
last place is located the Memory of the virtual machines. This with a variation of only 5% a
very small percentage compared to the other indicators. The variability in terms of latency,
cpu and memory is similar for all VMs. However, it should be noted that for t2.xlarge VM the
variability for these aspects is higher in comparison to the other VMs.

POST
Latency
CPU
Memory
Errors
Nano
30%
88%
1%
58.46%
Micro
33%
79%
0%
55.57%
Small
33%
79%
0%
56.53%
Medium
33%
84%
1%
57.28%
Large
31%
84%
2%
57.88%
Xlarge
42%
89%
5%
59.34%
Table 4. Table of coefficients of variation of the indicators in POST requests

5 CONCLUSIONS
Currently, Bucket, an IoT repository developed at the CEA-IoT, is deployed in an AWS
t2.small VM. This study allowed to characterize the performance of Bucket over 6 different
AWS VM types. For this, a state of the art based on load, stress and performance keywords
has been conceived from previous studies found in the IEEE Xplore Digital Library.
Moreover, a testing procedure has been proposed and the Apache JMeter application has
been used to simulate and measure the impact of HTTP user requests. The main key
findings of this study are:
● It was experimentally proved that for some cases the most costly VM with the highest
capacity in terms of hardware resources (t2.xlarge) had not been the VM with the
highest performance. Indeed, this VM was outperformed by cheaper and low
hardware resources VMs in terms of variability. Particularly, for POST requests, the
t2.large VM presents the highest percentage of error for 2.000 and 2.500 requests.
● Bucket is a CPU-bound application. While the percentage of memory used has a
small slope value (in some cases 0), the percentage of CPU used had an increasing
trend for 100, 500 and 1.000 for GET requests and remains over 80% for the interval
of 1.500 to 5.000 requests. For POST requests, the increasing trend was for 100 and
500 requests.
● The percentage of errors in VM is not very affected by the capabilities and resources
of the virtual machine. Highlighting that the most expensive machine (t2.xlarge) did
not always have the best performance in terms of errors. The latency is related to
this. That being a very important factor when it comes to solving various requests
and if it was related to the resources of the VM.


ANNEX A. MANUAL OF JMETER
JMeter is software that can be used as a tool that generates load. It can analyze and
measure the performance of different services focused on web applications.
To begin you must download Jmeter from the Apache page http://jmeter.apache.org/ in the
download section. Then it is selected according to the operating system that has the
computer. In this case it is the link ".zip".
Figure A 1. Page to download Jmeter.
After downloading the .zip file the software is installed. You must have a version of java 8 or
later for a correct operation. It should also be verified that it is of the version of the system
(32 bits or 64 bits). If this is not the case, errors will occur when using the program
After installing JMeter is necessary to install the plugin that allows to collect information of
CPU and memory. This is done from the page https://jmeter-plugins.org/downloads/all/ from
here the latest updates are downloaded regarding pluggins.
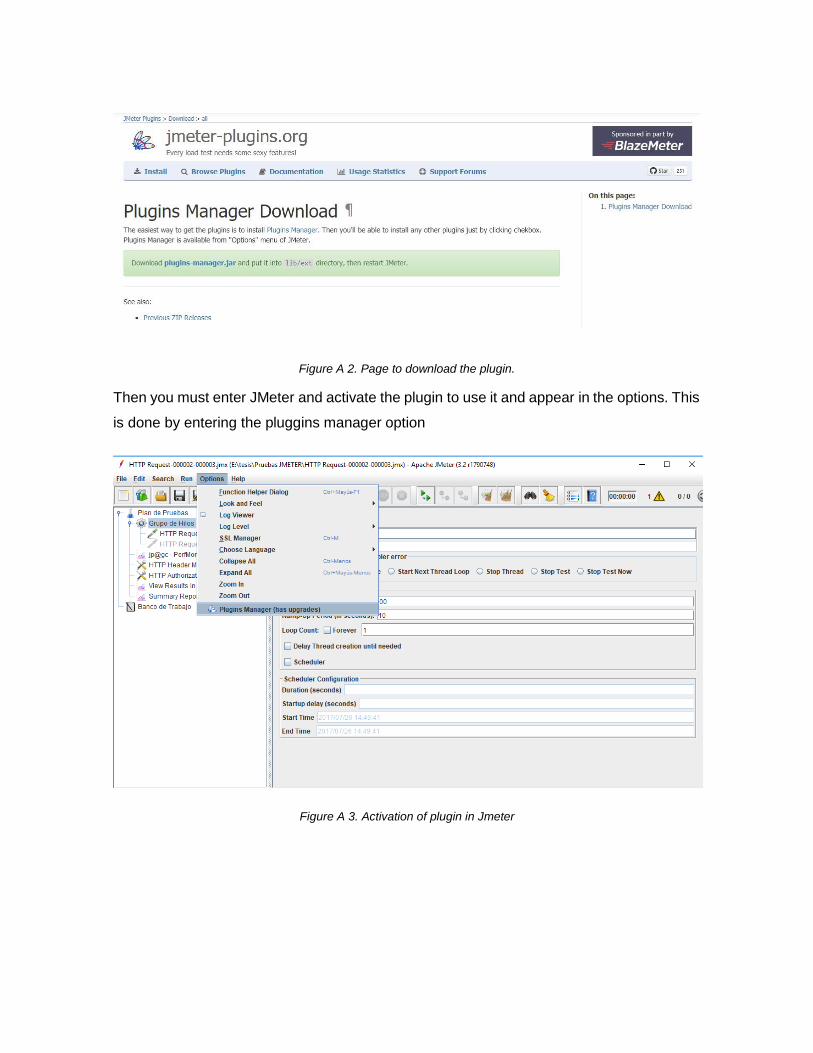
Figure A 2. Page to download the plugin.
Then you must enter JMeter and activate the plugin to use it and appear in the options. This
is done by entering the pluggins manager option
Figure A 3. Activation of plugin in Jmeter

When selecting this option we look for the Perfmon plugin (Server Performance Monitoring)
in the available pluggins tab. We select the button that says apply changes and restart
JMeter (For the example is already activated the pluggin, should only look in the following
tab).
Figure A 4. Selection of plugin.
Now it will be available in the software listener. A listener is an option that allows locating a
process when making the request so that we can review what we want (Latency, CPU,
memory and others). The listener will be seen in the following image.
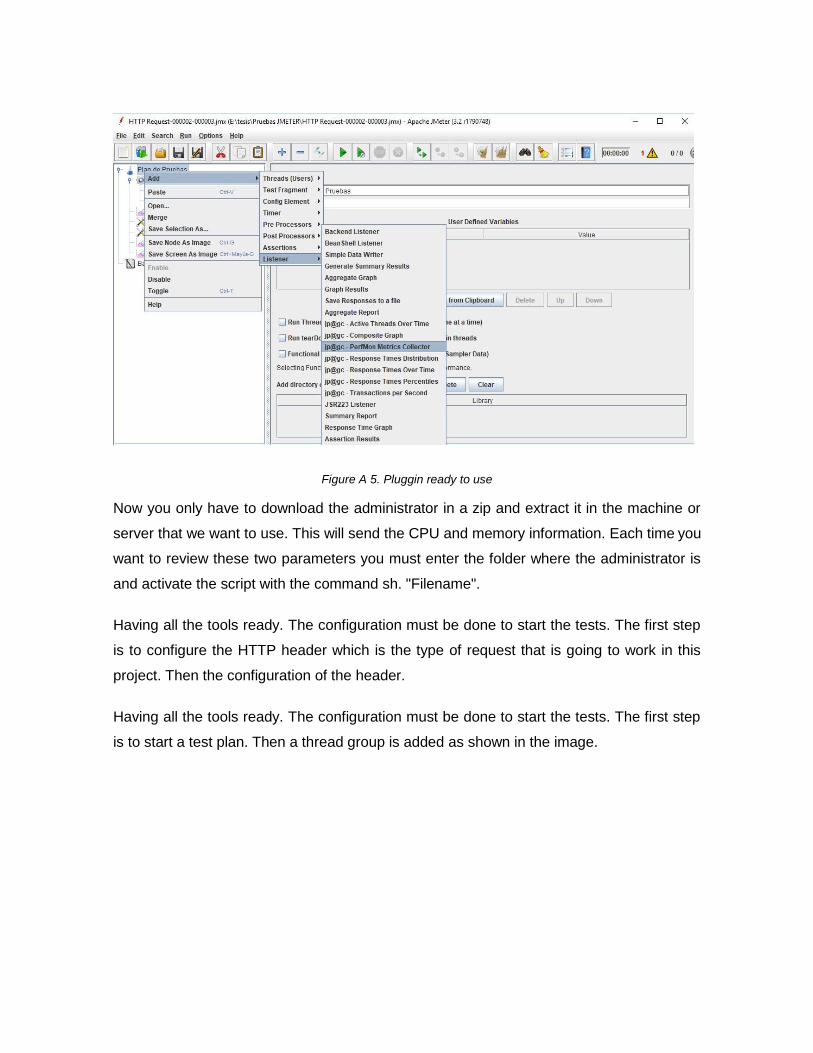
Figure A 5. Pluggin ready to use
Now you only have to download the administrator in a zip and extract it in the machine or
server that we want to use. This will send the CPU and memory information. Each time you
want to review these two parameters you must enter the folder where the administrator is
and activate the script with the command sh. "Filename".
Having all the tools ready. The configuration must be done to start the tests. The first step
is to configure the HTTP header which is the type of request that is going to work in this
project. Then the configuration of the header.
Having all the tools ready. The configuration must be done to start the tests. The first step
is to start a test plan. Then a thread group is added as shown in the image.

Figure A 6. Adding Thread Group for the test.
Then in that group of threads the whole configuration of the HTTP request is added. These
will be "HTTP Header Manager" and "HTTP Authorization Manager" as shown in the image.
Figure A 7. Adding the configuration elements of HTTP request.

Now the HTTP request is added. This selecting the group of threads and selecting in the
option "sampler" the check box of "HTTP request"
Figure A 8. Adding the HTTP request.
Now the listener is added for this project three were used. The first is the "summary report"
to see the percentage error of the requests made, the second is the "View results in a table"
by means of this you can obtain the latency of each request and to finish the "jp @ gc -
PerfMon Metric Collector" to see the percentage of CPU and memory used of the virtual
machine.
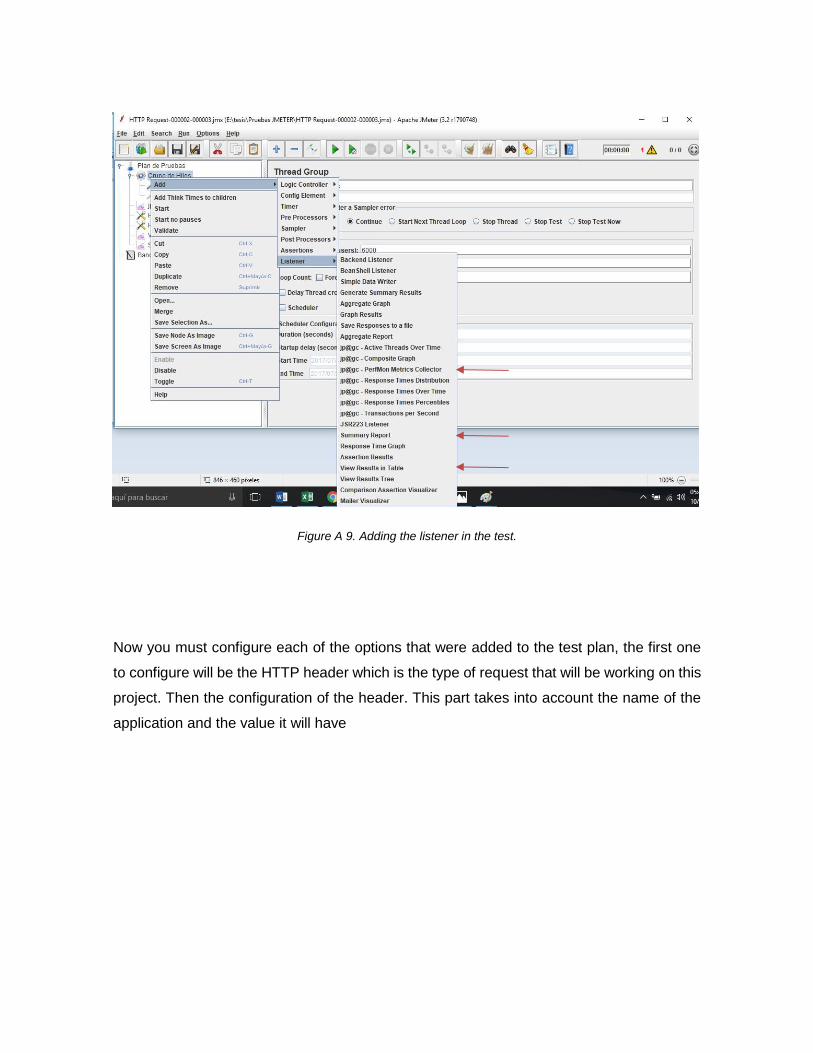
Figure A 9. Adding the listener in the test.
Now you must configure each of the options that were added to the test plan, the first one
to configure will be the HTTP header which is the type of request that will be working on this
project. Then the configuration of the header. This part takes into account the name of the
application and the value it will have

Figure A 10. Configuration of HTTP Header Manager.
Then the HTTP "Authorization Manager" is configured, this is the one that handles the
addressing of the request to the server in this case the Bucket and allows to enter with the
user and password.
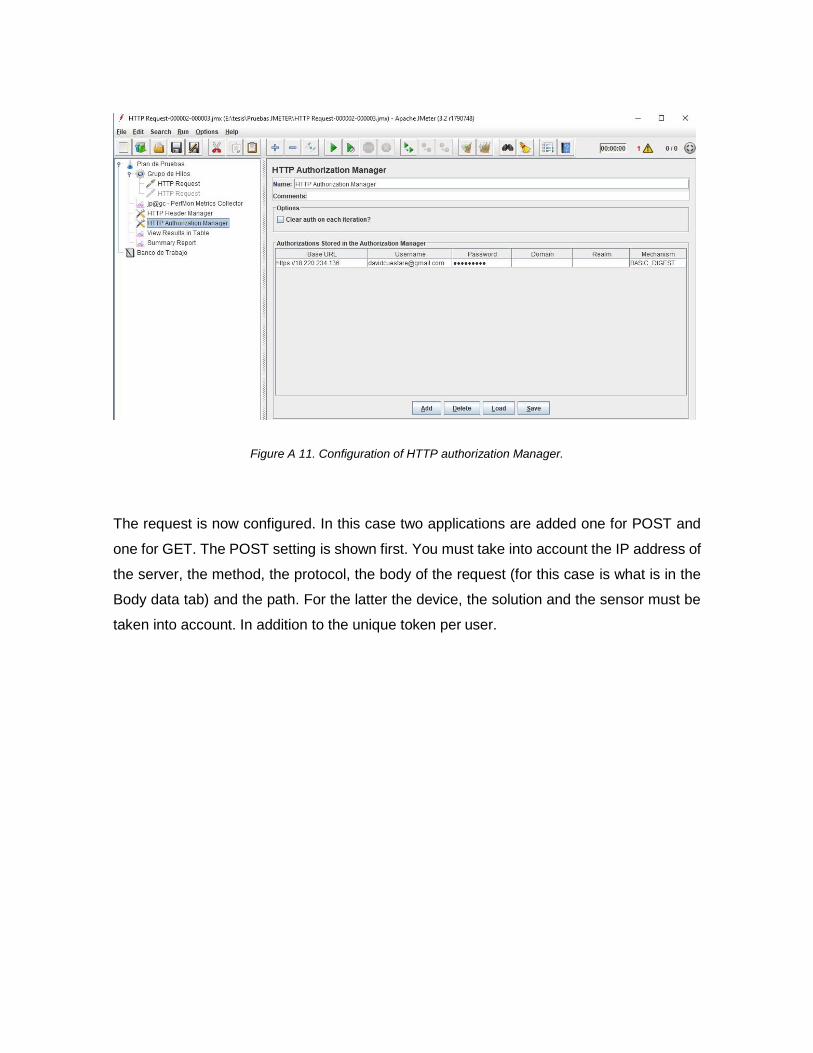
Figure A 11. Configuration of HTTP authorization Manager.
The request is now configured. In this case two applications are added one for POST and
one for GET. The POST setting is shown first. You must take into account the IP address of
the server, the method, the protocol, the body of the request (for this case is what is in the
Body data tab) and the path. For the latter the device, the solution and the sensor must be
taken into account. In addition to the unique token per user.
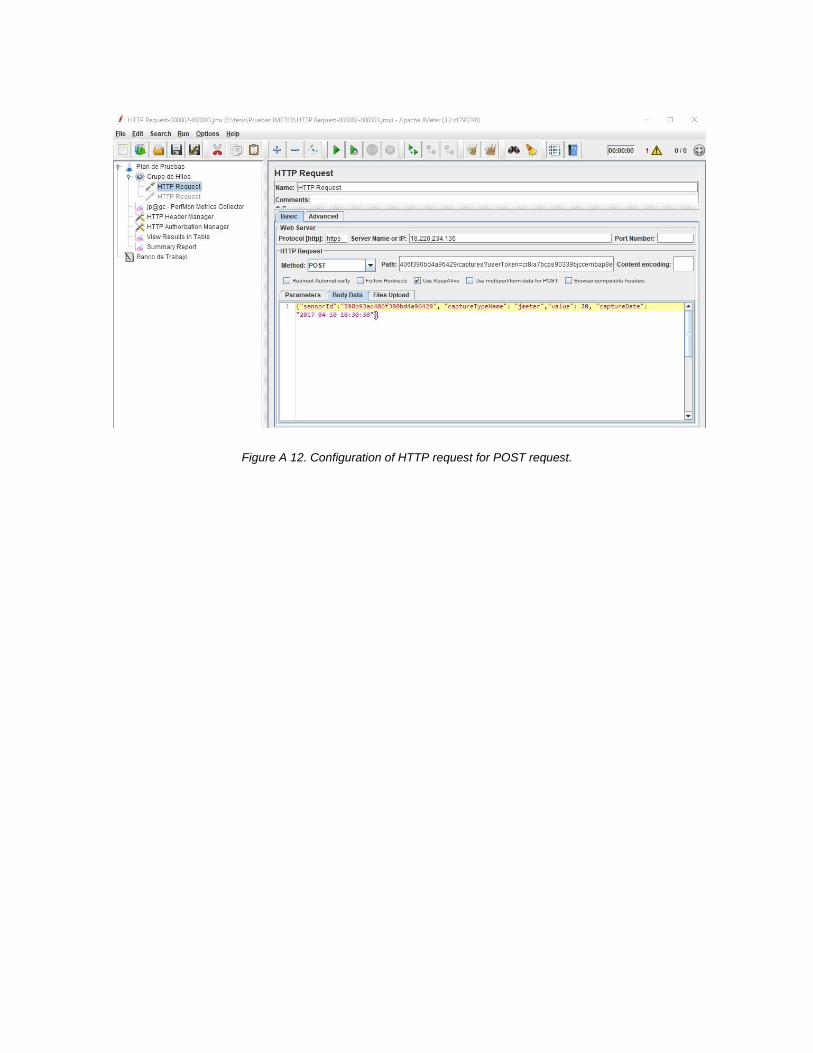
Figure A 12. Configuration of HTTP request for POST request.
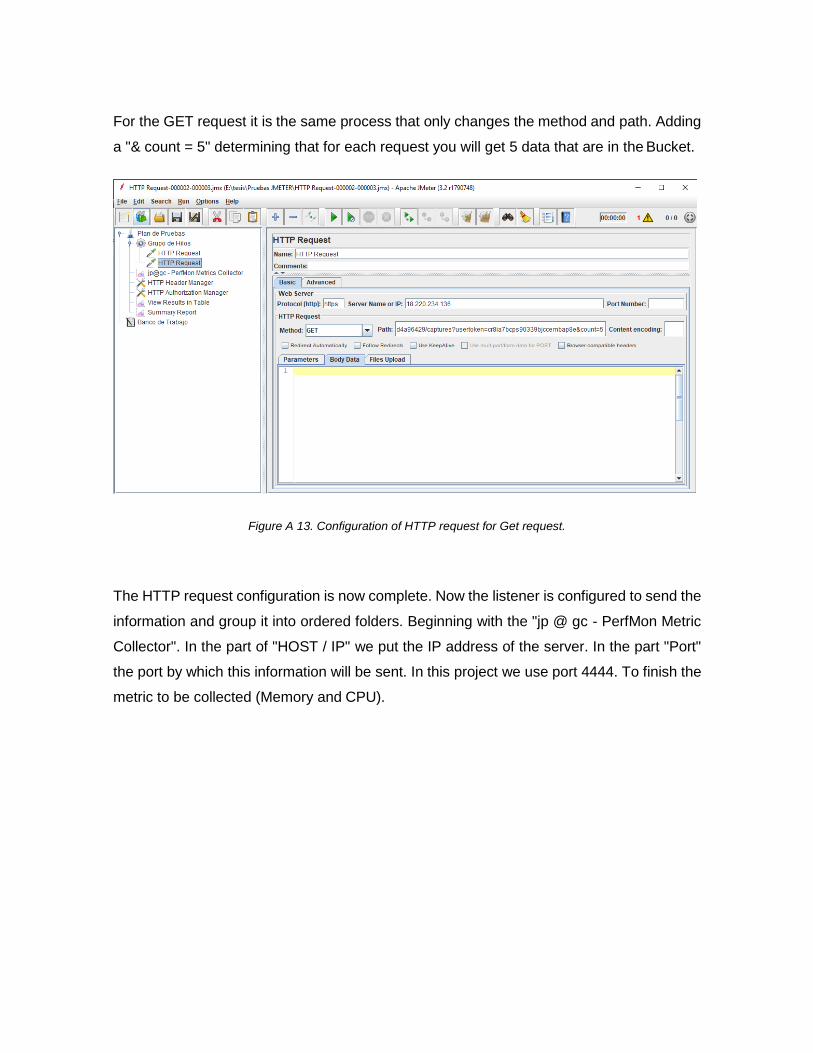
For the GET request it is the same process that only changes the method and path. Adding
a "& count = 5" determining that for each request you will get 5 data that are in the Bucket.
Figure A 13. Configuration of HTTP request for Get request.
The HTTP request configuration is now complete. Now the listener is configured to send the
information and group it into ordered folders. Beginning with the "jp @ gc - PerfMon Metric
Collector". In the part of "HOST / IP" we put the IP address of the server. In the part "Port"
the port by which this information will be sent. In this project we use port 4444. To finish the
metric to be collected (Memory and CPU).
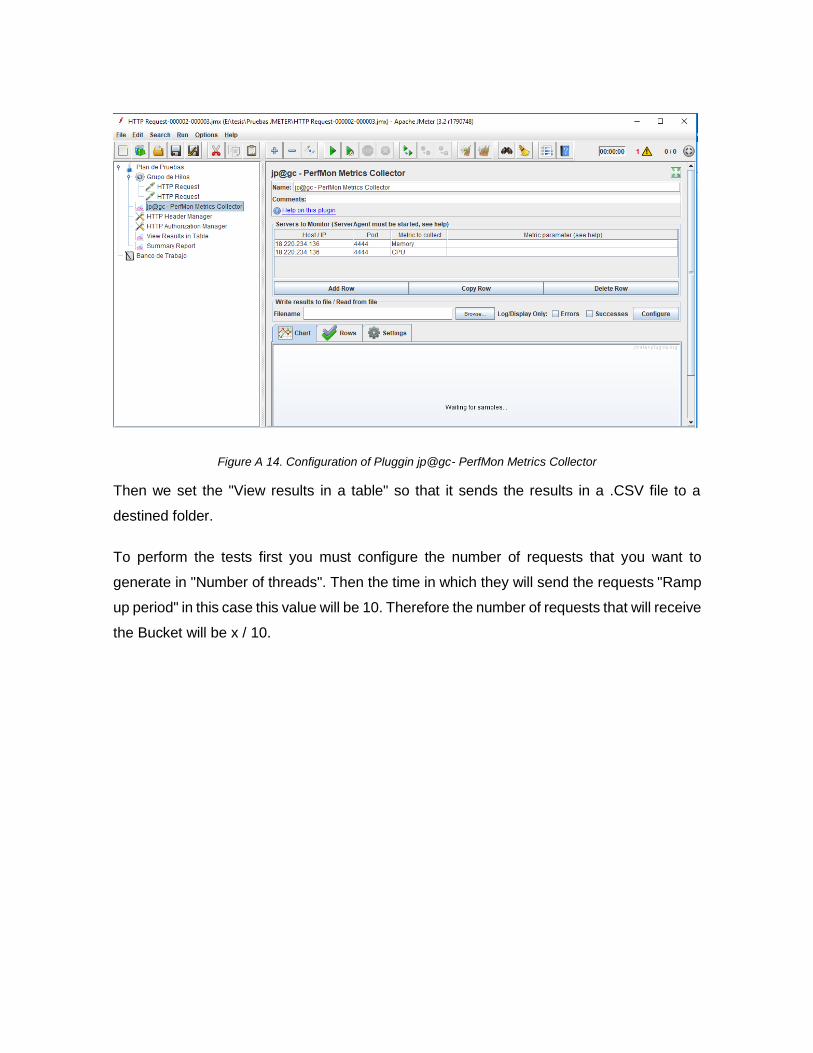
Figure A 14. Configuration of Pluggin jp@gc- PerfMon Metrics Collector
Then we set the "View results in a table" so that it sends the results in a .CSV file to a
destined folder.
To perform the tests first you must configure the number of requests that you want to
generate in "Number of threads". Then the time in which they will send the requests "Ramp
up period" in this case this value will be 10. Therefore the number of requests that will receive
the Bucket will be x / 10.

Figure A 15. Configuration of Thread Group.
You must activate the agent on the server to send the Bucket CPU and memory information.
That agent is activated as follows.
Figure A 16. Activation of Agent in the Bucket.
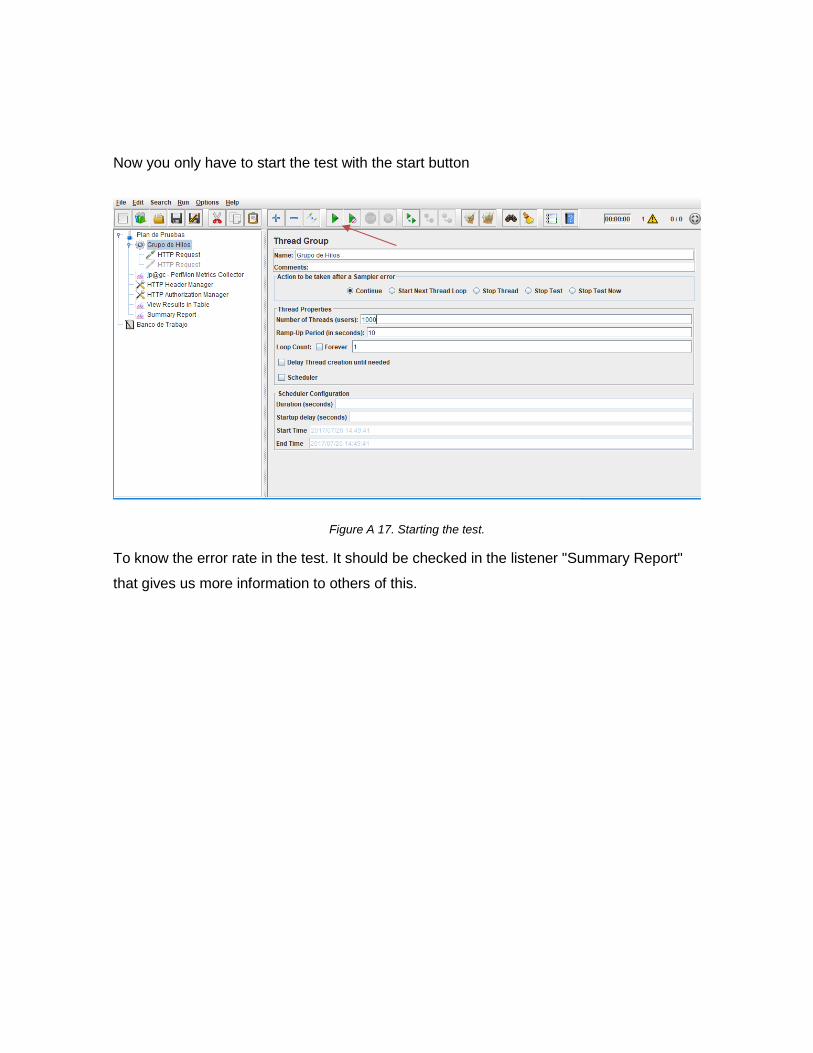
Now you only have to start the test with the start button
Figure A 17. Starting the test.
To know the error rate in the test. It should be checked in the listener "Summary Report"
that gives us more information to others of this.
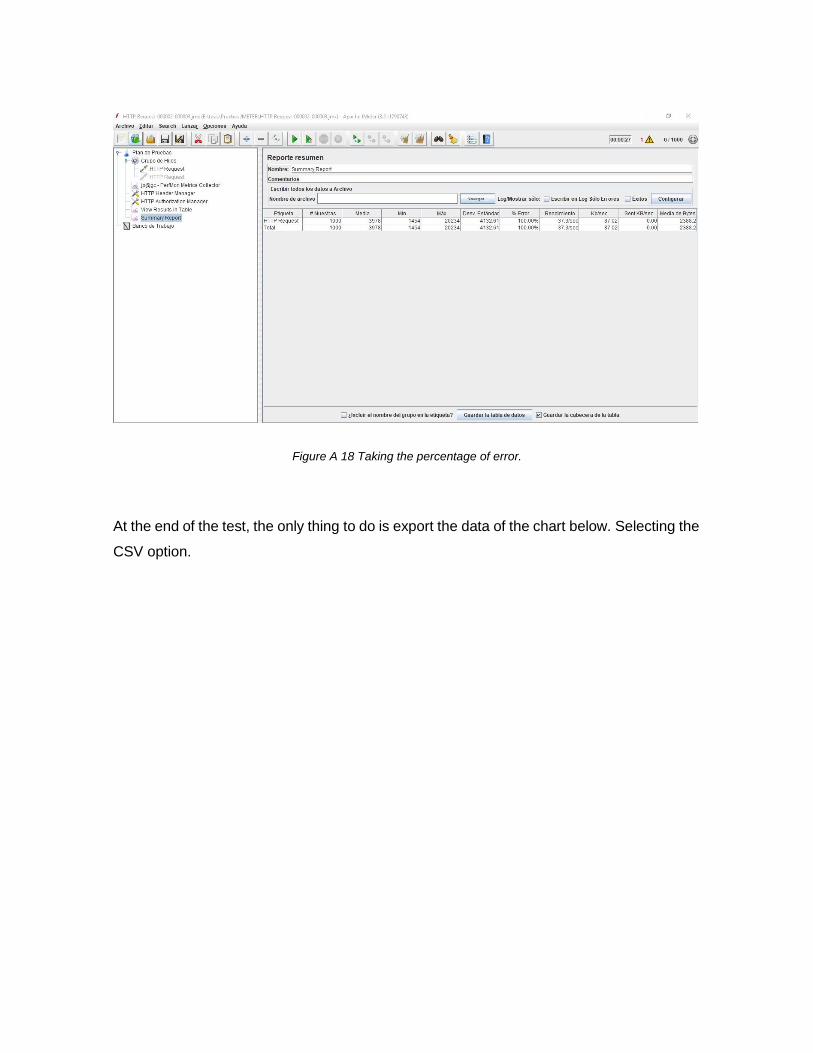
Figure A 18 Taking the percentage of error.
At the end of the test, the only thing to do is export the data of the chart below. Selecting the
CSV option.
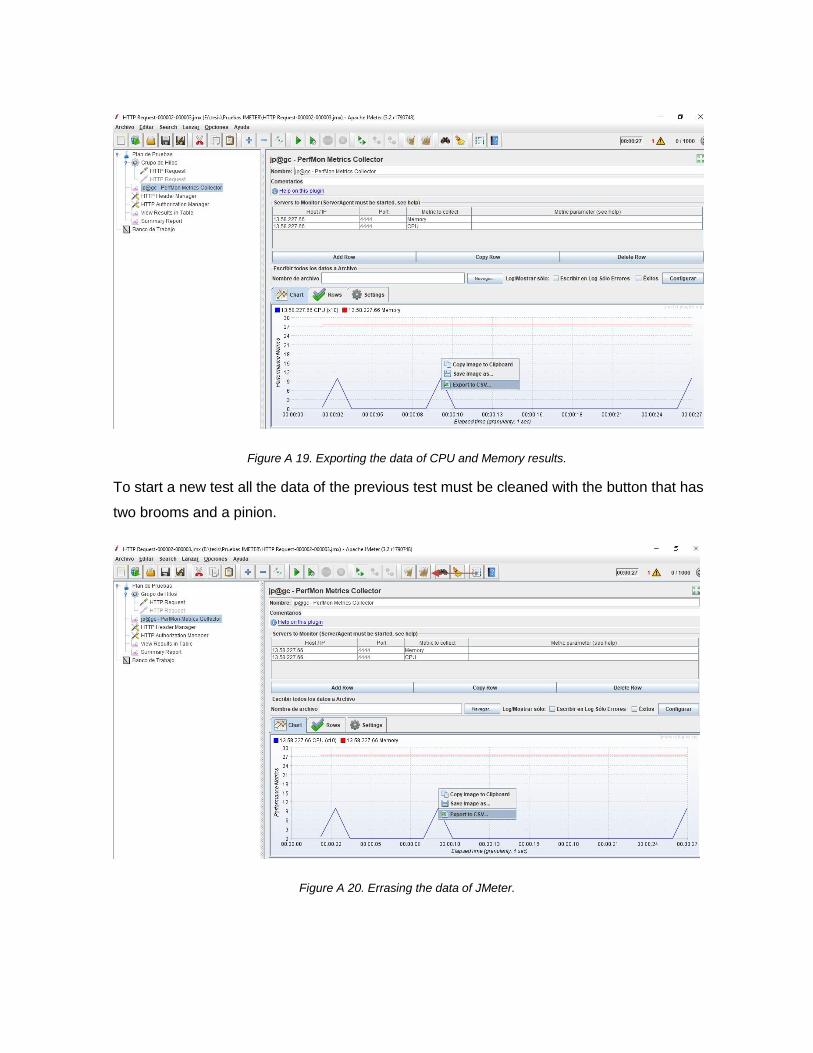
Figure A 19. Exporting the data of CPU and Memory results.
To start a new test all the data of the previous test must be cleaned with the button that has
two brooms and a pinion.
Figure A 20. Errasing the data of JMeter.

Now just change the number of threads in the "group of threads" tab and make the number
of purebas that are needed by repeating the previous processes of exporting and cleaning
of data.
ANNEX B. MANUAL OF AWS
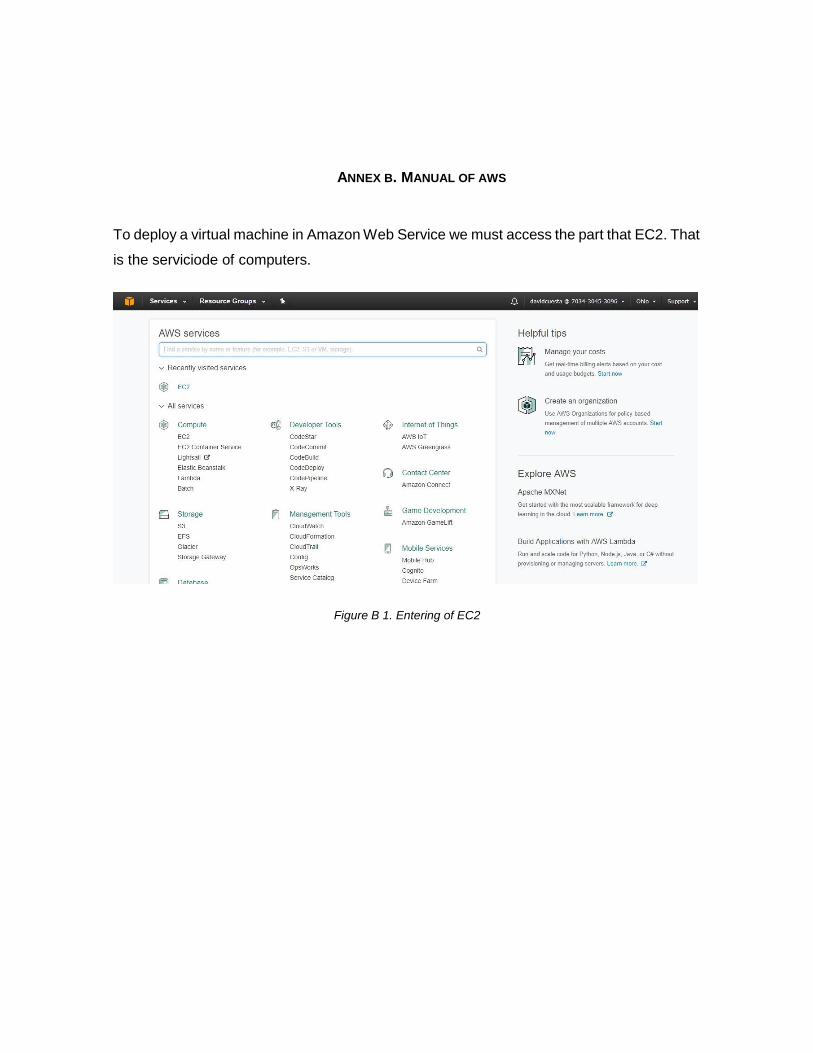
To deploy a virtual machine in Amazon Web Service we must access the part that EC2. That
is the serviciode of computers.
Figure B 1. Entering of EC2
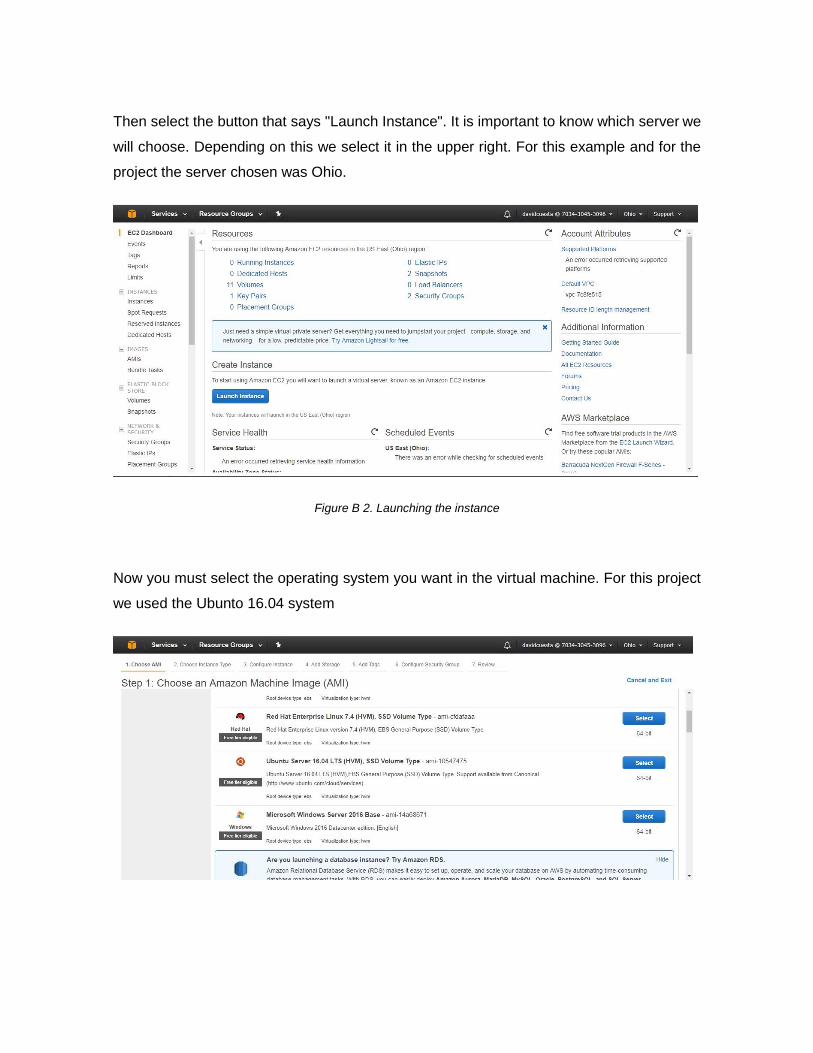
Then select the button that says "Launch Instance". It is important to know which server we
will choose. Depending on this we select it in the upper right. For this example and for the
project the server chosen was Ohio.
Figure B 2. Launching the instance
Now you must select the operating system you want in the virtual machine. For this project
we used the Ubunto 16.04 system

Figure B 3. Selecting the operating system
Now select the type of machine to be deployed. According to the type of machine that is
chosen there are certain resources that are increasing in these.
Figure B 4. Selecting the family of virtual machine
After selecting the type of machine you want, go to the "Add Storage" tab. This will load the
snapshot of a previous machine. Select the button that says "Add New Volume" and select
the snapshot already created. If this is the first machine to be created skip this step.
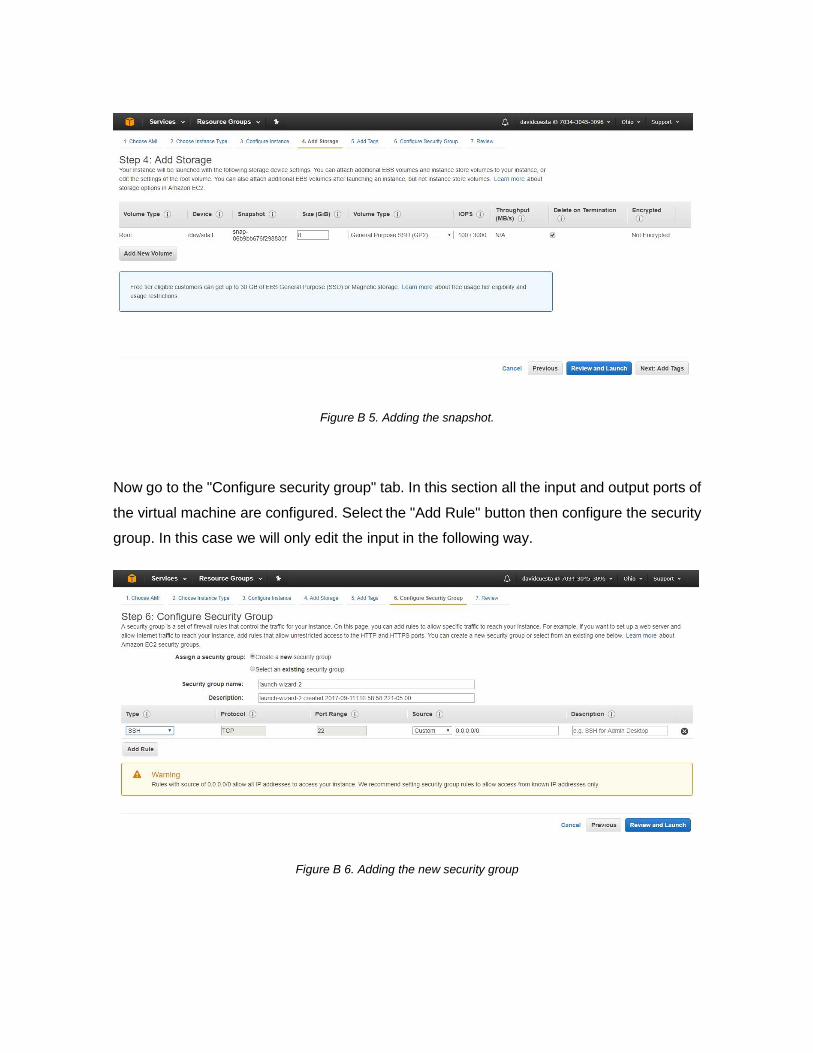
Figure B 5. Adding the snapshot.
Now go to the "Configure security group" tab. In this section all the input and output ports of
the virtual machine are configured. Select the "Add Rule" button then configure the security
group. In this case we will only edit the input in the following way.
Figure B 6. Adding the new security group

Figure B 7. Configuration of inbounds in virtual machine.
At the end of the deployment of the machine we can review the summary of the configuration
in the tab "Review"
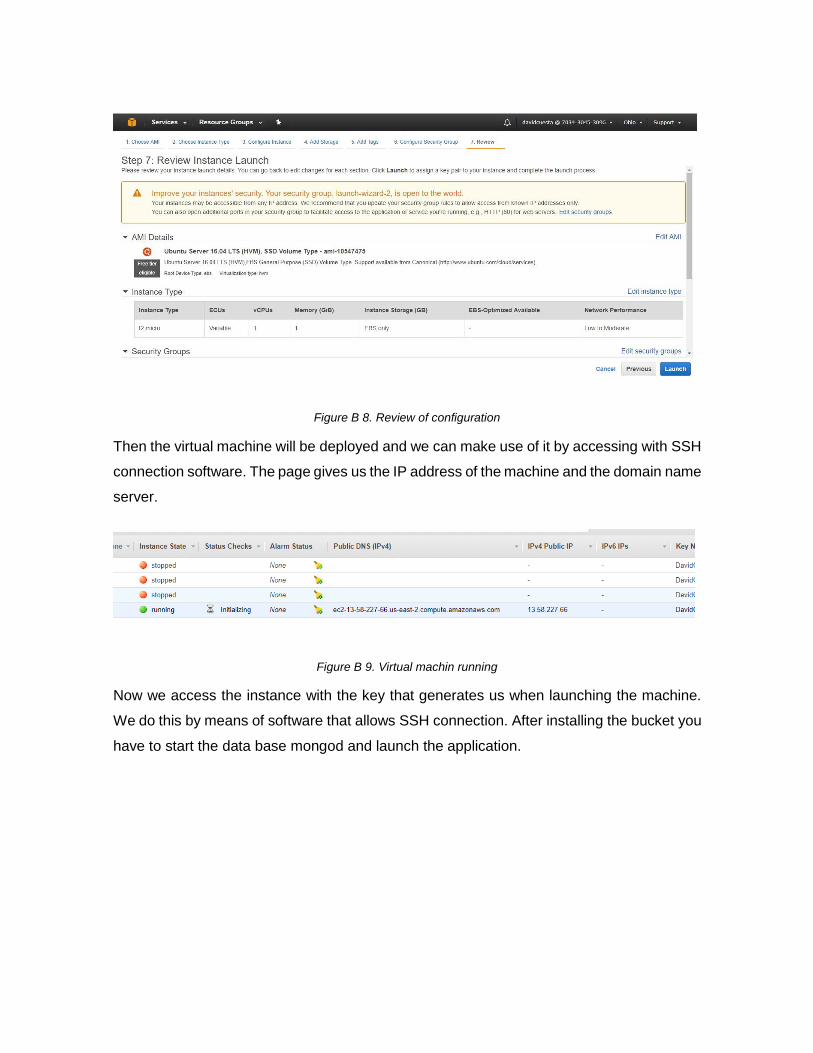
Figure B 8. Review of configuration
Then the virtual machine will be deployed and we can make use of it by accessing with SSH
connection software. The page gives us the IP address of the machine and the domain name
server.
Figure B 9. Virtual machin running
Now we access the instance with the key that generates us when launching the machine.
We do this by means of software that allows SSH connection. After installing the bucket you
have to start the data base mongod and launch the application.

Figure B 10. Activation of data base mongod
Figure B 11. Launching the application.
To collect the CPU and memory information with JMeter the agent must be activated as
follows.
Figure B 12. Starting the agent
You should now verify that the bucket Works. Entering from the browser with the IP address
of the virtual machine using htttp://IP:8080 in the search bar. The next page will appear

Figure B 13. Acces to the Bucket
We must select the "ADVANCED" button and select the part that said proceed.

Figure B 14 Acces to the bucket. Advanced button.

After doing this will appear the main page of the bucket.
Figure B 15 Main page of the Bucket.
Now you only have to log in and the user's unique token will appear.
Figure B 16. Token of user
This is the token that will be used to generate the GET and POST requests.
6 REFERENCES
[1] Z. M. J. Jiang, “Load Testing Large-Scale Software Systems,” Proc. - Int. Conf. Softw.
Eng., vol. 2, pp. 955–956.
[2] C. H. Kao, C. C. Lin, and J.-N. Chen, “Performance Testing Framework for REST-
Based Web Applications,” 2013 13th Int. Conf. Qual. Softw., pp. 349–354.
[3] M. Arslan, U. Qamar, S. Hassan, and S. Ayub, “Automatic performance analysis of
cloud based load testing of web-application & its comparison with traditional load
testing,” 2015 6th IEEE Int. Conf. Softw. Eng. Serv. Sci., vol. 2015–Novem, pp. 140–
144.
[4] T. Gao, Y. Ge, G. Wu, and J. Ni, “A Reactivity-based Framework of Automated
Performance Testing for Web Applications,” 2010 Ninth Int. Symp. Distrib. Comput.
Appl. to Business, Eng. Sci., no. 2, pp. 593–597.
[5] S. Barber, “Creating effective load models for performance testing with incomplete
empirical data,” Web Site Evol. Sixth IEEE Int. Work., pp. 51–59.
[6] R. Gao, Z. M. Jiang, C. Barna, and M. Litoiu, “A Framework to Evaluate the
Effectiveness of Different Load Testing Analysis Techniques,” 2016 IEEE Int. Conf.
Softw. Testing, Verif. Valid., pp. 22–32.
[7] J. H. Hill, D. C. Schmidt, A. A. Porter, and J. M. Slaby, “CiCUTS: Combining system
execution modeling tools with continuous integration environments,” Proc. - Fifteenth
IEEE Int. Conf. Work. Eng. Comput. Syst. ECBS 2008, no. 2, pp. 66–75.
[8] A. Hill, James H. Tambe, Sumant Gokhale, “Model-driven engineering for
development-time QoS validation of Component-based software systems,” Proc. Int.
Symp. Work. Eng. Comput. Based Syst., pp. 307–316.

[9] B. Vani, R. Deepalakshmi, and S. Suriya, “Web based testing — An optimal solution
to handle peak load,” 2013 Int. Conf. Pattern Recognition, Informatics Mob. Eng., pp.
5–10.
[10] D. a Menasce, “Load testing of Web sites,” IEEE Internet Comput., vol. 6, no. 4, pp.
70–74.
[11] I. Snellman, Niclas Ashraf, Adnan Porres, “Towards Automatic Performance and
Scalability Testing of Rich Internet Applications in the Cloud,” 2011 37th
EUROMICRO Conf. Softw. Eng. Adv. Appl., pp. 161–169.
[12] C. Patel and R. Gulati, “Identifying ideal values of parameters for software
performance testing,” 2015 Int. Conf. Comput. Commun. Secur. ICCCS 2015.
[13] J. H. Hill, “An architecture independent approach to emulating computation intensive
workload for early integration testing of enterprise DRE systems,” Lect. Notes
Comput. Sci. (including Subser. Lect. Notes Artif. Intell. Lect. Notes Bioinformatics),
vol. 5870 LNCS, no. PART 1, pp. 744–759.
[14] Y. Gu and Y. Ge, “Search-based performance testing of applications with composite
services,” 2009 Int. Conf. Web Inf. Syst. Mining, WISM 2009, pp. 320–324.
[15] F. I. Weyuker E.J.; Vokolos, “Experience with performance testing of software
systems: issues, an approach, and case study,” Softw. Eng. IEEE Trans., vol. 26, no.
12, pp. 1147–1156.
[16] G. H. Kim, H. C. Moon, G. P. Song, and S. K. Shin, “Software performance testing
scheme using virtualization technology,” Proc. 4th Int. Conf. Ubiquitous Inf. Technol.
Appl. ICUT 2009, pp. 2–6.
[17] C. Lutteroth and G. Weber, “Modeling a realistic workload for performance testing,”
Proc. - 12th IEEE Int. Enterp. Distrib. Object Comput. Conf. EDOC 2008, pp. 149–
158.
[18] D. C. Kung, C.-H. Liu, and P. Hsia, “An Object-Oriented Web Test Model for Testing

Web Applications,” Qual. Software, 2000. Proceedings. First Asia-Pacific Conf., pp. 111–
120.
[19] J. Hill, D. Schmidt, J. Edmondson, and A. Gokhale, “Tools for continuously evaluating
distributed system qualities,” IEEE Softw., vol. 27, no. 4, pp. 65–71.
[20] X. Meng, “Designing approach analysis on small-scale software performance testing
tools,” Proc. 2011 Int. Conf. Electron. Mech. Eng. Inf. Technol. EMEIT 2011, vol. 8,
pp. 4254–4257.
[21] Z. M. Jiang and A. E. Hassan, “A Survey on Load Testing of Large-Scale Software
Systems,” IEEE Trans. Softw. Eng., vol. 41, no. 11, pp. 1091–1118.
[22] A. Chakravarty, “Stress Testing an AI Based Web Service: A Case Study,” Inf.
Technol. New Gener. (ITNG), 2010 Seventh Int. Conf., pp. 1004–1008.
[23] D. Krishnamurthy, J. Rolia, and S. Majumdar, “SWAT : A Tool for Stress Testing
Session-based Web Applications Department of Systems and Computer Engineering
,” Serv. Manag., pp. 1–12.
[24] G. Casale, A. Kalbasi, D. Krishnamurthy, and J. Rolia, “Automatic stress testing of
multi-tier systems by dynamic bottleneck switch generation,” Lect. Notes Comput.
Sci. (including Subser. Lect. Notes Artif. Intell. Lect. Notes Bioinformatics), vol. 5896
LNCS, pp. 393–413.
[25] M. Kalita and T. Bezboruah, “Investigation on performance testing and evaluation of
PReWebD: a .NET technique for implementing web application,” IET Softw., vol. 5,
no. 4, p. 357.
[26] J. Zhang, S. Cheuni, and S. T. Chanson, “Stress Testing of Distributed Multimedia
Software Systems.”
[27] D. Krishnamurthy, J. A. Rolia, and S. Majumdar, “A synthetic workload generation
technique for stress testing session-based systems,” IEEE Trans. Softw. Eng., vol.
32, no. 11, pp. 868–882.
[28] V. Garousi, “Traffic-aware Stress Testing of Distributed Real-Time Systems Based
on UML Models in the Presence of Time Uncertainty,” 2008 Int. Conf. Softw. Testing,
Verif. Valid., pp. 92–101.
[29] H. Lewitschnig and I. Technologies, “New Model For Stress Tests Without Failures,”
vol. 1, no. 1.
[30] H. Liu and A. R. Reibman, “Software to Stress Test Image Quality Estimators,” 2016
8th Int. Conf. Qual. Multimed. Exp. QoMEX 2016.
[31] «Amazon Web Service,» Amazon , 10 06 2008. [En línea]. Available: https://us-east-
2.console.aws.amazon.com/ec2/v2/home?region=us-east-2#LaunchInstanceWizard:.
[Último acceso: 11 09 2017].
[32] F. D. Sánchez, Cloud Brokering, Bogotá: Ediciones USTA, 2016.
[33]«Amazon Web Service,» Amazon, 10 06 2008. [En línea]. Available:
https://aws.amazon.com/ec2/pricing/on-demand/. [Último acceso: 11 09 2017].
