performance evaluation of gaza waste water treatment plant · performance evaluation of gaza waste...
TRANSCRIPT

Performance Evaluation of Gaza Waste
water Treatment Plant
By Majed M. Ghannam
Supervised By Prof. Samir A. Afifi
A Thesis Submitted in Partial Fulfillment of the Requirement for the Degree of Master of Science in Water Resources Management
The Islamic University – Gaza – Palestine
2006-1427
Islamic University-Gaza
Deanship of Graduate Studies
Faculty of Engineering
Water Resources Management
<íéÚø{{‰ý]<í{{ÃÚ^¢]–ìˆ{{Æ<<
<{{{{‰]…‚Ö]<ì^{{{{ÛÂ^{{{{é×ÃÖ]<l^<
<í{{{{{{{{{{{{{‰‚ß]<í{{{{{{{{{{{{{é×Ò<
<<å^{{{é¹]<…^’{{{Ú<ì…]c<ÜŠ{{{Î<

I
ACKNOWLEDGMENT
First of all I praise Allah for blessings and guidance in fulfilling this goal. I would
like to thank all those who have assisted, guided and supported me in my studies leading to
this thesis. The author graciously appreciates the continued support and dedication of his
supervisor, Pro. Samir Afifi . The combined experience and insight have greatly impacted
and influenced the author in his studies and in writing this thesis.
Special appreciation to teaching members committee in Water Resources
Management Programm, Dr. Hamed Al-Nakhal, Dr. Mohammed Al-Agha, Dr.
Mohammed Zeyara, Dr. Mohammed Saqir, and Dr. Khalil Tbail for the ethical and
scientific knowledge that are transferred to us.
I would like to express my sincere appreciation to Mr. Ashraf Mushtaha-
Palestinian Water Authority who helped me in the graphs preparation .
Head of GWWTP lab, Mr. Jawdat Al-Dalo is thanked for cooperation to facilitate
author access to the treatment plant records and helped with his experience in the analysis
of data.
Special thanks to my special friends, Dr. Saeed Ghabayen and Mr. Marwan Al-
Bardawil and Mr. Yehia Obaid who encouraged me to succeed, reviewed my work and
helped in the calculations .
Many thanks to Dr. Abedel-Majeed Nassar, Dr. Fahed Rabah , who many times
answered questions and gave assistance for the author.

II
ABSTRACT
Wastewater treatment plant at Gaza and its infiltration basins are considered the
primary sources of pollution for the ground water and sea water. The historical records of
Gaza Wastewater Treatment Plant from January 2000 to October 2004 were collected and
evaluated to assess the system performance in term of removal efficiency for the Bio-
Filter-Aerated Lagoon combined system. This study attempts to highlight the factors
leading to the inadequate performance of GWWTP in removing organic matter, solids,
nutrients and microorganisms. The efficiency of the different stages of the treatment
process and the overall plant performance has been demonstrated.
Collection and analysis of available historical data revealed a constantly
decreasing removal efficiency of biochemical oxygen demand (BOD), chemical oxygen
demand (COD), total suspended solids (TSS) and fecal coli form (FC). Analysis of data
showed that the combined system removal reached 91%,87%,88%,97.5% and 21.5% of
the influent BOD5,COD,TSS,FC and TKN respectively with an effluent concentration of
35.2 mg/l,110 mg/l,53 mg/l,7.73E+6 and 69.2 mg/l. The decrease in the removal efficiency
of the pollutants appeared to be due to the increase in the hydraulic and organic load that
exceeded treatment plant designed capacity, inaccurate design parameters and inadequate
operation.
Over hydraulic and organic loading, increasing values of TSS than normal values,
inadequate design of the plant and inadequate plant management are the main factors
behind the drop in the treatment system performance. The study presents proposals like the
construction of another anaerobic lagoon and a grit chamber and splitting the flow equally
between the trickling filters and the aeration lagoon along with the construction of another
final settling tank which can be introduced as short, simple and economic solutions to
overcome and improve the inefficient and poor treatment plant performance.

III
الخالصة
تعتبر محطة معالجة المياه العادمة لمدينة غزة وأحواض الترسيب الملحقة بها المصدر
لقد تم تجميع وتحليل السجالت التاريخية السابقة لمحطة . الرئيسي لتلوث مياه البحر والخزان الجوفي
وذلك لعمل دراسة لكفاءة أداء المحطة من 2004 وحتى أآتوبر 2000معالجة المياه العادمة من يناير
وتسلط . البيولوجي) الفلتر(حيث آفاءة إزالة الملوثات للنظام المرآب من األحواض الهوائية والمصفى
هذه الدراسة الضوء على العوامل التي تؤدي إلى خفض آفاءة تشغيل محطة معالجة المياه العادمة
وقد تم استعراض . مواد العضوية، والمواد الصلبة، والمغذيات واألحياء الدقيقةلمدينة غزة من حيث ال
. آفاءة آل مرحلة من مراحل المعالجة المختلفة على حدة وآذلك الكفاءة الكلية للمحطة آكل
أظهرت نتائج تجميع وتحليل البيانات التاريخية المتوفرة تراجعا ثابتا في آفاءة إزالة األآسجين
. حيويًا واألآسجين المستهلك آيماويا والمواد الصلبة العالقة باإلضافة إلى البكتيريا القولونيةالمستهلك
من األآسجين المستهلك حيويًا، % 91ومن خالل تحليل البيانات، أزال نظام المعالجة في محطة غزة
من البكتيريا % 97.5من المواد الصلبة المعلقة، و % 88من األآسجين المستهلك آيماويًا، و % 87و
من نيتروجين آلدال الكلي، وقد آان ترآيز هذه المواد في المياه الخارجة من % 21.5القولونية و
لتر / ملجم115لتر ، / ملجم35.2: المحطة بعد عملية المعالجة خالل فترة الدراسة على الترتيب آالتالي
ود السبب في انخفاض آفاءة ويع. لتر/ ملجم69.2 مل ، 100/ وحدة X 106 73لتر ، / ملجم53،
إزالة الملوثات إلى زيادة الحمل الهيدروليكي والعضوي اللذان يتعديان قدرة المحطة، باإلضافة إلى
. األخطاء في معطيات التصميم والتشغيل
ة عن صلبة العالق واد ال يم الم اد ق وقد خلصت الدراسة إلى أن زيادة الحمل الهيدروليكي، وازدي
سة حدودها المعتادة، شغيل المحطة هي العوامل الرئي وعدم دقة التصميم وآذلك األخطاء في إدارة وت
شاء حوض . التي أدت إلى انخفاض أداء نظام المعالجة ل إن دمت الدراسة بعض االقتراحات مث د ق وق
ضوية وحوض ر الع ين الفالت ساو ب شكل مت اه ب ع المي ة وتوزي ة أترب اة إزال شاء قن وائي، وإن ر اله آخ
ع المعالجة سيطة وقصيرة المدى لرف صادية ب ول اقت د آحل الهوائية مع إنشاء حوض ترسيب نهائي جدي
. آفاءة المحطة وتحسين أدائها

IV
DEDICATION
I would like to dedicate this thesis to my parents to whom I owe everything since I
was born.
Also, this thesis is dedicated to my wife who supported and encouraged me at all
stages of my study, and for my beloved suns: Khalid and Basil, and beloved daughters Asil
and Lama who have been a great source of motivation and inspiration.
Finally, this thesis is dedicated to my brothers, sisters, friends, colleagues at the
Coastal Municipalities Water Utility, and all those who believe in the richness of learning.
Majed M.Ghannam
V
Table of Contents
ACKNOLEDGEMENT I
ABSTRACT II
ABSTRACT (ARABIC) III
DEDICATION IV
TABLE OF CONTENTS V
LIST OF TABLES VIII
LIST OF FIGURES IX
LIST OF ABBREVIATIONS AND ACRONYMS XI
CHAPTER (1): INTRODUCTION 1
1.1 BACKGROUND 1
1.2 Wastewater treatment facilities in the Gaza Strip 2
1.3 Problem Identification 3
1.4 Problem Identification 4
1.5 Methodology 4
1.5.1 Data Collection 4
1.5.2 Analysis of Data 5
1.5.3 Assessment of Data Reliability 5
1.5.4 Human Error 5
1.5.5 Instruments' Accuracy 6
1.5.6 Sampling Procedure 6
1.5.7 Reliability of Data 6
1.5.8 Data Filtration 6
CHAPTER (2): STUDY AREA 8
2.1 Location and Population 8
2.2 Administration 8
2.1.3 Climate 10
2.1.4 Land Ownership and Land Use 10
2.2 Sewerage system and coverage 12
2.3 The Gaza Wastewater Treatment Plant 12
2.3.4 Existing Operation Condition 16
2.3.6 Research Contribution to GWWTP 17
CHAPTER (3): LITERATURE REVIEW 18
3.1 Historical development of original design and related studies 18
3.1.1 Studies Conducted on GWWTP for Upgrading 20
3.1.2 Deficiencies of the previous studies and assessments of GWWTP 22
3.2 Treatment Process Evaluation 23
3.3 Industrial Wastewater Generation 24

VI
3.4 Trickling Filter-Aerated Lagoon Combined System 24
3.4.1 Advantages and disadvantages of Trickling Filters 25
3.4.2 Function of Trickling Filters 26
3.4.3 Removal Efficiency and Mechanisms in T.F. 26
3.4. 4 Aerated Lagoons System 27
3.4.4.1 BOD Removal 29
3.5 Alternative Treatment Systems 29
3.5.1 Anaerobic Ponds 29
3.5.2 Aerobic Lagoons 30
3.5.3 Natural Systems 30
3.5.4 Rotating Biological Contactors (RBC) 30
3.5.5 Oxidation Ditch 30
3.5.6 Sequencing Batch Reactor (SBR) 31
3.5.7 Lagoon Clarification 31
Chapter 4: RESULTS AND DISCUSSION 32 4.1 Total System Performance of GWWTP. 32
4.1.1 Biochemical Oxygen Demand (BOD5) 33
4.1.2 Chemical Oxygen Demand (COD) 37
4.1.3 Total Suspended Solids (TSS) 39
4.1.4 Total Suspended Solids (TSS) 42
4.1.5 Total Kjeldhal Nitrogen (TKN) 44
4.1.6 Faecal Coli form (FC) 46
4.2 Performance of each of the GWWTP Components 47
4.2.1 Initial Sedimentation Lagoons 1&2 50
4.2.2 Anaerobic Lagoon 3 51
4.2.3 Bio-Tower 51
4.2.4 Aerated Lagoon 53
4.2.5 Final Sedimentation Tank 54
4.3 Proposed System Modifications 54
4.3.1 Hydraulic Capacity Proposed Modification 54
4.3.1.1 Alternative 1: Addition of a new Anaerobic Lagoon 55
4.3.1.2 Alternative 2: Bio-tower 55
4.3.3.3 Alternative 3: Activated Sludge 57
4.3.2 Proposed Modification for TSS Removal Efficiency 62
4.3.3 Proposed Flow Scheme 63
4.3.4 Plant Management 65

VII
CHAPTER 5: CONCLUSIONS AND RECOMMENDS 66
5.1 Conclusions 66
5.2 Recommendations 67
Glossary 69
References 73
ANNEXES 78
A NNEX A A-1
ANNEX B B-1
ANNEX C C-1
ANNEX D D-1
ANNEX E E-1
ANNEX F F-1
ANNEX G G-1
ANNEX H H-1

VIII
LIST OF TABLES
Table 2.1 Treatment Upgrading Options 19 Table 4.1 The average annual flow of GWWTP for the period from 2000 to 59 2004. Table 4.2 The Evaluation Criteria and their Weights According to 60 Questionnaire. Table 4.3 Comparison between the three proposed alternatives of treatment The GWWTP modification 72 Table 4.4 The weighted evaluation of the three criteria according to the proposed criteria. 61
IX
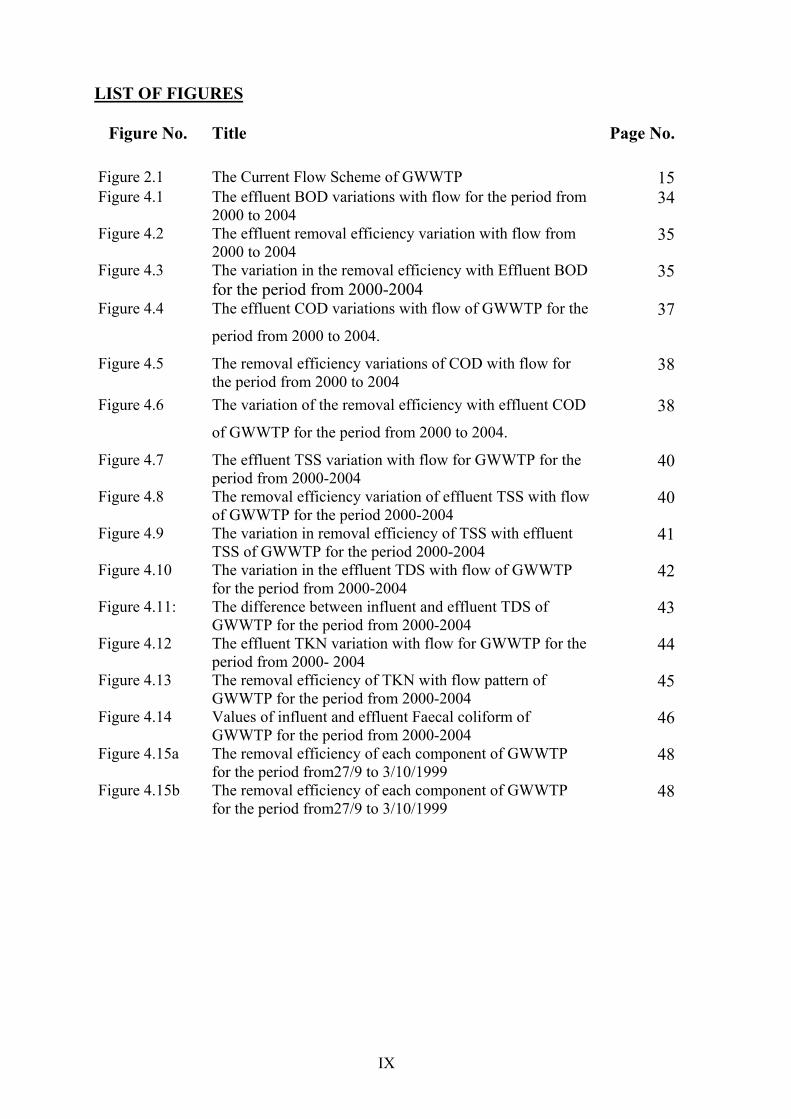
LIST OF FIGURES
Page No. TitleFigure No.
15 The Current Flow Scheme of GWWTPFigure 2.134 The effluent BOD variations with flow for the period from
2000 to 2004 Figure 4.1
35 The effluent removal efficiency variation with flow from 2000 to 2004
Figure 4.2
35 The variation in the removal efficiency with Effluent BOD for the period from 2000-2004
Figure 4.3
37 The effluent COD variations with flow of GWWTP for the
period from 2000 to 2004.
Figure 4.4
38 The removal efficiency variations of COD with flow for the period from 2000 to 2004
Figure 4.5
38 The variation of the removal efficiency with effluent COD
of GWWTP for the period from 2000 to 2004.
Figure 4.6
40 The effluent TSS variation with flow for GWWTP for the period from 2000-2004
Figure 4.7
40 The removal efficiency variation of effluent TSS with flow of GWWTP for the period 2000-2004
Figure 4.8
41 The variation in removal efficiency of TSS with effluent TSS of GWWTP for the period 2000-2004
Figure 4.9
42 The variation in the effluent TDS with flow of GWWTP for the period from 2000-2004
Figure 4.10
43 The difference between influent and effluent TDS of GWWTP for the period from 2000-2004
Figure 4.11:
44 The effluent TKN variation with flow for GWWTP for the period from 2000- 2004
Figure 4.12
45 The removal efficiency of TKN with flow pattern of GWWTP for the period from 2000-2004
Figure 4.13
46 Values of influent and effluent Faecal coliform of GWWTP for the period from 2000-2004
Figure 4.14
48 The removal efficiency of each component of GWWTP for the period from27/9 to 3/10/1999
Figure 4.15a
48 The removal efficiency of each component of GWWTP for the period from27/9 to 3/10/1999
Figure 4.15b

X
Page No TitleFigure No.
50 Cumulative BOD5 removal efficiency of GWWTP components for
the period of February and June 2003.
Figure 4.16
51 The measured removal efficiency of GWWTP Bio-Tower throughout the years 1999,2002 and 2003
Figure 4.17
53 The removal efficiency of Aerated Lagoons of GWWTP for the period from September to October 1999
Figure 4.18
56 flow diagram for Alternative 2: Addition of a new trickling filter
Figure 4.19
58 flow diagram for Alternative 3: Activated Sludge optionFigure 4.20 64 The proposed flow scheme of GWWTP
Figure 4.21

XI
LIST OF ABBREVIATIONS AND ACRONYMS
0C Degrees Celsius.
Cl Chloride
BOD5 5 days Biochemical Oxygen Demand.
CAMP Coastal Aquifer Management Program. cfu Colony Forming Units
COD Chemical Oxygen Demand
Conc. Concentrated
EQA Environment Quality Authority.
FC Faecal Coliform.
GIS Geographic Information System
GWWTP Gaza Wastewater Treatment Plant
h Hour
hp Horse Power
KfW The German Bank of International Development
KW Kilo Watt
L Liter
Lv Volumetric Loading
Lab Laboratory
l/c/d Liter Per Capita Per Day
m3 Cubic meter
mm Millimeter
MCM Million Cubic Meter
m3/h Cubic Meter Per Hour

XII
mg/l Milligrams per Liter
MOG Municipality Of Gaza
MOPIC Ministry Of Planning and International Corporation.
NH3 Ammonia
NO3 Nitrates
PCBS Palestinian Central Bureau of Statistics.
ppm Parts Per Million
P.S. Pumping Station
PWA Palestinian Water Authority
TDS Total Dissolved Solids
Temp. Temperature
TKN Total Kjeldhal Nitrogen
TSS Total Suspended Solids
UNDP United Nations Development Program
UNRWA United Nations Relieve and Work Agency
U.S $ United States Dollar
USAID Unites States Agency for International Development
WHO World Health Organization
WWTP Wastewater Treatment Plant

A.1ِ
CHAPTER (1): INTRODUCTION
1.1 Background
Gaza Strip (GS) has a coastline of 40 km at the eastern extreme of the
Mediterranean and on the edge of the Sinai Desert. GS has a total area of 365 square
kilometers (MOPIC, 1998) and the population is estimated to be around 1,500,000
people.
There are more than 7000 wells (PWA, 2004) existing in Gaza strip most of
which is privately owned and used for agricultural purposes. In most regions, over
pumping has resulted in extractions greatly exceeding replenishment which in turn
has caused the saltwater interface to move inland (CAMP,2001). Continuing over
pumping for agricultural and domestic use will deplete the fresh water aquifer
resulting in its replacement with sea water. The extractions for agricultural purposes
now exceed 80 million cubic meters (MCM) per year, while rainfall replenishment is
only about 40-50 Mcm per year ( Al-Jamal, K and Yaqubi, 2003) Agricultural return
flows are about 20 MCM and often carry pesticides and nitrates, a major pollutant in
the upper levels of the aquifer (CAMP, 2001). Also, sea water intrusion has caused
the closing of many wells (CAMP, 2001)
Surface water in Gaza strip consists mainly of wadi Gaza, which originates in
the Negev Desert, is the major one. Its catchments area is about 3500 km2 (CAMP,
2001). The estimated average annual flow of Wadi Gaza is 20 to 30 MCM (PWA,
1997). When surface runoff occurs, it occurs during a limited number of days.
Presently, surface water resources are not anymore available in the Gaza Strip due to
Israeli violations.
Groundwater in the Gaza Strip is a confined Pleistocene age costal aquifer and
divided into three sub-aquifers composed mainly of sandstone and pebbles (PWA,
1997). The sub-aquifers overlie each other and are separated by impervious and/or
semi-pervious clay and clayey layers. The thickness of the aquifer in eastern boundary
is about 10 m and increasing gradually to about 150 m at the cost. The pumping test
results indicate that the aquifer is highly permeable with a transmissivity of about
1000 m2/day and an average porosity of 25% (PWA, 1997). Depth to the water level
ranges from 8 to 90 meters in West and the East of the Gaza Strip respectively (PWA,
1997).

A.2ِ
Thirty years of deteriorating infrastructure and negligence, over the period
1967-1994, lead to inadequate investment in the various environmental sectors,
particularly water, wastewater, sanitation and solid waste (Kelly & Dioxin, 1995).
Overpopulation is also a major challenge that creates additional pressure, especially
on the limited natural resources in the area and has a profound impact on the quality
of health and social life of people (Coad, 1997; MOH, 2002). During the period some
of existing infrastructure deteriorated while the population and their needs rapidly
increased. This leads to environmental degradation on almost every aspect (El-Hawi,
M. and Hamilton, A. 2001). Quality of the groundwater is a major problem in Gaza
strip. ِِAccess to sewerage facilities, at present, varies from areas to areas. On average,
it is estimated that about 60% of the population is connected to a sewerage network
(UNEP, 2003). Cesspits and boreholes are the other wastewater disposal systems in
the area.
Gaza Governorate is one of the five GS Governorates with a current
population around 530,000 (PCBS, 2005) people. The Municipality of Gaza (MOG)
jurisdictions comprises about 35square kilometers (USAID, 1996). The population
growth has been rapid in Gaza strip and particularly in the governorate of Gaza. The
annual water production from the municipal water wells of Gaza is 30,000,000 m3
(PWA, 2005), and the average daily flow of waste water is estimated to be 55,000 m3
(DORSCH CONSULT, 2005).
1.2 Wastewater treatment facilities in the Gaza Strip
There are three wastewater disposal and treatment facilities in Gaza strip, Beit
Lahia (BLWWTP), Gaza City (GWWTP) and Rafah (RWWTP), but none is
functioning effectively (MOPIC, 1998). They are not sophisticated treatment
technology, its consist of anaerobic lagoons, aerated lagoons and maturation ponds.
GWWTP is the only treatment facility which has trickling filters. The effluent from
Gaza and Rafah treatment plants is mostly discharged into the Mediterranean Sea. In
the case of the Beit Lahia wastewater treatment plant, a substantial quantity of
wastewater infiltrates into the ground, contaminating soil and groundwater in the area.
High level of nitrate has recently been detected from the aquifer, and it is most likely
that the excess effluent is responsible for the deterioration of the water quality of the
aquifer (Abu-Jalalah, 1999).
A.3ِ
The GWWTP is located in Sheikh Ejleen Area southern Gaza city; this area is
known to produce the most famous grapes in Gaza strip and may be in whole
Palestine. The area, where the plant is located is owned by the MOG totaling around
120 dunums including the infiltration basins and most of this area is bought by the
MOG from private owners. Before the Israeli disengagement in 12/09/05, there was
an Israeli settlement just 100m from the treatment plant called Netzarim, and now
after the disengagement this area is expected to be developed for the harbor stores .
As the level of treatment in GWWTP continued to deteriorate, the pollution in
Wadi Gaza became a problem. This was worsened by wastewater flows from the
middle area. To alleviate the problem in 1994, UNRWA and the municipality of Gaza
upgraded the treatment plant by removing sand and sludge from the lagoons,
upgrading their physical conditions and altering the treatment process to adequately
treat around 12,000m3 of influent daily.
In 1998, the United State Agency for International development (USAID) upgraded
GWWTP to receive influent quantity up to 32,000 m3 daily in 2005 (USAID, MOG,
1997) However, the system is overloaded and the hydraulic flows exceed the planning
schedule. The GWWTP receive new an estimated effluent of more than 55,000
m3/day (DORSCH CONSULT, 2005).
1.3 Problem Identification
The upgrading of GWWTP conducted by the USAID in 1998 increased the
capacity of the plant to receive 32,000m3/day by 2005. The records of the plant
showed that the influent quantity reached the maximum hydraulic designed loads as
the plant started to operate after the upgrading in 1998 (MOG lab, 1999). Due to the
natural increase in population and connecting the non sewered areas to the sewage
network, the effluent reached more than 55,000m3 in the year 2004 (MOG lab, 2004).
This was reflected negatively on the treatment capacity of the system and as a result
the quality of the effluent deteriorated with BOD5 effluent of more than 60mg/l
(DORSCH CONSULT, 2005). The final discharge points of the treatment plant
effluent are the sea beach and the infiltration ponds south of Gaza City. The
environment and public health has been affected by the current trends and practices of
wastewater disposal and treatment due to the poor quality of the effluent. The
biological seawater quality exceeds the WHO standard in most locations of Gaza
beach (Afifi, 1998) and health impact indications were observed on beach users

A.4ِ
(Elmanama,A,2004). In addition, the water quality of agricultural and municipal wells
located nearby the infiltration ponds showed a great increase in nitrates concentration
(PWA, 2004).
The limited hydraulic capacity of plant has forced the Municipality of Gaza
(MOG) to divert the flow from two pumping stations (P.S2 & P.S3) directly to the
beach; pumping raw sewage into the seashore which was has resulted in increase the
environmental and health impacts in the discharge points. In addition, the overflow of
the initial sedimentation ponds, due to over hydraulic loading, has caused a
tremendous damage to the agriculture areas around the plant leading to great
economic losses for the farmers.
The study seeks to identify and evaluate the limiting treatment factors of
GWWTP to produce effluent that reduce the environmental and health effects on the
area. The overall aim of the study is to evaluate the current performance of GWWTP
and to highlight the problems hindering GWWTP to produce the best possible effluent
quality and to propose solutions for these problems that will be reflected positively on
environment, health, economy and the service level.
1.4 Objectives
The objectives of this study are:
• Evaluate and document the treatment system performance in respect to the
removal efficiency of biochemical, chemical and biological parameters.
• Determine the limiting factors leading to inadequate treatment system
performance
• Determine and recommend economic and short term solution needed for optimal
operation and maximum waste removal
1.5 Methodology
1.5.1 Data Collection
The monthly and daily reports of GWWTP laboratory were collected for the
years: 2000,2001,2002,2003 and 2004. The laboratory conducts physical, chemical
and biological parameters on the influent and effluent of water received by GWWTP
through an automatic refrigerated sampler for 24 hours daily. The following
parameters were performed:
1. Temperature which was measured by a thermometer at the sampling point.

A.5ِ
2. pH which was measured by a pH meter at various points throughout the
treatment plant.
3. Settleable solids (SS) which was measured using an Imhoff cone.
4. Total Solids (TS) which was measured using dry oven at 105 Co.
5. Volatile Total Solids (VTS) which was measured using burning oven at 550
Co.
6. Suspended Solids (SS) which was measured using dry oven at 105 Co.
7. Volatile Suspended Solids (VSS) which was measured using burning oven at
550 Co.
8. Dissolved Solids (DS) which was measured using dry oven at 105 Co.
9. Chemical Oxygen Demand (COD) which was measured by micro COD
apparatus using potassium dichromate.
10. Biochemical Oxygen Demand (BOD5) was measured with OxiTop measuring
system.
11. Ortho-phosphorous which was determined using ascorbic acid colorimetric
method.
12. Total Coli form TC: For estimation of FC bacterial populations, the Membrane
Filtration (MF) technique is performed.
1.5.2 Analysis of Data
All the data obtained from monthly and daily reports were entered as
Microsoft Excel sheets and results were arranged in tables or figures.
1.5.3 Assessment of Data Reliability
The data collected from the records of GWWTP have three sources of error;
human error, instrument accuracy and sampling procedure. The data reliability was
examined and the sources of error were highlighted. In the following points, the main
sources of error are discussed briefly. .
1.5.4 Human Error
The sources of this type of error are the laboratory technicians who are
collecting, transporting and analyzing the samples. As mentioned before the
composite samples are collected by an automatic refrigerated sampler through 24
hours a day, but the calibration of the sampler on the level of the water on which the
samples are collected is performed by the operators and sometimes when the level is
too low the values for BOD and TSS are very high reflecting a misleading indication
A.6ِ
for the water sample and the contrary is correct, when the sampler is raised too much,
the values are too low for BOD, and TSS. Some times the samples are collected at a
point where the sample stream is not well mixed. The samples are not mixed through
the collection and testing which leads to some error in the results. The human error
arises also in taking the readings and weights during performing the tests inside the
laboratory.
1.5.5 Instruments' Accuracy
The age of GWWTP laboratory now is ten years and these instruments were
maintained more than once and calibrated, but when operated it indicates some errors.
Recent cross checking for the laboratory results with other laboratories showed
deviations in the results which questions the accuracy of these instruments.
1.5.6 Sampling Procedure
The collected composite samples were time composite of a fixed volume, but
taking in consideration the night flow for quality and quantity wise is much different
than the morning flow. A variable volume technique for forming the composite
sample is the most practical with a manual sampling method.
1.5.7 Reliability of Data
Based on the data analysis, it has been observed that the average values were
in general accepted. Some of the data is subject to the errors mentioned before such as
the values of the BOD which indicates a grip sample or some error in taking the
sample by the sampler. Some error arises in the values of the influent parameters is
due to the dilution of storm water connected to the sewerage system which runs to
GWWTP. The relation between the average values of BOD, TSS and COD is
identical to the theoretical relations between these parameters which indicate a strong
reliability of the GWWTP lab analysis.
1.5.8 Data Filtration
During the processing of the data collected throughout the five years, some
values of the parameters highlighted by this research were much higher or lower than
the average or expected values. The average monthly values for the BOD, COD, TSS
and TKN are shown in table 4.1 below. Values less than the average minimum
mentioned in the table are not considered in this research since their reliability are in
question and the same applies for values greater than double the values of the average
monthly values of the studied parameters. The values which are considered to be

A.7ِ
lower than minimum are replaced by the minimum average value for that parameter
and the values greater than the double average are replaced by the double the average
values.

A.8ِ
CHAPTER (2): STUDY AREA
2.1. Location and Population
The Municipality of Gaza (MOG) is located in the mid-north of Gaza strip and
it is a separate Governorate as shown in map (1), with a total area of 40 square
kilometers (MOPIC, 1998). The Gaza City population is estimated to be around
500,000 people, about two third of them are refugees. All governmental institutes and
international organizations headquarters are located in Gaza city.
2.2 Administration
Prior to the year 1948, the MOG had a population of about 75,000 inhabitants
with a limited infrastructure (USAID, 1997). The mass of refugees resulting from the
1948 war caused crowded housing conditions, and thus massive drainage problems to
the city. After the war, the Egyptian Government Administration took responsibility
for the Gaza strip, who undertook limited sewer construction activities within the area
of MOG in an attempt to keep up with the rapidly growing population. The 1967 war
brought Israeli occupation and control to Gaza strip. Infrastructure control, including
planning and development, was under Israeli Civil Administration. The population of
MOG was estimated to be about 117,000 by the year 1967. After the establishment of
the Palestinian Authority in 1994, the first most accurate survey for population was
performed by the Palestinian Central Bureau of Statistics (PCBS) which showed the
population of Gaza governorate was 357,768 in mid 1994, and according to the PCBS
report on December 1999 the population projection for the year 2005 is 516,882
inhabitants and it is expected to reach 650,033 by the year 2010 (PCBS, 1999).
Nowadays, the Governorate of Gaza is divided into nine main areas: Turkman,
Judeidah, Al-Daraj, Al-Sabrah, Northern Remal, Southern Remal, Tal El-hawa, al-
Zaitoon, and the Beach Camp. The Ministry of Local Governorates is responsible for
the administration of the local Municipalities within the territories of the Palestinian
Authority (PA) which was created after Oslo Agreement in 1994, which signed
between the Palestinian Liberation Organization (PLO) and Israeli. The Municipality
has municipal counsels, which formed by Presidential Decrees to supervise the
administration of municipalities. The municipal counsel of Gaza municipality
consisted of seven members.

A.9ِ
The responsibility for the development, operation and maintenance of all
wastewater and storm water drainage system within the MOG is fully under the
direction of the Mayor. Similarly, the Municipality is also responsible for water
supply. Operation and maintenance costs are covered by the MOG annual budget
which is supplemented by user fees assessed on water use. Such fees include a
surcharge for wastewater services. Funding support from donor program is being
obtained directly through National Ministries and used primarily for new projects and
for rehabilitation of existing works. However, some efforts are being dedicated to
operations, maintenance and training activities.
The department of water and wastewater in the MOG consists of four main
sub-departments: Water (wells and networks), Wastewater (networks and pumping
stations), Treatment (wastewater treatment plant- GWWTP) and Maintenance
(electrical and mechanical). The GWWTP consists of two sections: operation and
laboratory. The operation section is responsible for the daily operations of the plant
and to monitor the performance of the different mechanical facilities in the plant and
to record the daily activities while the laboratory is responsible for monitoring the
quality of influent and effluent coming to the plant or discharging to the sea or
infiltration ponds.
In 2000, the MOG along with 25 Municipal Counsels signed a memorandum
of understanding with the Palestinian Water Authority to consolidate the water
services in all the 26 municipalities in one single water utility called Coastal
Municipalities Water Utility (CMWU). The establishment of the CMWU was one of
the major reforms adopted by Palestinian Water Authority (PWA) in water sector and
it became a major demand from the donors to cooperate with the PA. The Board of
the Utility has also been nominated. The Minister of Local Government, as part of his
mandate, issued a Decree of CMWU establishment under the Local Government Law
(CMWU Quarter Report, 2005)
In April, 2005 a Management Contract was signed between CMWU and a
consortium of an Austrian company and a Saudi company (joint venture) to operate
the Gaza Emergency Water Project (GEWP) financed by the World Bank which will
lead to the activation of the CMWU on the ground as a responsible body for the water
services in all Gaza strip. Today, the Operator (Inframan) is responsible for the
maintenance and operation of GWWTP (CMWU Quarter Report, 2005).

A.1ِ0
2.1.3 Climate
The climate in the Governorate of Gaza is typical Eastern Mediterranean with
hot dry summers and mild winters. Rainfall average about 425 mm annually based on
35 years record (USAID, 1997). The average daily mean temperature is 25 degrees
centigrade in the summer and 13 degrees centigrade in the winter (MOPIC, 1998).
During the hot summer season, the daily maximum temperature generally exceeds 30
degrees centigrade and the maximum relative humidity exceeds 90%. Winds prevail
from the northwest in the summer, with velocities up to 3.9 m/s (USAID, 1997).
During the winter, the most frequent wind direction is southwest and average velocity
is about 4.2 m/s (USAID, 1997).
2.1.4 Land Ownership and Land Use
Historically Gazans have generally had the freedom and opportunity to own
and develop their own lands. This trend continues today and land is one of the most
important commodities in Gaza with values rating from $200 to more than $1000 per
square meter within the city limits. These prices are high, even by industrialized
country standard, and will influence the land use in the MOG area. The development
in Gaza increased after the Oslo accord by both private owners and donors. Returning
residents and refugees have added to this rapid development rate. Even during the
Intifada, investment in land remained high. Today growth is occurring at a rapid and
uncontrolled pace. There are no planning controls in place that effectively direct
growth or control the type of use. The Ministry of Planning (MOP) has developed
general plans for the Gaza strip defining target uses such as agriculture, industry, and
public facilities including locations of a future harbor and the regional wastewater
treatment sites. This general plan assumes that growth within the city limits will
continue.

A.1ِ1
Map (1): Location of Gaza city and existing treatment facilities.
Gaza City

A.1ِ2
2.2 Sewerage system and coverage
The sewer system in Gaza City is reported to date back to a Roman drainage
system; however, the extent and location of this early history are unknown. Such a
system was probably used for the removal of both storm flows and sewage (USAID,
MOG, 1996). Over the last 30 years, the sewage network was constructed primarily
by the MOG while under various authorities and controls. Records, such as as-built
drawings were not usually developed or kept, nor was maintenance undertaken except
for emergencies. UNRWA addressed the need for cleaning and repairs of a key
portion of the system. A critical part of this work was a detailed inspection of the
network and recording of the physical as-built data of the network. These as-built
conditions were combined with available city records and survey data collected for
the Master Plan to create a detailed as-built record of the network. The sewer network
covers around 75% of the total area of the MOG and around 90% of the population
with a total number of sewage subscribers around 26,000 subscriptions in the Gaza
Governorate (PWA, Fiscal Report, 2004).
2.3 The Gaza Wastewater Treatment Plant
This section describes the Gaza Wastewater Treatment Plant demonstrating
the development of the original design, the existing facilities of GWWTP and the
prevailing conditions of the plant. The ongoing and planned activities of GWWTP are
then produced along with the environmental effects of plant on the aquifer and
habitat. This section concludes with a description of the treatment process scheme.
• Hydrogeology of Plant Location
The Gaza Strip is essentially a foreshore plain gradually sloping westwards,
and underlain by a series of geological formations. The area within MOG consists
mainly of sands dunes in undulating formations, interspersed with clay lenses. Some
areas have relatively deep layers of clay soils (USAID, 2001). These are experienced
mostly in Al-Zeiton and Al-Tofah catchments while the coastal zone is primarily
sand. Groundwater levels in the city ranges from 1.0m to 2.0m relative to mean sea
level and the fresh water aquifer under the city is reported to have thickness of up to
about 90m (USAID, 1996) The GWWTP is situated on a hill with elevation of
44.2masl in Sheikh Ejleen sand dune area with a percolation rates in the range of
8.6m/day (USAID, 1997).
A.1ِ3
• Existing GWWTP Facilities The existing GWWTP includes on-site treatment facilities, as well as off-site
infiltration basins. All flow is pumped to the site through three force mains. An
effluent pump station and pipeline are used to transport effluent from the main plant
to the infiltration basins or to the Wadi Gaza. An existing force main/gravity line is
also used to discharge effluent to the sea.
The main plant facilities consist of three anaerobic ponds in series followed by
an aerated lagoon and two bio-towers. The anaerobic lagoons are heavily loaded
compared to typical design recommendations. Limited dredging is practiced in the
first of the three anaerobic lagoons. The aerated lagoon is equipped with floating
mechanical aerators and the bio-towers are filled with high-density plastic media. The
bio-tower effluent is directed to an effluent polishing pond where solids sedimentation
occurs and limited solids collection is possible. Solids are removed by a series of draft
tubes. The sludge is directed to un-aerated solid holding ponds. Polishing pond
effluent is pumped to the off-site infiltration basins, Wadi Gaza or to the sea. Three
basins are used for infiltration. The plant has a sodium hypochlorite disinfection
system used for the effluent which is directed to the sea. Solids dredged form
anaerobic pond 1 and biological solids from the sludge holding pond are directed to
the on-site sludge drying beds for dewatering. The following point gives short
description to the main existing treatment facilities of GWWTP (CAMP,2001)
• Influent Structure: The structure consists of a side inlet structure accepting the
900mm force main from Pumping Station No.7B, and a main box inlet structure
which accepts the flow from the remaining two pumping stations: Pumping
Station No.1 and Pumping Station No.6A.
• Anaerobic Ponds: The anaerobic ponds include two initial anaerobic ponds (1 &
2) each with volume of 22,000m3. The two ponds can be operated in series or
parallel. The third anaerobic pond (3) has a volume of 32,000m3.
• Aerated Pond: The aerated pond includes ten 25hp floating surface aerators and
six 50hp units. Each of the 16 aerators is fixed in the pond by cables and anchors.
The pond has the total capacity of 45,000 m3. The effect of the number of the
aerators will be shown and discussed in chapter 4 (Results& Discussion).

A.1ِ4
• Bio-Tower Feed Pump Station: A submersible pumping station pumps aerated
pond effluent plus recycle to two high-rate bio-towers. Four 60hp pumps, each
rated at 667m3/hr, are available.
• Bio-towers: The two high rate bio-towers are 27 m in diameter with 7.3 m of
media depth. The units operate in parallel and are designed for 85% BOD5
removal. Countercurrent natural ventilation openings are provided at the base of
the units around the circumference on a 45-degree center. Bio-tower effluent
drains to the downstream settling pond through a 1,000mm pipe.
• Bio-Tower effluent Distribution Chamber: This structure divides effluent flow
from the bio-towers proportionally between the settling pond and recycle back to
the bio-towers. It also allows bypass of bio-tower effluent to the existing effluent
pump station. Stop gates provide for six recycle rates ranging from 20%-67% of
the bio-tower effluent.
• Effluent Polishing Pond: The pond is divided by a concrete wall creating a
settling pond and a chlorination contact zone. The settling pond is 13 m wide by
83 m long concrete hopper-bottom settling zone. Sludge is removed through 150
mm suction pipe draped along the existing 3:1 slope. The suction manifold is
connected to a diesel pump. The pump discharges sludge into the sludge holding
pond. The suction drop pipes are spaced on 4 m centers and each includes a plug
valve located at the top of the beam so the suction pipes can open individually.
• Sludge Holding Pond: This un-aerated pond is used as an anaerobic sludge
holding pond with a total capacity of 10,700m3.
• Effluent Pump Station: A submersible pump station is constructed in the beam
of the effluent polishing pond. It consists of two wet wells, each containing two
60hp and 1,000 m3/hr submersible pumps.
• Chlorination Facility: Sodium hypochlorite storage and dosing equipment are
provided, but are not currently in use.
• Effluent Pipeline. A 600mm pipeline can deliver plant effluent to the infiltration
basins or to the Wadi Gaza. A separate pipeline can carry effluent to the sea.
• Infiltration Facilities. Effluent reuse facilities consist of three infiltration ponds
with a total area of 37,000 m2, 5,000 m3 storage tank and 2,000 m3/hr booster
pump station.

A.1ِ5
Figure 2.1: The Current Flow Scheme of GWWTP
Inlet Chamber
Sedimentation Lagoon No.1
Anaerobic Lagoon No
3
Aerated Lagoon
Final Settling
Channel
Trickling Filter
Trickling Filter
Sedimentation Lagoon No.2
Collection Chamber
Effluent

A.1ِ6
2.3.4 Existing Operation Condition
The GWWTP was upgraded in 1997-1998 to receive and treat influent
quantity up to 32,000 m3 daily in 2005 from Gaza City. When it was put into
operation, flows were found already to exceed 30,000m3/day. The GWWTP regularly
received over 50,000m3/day up to summer2004, after this time the flow meter was out
of order. Based on site visit and discussions with plant operators and engineers, the
following points are noted:
• The GWWTP was already over loaded since it started operation in 1998 and
today the plant receives more than 55,000m3/day. The lagoons are almost full
to the edges and the capacity to discharge effluent is limited to the capacity of
the effluent pumping station which is less than 2000m3/ HOUR. To reduce the
flows received at the GWWTP, raw sewage is being discharged direct to the
sea from two locations at Gaza beach.
• The anaerobic lagoons had not been desludged (cleaned) for more than three
years. As a result, the settlement lagoons are now full of grit and sludge. Since
anaerobic lagoon no.1 is filled with grit totally, this part of treatment plant is
bypassed. The sludge layer of bond 2 is almost 20cm below the water surface.
Less than one eighth of the tank volume is operating as a settling zone.
Anaerobic bond 3 seems to be not significantly better than pond 2.
• The official Gaza Municipality landfill site is located on eastern Gaza near the
Green Line with Israel. Access to the land fill had been frequently blocked
during the past two years. During these periods, municipal garbage had been
dumped in the GWWTP site as the only available alternative. It is estimated
that more than 700,000m3of solid waste had been dumped at the site. Wind
blown plastic bags are causing frequent blockage of the aerators and bio-
tower distributors.
• Although the Bio-towers are damaged by Israeli actions, they are operating
well and the media is in good shape. However, the surface area of the trickling
filter is partly covered with solid waste (plastic bags) which influences the
hydraulic flow patterns negatively. Part of the openings of the trickling filter
flow distributors seem to be clogged and the first layer of the media seems to
be clogged and need to be cleaned.

A.1ِ7
• In the end of October 2004, the GWWTP received more aggressions from the
Israeli Army, where the administration building had been damaged, the
parking shelter had been completely destroyed and one of the bio-towers has
been hit by a tank gun. Moreover, the lab of plant also received its share in the
damage that led to complete suspension of the monitoring program of the
quality of influent and effluent, moreover, the automatic sampler for the
influent was also totally damaged.
2.3.6 Research Contribution to GWWTP
The research manipulates the above two assessments with the gathered
historical record of GWWTP for the period from 2000 to the end of 2004 when the
sampler and the flow meter of the plant were out of order. The historical records
include organic effluent and influent characteristics such as the BOD and COD, the
solids such as the TSS and TDS, nutrients such as the Total Kjeldhal Nitrogen (TKN)
and the microbial content (Fecal Coli form).
For the design loads and flows, the projected data from the charts will be used
instead of assumptions. And the removal efficiency for each component of the plant
was measured practically which will make process calculation more accurate. Finally,
this research will come with recommendations for solving the problems of hydraulic
overload, solids, and bacteria removal with the lowest cost possible and will propose
the best scheme for the flow process to get the best effluent quality especially if
discharged to the sea. The recommendations will also include the Best Management
Practice to operate the GWWTP.

A.1ِ8
CHAPTER (3): LITERATURE REVIEW
3.1. Historical development of original design and related studies
The existing treatment plant was constructed in 1977 by the Israeli
administration authority with initially two lagoons. In 1986, the UNDP funded
treatment plant upgrading program to cope with increasing wastewater load and
expanding the initial plant capacity by more than three times. The UNDP upgrade
added two more lagoons and planned that all four lagoons would be aerated. The
technology of the plant was based on using a high level of mixing and aeration in the
first stage (2 lagoons in parallel) and a lower level in the second stage (also two
lagoons in parallel) and the system was called Dual Power Multicellular Aerated
Ponds (USAID, 1996) The reuse facilities were constructed which included two large
recharge basins totaling 40 dunums, two pumping stations, a 5000 m3 storage tank
and an overflow line terminating in Wadi Gaza. The treatment process could never
meet acceptable standards required for reuse. Therefore, the reuse facility has
remained unused.
The effluent from the treatment was pumped to Wadi Gaza via the UNDP
reuse distribution system. The reuse pumping station 1 was located at the treatment
plant while pump station 2 was located to the east in the vicinity of the farms that
expected to receive the treated effluent. As the level of treatment continued to
deteriorate, the pollution in Wadi Gaza became a problem. This was worsened by
wastewater flows from the near by middle area and the dumping of seepage into the
Wadi. To mitigate the problem, a new effluent line was constructed between the
GWWTP and the beach in 1994. In that year, the MOG and UNRWA upgraded the
treatment plant by; removing sand and sludge from the lagoons, upgrading their
physical condition and altering the treatment process to adequately treat an estimated
flow of 12,000m3/day (USAID,1996) . In 1993 the Dutch firm DHV contracted by
UNRWA, conducted assessment and redesign study which was meant to serve as an
immediate urgent program to put the treatment facility back into working condition
basically at its original design capacity. The DHV study reviewed six treatment
options. Three of these included an Up flow Anaerobic Sludge Blanket (UASB)
system in combination with other less sophisticated processes (Qasim,1999). The
UASB technology consists of a digester in which the wastewater is introduced at the
bottom. Organic waste is converted into biogas. As the gas bubbles escape by rising,

A.1ِ9
mixing is provided. The upper part of the digester contains devices to separate the
biogas, the sludge and the treated water. The system or reactor is commonly used for
industrial applications and has no mechanical parts and the BOD5 removal efficiency
is estimated to be up to 60 to 80% (Qasim, 1999).
Another alternative reviewed by DHV study in 1993, was the use of an
intermittent sand filter, a low cost system that is reported to achieve a very high
degree of removal of both organic and microbial pollution. The system consists of a
thick layer of sand that is batch loaded. A lack of maintenance of the system would
lead to flooding of the treatment site. The DHV analyses targeted the design needs for
the year 2010 with an estimated population served of 435,000 and an average daily
flow of 36,540m3. Loading in kg/day was projected to be 17,400 for BOD5, 43,500
for COD, 17,400 for TSS and 3,480 for N (USAID, 1996). The construction cost, area
requirement and the treatment process for the six options reviewed are summarized in
table 2.1.
Table 2.1: Treatment process, construction cost and area requirement for the six
options in DHV study (UNRWA/DHV, 1993).
Based on DHV study in 1993, operating costs vary considerably between the
options and are primarily a function of power consumption and chemical demand.
Options 2, 3 and 4 require high levels of power for the aeration and activated sludge
processes while options 5 and 6 would minimize chemical requirements because of
Treatment Option Construction cost
US $
Site requirements
(ha)
1. UASB+ Trickling Filter 10.4 million 9.9
2. UASB+ Aerated facultative lagoons 7.9 million 29.9
3.Activated Sludge 7.6 million 26.6
4. Anaerobic + Aerated + Facultative
Lagoons
5.8 million 30.9
5. UASB + Intermittent Sand Filter 5.8 million 15
6. Anaerobic Lagoons+ Intermittent
Sand Filter
2.2 million 18

A.2ِ0
the effectiveness of the intermittent sand filter. Option 3 would also have much higher
costs for sludge disposal than the other options. Disregarding the cost of land, option
6 clearly has the lowest investment cost. Both options 5 and 6 would have low
operating costs.
In 1997 the USAID appointed Metcalf and Eddy as its consultant in Gaza to
conduct the necessary studies, assessments and design an upgrading of GWWTP. The
proposed design criteria for the upgrading of GWWTP were to achieve a level of
treatment of 35/30 mg/l for BOD5 and TSS and some nitrogen removal. The use of the
existing facilities and converting them to cope with the treatment process proposed
was one of the terms of reference in the conceptual design. The Bio-tower technology
was adopted for the treatment process based on its lower construction and annual cost
and power demand as compared to other treatment techniques. The plant was
designed for an average flow of 32,000m3 and peak flow of 48,000 m3 and proposed
six schemes for the treatment process (USAID, 1997)
3.1.1. Studies Conducted on GWWTP for Upgrading
There are two comprehensive studies performed by international consultants
for upgrading GWWTP along with cost estimates:" the feasibility study and
conceptual design for GWWTP" performed by METCALF&EDDY for the
USAID in March,2001 and "Assessment of Existing Gaza WWTP" performed by
DORSCH CONSULT for the KfW in July, 2005.
• Feasibility Study and Conceptual Design for GWWTP( March,
2001)
This study was proposed on March, 2001 and was performed by Metcalf and
Eddy on the behalf of the United States Agency for International Development
(USAID) after two years of the upgrading it carried out for GWWTP.
The purpose of this study is to define the facilities needed to provide
additional treatment capacity for the near-term. The scope of the project consisted of
providing additional wastewater treatment and sludge treatment facilities needed to
expand wastewater treatment capacity. These facilities include on-site wastewater
treatment plant facilities and off-site sludge drying facilities, an effluent pipeline and
infiltration basins.
The study came up with two alternatives:

A.2ِ1
• Alternative 1- Bio-towers: This consists of converting Anaerobic Pond no.3 to
an aerated lagoon and adding an additional bio-tower. The aerated lagoon and
bio-tower group will be configured in series as they currently are. The existing
bio-tower feed pumping stations will be sized for sustained peak loading from
64,000 m3/day to 144,000 m3/day. The facilities require two 40 m diameter
clarifiers sized at an overflow rate of 57m3/day/m2.
• Alternative 2-Activated Sludge: This consists of converting Anaerobic Pond
No.3 to an activated sludge aeration basin and converting the existing aerated
lagoon also to an activated sludge aeration basin. The activated sludge facility
would run in parallel with the existing two bio-tower group.
A flow splitter structure would be constructed to divert flow to two existing
bio-towers.
Three final clarifiers will be provided, sized at an overflow rate of 32
m3/day/m2 at sustained peak flows. The facilities required are three 32 m
diameter clarifiers.
The two defined alternatives were compared to each other. The evaluation
criteria were process performance, power requirements, construction cost, annual
cost, operability, and effect on the local environment.
The conclusion was that Alternative 1- Bio-towers is the most favorable
alternative in terms of power requirements, construction cost, and annual cost and is
equivalent in terms of process performance. The feasibility study recommended the
implementation of alternative 1- Bio-towers.
• Gaza Central Wastewater Project, Assessment of Existing Gaza
WWTP (July,2005)
This assessment was conducted by Dorsch Consult for the German Bank for
Development (KfW) in July, 2005. Gaza Municipality and Palestinian Water
Authority requested urgent assistance from the KfW to restore the existing wastewater
treatment plant on December 2004.The objective of the assessment was to identify the
essential works needed to restore GWWTP to reasonable operating conditions the
2010 when the Central Wastewater Treatment Plant in Buriej is assumed to start
operation, which means to optimize use of the existing facilities, and not to provide
new facilities.

A.2ِ2
The objectives of the assessment were:
• Restore the Operation of GWWTP to an acceptable and sustainable standard.
• Increase the hydraulic capacity of the GWWTP and effluent discharge so that
all sewage from Gaza City receives at least partial treatment and stop the
direct sea discharges.
• Review and optimize the GWWTP treatment process.
The assessment came up with the following:
1 A list of materials and works required to improve the standard of operation
and maintenance of GWWTP.
2 Review of the hydraulic capacity for the internal piping of GWWTP along
with identification of critical pipe segments in the plant.
3 Process Options for improving the effluent quality with two alternatives:
• Alternative 1: to follow the same flow scheme of the existing treatment
process but to split the flow after the anaerobic pond no.3 into two
branches; one to the aerated pond and the other to the bio-towers and
then the two branches meet at the maturation pond.
• Alternative 2: the same as alternative 1 above but the anaerobic pond
NO3 is partially aerated by installing aerators for oxygen supply.
4 Other potential measures for Process Optimization.
3.1.2 Deficiencies of the previous studies and assessments of GWWTP
As mentioned above, there are two assessments conducted on GWWTP: one
by the USAID and the other by KfW. The common factor between the two studies is
that they are dealing with GWWTP with temporary and interim solutions, and the
proposed actions are emergency actions for operation continuity. The prevailing
unstable situation in Gaza has led to postponement of many strategic projects, and by
these postponements many circumstances change on the ground such as the land
availability, the served population and the service area. This has led to the fact that
temporary solutions become permanent status with all environmental problems
associated with it, which is reflected negatively on the Palestinian people.
• The feasibility study and conceptual design performed by Metcalf and
Eddy proposed construction of an extra bio-tower with a construction

A.2ِ3
cost of US $3,191,000, which is considered to be very high if not
financed by the USAID, especially it was proposed for PWA to be
totally financed by the USAID and was rejected. Moreover, the study
proposes construction of bio-tower pumping station along with
addition of more aerators which will double the electricity bill which is
around one million dollars annually. The bio-towers have in general
the potential to generate odors which will be reflected on the local
environment.
The assessment performed by DORSCH CONSULT for the KfW proposed priorities
to implemented starting with increasing the hydraulic capacity of piping, and proposes
parallel operation of bio-towers and the aeration pond and then to implement
additional aerators and start sludge recycling. The cost estimate for these works was
from 275,000 EUR to 335,000 EUR depending on the required performance. The
DORSCH assessment assumed design loads and flows; for example the assumed
BOD used in the model HYDKA was 500 mg/l while the average value for the BOD
for the five years was 533 mg/l. also in the process calculation there was assumed
performance for the plant components (anaerobic pond, aerated pond and the trickling
filter).
3.2 Treatment Process Evaluation
The final engineering design report of the GWWTP was revised to evaluate
the treatment process and the criteria set for the modification of the plant along with
assumptions made in considering the upgrading of the plant.
There are six options to operate the treatment system proposed and only two
options were practiced by allowing the flow after the anaerobic lagoon either to pass
through the trickling filters then to the aerated lagoon or to let the flow pass through
the aerated lagoon then to the trickling filters. The first option seemed to be less
power consumption than the second option and was the approved scheme.
The lagoons were almost full to the edges indicating a hydraulic overload and
hence a low treatment efficiency. This problem arises the need to propose solutions
for solving the problem of over loading, treatment process management and
improvement of the effluent quality.

A.2ِ4
3.3 Industrial Wastewater Generation
The final disposal of the industrial effluent has to be defined to avoid the
damage of the treatment process and to protect public health and ecological system.
Furthermore, it is important for the possible reuse of treated effluent in agriculture or
recharge to the groundwater aquifer (Afifi, 1998). Industrial wastewater loading in the
Gaza Governorate is insignificant compared to the domestic loading. Limited
quantities of wastewater with varying characteristics are produced by small industries
distributed in the City (Afifi, 2003). The quantities and characteristics of the
generated wastewater depend on the kind and size of industries. The tile, laundry
services, and juice industries represent the major wastewater producing industries.
Flows coming from food processing industries are mainly generated from washing
fruits and soft drink bottles (CAMP, 2001). The wastewater generated by laundries is
the disposed wash water. In the slaughter house there is a pre-treatment system which
is also connected to the municipal system.
As mentioned earlier, the characteristics of industrial wastewater are of more
concern than expected flow levels. While flows remain relatively small, the
characteristics can range from relatively high BOD5 concentration in the slaughter
house and food processing industries, to relatively high concentration of nitrates and
phosphate in wastewater discharged by laundry services from the use of detergents (InfraMan, 2006) Most industries are involved with washing activities and will have
some combination of washing compounds and BOD5 loading. Future trends in
industrial development in Gaza City involve some uncertainty resulting both directly
and indirectly from the political instability in the region.
3.4 Trickling Filter-Aerated Lagoon Combined System
In this section, the function theoretical background of the trickling filter and
the aerated lagoons is described with a highlight on the advantages and disadvantages
of each system. The various types and functions of the trickling filters are also
discussed, along with the removal efficiency and mechanisms of each the trickling
filters and the aerated lagoons systems.
Many unit operations and processes can be combined to develop a process
diagram to achieve a desired level of treatment. The level of treatment may range for

A.2ِ5
removal of BOD and TSS, nitrogen, and phosphorus, to complete demineralization
(Qasim, 1999). To develop the best possible process diagram, designers must evaluate many
factors that are related to operation and maintenance, process efficiency under
variable flow conditions and, and environmental constrains (Qasim, 1999). The
factors that are considered important in the selection of process diagram are:
1. Land requirements.
2. Adverse climatic conditions.
3. Ability to handle flow variations.
4. Ability to handle Influent Quality variations.
5. Industrial pollutants affecting process.
6. Reliability of the process.
7. Ease of operation and maintenance.
8. Occupational hazards.
9. Air pollution.
10. Waste products.
In upgrading GWWTP the flexibility of the process was taken into
consideration (USAID, MOG, 1997). Seven process options were proposed for the
operation of GWWTP.
3.4.1 Advantages and disadvantages of Trickling Filters
Using the trickling filters system has many advantages especially in some
developing countries for power consumption reasons. On the other hand the system
could have some disadvantages where land resources are scarce. In the following
points, the advantages and disadvantages of the system will be short listed (Horan,
1991)
1- Major advantage of trickling filters
• They are comparatively simple to operate.
• Have very low running costs.
• They are able to tolerate shock and toxic loads owing to the short contact
time of the wastewater with the slime layer.
2- Major disadvantages of the trickling filters,
• Their land requirements are high

A.2ِ6
• They can only provide limited treatment efficiency (although a 20/30
effluent is readily attainable).
• In hot countries they are associated with odors and fly nuisance.
• Although it is a relatively simple technique, the degree of skill required for
operation and maintenance is frequently not available
3.4.2 Function of Trickling Filters
A trickling filter (also referred to as a bio-filter, bacteria bed or percolating
filter) is a reactor of rectangular or circular plan which is filled with permeable media.
Wastewater is distributed mechanically over the media and percolates down the filter
to collect in an under drain system at its base. A microbial film develops over the
surface of the media and this is responsible for removal of BOD during passage of
sewage through the bed. Filtration doesn't occur and the process is solely a biological
one (Horan, 1991). The efficiency of the system depends upon an even distribution of
settled sewage over the whole surface of the filter and also upon the circulation of air
throughout the filter media.
On circular filters, the distribution and circulation is achieved by influent
entering at the center of the bed and passing into radial distributor arms above the bed
surface. The distribution arms are fitted at intervals with spurge holes such that
discharge of sewage through them provides the necessary force to drive the arms
around the central column. In case of rectangular filter, the distributor is driven
forward and backwards with the liquid being siphoned from a channel running along
the length of the bed. This wetting followed by a rest period is an essential
requirement for successful filter operation (Horan, 1992).
3.4.3 Removal Efficiency and Mechanisms in T.F.
The organic material and nutrient removal efficiency of the trickling filters is
reviewed in following section from theoretical point of view:
1- BOD5 Removal
For low loaded Trickling Filter systems the daily volumetric organic loading
rate (Lv) is in the range of 0.1- 0.2 kg BOD5/ m3 (Qasim,1999) The normal ranges of
hydraulic surface loading rate are 0.1 to 0.2 m3/m2.h (Horan,1991) In the low loading
rate TF system, the sludge retention is rather long and this will ensure a high degree

A.2ِ7
of Bio-film stabilization within the filter and BOD5 removal efficiency greater than
85% (Horan,1991) The high rate trickling filter has been developed to further reduce
the area requirements and the construction cost of low-rate filters by permitting a
higher organic load (Horan, 1991). The high BOD5 load results in rapid Bio-film
growth and a comparatively high production of biological sludge (Horan, 1991). The
hydraulic load on the filter must therefore be sufficiently high to produce flushing
effect. The volume load (Lv) is chosen between 0.2-1.5 kg BOD5 / m3.day depending
on the required BOD5 removal efficiency. The hydraulic surface load should be
between 0.3 and 1.2 m/h. (Qasim,1999) assumed that BOD5 removal by trickling
filters was proportional to the contact time of the wastewater with the biological slime
layer and also to the total active microbial mass in the slime layer and came up with
following equation:
Le/Lo= exp(-kD/Qn)
Where:
Le/Lo is the removal efficiency of the BOD5,
K is the BOD5 removal rate constant,
D is the filter depth (m) and
Q is the surface hydraulic loading (m3/d) .
2- Nutrient Removal
For low loaded trickling filters systems, a high degree of nitrification can be
realized (more than 75%) at the bottom part of the filter where autotrophic nitrifies
will accumulate (Qasim, 1999). De nitrification can only be achieved if the nitrified
effluent is recycled to the filter. A maximum of 20-35% of N can be denitrified if
anaerobic conditions prevail in the inner Bio-film (Horan, 1990). This is however in
practice very difficult to control. For high rate Trickling Filters, Nitrification will
hardly take place. Only at low (Lv) loading less than 0.3 kg BOD5/m3.day partial
nitrification (less than 50%) can be observed. At higher temperature this may increase
to some extent (Horan, 1990).
3.4. 4 Aerated Lagoons System
An aerated lagoon resembles a waste stabilization pond in that it is a shallow
basin between 2 and 5m deep, with a large surface area, which receives a continuous
flow of wastewater. It differs in that the bio-oxidation of organic material is forced by
mechanical aeration and not naturally by algal photosynthesis. In ponds where

A.2ِ8
mechanical aerators have been installed, there is a great change in the ecology of the
lagoon, leading to a complete disappearance of the algae and their replacement by a
mixed heterotrophic bacterial community, which grows in the form of flocs. Thus,
ecologically, aerated lagoons most resemble an activated sludge process operated
without cell recycle (Metcalf & Eddy, 1992). Aerated lagoons generally employ
surface aerators, which is either floating or fixed. In deeper lagoons, submerged
turbines must be provided in order to provide adequate mixing. Concrete pads are
usually placed under the mixer in order to prevent scour of the lagoon bottom. These
are not required when the lagoon has been completely lined. Aerated lagoons
typically are classified by the amount of mixing provided. A partial mix system
provides only enough aeration to satisfy the oxygen requirements of the system and
does not provide energy to keep all total suspended solids (TSS) in suspension (EPA,
2002). In some cases, the initial cell in a system might be a complete mix unit
followed by partial mix and settling cells.
The power level required for mixing is a function of the lagoon size, geometry
and the concentration of suspended solids (Metcalf Eddy, 1992). If the BOD or solids
loading to the lagoon increases, then more aerators can be added as required, but a
minimum spacing is required to prevent interference .
The effluent from an aerated lagoon requires some form of settlement stage
before it is fit to discharge to a watercourse. Although this can be a conventional
sedimentation tank, it is more usual to discharge into one or more ponds, depending
upon the final effluent quality required. Aerated lagoons can reliably produce an
effluent with both biochemical oxygen demand (BOD5) and TSS less than 30 mg/l if
provisions for settling are included at the end of the system (Horan, 1991).
Significant nitrification will occur during the summer months if adequate dissolved
oxygen is applied (Metcalf Eddy, 1992). Many systems designed only for BOD5
removal fail to meet discharge standards during the summer because of shortage of
dissolved oxygen. The suspended solids content of aerated lagoon effluent is high and
thus the first pond in the series acts as a settlement tank. A retention time of up to 10
days is required and depths are typically 2m. The remaining ponds in the series
behave as maturation ponds. The sedimented solids from aerated lagoons should
ideally be subject to anaerobic digestion or placed on sludge-drying beds until it has
stabilized. The factors that must be considered in the process design of aerated
lagoons include (Horan, 1991):

A.2ِ9
1. BOD removal.
2. Effluent characteristics.
3. Oxygen requirements.
4. Temperature effects
5. Energy required for mixing
6. Solids separation.
Depending on the detention time, the effluent from an aerated lagoon contains
about one-third to more than one half the value of the incoming BOD5 in the form of
cell tissue. Most of these solids must be removed by settling prior to discharge (a
settling tank or basin is a normal component of most lagoon systems). If the solids are
returned to the lagoon, there is no difference between this process and a modified
activate sludge process (EPA, 1999)
3.4.4.1 BOD Removal
Depending on the detention time, the effluent from an aerated lagoon contains
about one-third to more than one half the value of the incoming BOD in the form of
cell tissue. Most of these solids must be removed by settling prior to discharge (a
settling tank or basin is a normal component of most lagoon systems). If the solids are
returned to the lagoon, there is no difference between this process and a modified
activate sludge process.
3.5 Alternative Treatment Systems
A review of the individual unit processes that could be implemented in
GWWTP with their drawbacks is highlighted in the following sections:
3.5.1 Anaerobic Ponds
Anaerobic ponds are simple and effective for small plants but the quantity of
BOD to be removed by GWWTP combined with land limitation make additional
anaerobic ponds not practical for the expansion.
A.3ِ0
3.5.2 Aerobic Lagoons
Converting anaerobic lagoons to aerobic lagoons makes efficient use of
existing facilities and conserves land. The BOD removal efficiency per land area
required is significantly higher than anaerobic lagoons but less than a bio-tower.
Furthermore, the operating cost of aerators is considerably higher than that of a bio-
tower.
3.5.3 Natural Systems
Natural treatment systems consist of man – made wetlands or reed bed
cultivation type systems. These facilities are effective for small systems but require a
large amount of land for facilities of moderate capacity. The design parameters for
such systems are not well established and these facilities normally develop from small
pilot scale systems which are demonstrated and then scaled up. This requires time,
which is not available to the Gaza WWTP facility. In addition to difficulties with land
acquisition, environmental documentation and permitting would be time consuming
due to the lack of a local precedent.
3.5.4 Rotating Biological Contactors (RBC)
Rotating Biological Contactors (RBCs) are a fixed film system similar to bio-
towers. RBCs are often cost effective when they can be added to existing tankage. In
the case of the GWWTP tankage would have to be constructed to house the RBCs,
thus negating that potential advantage. RBCs would have higher construction costs,
similar to bio-towers, and they complicate plant operation by adding another different
biological process. No advantage over expansion of the existing fixed film process
could be identified.
3.5.5 Oxidation Ditch
An oxidation ditch is a specific configuration of the activated sludge process.
The activated sludge process is recognized as a viable alternative, but the utilization
of the existing lagoons for basins would be more cost-effective than constructing
additional basins in that specific configuration.

A.3ِ1
3.5.6 Sequencing Batch Reactor (SBR)
A sequencing Batch Reactor (SBR) can be a cost-effective process for a plant
of GWWTP size. The SBR has the construction cost advantage of achieving oxidation
and sedimentation in the same basin, thus eliminating the need for separate
sedimentation basins. Constructing SBRs to reduce the remaining BOD may require
parallel flow trains and therefore separate clarification behind the existing biological
treatment systems. The advantage of not constructing separate clarifiers is then lost.
2.5.7 Lagoon Clarification
Using the existing lagoon capacity for clarification was considered. This has
the advantage of not having to construct clarifiers. Disadvantages include the loss of
lagoon capacity for biological reduction and the expected reduced efficiency and
reduced operability of a lagoon clarification system. A lagoon clarification system
would be oversized compared to a circular clarifier tank to account for short circuiting
and non-uniform solids distribution. Solids removal would also be a more difficult
operation since it would be likely require some type of dredge equipment. The
operators find the existing suction tube system relatively difficult to operate. The final
clarification is important to comply with effluent requirements and it is beneficial to
rely on proven unit processes for this key facility.

A.3ِ2
Chapter 4: RESULTS AND DISCUSSION
This chapter demonstrates and discusses the results of the collected data and
their analysis of GWWTP. The performance of system -as a total – is presented by
comprising the level of different physical, chemical and biological parameters in
influent and the effluent. In addition, results showed the performance of different
system components. Analysis of the performance aspects of GWWTP and factors
leading to inadequate performance of the system is discussed. Moreover,
modifications on the treatment system that can enhance the system performance have
been demonstrated.
In general, these results showed a decline of treatment capacity and decrease
of removal efficiency of the system over the study period.
Correlation between Data and Research Aims
One of the research aims is to evaluate the behavior of GWWT and the
performance of the plant through analyzing the biological, chemical, solids, nutrients
and bacteriological removal efficiency of the plant. The BOD, COD, TSS, TDS, TKN
and Faecal Coliform were chosen as parameters to reflect the removal efficiency of
the plant. The data collected from the GWWTP lab were recorded daily and the tests
were performed weekly, bi-weekly or monthly. The data collected were filtered from
the odds and were averaged as monthly readings for each month to indicate the values
of the selected parameters for each month and then to indicate the removal efficiency
of the plant for the whole year as a performance indicator. The tables shown in annex
A show an average value for each parameter for each year from 1998 to 2002.
4.1 Total System Performance of GWWTP.
The analysis of the total system performance through collected data is
demonstrated in the following sections. The main parameters included in the analysis
were the removal efficiency of organic materials, nutrients (Nitrogen),
microbiological indicator (FC) and solids. These parameters were compared with the
hydraulic flow over the study period. These parameters are:
• Biochemical Oxygen Demand (BOD)

A.3ِ3
• Chemical Oxygen Demand (COD)
• Total Suspended Solids (TSS)
• Total Dissolved Solids (TDS)
• Total Kjeldhal Nitrogen (TKN)
• Fecal Coli form (F.C)
Annex (1) presents the Results of the GWWTP lab monitoring program data
for period from the year 2000 to 2004 based on daily readings and averaged for each
month of the year.
Table 4.1 shows the maximum, minimum and the average monthly values for
the flow quantities, BOD, COD, TSS and TKN for the period from January 2000 to
December 2004 of both influent and effluent of the total system.
Average monthly value Max monthly value Min monthly value
Parameters Influent Effluent Influent Effluent Influent Effluent
Flow (m3/d) 43786 - 59419 - 34508 -
BOD (mg/l) 533 31 1300 54 297 17
COD (mg/l) 1046 106 2180 380 752 65
TSS (mg/l) 661 40 1589 107 318 18
TKN (mg/l) 80.5 61 154 91 35 37.5
Table 4.1: Maximum, Minimum and the Average monthly values of different studied
parameters in GWWTP for both influent and effluent of the total system for the study
period.
The results show a decline of treatment capacity and decrease of removal
efficiency of the system over the study period. This problem was basically due to the
underestimates in the design criteria for the projected flow for the planed operation
period from 1998 to 2005.
4.1.1 Biochemical Oxygen Demand (BOD5)
Figures 4.1 to 4.3 show the results of the average monthly effluent BOD5 level
and removal efficiency versus flow of GWWTP during the study period. The results
show the dramatic increase of the average flow rate from 2000 to 2004 from 42,185
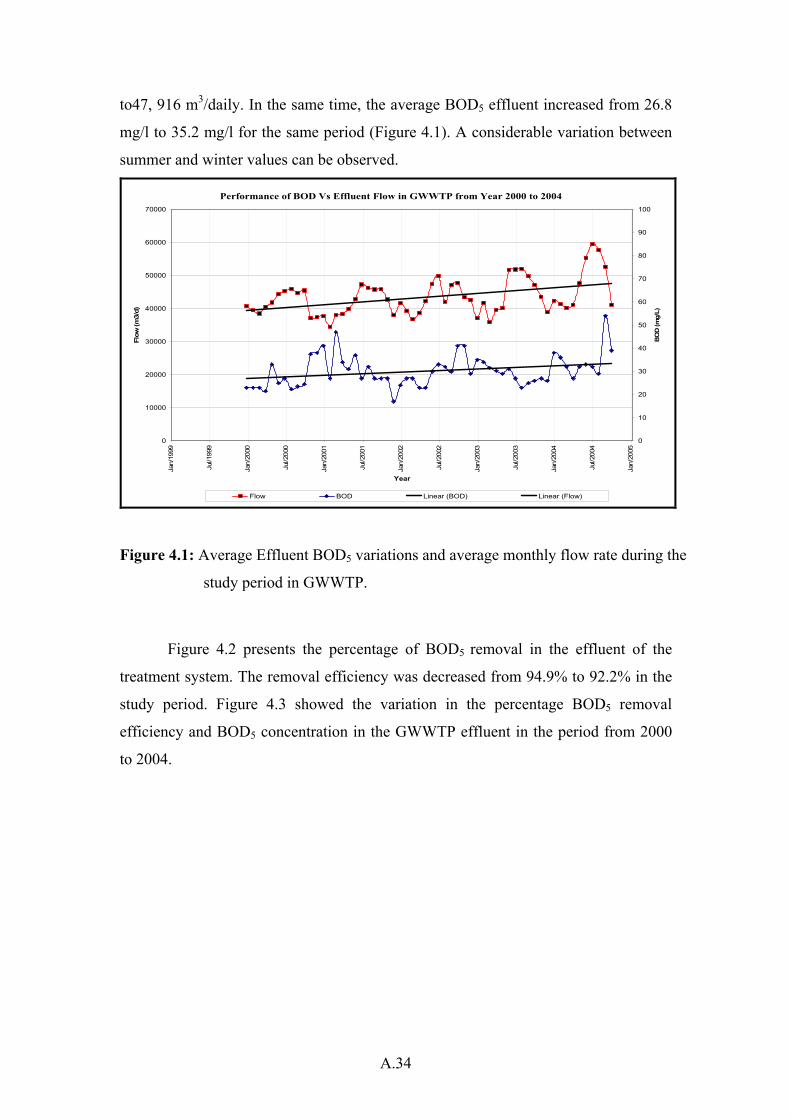
A.3ِ4
to47, 916 m3/daily. In the same time, the average BOD5 effluent increased from 26.8
mg/l to 35.2 mg/l for the same period (Figure 4.1). A considerable variation between
summer and winter values can be observed.
Performance of BOD Vs Effluent Flow in GWWTP from Year 2000 to 2004
0
10000
20000
30000
40000
50000
60000
70000
Jan/
1999
Jul/1
999
Jan/
2000
Jul/2
000
Jan/
2001
Jul/2
001
Jan/
2002
Jul/2
002
Jan/
2003
Jul/2
003
Jan/
2004
Jul/2
004
Jan/
2005
Year
Flow
(m3/
d)
0
10
20
30
40
50
60
70
80
90
100
BO
D (m
g/L)
Flow BOD Linear (BOD) Linear (Flow)
Figure 4.1: Average Effluent BOD5 variations and average monthly flow rate during the
study period in GWWTP.
Figure 4.2 presents the percentage of BOD5 removal in the effluent of the
treatment system. The removal efficiency was decreased from 94.9% to 92.2% in the
study period. Figure 4.3 showed the variation in the percentage BOD5 removal
efficiency and BOD5 concentration in the GWWTP effluent in the period from 2000
to 2004.

A.3ِ5
Removal Eff. Of BOD in GWWTP Vs Effluent Flow from Year 2000 to 2004
30000
35000
40000
45000
50000
55000
60000
65000
Jan/
1999
Jul/1
999
Jan/
2000
Jul/2
000
Jan/
2001
Jul/2
001
Jan/
2002
Jul/2
002
Jan/
2003
Jul/2
003
Jan/
2004
Jul/2
004
Jan/
2005
Year
Flow
(m3/
d)
70
75
80
85
90
95
100
BO
D R
emov
al E
ff. %
Flow Removal Eff. BOD% Linear (Flow) Linear (Removal Eff. BOD%)
Figure 4.2: Relation between percentage of the BOD5 effluent removal and average monthly
flow rate from 2000 to 2004 for GWWTP.
Removal Eff. Of BOD in GWWTP Vs Effluent Flow from Year 2000 to 2004
0
10
20
30
40
50
60
Aug/
1999
Mar
/200
0
Oct
/200
0
Apr
/200
1
Nov
/200
1
May
/200
2
Dec
/200
2
Jun/
2003
Jan/
2004
Aug/
2004
Feb/
2005
Year
BO
D (m
g/l)
86
88
90
92
94
96
98
100
BO
D R
emov
al E
ff. %
Removal Eff. BOD% BOD (mg/L) Linear (BOD (mg/L)) Linear (Removal Eff. BOD%) Figure 4.3 Variation in the percentage BOD5 removal efficiency and average BOD5
concentration in the GWWTP effluent in the period from 2000 to 2004.
The Biochemical Oxygen Demand (BOD5) is the most important parameter in
the treatment process design and effluent discharge or reuse (Qasim, 1999). Lowering
of BOD5 is both a physical process by way of settling of organic particles and a
biochemical process through decomposition and mineralization of organic and

A.3ِ6
inorganic compounds (Reed, 1995). In a good designed system, aerated lagoons can
reliably produce an effluent with both biological oxygen demand (BOD5) and TSS
less than 30mg/l if settling is provided at the end of the system (EPA, 2002). A
combined system in which the process includes a fixed film reactor followed by a
contact channel 10-15% of the size of an aeration basin of a conventional activated
sludge plant will have a removal efficiency of BOD5 up to 85% (Qasim, 1999). The
BOD5 values for influent and effluent of GWWTP generally increase in the winter
months than in the summer months. This is due to the increase in the water
consumption in the summer season than in the winter while the biological load is
constant, which leads to the dilution in the influent BOD5. The average value for
February influent BOD5 value is 525 mg/l, while the average value of influent BOD
for September is 403 mg/l (see appendix 1).
The effluent BOD5 value is increasing with the annual increase in the influent
quantity and the most recent tests taken in October 2006 indicates a value of 45-50
mg/l, as the quantity of effluent reached more than 55,000m3/d as shown in the
extrapolation of Figure 4.1. The explanation for this increase in the value of effluent
BOD5 is that the GWWTP is already hydraulically over loaded of more than 70% of
the designed hydraulic load and an estimated quantity of 15000m3 is being diverted to
the sea from sewage pumping stations 1&2, which leads to decrease in the retention
time of the sewage water when passing through the plants components, which reflects
the need to find a solution to retain the original designed retention time for the
treatment process and hence obtain the required values of the BOD5. The GWWTP
BOD5 removal efficiency has decreased from around 95% in the year 2000 when the
average flow was around 42,000m3; to around 91% in the year 2004 when the average
flow was around 48,000m3 and recent tests made on October 2006 show that it is
dropped to less than 90% (45-50 mg/l) where the influent quantity reached to more
than 55,000m3 (see figure 4.2).
Taking into consideration that the effluent is discharged to the sea and the
increasing quantity of wastewater received by GWWTP, the environmental impacts of
GWWTP is considered to be negative. The trend of BOD5 removal efficiency and the
effluent values of the BOD5 are demonstrated in figure 4.3 which showed linear like
decrease in the removal efficiency and an almost linear increase in the effluent BOD5.

A.3ِ7
4.1.2 Chemical Oxygen Demand (COD)
The Chemical Oxygen Demand (COD) is another important factor highlighted
in this research for the performance of GWWTP. The average values of the effluent
COD and removal efficiency against flow rates of GWWTP and the trend of the
removal efficiency during the study period are demonstrated in figures 4.4 to 4.6. The
results show the same trend as in case of the BOS5 parameter. Increasing the
hydraulic load of the plant was reflected negatively on removal efficiency and
increases the average effluent COD concentration of the plant.
Performance of COD Vs Effluent Flow in GWWTP from Year 2000 to 2004
0
10000
20000
30000
40000
50000
60000
70000
Jan/
1999
Jul/1
999
Jan/
2000
Jul/2
000
Jan/
2001
Jul/2
001
Jan/
2002
Jul/2
002
Jan/
2003
Jul/2
003
Jan/
2004
Jul/2
004
Jan/
2005
Year
Flow
(m3/
d)
50
70
90
110
130
150
170
190
210
230
250
CO
D (m
g/L)
Flow COD Linear (Flow) Linear (COD)
Figure 4.4 The average Effluent COD variations and average monthly flow rate during the
study period in GWWTP.

A.3ِ8
Removal Eff. Of COD in GWWTP Vs Effluent Flow from Year 2000 to 2004
30000
35000
40000
45000
50000
55000
60000
65000
Jan/
1999
Jul/1
999
Jan/
2000
Jul/2
000
Jan/
2001
Jul/2
001
Jan/
2002
Jul/2
002
Jan/
2003
Jul/ 2
003
Jan/
2004
Jul/2
004
Jan/
2005
Year
Flow
(m3/
d)
70
75
80
85
90
95
100
CO
D R
emov
al E
ff. %
Flow Removal Eff. COD% Linear (Removal Eff. COD%) Linear (Flow)
Figure 4.5: Relation between percentage of the COD effluent removal and average
monthly flow rate from 2000 to 2004 for GWWTP.
Removal Eff. Of COD in GWWTP Vs Effluent Flow from Year 2000 to 2004
0
20
40
60
80
100
120
140
160
Jan/
1999
Jul/ 1
999
Jan/
2000
Jul/2
000
Jan/
2001
Jul/2
001
Jan/
2002
Jul/ 2
002
Jan/
2003
Jul/2
003
Jan/
2004
Jul/2
004
Jan/
2005
Year
CO
D (m
g/L)
70
75
80
85
90
95
100
CO
D R
emov
al E
ff. %
COD (mg/L) Removal Eff. COD% Linear (Removal Eff. COD%) Linear (COD (mg/L))
Figure 4.6: Variation in the percentage COD removal efficiency and COD concentration in the
GWWTP effluent in the period from 2000 to 2004.

A.3ِ9
The COD test is rarely used in effluent discharge control, but primarily in
assessing the strength of trade or industrial effluents (Tchobanoglous and
Schroeder, 1999). For the reason that the COD test is a simple chemical assay, it is
easy to point out its drawbacks and limitations. The results showed that the average
COD values for effluent increased from the year 2000 of an average of 95.4 mg/l to
an average of 110 mg/l in the year 2004 and the COD removal efficiency decreased
from 91% in the year 2000 to 86% in the year 2004, which indicates a poor
performance of GWWTP due to the increasing hydraulic load. The most recent tests
of GWWTP lab show that the effluent values of the COD ranges between 120mg/l to
130mg/l indicating that the removal efficiency of COD was less than 83% by October
2006. The general trend of the COD removal of GWWTP along with the values of
effluent COD is shown in figure 4.6. It is worth mentioning here that the numeric
value of the COD removal efficiency is less than the BOD because of the non removal
of the non-degradable fraction of the COD.
In a combined aeration lagoons –trickling filter system, the COD removal
could reach up to 90% (Qasim, 1999). Values obtained from the tables in annex 1 for
influent COD test simply showed a relation of 2:1 of COD: BOD which is complying
with theoretical values of COD: BOD ratio of municipal settled sewage (Horan,
1990). Values obtained for effluent for COD: BOD ratios show a relation of 3:1. This
is owing to the fact that biodegradable fraction of the waste decreases through the
biological treatment whereas the non-biodegradable fraction remains unchanged
(Horan, 1990). In view of its simplicity and rapidity, the COD test is the most
suitable assay for the determination of the strength of both raw and treated
wastewater.
4.1.3 Total Suspended Solids (TSS)
The results of effluent TSS average values and the trend of the TSS removal
efficiency compared with the hydraulic loading of the GWWTP during the study
period are shown in figures 4.7 to 4.9. Figure 4.7 showed that the average effluent
TSS doubled and increased from an average of about 25 mg/l to 50 mg/l from the year
2000 to 2004 and the GWWTP lab tests on October 2006 showed that the TSS values
in the effluent reached to more than 65mg/l.
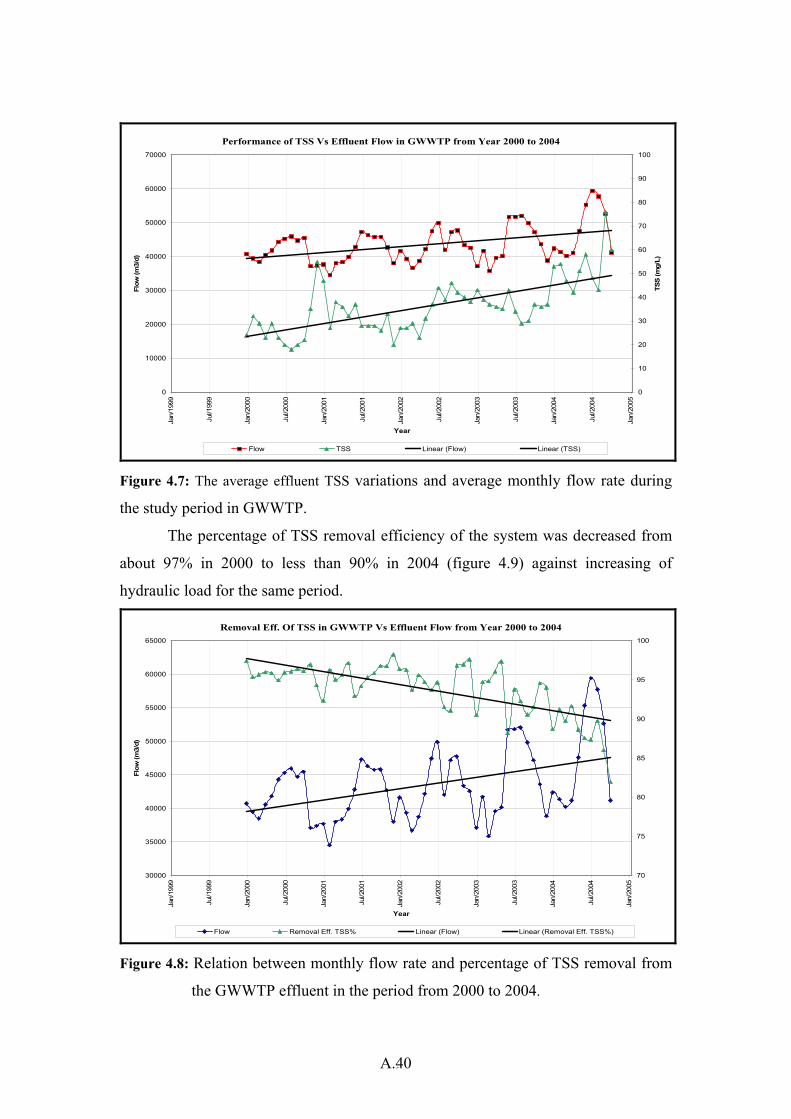
A.4ِ0
Performance of TSS Vs Effluent Flow in GWWTP from Year 2000 to 2004
0
10000
20000
30000
40000
50000
60000
70000
Jan/
1999
Jul/1
999
Jan/
2000
Jul/2
000
Jan/
2001
Jul/2
001
Jan/
2002
Jul/2
002
Jan/
2003
Jul/2
003
Jan/
2004
Jul/2
004
Jan/
2005
Year
Flow
(m3/
d)
0
10
20
30
40
50
60
70
80
90
100
TSS
(mg/
L)
Flow TSS Linear (Flow) Linear (TSS) Figure 4.7: The average effluent TSS variations and average monthly flow rate during
the study period in GWWTP.
The percentage of TSS removal efficiency of the system was decreased from
about 97% in 2000 to less than 90% in 2004 (figure 4.9) against increasing of
hydraulic load for the same period.
Removal Eff. Of TSS in GWWTP Vs Effluent Flow from Year 2000 to 2004
30000
35000
40000
45000
50000
55000
60000
65000
Jan/
1999
Jul/1
999
Jan/
2000
Jul/2
000
Jan/
2001
Jul/2
001
Jan/
2002
Jul/2
002
Jan/
2003
Jul/2
003
Jan/
2004
Jul/2
004
Jan/
2005
Year
Flow
(m3/
d)
70
75
80
85
90
95
100
Flow Removal Eff. TSS% Linear (Flow) Linear (Removal Eff. TSS%) Figure 4.8: Relation between monthly flow rate and percentage of TSS removal from
the GWWTP effluent in the period from 2000 to 2004.

A.4ِ1
Removal Eff. Of TSS in GWWTP Vs Effluent Flow from Year 2000 to 2004
0
10
20
30
40
50
60
70
80Ja
n/19
99
Jul/1
999
Jan/
2000
Jul/2
000
Jan/
2001
Jul/2
001
Jan/
2002
Jul/2
002
Jan/
2003
Jul/2
003
Jan/
2004
Jul/2
004
Jan/
2005
Year
TSS
(mg/
L)
70
75
80
85
90
95
100
TSS (mg/L) Removal Eff. TSS% Linear (TSS (mg/L)) Linear (Removal Eff. TSS%) Figure 4.9 Variation of TSS removal efficiency and TSS level in the GWWTP effluent from
2000 to 2004.
The results in annex (1) show the ratios of TSS to BOD for both influent and
effluent for the wastewater received by GWWTP. Theoretically the value of TSS
should not exceed 80% of the value of BOD in the wastewater (Horan, 1990). The
ratios of TSS to BOD in the effluent increased from 105% in the year 2000 to 150%
in the year 2004. This indicates a decrease in the ability of GWWTP to remove
suspended solids. This can be referred to their larger size and more rapid settling
velocities and form a sludge blanket in the settling lagoons (anaerobic) (Crites,
Tchobanoglous, 1998) which could be seen as small sludge islands in the two initial
sedimentation lagoons. Consequently, this will reduce the hydraulic capacity of
GWWTP (retention time) and the removal efficiency of the TSS.
The organic material deposited on the bed of the treatment process is subject
to biodegradation, which results in a depletion of the oxygen source at a faster rate
than it is supplied with. This material is therefore subject to anaerobic breakdown,
which results in the production of methane and toxic hydrogen sulfide gases. It is
worth noting that the values of TSS in the influent in the last five years, except 2001,
had exceeded the normal values which indicate no grit removal in the sewage
pumping stations that delivers wastewater to GWWTP. It is worth mentioning here
that the two anaerobic sedimentation lagoons were cleaned (desludged ) in April 2003

A.4ِ2
which explains the behavior of the curve of TSS which reached a maximum value in
March 2003 then started to drop linearly after. The general trend of the removal
efficiency of the TSS and the effluent values is shown in figure 4.9 which indicates a
decrease in the removal efficiency and increase in the effluent TSS values.
4.1.4 Total Dissolved Solids (TDS)
The results of effluent Total Dissolved Solids (TDS) values and the trend of
the TDS of the influent compared with the hydraulic loading of the GWWTP during
the study period are shown in figures 4.10 and 4.11. The results show an increase in
the average effluent TDS from about 1300 mg/l to about 1650 in the study period. The
same tendency was observed for the level of TDS of the influent (figure 4.11).
Performance of TDS Vs Effluent Flow in GWWTP from Year 2000 to 2004
0
10000
20000
30000
40000
50000
60000
70000
Jan/
1999
Jul/1
999
Jan/
2000
Jul/2
000
Jan/
2001
Jul/2
001
Jan/
2002
Jul/2
002
Jan/
2003
Jul/2
003
Jan/
2004
Jul/2
004
Jan/
2005
Year
Flow
(m3/
d)
1000
1100
1200
1300
1400
1500
1600
1700
1800
1900
TDS
(mg/
L)
Flow TDS Linear (Flow) Linear (TDS)
Figure 4.10: The variation of average effluent TDS and average flow rate of GWWTP for the
period from 2000 to 2001.

A.4ِ3
Performance of TDS_Influent Vs TDS_Effluent in GWWTP from Year 2000 to 2004
800
1000
1200
1400
1600
1800
2000
Jan/
1999
Jul/1
999
Jan/
2000
Jul/2
000
Jan/
2001
Jul/2
001
Jan/
2002
Jul/2
002
Jan/
2003
Jul/2
003
Jan/
2004
Jul/2
004
Jan/
2005
Year
TDS
(mg/
l)
TDS_Influent TDS_Effluent Linear (TDS_Effluent) Linear (TDS_Influent)
Behavior of TDS in the Effluent
Behavior of TDS in the Influent
Figure 4.11: The variation of both influent and effluent TDS of GWWTP in the period from
2000 to 2004.
Dissolved solids are a portion of organic and inorganic solids that is not
filterable and consists of two main categories: Fixed (noncombustible or mineral
components of total dissolved solids) and Volatile (combustible or organic
components of total dissolved solids). Normally, solids smaller than one mill micron
are fall in this category and in a concentration range of 250-800 mg/l (Qasim, 1999).
Considering the period from the year 2000 to 2004, the values of the effluent TDS are
increasing with time and this is mainly due to the deterioration of water quality of the
aquifer, which is reflected on the incoming influent to GWWTP as figure 4.11
showed the trends of both effluent and influent. The values of TDS increased a little
when passing through the treatment process due to evaporation which is clear in
summer months. This was reflected clearly after the year 2002 as the effluent TDS
average values were higher than the influent values as given in figure 4.11.

A.4ِ4
4.1.5 Total Kjeldhal Nitrogen (TKN)
Figures 4.12 and 4.13 present the results the level of effluent TKN and the
general trend between the removal efficiency and the effluent values of the TKN in
the study period from the yeas 2000 to 2004. The average effluent level of TKN
values were increased from about 50 mg/l to about 70 mg/l in the study period (figure
4.12).
Performance of N-KJD Vs Effluent Flow in GWWTP from Year 2000 to 2004
0
10000
20000
30000
40000
50000
60000
70000
Jan/
1999
Jul/1
999
Jan/
2000
Jul/2
000
Jan/
2001
Jul/2
001
Jan/
2002
Jul/2
002
Jan/
2003
Jul/2
003
Jan/
2004
Jul/2
004
Jan/
2005
Year
Flow
(m3/
d)
30
50
70
90
110
130
150
N-K
JD (m
g/L)
Flow N-KJD Linear (Flow) Linear (N-KJD)
Figure 4.12: Average effluent TKN and flow rate of GWWTP during the study period.
The removal efficiency average was nearly constant and less than 25% in the
same period with high variation. The maximum removal efficiency was 55.2% in
February 2003 which indicates nitrification-denitrification processes occurred for the
ammonia at that time as shown in the table in annex (1).

A.4ِ5
Removal Eff. Of N-KJD in GWWTP Vs Effluent Flow from Year 2000 to 2004
0
10
20
30
40
50
60
70
80
90
Jan/
1999
Jul/1
999
Jan/
2000
Jul/2
000
Jan/
2001
Jul/2
001
Jan/
2002
Jul/2
002
Jan/
2003
Jul/2
003
Jan/
2004
Jul/2
004
Jan/
2005
Year
N-K
JD (m
g/L)
0
10
20
30
40
50
60
70
N-K
JD R
emov
al E
ff. %
N-KJD (mg/L) Removal Eff. N-KJD%_Detail Linear (Removal Eff. N-KJD%_Detail) Linear (N-KJD (mg/L))
Figure 4.13: Variation of the average removal efficiency and effluent average values of the TKN of
GWWTP for the period 2000 to 2004.
The major problems likely to arise from sewage effluent discharges are
nutrient enrichment (Eutrophication) with its associated algal blooms and deaeration
of the watercourse resulting from oxidation of ammonia to nitrate by nitrification.
Where nitrification does occur, and water is abstracted as a potable source, there is the
associated problem of nitrate toxicity. Although sewage effluents are not the only
source of nitrogen pollution, they are major one, and also the one which is most
amenable to control.
The reduced form of total nitrogen content of a wastewater is often referred to
as the Total Kjeldal Nitrogen (TKN). During any biological treatment process, from
20-30% of the total nitrogen is removed in cell synthesis by ammonification, in
addition a small fraction of the influent nitrogen will be removed during the
sedimentation process (Crites, Tchobanoglous, 1998) In order to remove the
remaining ammonia, a nitrification followed by denitrification processes should be
undertaken. The average removal efficiency of TKN for the last five years was about
23% in average, which is in the range of the theoretical value as shown in figure 4.13.
The removal efficiency of GWWTP for the TKN is not related to temperature or to
hydraulic load of the plant. There is no clear trend for the removal efficiency in winter

A.4ِ6
when the temperature and flow decrease, or in summer when the flow and
temperature increase. The GWWTP was not upgraded to nutrients removal, this is
explained as follows; a soluble BOD5 as low as 20 mg/l is required before sufficient
oxygen is available to permit nitrification (Horan, 1991) and this value of the BOD5
can never be achieved by the existing trickling filters according to the upgrading
design. The nutrient removal is highlighted in this research as part of the evaluation of
GWWTP for this aspect.
4.1.6 Faecal Coli form (FC)
Faecal Coli form (FC) is used as an indicator parameter for the potential
removal of biological contamination. Figure 4.14 presented the average values of
influent and effluent Faecal coli form of GWWTP in the study period from 2000 to 2004. The
average values of FC in influent were 5x10⁸ cfu/100cm while the average values of
FC in the effluent is 6x10⁶ cfu/100cm. The difference between the influent and
effluent FC is two logs of cfu/100cm, which indicates a very low microbiological
removal efficiency of GWWTP. One log is removed in the anaerobic pond and one is
removed in the facultative pond (final settling channel).
Performance of FC_Influent Vs FC_Effluent in GWWTP from Year 2000 to 2004
1
10
100
1000
10000
100000
1000000
10000000
100000000
1000000000
10000000000
Jan/
1999
Jul/1
999
Jan/
2000
Jul/2
000
Jan/
2001
Jul/2
001
Jan/
2002
Jul/2
002
Jan/
2003
Jul/2
003
Jan/
2004
Jul/2
004
Jan/
2005
Year
TDS
(mg/
l)lo
g Sc
ale
FC_Influent FC_Effluent Linear (FC_Influent) Linear (FC_Effluent) Figure 4.14: Average values of influent and effluent Faecal coli of GWWTP in study period from
2000 to 2004.
The plant is equipped with a chlorination station with dosing pumps and the
sodium hypochlorite should be used for disinfection. Due to lack of financial

A.4ِ7
resources, the chlorination unit had been stopped since the summer of 1999 and this is
the main reason of having the high values of the Faecal Coliform in the effluent. The
discharged effluent to the sea or to the infiltration basins will have a bad
environmental impact on the on the aquifer and bathing seawater quality, and it is
worth mentioning here that the beach was closed for bathing for three consecutive
summers(2004,2005,2006).
4.2 Performance of each of the GWWTP Components
The existing GWWTP plant facilities consist of three anaerobic ponds in
series followed by an aerated lagoon and two bio-towers (see figure 2.1). The aerated
lagoon is equipped with floating mechanical aerators and the bio-towers are filled
with high-density plastic media. The bio-tower effluent is directed to an effluent
polishing pond where solids sedimentation occurs and limited solids collection is
possible. The assessment of the performance of each component of the plant is
important to identify whether each component is performing according to the
proposed performance and highlight the deficiencies in the system.
Contrary to the data available for the whole system, the data for each
component performance is little and rare. The tests for the BOD5, COD, and TSS
were only performed upon request when there is a problem in the system results and a
need for maintenance is required. Another factor for the limited number of the tests
for each component of the system is the cost of such tests and the efforts required to
be performed by the lab and operation teams. The available data analyzed in this
research are scattered for short intervals of time but almost covers the performance of
each system component along the study period which gives a good indicator for their
performance.
In the last quarter of the year 1999 and upon a request from MOG Mayor, Dr.
Afifi conducted a COD test for each of GWWTP components with the operation of 7
aerators and 14 aerators in the period from 27/9/1999 to 3/10/1999 to determine
whether it is economic to operate the 14 aerators. The COD test was chosen due its
short time results. The results of the removal efficiency are demonstrated in the
following two graphs (4.15a, 4.5b) which represent the cumulative removal efficiency
of the combined components for the whole system (Annex c).

A.4ِ8
Lago
on 1
&2
Lago
on 3
Bio
Tow
er
Aer
atio
n La
goon
Final Sed.
0.00%
10.00%
20.00%
30.00%
40.00%
50.00%
60.00%
70.00%
80.00%
90.00%
100.00%
Different Components of GWWTP
Rem
oval
Effi
cien
cy
Figure 4.15a: The cumulative removal efficiency of each component of GWWTP for the
period from 27/9/1999 to 3/10/1999.
Lagoon 1&2
Lagoon 3
Aeration Lagoon
Bio Tower
Final Sed.
0.00%
10.00%
20.00%
30.00%
40.00%
50.00%
60.00%
70.00%
80.00%
90.00%
100.00%
1 2 3 4 5
Figure 4.15b: The removal efficiency of each component of GWWTP for the period from
27/9/1999 to 3/10/1999.

A.4ِ9
In the year 2003, GWWTP was under the direct supervision of the operator
Lions Des Eau & Khatib and Alami( LEKA) of the World Bank project and the
operator( LEKA) made contracts for cleaning the two initial sedimentation lagoons
and replaced the arms of the Bio-Tower, and to evaluate the results of his work, BOD5
tests were made for each components of GWWTP and the results are given in annex
C. Figure 4.16 demonstrate the cumulative BOD5 removal efficiency of different
treatment system components which is most reliable of the results.

A.5ِ0
Lago
on 1
&2
Lago
on 3
Bio
Tow
er
Aeration Lagoon
0%
10%
20%
30%
40%
50%
60%
70%
80%
90%
100%
Different Components of GWWTP
Cum
lativ
e R
emov
al E
ff. (
%) o
f BO
D
Figure 4.16: Cumulative BOD5 removal efficiency of GWWTP components for the period of
February and June 2003.
4.2.1 Initial Sedimentation Lagoons 1&2
The objective of treatment by sedimentation is to remove readily settleable
solids and thus reduce the suspended solids content. Primary sedimentation is used as
a preliminary treatment step in the further processing of the wastewater. Efficiently
designed and operated primary sedimentation tanks should remove from 50 to 70
percent of the suspended solids and from 25 to 40 percent of BOD5 (Crites and
Tchobanoglous, 1998).
Comparing the available data for measuring the removal efficiency of the two
initial sedimentation lagoons, it is clear that at the beginning of the operation of
GWWTP in 1999 the BOD5 removal efficiency was more than 40% (figure 4.15). A
well designed sedimentation tank can remove 40% of the BOD5 in the form of settle
able solids (Horan, 1991). In the year 2003, the BOD5 removal efficiency dropped to
almost 25%. The plant has no grit removal chamber and hence all grit and sand
coming from the sewage pumping stations was settled in the two initial sedimentation
lagoons and compiling, leading to decrease in the volume and retention time in the
two lagoons. Since the plant started operation in late 1998 till 2003 without sludge

A.5ِ1
cleaning of the sedimentation lagoons which represent additional reason behind the
drop in the removal efficiency of this unit. Further to that, the increase of the
hydraulic load was significant in this period which decreased the retention time.
4.2.2 Anaerobic Lagoon 3
In the year 2003, the BOD5 removal efficiency was about 27% which means
that the removal efficiency of the anaerobic lagoons was not altered with time and the
increase of average flow. The average daily flow for the year 2003 was about 44, 000
m3/day and a maximum flow of about 52, 000 m3/day. The explanation for this is that
the total volume of the three anaerobic lagoons together is approximately 80,000 m3
which gives a retention time for the influent of 44, 000 m3/day for two days which is
enough for the anaerobic lagoon to remove the designated value of the BOD.
The total BOD removal for the three anaerobic lagoons was 50% as shown in
figure 4.16, which is according to the theoretical values of 40-60% BOD5 removal
(Horan, 1991).
4.2.3 Bio-Tower
In the upgrading design of GWWTP performed by the USAID considered the
bio-towers as the main organic treatment component in the GWWTP and the
calculation of the removal efficiency was about 85% given that the average
temperature in summer is 30 degrees and the average in winter is 20 degrees (CAMP,
1997). The records of GWWTP show that the average summer temperature is 27
degrees and winter average temperature is 18 degrees. The normal BOD5 removal
efficiency ranges from 80 to 85 percent for high rate trickling filters (Qasim, 1998)
with little nitrification.
The results of the data collected within the years 1999, 2002 and 2003 showed
that the removal efficiency of the Bio-tower was almost constant and was around 75%
of the filtered BOD5 (after settling) as shown in figure 4.17. This is clear when taking
the average BOD5 removal of the Bio-Tower for the three years as shown in Annex F.
According to the formula (Metcalf, Eddy, 1991) of calculating the removal efficiency
of the trickling filters, the efficiency drop could appear significantly if the change in
the loads is significant.

A.5ِ2
Removal Efficiency Of Bio-Tower
60.0
65.0
70.0
75.0
80.0
85.0
27-S
ep-9
9
28-S
ep-9
9
29-S
ep-9
9
30-S
ep-9
9
02-O
ct-9
9
03-O
ct-9
9
16-O
ct-0
2
24-D
ec-0
2
28-J
an-0
3
18-F
eb-0
3
19-A
pr-0
3
22-A
pr-0
3
26-A
pr-0
3
03-M
ay-0
3
10-M
ay-0
3
17-M
ay-0
3
03-J
un-0
3
17-J
un-0
3
Time (Years)
Rem
oval
Effi
cien
cy %
R.Eff.% Linear (R.Eff.%)
Figure 4.17: The measured removal efficiency of GWWTP Bio-Tower throughout the years: 1999,
2002, and 2003.
The annual increase in flow of GWWTP in the period from the year 2000 to
the year 2003 was around 1000 m3 each year and the only a jump in the flow was in
2004 (around 4000 m3/year). Unfortunately there are no records for the year 2004 to
measure the removal efficiency of each component of GWWTP although it is
expected according to theoretical calculations for a flow of 55000 m3/day to drop to
63% removal of BOD and this is close to realistic since the recorded values for the
years 1999, 2002 and 2003 are almost typical to the calculated values.
The filters are not designed for Nitrogen removal as mention before and no
data is available to measure the performance removal of it. According to (Qasim,
1998), the nutrient removal efficiency ranges from 8-15% for the high rate trickling
filters.

A.5ِ3
4.2.4 Aerated Lagoon
Aerated treatment systems are those in which microorganisms remain in
suspension, and aerobic conditions prevail. For Modified aeration, the process is used
as an intermediate treatment to reduce the organic loading in subsequent process. It is
similar to conventional treatment with short aeration period (2-3 hours) (Qasim,
1998). In general, the overall BOD5 removal efficiency of the aerated lagoons ranges
from 40-80% and the soluble BOD5 removal ranges from 90 to 97 % (Qasim, 1998).
The only available data found for the removal efficiency of the aerated lagoons was
on September and October 1999 and only for one week time. The COD removal
efficiency is shown in figure 4.18.
7 A
erat
ors 7
Aer
ator
s
7 A
erat
ors
14 A
erat
ors
14 A
erat
ors
14 A
erat
ors
0.00
10.00
20.00
30.00
40.00
50.00
60.00
70.00
80.00
90.00
100.00
Day 1 Day 2 Day 3
Rem
oval
Eff
icie
ncy
(%)
Figure 4.18: COD removal efficiency of Aerated Lagoons of GWWTP for the period from 25
September to 5 October 1999 for 7 and 14 aerators operation.
The average removal efficiency for the aerated lagoons was around 15%
according to the operation scheme of GWWTP. The removal efficiency of the aerated
lagoons using 14 surface aerators exceeds the removal efficiency using 7 aerators by
an average of 5-10% as can be shown in figure 4.18 which is considered very low and
negligible . This is related to the scheme of the flow of wastewater through the
treatment plant since the water passes through the Bio-Tower before passing the
aeration lagoons. The logic for this is based on the nature of the organic material in
wastewater. A portion of the BOD is readily biodegradable and is removed rapidly by
A.5ِ4
the filters, the remainder is less readily degradable and in overloaded filters this
fraction is discharged to the next treatment component which in GWWTP case is the
aerated lagoon. For the reason that the remained organic substance is biodegraded
more slowly, it requires more retention time in the aerated lagoons to be removed
completely which is not the case on GWWTP and hence the removal efficiency is
considered to be low in the aerated lagoons.
4.2.5 Final Sedimentation Tank
The removal efficiency of the final sedimentation tank (clarifier) could reach
up to 40% of the BOD (Qasim, 1998). As fig.4.15a show that removal efficiency of
the final sedimentation tank reached to around 15%. The role of the final clarifier is
important since after the biological treatment process either by aeration or by the
trickling filter, the TSS need to be settled after the turbulence caused by the biological
treatment process. It is clear that the removal efficiency of the final sedimentation is
much below the theoretical proposed values due to the over loading of the plant.
4.3 Proposed System Modifications
There are three main problems facing GWWTP that are hindering the goal of
the treatment process. The hydraulic load is the most urgent problem that needs to be
solved. The high values of the TSS, which also settles in the lagoons leading also to a
decrease in the hydraulic capacity of the plant, need also to be solved. A treatment
management process needs to be recognized that will attain the effluent quality.
4.3.1 Hydraulic Capacity Proposed Modification
This research reviewed individual unit processes and evaluated many
treatment alternatives. Due to the unique conditions and constrains of the Gaza strip,
the following parameters were set as an evaluation criteria for the selection of any
new treatment process for the GWWTP:
1. Land Availability
2. Construction Cost
3. Running Cost ( Operation and Maintenance)
4. Local Operating Experience
5. Process Performance

A.5ِ5
Three options seem to be the most practical for the expansion and upgrading
of GWWTP:
• Construction of a new anaerobic lagoon.
• Construction of a new trickling filter.
• Modification of the process to activated sludge
4.3.1.1 Alternative 1: Addition of a new Anaerobic Lagoon
Anaerobic ponds are simple and effective for small plants if combined with an
aerated pond and a clarifier. An effective anaerobic lagoon of a capacity of 50,000 m3
(24000 m2) would increase the retention time of the current flow into more than two
days. According to the estimated construction cost (CMWU, 2005), the required
budget will be around U.S $ 300,000, and the running cost is considered to be very
low.
4.3.1.2 Alternative 2: Bio-tower
The biotower alternative consists of converting the Anaerobic Pond No.3 to an
aerated lagoon and adding an additional biotower (CAMP, 2001). The aerated
lagoons will run in series with the biotower group, and the biotowers will run in
parallel. The power consumption for the proposed aerators and the biotower pumps is
considered to be very high, and putting into consideration the required maintenance
for the machinery and biotower arms, this option's running cost is considered to be
very high. The construction cost of this alternative is estimated to be U.S. $ 2.5
million (PWA, 2001). Around 5000 m2 area is required for this alternative, and since
the existing of these biotowers in GWWTP, the local experience with operation and
maintenance for this option is considered to be good.

A.5ِ6
Figure 4.19: flow diagram for Alternative 2: Addition of a new trickling filter .
Inlet Chamber
Sedimentation Lagoon No.1
Aeration Lagoon
Final Settling
Channel Trickling
Filter
Proposed Trickling
Filter
Sedimentation Lagoon No.2
Collection Chamber
Effluent
Proposed Aeration Lagoon
Proposed New
Clarifier

A.5ِ7
4.3.3.3 Alternative 3: Activated Sludge
The activated sludge alternative consists of converting Anaerobic Pond No. 3
to an activated sludge aeration basin and converting the existing aerated lagoon also
to an activated sludge aeration basin. The activated sludge facility would run in
parallel with the existing biotower group. This system is never practiced before in
Gaza strip and no local experience is available to run such a system. Land is
considered to be minor for this option, but the construction cost is estimated to be
U.S. $ 3.0 Million (CAMP, 2001). The running cost for blowers, aeration system,
return sludge pumps and thickener pumps is considered to be very high. The quality
of the effluent of the activated sludge is considered to be the best among all the
available alternatives.
The comparison between the three options is shown in table 4.2 below were
values of Minimum (min), Moderate (Mod) and Maximum are given for the
evaluation criteria.

A.5ِ8
Figure 4.20: flow diagram for Alternative 3: Activated Sludge option
Return Sludge
Inlet Chamber
Sedimentation Lagoon No.1
Activated Sludge
Aeration Basin
Final Settling
Channel Trickling Filter
Trickling Filter
Sedimentation Lagoon No.2
Collection Chamber
Effluent
Activated Sludge
Aeration Basin
Proposed New
Clarifier

A.5ِ9
To evaluate the most appropriate treatment process for the proposed for
GWWTP, seven criteria were evaluated and weight by academics, municipal staff
working in the GWWTP, consultants and Palestinian Water Authority wastewater
project managers and the result of the survey is shown in Fig.4.2 and the
questionnaire is demonstrated in Annex H.
The Running (O&M) is the most important factor in the evaluation criteria due
to the economic situation in Gaza and the sewage treatment cost is not incurred in the
municipal billing system , so it was given a higher weight in the evaluation process.
The Process Performance was given a lower weight in the evaluation (the second
rank). The three remaining criteria (Land, Sludge Handling, Land Availability and
Local experience) are given almost the same weight in the evaluation due to the
equity between them in the importance according to the survey. Table 4.2 shows the
proposed weights for each criterion.
Criteria Weight % Comments Land Availability 15 Area Required in m2
Construction Cost 13 Amount in U.S.$
Running Cost 26 Amount in U.S.$/ year
Process Performance 19 The BOD/TSS in influent
Sludge Handling 14 Sludge degradation
Local Operating Experience 13 Available or not Available
Table 4.2: The evaluation criteria and their weights according to
Questionnaire.
The land availability is calculated in Annex E for the proposed Anaerobic
lagoon and the land required for the trickling filter option is measured according to
the existing ones in GWWTP. The third option is estimated from the USAID study in
2001, the Feasibility Study and Conceptual Design for Gaza Wastewater Treatment
Plant.
The running cost is calculated for the third treatment option (activated Sludge)
from the cost equations given in Annex C in (Qasim.1999) which is derived from the
EPA's Area wide Assessment Procedure Manual: Performance and Cost, and the the

A.6ِ0
running cost for the first alternative is calculated from the data available for GWWTP
at an average daily flow of 52000m3 /day and the value of the second option is also
calculated from the available data for the power consumption of the trickling filters
and the aerators. While the construction cost is mentioned in the CMWU report for
the first option and in the USAID Feasibility Study for the other two options. The
sludge handling will be given three values (Excellent, Good and Poor) depending on
the process retention time and sludge degradation, while the process performance will
be given the values of BOD theoretically expected from the proposed process
configuration, and the local operating experience will be given one of the three
values( highly available, available and little available).
Treatmen
t process
Land (m2)
Availability
(requirement
Constructi
on Cost
(US$)
Running
Cost
(US$/ year)
Process
Performance
Sludge
Handling
Local
Operating
Experience
Anaerobi
c lagoon
(Alt.1)
15,000
300,000
153,500
35
Excellent
Highly
Available
Trickling
filter
(Alt.2)
4,000
2,500,000
209000
30
Good
Available
Activated
sludge
(Alt.3)
4,000
3,000,000
274,500
20
Poor
Little
Available
Table 4.3: comparison between the proposed three alternatives of treatment for the
GWWTP modification.
The evaluation of the best option for the treatment process is shown in table
4.4. which shows that Alternative (construction of an anaerobic pond and splitting the
flow) is the best option according to the proposed criteria?

A.6ِ1
Criteria Max
Wt.
Alternative(1) Alternative(2) Alternative(3)
Land
(requirement)
15
4
15
15
Construction
Cost.
13
13
1.6
1.3
Running
Cost.
26
26
19
14.5
Process
Performance
19
10.9
12.7
19
Sludge
Handling
14
14
10.5
7
Local
Operating
Experience
13
13
13
6.5
Total 100 80.9 71.8 63.3
Table 4.4: The weighted evaluation of the three criteria according to the proposed
Criteria.
By the year 2011, the peak influent flow is expected to reach 70,000m3/day
(CAMP, 1999.). The year 2011 was the proposed date for the operation of the Central
Wastewater Treatment Plant in Bureij, which was proposed and financed by the KfW.
An anaerobic lagoon with a capacity of 78,600 m3 and a clear depth of 4 m will
increase the retention time of the influent for more than two days (see Annex E)
which will produce the best removal efficiency for the anaerobic treatment which is
important in decreasing the BOD and settleable solids and decreasing the load and
improving the removal efficiency for the next treatment processes. The choice of the
construction of anaerobic lagoon seams to be suitable since the construction cost of
such a lagoon will not exceed US$300,000 and the removal efficiency of the
anaerobic lagoons could reach up to 60% of BOD and up to 70% of the TSS. The
proposed space for this lagoon is available within the land area of GWWTP between
A.6ِ2
the two initial sedimentation lagoons and the second anaerobic lagoon (see figure
4.19). The required surface area of the proposed lagoon is 28,000 m2.
The piping system between the newly proposed lagoon and the other
anaerobic lagoons needs to be scaled according to the assumed influent (70,000 m3).
Also the rest of the piping system within the treatment plant needs to be redesigned
according to the expected peak flow of 70,000m3. The most dominant part of the
GWWTP for the hydraulic capacity is the effluent pumping station which is limited to
maximum flow of 48,000 m3/ day.
4.3.2 Proposed Modification for TSS Removal Efficiency
The analysis of the results shows increased values of TSS than normal
conditions. The high TSS content of the effluent will affect the reuse purpose of the
effluent specially when used in the percolation lagoons to recharge the aquifer. It also
affects the media of the trickling filters by clogging and thus affects the performance
of the trickling filters. Moreover, the existence of sand in the water will cause wear
problems for the pumping stations of the bio- tower and effluent pumps.
The high sand and grit content in the influent led to the settling of the sludge
and grit in the two sedimentation lagoons at the inlet of the treatment system. That
almost filled them completely, reducing the hydraulic capacity of the plant and hence
decreasing the treatment efficiency of GWWTP. A grit removal channel along with a
final sedimentation tank (final clarifier) is proposed to be added to the plant. The
proposed grit removal channel could be constructed to the southern part of the inlet
flow chamber of the GWWTP parallel to the two initial sedimentation lagoons (figure
4.19) with a total length of 31 m and a depth of 2.5 m (see Annex G) with an option to
divert the flow from the channel to the two initial sedimentation lagoons in case of
cleaning the channel. The land is available within the area of GWWTP for the
proposed grit removal channel and the estimated cost for construction is
US$40,000(CMWU, 2005). The removal of grit could be done using a normal
wheeled excavator on a weekly basis.
Since the settling channel in the final settling lagoon will be hydraulically
overloaded, it will be working only as a distribution and flocculation unit. Settling
will take place mainly in the main part of the settling lagoon. In order to improve the
flocculation of the sludge and hence the settlement efficiency, a baffle could be

A.6ِ3
constructed as a floating curtain wall along the overflow weir. By including a bottom-
up flow, using the effect of a "floc-filter", sedimentation could possibly be improved
and thus effluent TSS is minimized. Land is available for the construction of the final
sedimentation tank in the southern area of the final settling pond (figure 4.19). The
estimated construction cost for the tank will be around US$180,000.
4.3.3 Proposed Flow Scheme
To have the optimal performance of the biological treatment units, the Bio-
Towers with the highest removal efficiency in the GWWTP SYSTEM and the
Aerated Lagoon, the flow after the anaerobic lagoons should be split into two flows:
one for the bio-towers and the other to the aeration lagoon (figure 4.19). The
maximum flow to the bio-towers should not exceed 34,000m3 to attain an 80%
removal efficiency of the bio-towers according to the design criteria (USAID, 1996).
Parallel operation of trickling filter and aerated lagoon reduces the load to the aerated
lagoon (limited aeration capacity) and uses the BOD removal capacity of the trickling
filters to a higher extent. The hydraulic head losses can be reduced as well.
This measure should be implemented directly after cleaning the anaerobic
lagoons, since this can be done without additional equipment and cost.

A.6ِ4
35,000m3 35,000m3
70,000m3
35,000m3
35,000m3
17,500m3 17,500m3
70,000m3
Figure 4.21: Proposed Flow Scheme and Proposed System Modifications of
GWWTP.
Inlet Chamber
Sedimentation Lagoon No 1
Anaerobic Lagoon No
3
Aerated Lagoon
Final Settling
Channel
Trickling Filter
Trickling Filter
Sedimentation Lagoon No2
Collection chamber
Proposed
New Anaerobic
Pond
Proposed New Grit Removal Chamber
Proposed New Settling Channel Effluent
Influent
A.6ِ5
4.3.4 Plant Management
Since October 2004 the GWWTP lab was out of work due to the Israeli
aggression against the plant. The automatic sampler was also stopped since then and
up to this date the sampler and the lab are not in performance. Moreover, the flow
meter of the plant is also out of service since February 2004. Before the withdrawal of
the Israeli Army from Gaza Strip, it was dangerous and some times forbidden to go to
GWWTP. The MOG, even with the bad financial situation, could have made the flow-
meter and the sampler repaired or replaced because of the importance of these two
instruments for the monitoring program of the effluent of GWWTP. The lab should be
independent from the plant operation department from the administration point; the
lab should be reporting any abnormal result in the various plant components
immediately and daily to the water and wastewater department head who takes the
necessary actions in case of any operational deficiency.
There should be a clear daily, weekly and monthly check list for the
operational personnel along with a clear job description for each member and a clear
plan for the preventive maintenance on a weekly, monthly and yearly basis to keep
the plant in good shape. Moreover, a quality assurance and instruments calibration
plan for the lab with the periodic maintenance plan for the instruments. Removal
efficiency of each plant components should be measured at least once monthly; in the
summer and winter to have a more specific indicator about the performance of the
plant.
Finally, a detailed training program along with the human resources
management plan should prepared to highlight the needs of the operation team and lab
staff.

A.6ِ6
CHAPTER 5: CONCLUSIONS AND RECOMMENDS
5.1 Conclusions
The parameters which led to the bad performance of GWWTP were
highlighted by analyzing the historical records of GWWTP in the period from the
year 2000 to the year 2004 when the GWWTP lab was destroyed by Israeli army and
the sampler was completely stopped and the flow meter was out of service. The
research came with the following conclusions:
1. The GWWTP was upgraded to receive 32,000m3/ day influent, a value which was
attained in the first year the plant was in operation. Due to the natural increase in
population and new area connection to the sewage network, the influent to
GWWTP has continued to increase dramatically and today it is estimated to be
around 55,000m3/ day. So, the plant is hydraulically over loaded and thus the
water retention time in the plant is cut into half the designed period leading to
poor plant performance in the treatment process.
2. The TSS is higher than usual in both influent and effluent. For influent the reason
behind this high value is the malfunctioning of the sand traps and grit removal in
the sewage pumping stations and this value continues to be high throughout the
plant treatment stages leading to high maintenance cost and bad effluent quality
for reuse purposes especially for infiltration.
3. The removal efficiency of GWWTP has decreased throughout the years from
2000 to 2004 from 95% to 91% for the BOD and from 96% to 88% for the TSS
and from 91% to 87% for COD. The main components of the plant which is the
bio-tower and the anaerobic lagoons are performing with less than there design
removal efficiency, which reflected in general as deterioration in the treatment
process for GWWTP. This problem was basically due to the underestimates in the
design criteria for the projected flow for the period in which the plant should be
operating and the proposed design temperatures for summer and winter.
4. The removal efficiency of the Faecal Coli form is very minor limited only to two
logs and the effluent content of the coli form is considered to be high putting in
mind that this effluent will be discharged to the sea or sometimes used for
agriculture which will cause bad environmental impact on man. In addition, the
plant is not designed for nutrient removal.

A.6ِ7
5. The absence of financial resources from the MOG to be allocated for the GWWTP
had led to significant operation and maintenance problems such as the compilation
of sludge in the anaerobic and settling tank which decreased the treatment process
dramatically and the disability of the MOG to remove the garbage packed at the
eastern side of GWWTP which has led to many problems due to flying plastic
bags into machinery and treatment equipments.
6. The absence of a grit removal channel had led to the accumulation of sand which
was combined with sludge in the two initial sedimentation lagoons and the
anaerobic lagoon leading to significant decrease in the volumes of these anaerobic
lagoons and hence decreasing the retention time significantly which was finally
reflected on the removal efficiency of the plant.
7. The study proposed system modifications includes hydraulic capacity
modification, modification for TSS removal efficiency, proposed flow scheme and
plant management system.
8. There is no difference between operating 7 aerators and 14 in the removal of
organic matter from the wastewater influent (BOD &COD) in the GWWTP in the
current operation scheme.
5.2 Recommendations
• The political situation in Gaza is unstable and consequently affects the donors
contribution towards developing the water sector in general and temporarily
solutions becomes permanent solution. So GWWTP should be part of the
development plant of the Palestinian Authority until a real sensible alternative is
existed on the ground.
• Due to the population growth and sewer connections to GWWTP, it is
recommended to allocate some land in GWWTP neighborhood for any future
expansions of the plant.
• There should be a clear Operation and Maintenance plan for the plant a long with
a proposed budget to be allocated either from the CMWU or others.
• To implement personnel safety program including the necessary training, proper
safety clothes and the necessary premises for cleaning and taking food. A first aid
material should always be available for any accidents at site.

A.6ِ8
• To construct the proposed new anaerobic lagoon and the grit removal channel and
the final sedimentation tank with an estimated cost of US$ 520,000 which will
sustain the plant till the year 2015.
• The lab instruments are out of date and a complete lab instruments should be
supplied along with an automatic refrigerated sampler for day and night flows
along with portable instruments for site inspections. • To adopt flow- proportional composite sample technique in taking the samples for
more accurate and reflecting results.
• The solid waste dumping site should be removed as soon as possible and should
be in the first priorities of MOG for its effects on the environment, aquifer and the
operation and maintenance cost of GWWTP. Moreover, the removal of this site
could make at lest 20 donems of land available expansion of GWWTP.
• The sand and grit removal screens in sewage pumping stations to GWWTP should
be maintained and operated properly to reduce the quantities of sand entering into
GWWTP and thus reduce the desludging time and cost of initial sedimentation
lagoons and enhance the removal efficiency of the plant.

A.6ِ9
Glossary Aerated lagoon: A holding and /or treatment pond that speeds up the natural
process of biological decomposition of organic waste by stimulating the growth
and activity of bacteria that degrade organic waste.
Aerator (mechanical): A means of aerating wastewater to increase dissolved
oxygen, to enhance aerobic treatment and reduce offensive odors.
Aerobic Treatment: Process by which microbes decompose complex organic
compounds in the presence of oxygen and use the liberated energy for
reproduction and growth. (Such process include extended aeration, trickling
filtration, and rotating biological contactors).
Algae: Simple rootless plants that grow in sunlit waters in proportion to the
amount of available nutrients. They can affect water quality adversely by lowering
the oxygen content of water.
Anaerobic: A biological environment that is deficient in all forms of oxygen,
especially molecular oxygen.
Biochemical Oxygen Demand (BOD): A measure of the amount of oxygen
consumed in the biological process that breaks down organic matter in water. The
BOD is an indicator for pollution.
Bio-filter: Known also as trickling filter, bacteria bed, or percolating filter. It is a
reactor of rectangular or circular plan which is filled with a permeable media.
Wastewater is distributed mechanically over the media and percolates down the
filter to collect in an under drain system at its base. A microbial film develops
over the surface of the media and this is responsible for removal of BOD during
passage of sewage through the bed.
Chemical Oxygen Demand (COD): A quick chemical test to measure the oxygen
equivalent of the organic matter content of wastewater that is susceptible to
oxidation by a strong chemical reagent.
Detention (Retention) time: The theoretical length of time for water to pass
through a basin or tank, if all the water moves with the same velocity.
Dissolved Oxygen (DO): The oxygen dissolved in water, wastewater, or other
liquids; usually expressed in milligrams per liter, parts per million, or percent of
saturation.

A.7ِ0
Domestic Wastewater: Wastewater that comes primarily from dwelling, business
buildings, institutions, and does not generally include industrial or agricultural
wastewater.
Effluent: Treated wastewater discharging from a water or wastewater treatment
plant.
Grab Sample: A single sample collected at a particular time and place that
represents the composition of the water, air, or soil only at that time and place.
Grit chamber: A chamber or tank that is used in primary treatment where
wastewater slows down and the heavy, large solids(grit) settle out and are
removed.
Influent: The flow of raw sewage entering the plant.
Kjeldahl Nitrogen: The combined amount of organic and ammonia nitrogen.
Also known as Total Kjeldahl Nitrogen (TKN).
Milligram per liter (mg/l): The weight of a substance measured in milligram
contained in one liter. It is equivalent to 1 part per million in water measures.
Monitoring: Periodic or continuous surveillance or testing to determine the level
of compliance with statutory requirements and /or pollutant levels in various
media or in human, plants, and animals.
Municipal sewage: Wastewater originated from a community and is composed of
domestic wastewater and/or industrial discharge.
Nitrate: A form of nitrogen found in oxygenated wastewater. Nitrate is a nutrient
for plants so it can contribute to prolific weed growth in waterways.
Nutrients: Key nutrients associated with wastewater are nitrogen and phosphorus.
Nutrients are an important contaminant in wastewater as they cause prolific weed
growth in waterways, adversely affecting ecology.
Parts per million (PPM): A measure of concentration of one unit of material
dispersed in one million units of another.
PH: An expression of the intensity of the basic or acid of a liquid; ranges from 0
to 14, where 0 is the most acid and 7 is neutral. Natural water usually have a PH
value between 6.5 and 8.5.
Phosphorus: Phosphorus is an essential element in the metabolism of biological
organisms. A minimal concentration is necessary to achieve optimum operation of
biological treatment systems. Because it has been implicated as a contributing
factor in the development of noxious algal blooms, more emphasis is being placed

A.7ِ1
on controlling the amount of phosphorus discharged in the treatment plant
effluent. Phosphorus may exist in many different forms in aqueous solutions.
These forms maybe classified as (a) orthophosphorus,(b) pyro-, poly-, and
metaphophates, and (c) organic phosphorus. The orthophosphates are of most
concern because they are freely available for biological metabolism.
Primary treatment: The first stage of wastewater treatment that removes settle
able or floating solids only; generally removes 40% of the suspended solids and
30-40% of the BOD in the wastewater.
Pump: Mechanical device that allows water to be lifted or raised.
Sampler: A device used with or without flow measurement to obtain an aliquot
portion of water or wastewater for analysis purposes. May be designed for taking
single sample (grab), composite sample, continuous sample, or periodic sample.
Sampling frequency: The interval between the collection of successive samples.
Screen: A device to remove large suspended or floating debris from wastewater.
Screening: The removal of relatively coarse floating and suspended solids by
straining through racks or screens.
Secondary treatment: The wastewater process where bacteria are used to digest
organic matter in the wastewater.
Settle able Solids: Material heavy enough to sink to the bottom of a wastewater
treatment tank.
Settling Pond: a lagoon in which settle able solids removed by gravity.
Settling Tank(sedimentation tank or clarifier): A vessel in which solids settle
out of water by gravity during wastewater or potable water treatment process.
Sewage: the spend water of a community. This term is known as wastewater.
Sewerage System: The complete sewage collection, treatment and disposal
system.
Solids: The determinations of various forms of residue are useful in controlling
wastewater treatment plant. Total Solids (TS), Suspended Solids (SS) and
Dissolved Solids (DS), and their volatile and fixed fractions, may be used to
assess wastewater strength, process efficiency, and unit loadings. Measurements
of the various residue concentrations are necessary to establish and assure
satisfactory operational control. It is important that the operator develop sufficient
knowledge of these measurements and their interpretation so that they become
routine daily process.

A.7ِ2
Stabilization: Conversion of the active organic matter in sludge into inert,
harmless material.
Standards: Norms that impose limits on the amount of pollutants or emissions
produced.
Suspended Solids: Solids in suspension in a water or wastewater which can be
removed by filtration.
Total Dissolved Solids (TDS): The sum of the inorganic and organic materials
dissolved in water.
Total Solids (TS): TS, is a term applied to the weight of material per unit volume
of sample remaining in a previously weighed crucible after evaporation of the
sample at a temperature of 103 to 105 degrees Celsius.
Total Suspended Solids (TSS): A laboratory measurement of the quantity of
suspended solids present in wastewater that is one of the main indicators of the
quantity of pollutants present.
Treated Wastewater: Wastewater that has been subjected to one or more
physical, chemical or biological processes to reduce its potential of being a health
hazard.
Wastewater Treatment Plant: A facility containing a series of tanks, screens,
filters and other processes by which pollutants are removed from water.
Wastewater: The spent or used water from a house, community, farm or industry
that contains dissolved or suspended matter.
Water-born disease: a disease spread by contaminated water.

A.7ِ3
References
Abu-Jalalah, S. (1999). Wastewater Treatment in Gaza.
http:// www.mofa.go.jp/region/middle_e/peaceprocess/ewg/mission9903/gaza2.htm
Afifi, s. (1998). Potential of wastewater reuse in Gaza-Palestine. Advantages and
disadvantages, Third International Water Technology Conference IWTC.
Afifi ,S and Nassar, A(1999). Training Course in Wastewater Treatment Plant
Management,April.
Afifi, S,(2003). Septage Treatment in A Vertical Flow Reed Bed System,
International Conference on Engineering and city Development, IU-Gaza-Palestine,
September, 2003.
Al-Jamal, K and Yaquobi, A, 2004). Water Resources Management in Gaza Strip
Al-Khaldi ,R (2006). Performance Evaluation of Beit-Lahia Wastewater Treatment
Plant in Northern Gaza Strip,March.
Austin Water. Septic Tank to Anaerobic filter to Trickling Filter with Recirculation to
Anaerobic Filter.
http://www.ci.austin tx.us/wri/treat12.htm
CAMP(Coastal Aquifer Management Program),(1999).Feasibility Study and
Conceptual Design For Gaza Wastewater Treatment Plant, P.W.A.
CAMP(Coastal Aquifer Management Program),(2001). Standard Laboratory
Procedures, Municipality Of Gaza
Coastal Municipalities Water Utility, (2005). First Quarter Report for the Gaza
Emergency Water Project( October,2005).

A.7ِ4
Crites . Tchobanoglous, (1991 ). Small and Decentralized Wastewater Management
Systems, McGraw Hill.
DORSCH CONSULT.(2005).Assessment Existing Gaza WWTP. July.
Daigger, Glen T. and Buttz, Johm A.(1992). Upgrading Wastewater Treatment Plants.
El-Hawi,M. and Hamilton,A. 2001. Public Participation in Solid Waste Management
Strategy for Essex, UL.
Elmanama, Abdelraouf,2004. the Use of Sand and Seawater in the Assessment of
Microbial Quality of Gaza Beach and Public Health.
Horan , N.J, (1990). Biological Wastewater Treatment System, John Wilet & sons
Ltd. England.
InfraMan,(2006). Water and Wastewater Sampling and monitoring program for the
Gaza Emergency Project.
Karen Mancl,(2004). Wastewater Treatment Principles and Regulations.
htt://ohioline.osu.edu/aex-fact/0768.html
Kelly & Dioxin, H (1995). Environmental scarcity and violent. The case of Gaza,
American Association for Advancement of Science, University of Toronto, Canada
Malina,Joseph F. and Pohland , Frederick G.(1992). Design of Anaerobic Processes
for the treatment of Industrial and Municipal Waste.
Logan, B.E (July,2002). Trickling Filters Design.
http://www.engr.psu.edu/ce/enve/tf.htm.
McGhee, Terence J.(1991). Water Supply and Sewerage, McGRAW- HILL
International Editions.

A.7ِ5
Metcalf, Eddy (1991). Wastewater Engineering Treatment, Disposal and reuse, 3rd
edition. McGraw Hill.
MOPIC (Ministry Of Planning and International Cooperation),(1998). Master Plan for
Sewage and Storm Water Drainage in the Gaza Governorates-Final Master Plan
Report, Main Report. Palestinian National Authority.
Municipality Of Gaza (1996). Master Plan – Analytical Studies. USAID, December.
Municipality Of Gaza (1997). Final Engineering Design Report. USAID, November.
PCBS (Palestinian Central Bureau of Statistics), (1997). Preliminary Results for the
Census of Population and Establishments, Palestinian National Authority, Ramalla.
PCBS (Palestinian Central Bureau of Statistics), (2005). Small Area Population,
Revised Estimates 2004-2005. http:/www.pcbs.org/Portals/_pcbs/population/
PNIC (Palestinian National Information Center), (1999). The Administrative Division
of Governorates. http:/www.pnic.gov.ps/English/geography/Residential
P.W.A (Palestinian Water Authority), (2004). Hydraulical Impact Assessment of
Infiltration Basins on Local Groundwater.
P.W.A (Palestinian Water Authority),(2000). Drinking Water Quality Standards
(Draft) in Gaza Strip
P.W.A (Palestinian Water Authority), 2004. fiscal report for the Gaza strip
municipalities.
P.W.A (Palestinian Water Authority),(2002). Water Resources and Management
Issues (Gaza Strip/Palestine), July.
P.W.A(Palestinian Water Authority),(1999). Wastewater Treatment Plant and Sludge
Disposal, Technical paper no.44,February.

A.7ِ6
P.W.A( Palestinian Water Authority),(1998). Wastewater Treatment Plant Operation
Manual, Technical paper no.39, July.
P.W.A (Palestinian Water Authority),(1999). Wastewater Treatment Plant Operation
Tests, Technical paper no.53, August.
P.W.A (Palestinian Water Authority), (2005). Agricultural And Municipal Water
Demand in Gaza Governorates for 2004.
Qasim, Syed R.(1999). Wastewater Treatment Plants Planning, Design, and
Operation, TECHNOMIC publishing co. Inc.
Reed, S.C, 1995. Nitrogen Removal in Wastewater Stabilization Ponds, Water
Pollution Control Federation Journal. 57(1)39-45.
Statistical Abstract of Israel, (2002). Water consumption for Israeli citizens.
Tchobanoglous, George and Schroeder, Edward D (1999). Water Quality
Characteristics, Modeling and Modification, ADDISON-WESLEY Publishing
Company.
Thomas E.Schultz (October,2005).Biological Wastewater Treatment.
http://www.usfilter.com/nr/rdonlyres/biological tr .pdf
UNEP(United Nations Environmental Program), (2003). Desk study on the
Environment in the Occupied Palestinian Territories, Switzerland.
Varon, M,(2002). Advanced Primary Treatment of Domestic Wastewater in Tropical
Countries: Development of High –Rate Anaerobic Ponds. Doctorate Thesis; School of
Civil Engineering, Leeds University; UK.
Victoria Mitchell, October.1994. Trickling filter solution, Water and Waste
Treatment, Vol.37, No.10, pp125-126.

A.7ِ7
Wolfe, M.D.Tremblay,A.M. (2001). Partial Aerated Lagoons: an Optimal Choice for
Small Community Wastewater Treatment, McGill University.
.االسكندرية. هندسة الصرف الصحى، دار صادق للنشر). 1990(العدوى، محمد صادق

A.Iِ
Annex A
Results of the GWWTP lab monitoring program data for the period from the year 2000 to 2004

A.IِI
of GWWTP2000 Results of the Year Effluent Influent Flow
BOD COD TDS TSS F.C N-KJD BOD COD TDS TSS F.C N-KJD Date m3/day mg/l mg/l mg/l mg/l cfu/100cm mg/l mg/l mg/l mg/l mg/l cfu/100cm mg/l
Jan-00 40743 23.0 65 1102 24 4.00E+06 55.0 343 817 872 936.5 6.00E+08 70 Feb-00 39472 23.0 92 1253 32 3.74E+06 45.5 502.5 968 1385 696.75 8.50E+07 65 Mar-00 38500 23.0 95 1312 29 9.50E+06 61.5 450 1010 1317 673 1.83E+08 66.5 Apr-00 40576 21.5 97 1346 23 1.62E+06 60.5 560 1136 1415 575 6.60E+08 65.8
May-00 41841 33.0 95 1287 29 7.00E+05 50.0 602 1193 1485 700 7.00E+07 62 Jun-00 44315 25.0 90.5 1360 23 4.00E+06 41.0 640 1264 1351 457 4.00E+08 60.2 Jul-00 45297 27.0 90 1406 20 7.00E+06 56.0 600 1098 1559 493 4.00E+08 67.65
Aug-00 45957 22.3 79 1514 18 4.40E+06 64.5 495 933 1540 458 3.30E+08 72.1 Sep-00 44739 23.5 79 1517 20 1.53E+06 49.0 279 752 1423 555 2.95E+08 72.1 Oct-00 45489 24.5 89 1382 22 1.00E+07 37.5 620 1194 1145 566 4.00E+08 61.15
Nov-00 37109 37.5 135 1440 35 9.80E+06 48.2 555 1130 1495 1147 5.10E+08 84 Dec-00 42693 38.0 138 1204 55 1.70E+07 57.0 980 1854 1681 969 2.63E+09 74
Average 42185 26.8 95.4 1344 28 6E+06 52.1 552 1112 1389 685.5 5E+8 68.38
for the GWWTP2001 Results of the Year Effluent Influent Flow
BOD COD TDS TSS F.C N-KJD BOD COD TDS TSS F.C N-KJD Date m3/day mg/l mg/l mg/l mg/l cfu/100cm mg/l mg/l mg/l mg/l mg/l cfu/100cm mg/l
Jan-01 37704 41 113 1204 47 7.20E+06 61.6 580 1222 1114 617 2.60E+08 93.4 Feb-01 34508.36 27 90 1202 27 8.50E+06 50.4 680 1160 1344 729 2.65E+08 56 Mar-01 38021.68 47 149 1341 38 8.75E+06 70.0 870 1660 1621 767 3.05E+08 84 Apr-01 38369.33 34 109 1410 36 5.00E+06 61.4 900 1639 1563 825 2.70E+08 74.6
May-01 39934.71 31 87 1439 32 6.20E+06 50.4 720 1433 1528 1113 3.75E+08 56 Jun-01 42806.73 37 106 1525 37 6.45E+06 53.2 610 1285 1534 527 3.80E+08 70 Jul-01 47294.84 27 91 1532 28 8.05E+06 56.0 530 1017 1504 485 1.15E+09 67.65
Aug-01 46315.84 32 99 1546 28 3.00E+06 45.0 590 1059 1572 595 7.95E+08 60 Sep-01 45779.77 27 90 1582 28 2.50E+06 44.8 560 1104 1649 679 8.00E+08 65.4 Oct-01 45808.68 27 91 1483 26 2.00E+06 40.6 810 1467 1584 815 8.20E+08 80.2
Nov-01 42721.73 27 103 1558 33 3.00E+06 50.0 1000 2180 1573 1011 7.95E+08 Dec-01 38019.13 17 77 1237 20 5.51E+06 77.0 1085 2033 1486 1137 5.65E+08 154
Average 41440 31.2 100 1422 32 5.51E+06 55.0 770 1438 1506 775 5.65E+08 154

A.IِII
for the GWWTP 2002 esults of the Year R Effluent Influent Flow
BOD COD TDS TSS F.C N-KJD BOD COD TDS TSS F.C N-KJD Date m3/day mg/l mg/l mg/l mg/l cfu/100cm mg/l mg/l mg/l mg/l mg/l cfu/100cm mg/l
Jan-02 41628.97 24 77 1128 27 2.50E+06 56.0 500 1025 1046 746 3.80E+08 39.2 Feb-02 39334.82 27 91 1358 27 50.4 563 1160 1298 729 56.0 Mar-02 36708.48 27 94 1588 29 2.50E+06 87.0 500 1009 1549 464 2.00E+08 119.0 Apr-02 38759.23 23 76 1465 23 91.0 550 1055 1634 522 102.0 May-02 42164.77 23 87 1566 31 82.0 540 1117 1591 590 90.0 Jun-02 47442.37 30 98 1658 37 60.0 770 1307 1718 592 101.0 Jul-02 49894.42 33 106 1700 44 41.0 410 826 1640 826 35.0
Aug-02 42029 32 100 1640 39 64.0 370 713 1278 459 88.0 Sep-02 47200.7 30 89 1613 46 56.0 430 842 1570 517 77.0 Oct-02 47745.71 41 140 1568 70 53.0 760 1329 1640 1320 69.0 Nov-02 43392 41 140 1437 70 53.0 760 1329 1436 1320 69.0 Dec-02 42603.9 29 94 1305 38 3.75E+06 68.0 410 925 1232 1589 3.10E+08 90.0
Average 43242 30 99.3 1502 40 2.92E+06 63.5 547 1053 1469 806 2.97E+08 77.9
of the GWWTP2003 Results of the Year Effluent Influent Flow
BOD COD TDS TSS F.C N-KJD BOD COD TDS TSS F.C N-KJD Date m3/day mg/l mg/l mg/l mg/l cfu/100cm mg/l mg/l mg/l mg/l mg/l cfu/100cm mg/l
Jan-03 37126 35 121 1421 43 4.65E+06 78 460 817 1158 454 1.06E+08 102.0 Feb-03 41744 34 111 1293 39 5.05E+06 60 420 819 1155 740 1.41E+08 134.0 Mar-03 35860 50 380 1116 107 4.75E+06 67 380 765 1083 714 5.15E+08 125.0 Apr-03 39629 43 147 1452 89 1.02E+07 72.8 350 758 1316 349 1.67E+08 103.8
May-03 40173 29 102 1569 35 4.61E+06 67 380 818 1415 1318 2.04E+08 73.0 Jun-03 51718 31 100 1754 43 4.55E+06 69 450 711 1558 364 2.16E+08 76.5 Jul-03 51804 27 88 1664 34 3.05E+06 58 340 702 1591 547 2.65E+08 78.0
Aug-03 52050 23 81 1700 29 9.10E+06 56 310 584 1528 375 2.41E+08 64.0 Sep-03 49850 25 88 1725 30 2.30E+06 56 300 598 1497 318 2.28E+08 78.0 Oct-03 47185 26 104 1721 37 2.90E+06 73 435 942 1690 436 3.60E+08 95.0
Nov-03 43620 27 92 1700 36 2.10E+06 62 530 1080 1647 663 2.03E+08 78.0 Dec-03 38867 26 108 1362 37 2.10E+06 55 490 1011 1564 617 1.60E+08 75.0
Average 44136 31.3 127 1540 46.6 4.61E+06 64.48 404 800 1434 574.6 2E+08 90.2

A.IِV
of the GWWTP2004 Results of the Year
Effluent Influent Flow BOD COD TDS TSS F.C N-KJD BOD COD TDS TSS F.C N-KJD Date
m3/day mg/l mg/l mg/l mg/l cfu/100cm mg/l mg/l mg/l mg/l mg/l cfu/100cm mg/l Jan-04 42387 38 119 1241 53 9.20E+07 61.6 395 811 1171 472 1.58E+08 77.4 Feb-04 41379 36 129 1482 54 2.30E+05 73.0 460 1052 1562 614 1.31E+08 93.0 Mar-04 40258 32 95 1549.5 47 3.30E+06 73.0 400 738 1424 460 1.13E+08 81.0 Apr-04 41167 27 95 1652 42 2.30E+06 69.2 430 890 1430 502 3.00E+08 87.0
May-04 47613 32 102 1691 51 65.0 410 831 1599 449 84.0 Jun-04 55333 33 108 1748 58 64.0 355 853 1651 467 76.0 Jul-04 59419 32 103 1708 48 2.60E+06 67.0 295 661 1706 381 2.40E+07 73.0
Aug-04 57742 29 93 1791 43 2.30E+06 73.0 370 812 1661 420 7.30E+08 86.0 Sep-04 52667 54 129 1806 76 2.20E+07 73.0 445 921 1742 543 2.40E+08 100.0 Oct-04 41194 39 129 1839 60 4.00E+06 73.0 370 726 1794 333 2.50E+08 118.0
Average 47916 35.2 110 1650.8 53 7.73E+06 69.2 393 830 1574 464 3.11E+08 87.5

B-I
Annex B
GWWTP Removal Efficiency of Organic material, Solids, Nutrients and
microbiological materials for the period from 2000 to 2004

B-II
Removal efficiency of year
2000 Removal efficiency of year
2001 Removal efficiency of year
2002 Month BOD COD TDS TSS N-kjd BOD COD TSS TDS N-kjd BOD COD TSS TDS N-kjd
Jan 93.3 92.0 -26.4 97.4 21.4 92.931 90.753 92.4 -8.1 34.0 95.2 92.488 96.38 -
7.839 42.9
Feb 95.4 90.5 9.5 95.4 30.0 96.029 92.241 96.3 10.6 10.0 95.2 92.155 96.3 -
4.622 10.0
Mar 94.9 90.6 0.4 95.7 7.5 94.598 91.024 95.0 17.3 16.7 94.6 90.684 93.75 -
2.518 26.9 Apr 96.2 91.5 4.9 96.0 8.1 96.222 93.35 95.6 9.8 17.7 95.82 92.796 95.59 10.34 10.8 May 94.5 92.0 13.3 95.9 19.4 95.694 93.929 97.1 5.8 10.0 95.74 92.211 94.75 1.571 8.9 Jun 96.1 92.8 -0.7 95.0 31.9 93.934 91.751 93.0 0.6 24.0 96.1 92.502 93.75 3.492 40.6
Jul 95.5 91.8 9.8 95.9 17.2 94.906 91.052 94.2 -1.9 17.2 91.95 87.167 94.67 -
3.659 17.1
Aug 95.5 91.5 1.7 96.1 10.5 94.576 90.652 95.3 1.7 25.0 91.35 85.975 91.5 -
28.33 27.3
Sep 91.6 89.5 -6.6 96.4 32.0 95.179 91.848 95.9 4.1 31.5 93.02 89.43 91.1 -
2.739 27.3 Oct 96.0 92.5 -20.7 96.1 38.7 96.667 93.797 96.8 6.4 49.4 94.61 89.466 94.7 4.39 23.2 Nov 93.2 88.1 3.7 96.9 42.7 97.923 95.275 96.7 1.0 20.0 94.61 89.466 94.7 -0.07 23.2
Dec 96.1 92.6 28.4 94.3 23.0 98.433 96.212 98.2 16.8 50.0 92.93 89.838 97.61 -
5.925 24.4 Average 94.9 91.3 1.4 95.9 23.5 95.6 92.7 95.6 5.3 25.5 94.3 90.3 94.6 -3 13.5
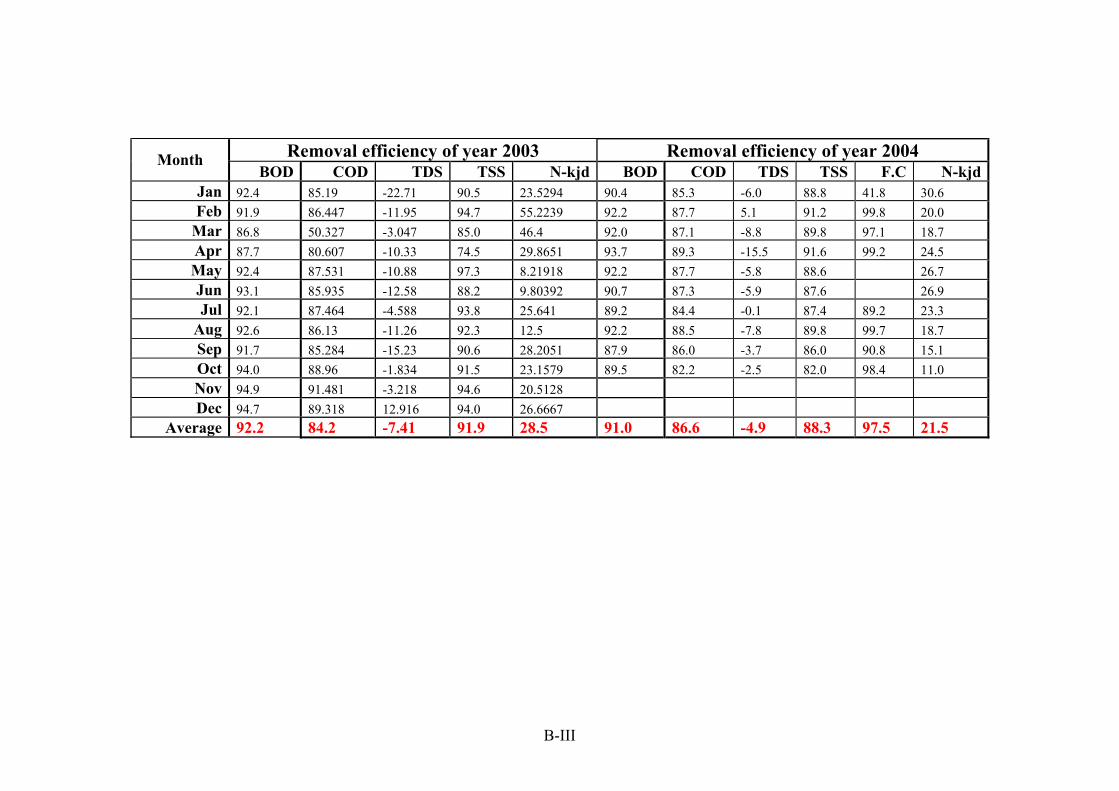
B-III
Removal efficiency of year 2003 Removal efficiency of year 2004 Month
BOD COD TDS TSS N-kjd BOD COD TDS TSS F.C N-kjd Jan 92.4 85.19 -22.71 90.5 23.5294 90.4 85.3 -6.0 88.8 41.8 30.6 Feb 91.9 86.447 -11.95 94.7 55.2239 92.2 87.7 5.1 91.2 99.8 20.0
Mar 86.8 50.327 -3.047 85.0 46.4 92.0 87.1 -8.8 89.8 97.1 18.7 Apr 87.7 80.607 -10.33 74.5 29.8651 93.7 89.3 -15.5 91.6 99.2 24.5 May 92.4 87.531 -10.88 97.3 8.21918 92.2 87.7 -5.8 88.6 26.7 Jun 93.1 85.935 -12.58 88.2 9.80392 90.7 87.3 -5.9 87.6 26.9 Jul 92.1 87.464 -4.588 93.8 25.641 89.2 84.4 -0.1 87.4 89.2 23.3
Aug 92.6 86.13 -11.26 92.3 12.5 92.2 88.5 -7.8 89.8 99.7 18.7 Sep 91.7 85.284 -15.23 90.6 28.2051 87.9 86.0 -3.7 86.0 90.8 15.1 Oct 94.0 88.96 -1.834 91.5 23.1579 89.5 82.2 -2.5 82.0 98.4 11.0 Nov 94.9 91.481 -3.218 94.6 20.5128Dec 94.7 89.318 12.916 94.0 26.6667
Average 92.2 84.2 -7.41 91.9 28.5 91.0 86.6 -4.9 88.3 97.5 21.5

C-I
Annex c
GWWTP lab data for the removal efficiency of each treatment stage for the
period from 2000 to 2004
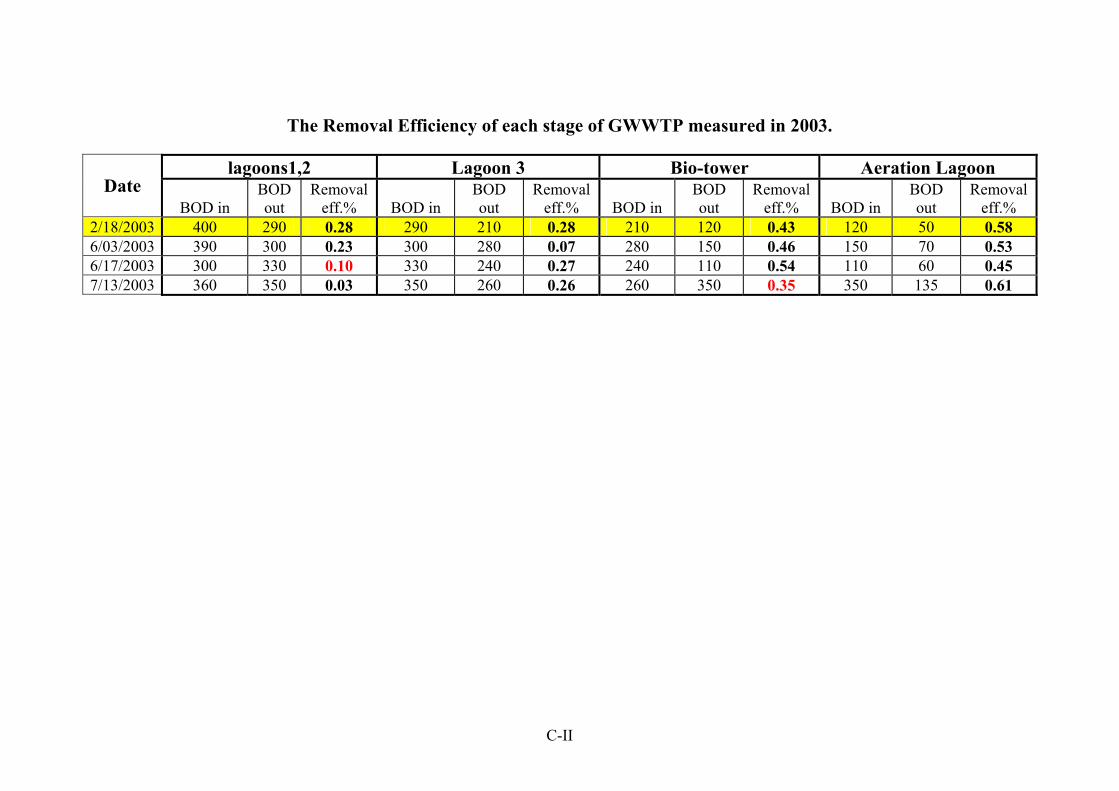
C-II
The Removal Efficiency of each stage of GWWTP measured in 2003.
lagoons1,2 Lagoon 3 Bio-tower Aeration Lagoon
Date BOD in
BOD out
Removal eff.% BOD in
BOD out
Removal eff.% BOD in
BOD out
Removal eff.% BOD in
BOD out
Removal eff.%
2/18/2003 400 290 0.28 290 210 0.28 210 120 0.43 120 50 0.58 6/03/2003 390 300 0.23 300 280 0.07 280 150 0.46 150 70 0.53 6/17/2003 300 330 0.10 330 240 0.27 240 110 0.54 110 60 0.45 7/13/2003 360 350 0.03 350 260 0.26 260 350 0.35 350 135 0.61
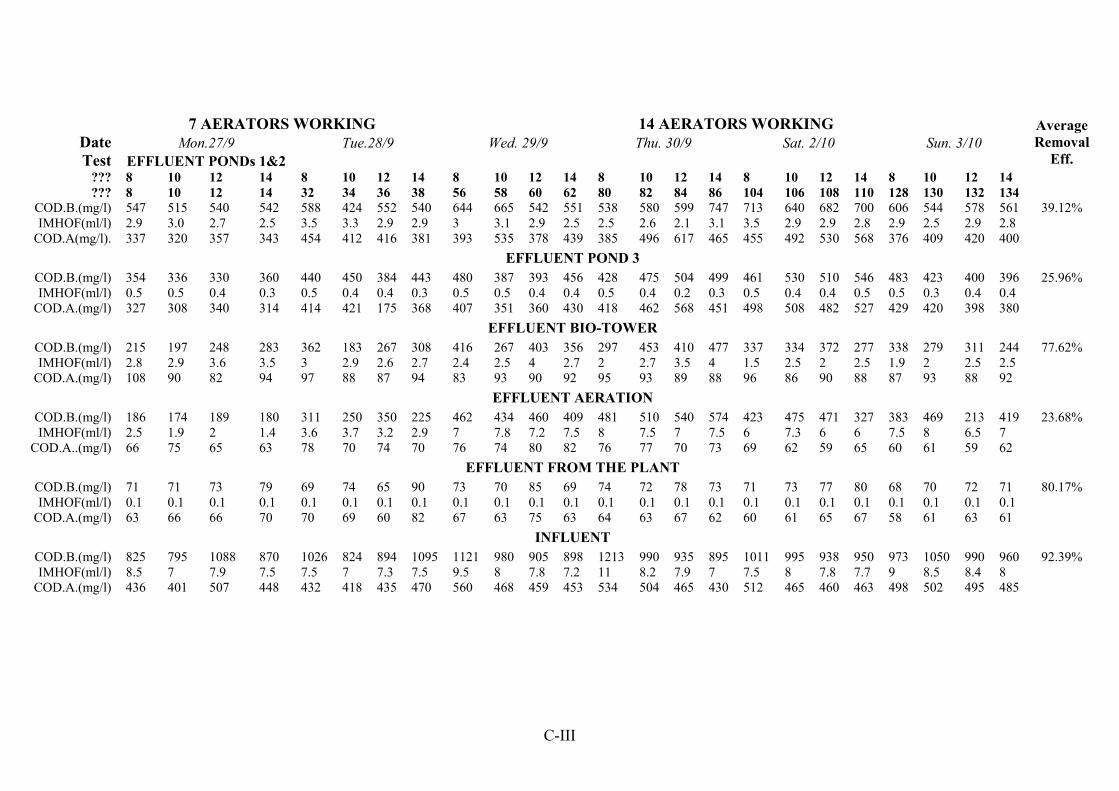
C-III
7 AERATORS WORKING 14 AERATORS WORKING
Date Mon.27/9 Tue.28/9 Wed. 29/9 Thu. 30/9 Sat. 2/10 Sun. 3/10 Test EFFLUENT PONDs 1&2
Average Removal
Eff. ??? 8 10 12 14 8 10 12 14 8 10 12 14 8 10 12 14 8 10 12 14 8 10 12 14 ??? 8 10 12 14 32 34 36 38 56 58 60 62 80 82 84 86 104 106 108 110 128 130 132 134
COD.B.(mg/l) 547 515 540 542 588 424 552 540 644 665 542 551 538 580 599 747 713 640 682 700 606 544 578 561 39.12% IMHOF(ml/l) 2.9 3.0 2.7 2.5 3.5 3.3 2.9 2.9 3 3.1 2.9 2.5 2.5 2.6 2.1 3.1 3.5 2.9 2.9 2.8 2.9 2.5 2.9 2.8
COD.A(mg/l). 337 320 357 343 454 412 416 381 393 535 378 439 385 496 617 465 455 492 530 568 376 409 420 400
EFFLUENT POND 3 COD.B.(mg/l) 354 336 330 360 440 450 384 443 480 387 393 456 428 475 504 499 461 530 510 546 483 423 400 396 25.96% IMHOF(ml/l) 0.5 0.5 0.4 0.3 0.5 0.4 0.4 0.3 0.5 0.5 0.4 0.4 0.5 0.4 0.2 0.3 0.5 0.4 0.4 0.5 0.5 0.3 0.4 0.4
COD.A.(mg/l) 327 308 340 314 414 421 175 368 407 351 360 430 418 462 568 451 498 508 482 527 429 420 398 380
EFFLUENT BIO-TOWER COD.B.(mg/l) 215 197 248 283 362 183 267 308 416 267 403 356 297 453 410 477 337 334 372 277 338 279 311 244 77.62% IMHOF(ml/l) 2.8 2.9 3.6 3.5 3 2.9 2.6 2.7 2.4 2.5 4 2.7 2 2.7 3.5 4 1.5 2.5 2 2.5 1.9 2 2.5 2.5
COD.A.(mg/l) 108 90 82 94 97 88 87 94 83 93 90 92 95 93 89 88 96 86 90 88 87 93 88 92
EFFLUENT AERATION COD.B.(mg/l) 186 174 189 180 311 250 350 225 462 434 460 409 481 510 540 574 423 475 471 327 383 469 213 419 23.68% IMHOF(ml/l) 2.5 1.9 2 1.4 3.6 3.7 3.2 2.9 7 7.8 7.2 7.5 8 7.5 7 7.5 6 7.3 6 6 7.5 8 6.5 7
COD.A..(mg/l) 66 75 65 63 78 70 74 70 76 74 80 82 76 77 70 73 69 62 59 65 60 61 59 62
EFFLUENT FROM THE PLANT COD.B.(mg/l) 71 71 73 79 69 74 65 90 73 70 85 69 74 72 78 73 71 73 77 80 68 70 72 71 80.17% IMHOF(ml/l) 0.1 0.1 0.1 0.1 0.1 0.1 0.1 0.1 0.1 0.1 0.1 0.1 0.1 0.1 0.1 0.1 0.1 0.1 0.1 0.1 0.1 0.1 0.1 0.1
COD.A.(mg/l) 63 66 66 70 70 69 60 82 67 63 75 63 64 63 67 62 60 61 65 67 58 61 63 61
INFLUENT COD.B.(mg/l) 825 795 1088 870 1026 824 894 1095 1121 980 905 898 1213 990 935 895 1011 995 938 950 973 1050 990 960 92.39% IMHOF(ml/l) 8.5 7 7.9 7.5 7.5 7 7.3 7.5 9.5 8 7.8 7.2 11 8.2 7.9 7 7.5 8 7.8 7.7 9 8.5 8.4 8
COD.A.(mg/l) 436 401 507 448 432 418 435 470 560 468 459 453 534 504 465 430 512 465 460 463 498 502 495 485

D-I
Annex D
Total Suspended Solids to Biochemical Oxygen Demand Ratio for both influent and effluent of GWWTP

D-II
Effluent influent
Year average BOD average TSS TSS/BOD%average
BOD average
TSS TSS/BOD%2000 26.78 28 104.6 552 685.5 124.2 2001 31.20 32 102.6 770 775 100.6 2002 30.00 40 133.3 547 806 147.3 2003 31.30 46.6 148.9 404 574 142.1 2004 35.20 53 150.6 393 464 118.1
TSS to BOD Ratios of influent and effluent of GWWTP

E-I
Annex E
The Calculation Sheet of the Newly Proposed Anaerobic Lagoon and the final Sedimentation Tank

E-II
Anaerobic Lagoon
Parameter Value
Winter temp. C 14 C° Summer temp. C 23.3 C°
Qmax m3/day 70800.0 m3/day Inffluent BOD5
20 440 mg/l water depth 3.2 m
design temperature C° >20 10 -- 20 11 -- 20
volumetric loading gBOD/m3/d 300 gBOD/m3/d 20T-100 180 gBOD/m3/d
BOD removal (%) 60% 2T+20 48 %
Retention time 2 days BOD Removal 48-60 %
Lagoon Surface Area A = LiQ/λD
Where Li Influent BOD mg/l Q Daily flow
λ volumetric loading
gBOD/m3/d D Depth of Lagoon A Lagoon Surface Area
Lagoon Surface Area A = 54,083.33 m2 m2 m3
lagoon 1-1, 7200 16000
lagoon 1-2 7200 16000 lagoon 2 12000 31000
total 26400 63000 required lagoon 3 27,683 78,600
Final Sedimentation Tank
Design Wastewater Production 3933.33 m3/h Design Wastewater Production 1.09 m3/s
Minimum Retintion Time 1.25 h Min Sedimentation Tank Volume 4916.67 m3
Max Surface Loading 2 m3/h/m2 Min Sedimentation Tanks Surface 1966.67 m2
No. of sedimentation tanks 2 Min Sedimentation EachTank Surface 983.33
Chosen Effective Height of ST 4.10 m length of channel 80.00 m
Chosen Mean Area of ST 1118.00 m2 Existing ST mean Area 599.00 m2
Total mean area S T provided 1198 m2

E-III
Total surface area S T provided 2236 m2 Total Tank volum provided provided 5111.8 m3
surface loading provided 1.76 Retintion Time provided 1.30 h

F-I
Annex F
Average BOD5 DATA for the Trickling Filters

F-II
Bio-Tower Filtered Filtered Unfiltered Unfiltered
Date Influent BOD Effluent BOD Efficiency % Influent BOD Effluent BOD Efficiency % mg/l mg/l mg/l mg/l
27-Sep-99 161.0 47 70.8 173 118 31.8 28-Sep-99 172.0 46 73.3 213 140 34.3 29-Sep-99 194.0 45 76.8 215 180 16.3 30-Sep-99 237.0 46 80.6 238 205 13.9 02-Oct-99 252.0 45 82.1 256 213 16.8 03-Oct-99 147.0 45 69.4 213 145 31.9 Average 1999 193.8 45.7 75.5 218 167 24.2 16-Oct-02 300.0 90 76.3 300 155 48.3 24-Dec-02 180.0 34 76.8 180 70 61.1 Average 2002 240.0 62.0 76.5 240.0 112.5 54.7 28-Jan-03 310.0 175 76.1 310.0 175 43.5 18-Feb-03 210.0 50 75.1 210.0 120 42.9 19-Apr-03 300.0 65 76.0 300.0 115 61.7 22-Apr-03 250.0 70 76.1 250.0 100 60.0 26-Apr-03 200.0 32 76.1 200.0 35 82.5 03-May-03 260.0 30 76.0 260.0 60 76.9 10-May-03 310.0 55 75.9 310.0 85 72.6 17-May-03 170.0 70 75.9 170.0 168 1.2 03-Jun-03 280.0 70 76.0 280.0 150 46.4 17-Jun-03 240.0 60 76.0 240.0 110 54.2 Average 2003 253.0 67.7 75.9 253.0 112 54.2
Bio-Tower Average BOD Removal efficiency
50
55
60
65
70
75
80
85
90
95
100
1999 2002 2003
Years
Rem
oval
effi
cien
cy

G-II
Annex G
Calculation Sheet for the Grit Removal Channel

G-Ii
Gaza waste water treatment plant
A. Inlet pipe
w.w. production 120 L/c.d Qp/Qf 0.63
h 0.70 n 0.013
Table(1)
Population w.w prod. w.w prod. P factor Peak flow Q QP Slope Profile Vf Qf Qp/Qf Vp h
m3/c.d m3/d m3/d m3/s m3/s % m m/s m3/s m/s m 400,000 0.118 47200 1.5 70800.0 1.09 1.09 0.200 1.200 1.53 1.732 0.631 1.6 0.70
B. Bar Screen channel
The deph of flow in the bar screen channel (d2) depends on the depth of flow in the inlet pipe (d1)
d1= 0.70 m V1= 1.6 m/s
Qmax = 1.09 m3/s Vmax = 1.0 m/s
d2 = 0.70 m Aclear = 1.09 m2 Wclear = 1.57 m
S = 0.025 m Nopen = 63.00 No.
T = 0.010 m Wtotal = 2.20 m
flow condition in the incoming conduit

G-Iii
diameter 1.20 m slope % 0.20
Vp 1.6 m/s Depth h 0.70 m
clear area through the rack openings
Clear = Qmax/Vmax 1.09 m2
Clear width
Clear = Aclear/d2 1.57 m
no. of spaces Wclear/spaceing 62.68
take 63 total No. OF bars 62
Clear width Clear 1.575 width of the chamber
Total = 2.20 m
Actual depth in the approach channel using the energy equation:
Z1+d1+V12/2g = Z2+d2+V2
2/2g+0.3(V12/2g-V2
2/2g)
Z1-Z2 = 0.1 m V1
2/2g = 0.132 K1 = 0.889 =(Z1-Z2+d1+0.7V1
2/2g) K2 = 0.009 =.70(Q/W)2*(1/2*9.81)
The above equation is simplified in the following form to solve it for d2 by trail and error d2
3-K1*d22+K2=0=C
d2 C 0.88 0.00 so the assumed d2 is the same as actual d2
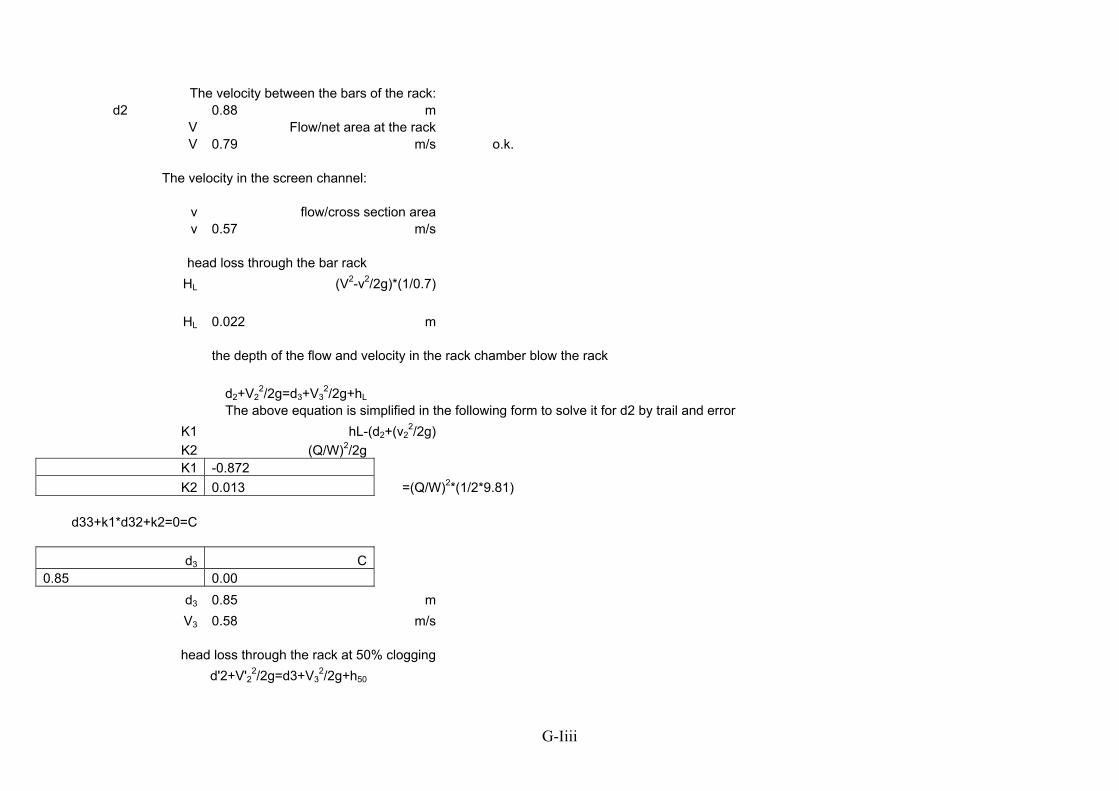
G-Iiii
The velocity between the bars of the rack: d2 0.88 m
V Flow/net area at the rack V 0.79 m/s o.k.
The velocity in the screen channel: v flow/cross section area v 0.57 m/s head loss through the bar rack
HL (V2-v2/2g)*(1/0.7)
HL 0.022 m
the depth of the flow and velocity in the rack chamber blow the rack
d2+V22/2g=d3+V3
2/2g+hL The above equation is simplified in the following form to solve it for d2 by trail and error
K1 hL-(d2+(v22/2g)
K2 (Q/W)2/2g K1 -0.872 K2 0.013 =(Q/W)2*(1/2*9.81)
d33+k1*d32+k2=0=C
d3 C
0.85 0.00 d3 0.85 m V3 0.58 m/s
head loss through the rack at 50% clogging d'2+V'22/2g=d3+V3
2/2g+h50

G-Iiv
h50=(velocity through rack opening)2- v'22 X 1/0.7
2g
velocity through rack opening at 50% clogging = QP/ACLEARx0.50
v3 = 1.39 /d' m/s 70
v'2 = QP/Total
v'2 = 0.50 /d' m/s
K1 d3+(V32/2*g)
K2 1/2*g(2.43(Q/Total)2-((Q/Clear)2/0.7) K2 -0.055 K1 0.87
simplifying the equation
d'23-K1d'22+K2=0=C
d'2 C 0.94 0.00
d'2 0.94 m V'2 0.53 m h50 0.08 m
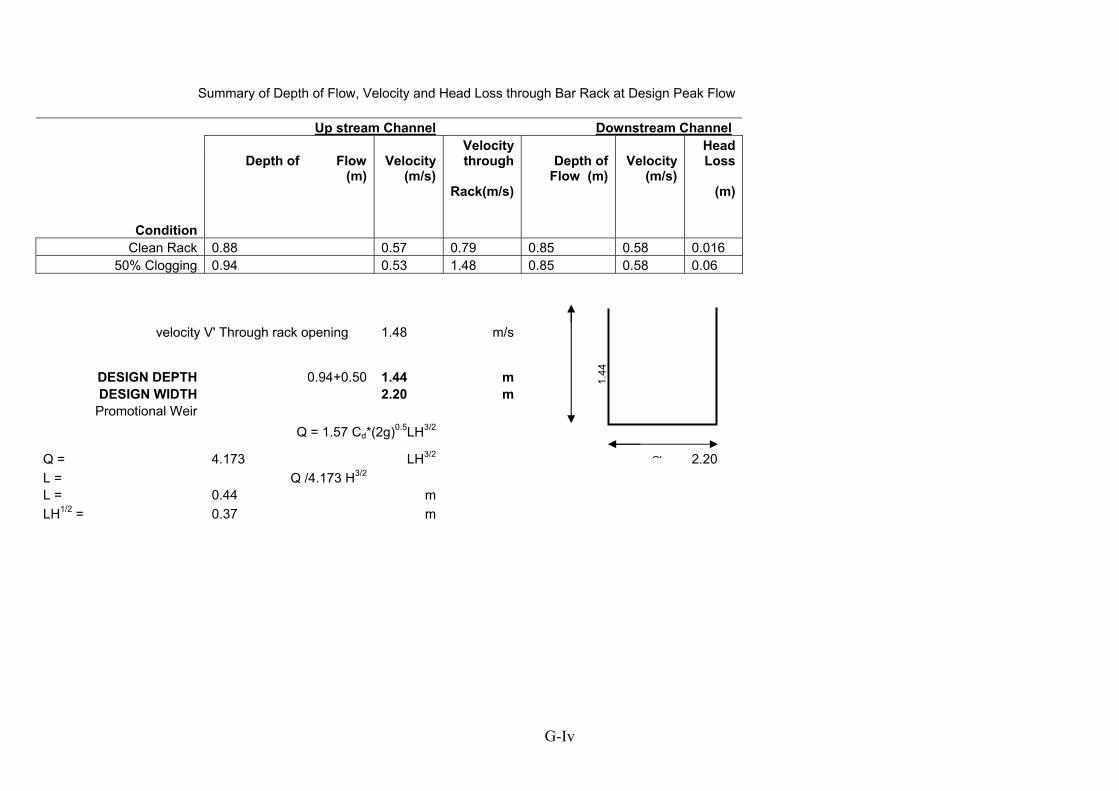
G-Iv
Summary of Depth of Flow, Velocity and Head Loss through Bar Rack at Design Peak Flow
Up stream Channel Downstream Channel Velocity Head
Condition
Depth of Flow (m)
Velocity (m/s)
through
Rack(m/s)
Depth of Flow (m)
Velocity (m/s)
Loss
(m)
Clean Rack 0.88 0.57 0.79 0.85 0.58 0.016
50% Clogging 0.94 0.53 1.48 0.85 0.58 0.06
velocity V' Through rack opening 1.48 m/s
DESIGN DEPTH 0.94+0.50 1.44 m 1.44
DESIGN WIDTH 2.20 m
Promotional Weir Q = 1.57 Cd*(2g)0.5LH3/2
Q = 4.173 LH3/2 2.20 L = Q /4.173 H3/2 L = 0.44 m LH1/2 = 0.37 m
Ch

G-Ivi
Propotional weir Flow Q m3/s H m L
m D m V m
1.47 0.95 0.38 1.10 0.61 1.32 0.85 0.40 1.00 0.60 1.16 0.75 0.43 0.90 0.59 1.01 0.65 0.46 0.80 0.57 0.85 0.55 0.50 0.70 0.55 0.70 0.45 0.55 0.60 0.53 0.54 0.35 0.63 0.50 0.49 0.39 0.25 0.74 0.40 0.44 0.23 0.15 0.96 0.30 0.35
Quantity of screening at average flow
Maximum 2.5488 m3/d minimum 1.416 m3/d
0 10 00
Rack Propotiona
0 880 9
50% clogging 0 7
clean scre
Horizontal
0 85 m
Free fall into the wet

G-Ivii
Grit Channel Design 0.15 mm sand particles and above = 89% 0.15 mm sand particles = 22%
Settling Velocity = Vs 0.004 < Vs < 0.018
Horizontal Velocity = Vh 0.05 < Vh < 0.2
Channel dimension
flow Q 1.09 m3/s Settling Vs 0.018 m/s
Horizontal Vh 0.3 m/s
Cross section area = Qmax/Vh
= 3.64 m2
Surface Area = Qmax/Vs
= 60.70 m2
Detention time Td 45 - 90 Take 90 seconds Td = D/Vs Depth D 1.62 m Td =L/Vh Length L 27 m Width = Surface/Length 2.25 m To avoid turbulence condition in the flow increase the length 15% of design length
Length L 31.05 m Actual Depth 2.12
Length L 31.05 m Width W 2.25 m Depth D 2.12 m

G-Iviii
Promotional Weir Q = 1.57 Cd*(2g)0.5LH3/2
Q = 4.173 LH3/2 L = Q /4.173 H3/2 L = 0.15 m LH1/2 = 0.18 m
Proportional weir
Flow Q m3/s H m L m
D m V m/s
1.23 1.65 0.14 1.80 0.30 1.00 1.15 1.55 0.14 1.70 0.30 0.15 1.45 1.08 1.45 0.15 1.60 0.30 0.15 1.35 1.00 1.35 0.15 1.50 0.30 0.16 1.25 0.93 1.25 0.16 1.40 0.30 0.17 1.15 1.09 1.15 0.17 1.30 0.37 0.17 1.05 0.78 1.05 0.17 1.20 0.29 0.18 0.95 0.71 0.95 0.18 1.10 0.29 0.19 0.85 0.63 0.85 0.19 1.00 0.28 0.21 0.75 0.56 0.75 0.21 0.90 0.28 0.22 0.65 0.48 0.65 0.22 0.80 0.27 0.24 0.55 0.41 0.55 0.24 0.70 0.26 0.27 0.45 0.33 0.45 0.27 0.60 0.25 0.30 0.35 0.26 0.35 0.30 0.50 0.23 0.36 0.25 0.19 0.25 0.36 0.40 0.21 0.46 0.15 0.11 0.15 0.46 0.30 0.17 1.25
2.25
Quantity of grit removed 3.54 m3 sand daily

G-Ii
Annex H Questionnaire of Wastewater Treatment Experts

G-Iii
Survey
Name (optional): Sc. Degree:
A. As part of my Masters degree "Performance Evaluation of Gaza Wastewater
Treatment Plant". I proposed six criteria for the evaluation of any future
construction of treatment plants or any modifications to the existing treatment
plants. These criteria take into consideration the economic, environmental and
land availability situation in Gaza. You are requested to support with your
opinion in the evaluation of the following criteria weights to help in the
Assessment of the options to any modification or construction.
No. Criteria Weight
1. Annual (operation and maintenance) cost
2. Construction Cost.
3. Land availability (Requirements)
4. Local operating experience
5. Process performance.
6. Sludge handling
Total 100%