performance comparison of unicast routing schemes …chuah/publications/dtn_unicast_routing.pdf ·...
TRANSCRIPT
Performance Comparison of Unicast Routing Schemes in DTNs Mooi Choo Chuah, Peng Yang, Brian D. Davison, Liang Cheng
{chuah, pey204, davison, cheng}@cse.lehigh.edu Lehigh University
Abstract—Delay and disruption tolerant networks have been proposed to address data communication
challenges in network scenarios where an instantaneous end-to-end path between a source and destination
may not exist, and the links between nodes may be opportunistic, predictably connectable, or periodically-
(dis)connected. In this paper, we focus on comparing the performance of different unicast routing schemes
proposed for intragroup communications. In particular, we conduct performance studies for different
DTN scenarios, e.g., DTNs with different node densities, DTNs with different mobility models, networks
with different percentage of nodes supporting DTN functionality, etc. In addition, we also study intergroup
DTN routing scenarios where message ferries and backhaul links are used. Our results indicate that (a) the
store-and-forward and custody transfer concepts have significantly improved the delivery ratio in a
sparsely connected network, (b) in very sparse networks, message ferries are required to enable
communications, (c) a high delivery ratio can be maintained even with only 50% of the nodes supporting
DTN functionality, (d) the two-way delay in bidirectional flows only experience 10% more delay than one-
way delay, and, (e) some routing schemes are optimized to perform well in certain mobility scenarios and
thus a hybrid scheme will work best in all scenarios.
Keywords-disruption tolerant networks; custody transfer; route discovery; message ferry
I. INTRODUCTION Packet-switched network communication has been studied for decades. Important progress has been
made in robustness and scalability in the TCP/IP protocol suite based primarily on principles of end-to-
end protocols and services [9]. However, there are many scenarios in which an end-to-end connection is
not guaranteed or even possible, and so an intermediary is needed, perhaps to translate between protocols
or to provide temporary storage (e.g., in mail servers). In these cases, without such intermediaries,
communication would fail. In other cases, communication may fail not because of a lack of
instantaneous connection, but because the connection properties fall beyond the expected bounds
(excessive round-trip-time or high packet loss probability).
Solutions have been proposed to deal with some specific situations, e.g., using link layer
retransmissions to deal with high packet loss probability in wireless environments [4] or using
performance enhancing proxies [28]. However, these solutions still do not work in situations where there
are no end-to-end paths. In contrast, DakNet [3] deploys physical transport devices, e.g., buses and
motorcycles, to carry mobile access points between village kiosks and hubs with Internet connectivity so
that the data carried by the physical transport devices can be automatically uploaded and/or downloaded
when the physical transport devices are in the wireless communication range of a kiosk or a hub. Similar
techniques are proposed in [1],[2]. In the past two years, a considerable amount of research focusing on
delay/disruption-tolerant networking and communications has been published (e.g., [13],[14],[15],[27]).
DieselNet [14],[27] is a disruption tolerant network where connections between nodes are short-lived and
occasional. A common approach used to address delays and disruptions is via the use of a store-and-
forward mechanism similar to electronic mail [11]. This makes communication possible, even when an
instantaneous end-to-end path does not exist. Message ferrying schemes [14],[27] are proposed where
special mobile nodes called message ferries are used to facilitate connectivity between nodes. The
message ferries visit the nodes in the network and deliver data among them.
In [5], Fall describes an architecture for delay tolerant networking that implements much of what we
have described. It proposed the idea of topological regions connected by gateways, which were
responsible for storing messages in non-volatile storage to provide for reliable delivery. End-point
addressing in his scenario consisted of a region name used for inter-region routing and a locally-
resolvable name for intra-region delivery. More recently, we have proposed an enhanced disruption-
tolerant network architecture called EDIFY (Enhanced Disruption and Fault Tolerant Bundle Delivery)
[6]. Our approach builds on many ideas from Fall, but adds support for multiple, overlapping name
spaces and node and group mobility.
In this paper, we focus on comparing the performance of different DTN unicast routing schemes.
Specifically, our contributions in this paper are:
(a) we study the effectiveness of the custody transfer feature with on-demand routing protocols in
DTNs. It is important to know when the custody transfer feature needs to be turned on since the
deployment of the custody transfer feature incurs extra overhead.
(b) we study the impact of mobility models on the performance of on-demand routing protocols in
DTNs. We consider both the random waypoint model and the Zebranet-like model.
(c) we compare the performance of two-hop [19], and multihop routing schemes in DTNs. We believe
this is the first paper that compares the performance difference between the two-hop and multihop routing
schemes in DTNs.

The rest of our paper is organized as follows: we first give an overview of the three routing approaches
that have been proposed for forwarding intragroup messages in DTNs in Section II, and discuss their
advantages and disadvantages. In Section III, we study the performance of intragroup message delivery
by studying the impact of node densities and mobility models on intragroup message delivery ratio. In
addition, we also compare the performance of 2-hop and multihop unicast routing approaches in DTNs.
Our results indicate that a multihop unicast routing approach can provide higher delivery ratio and lower
packet delivery latency. Next, we describe how routes for intergroup communications can be discovered.
In Section V, we study the performance of intergroup communications in a DTN with message ferries
and backhaul links. Our results indicate that the presence of message ferries and backhaul links allow
otherwise partitioned groups of nodes to communicate with one another. With appropriate buffer size,
the delivery ratio for intergroup messages can be maintained at more than 83%. We give some
concluding remarks in Section VI.
II. INTRAGROUP ROUTING SCHEMES FOR DTNS
Three categories of forwarding schemes have been proposed for DTNs. In the first category
[20], message ferries or data mules are proposed to gather data from stationary sources and deliver them
to their destinations. However, for nodes that move, they can be message carriers themselves without
having to resort to special message ferries. In the second category [21],[22], history-based routing is
proposed in which each node maintains a utility value for every other node in the network, based on a
timer indicating the time elapsed since the two nodes last encountered each other. These utility values,
which carry indirect information about relative node locations, get diffused through nodes’ mobility.
Nodes forward message copies only to those nodes with a higher utility for the message’s destination.
For example in [22], the authors propose a probabilistic metric called delivery predictability at every
node A for each known destination B. This metric indicates how likely it is that node A will be able to
deliver a message to that destination. The delivery predictability ages with time and also has a transitive
property, i.e., a node A that encounters node B which encounters node C allows node A to update its
delivery predictability to node C based on its (A’s) delivery predictability to node B and node B’s
delivery predictability to node C. In [22], a node will forward a message to another node it encounters if
that node has higher delivery predictability to the destination than itself. Such a scheme was shown to
produce superior performance than epidemic routing [25]. We anticipate that the transmission overhead
(defined as the number of transmitted bytes over the number of generated bytes) for such schemes will

be similar to that achieved using a routing protocol combined with custody transfer (about which we will
elaborate below). The results in [22] (Figure 3 in [22]) suggest that the transmission overhead will be
close to 35.6% (with a transmission range of 100 m and using the random waypoint mobility model) for
the case with 200 buffers.
In the third category [19], [23], a two-hop relay forwarding scheme is proposed in which the
source sends multiple copies (e.g., different erasure coding blocks) to different relaying nodes and the
relaying nodes deliver the copies they have to the destination node when they encounter the destination
node. Again, such a strategy will achieve small transmission overhead but may not enjoy high delivery
ratio for messages with shorter deadlines.
A. Custody Transfer Feature In our work, we assume support for custody transfer is turned on in some DTN routing schemes. This
custody transfer feature is proposed in [13],[17] to provide reliable communications in an intermittently
connected network. In this scheme, accepting a message with custody transfer amounts to promising not
to delete it until it can be reliably delivered to another node providing custody transfer or it arrives at the
destination. Nodes holding a message with custody are called custodians. Normally, a message has a
single custodian (referred to as sole custody) but in some circumstances, more than one custodian owns a
message or message fragment (referred to as joint custody). Applications can optionally request the
custody transfer feature on a per-message basis and they will receive a custody acknowledgement when
their host system can find one or more nodes that are willing to take custody of the message. A node may
agree to accept custody for messages initially and refuse to do so when its local node resources, e.g.,
buffers, become substantially consumed. Potential problems that may occur with custody transfer are
discussed in [17].
The custody transfer feature considered in this paper works as follows: when a DTN node has a
message to send for which it holds custodianship, it checks its cache to see if it has a route to the
destination node. If it finds more than one route, it picks the one with the lowest cost (e.g., using hop
count, delivery latency etc., as metrics). When a route is selected, it checks the DTN nodes included in
this selected route to see which node is the best candidate for custody transfer, e.g., the closest DTN node
that has buffer space available. Then, it sends a custodian request to that downstream DTN node. If the
DTN node can accept the custodianship, it will respond with a custody acknowledgement. Otherwise, it
sends a negative reply.

If the sending DTN node cannot find a route to the destination of the message, it will send a custody
request to its 1-hop DTN neighbors to see if any one of them has a route to this destination. If there is a
custodian accept reply from any 1-hop DTN neighbors, then, this sending DTN node will send the bundle
to that replying node. If there is no reply (after a wait-for-reply timer expires), then this sending DTN
node will trigger its underlying ad hoc network layer to look for a route or neighboring nodes that are
closer to the destination than itself. At the ad hoc network routing layer, all DTN nodes that receive a
route reply message with the DTN option flag set will set a bit in the appropriate position (according to
its hop distance from the sending node of the route request) to indicate buffer availability before relaying
the route reply message. Thus, our dual-layer (at ad hoc network routing and DTN layers) approach
allows a node to identify downstream nodes to which we can forward the messages. Once a custodian
node is selected, the sender transmits a message to it and waits for an acknowledgement. If the sender
does not receive custodian acknowledgement from the new custodian node, it will retransmit up to a
certain maximum number of times. If the sender still fails to receive acknowledgement after multiple
attempts, the sender can select another node to be the custodian. Our custody transfer implementation
avoids the head of line blocking problem described in [17] by allowing the DTN node to search through
the queued messages until it finds a message that can be sent to the next hop node.
III. PERFORMANCE STUDY OF INTRAGROUP COMMUNICATIONS
A. Impact of Node Densities in a DTN with Custody Transfer
In this section, we investigate how the presence of DTN nodes supporting custody transfer in a
sparsely connected ad hoc network impacts the system performance. DSR-like routing [18] is used as
the default routing protocol. The delivery ratio of such a multihop routing approach is expected to
degrade with increasing network sparseness even with the custody transfer turned on. We conducted two
sets of experiments. We simulate a scenario where there are 40 nodes. The 40 nodes are distributed
randomly in the following areas: (a) 1000x1000 m2, (b) 1500x1500 m2, and (c) 2000x2000 m2. First, we
run some experiments assuming that the nodes do not support custody transfer, i.e., they are just regular
adhoc network nodes. Then, we run the same experiments assuming all nodes turn on the custody
transfer feature.
10 source/destination pairs are used in this set of experiments. The source/destination pairs are
randomly picked among the 40 nodes. Each source generates one packet every 4 seconds. The packet
size is 512 bytes. The nodes move according to the random waypoint model with a maximum speed of
5 m/s. Table 1 shows the results we obtained without custody transfer and Table 2 shows the results we
obtained when custody transfer feature is turned on. The performance metrics we use are:
(a) transmission overhead [19] which is defined as the number of transmitted bytes over the
number of generated bytes. Note that in this case, the transmitted bytes include the routing overhead.
Each routing message and each custody transfer request/acknowledgement message is assumed to be 35
bytes long.
(b) total number of control messages sent (including custody transfer acknowledgements)
(c) the average end-to-end delivery latency (denoted as Avg Delay in the tables)
(d) the packet delivery ratio (PDR), and,
(e) the average hop counts of the chosen path.
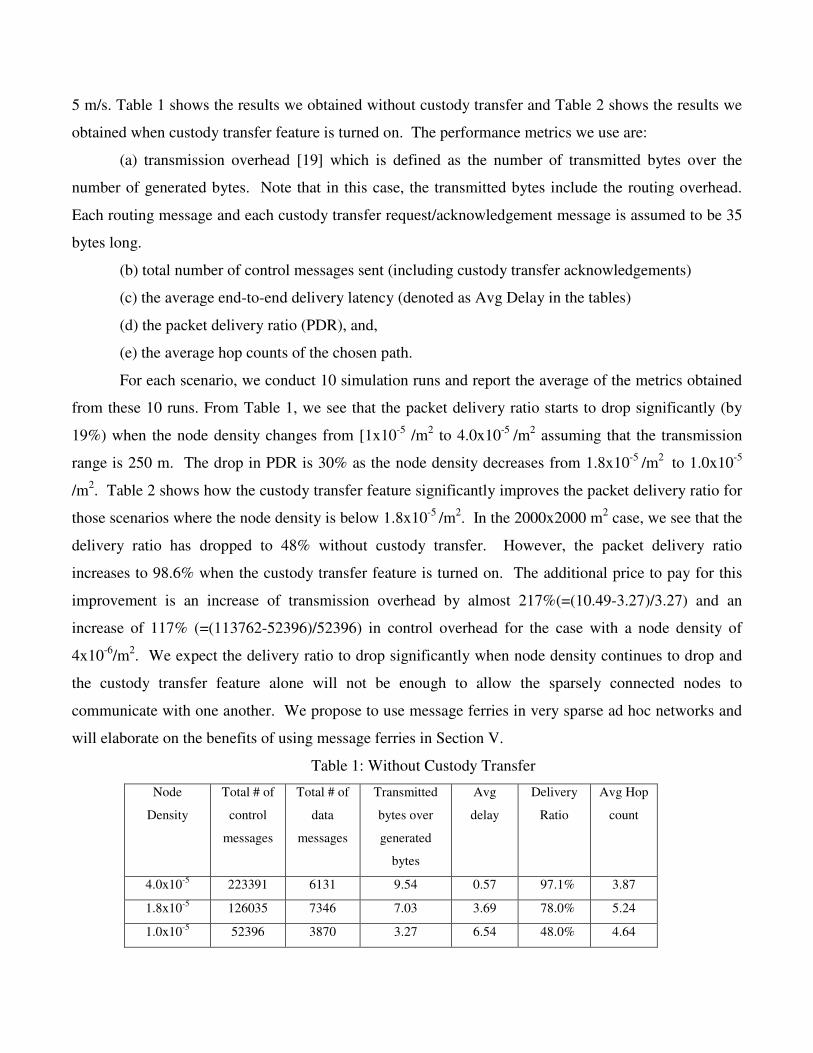
For each scenario, we conduct 10 simulation runs and report the average of the metrics obtained
from these 10 runs. From Table 1, we see that the packet delivery ratio starts to drop significantly (by
19%) when the node density changes from [1x10⁻⁵ /m2 to 4.0x10⁻⁵ /m2 assuming that the transmission
range is 250 m. The drop in PDR is 30% as the node density decreases from 1.8x10⁻⁵ /m2 to 1.0x10⁻⁵
/m2. Table 2 shows how the custody transfer feature significantly improves the packet delivery ratio for
those scenarios where the node density is below 1.8x10⁻⁵ /m2. In the 2000x2000 m2 case, we see that the
delivery ratio has dropped to 48% without custody transfer. However, the packet delivery ratio
increases to 98.6% when the custody transfer feature is turned on. The additional price to pay for this
improvement is an increase of transmission overhead by almost 217%(=(10.49-3.27)/3.27) and an
increase of 117% (=(113762-52396)/52396) in control overhead for the case with a node density of
4x10⁻⁶/m2. We expect the delivery ratio to drop significantly when node density continues to drop and
the custody transfer feature alone will not be enough to allow the sparsely connected nodes to
communicate with one another. We propose to use message ferries in very sparse ad hoc networks and
will elaborate on the benefits of using message ferries in Section V.
Table 1: Without Custody Transfer
Node
Density
Total # of
control
messages
Total # of
data
messages
Transmitted
bytes over
generated
bytes
Avg
delay
Delivery
Ratio
Avg Hop
count
4.0x10⁻⁵ 223391 6131 9.54 0.57 97.1% 3.87
1.8x10⁻⁵ 126035 7346 7.03 3.69 78.0% 5.24
1.0x10⁻⁵ 52396 3870 3.27 6.54 48.0% 4.64

Table 2: With Custody Transfer
Node
Density
Total # of
control
messages
Total # of
data
messages
Transmitted
bytes over
generated
bytes
Avg
delay
(sec)
Delivery
Ratio
Avg Hop
count
4.0x10⁻⁵ 229645 7376 10.49 1.59 100% 3.9
1.8x10⁻⁵ 158688 18091 13.16 43.4 99.9% 5.7
1.0x10⁻⁵ 113762 15098 10.39 259.4 98.6% 5.25
B. Impact of different mobility models
In this section, we describe an experiment we conducted to understand the impact of mobility models
on the system performance. In this experiment, we simulate a scenario where 34 nodes are randomly
distributed over an area of 1500mx1500m and the nodes move either according to random waypoint
model or according to Zebranet movement [19]. For the random waypoint movement, the nodes have a
maximum speed of 5m/s. For the Zebranet movement, we scale the node positions to be within
1500mx1500m area. To maintain similar node connectivities, we reduce the transmission range to 250 m
(as compared to 1000 m in the original simulation reported in [19]). In the original Zebranet trace [19],
the inter-sample interval is 8 minutes but we scale this interval to 8 seconds in the experiment we
conducted. This means that in our experiment, the nodes move faster than those reported in the original
Zebranet trace. Table 3 tabulates our results. The faster and more chaotic node movements that are
based on the Zebranet trace result in higher average packet delivery latency (30.6 seconds compared to
22.6 seconds). The transmission overhead is also higher using the Zebranet mobility model as compared
to that obtained using random waypoint mobility model.
Table 3(a): System Performance with ZebraNet Movement
Total # of
control
messages
Total # of
data
messages
Transmission
Overhead
Avg
delay
(sec)
Delivery
Ratio
Avg Hop
count
RWP(5m/s) 145594 13014 10.45 22.6 99.9% 4.78
Zebra 129653 16521 11.23 30.6 99.9% 4.56

We conducted another experiment where we scaled all the reported distances by 4 (to fit the locations
to within the 1500mx1500m rather than the 6000mx6000m as described in [19] and scaled the time unit
such that the nodes will be moving at the same speed as reported in [19]). The result is tabulated below.
We see that when the nodes move slower using the Zebranet mobility model, the average packet delivery
latency and transmission overhead increases. The packet delivery latency increases from 30.6 seconds to
68 seconds while the transmission overhead increases from 11.2 to 15.1.
Table 3(b) System Performance with another Zebranet mobility model Total # of
control
messages
Total # of
data
messages
Transmission
Overhead
Avg
delay
(sec)
Delivery
Ratio
Avg Hop
count
With custody
transfer
169595 23301 15.14 68 99.9% 5.98
The delay distributions obtained using the random waypoint model and using the Zebranet model are
plotted in Figures 1(a) and 1(b) respectively. Here, we see that the Zebranet mobility model results in
packet delivery latency that has a higher tail. The 90 percentile delay is 100 seconds using the random
waypoint model but it is 260 seconds using the Zebranet model. If we translate the time unit from
minutes to seconds in [19], the 90 percentile packet delivery latency achieved using the 2-hop relay
forwarding scheme as reported in [19] is close to 1200 seconds. Thus, we anticipate that the packet
delivery latency will be smaller with the multihop routing approach as compared to the 2-hop relay
approach. More simulation studies comparing these two forwarding schemes will be discussed in
subsection E.
(a) Using RWP (b) Using Zebranet model
Figure 1: Delay Distribution using different mobility models.

C. Impact of DTN percentage & bidirectional flows
In this section, we investigate how the percentage of DTN nodes impacts the delivery ratio. We
also measure the end-to-end delay for bidirectional flows. In this set of experiments, we simulate 40
nodes randomly distributed in an area of 1000x1000 m2. The nodes move according to the random
waypoint mobility model. In addition, we select 10 source/destination pairs that require many hops for
packet delivery. Bidirectional flows are implemented as follows: a source sends a message to a
destination and the destination will respond with a message of the same size back to the source before
the source generates further messages. Then, we evaluate the delivery ratio, the one-way end-to-end
delay, the two-way end-to-end delay as well as the transmission overhead. The results for 50% DTN
nodes and 100% DTN nodes are tabulated in Table 4. The delay distributions for both cases are plotted
in Figures 2 & 3 respectively.
Table 4: Impact of DTN percentage From the results, we see that even with 50% DTN nodes, the delivery ratio is as high as 96.5%
and the one way and bidirectional delay is reasonably low. The 95% one-way delay is about 1150(927)
seconds and the 95% bidirectional delay is about 1650 (1250) seconds for the 100% (50%) DTN nodes
case. Those packets that are not delivered in the 50% DTN nodes case but are delivered in the 100%
DTN nodes incur larger delay. Thus, we observe larger 95% bidirectional delay for the 100% DTN
nodes case when compared to that achieved in the 50% DTN nodes case.
Figure 2: Delay distribution for 100% DTN nodes case.
100% DTN 50% DTN Delivery Ratio 98.7% 96.5
Avg One-way Dly (sec) 278 257 Avg Bidirectional Dly(sec) 316 284 Transmission Overhead 13.1 11.0
One-way Delay Bi-directional DelayOne-way Delay Bi-directional Delay

Figure 3: Delay distribution for 50% DTN nodes case.
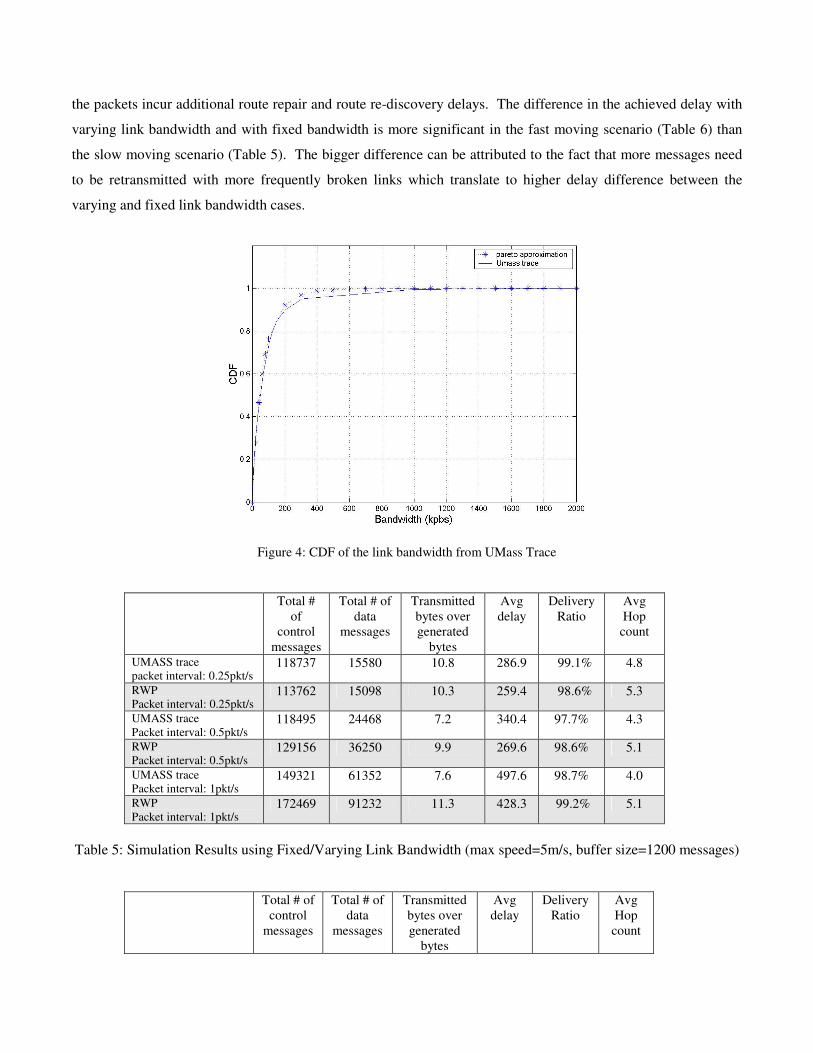
D. Impact with varying link bandwidths
The DieselNet [27] trace does not have accurate GPS information. Thus, we cannot use the trace data to
provide yet another mobility model. However, the trace provides information about varying link bandwidths
between two nodes. Figure 4 shows the CDF of the link bandwidths information we extracted from the trace. We
fit this data to a Pareto distribution and use this distribution in our simulator. The CDF of the fitted Pareto
distribution is as shown in Eq 1 below.
5)
1003
3(1)(
xxF
+−= --- (1)
In the first set of experiments, we use 40 nodes distributed over an area of 2000x2000m2. When a node
needs to send a packet to another node, we assume that the available link bandwidth is obtained from this
distribution. We vary the traffic load from 0.25 pkt/sec to 1 pkt/sec. The nodes move according to random
waypoint mobility model with a maximum speed of 5 m/s. In this first set of experiment, the buffer size is set to
1200 messages. Table 5 tabulates the results we obtained. In Table 5, the results using the varying link
bandwidth are labeled as UMASS trace and the results using fixed bandwidth are labeled as RWP. The varying
link bandwidth (varies between 0 to 2 Mbps) increases the average packet delay. From Table 5, one can see that
providing a buffer size of 1200 messages is sufficient to maintain delivery ratio at 97-99% at all traffic load (up to
1 pkt/sec).
Since the buses in [27] move rather fast, we also conducted another set of experiments where the nodes
move with a maximum speed of 20 m/s. Each node’s buffer size is still set at 1200 messages. The results for this
second set of experiments are tabulated in Table 6. We observe that the delivery ratio can still be maintained at
high values. The average delay has increased since the links get broken more easily at higher speed, and hence
One-way Delay Bidirectional DelayOne-way Delay Bidirectional Delay
the packets incur additional route repair and route re-discovery delays. The difference in the achieved delay with
varying link bandwidth and with fixed bandwidth is more significant in the fast moving scenario (Table 6) than
the slow moving scenario (Table 5). The bigger difference can be attributed to the fact that more messages need
to be retransmitted with more frequently broken links which translate to higher delay difference between the
varying and fixed link bandwidth cases.
Figure 4: CDF of the link bandwidth from UMass Trace
Total # of
control messages
Total # of data
messages
Transmitted bytes over generated
bytes
Avg delay
Delivery Ratio
Avg Hop count
UMASS trace packet interval: 0.25pkt/s
118737 15580 10.8 286.9 99.1% 4.8
RWP Packet interval: 0.25pkt/s
113762 15098 10.3 259.4 98.6% 5.3
UMASS trace Packet interval: 0.5pkt/s
118495 24468 7.2 340.4 97.7% 4.3
RWP Packet interval: 0.5pkt/s
129156 36250 9.9 269.6 98.6% 5.1
UMASS trace Packet interval: 1pkt/s
149321 61352 7.6 497.6 98.7% 4.0
RWP Packet interval: 1pkt/s
172469 91232 11.3 428.3 99.2% 5.1
Table 5: Simulation Results using Fixed/Varying Link Bandwidth (max speed=5m/s, buffer size=1200 messages)
Total # of control
messages
Total # of data
messages
Transmitted bytes over generated
bytes
Avg delay
Delivery Ratio
Avg Hop count
UMASS trace Packet interval: 0.25pkt/s
58837 9369 6.1 496 99.2% 3.5
RWP Packet interval: 0.25pkt/s
56842 12585 7.4 351 99.6% 4.3
UMASS trace Packet interval: 0.5pkt/s
61380 17354 4.7 549 99.6% 2.6
RWP Packet interval: 0.5pkt/s
66181 24996 6.5 376 99.4% 4.1
UMASS trace Packet interval: 1pkt/s
79416 28451 3.2 794 98.9% 2.3
RWP Packet interval: 1pkt/s
83036 39256 4.2 383 99.5% 3.4
Table 6: Simulation Results using Fixed/Varying Link Bandwidth (max speed=20m/s, buffer size=1200 messages)
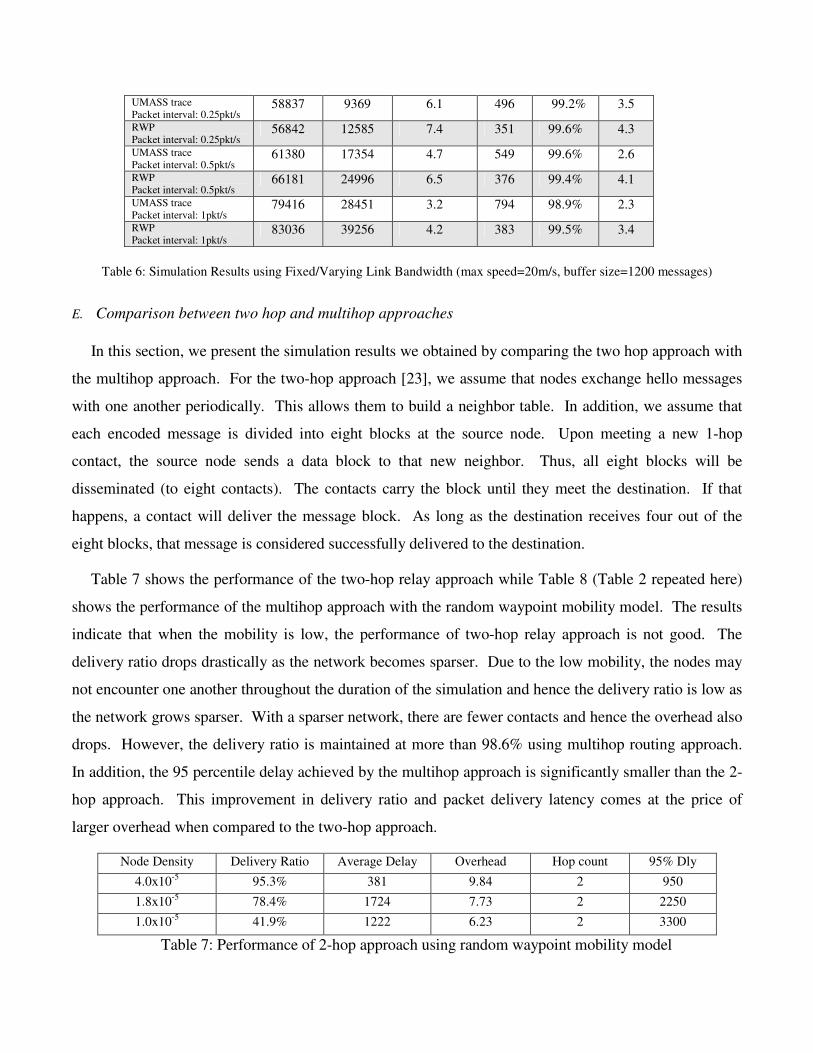
E. Comparison between two hop and multihop approaches
In this section, we present the simulation results we obtained by comparing the two hop approach with
the multihop approach. For the two-hop approach [23], we assume that nodes exchange hello messages
with one another periodically. This allows them to build a neighbor table. In addition, we assume that
each encoded message is divided into eight blocks at the source node. Upon meeting a new 1-hop
contact, the source node sends a data block to that new neighbor. Thus, all eight blocks will be
disseminated (to eight contacts). The contacts carry the block until they meet the destination. If that
happens, a contact will deliver the message block. As long as the destination receives four out of the
eight blocks, that message is considered successfully delivered to the destination.
Table 7 shows the performance of the two-hop relay approach while Table 8 (Table 2 repeated here)
shows the performance of the multihop approach with the random waypoint mobility model. The results
indicate that when the mobility is low, the performance of two-hop relay approach is not good. The
delivery ratio drops drastically as the network becomes sparser. Due to the low mobility, the nodes may
not encounter one another throughout the duration of the simulation and hence the delivery ratio is low as
the network grows sparser. With a sparser network, there are fewer contacts and hence the overhead also
drops. However, the delivery ratio is maintained at more than 98.6% using multihop routing approach.
In addition, the 95 percentile delay achieved by the multihop approach is significantly smaller than the 2-
hop approach. This improvement in delivery ratio and packet delivery latency comes at the price of
larger overhead when compared to the two-hop approach.
Node Density Delivery Ratio Average Delay Overhead Hop count 95% Dly
4.0x10⁻⁵ 95.3% 381 9.84 2 950
1.8x10⁻⁵ 78.4% 1724 7.73 2 2250
1.0x10⁻⁵ 41.9% 1222 6.23 2 3300
Table 7: Performance of 2-hop approach using random waypoint mobility model

Node Density Delivery Ratio Average Delay Overhead Hop count 95% Dly 4.0x10⁻⁵ 100% 1.59 10.49 3.9 2.4 1.8x10⁻⁵ 99.99% 43.4 13.16 5.7 2.7 1.0x10⁻⁵ 98.6% 259.4 10.39 5.25 1600
Table 8: Performance of multihop approach using random waypoint mobility model
Tables 9 & 10 summarize the simulation results obtained for two-hop and multihop approaches
respectively when ZebraNet mobility model is used. The results show that the 2-hop approach achieves
relatively good performance. It seems that this 2-hop approach has been specifically tuned for ZebraNet
mobility model. The multihop approach still performs slightly better than the two-hop approach. It has
slightly higher delivery ratio and significantly better 95% delay when compared to the two-hop approach.
This again comes at the price of incurring larger overhead.
Node Density Delivery Ratio Average Delay Overhead Hop count 95% Dly
4.0x10⁻⁵ 96.8% 710 7.02 2 420
1.8x10⁻⁵ 96.5% 366 8.01 2 950
1.0x10⁻⁵ 98.99% 128 10.3 2 1500
Table 9: Performance of the two-hop approach using ZebraNet mobility model
Node Density Delivery Ratio Average Delay Overhead Hop count 95% Dly
4.0x10⁻⁵ 99.99% 0.71 9.32 2.1 3
1.8x10⁻⁵ 99.99% 29 14.45 4.1 130
1.0x10⁻⁵ 99.99% 203 14.77 3.5 700
Table 10: Performance of the multihop approach using ZebraNet mobility model
IV. INTERGROUP ROUTE DISCOVERY In some network scenarios, one group of nodes (say Group 1) may not be able to hear another group of
nodes (say Group 3) directly but they may hear members of a third group (say Group 2) that can
communicate with Group 3 as shown in Figure 5. In such scenarios, different groups may use different
algorithms to route packets within their own groups. To enable intergroup communications, we assume
that different groups are willing to support a few common intergroup route messages to facilitate the
ability for nodes from one group to route packets destined to another group. To minimize the need for all
nodes to support inter-region routing, a gateway selection protocol [16] is used whereby only nodes
which have been selected as gateways need to run an intergroup routing protocol.

Figure 5. Intergroup Routing
Here, via an example with a message ferry, we describe how the nodes in a DTN environment can
discover routes to other nodes. In Figure 6, we have forty nodes that are partitioned into four isolated
groups. There is a base station node in each group. The base station node is assumed to have a second
long range radio that provides wireless backhaul link with higher bandwidth. To minimize the risk of
potential enemy detection or energy consumption, the wireless backhaul links are only turned on
periodically for short durations of time. In the example shown in Figure 6, we assume that BS1 (BS2)
can communicate only occasionally with BS2 (BS3). Similarly, BS3 can communicate only occasionally
with BS4.
Because these groups are isolated far away from one another, the groups can only communicate with
one another either via the wireless backhaul links that are not always available or via the message ferry.
We assume that the message ferry broadcasts a service announcement message periodically as it moves
along a fixed route. We also assume the service announcement message contains information on the
groups that the message ferry can reach from previous trips. Other useful information like the estimated
next visit time to those reachable groups may be included for more sophisticated forwarding decisions.
Figure 6. A 4-group DTN example
Base Station
Regular nodes
Mobile Carrier
MC Route
Wired LinkLink1
Link2
Link3
Mobile Carrier
G1
G4
G2
G3
BS1
BS4BS3
BS2Base Station
Regular nodes
Mobile Carrier
MC Route
Wired LinkLink1
Link2
Link3
Mobile Carrier
G1
G4
G2
G3
BS1
BS4BS3
BS2
Network1Network3
Network2Network4
N1:GW1
N2:GW1 N4:GW4N2:GW2
N3:GW1
Network1Network3
Network2Network4
N1:GW1
N2:GW1 N4:GW4N2:GW2
N3:GW1

We assume that the intragroup routing protocol makes use of the information provided by the
underlying ad hoc routing protocol which is again assumed to be DSR-like [7]. Whenever there is
intergroup traffic, the nodes will evaluate to see if it consumes less cost (e.g., in terms of expected
delivery delay) to send the traffic via the backhaul links or via the message ferry if both types of
forwarding services are available. The base station will send announcements to inform the nodes whether
or not it can provide intergroup forwarding services. For example, when Link 1 is not available, BS1 will
inform all members in group 1 that intergroup service is not available. Similarly, when Link 2 is not
available, BS2 will inform BS1 that it cannot communicate with Group 3. Then, BS1 will inform Group
1 members that intergroup service to Group 3 is not available. Note that BS2 can delay such notification
until its buffers are full or can notify BS1 immediately when Link 2 disappears.
Assume that Group 1 needs to communicate with Group 3; then a source node (a node in Group 1)
will send the traffic to BS1 and BS1 will forward it to BS2 when Link 1 is available. If Link 2 is not
available, the messages will be stored at the buffers at BS2 until Link 2 is available. Drop-from-front
scheme can be used to replace old messages with new messages when the buffer at a base station is full.
However, one can also use tail-drop scheme where no new messages will be accepted when the buffer at
the base station is full. In addition, when different classes of messages are available, smarter buffer
management schemes will be needed to give different treatments to messages from different classes.
When the base station does not provide intergroup service or if the cost for sending such traffic using
the backhaul route is higher than using a route via the message ferry, the regular nodes will use the
service from the message ferry. Not all nodes can hear the message ferry. We assume that all nodes
within a group that can hear the service announcement from a message ferry can provide forwarding
services to/from the message ferry. Such nodes serve as gateway nodes. The gateway nodes can make
periodic announcements to their group members that they can provide forwarding services. All regular
nodes can cache the gateway information for future use. The above approach is more proactive since the
nodes within a group can find out where the gateway nodes are before they need to use the forwarding
services from such nodes. Alternatively, the sending nodes can send gateway discovery messages to
discover the gateway nodes. Once a sending node can identify a gateway node, it can then send
intergroup traffic to that gateway node. This approach is more reactive and message delivery time may
increase due to the need to perform gateway discovery.

V. PERFORMANCE STUDIES OF INTERGROUP COMMUNICATIONS USING A MESSAGE FERRY
Using the network topology shown in Figure 6, we wish to investigate the performance that can be
achieved for intergroup communications when wireless backhaul links and a message ferry are deployed.
In this section, we report extensive simulation experiments to evaluate the impact of the custody transfer
feature, and the use of a message ferry on the message delivery ratio when the availabilities of the
wireless backhaul links are varied both in terms of the relative on-off patterns and the percentages of their
availabilities. We also explore the impact of having limited buffers at the base stations and regular DTN
nodes on the end-to-end message delivery ratio. We use ns-2 [8],[9] for our simulations. The common
parameter values used in the simulation are tabulated in Table 11. Each group has ten nodes which are
randomly distributed over an area of 1000m by 1000m. Thus, each group forms a sparse ad hoc network.
All nodes support DTN functionalities. The regular nodes move according to the random waypoint
mobility model with a maximum speed of 5 m/s. We assume that the regular DTN nodes communicate
with one another via the 802.11 links with 2 Mbps link bandwidth, while the wireless backhaul link has a
bandwidth of 5Mbps. The link availability patterns used for the backhaul links are shown in Figure 7.
The on/off times follow an exponential distribution with a certain mean on/off times to mimic link
patterns shown. In Case 1 and Case 2, each link is available for an average of 20 seconds and not
available for an average of 80 seconds if the mean on/off time is 100 seconds for a link availability of
20%. The two on/off patterns only differ in the relative positions of the link availabilities. To achieve the
on/off patterns shown as Case 1 in Figure 7, we generate a random on time for link 1 (say x1), then
schedule for link 2 to be on only after link 1 turns off, and link 2 will be on for another random on time
(say x2), etc. In Case 3, each link is available for an average of 30 sec and not available for an average of
120 sec. So, the link availability is also 20%.
We assume that only one type of message is used and that the message has a fixed size of 512 bytes.
We further assume that the message ferry has a buffer size of 400 messages. For each experiment, we
measure the delivery ratio for the messages delivered via the wireless backhaul links and the message
ferry separately. We also measure the contact time a message ferry has with a particular group during its
route to help us understand the delivery ratio in each experiment. In addition, we also record the end-to-
end message delivery times.
There are 10 pairs of traffic sessions where 4 pairs are single hop pairs (meaning requiring a traversal
of only one backhaul link for delivery), 4 pairs are 2-hop pairs (meaning requiring a traversal of two
backhaul links for delivery), and 2 pairs that are 3-hop pairs (meaning it needs to traverse 3 backhaul
links) when the message ferry service is not available.
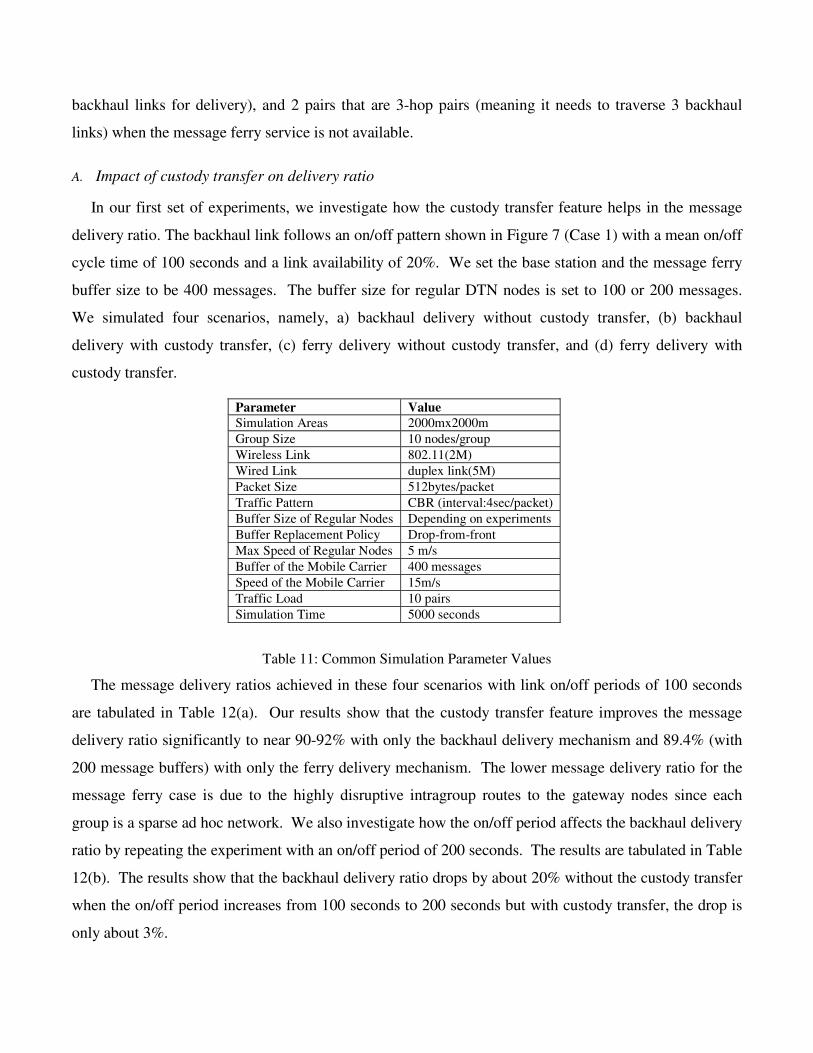
A. Impact of custody transfer on delivery ratio
In our first set of experiments, we investigate how the custody transfer feature helps in the message
delivery ratio. The backhaul link follows an on/off pattern shown in Figure 7 (Case 1) with a mean on/off
cycle time of 100 seconds and a link availability of 20%. We set the base station and the message ferry
buffer size to be 400 messages. The buffer size for regular DTN nodes is set to 100 or 200 messages.
We simulated four scenarios, namely, a) backhaul delivery without custody transfer, (b) backhaul
delivery with custody transfer, (c) ferry delivery without custody transfer, and (d) ferry delivery with
custody transfer.
Parameter Value Simulation Areas 2000mx2000m Group Size 10 nodes/group Wireless Link 802.11(2M) Wired Link duplex link(5M) Packet Size 512bytes/packet Traffic Pattern CBR (interval:4sec/packet) Buffer Size of Regular Nodes Depending on experiments Buffer Replacement Policy Drop-from-front Max Speed of Regular Nodes 5 m/s Buffer of the Mobile Carrier 400 messages Speed of the Mobile Carrier 15m/s Traffic Load 10 pairs Simulation Time 5000 seconds
Table 11: Common Simulation Parameter Values
The message delivery ratios achieved in these four scenarios with link on/off periods of 100 seconds
are tabulated in Table 12(a). Our results show that the custody transfer feature improves the message
delivery ratio significantly to near 90-92% with only the backhaul delivery mechanism and 89.4% (with
200 message buffers) with only the ferry delivery mechanism. The lower message delivery ratio for the
message ferry case is due to the highly disruptive intragroup routes to the gateway nodes since each
group is a sparse ad hoc network. We also investigate how the on/off period affects the backhaul delivery
ratio by repeating the experiment with an on/off period of 200 seconds. The results are tabulated in Table
12(b). The results show that the backhaul delivery ratio drops by about 20% without the custody transfer
when the on/off period increases from 100 seconds to 200 seconds but with custody transfer, the drop is
only about 3%.

Table 12(a): Message Delivery Ratio for Experiment 1 with on/off period of 100 sec
Buffer Size 100 200
Backhaul-delivery without custody-transfer 55.6% 58.4%
Backhaul-delivery with custody-transfer 90.9% 92.3%
Ferry-delivery without custody-transfer 10.3% 11.6%
Ferry-delivery with custody-transfer 78.6% 89.4%
Table 12(b): Message Delivery Ratio for Experiment 1 with on/off period of 200 sec
Buffer Size 100 200
Backhaul-delivery without custody-transfer 44.9% 45.9%
Backhaul-delivery with custody-transfer 87.5% 91.1%
Figure 7. Various Link Availability Patterns
B. Impact of Link Pattern on End-to-end Message Delivery
In our second experiment, we set the mean on/off period to be 200 seconds. The custody transfer
feature is turned on. The DTN nodes only use the backhaul links (no message ferry service is provided).
The results are tabulated in Table 13. The number expressed in seconds is the mean end-to-end message
delivery time.
Case 1Case 2
Case 3
Case 1Case 2
Case 3

Table 13: Message Delivery Ratio and Mean End-to-end Message Delivery Time for Experiment 2
Link Pattern 1 Link Pattern 2 Link Pattern 3
1-3
pair
78.7%
277.2seconds
82.0%
410.8second
75.1%
385.9seconds
3-1
pair
86.7%
352.5seconds
84.7%
337.1seconds
82.1%
306.4seconds
2-4
pair
96.2%
131.4seconds
97.0%
278.3seconds
99.1%
144.5seconds
4-2
pair
96.0%
229.3seconds
97.0%
145.9seconds
96.9%
166.9seconds
1-4
pair
75.9%
188.1seconds
77.4%
432.0seconds
79.3%
239.3seconds
4-1
pair
85.0%
444.6seconds
96.8%
240.9seconds
72.2%
345.7seconds
1-hop
pairs
88.7%
138.5seconds
89.4%
148.3seconds
87.9%
193.7seconds
There are a few interesting observations that we can make from these results. First, the delivery ratio
for the traffic session between Group 1 and Group 3 (indicated by 1-3 pair) is lower than other pairs
because the route between the source node and the base station breaks more frequently than other traffic
pairs, e.g., Group 3 to Group 1. The mean end-to-end delivery time depends on various factors, e.g., the
link availability pattern, the connectivity between the source node and the base station, etc. For example,
even though session 1-3 and session 3-1 are both 2-hop pairs, the average end-to-end message delivery
time for session 3-1 is higher than that achieved for session 1-3 using Case 1 link patterns because the
traffic from Group 3 requires at least two on/off cycles to reach Group 1 but the traffic from Group 1 to
Group 3 only needs one on/off cycle. In general, the mean end-to-end message delivery times are higher
for traffic sessions that traverse more backhaul hops. However, there may be situations where this is not
true. For example, the mean end-to-end delivery time for traffic session 1-4 is smaller than the mean end-
to-end delivery time for traffic session 1-3. This is due to the fact that the source node for this 1-3 pair is
sparsely connected to the base station in Group 1 while the source node for the 1-4 pair has a very reliable
route to the base station in Group 1.

C. Buffer Size Study
In the third experiment, the nodes use: (a) only the backhaul links, (b) only the message ferry, or (c)
both backhaul links and message ferry to deliver intergroup traffic. We set the message ferry and base
station buffer size to be 400 messages each. We then vary the buffer size of the regular DTN nodes to see
what its impact on the message delivery ratio and end-to-end message delivery times. The link on/off
pattern for Case 1 with a mean on/off cycle of 200 seconds and link availability of 20% is used for this
third experiment. The results for the message delivery ratio, the end-to-end message delivery time
(denoted as delay in Figure 9) and the overhead of control messages sent are plotted in Figures 8, 9, and
10. The results indicate that a delivery ratio of 90% is achievable even with 20% link availability.
Figure 8: Message Delivery Ratio
Figure 9: End-to-end Message Delivery Time
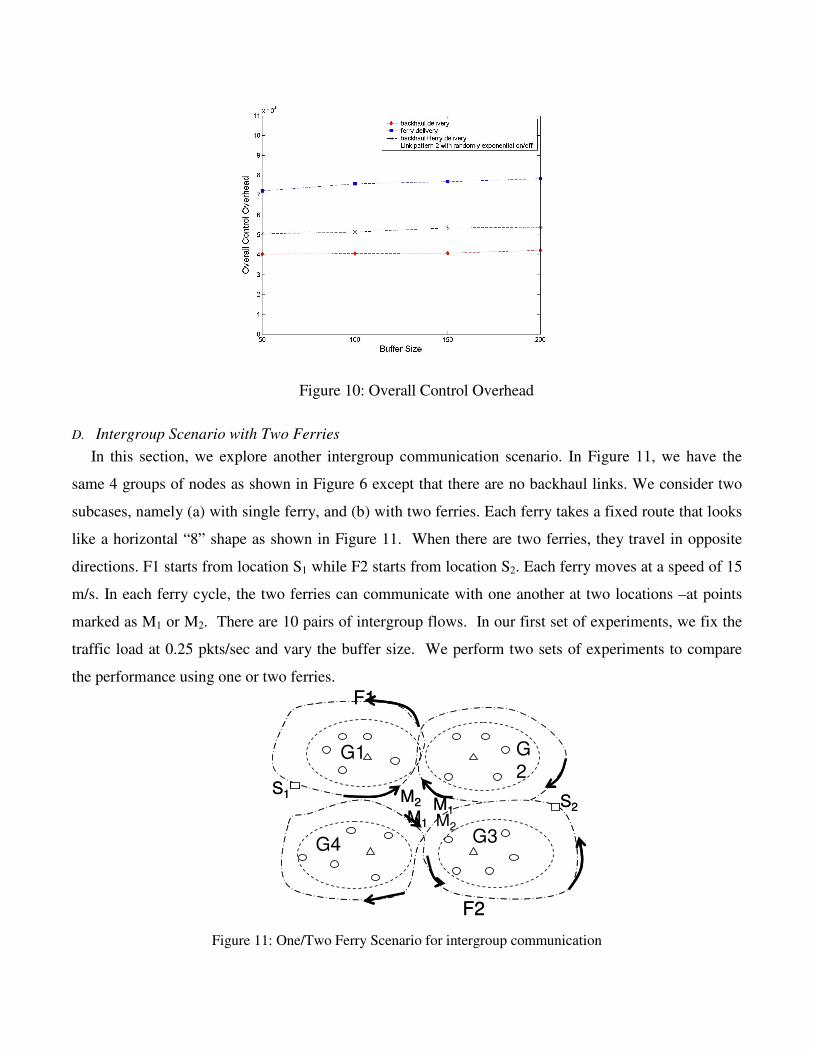
Figure 10: Overall Control Overhead
D. Intergroup Scenario with Two Ferries In this section, we explore another intergroup communication scenario. In Figure 11, we have the
same 4 groups of nodes as shown in Figure 6 except that there are no backhaul links. We consider two
subcases, namely (a) with single ferry, and (b) with two ferries. Each ferry takes a fixed route that looks
like a horizontal “8” shape as shown in Figure 11. When there are two ferries, they travel in opposite
directions. F1 starts from location S1 while F2 starts from location S2. Each ferry moves at a speed of 15
m/s. In each ferry cycle, the two ferries can communicate with one another at two locations –at points
marked as M1 or M2. There are 10 pairs of intergroup flows. In our first set of experiments, we fix the
traffic load at 0.25 pkts/sec and vary the buffer size. We perform two sets of experiments to compare
the performance using one or two ferries.
Figure 11: One/Two Ferry Scenario for intergroup communication
G1
G4
G2
G3
F1
F2
M1M1
M2
M2
S1 S2
G1
G4
G2
G3
F1
F2
M1M1
M2
M2
S1 S2

Figures 12-14 plot the results we obtained for delivery ratio, the average packet delay and the
routing overhead respectively. The results indicate that the delivery ratio improved by 8% (with buffer
size=200) with two ferries compared to the case with one ferry and the average packet delay was cut by
nearly half with two ferries. As far as overall control overhead is concerned, the presence of an
additional ferry decreases the overhead by 12%. This is because with more ferries, the routes are shorter
(i.e., fewer hops) and hence more stable.
Figure 12: Delivery Ratio vs Buffer Size Figure 13: Avg Pkt Delay vs Buffer Size
. Figure 14: Overall Control Overhead vs Buffer Size
In our second set of experiments, we fix the buffer size at 200 messages and vary the traffic load
from 0.25 pkt/sec to 2 pkt/sec and see what performance differences one or two ferries have. The results
for the second set of experiments are plotted in Figures 15-17 below.

Figure 15: Delivery Ratio vs. Traffic Load Figure 16: Avg Pkt Delay vs. Traffic Load
Figure 17: Overall Control Overhead vs. Traffic Load (Buffer=200 msgs)
Figure 15 shows that the delivery ratio drops significantly with increasing traffic load. The low
delivery ratio is due to buffer overflows. Thus, we repeat the same experiments with a buffer size of
800 messages. The results are plotted in Figures 18 to 20. We see that compared to the delivery ratio
achieved with a buffer size of 200 messages, the delivery ratio with a buffer size of 800 messages has
significantly increased. With 2 msgs/sec, the delivery ratio in the 2 ferries scenario has increased from
40% (shown in Figure 15) to 83% (shown in Figure 18). The delivery ratio in the single ferry scenario
also has increased from 28% to 51% as the buffer size increases from 200 to 800 messages. From
Figure 19, we also observe that as the traffic load increases beyond 1 msg/sec, the average packet delay
with single and two ferries becomes very similar. The average packet delay consists of three
components, namely (a) the multihop delay in reaching a node that can communicate with a ferry, (b)
the waiting time for a ferry to arrive, and, (c) the ferry transport time. At low traffic load, the average
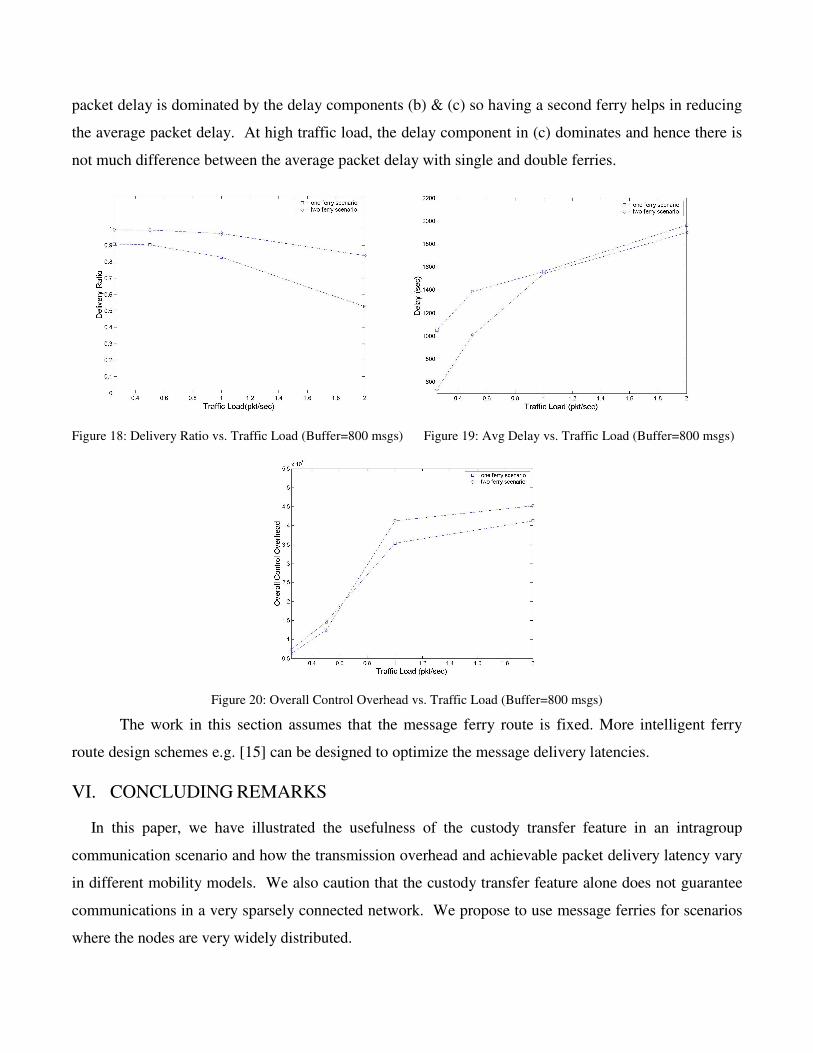
packet delay is dominated by the delay components (b) & (c) so having a second ferry helps in reducing
the average packet delay. At high traffic load, the delay component in (c) dominates and hence there is
not much difference between the average packet delay with single and double ferries.
Figure 18: Delivery Ratio vs. Traffic Load (Buffer=800 msgs) Figure 19: Avg Delay vs. Traffic Load (Buffer=800 msgs)
Figure 20: Overall Control Overhead vs. Traffic Load (Buffer=800 msgs)
The work in this section assumes that the message ferry route is fixed. More intelligent ferry
route design schemes e.g. [15] can be designed to optimize the message delivery latencies.
VI. CONCLUDING REMARKS
In this paper, we have illustrated the usefulness of the custody transfer feature in an intragroup
communication scenario and how the transmission overhead and achievable packet delivery latency vary
in different mobility models. We also caution that the custody transfer feature alone does not guarantee
communications in a very sparsely connected network. We propose to use message ferries for scenarios
where the nodes are very widely distributed.

In addition, we investigated how the percentage of nodes supporting DTN functionality affects
performance. Our results indicate that the delivery ratio achieved with only 50% nodes supporting DTN
functionality can be as high as 96.5% (only 2.2% lower than that achieved with all nodes supporting DTN
functionality) using the scenarios we have simulated. Our results also suggest that the two-way delay
experienced in bidirectional flow is only about 10% more than the one-way delay with unidirectional
flow. We also provide some results that compare the performance difference between two categories of
routing protocols, namely the multihop approach and the two-hop approach. Our results indicate that the
multihop approach still outperforms the two-hop approach. Using the traces provided by the UMass
DieselNet group, we also investigate how the varying link bandwidth impacts the performance. Our
simulation results indicate that the varying link bandwidth increases the average packet delay by about
24% compared to that experienced with fixed link bandwidth.
Via an example, we show that both the message ferry and the custody transfer feature can
improve the end-to-end intergroup message delivery ratio in a scenario with multiple backhaul links
where the link availability can be as low as 20%. In particular, our results indicate that one can achieve a
delivery ratio as high as 90-99% with appropriate buffer allocations. The design factors that influence the
end-to-end delivery ratio in scenarios where message ferries and backhaul links are used to connect
partitioned groups of nodes include the backhaul link availability patterns, and buffer allocation
strategies. Our results indicate that with appropriate buffer size, the intergroup message delivery ratio can
be maintained at more than 80% with a single ferry and multiple backhaul links. We also simulate
another scenario where there is no backhaul link but either one or two ferries are used for intergroup
communications. With appropriate buffer allocation, we again show that high delivery ratio (as high as
83%) can still be achieved even without the presence of backhaul wireless links.
There are some topics that are worthwhile investigating further. In this paper, we assume that the
traffic demands from one group to another do not vary with time and that the link availability follows
exponential on/off distribution. In real world scenarios, the traffic demands and the link availabilities
may be changing dynamically so one may not be able to predict the maximum required buffer size for the
base station. So, some work needs to be done to estimate the maximum required buffer size given some
rough estimates of the nodes’ velocities, and mobility models in different environments. In this paper, we
also simulated single and bidirectional flows. In the real world, there may be different traffic types
[25],[26]. We intend to investigate the impacts of having different traffic types on the system
performance especially when these different traffic types have different Quality of Service requirements

(e.g., in terms of delivery latency). In addition, our results comparing different unicast routing schemes
in DTN suggest that different schemes perform well in different scenarios and hence a hybrid scheme that
combines the benefits of different schemes should be used to give the most flexibility.
Acknowledgments
This work is sponsored by Defense Advanced Research Projects Agency (DARPA). Any opinions, findings, and
conclusions or recommendations expressed in this material are those of the authors and do not necessarily reflect
the views of DARPA. This document is approved for public release, unlimited distribution.
REFERENCES [1] Y. Gitman, “Magic Bike: Wireless Internet”, http://www.magicbike.net/
[2] L. Arent, G4techTV, Tech-Live, “Wi-Fi on Two Wheels”,
http://www.g4techtv.com/techtvvault/features/47657/WiFi_on_Two_Wheels.html, May 2004
[3] A. Pentland, R. Fletcher, and A. Hasson, “DakNet: Rethinking connectivity in developing nations”, IEEE
Computer, 37(1):78-83, January 2004.
[4] H. Balakrishnan, V. N. Padmanabhan, S. Seshan, and R. H. Katz, “A comparison of mechanisms for
improving TCP performance over wireless links”, IEEE/ACM Transactions on Networking, 5(6):756-769,
December 1997.
[5] K. Fall, “A delay-tolerant network architecture for challenged Internets”, Proceedings of SIGCOMM’03,
August 2003.
[6] M. Chuah, L. Cheng, and B. D. Davison, “Enhanced Disruption and Fault Tolerant Network Architecture for
Bundle Delivery (EDIFY)”, in Proceedings of IEEE Globecom, Nov. 2005
[7] C. E. Perkins and E. M. Royer, ”Ad-hoc On-Demand Distance Vector Routing”, Proceedings of IEEE
Workshop on Mobile Computing Systems and Applications, pp 90-100, Feb 1999.
[8] UCB/LBNL/VINT, “The Network Simulator ns-2”, Online at http://www.isi.edu/nsnam/ns/
[9] J. H. Saltzer, D. P. Reed, and D. D. Clark, “End-to-End Arguments in System Design”, ACM Transactions on
Computer Systems, 2(4):277-288, November 1984
[10] J. Klensin, Editor, “Simple mail transfer protocol”, IETF RFC 2821, April 2001.
[11] R. Viswanathan, J. Li, and M. C. Chuah, “Message Ferrying for Constrainted Scenarios”, poster, Proceedings
of WoWMoM, 2005.
[12] W. Zhao and M. H. Ammar, “Message Ferrying: Proactive Routing in Highly Partitioned Wireless Adhoc
Networks”, Proceedings of the IEEE Workshop on Future Trends in Distributed Computing Systems, Puerto
Rico, May, 2003.

[13] V. Cerf et al, “Delay-Tolerant Network Architecture”, Internet Draft, draft-irtf-dtnrg-arch-06.txt, March 2006.
[14] B. Burns, O. Brock and B. N. Levine, “MV Routing and Capacity Building in Disruption Tolerant Networks”,
IEEE Infocom, March 2005.
[15] W. Zhao, M. Ammar, and E. Zegura, “A message ferrying approach for data delivery in sparse mobile ad hoc
networks”, ACM Mobihoc, May 2004.
[16] W. Ma and M. Chuah, “Comparisons of Interdomain Routing Schemes for Heterogeneous Adhoc Networks”,
Proceedings of WoWMoM, 2005.
[17] K. Fall, W. Hong and S. Madden, “Custody transfer for reliable delivery in delay tolerant networks”, IRB-
TR-03-030, July 2003.
[18] J. Broch, D. A. Maltz, D. B. Johnson, Y.-C. Hu, and J. Jetcheva, “A performance comparison of multihop
wireless adhoc network routing protocol”, Proceedings of Mobicom, 1998.
[19] Y. Wang, S. Jain, M. Martonosi, and K. Fall, “Erasure-Coding Based Routing for Opportunistic Networks”,
Proceedings of Sigcomm WDTN workshop, 2005.
[20] R. Shah, S. Roy, S. Jain, and W. Brunette, “Data mules: Modeling and analysis of a three-tier architecture for
sparse sensor networks”, Elsevier Ad Hoc Networks Journal, Vol 1, pp 215-233, Sept. 2003
[21] P. Juang, H. Oki, Y. Wang, M. Martonosi, L.-S. Peh, and D. Rubenstein, “Energy-efficient computing for
wildlife tracking: design tradeoffs and early experiences with zebranet”, Proc ASPL0S, Oct 2002.
[22] A. Lindgren, A. Doria, O. Schelen, ”Probabilistic routing in intermittently connected networks”, Sigmobile,
Mobile Computing and Communications Review, Vol 7(3), pp 19-20, 2003.
[23] S. Jain, M. Demmer, R. Patra, K. Fall, “Using Redundancy to cope with Failures in a Delay Tolerant
Network”, Proceedings of Sigcomm, 2005.
[24] A. Vahdat, D. Becker, “Epidemic Routing for partially connected adhoc networks”, Tehnical Report CS-
200006, Duke University, April 2000.
[25] W. W. Brown, T. Krout, “Future Performance Expectations for Mobile Wireless Communication Networks”,
preprint, 2005.
[26] J. Hsu, S. Bhatia, M. Takai, R. Bagrodia, M. J. Acriche, ”Performance of Mobile Adhoc Networking Routing
Protocols in Realistic Scenarios”, Proc. Milcom, 2003.
[27] J. Burgess, B. Gallagher, D. Jensen, B. N. Levine, “MaxProp: Routing for Vehicle-Based Disruption-Tolerant
Networking”, in Proceedings of IEEE Infocom 2006. April 2006.
[28] J. Border, M. Kojo, J. Griner, G. Montenegro, and Z. Shelby, “Performance enhancing proxies intended to mitigate link-related degradations”, IETF RFC 3135, June 2001.