performance assessment of tariff-based air source heat pump load shifting in a uk detached dwelling...
TRANSCRIPT
lable at ScienceDirect
Applied Thermal Engineering xxx (2013) 1e12
Contents lists avai
Applied Thermal Engineering
journal homepage: www.elsevier .com/locate/apthermeng
Performance assessment of tariff-based air source heat pump loadshifting in a UK detached dwelling featuring phase change-enhancedbuffering
Nicolas J. Kelly a,*, Paul G. Tuohy a, Adam D. Hawkes b
a Energy Systems Research Unit, Department of Mechanical and Aerospace Engineering, University of Strathclyde, 374 Cathedral St, Glasgow G1 2TB, UKbCentre for Environmental Policy, Imperial College, Imperial College London, South Kensington Campus, London SW7 1NA, UK
h i g h l i g h t s
� Large thermal buffer is needed to shift the operation of a heat pump to off-peak periods.� Using phase change material halves buffer size required for load shifting.� Significant energy penalty associated with heat pump buffering and load shifting.� Buffering and load shifting causes increased heat pump running costs and CO2 emissions.� Constraining a group of buffered heat pumps to off-peak Economy 10 operation increases peak electrical load.
a r t i c l e i n f o
Article history:Received 17 July 2013Accepted 9 December 2013Available online xxx
Keywords:Load shiftingDemand side managementDomesticHeat pumpPhase change materialSimulation
* Corresponding author.E-mail address: [email protected] (N.J. Kelly).
1359-4311/$ e see front matter � 2013 Elsevier Ltd.http://dx.doi.org/10.1016/j.applthermaleng.2013.12.019
Please cite this article in press as: N.J. Kelly,dwelling featuring phase change-enj.applthermaleng.2013.12.019
a b s t r a c t
Using a detailed building simulation model, the amount of thermal buffering, with and without phasechange material (PCM), needed to time-shift an air source heat pump’s operation to off-peak periods, asdefined by the UK ‘Economy 10’ tariff, was investigated for a typical UK detached dwelling. The per-formance of the buffered system was compared to the case with no load shifting and with no thermalbuffering. Additionally, the load shifting of a population of buffered heat pumps to off-peak periods wassimulated and the resulting change in the peak demand on the electricity network was assessed. Theresults from this study indicate that 1000 L of hot water buffering or 500 L of PCM-enhanced hot waterbuffering was required to move the operation of the heat pump fully to off-peak periods, withoutadversely affecting the provision of space heating and hot water for the end user. The work also high-lights that buffering and load shifting increased the heat pump’s electrical demand by over 60% leadingto increased cost to the end user and increased CO2 emissions (depending on the electricity tariff appliedand time varying CO2 intensity of the electricity generation mix, respectively). The study also highlightsthat the load-shifting of populations of buffered heat pumps wholly to off-peak periods using crudeinstruments such as tariffs increased the peak loading on the electrical network by over 50% rather thanreducing it and that careful consideration is needed as to how the load shifting of a group of heat pumpsis orchestrated.
� 2013 Elsevier Ltd. All rights reserved.
1. Introduction
The UK has committed itself to radically reducing its greenhousegas (GHG) emissions over the coming decades, with a specifictarget of an 80% reduction by 2050 [1]. Key to achieving this goallies in decarbonising the space and water heating demands of the26 million dwellings that comprise the UK domestic sector [2].
All rights reserved.
et al., Performance assessmenhanced buffering, Appli
Housing accounts for over 30% of the UK’s final energy consump-tion [3] and around 38% of its greenhouse gas (GHG) emissions [4].
The widespread uptake of heat pumps, coupled with centralelectricity generation from nuclear and renewable sources is oftencited as a means to decarbonise domestic heating (e.g. Refs. [5,6]).However, as the vast majority of UK dwellings likely to be extant in2050 are already constructed [7], then a radical reduction in do-mestic GHG emissions will require awidespread heat pump retrofitprogramme. Air source heat pumps (ASHPs) have the potential toact as a direct replacement for the fossil-fuelled boilers commonlyfound in UK housing, though their control needs to be slightly
t of tariff-based air source heat pump load shifting in a UK detacheded Thermal Engineering (2013), http://dx.doi.org/10.1016/

N.J. Kelly et al. / Applied Thermal Engineering xxx (2013) 1e122
different and heat emitters need to be resized to account for thelower flow temperatures delivered by heat pumps [8]. The (rela-tively) low cost of installation and the lack of a requirement forground works makes ASHPs a more feasible mass retrofit propo-sition than ground source heat pumps (GSHP).
A consequence of significant numbers of ASHPs being retro-fitted into the housing stock could be substantially increasedelectrical load in the low voltage (LV) distribution system (e.g. Ref.[9]) leading to problems such as voltage dips and cable overloading,and potentially the need for expensive network reinforcement. Onemeans to avoid this scenario is to shift heat pump electrical demandto off-peak periods such as the early morning, late evening or themiddle of a typical working day, when domestic electrical demandis lower. However, this could have an impact on the delivery ofadequate indoor temperatures and the provision of hot water.Effective shifting of heat pump operation requires that themanipulation of operating times is achieved with the minimum ofinconvenience to the end user. An appropriate means to delivereffective load shifting is through the provision of sufficient thermalbuffering to temporally decouple the operation of the heat pumpfrom the space heating and hot water demands.
1.1. Review
There are many examples of electrical heating or cooling loadshifting in the literature. For example, Moreau [10] studied loadshifting in populations of hot water heating loads, indicating thatcare is required in how the load shifting was undertaken and therewas a risk of exacerbating rather than reducing the demand on thenetwork. In a study focused onwind energy, Callaway [11] assessedthe potential for manipulation of large populations thermostati-cally controlled loads to follow variable renewable generation.Wang et al. [12] analysed the potential for load shedding in a largepopulation of many thousands of unbuffered domestic heat pumpsby manipulating of the space heating set point. Focussing specif-ically on heat pumps, Hewitt [5] argues that their use with thermalstorage could be a useful means of load management in an elec-tricity system with increasing quantities of renewable energygeneration. However, as the paper is strategic in focus, the authordoes not undertake any specific analysis of the load shifting po-tential nor of the size of thermal store required.
Whilst the aforementioned studies on large populations of de-vices provide useful insight into the scope for domestic loadmanagement, they do not truly examine the potential effect on theend user in terms of comfort or provision of hot water. This either isbecause the thermal model employed is necessarily simplified (dueto the large number of loads covered in the study) or because onlyone aspect of heating is covered (i.e. space or water heating). Properassessment of the effect of thermal load shifting on the end usertypically requires the use of a more detailed model of the building.
Studies focused on the implications of load shifting at the levelof the individual dwelling, with detailedmodelling of the impact oninternal conditions are less common in the literature. Bagdanavi-cius and Jenkins [6] use a building simulation tool to estimate thepotential extra electrical load on the supply network from domesticheat pumps. They indicate that significant load shifting would berequired to reduce demand peaks, though the authors do notexplicitly model any load shifting nor its impacts. Hong et al.,([13,14]) examined the potential for flexible operation of air sourceheat pumps (ASHP) retro-fitted into UK dwellings when con-strained by the need to deliver hotwater and thermal comfort. Theyfound that shifts in heat pump operating times of up to 6 hourswere possible, but only with the addition of significant quantities ofhot water thermal buffering (up to 500 L) coupled with extensiveimprovements to the building fabric: in their paper, the authors do
Please cite this article in press as: N.J. Kelly, et al., Performance assessmendwelling featuring phase change-enhanced buffering, Applij.applthermaleng.2013.12.019
not explicitly follow any load shifting strategy and instead use asensitivity analysis. Further, the authors do not fully explore theimplications of load shifting on the heat pump’s energy and envi-ronmental performance. Arteconi et al. [15] investigated the use ofbuffering in detached dwellings insulated to 1990 UK buildingstandards with both under floor and radiator-based heating sys-tems. They calculated that up to 800 L of buffering would berequired to deliver only 1 hour of load shifting. In this study, theauthors only analyse sensible thermal buffering. Hong et al. pointedout the difficulty of accommodating large hot water tanks; partic-ularly as new build UK housing is high-cost and reducing in size[16]. More volumetrically efficient thermal buffering (e.g. PCM-enhanced buffering) is therefore beneficial, as it would take upless valuable living space within a dwelling.
1.2. Objectives
By simulating the performance of a ‘typical’ UK family dwelling[17] equipped with a heat-pump-based heating system, thecontribution of this paper is to address some of the gaps in theknowledge relating to domestic heat pump load shifting. Firstly,the volume of thermal storage (with and without PCM) required toeffectively load shift heat pump entirely to off-peak periods, asdefined by the UK economy 10 tariff [18], is assessed; this is thevolume of storage required to achieve shifting without affectingend-user comfort and hot water delivery. Secondly, the impact ofload shifting on the heat pump’s energy and environmental per-formance is assessed along with an assessment of the effect onrunning costs. Finally, to assess the potential impact on electricaldemand, an example is presented where a population of heatpumps are load shifted to timings dictated by the UK the Economy10 tariff.
2. Modelling
The typical UK family dwelling was developed as an integratedESP-r model [19], which features both the dwelling, the heat pumpand its associated heating system. The ESP-r building simulationtool, allows the energy and environmental performance of thebuilding and its energy systems to be determined over a userdefined time interval (e.g a day, week, year). The tool explicitlycalculates all of the energy and mass transfer processes underpin-ning building performance. These include: including conductionand thermal storage in building materials, all convective andradiant heat exchanges (including solar processes), air flows,interaction with plant and control systems. To achieve this, aphysical description of the building (materials constructions, ge-ometry, etc.) is decomposed into thousands of ‘control volumes’. Inthis context, a control volume is an arbitrary region of space towhich conservation equations for continuity, energy (thermal andelectrical) and species can be applied and one or more character-istic equations formed. A typical building model will containthousands of such volumes, with sets of equations extracted andgrouped according to energy system. The solution of these equa-tions sets with real time series climate data, coupled with controland occupancy-related boundary conditions yields the dynamicevolution of temperatures, energy exchanges and fluid flowswithinthe building and its supporting systems. The validity of the ESP-rtool is reviewed in Ref. [20].
The focus of the work presented here is therefore the applica-tion of the ESP-r tool, rather than development of algorithms ornew functionality: all of the models used are already available inthe general release of ESP-r. The algorithms underpinning the keyheating system components referred to later in this paper aredocumented in more detail elsewhere: air source heat pump [21],
t of tariff-based air source heat pump load shifting in a UK detacheded Thermal Engineering (2013), http://dx.doi.org/10.1016/
N.J. Kelly et al. / Applied Thermal Engineering xxx (2013) 1e12 3
the buffering and hot water storage tanks [22] and radiators andcontrols [23].
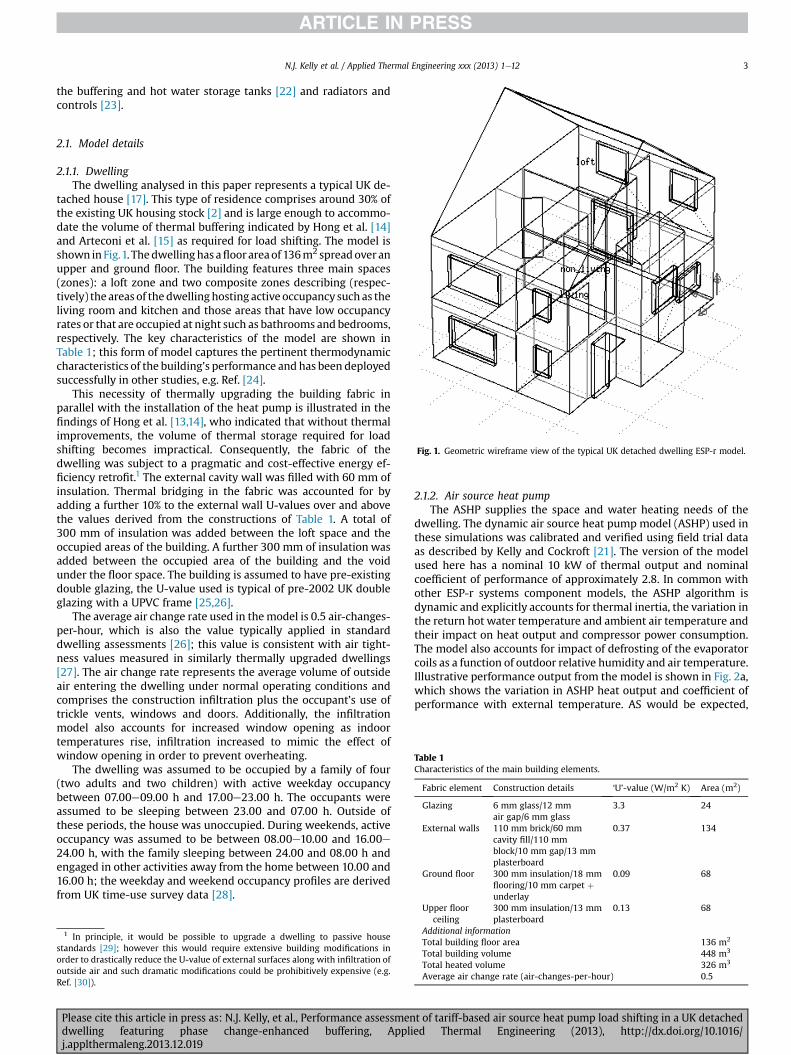
Fig. 1. Geometric wireframe view of the typical UK detached dwelling ESP-r model.
Table 1Characteristics of the main building elements.
Fabric element Construction details ‘U’-value (W/m2 K) Area (m2)
Glazing 6 mm glass/12 mmair gap/6 mm glass
3.3 24
External walls 110 mm brick/60 mmcavity fill/110 mmblock/10 mm gap/13 mmplasterboard
0.37 134
Ground floor 300 mm insulation/18 mmflooring/10 mm carpet þunderlay
0.09 68
2.1. Model details
2.1.1. DwellingThe dwelling analysed in this paper represents a typical UK de-
tached house [17]. This type of residence comprises around 30% ofthe existing UK housing stock [2] and is large enough to accommo-date the volume of thermal buffering indicated by Hong et al. [14]and Arteconi et al. [15] as required for load shifting. The model isshown in Fig.1. Thedwellinghas afloorareaof 136m2 spreadover anupper and ground floor. The building features three main spaces(zones): a loft zone and two composite zones describing (respec-tively) the areasof the dwellinghosting active occupancy such as theliving room and kitchen and those areas that have low occupancyrates or that are occupied at night such as bathrooms and bedrooms,respectively. The key characteristics of the model are shown inTable 1; this form of model captures the pertinent thermodynamiccharacteristics of the building’s performance and has been deployedsuccessfully in other studies, e.g. Ref. [24].
This necessity of thermally upgrading the building fabric inparallel with the installation of the heat pump is illustrated in thefindings of Hong et al. [13,14], who indicated that without thermalimprovements, the volume of thermal storage required for loadshifting becomes impractical. Consequently, the fabric of thedwelling was subject to a pragmatic and cost-effective energy ef-ficiency retrofit.1 The external cavity wall was filled with 60 mm ofinsulation. Thermal bridging in the fabric was accounted for byadding a further 10% to the external wall U-values over and abovethe values derived from the constructions of Table 1. A total of300 mm of insulation was added between the loft space and theoccupied areas of the building. A further 300 mm of insulation wasadded between the occupied area of the building and the voidunder the floor space. The building is assumed to have pre-existingdouble glazing, the U-value used is typical of pre-2002 UK doubleglazing with a UPVC frame [25,26].
The average air change rate used in themodel is 0.5 air-changes-per-hour, which is also the value typically applied in standarddwelling assessments [26]; this value is consistent with air tight-ness values measured in similarly thermally upgraded dwellings[27]. The air change rate represents the average volume of outsideair entering the dwelling under normal operating conditions andcomprises the construction infiltration plus the occupant’s use oftrickle vents, windows and doors. Additionally, the infiltrationmodel also accounts for increased window opening as indoortemperatures rise, infiltration increased to mimic the effect ofwindow opening in order to prevent overheating.
The dwelling was assumed to be occupied by a family of four(two adults and two children) with active weekday occupancybetween 07.00e09.00 h and 17.00e23.00 h. The occupants wereassumed to be sleeping between 23.00 and 07.00 h. Outside ofthese periods, the house was unoccupied. During weekends, activeoccupancy was assumed to be between 08.00e10.00 and 16.00e24.00 h, with the family sleeping between 24.00 and 08.00 h andengaged in other activities away from the home between 10.00 and16.00 h; the weekday and weekend occupancy profiles are derivedfrom UK time-use survey data [28].
1 In principle, it would be possible to upgrade a dwelling to passive housestandards [29]; however this would require extensive building modifications inorder to drastically reduce the U-value of external surfaces along with infiltration ofoutside air and such dramatic modifications could be prohibitively expensive (e.g.Ref. [30]).
Please cite this article in press as: N.J. Kelly, et al., Performance assessmendwelling featuring phase change-enhanced buffering, Applij.applthermaleng.2013.12.019
2.1.2. Air source heat pumpThe ASHP supplies the space and water heating needs of the
dwelling. The dynamic air source heat pump model (ASHP) used inthese simulations was calibrated and verified using field trial dataas described by Kelly and Cockroft [21]. The version of the modelused here has a nominal 10 kW of thermal output and nominalcoefficient of performance of approximately 2.8. In common withother ESP-r systems component models, the ASHP algorithm isdynamic and explicitly accounts for thermal inertia, the variation inthe return hot water temperature and ambient air temperature andtheir impact on heat output and compressor power consumption.The model also accounts for impact of defrosting of the evaporatorcoils as a function of outdoor relative humidity and air temperature.Illustrative performance output from the model is shown in Fig. 2a,which shows the variation in ASHP heat output and coefficient ofperformance with external temperature. AS would be expected,
Upper floorceiling
300 mm insulation/13 mmplasterboard
0.13 68
Additional informationTotal building floor area 136 m2
Total building volume 448 m3
Total heated volume 326 m3
Average air change rate (air-changes-per-hour) 0.5
t of tariff-based air source heat pump load shifting in a UK detacheded Thermal Engineering (2013), http://dx.doi.org/10.1016/
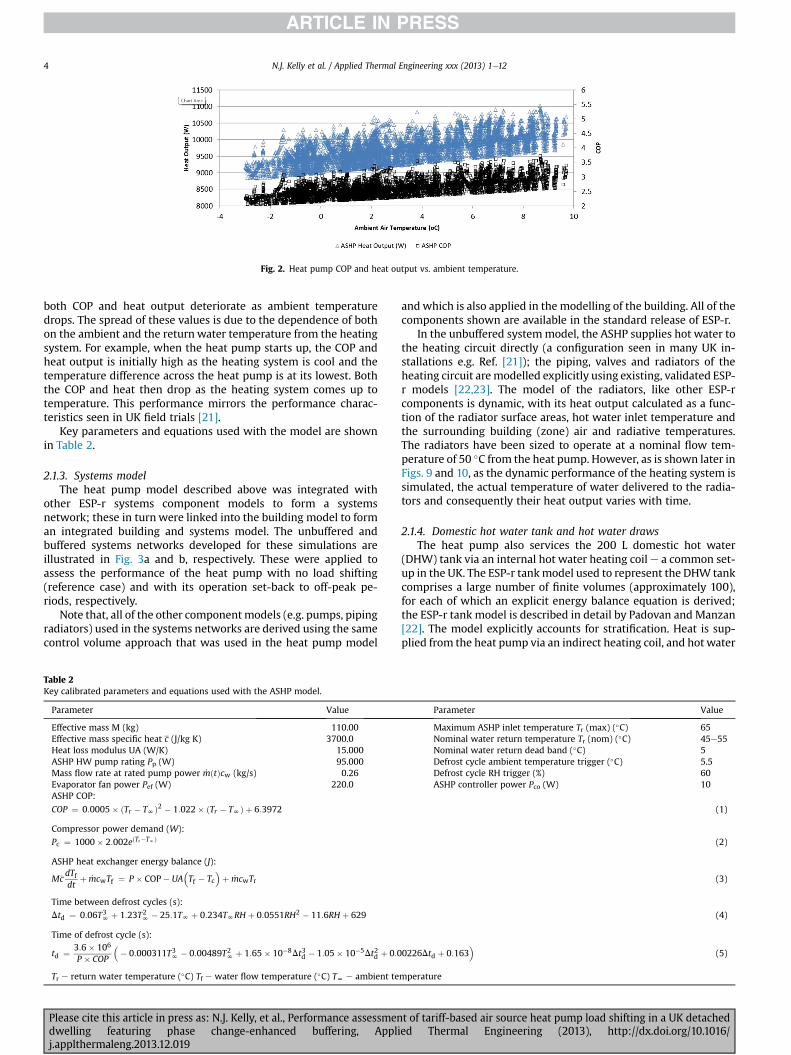
Fig. 2. Heat pump COP and heat output vs. ambient temperature.
N.J. Kelly et al. / Applied Thermal Engineering xxx (2013) 1e124
both COP and heat output deteriorate as ambient temperaturedrops. The spread of these values is due to the dependence of bothon the ambient and the return water temperature from the heatingsystem. For example, when the heat pump starts up, the COP andheat output is initially high as the heating system is cool and thetemperature difference across the heat pump is at its lowest. Boththe COP and heat then drop as the heating system comes up totemperature. This performance mirrors the performance charac-teristics seen in UK field trials [21].
Key parameters and equations used with the model are shownin Table 2.
2.1.3. Systems modelThe heat pump model described above was integrated with
other ESP-r systems component models to form a systemsnetwork; these in turn were linked into the building model to forman integrated building and systems model. The unbuffered andbuffered systems networks developed for these simulations areillustrated in Fig. 3a and b, respectively. These were applied toassess the performance of the heat pump with no load shifting(reference case) and with its operation set-back to off-peak pe-riods, respectively.
Note that, all of the other componentmodels (e.g. pumps, pipingradiators) used in the systems networks are derived using the samecontrol volume approach that was used in the heat pump model
Table 2Key calibrated parameters and equations used with the ASHP model.
Parameter Value
Effective mass M (kg) 110.00Effective mass specific heat c (J/kg K) 3700.0Heat loss modulus UA (W/K) 15.000ASHP HW pump rating Pp (W) 95.000Mass flow rate at rated pump power _mðtÞcw (kg/s) 0.26Evaporator fan power Pef (W) 220.0ASHP COP:
COP ¼ 0:0005� ðTr � TNÞ2 � 1:022� ðTr � TNÞ þ 6:3972
Compressor power demand (W):
Pc ¼ 1000� 2:002eðTr�TNÞ
ASHP heat exchanger energy balance (J):
McdTfdt
þ _mcwTf ¼ P � COP� UA�Tf � Tc
�þ _mcwTr
Time between defrost cycles (s):Dtd ¼ 0:06T3
N þ 1:23T2N � 25:1TN þ 0:234TNRH þ 0:0551RH2 � 11:6RH þ 629
Time of defrost cycle (s):
td ¼ 3:6� 106
P � COP
�� 0:000311T3
N � 0:00489T2N þ 1:65� 10�8Dt3d � 1:05� 10�5Dt2d þ 0:0
Tr e return water temperature (�C) Tf e water flow temperature (�C) TN e ambient te
Please cite this article in press as: N.J. Kelly, et al., Performance assessmendwelling featuring phase change-enhanced buffering, Applij.applthermaleng.2013.12.019
and which is also applied in the modelling of the building. All of thecomponents shown are available in the standard release of ESP-r.
In the unbuffered systemmodel, the ASHP supplies hot water tothe heating circuit directly (a configuration seen in many UK in-stallations e.g. Ref. [21]); the piping, valves and radiators of theheating circuit aremodelled explicitly using existing, validated ESP-r models [22,23]. The model of the radiators, like other ESP-rcomponents is dynamic, with its heat output calculated as a func-tion of the radiator surface areas, hot water inlet temperature andthe surrounding building (zone) air and radiative temperatures.The radiators have been sized to operate at a nominal flow tem-perature of 50 �C from the heat pump. However, as is shown later inFigs. 9 and 10, as the dynamic performance of the heating system issimulated, the actual temperature of water delivered to the radia-tors and consequently their heat output varies with time.
2.1.4. Domestic hot water tank and hot water drawsThe heat pump also services the 200 L domestic hot water
(DHW) tank via an internal hot water heating coil e a common set-up in the UK. The ESP-r tankmodel used to represent the DHW tankcomprises a large number of finite volumes (approximately 100),for each of which an explicit energy balance equation is derived;the ESP-r tank model is described in detail by Padovan and Manzan[22]. The model explicitly accounts for stratification. Heat is sup-plied from the heat pump via an indirect heating coil, and hot water
Parameter Value
Maximum ASHP inlet temperature Tr (max) (�C) 65Nominal water return temperature Tr (nom) (�C) 45e55Nominal water return dead band (�C) 5Defrost cycle ambient temperature trigger (�C) 5.5Defrost cycle RH trigger (%) 60ASHP controller power Pco (W) 10
(1)
(2)
(3)
(4)
0226Dtd þ 0:163�
(5)
mperature
t of tariff-based air source heat pump load shifting in a UK detacheded Thermal Engineering (2013), http://dx.doi.org/10.1016/
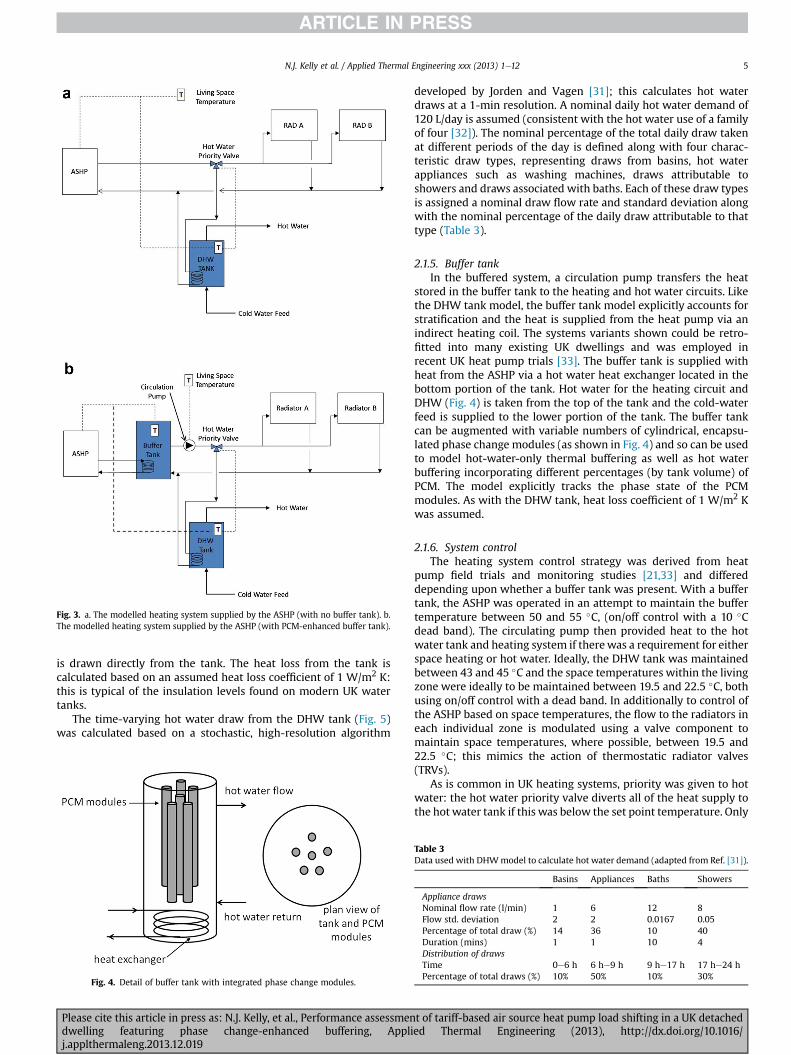
Fig. 3. a. The modelled heating system supplied by the ASHP (with no buffer tank). b.The modelled heating system supplied by the ASHP (with PCM-enhanced buffer tank).
N.J. Kelly et al. / Applied Thermal Engineering xxx (2013) 1e12 5
is drawn directly from the tank. The heat loss from the tank iscalculated based on an assumed heat loss coefficient of 1 W/m2 K:this is typical of the insulation levels found on modern UK watertanks.
The time-varying hot water draw from the DHW tank (Fig. 5)was calculated based on a stochastic, high-resolution algorithm
Fig. 4. Detail of buffer tank with integrated phase change modules.
Please cite this article in press as: N.J. Kelly, et al., Performance assessmendwelling featuring phase change-enhanced buffering, Applij.applthermaleng.2013.12.019
developed by Jorden and Vagen [31]; this calculates hot waterdraws at a 1-min resolution. A nominal daily hot water demand of120 L/day is assumed (consistent with the hot water use of a familyof four [32]). The nominal percentage of the total daily draw takenat different periods of the day is defined along with four charac-teristic draw types, representing draws from basins, hot waterappliances such as washing machines, draws attributable toshowers and draws associated with baths. Each of these draw typesis assigned a nominal draw flow rate and standard deviation alongwith the nominal percentage of the daily draw attributable to thattype (Table 3).
2.1.5. Buffer tankIn the buffered system, a circulation pump transfers the heat
stored in the buffer tank to the heating and hot water circuits. Likethe DHW tank model, the buffer tank model explicitly accounts forstratification and the heat is supplied from the heat pump via anindirect heating coil. The systems variants shown could be retro-fitted into many existing UK dwellings and was employed inrecent UK heat pump trials [33]. The buffer tank is supplied withheat from the ASHP via a hot water heat exchanger located in thebottom portion of the tank. Hot water for the heating circuit andDHW (Fig. 4) is taken from the top of the tank and the cold-waterfeed is supplied to the lower portion of the tank. The buffer tankcan be augmented with variable numbers of cylindrical, encapsu-lated phase change modules (as shown in Fig. 4) and so can be usedto model hot-water-only thermal buffering as well as hot waterbuffering incorporating different percentages (by tank volume) ofPCM. The model explicitly tracks the phase state of the PCMmodules. As with the DHW tank, heat loss coefficient of 1 W/m2 Kwas assumed.
2.1.6. System controlThe heating system control strategy was derived from heat
pump field trials and monitoring studies [21,33] and differeddepending upon whether a buffer tank was present. With a buffertank, the ASHP was operated in an attempt to maintain the buffertemperature between 50 and 55 �C, (on/off control with a 10 �Cdead band). The circulating pump then provided heat to the hotwater tank and heating system if therewas a requirement for eitherspace heating or hot water. Ideally, the DHW tank was maintainedbetween 43 and 45 �C and the space temperatures within the livingzone were ideally to be maintained between 19.5 and 22.5 �C, bothusing on/off control with a dead band. In additionally to control ofthe ASHP based on space temperatures, the flow to the radiators ineach individual zone is modulated using a valve component tomaintain space temperatures, where possible, between 19.5 and22.5 �C; this mimics the action of thermostatic radiator valves(TRVs).
As is common in UK heating systems, priority was given to hotwater: the hot water priority valve diverts all of the heat supply tothe hot water tank if this was below the set point temperature. Only
Table 3Data used with DHWmodel to calculate hot water demand (adapted from Ref. [31]).
Basins Appliances Baths Showers
Appliance drawsNominal flow rate (l/min) 1 6 12 8Flow std. deviation 2 2 0.0167 0.05Percentage of total draw (%) 14 36 10 40Duration (mins) 1 1 10 4Distribution of drawsTime 0e6 h 6 he9 h 9 he17 h 17 he24 hPercentage of total draws (%) 10% 50% 10% 30%
t of tariff-based air source heat pump load shifting in a UK detacheded Thermal Engineering (2013), http://dx.doi.org/10.1016/
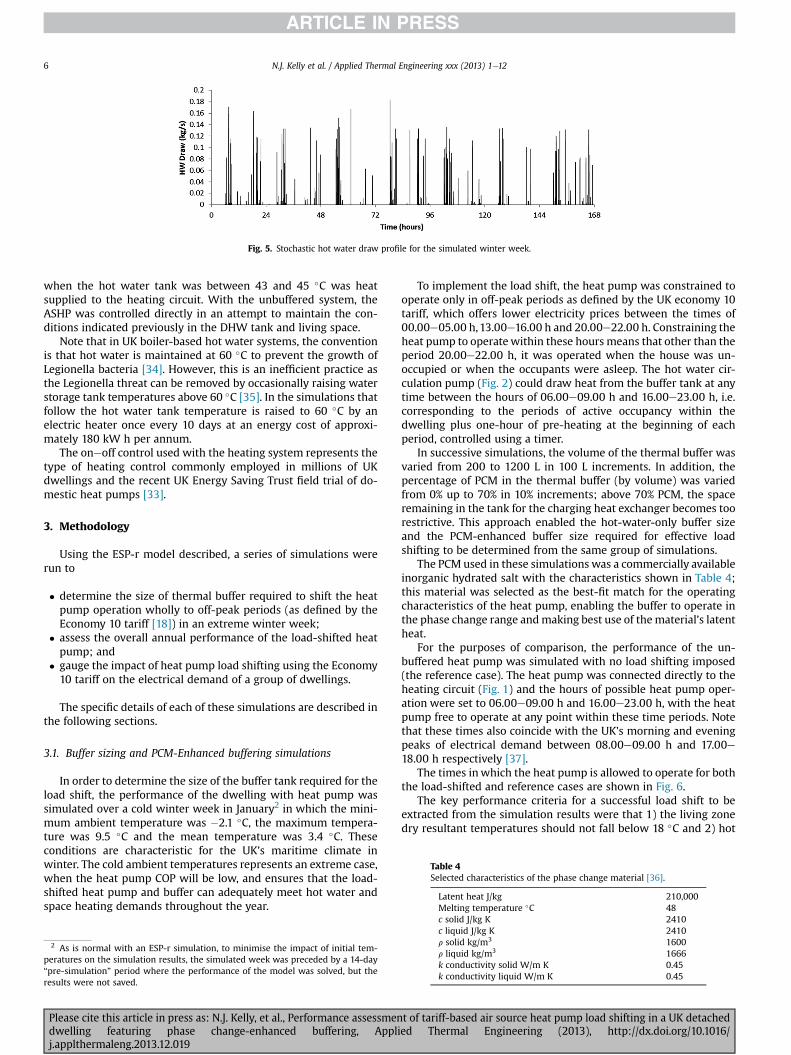
Fig. 5. Stochastic hot water draw profile for the simulated winter week.
Table 4Selected characteristics of the phase change material [36].
Latent heat J/kg 210,000Melting temperature �C 48
N.J. Kelly et al. / Applied Thermal Engineering xxx (2013) 1e126
when the hot water tank was between 43 and 45 �C was heatsupplied to the heating circuit. With the unbuffered system, theASHP was controlled directly in an attempt to maintain the con-ditions indicated previously in the DHW tank and living space.
Note that in UK boiler-based hot water systems, the conventionis that hot water is maintained at 60 �C to prevent the growth ofLegionella bacteria [34]. However, this is an inefficient practice asthe Legionella threat can be removed by occasionally raising waterstorage tank temperatures above 60 �C [35]. In the simulations thatfollow the hot water tank temperature is raised to 60 �C by anelectric heater once every 10 days at an energy cost of approxi-mately 180 kW h per annum.
The oneoff control used with the heating system represents thetype of heating control commonly employed in millions of UKdwellings and the recent UK Energy Saving Trust field trial of do-mestic heat pumps [33].
3. Methodology
Using the ESP-r model described, a series of simulations wererun to
� determine the size of thermal buffer required to shift the heatpump operation wholly to off-peak periods (as defined by theEconomy 10 tariff [18]) in an extreme winter week;
� assess the overall annual performance of the load-shifted heatpump; and
� gauge the impact of heat pump load shifting using the Economy10 tariff on the electrical demand of a group of dwellings.
The specific details of each of these simulations are described inthe following sections.
3.1. Buffer sizing and PCM-Enhanced buffering simulations
In order to determine the size of the buffer tank required for theload shift, the performance of the dwelling with heat pump wassimulated over a cold winter week in January2 in which the mini-mum ambient temperature was �2.1 �C, the maximum tempera-ture was 9.5 �C and the mean temperature was 3.4 �C. Theseconditions are characteristic for the UK’s maritime climate inwinter. The cold ambient temperatures represents an extreme case,when the heat pump COP will be low, and ensures that the load-shifted heat pump and buffer can adequately meet hot water andspace heating demands throughout the year.
2 As is normal with an ESP-r simulation, to minimise the impact of initial tem-peratures on the simulation results, the simulated week was preceded by a 14-day“pre-simulation” period where the performance of the model was solved, but theresults were not saved.
Please cite this article in press as: N.J. Kelly, et al., Performance assessmendwelling featuring phase change-enhanced buffering, Applij.applthermaleng.2013.12.019
To implement the load shift, the heat pump was constrained tooperate only in off-peak periods as defined by the UK economy 10tariff, which offers lower electricity prices between the times of00.00e05.00 h,13.00e16.00 h and 20.00e22.00 h. Constraining theheat pump to operatewithin these hours means that other than theperiod 20.00e22.00 h, it was operated when the house was un-occupied or when the occupants were asleep. The hot water cir-culation pump (Fig. 2) could draw heat from the buffer tank at anytime between the hours of 06.00e09.00 h and 16.00e23.00 h, i.e.corresponding to the periods of active occupancy within thedwelling plus one-hour of pre-heating at the beginning of eachperiod, controlled using a timer.
In successive simulations, the volume of the thermal buffer wasvaried from 200 to 1200 L in 100 L increments. In addition, thepercentage of PCM in the thermal buffer (by volume) was variedfrom 0% up to 70% in 10% increments; above 70% PCM, the spaceremaining in the tank for the charging heat exchanger becomes toorestrictive. This approach enabled the hot-water-only buffer sizeand the PCM-enhanced buffer size required for effective loadshifting to be determined from the same group of simulations.
The PCM used in these simulations was a commercially availableinorganic hydrated salt with the characteristics shown in Table 4;this material was selected as the best-fit match for the operatingcharacteristics of the heat pump, enabling the buffer to operate inthe phase change range andmaking best use of thematerial’s latentheat.
For the purposes of comparison, the performance of the un-buffered heat pump was simulated with no load shifting imposed(the reference case). The heat pump was connected directly to theheating circuit (Fig. 1) and the hours of possible heat pump oper-ation were set to 06.00e09.00 h and 16.00e23.00 h, with the heatpump free to operate at any point within these time periods. Notethat these times also coincide with the UK’s morning and eveningpeaks of electrical demand between 08.00e09.00 h and 17.00e18.00 h respectively [37].
The times inwhich the heat pump is allowed to operate for boththe load-shifted and reference cases are shown in Fig. 6.
The key performance criteria for a successful load shift to beextracted from the simulation results were that 1) the living zonedry resultant temperatures should not fall below 18 �C and 2) hot
c solid J/kg K 2410c liquid J/kg K 2410r solid kg/m3 1600r liquid kg/m3 1666k conductivity solid W/m K 0.45k conductivity liquid W/m K 0.45
t of tariff-based air source heat pump load shifting in a UK detacheded Thermal Engineering (2013), http://dx.doi.org/10.1016/

Fig. 6. Reference case and load shifted heat pump operating hours.
N.J. Kelly et al. / Applied Thermal Engineering xxx (2013) 1e12 7
water temperatures should be kept above 40 �C during occupiedhours.
A dry resultant temperature of 18 �C is towards the lower end ofacceptable thermal comfort as defined by Fanger [38]. Note that adry resultant temperature (50% mean radiant temperature, 50% drybulb temperature) of 18 �C does not guarantee comfort; this isdependent uponmany other factors including clothing and activity,hence this is an approximate metric.
Water supplied at 40 �C is the temperature of a typical shower[39]. The buffer sizes identified from this stage of modelling are thelowest buffer tank volumes (with or without additional PCMmodules) that satisfy the two aforementioned criteria.
Other performance metrics extracted were the heat pump coeffi-cient of performance, its electrical energy consumption and thenumber of oneoff cycles, all of which were affected by the use ofthermal buffering and the alterationof theheat pumpoperating times.
3.2. Energy, economic and environmental performance
For the buffer sizes (with and without PCM) identified from the1-week simulations which maintained comfort and hot watertemperatures, a further annual simulation was undertaken. TheASHP technical performance data from these simulations wasanalysed to determine the heat pump energy use, running costsalong with the carbon emissions associated with the electricalenergy use of the heat pump. Table 5 shows the on and off-peakprices applied [40].
To quantify the CO2 emissions from the heat pump whilst ac-counting for the effect of load shifting it was necessary to generatetime-varying carbon intensity data using a technique described byHawkes [40]. Briefly, data on the UK generation-mix for each hourof 2011 was obtained from Elexon [41]. This information along withthe assumed carbon intensities for different generation types [40]was then used to calculate the average hourly CO2 intensity(gCO2/kW) for grid electricity for each hour of the year as shown inFig. 7a. Additionally, Fig. 7b shows the grid carbon intensity varia-tions over the simulated winter week. The simulated heat pumpelectrical demand over each hour (kW h) could then be mapped tothe appropriate CO2 intensity and so the CO2 emissions (kg) asso-ciated with the operation of the heat pump over every hour of theyear could be calculated.
3.3. Load shifting a population of heat pumps
The effect of load shifting on the local, low voltage (LV) networkover several hours with the aid of a PCM-enhanced thermal buffer
Table 5Economy 10 on and off peak energy costs [18].
Tariff £GBP per kW h £GBP per kW h
Standard unit cost (forunbuffered ASHP with no load shift)
0.1308
Economy 10 unit costs (forbuffered ASHP under load-shift)
(On-peak cost)0.1817
(Off-peak cost)0.1053
Please cite this article in press as: N.J. Kelly, et al., Performance assessmendwelling featuring phase change-enhanced buffering, Applij.applthermaleng.2013.12.019
was analysed for the aggregate demand of a population of 50similar, detached dwellings. This scenario approximates the situa-tion found in many UK suburban housing estates (e.g. Ref. [42]),where the dwellings are of a similar age and type and correspondsto a ‘worst case’ that amplifies the effect of the electrification ofheat and load shifting. The analysis was undertaken over the samecold winter week used to size the buffer tank capacity.
Each dwelling incorporated a retrofitted, buffered heat pump. Inorder to enact the load shift, the operation of the whole populationof heat pumps was constrained to Economy 10 off-peak periods.The resulting aggregate demand for the 50 dwellings was thencompared to the case where unbuffered heat pumps were allowedto meet the dwellings’ heating demand without operating con-straints. The occupancy of the dwellings was predominantlyintermittent, with pronounced peaks of electrical and heating ac-tivity in the morning and evening.
The load management analysed here involves very substantialload shifts using a relatively crude, tariff-based approach. Conse-quently, the analysis that follows does not constitute an optimummeans of load shifting; however, it does illustrate some of the po-tential implications of shifting thermal loads over periods of severalhours using existing levers such as Economy 10. Substantial loadshifting of this type may be required in order to radically re-shapelocal, domestic demand; though such a high penetration of heatpumps represents a severe test for the LV network.
This study required the use of ESP-r to calculate the heat pumpelectrical power consumption along with a domestic electricitydemand model (DEDM) developed by Richardson et al. [43]. TheDEDM calculated the matching electrical demand of each house-hold (excluding the heat pump demand). The summation of eachdwelling’s heat pump electrical demand and the household appli-ance demand gave the total (real) electrical demand.
Fig. 7. a. Hourly UK grid average carbon intensity (g/kW h) for 2011. b. Hourly UK gridaverage carbon intensity (g/kW h) for modelled winter week.
t of tariff-based air source heat pump load shifting in a UK detacheded Thermal Engineering (2013), http://dx.doi.org/10.1016/
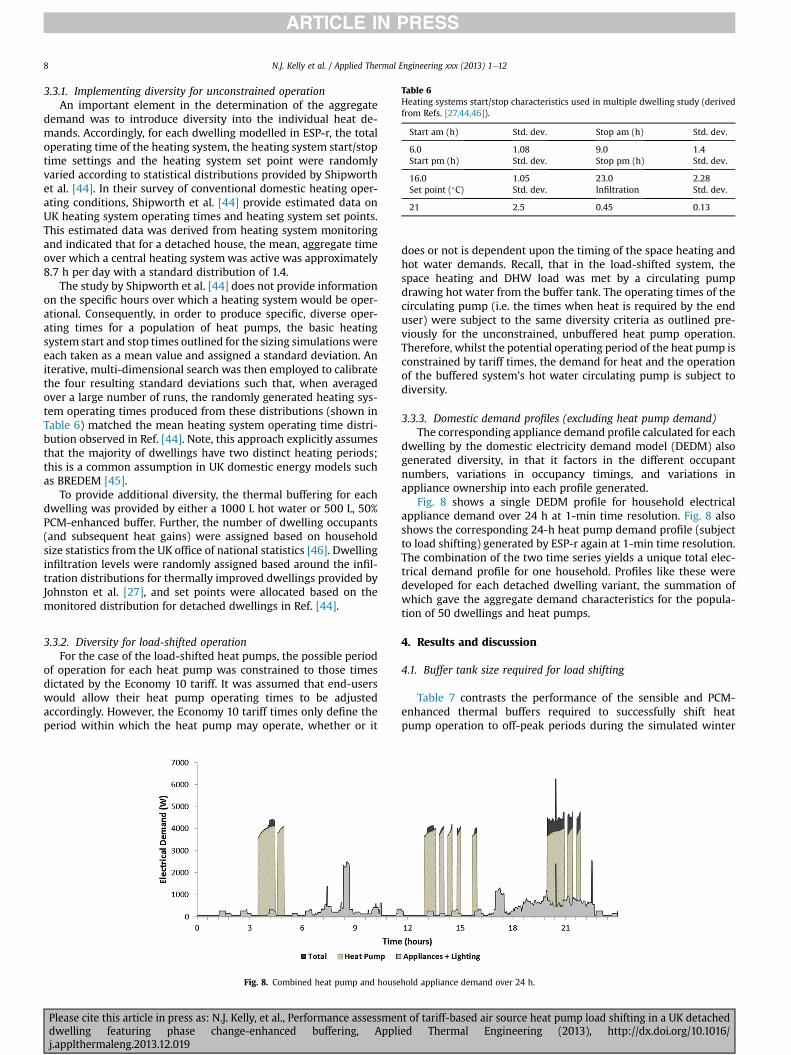
Table 6Heating systems start/stop characteristics used in multiple dwelling study (derivedfrom Refs. [27,44,46]).
Start am (h) Std. dev. Stop am (h) Std. dev.
6.0 1.08 9.0 1.4Start pm (h) Std. dev. Stop pm (h) Std. dev.
16.0 1.05 23.0 2.28Set point (�C) Std. dev. Infiltration Std. dev.
21 2.5 0.45 0.13
N.J. Kelly et al. / Applied Thermal Engineering xxx (2013) 1e128
3.3.1. Implementing diversity for unconstrained operationAn important element in the determination of the aggregate
demand was to introduce diversity into the individual heat de-mands. Accordingly, for each dwelling modelled in ESP-r, the totaloperating time of the heating system, the heating system start/stoptime settings and the heating system set point were randomlyvaried according to statistical distributions provided by Shipworthet al. [44]. In their survey of conventional domestic heating oper-ating conditions, Shipworth et al. [44] provide estimated data onUK heating system operating times and heating system set points.This estimated data was derived from heating system monitoringand indicated that for a detached house, the mean, aggregate timeover which a central heating systemwas active was approximately8.7 h per day with a standard distribution of 1.4.
The study by Shipworth et al. [44] does not provide informationon the specific hours over which a heating system would be oper-ational. Consequently, in order to produce specific, diverse oper-ating times for a population of heat pumps, the basic heatingsystem start and stop times outlined for the sizing simulations wereeach taken as a mean value and assigned a standard deviation. Aniterative, multi-dimensional search was then employed to calibratethe four resulting standard deviations such that, when averagedover a large number of runs, the randomly generated heating sys-tem operating times produced from these distributions (shown inTable 6) matched the mean heating system operating time distri-bution observed in Ref. [44]. Note, this approach explicitly assumesthat the majority of dwellings have two distinct heating periods;this is a common assumption in UK domestic energy models suchas BREDEM [45].
To provide additional diversity, the thermal buffering for eachdwelling was provided by either a 1000 L hot water or 500 L, 50%PCM-enhanced buffer. Further, the number of dwelling occupants(and subsequent heat gains) were assigned based on householdsize statistics from the UK office of national statistics [46]. Dwellinginfiltration levels were randomly assigned based around the infil-tration distributions for thermally improved dwellings provided byJohnston et al. [27], and set points were allocated based on themonitored distribution for detached dwellings in Ref. [44].
3.3.2. Diversity for load-shifted operationFor the case of the load-shifted heat pumps, the possible period
of operation for each heat pump was constrained to those timesdictated by the Economy 10 tariff. It was assumed that end-userswould allow their heat pump operating times to be adjustedaccordingly. However, the Economy 10 tariff times only define theperiod within which the heat pump may operate, whether or it
Fig. 8. Combined heat pump and house
Please cite this article in press as: N.J. Kelly, et al., Performance assessmendwelling featuring phase change-enhanced buffering, Applij.applthermaleng.2013.12.019
does or not is dependent upon the timing of the space heating andhot water demands. Recall, that in the load-shifted system, thespace heating and DHW load was met by a circulating pumpdrawing hot water from the buffer tank. The operating times of thecirculating pump (i.e. the times when heat is required by the enduser) were subject to the same diversity criteria as outlined pre-viously for the unconstrained, unbuffered heat pump operation.Therefore, whilst the potential operating period of the heat pump isconstrained by tariff times, the demand for heat and the operationof the buffered system’s hot water circulating pump is subject todiversity.
3.3.3. Domestic demand profiles (excluding heat pump demand)The corresponding appliance demand profile calculated for each
dwelling by the domestic electricity demand model (DEDM) alsogenerated diversity, in that it factors in the different occupantnumbers, variations in occupancy timings, and variations inappliance ownership into each profile generated.
Fig. 8 shows a single DEDM profile for household electricalappliance demand over 24 h at 1-min time resolution. Fig. 8 alsoshows the corresponding 24-h heat pump demand profile (subjectto load shifting) generated by ESP-r again at 1-min time resolution.The combination of the two time series yields a unique total elec-trical demand profile for one household. Profiles like these weredeveloped for each detached dwelling variant, the summation ofwhich gave the aggregate demand characteristics for the popula-tion of 50 dwellings and heat pumps.
4. Results and discussion
4.1. Buffer tank size required for load shifting
Table 7 contrasts the performance of the sensible and PCM-enhanced thermal buffers required to successfully shift heatpump operation to off-peak periods during the simulated winter
hold appliance demand over 24 h.
t of tariff-based air source heat pump load shifting in a UK detacheded Thermal Engineering (2013), http://dx.doi.org/10.1016/

Table 7System performance and size of buffering required for effective load shifting (winterweek).
Unbuffered noload shift(reference)
1000 L hot waterbuffer off-peakoperation
PCM-enhanced buffer500 L þ 50% PCMoff-peak operation
Average living roomtemperature (�C)
20.9 21.2 21.0
Average buffertemperature (�C)
N/A 47.9 48.4
Average DHWtemperature (�C)
44.6 44.2 43.9
AverageASHP COP (�)
3.04 2.44 2.37
ASHP heat output(kW h)
204.5 276.0 247.3
ASHP electricalenergy (kW h)
69.5 115.2 106.4
ASHP cycles e 127 41 65
N.J. Kelly et al. / Applied Thermal Engineering xxx (2013) 1e12 9
week. Also shown is the performance of the reference case with noload shifting. A tank size of 500 L, with 50% of the volume occupiedby PCM, enabled effective load shifting without adversely affectingthe comfort or availability of hot water to the end-user. Without theinclusion of the PCM, a buffer tank of 1000 L was required. Theperformance data shown was derived from the time-series simu-lation output of the ESP-r model. Example output can be seen inFigs. 9 and 10, which highlight the operation of the unbuffered heatpump and the heat pump with the PCM-enhanced buffer, respec-tively over the course of a day. Note however, that the temperaturescaling masks the small variation in the outside air temperature.
Fig. 9 shows the operation of the heat pump when directlycoupled in to the space heating and hot water system of thedwelling, with the heat pump initially operating to charge the DHWtank and then cycling to maintain the living space temperature. Thefigure also illustrates the dynamic nature of the model, with thevariation flow and return temperatures, storage temperatures, heatpump output and electrical demand.
Fig. 10 shows the effect of buffering and load shifting, with heatpump operating to charge the buffer tank, which is then dischargedto meet the dwelling’s space heating and hot water demands. Theheat pump operation is decoupled from the evolution of the livingspace and hot water tank outlet temperatures. The discharge of thebuffer tank is evident (Fig. 10) through the sudden reductions intemperature, as the pump taking hot water from the buffer (shownin Fig. 2) first charges the hot water tank and then operates to meetthe space heating demand during periods of active occupancy.
Fig. 10 also shows the effect of the of the PCM, with sometemperature recovery in the outlet temperature of the buffer tankafter the initial morning demand, as thewarmer PCMmodules heatthe surrounding, cooler water.
Fig. 9. Temperatures and heat pump electrical d
Please cite this article in press as: N.J. Kelly, et al., Performance assessmendwelling featuring phase change-enhanced buffering, Applij.applthermaleng.2013.12.019
4.2. Energy, economic and environmental performance
Having identified the tank sizes required to deliver effective loadshifting from the winter week simulation, full annual simulationswere undertaken to assess the energy performance of the loadshifted, buffered system. The results are shown in Table 8.
Comparing the buffered to the unbuffered case, therewas a clearannual energy penalty associated with the load shift to off-peakperiods. With the 500 L, PCM-enhanced tank, the annual energyuse was 61% higher than in the unbuffered case with no load shift.The energy use for the 1000 L tank was 65% higher. The reasons forthis increase in energy use were as follows.
Firstly, the COP of the buffered heat pumps was lower than theunbuffered case: the addition of the extra heat exchanger in thebuffer tank between the ASHP and the heating system means thatthe temperature at which heat was supplied needed to be greater inorder to maintain similar conditions in the dwelling. This is evidentwhen comparing the flow and return temperatures in Figs. 9 and10, the heat pump outlet temperature is some 5 �C higher than thecasewith no buffer and towards the upper end of themodelled heatpump’s capabilities. Moreover, the load-shifted ASHP operatedduring off-peak hours, generally during the evening and earlymorning when outside air temperatures were lower; this, coupledwith the elevated supply temperatures resulted in the temperaturedifference across the heat pump being greater and so the COP wasreduced, as is evidenced in the performance characteristics shownin Fig. 3. Secondly, whilst the buffer tank in these simulations waswell insulated (with a heat loss coefficient of 1 W/m2 K) it was stillsubject to parasitic losses not present in the unbuffered case. Theimpact of parasitic losses is evident in the periods of slow decay ofthe buffer tank temperature evident in Fig. 10. The buffer tank ef-ficiency (i.e. energy input/energy delivered) calculated from thesimulations was 84% for the 1000 L tank and 92% for the 500 L PCM-enhanced tank.
It is also worth noting that the annual COP of the buffered,shifted systems is marginally higher than their COP for the simu-lated winter week; this would be expected as during other periodsof the year the ambient air temperature is higher. The annual COP ofthe unbuffered system is marginally lower than in the winter week.This is due to higher levels of cycling during periods of low load inwarmer months offsetting the benefit of higher ambient air tem-peratures. However, the annual COP of the unbuffered system isstill superior to that seen in both of the buffered, load-shifted cases.
Table 8 also shows the calculated CO2 emissions for the unbuf-fered and buffered, load-shifted heat pumps. With the 2011 UK CO2intensity shown in Fig. 7a, load shifting of the heat pump into off-peak periods resulted in increased CO2 emissions, primarilybecause load shifting increased the heat pump’s electrical demandand because the difference in UK grid CO2 intensity between peakand off-peak periods was generally small (Fig. 7b).
emand with no buffering and no load shift.
t of tariff-based air source heat pump load shifting in a UK detacheded Thermal Engineering (2013), http://dx.doi.org/10.1016/
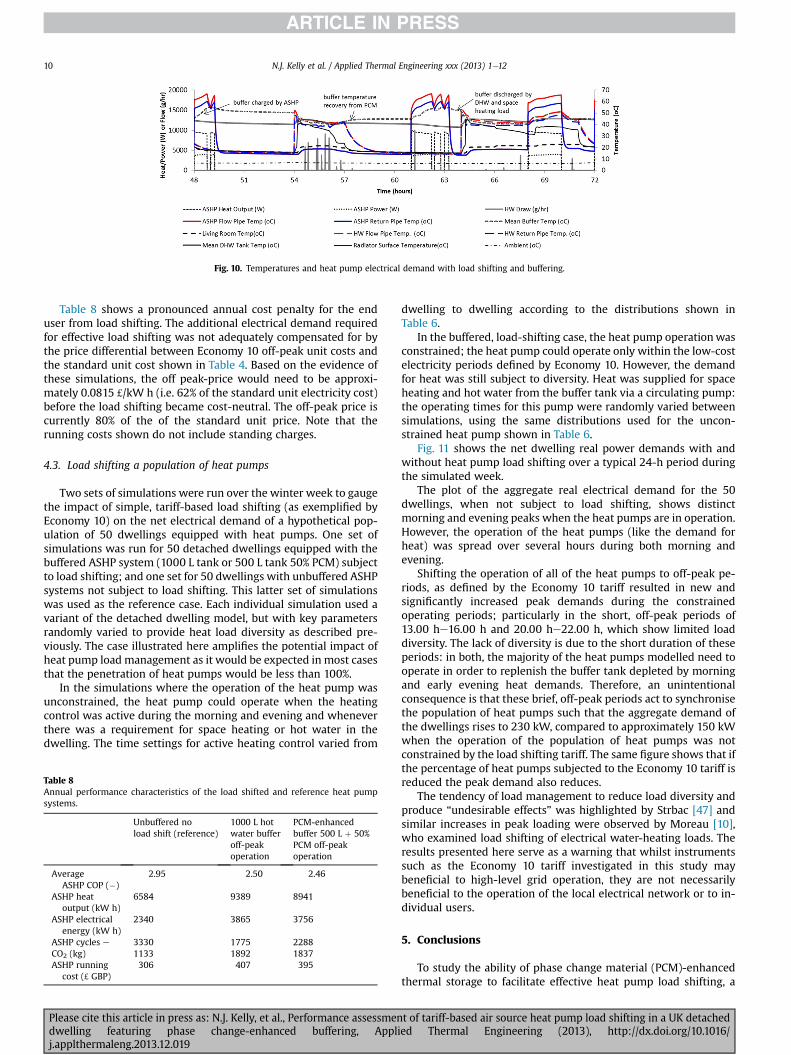
Fig. 10. Temperatures and heat pump electrical demand with load shifting and buffering.
N.J. Kelly et al. / Applied Thermal Engineering xxx (2013) 1e1210
Table 8 shows a pronounced annual cost penalty for the enduser from load shifting. The additional electrical demand requiredfor effective load shifting was not adequately compensated for bythe price differential between Economy 10 off-peak unit costs andthe standard unit cost shown in Table 4. Based on the evidence ofthese simulations, the off peak-price would need to be approxi-mately 0.0815 £/kW h (i.e. 62% of the standard unit electricity cost)before the load shifting became cost-neutral. The off-peak price iscurrently 80% of the of the standard unit price. Note that therunning costs shown do not include standing charges.
4.3. Load shifting a population of heat pumps
Two sets of simulations were run over the winter week to gaugethe impact of simple, tariff-based load shifting (as exemplified byEconomy 10) on the net electrical demand of a hypothetical pop-ulation of 50 dwellings equipped with heat pumps. One set ofsimulations was run for 50 detached dwellings equipped with thebuffered ASHP system (1000 L tank or 500 L tank 50% PCM) subjectto load shifting; and one set for 50 dwellings with unbuffered ASHPsystems not subject to load shifting. This latter set of simulationswas used as the reference case. Each individual simulation used avariant of the detached dwelling model, but with key parametersrandomly varied to provide heat load diversity as described pre-viously. The case illustrated here amplifies the potential impact ofheat pump load management as it would be expected in most casesthat the penetration of heat pumps would be less than 100%.
In the simulations where the operation of the heat pump wasunconstrained, the heat pump could operate when the heatingcontrol was active during the morning and evening and wheneverthere was a requirement for space heating or hot water in thedwelling. The time settings for active heating control varied from
Table 8Annual performance characteristics of the load shifted and reference heat pumpsystems.
Unbuffered noload shift (reference)
1000 L hotwater bufferoff-peakoperation
PCM-enhancedbuffer 500 L þ 50%PCM off-peakoperation
AverageASHP COP (�)
2.95 2.50 2.46
ASHP heatoutput (kW h)
6584 9389 8941
ASHP electricalenergy (kW h)
2340 3865 3756
ASHP cycles e 3330 1775 2288CO2 (kg) 1133 1892 1837ASHP running
cost (£ GBP)306 407 395
Please cite this article in press as: N.J. Kelly, et al., Performance assessmendwelling featuring phase change-enhanced buffering, Applij.applthermaleng.2013.12.019
dwelling to dwelling according to the distributions shown inTable 6.
In the buffered, load-shifting case, the heat pump operationwasconstrained; the heat pump could operate only within the low-costelectricity periods defined by Economy 10. However, the demandfor heat was still subject to diversity. Heat was supplied for spaceheating and hot water from the buffer tank via a circulating pump:the operating times for this pump were randomly varied betweensimulations, using the same distributions used for the uncon-strained heat pump shown in Table 6.
Fig. 11 shows the net dwelling real power demands with andwithout heat pump load shifting over a typical 24-h period duringthe simulated week.
The plot of the aggregate real electrical demand for the 50dwellings, when not subject to load shifting, shows distinctmorning and evening peaks when the heat pumps are in operation.However, the operation of the heat pumps (like the demand forheat) was spread over several hours during both morning andevening.
Shifting the operation of all of the heat pumps to off-peak pe-riods, as defined by the Economy 10 tariff resulted in new andsignificantly increased peak demands during the constrainedoperating periods; particularly in the short, off-peak periods of13.00 he16.00 h and 20.00 he22.00 h, which show limited loaddiversity. The lack of diversity is due to the short duration of theseperiods: in both, the majority of the heat pumps modelled need tooperate in order to replenish the buffer tank depleted by morningand early evening heat demands. Therefore, an unintentionalconsequence is that these brief, off-peak periods act to synchronisethe population of heat pumps such that the aggregate demand ofthe dwellings rises to 230 kW, compared to approximately 150 kWwhen the operation of the population of heat pumps was notconstrained by the load shifting tariff. The same figure shows that ifthe percentage of heat pumps subjected to the Economy 10 tariff isreduced the peak demand also reduces.
The tendency of load management to reduce load diversity andproduce “undesirable effects” was highlighted by Strbac [47] andsimilar increases in peak loading were observed by Moreau [10],who examined load shifting of electrical water-heating loads. Theresults presented here serve as a warning that whilst instrumentssuch as the Economy 10 tariff investigated in this study maybeneficial to high-level grid operation, they are not necessarilybeneficial to the operation of the local electrical network or to in-dividual users.
5. Conclusions
To study the ability of phase change material (PCM)-enhancedthermal storage to facilitate effective heat pump load shifting, a
t of tariff-based air source heat pump load shifting in a UK detacheded Thermal Engineering (2013), http://dx.doi.org/10.1016/
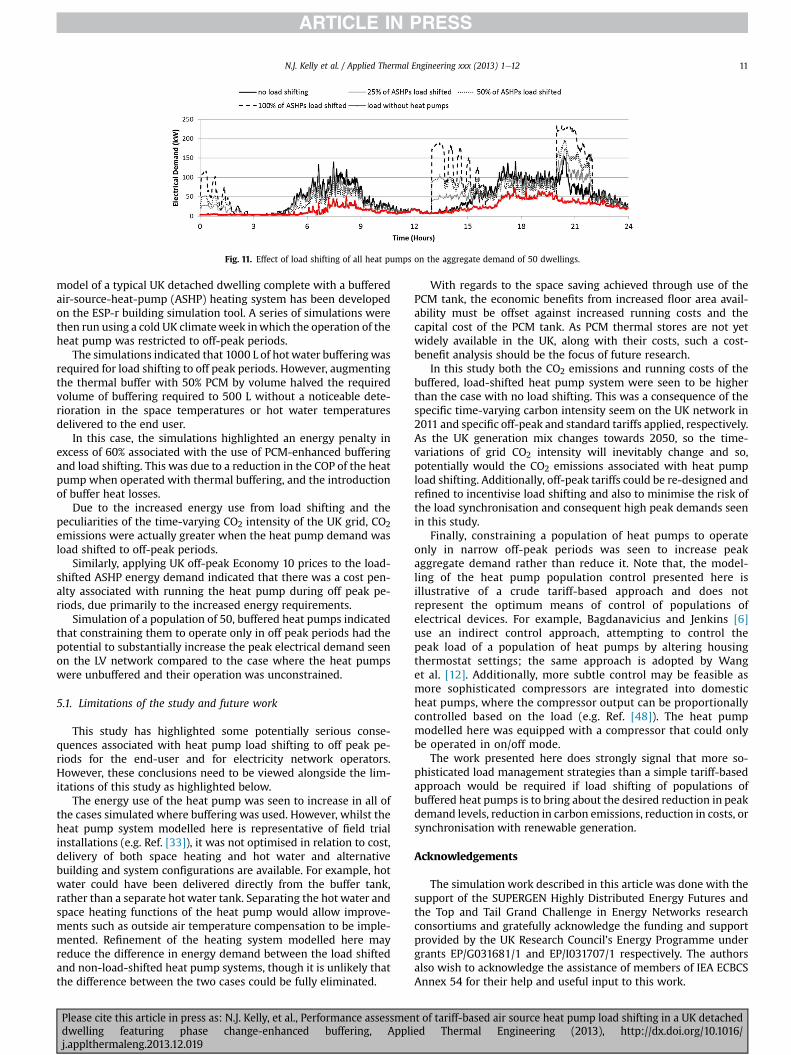
Fig. 11. Effect of load shifting of all heat pumps on the aggregate demand of 50 dwellings.
N.J. Kelly et al. / Applied Thermal Engineering xxx (2013) 1e12 11
model of a typical UK detached dwelling complete with a bufferedair-source-heat-pump (ASHP) heating system has been developedon the ESP-r building simulation tool. A series of simulations werethen run using a cold UK climateweek inwhich the operation of theheat pump was restricted to off-peak periods.
The simulations indicated that 1000 L of hotwater buffering wasrequired for load shifting to off peak periods. However, augmentingthe thermal buffer with 50% PCM by volume halved the requiredvolume of buffering required to 500 L without a noticeable dete-rioration in the space temperatures or hot water temperaturesdelivered to the end user.
In this case, the simulations highlighted an energy penalty inexcess of 60% associated with the use of PCM-enhanced bufferingand load shifting. This was due to a reduction in the COP of the heatpump when operated with thermal buffering, and the introductionof buffer heat losses.
Due to the increased energy use from load shifting and thepeculiarities of the time-varying CO2 intensity of the UK grid, CO2emissions were actually greater when the heat pump demand wasload shifted to off-peak periods.
Similarly, applying UK off-peak Economy 10 prices to the load-shifted ASHP energy demand indicated that there was a cost pen-alty associated with running the heat pump during off peak pe-riods, due primarily to the increased energy requirements.
Simulation of a population of 50, buffered heat pumps indicatedthat constraining them to operate only in off peak periods had thepotential to substantially increase the peak electrical demand seenon the LV network compared to the case where the heat pumpswere unbuffered and their operation was unconstrained.
5.1. Limitations of the study and future work
This study has highlighted some potentially serious conse-quences associated with heat pump load shifting to off peak pe-riods for the end-user and for electricity network operators.However, these conclusions need to be viewed alongside the lim-itations of this study as highlighted below.
The energy use of the heat pump was seen to increase in all ofthe cases simulated where buffering was used. However, whilst theheat pump system modelled here is representative of field trialinstallations (e.g. Ref. [33]), it was not optimised in relation to cost,delivery of both space heating and hot water and alternativebuilding and system configurations are available. For example, hotwater could have been delivered directly from the buffer tank,rather than a separate hot water tank. Separating the hot water andspace heating functions of the heat pump would allow improve-ments such as outside air temperature compensation to be imple-mented. Refinement of the heating system modelled here mayreduce the difference in energy demand between the load shiftedand non-load-shifted heat pump systems, though it is unlikely thatthe difference between the two cases could be fully eliminated.
Please cite this article in press as: N.J. Kelly, et al., Performance assessmendwelling featuring phase change-enhanced buffering, Applij.applthermaleng.2013.12.019
With regards to the space saving achieved through use of thePCM tank, the economic benefits from increased floor area avail-ability must be offset against increased running costs and thecapital cost of the PCM tank. As PCM thermal stores are not yetwidely available in the UK, along with their costs, such a cost-benefit analysis should be the focus of future research.
In this study both the CO2 emissions and running costs of thebuffered, load-shifted heat pump system were seen to be higherthan the case with no load shifting. This was a consequence of thespecific time-varying carbon intensity seem on the UK network in2011 and specific off-peak and standard tariffs applied, respectively.As the UK generation mix changes towards 2050, so the time-variations of grid CO2 intensity will inevitably change and so,potentially would the CO2 emissions associated with heat pumpload shifting. Additionally, off-peak tariffs could be re-designed andrefined to incentivise load shifting and also to minimise the risk ofthe load synchronisation and consequent high peak demands seenin this study.
Finally, constraining a population of heat pumps to operateonly in narrow off-peak periods was seen to increase peakaggregate demand rather than reduce it. Note that, the model-ling of the heat pump population control presented here isillustrative of a crude tariff-based approach and does notrepresent the optimum means of control of populations ofelectrical devices. For example, Bagdanavicius and Jenkins [6]use an indirect control approach, attempting to control thepeak load of a population of heat pumps by altering housingthermostat settings; the same approach is adopted by Wanget al. [12]. Additionally, more subtle control may be feasible asmore sophisticated compressors are integrated into domesticheat pumps, where the compressor output can be proportionallycontrolled based on the load (e.g. Ref. [48]). The heat pumpmodelled here was equipped with a compressor that could onlybe operated in on/off mode.
The work presented here does strongly signal that more so-phisticated load management strategies than a simple tariff-basedapproach would be required if load shifting of populations ofbuffered heat pumps is to bring about the desired reduction in peakdemand levels, reduction in carbon emissions, reduction in costs, orsynchronisation with renewable generation.
Acknowledgements
The simulation work described in this article was done with thesupport of the SUPERGEN Highly Distributed Energy Futures andthe Top and Tail Grand Challenge in Energy Networks researchconsortiums and gratefully acknowledge the funding and supportprovided by the UK Research Council’s Energy Programme undergrants EP/G031681/1 and EP/I031707/1 respectively. The authorsalso wish to acknowledge the assistance of members of IEA ECBCSAnnex 54 for their help and useful input to this work.
t of tariff-based air source heat pump load shifting in a UK detacheded Thermal Engineering (2013), http://dx.doi.org/10.1016/
N.J. Kelly et al. / Applied Thermal Engineering xxx (2013) 1e1212
References
[1] HM Government, The UK Low Carbon Transition Plan e National Strategy forClimate and, Energy, The Stationary Office, London, 2009, p. 77.
[2] J. Palmer, I. Cooper (Eds.), Great Britain’s Housing Energy Fact File, Departmentfor Energy and Climate Change Publication, 2011. URN 11D/866.
[3] DECC, Department for Energy and Climate Change, Energy Consumption inthe United Kingdom: DECC Factsheet. 2012, 2012. URN 12D/291.
[4] S.R. Allen, G.P. Hammond, M.C. McManus, Prospects for and barriers to do-mestic micro-generation: a United Kingdom perspective, Appl. Energy 85 (6)(2008) 528e544.
[5] N.J. Hewitt, Heat pumps and energy storage e the challenges of imple-mentation, Appl. Energy 89 (2012) 37e44.
[6] A. Bagdanavicius, N. Jenkins, Power requirements of ground source heatpumps in a residential area, Appl. Energy 102 (2013) 591e600.
[7] M. Hinnells, B. Boardman, S. Darby, G. Killip, R. Layberry, Transforming UKHomes: Achieving a 60% Cut in Carbon Emissions by 2050 Proc. EuropeanCouncil for an Energy-Efficient Economy 2007 Panel 5: Energy EfficientBuildings, Available from: http://www.eceee.org/conference_proceedings/eceee/2007/Panel_5/5.356/paper.
[8] L. Lira, N.J. Kelly, Impact of residential energy system sizing and control overheat pump’s system cost and reliability, in: Proc. the 2nd Int. Conf. inMicrogeneration Technologies, University of Strathclyde, Glasgow, April 4e6;2011.
[9] P. Luickx, L. Helsen, W. D’haeseleer, Influence of massive heat-pump intro-duction on the electricity-generation mix and the GHG effect: comparisonbetween Belgium, France, Germany and The Netherlands, Renew. Sustain.Energy Rev. 12 (8) (2008) 2140e2158.
[10] A. Moreau, Control strategy for domestic water heaters during peak periodsand its impact on the demand for electricity, Energy Proc. 12 (2011) 1074e1082.
[11] D. Callaway, Tapping the energy storage potential in electric loads to deliverload following and regulation, with application to wind energy, EnergyConvers. Manag. 50 (9) (2009) 1389e1400.
[12] D. Wang, S. Parkinson, W. Miao, H. Jia, C. Crawford, N. Djilali, Online voltagesecurity assessment considering comfort-constrained demand response con-trol of distributed heat pump systems, Appl. Energy 96 (2012) 104e114.
[13] J. Hong, N.J. Kelly, M. Thomson, I. Richardson, The influence of thermal storageon microgeneration flexibility, in: Proc. the 2nd Int. Conf. in MicrogenerationTechnologies, University of Strathclyde, Glasgow, April 2011, pp. 4e6.
[14] J. Hong, N.J. Kelly, M. Thomson, I. Richardson, Assessing heat pumps as flexibleload, Proc. Inst. Mech. Eng., Part A 227 (1) (2013) 30e42.
[15] A. Arteconi, N.J. Hewitt, F. Polonara, Domestic demand-side management(DSM): role of heat pumps and thermal energy storage (TES) systems, Appl.Therm. Eng. 51 (2013) 155e165.
[16] K. Williams, Space per person in the UK: A review of densities, trends, ex-periences and optimum levels, Land Use Policy. ISSN: 0264-8377 26 (Suppl.)(2009) 83e92.
[17] D. Beyer, N.J. Kelly, Modelling the behaviour of domestic micro-cogenerationunder different operating regimes and with variable thermal buffering, in:Proc. Microgen, National Arts Centre, Ottawa, 2008.
[18] Economy 10, 2012. http://www.electricityprices.org.uk/economy-10(accessed 1.11.12).
[19] J.A. Clarke, Energy Simulation in Building Design, second ed., ButterwortheHeinemann, Oxford, 2001.
[20] P. Strachan, G. Kokogiannakis, I. Macdonald, History and development ofvalidation with the ESP-r simulation Program, Build. Environ. 43 (4) (2008)601e609.
[21] N.J. Kelly, J. Cockroft, Analysis of retrofit air source heat pumps performance:results from detailed simulations and comparison to field trial data, EnergyBuild. 43 (1) (2011) 239e245.
[22] R. Padovan, M. Manzan, Development of a stratified tank storage componentfor ESP-r with embedded phase change material modules, Proc. Inst. Mech.Eng., Part A 227 (1) (2013) 53e61.
[23] J. Cockroft, D. Kennedy, M. O’Hara, A. Samuel, P. Strachan, P. Tuohy, Devel-opment and validation of detailed building, plant and controller modelling to
Please cite this article in press as: N.J. Kelly, et al., Performance assessmendwelling featuring phase change-enhanced buffering, Applij.applthermaleng.2013.12.019
demonstrate interactive behaviour of system components, in: Proc. BuildingSimulation ’09, Glasgow, 2009, pp. 96e103.
[24] J.A. Clarke, C.M. Johnstone, J.M. Kim, P.G. Tuohy, Energy, carbon and costperformance of building stocks: upgrade analysis, energy labelling and na-tional policy development, Adv. Build. Energy Res. 3 (2008). Earthscan:London.
[25] http://www.bre.co.uk/filelibrary/accreditation/scheme_standards/SAP_2009_9-91_Appendix_S_January_2012.pdf (accessed 27.11.13).
[26] BRE, The Government’s Standard Assessment Procedure for Energy Rating ofDwellings, BRE Report, 2009. Available from: http://www.bre.co.uk/filelibrary/SAP/2009/SAP-2009_9-90.pdf (accessed 24.05.13).
[27] D. Johnston, J. Wingfield, M. Bell, Airtightness of Buildings e Towards HigherPerformance, Interim report D1, Centre for the Built Environment, LeedsMetropolitan University, 2004. Available online: www.leedsmet.ac.uk/as/cebe/projects/airtight/airtight_final_report.pdf (accessed 23.05.13).
[28] http://discover.ukdataservice.ac.uk/series/?sn¼2000054 (accessed 26.05.13).[29] M. Dowson, A. Poole, D. Harrison, G. Susman, Domestic UK retrofit challenge:
barriers incentives and current performance leading into the green deal, En-ergy Policy 50 (2012) 294e305.
[30] R. Galvin, M. Sunnika-Blank, Including fuel price elasticity of demand in netpresent value and payback time calculations of thermal retrofits: case study ofGerman dwellings, Energy Build. 50 (2012) 219e228.
[31] U. Jordan, K. Vajen, DHWCALC: program to generate domestic hot waterdraws with statistical means for user defined conditions, in: Proc. ISES SolarWorld Congress, Orlando, US, 2005.
[32] European and Canadian non-HVAC electric and DHW load profiles for use insimulating the performance of residential cogeneration systems, A Report ofSubtask A of FCþCOGEN-SIM The Simulation of Building-Integrated Fuel Celland Other Cogeneration Systems, in: I. Knight, H. Ribberink (Eds.), Annex 42 ofthe International Energy Agency Energy Conservation in Buildings andCommunity Systems Programme, Natural Resources Canada, Ottawa, 2007.
[33] P. Dunbabin, C. Wickins, Detailed analysis from the first phase of the energysaving trust’s heat pump field trial, Department for Energy and ClimateChange (DECC) Report, URN12D/018.
[34] UK Health and Safety Executive, Legionnaires’ Disease. The Control ofLegionella Bacteria in Water Systems: Approved Code of Practice and Guid-ance L8, HSE Publications, 2000.
[35] Energy Saving Trust, Solar Water Heating Systems e Guidance for Pro-fessionals, Conventional Indirect Models, Guide CE131, EST Publication, 2006.
[36] PCM Products, 2012, http://www.pcmproducts.net/Phase_Change_Material_Products.htm (accessed 30.10.12).
[37] National Grid, 2012, http://www.nationalgrid.com/uk/Electricity/Data/DemandþData/Jan-July (accessed 22.11.12).
[38] P.O. Fanger, Thermal Comfort, McGraw-Hill, New York, 1970.[39] J.C. Lawrence, J.P. Bull, Thermal conditions which cause skin burns, Eng. Med.
5 (5) (1976) 61e63.[40] A.D. Hawkes, Estimating marginal CO2 emissions rates for national electricity
systems, Energy Policy 38 (2010) 5977e5987.[41] Elexon, 2012, www.elexon.co.uk (accessed 10.12.12).[42] M. Thomson, D. Infield, Impact of widespread photovoltaics generation on
distribution systems, J. Renew. Power Gen. 1 (1) (2007) 33e40.[43] I. Richardson, M. Thompson, D. Infield, C. Clifford, Domestic electricity use: a
high-resolution energy demand model, Energy Build. 42 (10) (2010) 1878e1887.
[44] M. Shipworth, S.K. Firth, M.I. Gentry, A.J. Wright, D.T. Shipworth, K.J. Lomas,Central heating thermostat settings and timing: building demographics, Build.Res. Inf. 38 (1) (2010) 50e69.
[45] L.D. Shorrock, A Guide to the Development of BREDEM, Building ResearchEstablishment Publication, 1995.
[46] ONS, Office for National Statistics, Families and Households, 2012. http://www.ons.gov.uk/ons/dcp171778_284823.pdf (accessed 01.02.13).
[47] G. Strbac, Demand side management: benefits and challenges, Energy Policy36 (2008) 4419e4426.
[48] C.K. Lee, Dynamic performance of ground-source heat pumps fitted withfrequency inverters for part-load control, Appl. Energy 87 (2010) 3507e3513.
t of tariff-based air source heat pump load shifting in a UK detacheded Thermal Engineering (2013), http://dx.doi.org/10.1016/