performance assessment of an optimal load control ...plaza.ufl.edu/brooks666/dgp_naps.pdfperformance...
TRANSCRIPT
Performance assessment of an optimal load controlalgorithm for providing contingency service
Jonathan Brooks∗, Rodrigo D. Trevizan†, Prabir Barooah∗, and Arturo S. Bretas†∗Department of Mechanical and Aerospace Engineering
University of Florida, Gainesville, Florida†Department of Electrical and Computer Engineering
University of Florida, Gainesville, Florida
Abstract—In prior work, the Distributed Gradient Projection(DGP) algorithm was proposed to allow loads or load aggregatorsto provide contingency service to the grid using local frequencymeasurements. The DGP algorithm was shown to perform wellin linear simulations. The goal of this work is to evaluate theperformance of the DGP algorithm in more realistic scenariosand its robustness to issues of practical implementation, such astime delay, model mismatch, measurement noise, and stochasticdisturbance. Simulation results from the IEEE 39-bus systemindicate that the DGP algorithm performs well in mitigating theeffects of contingencies and that it is robust to issues of practicalimplementation.
I. INTRODUCTION
An important class of ancillary services required to maintainstability of the power grid is contingency services, which refersto actions taken to correct demand-supply imbalance after acontingency event such as a generator or transmission linetrip [1]. Typically, generators are tasked with providing thisservice. An alternative that has drawn increasing attention isthe use of smart loads as contingency reserves.
One question that arises in the control of smart loads forproviding grid support is how to apportion the control effort(i.e., change in demand) among various loads in a fair manner.If the loads are of the same type, consumers’ quality ofservice (QoS) can be maintained by ensuring that some signalthat measures QoS stays within predetermined bounds. Forinstance, if the loads are air conditioners, then as long asindoor temperature variation of each unit is within a smallpredetermined band, the question of appropriate distributionof control effort among the loads can be avoided. However,when loads are heterogenous, such a uniform measure of QoSmay be lacking. In fact, it is envisioned that in the futuregrid, aggregators will play the role of a middleman betweenthe grid operators and consumers [2]–[4]. An aggregator mayhave a large number of heterogenous loads within its servicesector, such as multiple commercial-building HVAC systems,many residential water heaters and pool pumps, etc. Moreover,the capacity of each aggregator may be not only different,but itself elastic—with more capacity available at a higher“cost”—rather than a fixed inflexible capacity that is knownahead of time. In such a scenario, it is more appropriate todistribute the effort among the aggregators by minimizing thetotal cost involved in executing the control action. Since thiscost may not be strictly monetary but may vary depending on
the type of consumers involved and their perception of serviceobtained etc. we refer to this cost as a disutility. The disutilityis assumed to be a function of the demand variation from thenominal demand.
In our prior work [5], the Distributed Gradient Projection(DGP) algorithm was proposed to compute control actions fora group of agents (loads or load aggregators) with flexibledemand by solving an optimization problem: minimize totaldisutility among all the agents subject to the constraint thatthe total demand-supply imbalance is made 0. The changein demand to meet the constraint provides the contingencyservice, while the minimization is meant to provide an op-timal distribution of effort among heterogenous agents. Thealgorithm is distributed: agents use locally obtained frequencymeasurements and inter-agent communication to compute theircontrol actions. Finally, the algorithm preserves privacy: onlygradient information is sent to other loads—not demand ordisutility. Simulations indicated the algorithm is successful inmitigating frequency deviations following a contingency, andit was also proven that the distributed decisions computedby the algorithm converge to the central optima. Both thesimulation-based evaluations and the theoretical results in [6]were obtained under a number of simplifying assumptions.
In this paper, (1) we assess the performance of the DGPalgorithm under more realistic situations (than what was donein [6]), and (2) we examine the robustness of the DGPalgorithm to various uncertainties and errors that are inevitablewhen deployed in practice. We do this by testing the algorithmon the IEEE 39-bus test system under a variety of conditions,such as effects of measurement noise, communication delay,and distributed renewable generation. Of particular interest isthe DGP algorithm’s robustness to model mismatch. In theDGP algorithm, each agent requires a model of the grid to inferpower imbalance, and that model may contain large errors. Toassess the DGP algorithm’s robustness to those errors, loadsare given a linear model of the 39-bus system, and we examinethe DGP algorithm’s performance when a generator is discon-nected from the system. This generator disconnection rendersthe model used by the loads as outdated and inaccurate, andsimulation results indicate the DGP algorithm is robust to suchmodel mismatch.
In principle, each agent in the DGP algorithm can be aconsumer load. However, in this paper we assume that the
agents are aggregators, which are more suitable for providingcontingency services in deregulated electricity markets sinceindividual consumers are not well suited to take part in suchmarkets [7]. Additionally, we assume the aggregators act onthe transmission level directly. The balancing authority has amodel of the transmission grid, which may then be suppliedto the aggregators for use in the DGP algorithm. We donot consider the problem of computing actions for individualconsumers within the aggregator (given the command to theaggregator). Methods such as those proposed in [4] can beused for making such decisions.
A. Literature review
The DGP algorithm was inspired by the work in [8], whichalso proposed a distributed algorithm to solve the same opti-mization problem: minimize total disutility subject to demand-supply being balanced. The key difference between the DGPalgorithm and that in [8] (which we call the “dual” algorithmbecause it solves the dual problem) is that the dual algo-rithm is only applicable to strictly convex disutility functions,whereas the DGP algorithm is applicable to convex—but notnecessarily strictly convex—disutility functions, i.e., disutilityfunctions with affine regions. Not-strictly convex disutility isa more realistic model of consumers’ disutility in responseto demand variation because there may be no disutility forsome small demand variation around the nominal demand buta positive disutility for variations higher than a threshold value,and such a model of consumer disutility is not strictly convex.For instance, it was shown in [9] that a small variation in fanpower consumption of a commercial HVAC system led to noperceptible change in indoor climate, but a larger change indemand (from both the fan and the chiller) led to a 2 deg-Fdeviation from the set point. A strictly convex disutility cannotcapture such a phenomenon because every demand variation—no matter how small—will have a nonzero cost.
A decentralized algorithm for controlling smart loads to pro-vide contingency reserves was proposed in [10], and no gridmodel or communication is required; we call this algorithm theOptimal Load Control (OLC) algorithm. It was shown in [11]that the OLC algorithm performs well in the IEEE 39-bussystem for small contingencies. However, the OLC algorithmalso requires disutility functions that are strictly convex withrespect to demand variation. Moreover, the analysis in [10] wasdeterministic, and it was shown in [12] that the OLC algorithmis vulnerable to mean-square instability in the presence ofstochastic disturbance.
A core tenant of the DGP algorithm and those proposedin [8], [10] is that local frequency measurements provideglobal information about the state of the grid. The abil-ity of loads to use local frequency measurements to inferglobal information was observed in [13], and frequency-baseddemand-side ancillary service has been a vibrant subject in theliterature [14]–[17]. However, the approaches in these worksonly consider loads of the same type (e.g., smart refrigerators)and are not optimized to minimize disutility for heterogenousloads.
Another popular mechanism in the literature for loads toprovide demand-side ancillary service is the use of price sig-nals [18]–[20]. However, because contingencies are unplannedand must be mitigated in seconds (e.g., a generator trip), pricesignals will not be fast enough to provide on-line contingencyservice considered in this paper. Additionally, price signals arein units of price per energy, but change in demand is likelynonlinear—resulting in different prices for different changesin demand.
Another possible practice is the use of control signalsdistributed to loads by a central balancing authority [4],[9], [20]–[25]. However, centralized approaches either do notconsider the disutility to consumers, or the central authoritywill require all problem data—including sensitive informationsuch as demand and disutility—violating user privacy.
This paper is organized as follows. In Section II, wesummarize the DGP algorithm. The use and identification ofthe grid model are described in Section II-C. In Section III,results of numerical studies are presented. Finally, Section IVpresents conclusions of this work.
II. SUMMARY OF THE DGP ALGORITHM
A. Problem Formulation
There are n loads (aggregators) in the power grid. Each loadi may change its consumption by
xi ∈ Ωi = [xi, xi].
There is a disutility function, fi(xi), associated with loadi’s change in consumption. The generation in the grid isdenoted as g, and the global difference between generationand consumption is denoted as u = g − 1Tx, where x isthe vector of xi. It is the objective of the loads to changetheir consumption from their nominal values to obtain whileminimizing their total collective disutility. Formally, the loadsare to solve the following optimization problem:
minxi, i=1,...,n
n∑i=1
fi(xi), s.t.n∑i=1
xi = g, xi ∈ Ωi.
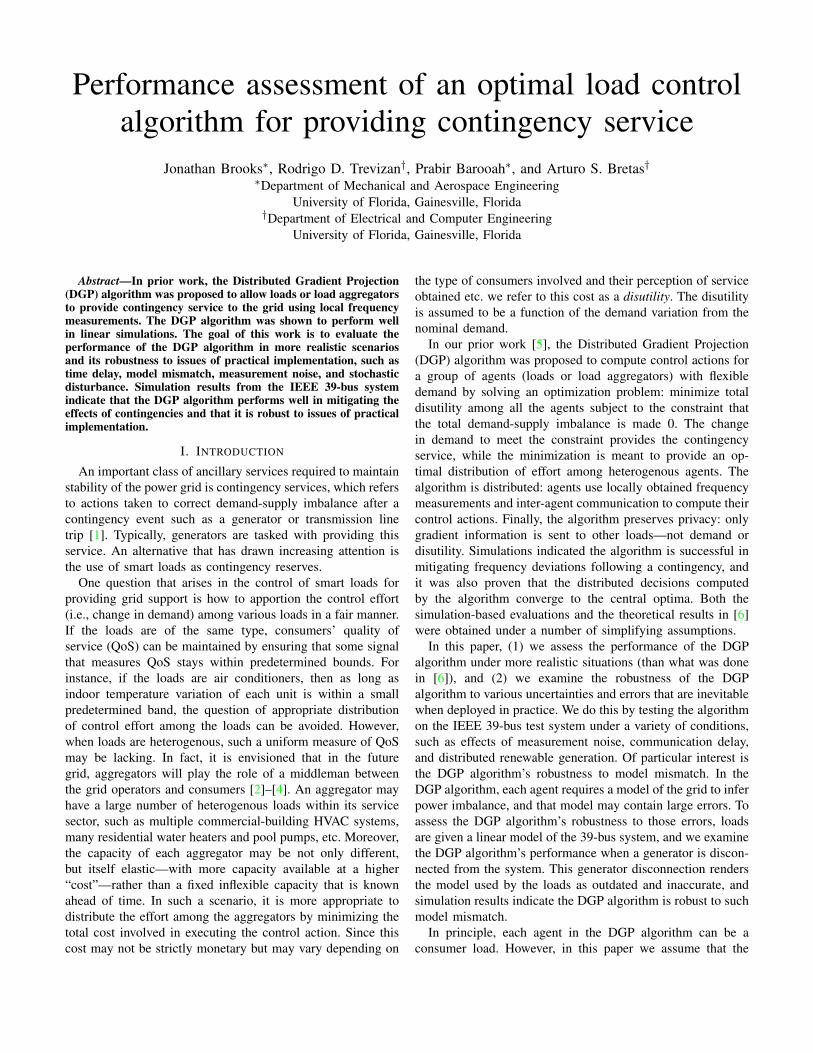
Each load i can obtain local noisy frequency measurements,∆ωi. Additionally, there exists a communication networkamong the loads, whose graph is denoted G = (V, E), wherethe node set, V = 1, 2, . . . , n, is the set of loads and the edgeset, E ⊆ V × V , denotes the pairs of loads that can exchangeinformation. The set of loads with whom load i can exchangeinformation is denoted Ni = j|(i, j) ∈ E. This architectureis illustrated in Fig. 1.
B. The DGP Algorithm
The update law of the DGP algorithm consists of three mainparts: i) a generation-matching step, ii) a gradient-descent step,and iii) a projection step. For the generation-matching step,each load uses its local frequency measurements and a modelof the grid to infer and reduce the global power imbalance(see Section II-C); the power imbalance inferred by load i is
Aggregator Aggregator
Load
Bus i
Load
Bus j
Bus k
Generator
Residential
load
Commercial
loads
Commercial
load
Industrial
loads
Communication
Generator
Bus k
Load
Bus i
Load
Bus j
Load
Bus
Generator
Bus
Load
Bus
Load
Bus
Load
Bus
Fig. 1. Schema of DGP-algorithm architecture.
denoted ui[k]. The gradient-descent step utilizes load-to-loadcommunication to equalize the loads’ gradients. Finally, theprojection step limits each load i’s consumption change to itsfeasible range, .
The update law of the DGP algorithm for load i at time kis summarized in the following [5].DGP Algorithm:
1) Obtain ui[k] from the measurement ∆ωi[k] using astate estimator, which is described in Section II-C. Thegeneration-matching step is then γ[k]ui[k], where γ[k]is a step size.
2) Compute gradient ddxi
fi(xi[k]), transmit gradient valueto neighbors, and receive neighbors’ gradient values.Compute the gradient descent step ∆xi[k] as the ith
entry of ∆x[k], where
∆xk , −L∇f(xk)T ,
where L is the Laplacian matrix of the communicationgraph G [26].
3) Compute xi[k + 1] = PΩi
[xi[k] + cγ[k]∆xi[k] +
γ[k]ui[k]], where PΩi
[·] denotes the standard projectionoperator, γ[k] is a step size, and c is a positive constant.
C. Estimating Global Power ImbalanceEach load uses its local frequency measurements and a
linear, time-invariant (LTI) model of the grid to infer the global
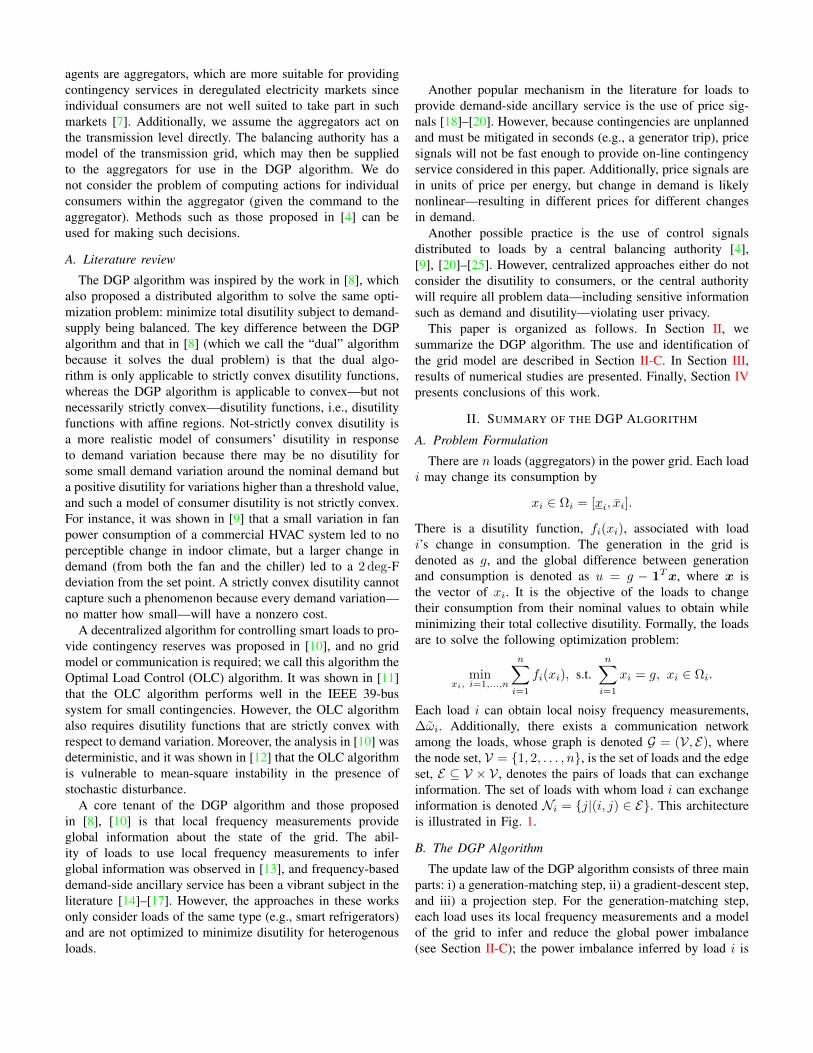
power imbalance using an algorithm proposed in [27], whichestimates an unknown input from output measurements. Thisestimation is achieved by effectively “back-solving” the state-space equations for the input. In this application, the inputto the model is power imbalance, and the output is powerfrequency. (For more details on the estimation algorithm, in-terested readers are referred to [8].) Therefore, each aggregatorrequires a discrete-time LTI model of the grid with powerimbalance as the input and frequency deviation as the output.In practice, the balancing authority has a detailed model ofthe transmission grid, from which they can extract simplifiedmodels. These models in turn can be provided to aggregators.
For this work, each load needs a discrete-time LTI modelof the IEEE 39-bus system. We use the least-squares identifi-cation method [28], in which unknown, discrete-time transfer-function parameters are estimated using input-output datafrom the 39-bus system. A pseudorandom-binary-sequencedisturbance was applied to the 39-bus system, and a second-order transfer function was identified relating power imbalanceto the mean frequency of the generators. Fig. 2 shows thestep response of the identified model and the 39-bus system.This implementation of the 39-bus test system had the multi-band Power System Stabilizer (PSS) activated for systemstabilization as implemented in [29]. It can be seen that theidentified model is highly inaccurate due to the complexity ofthe 39-bus system and the simplicity of a second-order linearmodel.
0 20 40 60 80 100 120 140−6
−4
−2
0
2
4
6x 10
−3
Time (seconds)
Fre
quen
cy d
evia
tion
(Hz)
Identified modelIEEE 39−bus system
Fig. 2. Step response of identified LTI model and IEEE 39-bus system.
III. RESULTS OF NUMERICAL STUDIES
A. Simulation Setup
The DGP algorithm was tested in the IEEE 39-bus testsystem, implemented in SimPowerSystems [29]. This systemhas 10 synchronous machines, each one of them with governorcontrol and PSS. The test system has 19 loads, and each load
can modulate its consumption by ±5%; that is, if the nominalconsumption of load i is xoi , then Ωi = [−0.05xoi , 0.05xoi ].
We test the performance of the DGP algorithm with aconvex (but not strictly convex) function:
fi(xi) =
0, |xi| < ai1βi
(xi − ai)2, xi ≥ ai1βi
(xi + ai)2, xi ≤ −ai
(1)
where ai = 0.05xi and βi is chosen from a uniform distribu-tion on [0.1, 0.3] for each i. There is a communication delayfor each load, i.e., each load only has access to past valuesof its neighbors’ gradients. For frequency measurements, eachload has access to the speed (frequency) of the closest gen-erator, and those measurements are corrupted by zero-meanGaussian noise with a standard deviation of 0.01% of thevalue of synchronous frequency (60 Hz), unless otherwisenoted. The loads use the model identified in Section II-C toestimate power imbalance using the frequency measurements.It is considered that the consumption of loads vary over time.This fluctuation is modeled as Gaussian additive noise inpower consumption of each load with zero-mean and standarddeviation equal to 0.01% of the power of the load (except forCase study 5). The gains used in the DGP algorithm are c = 5and γ[k] = 0.06/(19 maxiβi) for all k.
We conduct multiple case studies to assess: i) effect ofmodel mismatch, ii) effect of communication delay, iii) effectof communication topology, iv) effect of measurement noise,and v) effect of uncertain, uncontrollable renewables. Whenone parameter is varied to study its effect, others are heldconstant at their nominal values. The nominal values forcommunication delay and measurement-noise standard devi-ation are 100 ms and 0.01%. The nominal edge set for thecommunication graph is E = (i, j)||i− j| = 1.
B. Case 1: Model Mismatch and Communication Delay
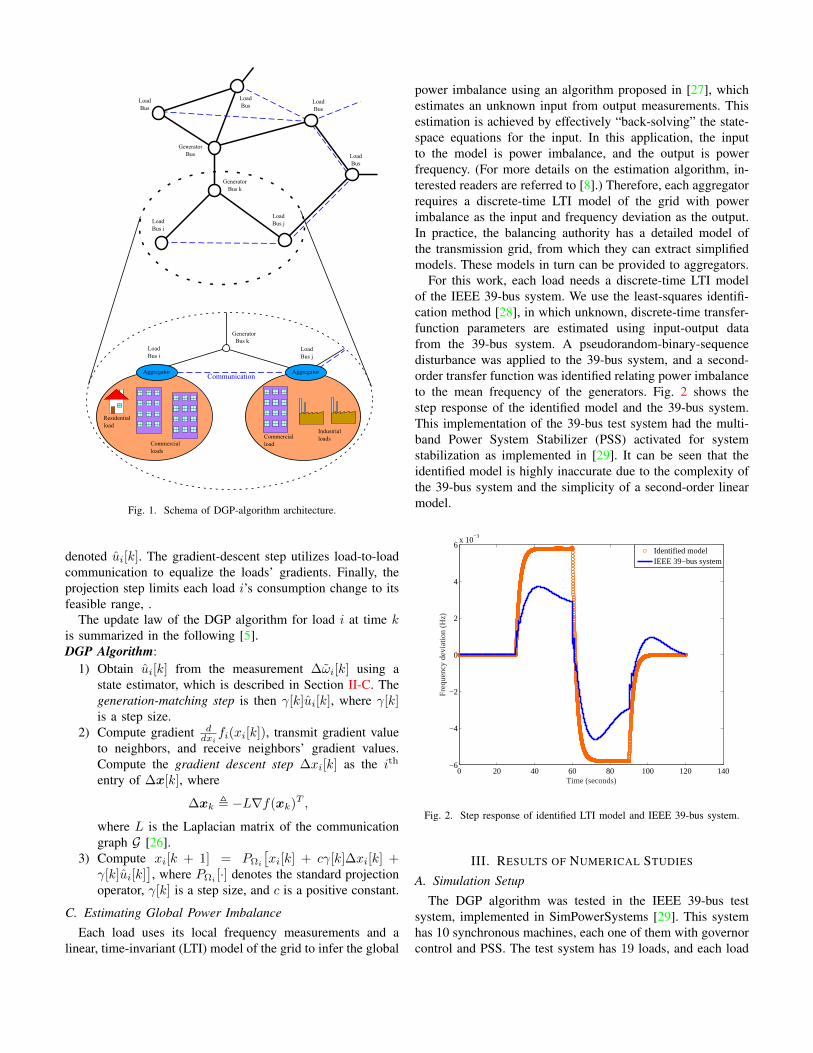
To evaluate model mismatch, we disconnect generator 5(508 MW) from the system at 5 seconds; generator 5 accountsfor nearly 10% of the total generation in the system.
For communication delay, we use three different valuesfor each scenario: no delay, 100 ms, and 1 second of com-munication latency between adjacent nodes. Fig. 3 showsthe results of generator 5 being disconnected from the grid.Results for nominal operation (without smart loads) are shownfor comparison. The frequency (speed deviation) shown is themean deviation of all 10 generators from 60 Hz. Although theDGP algorithm only marginally aids in the voltage recoveryat bus 20, the frequency deviation caused by the generator’sdisconnection is halved compared to the scenario withoutdemand response. The DGP algorithm achieves this whileusing the original model identified in Section II-C, which isno longer accurate due to changes caused by the generatordisconnection. In this case, the performance of the method isonly marginally affected by the time delay in communications.The loss of a generator creates a much larger frequencydeviation than the load increase in the following case studies.
Therefore, the response of the DGP algorithm is dominatedby the generation-matching term, which is not affected bycommunication delay.
0 5 10 15 20 25 30 35 40-0.2
-0.15
-0.1
-0.05
0
0.05
Spee
d de
viat
ion
[Hz]
DGP w/o delayDGP delay 100msDGP delay 1sW/o Smart loads
0 5 10 15 20 25 30 35 400
1
2
3
4
DG
P C
ost i
ncre
ase
DGP w/o delayDGP delay 100msDGP delay 1s
0 5 10 15 20 25 30 35 40Time [s]
0.8
0.85
0.9
0.95
1B
us 2
0 V
olta
ge [
p.u.
]
DGP w/o delayDGP delay 100msDGP delay 1sW/o Smart loads
Fig. 3. Effects of model mismatch and communication delay: generator-5disconnection.
C. Case 2: Load Increase and Communication Delay
Fig. 4 shows the results of a load disturbance appliedto bus 27. Again, results without smart loads are shownfor comparison. The DGP algorithm successfully arrests fre-quency deviations from the disturbance. In addition, the DGPalgorithm halves the voltage drop at bus 27 caused by thedisturbance compared to the scenario without demand re-sponse, and the voltage recovers more quickly under the DGPalgorithm than nominal operation. These results are despitethe inaccuracies in the identified model that the loads use toestimate the disturbance (see Fig. 2). Additionally, we cannotice that a larger time delay in communications tends toworsen the response time of the DGP algorithm. In particular,the longer delay results in a longer time for the disutilityto reach steady state. This is because the delay affects thegradient-descent step in the algorithm, which corresponds tominimizing disutility.
0 10 20 30 40 50 60 70-0.06
-0.04
-0.02
0
0.02
Spee
d de
viat
ion
[Hz]
DGP w/o delayDGP delay 100msDGP delay 1sW/o Smart loads
0 10 20 30 40 50 60 70-1
0
1
2
Loa
d in
crea
se [
W]
×108
0 10 20 30 40 50 60 700.98
0.99
1
1.01
Bus
27
Vol
tage
[p.
u]
DGP w/o delayDGP delay 100msDGP delay 1sW/o Smart loads
0 10 20 30 40 50 60 70Time [s]
0
0.5
1
1.5
DR
Cos
t inc
reas
e
DGP w/o delayDGP delay 100msDGP delay 1s
Fig. 4. Effect of communication delay: 150-MW load disturbance at bus 27.
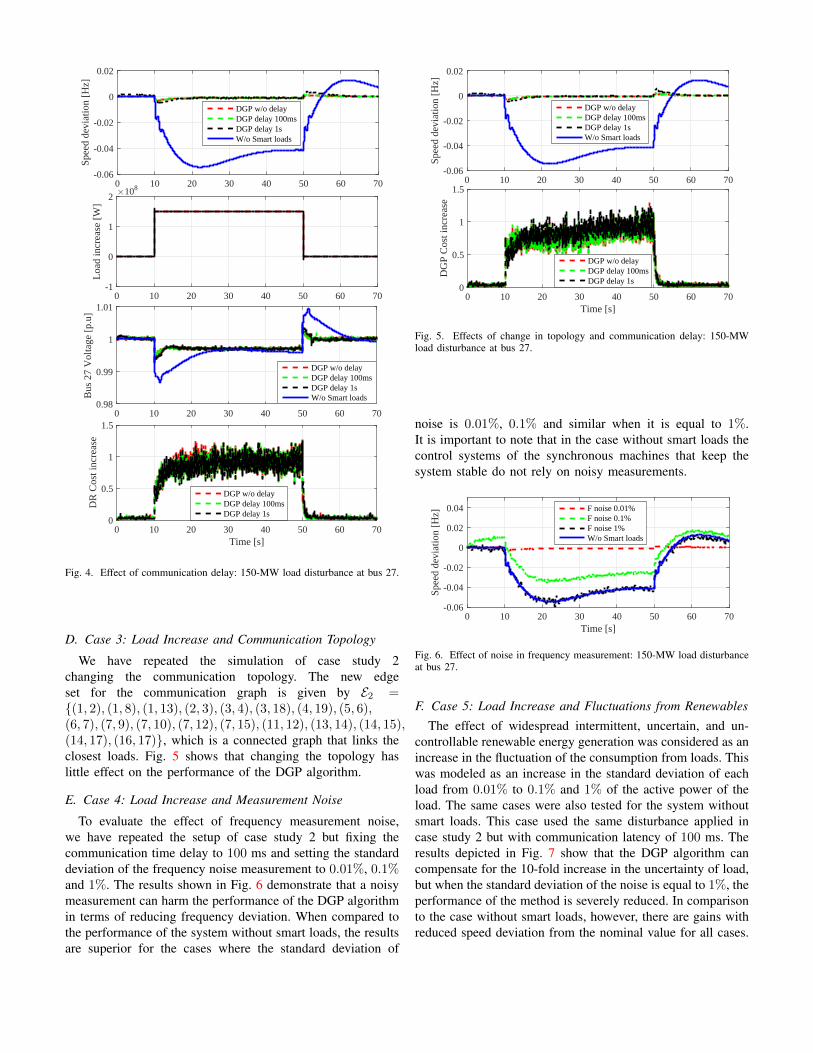
D. Case 3: Load Increase and Communication Topology
We have repeated the simulation of case study 2changing the communication topology. The new edgeset for the communication graph is given by E2 =(1, 2), (1, 8), (1, 13), (2, 3), (3, 4), (3, 18), (4, 19), (5, 6),(6, 7), (7, 9), (7, 10), (7, 12), (7, 15), (11, 12), (13, 14), (14, 15),(14, 17), (16, 17), which is a connected graph that links theclosest loads. Fig. 5 shows that changing the topology haslittle effect on the performance of the DGP algorithm.
E. Case 4: Load Increase and Measurement Noise
To evaluate the effect of frequency measurement noise,we have repeated the setup of case study 2 but fixing thecommunication time delay to 100 ms and setting the standarddeviation of the frequency noise measurement to 0.01%, 0.1%and 1%. The results shown in Fig. 6 demonstrate that a noisymeasurement can harm the performance of the DGP algorithmin terms of reducing frequency deviation. When compared tothe performance of the system without smart loads, the resultsare superior for the cases where the standard deviation of
0 10 20 30 40 50 60 70-0.06
-0.04
-0.02
0
0.02
Spee
d de
viat
ion
[Hz]
DGP w/o delayDGP delay 100msDGP delay 1sW/o Smart loads
0 10 20 30 40 50 60 70Time [s]
0
0.5
1
1.5
DG
P C
ost i
ncre
ase
DGP w/o delayDGP delay 100msDGP delay 1s
Fig. 5. Effects of change in topology and communication delay: 150-MWload disturbance at bus 27.
noise is 0.01%, 0.1% and similar when it is equal to 1%.It is important to note that in the case without smart loads thecontrol systems of the synchronous machines that keep thesystem stable do not rely on noisy measurements.
0 10 20 30 40 50 60 70Time [s]
-0.06
-0.04
-0.02
0
0.02
0.04
Spee
d de
viat
ion
[Hz]
F noise 0.01%F noise 0.1%F noise 1%W/o Smart loads
Fig. 6. Effect of noise in frequency measurement: 150-MW load disturbanceat bus 27.
F. Case 5: Load Increase and Fluctuations from RenewablesThe effect of widespread intermittent, uncertain, and un-
controllable renewable energy generation was considered as anincrease in the fluctuation of the consumption from loads. Thiswas modeled as an increase in the standard deviation of eachload from 0.01% to 0.1% and 1% of the active power of theload. The same cases were also tested for the system withoutsmart loads. This case used the same disturbance applied incase study 2 but with communication latency of 100 ms. Theresults depicted in Fig. 7 show that the DGP algorithm cancompensate for the 10-fold increase in the uncertainty of load,but when the standard deviation of the noise is equal to 1%, theperformance of the method is severely reduced. In comparisonto the case without smart loads, however, there are gains withreduced speed deviation from the nominal value for all cases.

0 10 20 30 40 50 60 70-0.015
-0.01
-0.005
0
0.005
0.01
Spee
d de
viat
ion
[Hz] DGP w Ren. noise 0.01%
DGP w Ren. noise 0.1%DGP w Ren. noise 1%
0 10 20 30 40 50 60 700
1
2
3
4
DG
P C
ost i
ncre
ase
DGP w Ren. noise 0.01%DGP w Ren. noise 0.1%DGP w Ren. noise 1%
0 10 20 30 40 50 60 70Time [s]
-0.1
0
0.1
0.2
Spee
d de
viat
ion
[Hz]
W/o DGP Ren. noise 0.01%W/o DGP Ren. noise 0.1%W/o DGP Ren. noise 1%
Fig. 7. Effect of fluctuations from renewable generation: 150-MW loaddisturbance at bus 27.
IV. CONCLUSION
The DGP algorithm proposed in [5] was designed for loadsto provide contingency service in the power grid. The focusof this work was to evaluate the performance of the DGPalgorithm in more-realistic scenarios than were consideredin [5]. In the scenarios examined, the DGP algorithm was ableto successfully arrest frequency deviations that result from adisturbance applied to the grid. The DGP algorithm requireseach load to have a model of the grid, but numerical resultssuggest the DGP algorithm performs well even when the loads’model is inaccurate. It is the subject of future work to analyzeother scenarios (e.g., change in topology of the power grid ora sensor with faulty measurements).
ACKNOWLEDGMENT
This work was supported by NSF grant CPS-1646229.
REFERENCES
[1] B. Kirby, “Ancillary services: Technical and commercial insights,” 2007,prepared for Wartsila North America Inc.
[2] F. Baccino, F. Conte, S. Massucco, F. Silvestro, and S. Grillo, “Fre-quency regulation by management of building cooling systems throughmodel predictive control,” in 18th Power Systems Computation Confer-ence, 2014.
[3] E. Vrettos, F. Oldewurtel, and G. Andersson, “Robust energy-constrainedfrequency reserves from aggregations of commercial buildings,” IEEETransactions on Power Systems.
[4] B. Biegel, L. Hansen, P. Andersen, and J. Stoustrup, “Primary controlby ON/OFF demand-side devices,” IEEE Trans. on Smart Grid, vol. 4,pp. 2061–2071, Dec 2013.
[5] J. Brooks and P. Barooah, “Consumer-aware load control to providecontingency reserves using frequency measurements and inter-load com-munication,” in American Control Conference, July 2016, pp. 5008 –5013.
[6] ——, “Distributed demand-side contingency-service provisioning whileminimizing consumer disutility through local frequency measurementsand inter-load communication,” arXiv preprint arXiv:1704.04586, 2017.
[7] G. Barbose, C. Goldman, and B. Neenan, “A survey of utility experiencewith real time pricing,” Lawrence Berkeley National Laboratory, 2004.
[8] C. Zhao, U. Topcu, and S. H. Low, “Optimal load control via frequencymeasurement and neighborhood area communication,” Power Systems,IEEE Transactions on, pp. 3576–3587, 2013.
[9] Y. Lin, P. Barooah, S. Meyn, and T. Middelkoop, “Experimental evalua-tion of frequency regulation from commercial building HVAC systems,”IEEE Transactions on Smart Grid, vol. 6, pp. 776 – 783, 2015.
[10] C. Zhao, U. Topcu, N. Li, and S. Low, “Design and stability of load-side primary frequency control in power systems,” IEEE Transactionson Automatic Control, vol. 59, no. 5, pp. 1177–1189, 2014.
[11] I. Kamwa and A. Delavari, “Simulation-based investigation of optimaldemand-side primary frequency regulation,” in Electrical and ComputerEngineering (CCECE), 2016 IEEE Canadian Conference on. IEEE,2016, pp. 1–6.
[12] S. Pushpak and U. Vaidya, “Fragility of decentralized load-side frequency control in stochastic environment,” arXiv preprintarXiv:1702.03477, 2017.
[13] F. Schweppe, R. Tabors, J. Kirtley, H. Outhred, F. Pickel, and A. Cox,“Homeostatic utility control,” IEEE Transactions on Power Apparatusand Systems, vol. PAS-99, no. 3, pp. 1151 –1163, may 1980.
[14] J. A. Short, D. G. Infield, and L. L. Freris, “Stabilization of gridfrequency through dynamic demand control,” Power Systems, IEEETransactions on, vol. 22, no. 3, pp. 1284–1293, 2007.
[15] P. J. Douglass, R. Garcia-Valle, P. Nyeng, J. Ostergaard, and M. Togeby,“Smart demand for frequency regulation: Experimental results,” SmartGrid, IEEE Transactions on, vol. 4, no. 3, pp. 1713–1720, 2013.
[16] A. Molina-Garcıa, F. Bouffard, and D. S. Kirschen, “Decentralizeddemand-side contribution to primary frequency control,” Power Systems,IEEE Transactions on, vol. 26, no. 1, pp. 411–419, 2011.
[17] S. H. Tindemans, V. Trovato, and G. Strbac, “Decentralized control ofthermostatic loads for flexible demand response,” IEEE Transactions onControl Systems Technology, vol. 23, no. 5, pp. 1685–1700, 2015.
[18] J. Mathieu, “Modeling, analysis, and control of demand response re-sources,” Ph.D. dissertation, 2012.
[19] DoE, “Benefits of demand response in electricity markets and recom-mendations for achieving them,” US Dept. Energy, Washington, DC,USA, Tech. Rep, 2006.
[20] P. Siano, “Demand response and smart grids: a survey,” Renewable andSustainable Energy Reviews, vol. 30, pp. 461–478, 2014.
[21] Y.-J. Kim, E. Fuentes, and L. K. Norford, “Experimental study of gridfrequency regulation ancillary service of a variable speed heat pump,”IEEE Transactions on Power Systems, vol. 31, no. 4, pp. 3090–3099,2016.
[22] S. Meyn, P. Barooah, A. Busic, Y. Chen, and J. Ehren, “Ancillary serviceto the grid from intelligent deferrable loads,” IEEE Transactions onAutomatic Control, vol. 60, pp. 2847 – 2862, March 2015.
[23] Monitoring Analytics, LLC, “State of the market report for PJM: Volume2,” Available online: http://www.monitoringanalytics.com/reports/PJMState of the Market/2015/2015-som-pjm-volume2.pdf, 2016.
[24] R. Walawalkar, S. Fernands, N. Thakur, and K. R. Chevva, “Evolutionand current status of demand response (dr) in electricity markets:Insights from pjm and nyiso,” Energy, vol. 35, no. 4, pp. 1553–1560,2010.
[25] S. A. Pourmousavi and M. H. Nehrir, “Introducing dynamic demandresponse in the lfc model,” IEEE Transactions on Power Systems,vol. 29, no. 4, pp. 1562–1572, 2014.
[26] C. Godsil and G. Royle, Algebraic Graph Theory, ser. Graduate Textsin Mathematics. Springer, 2001.
[27] P. K. Kitanidis, “Unbiased minimum-variance linear state estimation,”Automatica, vol. 23, no. 6, pp. 775–778, 1987.
[28] K. J. Astrom and P. Eykhoff, “System identificationa survey,” Automat-ica, vol. 7, no. 2, pp. 123–162, 1971.
[29] A. Moeini, I. Kamwa, P. Brunelle, and G. Sybille, “Open data ieee testsystems implemented in simpowersystems for education and researchin power grid dynamics and control,” in Power Engineering Conference(UPEC), 2015 50th International Universities. IEEE, 2015, pp. 1–6.