performance assessment for sustainable irrigation … · performance assessment for sustainable...
TRANSCRIPT
PERFORMANCE ASSESSMENT FOR SUSTAINABLE
IRRIGATION WATER MANAGEMENT
A case study of Lower Limpopo Irrigation System, Southern
Mozambique
Eduardo Marcos Cuamba
Master (Integrated Water Resources Management) Dissertation
University of Dar es Salaam
August 2016
PERFORMANCE ASSESSMENT FOR SUSTAINABLE
IRRIGATION WATER MANAGEMENT
A case study of Lower Limpopo Irrigation System, Southern
Mozambique
By
Eduardo Marcos Cuamba
A Dissertation Submitted in Partial Fulfillment of the Requirements for the
Degree of Master (Integrated Water Resource Management) of the University
of Dar es Salaam
University of Dar es Salaam
August 2016

i
CERTIFICATION
The undersigned certify that they have read and hereby recommend for acceptance
by the University of Dar es Salaam a dissertation entitled: Performance Assessment
for Sustainable Irrigation Water Management, A Case Study of Lower Limpopo
Irrigation System - Southern Mozambique, in Partial fulfillment of the requirements
for the degree of Master of (Integrated Water resources Management) of the
University of Dar es Salaam.
……………………………………...
Dr. S.H. Mkhandi
(Supervisor)
Date: ____________________
............................................................
Dr. D.M.M. Mulungu
(Supervisor)
Date: ______________________

ii
DECLARATION
AND
COPYRIGHT
I, Eduardo Marcos Cuamba, declare that this dissertation is my own original work
and that it has not been presented and will not be presented to any other University
for a similar or any other degree award.
Signature___________________________
This dissertation is copy material protected under the Berne Convention, the
copyright Act 1999 and other international and national enactments, in that behalf,
on intellectual properly. It may not be produced by any means, in full or in part,
except for short extracts in fair dealings, for research or private study, critical
scholarly review or discourse with acknowledgement, without the written permission
of the Director, Postgraduate Studies, on behalf of both the author and the University
of Dar es Salaam.

iii
ACKNOWLEDGEMENTS
First of all, I present my gratitude to Almighty God for the strength he gave me and
immeasurable things he has fulfilled in my life, particularly in pursuing this study.
I specially acknowledge my supervisors, Dr. S.H. Mkhandi and Dr. D.M.M.
Mulungu for their wise guidance, patience, valuable suggestions, encouragement and
insightful comments during my study.
I also gratefully express my acknowledge to the personnel of the Department of
Water Resources Engineering, UDSM, for all the help and support especially, Dr.
Joel Norbert
My everlasting gratefulness and appreciation to my wife Olinda da Graça Cuamba
for her love, prayer, unconditional support, encouragement and dedication.
I express my sincere and deep gratitude to Celestino Tsimpho, Rogerio Manhaussele,
Sebastião Ferro and Zukula, from Lower Limpopo Irrigation System company and
Bernardo Luciano from ARA-Sul for the support and help during my fieldwork in
Mozambique.
I acknowledge the WaterNet Fellowship Programme and the Department of
Agriculture of Gaza Province for the financial, technical, material and moral support
to pursue this study.
Special appreciations are expressed for my mother Esitela Matsinhe for her support
and prayer, my entire family and for my fellow brethren in Christ from CCT
Tanzania, Elias, Baraka, and Resique.
Finally, the kind support and input of all my classmates, families and friends are
honestly acknowledged.

iv
DEDICATION
I dedicate this dissertation to my parents, Marcos Cuamba (in memory) and Esitela
Matsinhe “Thanks for guiding me since my childhood and for your diligent support
in my education”, to my lovely wife Olinda da Graça Cuamba, to my brethren
Salomão, Daniel, Esperança, Tristeza and Anselmo and finally to my entire family
for the given support.

v
ABBREVIATIONS
AGLW Water and Land Development Division
AIDS Acquired Immune Deficiency Syndrome
ARA-Sul Administração Regional de Aguas-Sul
ARC Agricultural Research Council
ARC Agricultural Research Council
BM Central Bank of Mozambique
BOD Biochemical Oxygen Demand
CCT Christian Council of Tanzania
COD Chemical Oxygen Demand
CV Coefficient of Variation
CWR Crop Water requirement
DCG Department for Communities and Government
DNA Direção Nacional de Águas
EC Electric conductivity
EP Empresa Pública
ET Crop Evapontraspiration
Eto Reference Evapotranspiration
FAO Food and Agriculture Organization
GRI Gross Return on Investment
HIV Human Immunodeficiency Virus
IFAD International Fund For Agriculture development
vi
IPPM Integrated Production and Pest Management
IR Irrigation Requirement
IWMI International Water Management Institute
KMO Kaiser-Meyer-Olkin
MCA Multi-criteria Analysis
MS Microsoft
MT Metical (Mozambique currency)
NGOs Non-Governmental Organization
NO3 Nitrate
O&M Operation and Maintenance
OECD Organization for Economic Cooperation and Development
PAP Priority Action Programme
PCF Principal Component factor
pH Potential of Hydrogen
PNW Present Net Worth
PVC Polyvinyl Chloride
Pworld World Price
RBL Regadio do Baixo Limpopo (Lower Limpopo Irrigation system)
RH Relative Humidity
RIS Relative Irrigation Supply
RWS Relative Water Supply
SADAC Southern African Development Community
SPSS Statistical Package for the Social Sciences

vii
SSA Sub-Saharan Africa
SSF Self-Sufficiency
Std. Deviation Standard Deviation
SVGP Standardized Gross Value of Production
TDS Total Dissolved Solids
UDSM University of Dar es Salaam
UNEP United Nation Environmental Programme
USAID United State Agency for International Development
USD United State Dollar
USDA United States Department of Agriculture
WB World Banc
WDC Water Delivery Capacity
WMO World Meteorological Organization
WUE Water-Use Efficiency

viii
SYMBOLS
Symbols Description Units
Q Discharge m3/s
V Velocity m/s
A Area m2, ha
S Slope m/m
R Hydraulic radius m
N Manning coefficient -
EC Electric Conductivity S/m

ix
ABSTRACT
In most of the irrigation systems in Mozambique, the low water use efficiency
combined with the intensive use of agrochemical and unimproved technologies has
been appointed as being a serious threat to the environment and waste the already
scarce water resources . In Connection to this, a study was conducted to evaluate the
performance of Lower Limpopo Irrigation System (RBL). Field observation and
survey, personnel interview and literature review techniques were used for data
collection. A set of comparative performance and environmental indicators
developed by the International Water management institute (IWMI) were used to
analyze the collected data. The study results indicate good performance of the system
in terms of production per unit of land. However, the high Relative Irrigation Supply
and Relative Water Supply ratio (1.93 to 2.75 and 3.5 to 5.4 respectively) show the
existence of problems on irrigation water management, thereby suggesting the need
for more work in order to improve the irrigation efficiency. The Gross Return on
Investment varied from 1.1% to 20.9% indicating a very low capacity of the system
to generate profit. The SSF value was between 6.7 % and 110 %. Values of Self-
Sufficiency below 100 % indicate that the fees collected from irrigation are not
capable of covering the operation and maintenance costs, being this one of the major
concern for the sustainability of the system. The study concluded that the increase in
yield per hectare comes at the cost of environment and miss use of irrigation water.
Therefore adoption of water saving practices and environmentally friendly
technologies are highly recommended to minimize the waste of water and
environment degradation.

x
TABLE OF CONTENTS
Page
Certification................................................................................................................... i
Declaration and Copyright ........................................................................................... ii
Acknowledgements .....................................................................................................iii
Dedication ................................................................................................................... iv
Abbreviations ............................................................................................................... v
Symbols.. ...................................................................................................................viii
Abstract… ................................................................................................................... ix
Table of Contents ......................................................................................................... x
List of Tables.............................................................................................................. xv
List of Figures ........................................................................................................... xvi
CHAPTER ONE : INTRODUCTION ..................................................................... 1
1.1 General Introduction ..................................................................................... 1
1.2 Problem statement ........................................................................................ 2
1.3 Research objectives ...................................................................................... 4
1.3.1 Main Objective ............................................................................................. 4
1.3.2 Specific objectives of the study ................................................................... 4
1.4 Research questions ....................................................................................... 4
1.5 Significance of the study ............................................................................. 5
1.6 Scope of the study ........................................................................................ 5

xi
CHAPTER TWO : LITERATURE REVIEW ........................................................ 7
2.1 Definition of Key Terms .............................................................................. 7
2.2 Description of the study area ........................................................................ 9
2.2.1 The Limpopo River Basin ............................................................................ 9
2.2.2 The Lower Limpopo Irrigation System: geographical and historical
context ........................................................................................................ 10
2.2.3 Drivers for basin degradation ..................................................................... 11
2.2.4 Current situation of land and water resources for irrigation in
Mozambique ............................................................................................... 12
2.3 Main factor affecting productivity and sustainability water management . 13
2.3.1 Personal characteristics of farmers ............................................................. 13
2.3.2 Technological factors ................................................................................ 15
2.3.3 Credit markets/agricultural loans ............................................................... 16
2.3.4 Environmental factors ................................................................................ 17
2.4 Comparative performance Indicators ......................................................... 17
2.4.1 Indicators of Irrigated Agricultural Output ................................................ 18
2.4.2 Water Supply Indicator ............................................................................... 20
2.4.3 Indicator of the irrigation infrastructure ..................................................... 21
2.4.4 Financial indicator ..................................................................................... 22
2.4.5 Environmental performance indicators ...................................................... 23
2.4.6 Properties of performance indicators .......................................................... 23
2.4.7 Limitations of the Indicators ...................................................................... 25
2.4.8 Application of the indicators ..................................................................... 25
2.5 CROPWAT model description ................................................................... 29

xii
2.5.1 CROPWAT Program structure ................................................................... 29
2.6 Potential environmental impact of irrigation development ........................ 29
2.7 Strategies to improve the performance of the irrigation System ................ 31
2.7.1 An overview of Multicriteria Analysis (MCA) approach .......................... 32
2.7.1.1 Key features of MCA ................................................................................. 32
2.7.2 Steps in Multicriteria Analysis (DCG, 2009) ............................................. 33
CHAPTER THREE : METHODOLOGY OF THE STUDY .............................. 34
3.1 General information .................................................................................... 34
3.2 Description of the Study Area .................................................................... 34
3.2.1 Location ...................................................................................................... 35
3.2.2 Climate ....................................................................................................... 35
3.2.3 Soil .............................................................................................................. 37
3.2.4 Land occupation ......................................................................................... 37
3.3 Data collection ............................................................................................ 38
3.4 Methodology based on Objectives ............................................................. 39
3.4.1 Identification of the main factors affecting productivity and sustainable
water management in Lower Limpopo Irrigation system .......................... 39
3.4.2 Estimation of the overall Lower Limpopo irrigation performance ............ 40
3.5 Data analysis techniques and interpretation ............................................... 45
3.6 Appropriate strategies to improve the irrigation system performance ....... 46

xiii
CHAPTER FOUR : RESULTS AND DISCUSSION ........................................... 47
4.1 Identification of the main factors affecting productivity and sustainable
water management in Lower Limpopo Irrigation system .......................... 47
4.1.1 Personal characteristics of the farmers ....................................................... 47
4.1.2 Factors affecting sustainable irrigation system productivity and water
management ................................................................................................ 50
4.1.3 Factor analysis results ................................................................................. 52
4.2 Estimation of the overall Lower Limpopo irrigation system performance 61
4.2.1 Overview .................................................................................................... 61
4.2.1 Water Supply Indicators ............................................................................. 62
4.2.3 Canal Delivery Capacity indicator ............................................................. 64
4.2.4 Financial Indicators .................................................................................... 65
4.2.5 Land Productivity indicators ...................................................................... 67
4.2.6 Water Productivity Indicators ..................................................................... 69
4.2.7 Environmental Performance ....................................................................... 70
4.2.7.1 Irrigation Water Quality ............................................................................. 71
4.2.7.2 Irrigation impact on the Environment ........................................................ 72
4.2.8 Determination of overall system performance ........................................... 74
4.3 Strategies to improve Irrigation System performance. ............................... 75
4.3.1 Legal and Institutional aspects ................................................................... 75
4.3.2 Economic aspects ....................................................................................... 76
4.3.3 Technologic and agronomics aspects ......................................................... 77
4.3.4 Managerial aspects ..................................................................................... 78
4.3.5 Socio-cultural aspects ................................................................................. 79
xiv
4.3.6 Cross-cutting issues .................................................................................... 79
CHAPTER FIVE : CONCLUSIONS AND RECOMMENDATIONS ............... 81
5.1 Conclusions ................................................................................................ 81
5.2 Recommendations ...................................................................................... 83
REFERENCES ......................................................................................................... 85
APPENDICES .......................................................................................................... 94

xv
LIST OF TABLES
Table 2.1: Environmental indicators (Adapted from Malano and Burton, 2001). .. 23
Table 2.2: Main characteristics of the observed irrigation schemes ....................... 27
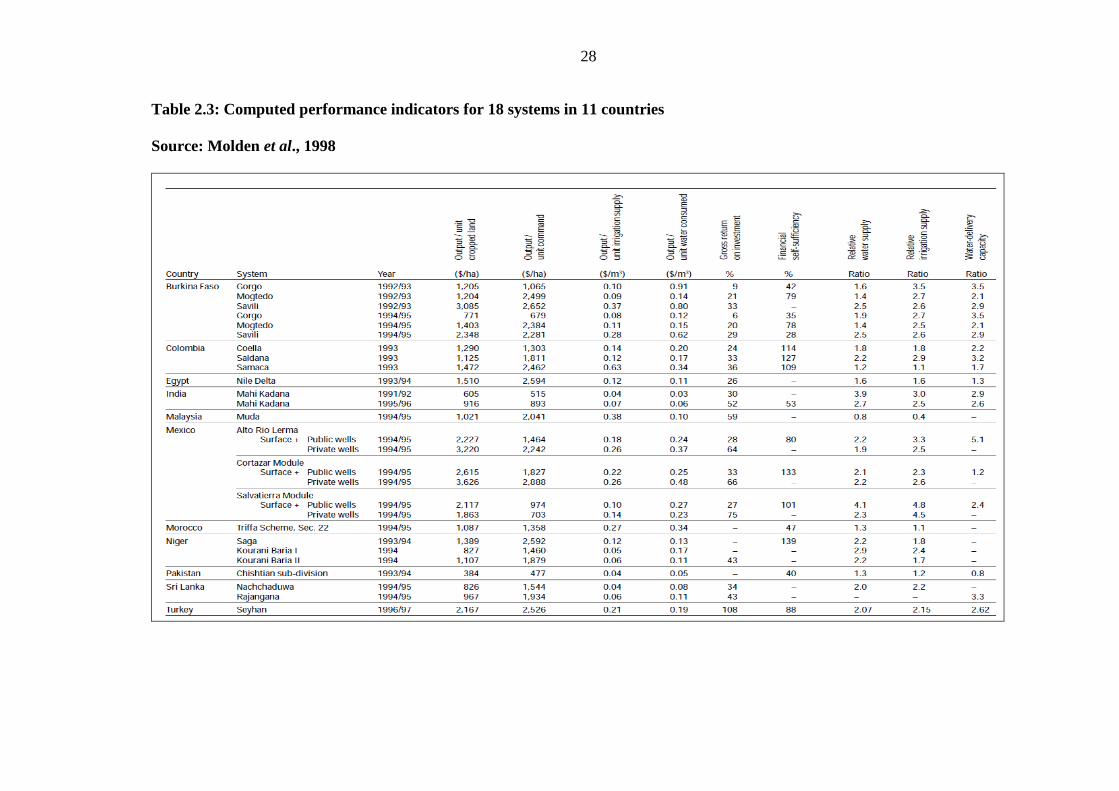
Table 2.3: Computed performance indicators for 18 systems in 11 countries ........ 28
Table 3.1: Indicative Performance threshold .......................................................... 46
Table 4.1: Distribution of respondents according to personal characteristics ........ 48
Table 4.2: Factors limiting optimal productivity and water management .............. 52
Table 4.3: KMO and Bartlett's Test ........................................................................ 53
Table 4.4: Extracted factors with eigenvalues greater than one.............................. 54
Table 4.5: Variable related to each extracted factor with loading factor ................ 55
Table 4.6: Parameters for calculation of individual project performance
indicators ............................................................................................... 61
Table 4.7: SVGP calculation for all the selected irrigation blocks ( year
2014/2015) ............................................................................................ 61
Table 4.8: Results of Water quality parameters ...................................................... 71
Table 4.9: Overall system Performance Index ........................................................ 75
xvi
LIST OF FIGURES
Figure 3.1: Map of Lower Limpopo Irrigation System( Adapted from Ganho,
2013). ................................................................................................... ..36
Figure 4.1: Water supply indicators .......................................................................... 62
Figure 4.2: Water Delivery Capacity indicator ......................................................... 64
Figure 4.3: Gross Return in investment .................................................................... 65
Figure 4.4: Self-Sufficiency indicator ....................................................................... 66
Figure 4.5: Land productivity indicators ................................................................... 68
Figure 4.6: Water Productivity Indicators ................................................................. 69
Figure 4.7: Water quality in the drainage system outlet ........................................... 72

1
CHAPTER ONE
INTRODUCTION
1.1 General Introduction
In most countries of the Southern Africa Development Community (SADC),
including Mozambique, the combined effect of population growth and climate
change or climate variability contributes to the increasing pressure on the already
threatened and scarce water resources. These factors limit the availability of water
for food production and threaten food security in many developing countries (FAO,
2015).
A Study by Seckler et al. (1998), relate that most of the regions in developing
countries have absolute water scarcity which affects one-third of their population. In
Limpopo Basin, where the study area is located, the over-use of water for agriculture
and mining upstream, is already causing a severe water shortage in the lower
catchment (Mozambique), which can be dry up to eight months (Amaral et al, 2004).
Being the largest water user, concerns about water scarcity have to pay more
attention to this sector. In Mozambique, the agriculture sector accounts for nearly
eighty-seven percents of total water use in the country (FAO, 2005). Studies by Perry
(2007) and Kijne et al. (2003), refer that an improvement in irrigation efficiency and
increase in agriculture water productivity are crucial in the mitigation of competition
for water resources, environment protection and sustainable food provision.

2
According to Ganho (2012), the Lower Limpopo Irrigation System (RBL) is the
second largest water consumer and source of diffuse pollutants in the basin due to the
inadequate water management, exhaustive use of agrochemicals (fertilizers and
pesticides) and livestock farming. Therefore, a coordinated effort is needed from
different stakeholders in order to ensure a sustainable production and protect the
threatened water resources.
With the view to minimize the water losses and increase productivity in irrigation
systems, a performance assessment should be carried out to check the state of health
of the systems and also the water use efficiency (Molden et al., 1998). Different
approaches for irrigation performance assessment are available, but in this study, the
comparative performance (external indicators) and environmental performance
indicators were used.
1.2 Problem statement
The Limpopo River Basin, where the research was carried out, is considered to be
one of the most vulnerable river basins in Africa, not only due to the particular
climate conditions in the region but also due to the weak water management.
Moreover, the Lower Limpopo Valley is presumably the environmentally more
vulnerable section in all the extensive Limpopo river basin (UNEP/FAO/PAP, 1998).
According to FAO (2004), Apart from drought, the concern on water scarcity and
salinity in Limpopo basin is aggravated by misuse of water for irrigation (over-
abstraction), lack of trained staff in water management and inadequate poor drainage
systems. USAID (2015) and FAO (2004), reported that the increasing water

3
abstraction for irrigation upstream the Limpopo River estuary is one of the main
causes of increasing saltwater intrusion, degradation of water resources by returning
polluted flow to the river and reduction of mangrove population.
Appointed as one of the major water use sector located in lower Limpopo valley, the
performance of the Lower Limpopo Irrigation System (RBL) is negatively affected
by poor practices and inefficiencies at the farm and post-harvest level. (USAID,
2014). Therefore, the low water use efficiency becomes a potential threat for
environmental degradation and waste the valuable and scarce water resources.
Besides the above-stated problems, there is no much work done to evaluate the
system performance in order to provide considerable information in selecting better
performing practices under the current system performance. The research carried out
by Julaia (2009), in Chokwe irrigation system was only focused on internal process
indicators rather than external indicators.
Hence, this research will look at ways in which both the output from agriculture and
water use efficiency can be increased through the introduction of more performance-
oriented management practices. For such, a set of external comparative performance
indicators and environmental performance indicators were used to evaluate the
current operational state of the system and propose strategies for improvement.

4
1.3 Research objectives
1.3.1 Main Objective
The main objective of this research is to assess the performance of Lower Limpopo
Irrigation System using external comparative performance indicators and
environmental performance indicators.
1.3.2 Specific objectives of the study
1) To identify the main factors affecting productivity and sustainable water
management in Lower Limpopo Irrigation system.
2) To estimate the overall performance of Lower Limpopo irrigation system.
3) To propose appropriate strategies to improve the performance of the
irrigation system.
1.4 Research questions
The research seeks to give answers the following questions:
1) Which are the main limiting factors and how are they affecting the
productivity and sustainability of the RBL irrigation system?
2) How the RBL irrigation system is performing in relation to water and land
productivity, and water use efficiency?
3) Which measures can be adopted to adjust the indicators so that they can
provide better results on the irrigation system operational performance?

5
1.5 Significance of the study
This study results if adhered to and implemented will be a significant endeavor in
addressing the gap-in-knowledge on the optimum potential of the irrigation system
and how it can perform well with the limited available land and water resources.
Likewise, the results will be beneficial to different stakeholders (policy maker, water
managers, and farmers) by providing a better understanding of how the system is
operating and help to analyze the problems, their causes and identify ways and
means to achieve efficient and effective project management or scheme performance.
Moreover, this study is useful as a future reference for researchers on the subject of
irrigation performance and irrigation water use efficiency which is still scarce in the
country in particular and in many developing countries in general. Furthermore, the
output from this study will be useful for water management institutions and operators
to ensure better irrigation services and sustainability in RBL irrigation system which
could also be extended to other similar irrigation schemes in Mozambique.
1.6 Scope of the study
This study made a comparative performance evaluation of three irrigation blocks
nested to Lower Limpopo Irrigation system. Relevant comparative (external)
performance indicators were applied for comparison in terms of selected criteria.
These include water productivity, land productivity, water supply, water delivery
capacity and financial indicators. Moreover, for each irrigation block, factors
affecting agriculture productivity and sustainable irrigation water management were
assessed and analyzed using Principal Component Factor Approach.
6
Due to time and financial constraints, was not possible to collect data in all the
irrigation blocks as well in all the secondary canal within the selected blocks, for this
reason, the study was limited to three irrigation blocks. However, the selected
sampling techniques used are representative and similar to the population of the
scheme as a whole. Hence, the results from this study could be extended to other
similar state-based managed systems in the basin in particular and in the country in
general.
7
CHAPTER TWO
LITERATURE REVIEW
2.1 Definition of Key Terms
The base crop is defined as the prime marketable crop under cultivation in the total
irrigated area for the period in the analysis (Molden et al.,1998).
Farmers’ Field School (FFS) is a learning process for groups of farmers in which
they find out the ecological relationship between different factors affecting the health
of their crop (pests, natural enemies and other), thus enabling them to make more
efficient and healthier crop management decisions (FAO, 2002).
Indicators are the ways of measuring progress towards the achievement of the goal.
They provide an objective basis to track the progress and assessment of final
achievements. A good indicator should define the level of achievement, specifically:
how much? how well? by when? (FAO, 2002).
Irrigated agriculture is defined as the practice of agriculture activity where
artificial means are used to supply additional water to the field, encompassing the use
of water control practices and infrastructures to remove the undesired water (FAO,
1999).

8
Irrigation efficiency is defined as the ratio (expressed as a percentage) of the
average amount of water applied to the field used helpfully to the total average
amount applied (USDA, 1997).
Irrigation is the use of artificial means to provide water to cultivated crops, in order
to make possible the crop production in arid regions and to compensate the effect of
water scarcity in semi-arid areas. The rainfall may be irregular throughout the year
and uneven between years even in regions where the total seasonal rainfall is
adequate (FAO, 1997).
Sustainable agriculture is defined as the one that meets the needs of present and
future generations for its products and services while ensuring, environmental health,
profitability and socio-economic equity (FAO, 2014).
Water productivity is defined as the ratio of the net benefits derived from crop,
fishery, livestock, forestry, and mixed agricultural systems to the amount of water
required to produce those benefits (Molden et al., 2010).
Water-use efficiency (WUE) is the ratio of biomass accumulation, expressed as the
assimilation of carbon dioxide, total crop biomass, or crop grain yield, to water
consumed, expressed as evapotranspiration, transpiration or total water input to the
system (Sinclair et al., 1984).

9
2.2 Description of the study area
2.2.1 The Limpopo River Basin
The Limpopo River within Mozambique flows about 561 km until it drains into the
Indian Ocean in Xai-Xai town (Louw and Gichuki, 2003). The average annual
temperatures are about 24 °C and the maximum daily temperatures range from 30º-
32 and 34 °C along the coastal zone and in the central area, respectively. The annual
average relative humidity is about 65% in the central zone and 75% in the northern
and southern areas (Mertens and Loureiro, 1974). The evaporation range from 800
mm to 2400 mm/year, being the average evaporation rate (1970 mm/year) higher
than rainfall (IWMI/ARC, 2003).
Rainfall varies considerably throughout the basin, from 860 mm/year along the
shoreline to below 30 mm per year in the arid area. The rainfall variability can be
explained by the cycle occurrence of anticyclone conditions which cover the entire
southern Africa (FAO, 2004). According to Amaral et al (2004), a major part of the
annual rainfall (95%) in Mozambique is observed during October to March, in
diversified secluded rain periods and insulated locations, describing the cyclic
recurrent, irregular and unpredictable rainfall. The part of runoff that is produced
inside the country is about 400 million cubic meters per year (Brito et al., 2009).

10
2.2.2 The Lower Limpopo Irrigation System: geographical and historical
context
The Lower Limpopo Irrigation System (RBL) is situated Xai‐Xai district in about 5
km far from Xa-Xai city, in Limpopo river basin (Figure 3.1), close to the river
outlet. The Limpopo river flow is characterized by a pronounced high seasonal and
inter‐annual fluctuation (Brito et al., 2009). Moreover, due to relief condition of the
floodplain, which normally does not exceed 100 m above sea level, the ecological
condition of the floodplain is cyclically influenced by the occurrence of floods and
dry spells caused by the discharges and water retention in dams located upstream the
basin (Ganho, 2013).
The irrigation infrastructures suffer from cyclic deprivation due to the destruction
caused by the recurrent occurrence of flood and huge assets are needed for their
rehabilitation. the condition of irrigation infrastructures turns the practice of
agricultural activity tricky and costly for the farmers. The history of agriculture in
lower Limpopo region is categorized into four major phases, namely: Period of
colonial capitalism( between 1950 to 1975), to planned economy (Socialist) from
(1975 to 1983) and finally the shift to market economy (1983-2000 ) to the actual
market economy from the year 2000 to the present which is dominated by
rehabilitation funded infrastructure (Ganho, 2013).
From 1994 the system began to face problems related to irrigation infrastructure
degradation which was exacerbated by the occurrence of flood in the year 2000

11
leading the system to collapse. Between 2003 and 2008, a total area of 4000 ha was
renewed as a part of Massingir Dam rehabilitation project (Appendix 1). In 2010 the
government decided to revitalize the Lower Limpopo Irrigation system by creating
the Lower Limpopo Irrigation system company (RBL, Ep). The role of the created
company was to ensure the management of the system and thereby, reactivate the
irrigated agriculture in the region. When it was established, the RBL-EP had a
jurisdiction of only 12 000 hectares of irrigated land (area with infrastructures),
which were later extended in 2012 to an area of 70 hectares (RBL, 2015)
2.2.3 Drivers for basin degradation
IWMI/ARC (2003), refer that in whole Limpopo River Basin, the main factors
leading to the continuous environment degradation include the misuse of water
resources, contamination due encroachment by settlements, mining activities
upstream and developments.
A study by DNA (1999) indicated that throughout the Limpopo Basin length, the
major water resources concerns include: (i) increasing salinity; (ii) discharge of
untreated wastes or partially treated waste water; (iii) dumping of untreated loads
from upstream mining activities; (iv) reduction of river flows exacerbated by the
increasing demands.
In Mozambique, the main sources of pollution include the practice of agricultural in
Chokwe Irrigation System, which is characterized by the intensive use chemical

12
products combined with poor and depredated drainage network. Other non-point
sources of pollution, but not the least, are domestic effluent discharges in all the river
extension, salt intrusion and waters mineralization as a result of decreased flows
(IWMI/ARC, 2003).
2.2.4 Current situation of land and water resources for irrigation in
Mozambique
Latest estimations of water consumption per sector in Mozambique indicate that
irrigated agriculture is the major water consumer accounting for about 87% of the
country total water consumption. (FAO, 2005). Likewise the practice of irrigation in
Lower Limpopo Valley is appointed as the main threat to the environment as it cause
water pollution and land degradation (Ganho, 2012).
Although rain-fed agriculture accounts for the majority of the cultivated land,
irrigated agriculture, which currently occupies about 1% of the total cultivated area,
constitutes a significant contribute to the national agricultural production. However,
Irrigated agriculture is characterized by high water losses, low efficiencies, highly
subsidized water rates, and low yields per unit of applied water (Marquês, 2006).
Therefore, any management practice leading to an improvement in water use
efficiency, either by adopting water saving technologies or by increasing agriculture
productivity for the same amount of water, is of vital importance to make the best
use of limited and threatened water resources. These savings would also inevitably

13
mean more water available to expand irrigated areas or to allocate to other sectors
within the same river basin, while also ensuring environment protection (Marquês,
2006).
2.3 Main factor affecting productivity and sustainability water management
In Mozambique, the low agricultural productivity has been seen as a result of lack of
appropriate technologies combined with deficient financial supports for agricultural
activities. In addition, agricultural markets are commonly distant, unpredictable and
not competitive for smallholder farmers (IFAD, 2014).The harmful effect of the
current agricultural techniques to the environment include, soil deterioration,
reduction and pollution of water sources, wasteful energy use, reduction of
biodiversity, and degradation of non-agricultural habitat (FAO, 2004).
2.3.1 Personal characteristics of farmers
The characterization of farmers encompasses number variables that can have an
influence in the day to day activities of farmers as well as in the agriculture
productivity. The main variables are as per the following description.
Education and Knowledge: Research findings by a number of authors reported the
vital role of education in agriculture productivity and generation of revenue. For
example, a study by Bingen et al. (2003), refer that awareness and know how are
fundamentals for farmers to accept new productions methods and techniques, obtain
input, modify the methods they do their agricultural activities and have access to
14
market. There is also a confidence that access to education can trigger an economic
boost by strengthening the farmers productive potential as well as removing the
traditional biases which can prevent the farmer to grow, such as gender biases.
(Asfaw and Admassie, 2004)
Gender: can be defined as a set of established habits and relation between women
and men in a particular society or place (Adeoti, et al., 2012). Camara et al., 2011),
refer that woman farmers are the main accountable group for food production for the
livelihood of most families in rural areas. Likewise, studies relate that women
farmers are somehow more sensible and aware about the need for environment
protection than men farmers (Burton, 2013).
Despite the recognized contribution of both men and women for food production,
gender disparity in this sector was reported in a number of studies. As an example,
Mohammed and Abdulquadri ( 2011), reported the tendency of particularizing some
crops to be only cultivated by men and others by women. A research by Adeoti et al.
(2012) carried out in Ghana concluded that vegetable production was mostly
cultivated by men as it requires the use of more corporeal power.
Age, family size, and landholding size: The agricultural experience of the farmers
is directly proportional to the maturity of the householder. This makes the production
of various crops by the farmers extremely dependent on their prior expertise.
(Adomi, et al., 2003). Thus, farmers with large experience are likely to improve the

15
yield of their property. Nevertheless, because farmers with advanced age tend to
have less corporeal power, the previous conclusion is not unlimited, given the fact
that this trend tends to reduce the willingness to accept changes and approve new
technology. (Burton, 2013).
2.3.2 Technological factors
This set of factors encompasses the use agrochemical products, new crop pattern,
improved seeds, artificial water application technologies and soil conservation
methods. The above-stated techniques and practices are meant to improve the water
and land productivity.
Chemical fertilizer: Aune and Bationo (2008), refer that the application of
fertilizers is the starting point to enhance productivity as if the soil quality and
productivity are poor the adoption of other techniques and practices will not bring the
desired results. A number of studies reported that in sub-Saharian Africa use of
chemical fertilizers is negligible, being the application in this region estimated in 11
kg/ha against 130 kg/ha and 271 kg/ha applied in south Asia and East Asia,
respectively (Janvry, 2010).
The least use of soil fertilization technologies in Sub-Saharan Africa relegates the
region to the last position in the world. The application of fertilizer below the
average is an apparent sign that improvement of agriculture productivity in Africa
continue to be development defiance (Xu et al., 2009 and Crawford et al., 2003). The
16
inadequate soil fertilization is appointed as the reason for the low productivity per
unit land, which is considered to be less than the world standards (Morris et al.,
2007).
Irrigation: The positive effect that can be generated by the artificial supply of water
to cultivated crops which in turn leads to rural poverty alleviation makes the practice
of irrigation as one of the vital inputs of is one of the vital production factors in
agriculture. Moreover, the use of irrigation can trigger an increase in the small-scale
farmer productivity and create alternatives for their livelihood thereby, mitigating
their dependability to the rainfall variability and extrinsic effect (Hussain and Hanjra,
2004).
However, due to the negative effects that the practice can cause to the environment
such as land deterioration, contamination of water resources and interference on
ecological functions, the practice of irrigation require special attention to avoid
disturbances (Hussain and Hanjra, 2004).
2.3.3 Credit markets/agricultural loans
Credit in agriculture can be defined as the money lending for agricultural production,
agro-processing and agribusiness, and the manufacture and supply of productions
factors (Aggelopoulos et al., 2011). The possibility of small-scale farmers get a loan
from formal financial institutions is very low since they almost never have suitable
guarantee to banks. In many African countries the land tenure is State propriety and

17
the farmers do not own title deeds for their farms but even where they do, the
markets are not structured well enough so that their properties can be considered
suitable collateral. (Kindness and Gordon, 2001). As an alternative, smallholder
farmers get loans from micro-credit banks which normally do not request collateral.
In this system of credit, the loan is for a group of borrower and collateral is
substituted by the commitment the each group member to prevent one member from
failure. to pay (Kindness and Gordon, 2001).
2.3.4 Environmental factors
There are many environmental factors influencing agricultural productivity and
consequently the revenue of farmers. The environmental factors considered in this
research are precipitation, soil erosion, land cover and soil characteristics. The
expansion and increase of the area for crop production throughout the world is
appointed as responsible for producing 25% and 30% of global greenhouse gas
emissions, as well as influencing climate variability (Janvry, 2010). Kintomo et al.
(2008), also reported that the decrease in agricultural productivity and environmental
health are some somehow due to the intensification of agriculture activities and poor
soil management practices.
2.4 Comparative performance Indicators
Performance assessment in irrigation and drainage refer to regular surveillance,
recording, and analysis of activities associated to irrigation in order to guarantee
continuous improvement. The final objective of performance assessment is to attain

18
an effective and efficient utilization of resources by supplying appropriate
information to all levels of the system management (Molden et al., 1998). The
evaluation of an irrigation system is of capital importance as it allow the
identification of sustainable management practices and methods that can be
successfully fulfilled to enhance the irrigation efficiency (FAO, 1989).
The field level assessment of surface irrigation is a vital aspect of both the
management and development of the scheme. The assessment at field level is
essential to classify the parameters of the scheme in order of their weight, to discover
its functionality deficiencies, and build up options for a better use of the scheme
(FAO, 1989).
Selected indicator: The selected indicators has been developed and widely field-
tested by the by the International Water Management Institute (IWMI). The
comparative indicators were developed to demonstrate gross relationships and trends
which are helpful in depicting the actual state of the system. For example where a
certain scheme is performing very good, or where deep intervention is needed
(Molden et al., 1998).
2.4.1 Indicators of Irrigated Agricultural Output
The agricultural output indicators establish relationship between agriculture output
with unit land or unit water. Values of output per unit command area higher than
output per unit irrigated area indicate that the irrigation intensity in the system is

19
greater than one. Lower value of output per unit irrigation supply if compared to the
value of output per unit water consumed indicate that part of water applied to the
field is not productive. The indicators are as per the equations below (Molden et al.,
1998).
Output per cropped Area (ha
$)=
( ))1.2.(..............................
A Area Cropped .Irr
oductionPr
Cropped
Output per Unit command (ha
$) = )2.2.....(..............................
)(V Area Command
oductionPr
div
Output per unit Irrigation supply ( )3m
$= )3.2....(..........
)Supply(V Irrig. Diverted
oductionPr
div
Output per unit water consumed 3
$
m= )4.2(..........
)ET(Vby Water of Volume
oductionPr
consumed
where,
Production is the Output of the area under irrigation in terms of gross or net value of
production measured at local or world prices (equation 2.5);
Irrigated cropped area is the Sum of the areas under crops during the time period
of analysis;
Command area is the designed or nominal area to be irrigated;
Diverted irrigation supply is the volume of water diverted to the command area;
and
Volume of water consumed by ET is the Actual evapotranspiration of crops.
20
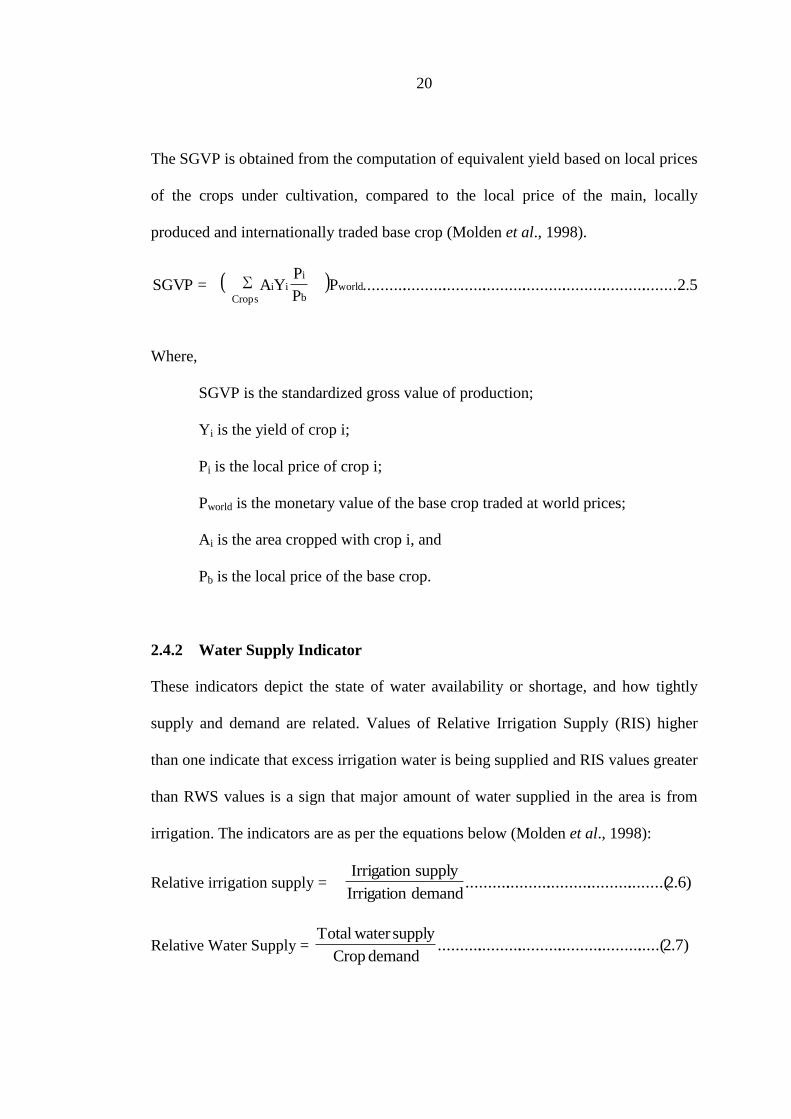
The SGVP is obtained from the computation of equivalent yield based on local prices
of the crops under cultivation, compared to the local price of the main, locally
produced and internationally traded base crop (Molden et al., 1998).
( ) 5.2...............................................................................P∑P
PYA=SGVP world
Crops b
iii
Where,
SGVP is the standardized gross value of production;
Yi is the yield of crop i;
Pi is the local price of crop i;
Pworld is the monetary value of the base crop traded at world prices;
Ai is the area cropped with crop i, and
Pb is the local price of the base crop.
2.4.2 Water Supply Indicator
These indicators depict the state of water availability or shortage, and how tightly
supply and demand are related. Values of Relative Irrigation Supply (RIS) higher
than one indicate that excess irrigation water is being supplied and RIS values greater
than RWS values is a sign that major amount of water supplied in the area is from
irrigation. The indicators are as per the equations below (Molden et al., 1998):
Relative irrigation supply = )6.2........(........................................demand Irrigation
supply Irrigation
Relative Water Supply = )7.2.....(..................................................demand Crop
supply water Total

21
where,
Crop demand is the potential crop ET, or the ET under well-watered conditions;
Total water supply is the surface diversions plus rainfall; and
Irrigation supply is the surface diversions only.
2.4.3 Indicator of the irrigation infrastructure
The water delivery capacity (WDC) ratio illustrate if the system design is somehow a
constraint to cope with the actual crop water demand at the pick period or not. To
meet the crop demand at the pick period without an limitation, the value of WDC
indicator mast be greater than one. Ratios of WDC very close to one are not
recommended as they may indicate difficulties for the system to meet the crop water
requirement at the pick period. The indicator for irrigation infrastructure is per the
equation 2.8: (Molden et al., 1998).
Water delivery capacity (%) = )8.2.(demand consuptivePeak
head systemat ter deliver wa ocapacity t Canal
where,
Capacity to deliver water at the system head is the present discharge capacity of
the canal at the system head; and
Peak consumptive demand is the peak crop IR for a growing period expressed as a
flow rate at the head of the irrigation system.

22
2.4.4 Financial indicator
The self-sufficiency indicator indicates whether the users are capable to manage the
system by themselves the assistance from the government or not. The computation of
this indicator provides the percentage of the revenue generated from irrigations that
is applied in the operation and maintenance. Values of self-sufficiency equal or
greater than 100% indicate that the farmers can operate the system without an
external fund and values less than 100% may be an indication of sustainability
concerns. The financial indicators are as per the equations 2.9 and 2.10 (Molden et
al., 1998):
Financial self-sufficient = )9.2..(........................................eexpenditur M&O Total
irrigation from venueRe
Gross return on Investment (%) = )10.2.....(..........tureinfrastruc irrigation of Cost
oductionPr
where:
Production is the Output from irrigation in terms of gross or net value measured at
local or world prices;
Cost of irrigation infrastructure is the cost of the irrigation water delivery system
referenced to the same period as the Standard Gross Value of Production;
Revenue from irrigation is the revenue generated from irrigation fees, or other
locally generated income; and

23
Total O&M expenditures are the amount expended locally through O&M plus
outside subsidies from the government.
2.4.5 Environmental performance indicators
This set of indicators meant to evaluate the effect of irrigated agriculture on land and
water resources. These are as per the summary in Table2.1.
Table 2.1: Environmental indicators
Adapted from Malano and Burton, 2001
Indicator DefinitionMozambique
Standard
PhysicalSalinity (electrical conductivity) of the irrigation supply and
drainage water.2.5 mS/cm
BiologicalBiological load of the irrigation supply and drainage water
expressed as Biochemical Oxygen Demand (BOD) at 20oC< 5
ChemicalChemical load of the irrigation supply and drainage water
expressed as Chemical Oxygen Demand (COD)≤ 150 mg/l
Physical Total Dissolved solids (TDS) ≤ 2000 mg/l
ChemicalAmount of acids and alkalies discharged expressed as
potencial of Hydrogen (pH) 6.5-8.5
2.4.6 Properties of performance indicators
An accurate performance indicator is composed by both an current value and an
projected value that permit the evaluation of the degree of variation. Additional, it
must include information that helps the manager to find out if the variation is
tolerable or not. Below are some of the performance indicators properties
recommended by Bos (1997):

24
Scientific basis: an indicator must be derived from an analytically and statistically
experienced fundamental model of the section of the system it refer to.
Quantifiable: the required information to quantify the indicator should be readily
accessible or reachable (quantifiable) with the available kwon-how. The assessment
should be replicable.
Reference to a target value: Means that the significance and the suitability of the
projected value and acceptance for the indicator can be settled. The settled values
along with their degree of variation must be correlated to the existing technology and
management practices (Bos et al., 1991).
Provide unbiased information: preferably, in the formulation of performance
indicators a narrow ethical perspective should be avoid. Actually, this is no ease
since even technical procedures have different ways of thinking.
Ease of use and cost effectiveness: mainly for regular management, performance
indicators must be strictly achievable, and readily used by the organization personnel
considering their motivation and level of knowledge. Moreover, the implication of
adopting the use of indicators in respect to equipment, investment, and human
resources commitment, mast fit within the organization‟s assets.

25
2.4.7 Limitations of the Indicators
It is important to highlight that the calculation of indicators is generally influenced
by a number of uncertainty derived from the broad use of secondary data, not
collected by the researcher and from the considerable level of uncertainty in the
computation of effective precipitation and crop water evapontraspiration, for which
several methods exist (Dastane, 1974).
The uncertainty in the calculation of effective precipitation is also found on the
estimation of actual crop evapotranspiration. According to Molden et al. (1998), the
variation in water deliveries, soil characteristics, and farmer practices make the
estimation of regional evapotranspiration quite difficulty. It is even more difficult to
get a good estimation when crops are stressed or deficit irrigation is practiced.
Because of the above stated, two irrigation scheme can only confidently be
considered different where the magnitude is considerable large. Where the difference
between system performances for computed indicator is less than 20%, the difference
in performance is considered to be negligible or insignificant.
2.4.8 Application of the indicators
The selected comparative indicators were experimented in eighteen irrigation
systems located in eleven countries all over the world. These are Colombia, Egypt,
Burkina Faso, India, Malaysia, Morocco, Niger, Mexico, Pakistan, Turkey and Sri
Lanka. The most important characteristics of the systems used for the calculation of

26
the indicators are as per the Table 2.2. These characteristics infer that the experiences
were carried out in a number of agro-climatic conditions and systems with different
water distribution patterns, crops and cultivation patterns, water resource
accessibility, and different management methods. Table 2.3 depicts the computed
indicators for eighteen (18) irrigation schemes throughout the world (Molden et al.,
1998).

27
Table 2.2: Main characteristics of the observed irrigation schemes
Source: Molden et al., 1998
28
Table 2.3: Computed performance indicators for 18 systems in 11 countries
Source: Molden et al., 1998

29
2.5 CROPWAT model description
CROPWAT model is a software program for the computation of crop water demand
and irrigation programming. Moreover, the software provide options for the design
of diverse water supply scenarios and the computation of a number of water supply
for several crop patterns (Allen et al., 1998).
Normally, the computation of crop CWR and irrigation schedules in CROPWAT is
based on the required information prepared by the user which whether can be directly
typed into the software or uploaded from other sources.
2.5.1 CROPWAT Program structure
The program is subdivided into in eight distinct modules, five of which are for data
enter and three for computations. The entry to the modules is through menu in the
tool bar or alternatively using the navigation bar at the left-hand side of the main
view (Allen et al., 1998).
The data entry modules include climate/Eto, rain, crop type (dry crop or rice, Soil
and Crop pattern. The computation modules are CWR, schedules and scheme, for the
calculation of crop water requirement, irrigation schedule and scheme supply,
respectively (Allen et al., 1998).
2.6 Potential environmental impact of irrigation development
The increase of food production by irrigation is considered as a threat to the
environment because of its potential negative effect to the environment. FAO (1994),

30
refer that the practice of irrigation can result in soil erosion; contamination of water
sources through agrochemicals, deterioration of water quality, increase the
concentration of nutrients in the water body which can lead to algal blooms,
proliferation of aquatic weeds and eutrophication in waterways
A poor water management in irrigation systems may turn the water unhealthy for
other users and affect aquatic ecosystems. Furthermore, the proliferation of aquatic
weed in waterways can have negative effect in navigation and ecologic health
consequences as it can abstract the water body surface (FAO, 1997).
Due to the huge amount of water that the large irrigation systems impound or divert
from the river, they are considered likely to cause environmental instability, resulting
from modifications in the limnology and hydrology of the river basins. The decrease
of flow, can cause severe alterations in land cover pattern and ecology resulting in
negative effects such as saltwater intrusion.
The water abstraction for irrigation reduces the amount of water downstream,
preventing other users located downstream to have enough water to cover their
needs. Moreover, the water over-abstraction takes out the water needed for the
dilution of wastes downstream (FAO, 1997).
The practice of surface irrigation is frequently appointed as the one of source of
Salinization and Waterlogging. The last, is mainly a result of poor drainage, water
over-abstraction for irrigation and, to a minor degree, seepage from canals and

31
ditches. Waterlogging concentrates salts in the plants' rooting zone by capillary rise
from the lower soil profile. The accumulation of sodium in soil layers (Alkalization),
is predominantly a harmful form of salinization which is no normally correct (FAO,
1997).
Salinity in irrigation systems mainly result from the application of irrigation water,
watering of saline soils, and rising of saline water table combined with poor soil
dreinage. If the water applied to the soil during the irrigation contain mineral salts,
the salts are laid up into the root zone, since the amount taken up by plants in the
process of evapotranspiration and removed at harvest is quite insignificant (FAO,
1997).
2.7 Strategies to improve the performance of the irrigation System
Despite their obvious contribution for food production to cope with the increasing
world food demand as the result of rapid population growth, the practice of irrigation
has been appointed as a potential threat to the environment due to their low use of
inputs and improved technologies (Faurès et al., 2007).
According to Joneydi (2012), in the strategies to reduce the pressure that irrigation
system has been subjected, various innovative practices are available, which can be
economically viable while time minimizing at the same the environmental burdens
such as misuse of water resources, overuse of energy, waste production and land
deterioration.
32
The suggested innovative practices include better use of the existing production
systems, adoption of new other technologies, improve the farmers management
expertise, modify the current crop patterns to lower the water supply and
consumption, minimize the application of agrochemical products (Joneydi, 2012),
The efficiency use of irrigation water can potentially improve the economic
feasibility of irrigated agriculture and ensure environment protection , without any
need to increase water usage. For such, different types and field tested models for
efficiency use of water are available, yet these are little used by farmers (Faurès et
al., 2007).
2.7.1 An overview of Multi-criteria Analysis (MCA) approach
The central role of MCA is to deal with the difficulties faced by the decision-makers
in handling huge amounts of complex information in a consistent way. The MCA
techniques can be used to identify a single most preferred option, to rank options, to
short-list a limited number of options for subsequent detailed appraisal, or simply to
distinguish acceptable from unacceptable possibilities (DCG, 2009).
2.7.1.1 Key features of MCA
Multi-criteria analysis establishes preferences between options by reference to an
explicit set of objectives that the decision making body has identified, and for which
it has established measurable criteria to assess the extent to which the objectives have
been achieved. In simple circumstances, the process of identifying objectives and
criteria may alone provide enough information for decision-makers (DCG, 2009).

33
One limitation of MCA is that it cannot show that an action adds more to welfare
than it detracts. Unlike CBA, there is no explicit rationale or necessity for a Pareto
Improvement rule that benefits should exceed costs. Thus in MCA, as is also the case
with cost effectiveness analysis, the „best‟ option can be inconsistent with improving
welfare, so doing nothing could in principle be preferable (DCG, 2009).
2.7.2 Steps in Multi-criteria Analysis (DCG, 2009)
1. Establish the decision context. What are the aims of the MCA, and who are
the decision makers and other key players?
2. Identify the options.
3. Identify the objectives and criteria that reflect the value associated with the
consequences of each option.
4. Describe the expected performance of each option against the criteria. (If the
analysis is to include steps 5 and 6, also „score‟ the options, i.e. assess the
value associated with the consequences of each option.)
5. „Weighting‟. Assign weights for each of the criteria to reflect their relative
importance to the decision.
6. Combine the weights and scores for each of the options to derive and overall
value.
7. Examine the results.
8. Conduct a sensitivity analysis of the results to changes in scores or weights
34
CHAPTER THREE
METHODOLOGY OF THE STUDY
3.1 General information
To attain the proposed objectives, this research involved the performance assessment
of the main limiting output and input factors in evaluating whether the irrigation
projects are performing in a sustainable manner or not, in light to recommend
sustainable strategies and practices to improve the management of the system.
Due to the very large area (70,000 ha) of the system, time limitation and resources
constraints, the interview, field survey, and observations were carried out in three
selected irrigations blocks nested to Lower Limpopo irrigation system. The criteria
for selection was based on the current existing irrigation method, the level of
technology (agricultural and irrigation), secondary data availability and the presence
of crops under cultivation during the research period.
The interview focused on the relevant data for the calculation of the proposed
indicators, such as agricultural production, environment sustainability, land size, crop
intensity and level of satisfaction with the water supply services.
3.2 Description of the Study Area
RBL was selected as the study area based on the proximity to an accessible road
during the rainy season, availability of secondary. Moreover, the RBL is very
35
vulnerable to land degradation provoked by low soil infiltration rate and to water
resource pollution due to salt intrusion through Limpopo river and agriculture
nutrients.
3.2.1 Location
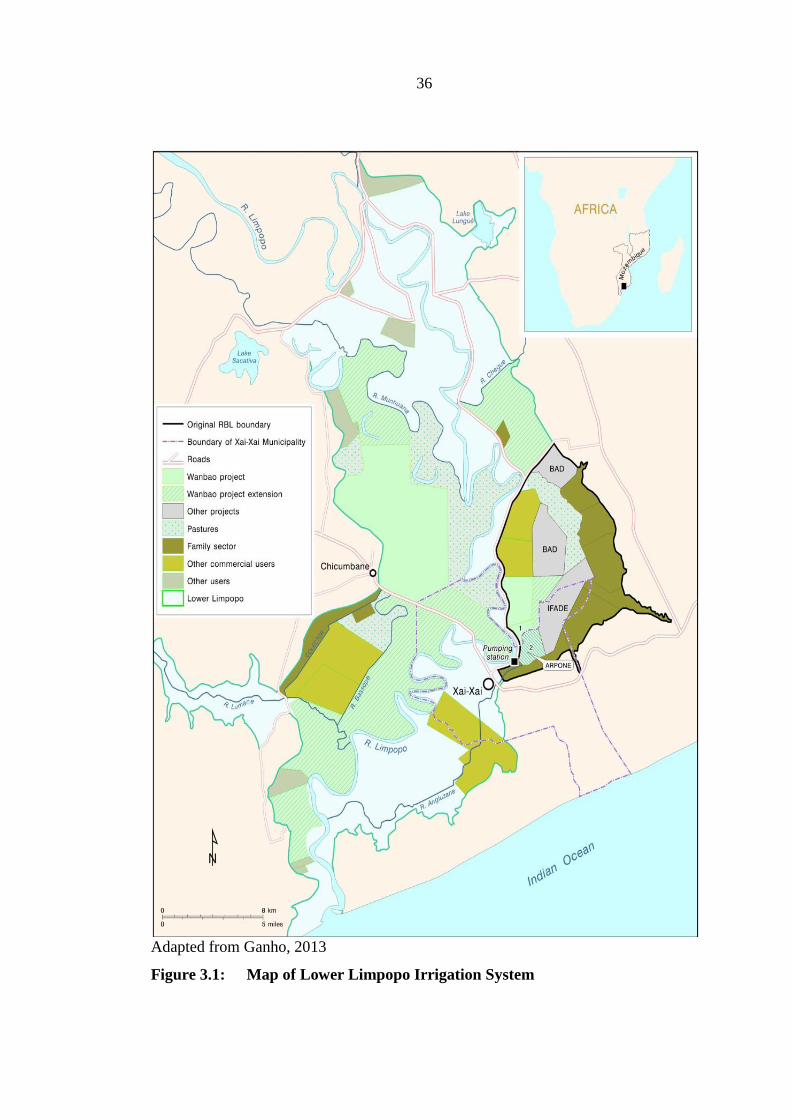
The Lower Limpopo Irrigation system is located in Xai-Xai district, in the southern
Mozambique at about 5 km far from Xai-Xai city. Its area is very close to the
Limpopo river mouth and extends along the alluvial plain of the Limpopo Basin in
the Lower Limpopo region (Ganho, 2013). It is bordered to the west and east by a
sandy plateau (ridge), to the north by the road linking the headquarters of the
Chissano administrative post to Chibuto town, and to the South by the sandy plateau
at the mouth of the Limpopo River to the Indian Ocean (Figure 3.1).
3.2.2 Climate
According to Reddy (1986), the climate of the study area is sub-humid, characterized
by large variations in rainfall throughout the year and between years, therefore with a
rain-fed agriculture low to moderate risk. The average annual rainfall is around 1000
mm, occurring mainly from November to March and the average annual reference
evapotranspiration (Eto) varies between 1200 and 1500 mm. The average
temperatures range from 18.4 °C to 26.4 °C and monthly average relative humidity
(RH) varies between 61% and 69%.
36
Adapted from Ganho, 2013
Figure 3.1: Map of Lower Limpopo Irrigation System

37
3.2.3 Soil
The terrain topography is flat with a very low gradient (almost nil), resulting in a
very slow runoff (locally flooded during the rainy season and partially flooded in wet
years), and the presence of very fine texture, very low permeability and groundwater
table near to the surface. The soil profile is generally very dark color, from dark gray
to black, which is due to the special composition of humus (Marquês et al., 2006).
3.2.4 Land occupation
The land occupation in the irrigation system is according to three different farming
sectors, namely:
(i) Household sector: occupies an infrastructured area of 6000 hectares located at
the interface between the upland zone and the lower zone. This area is potentially
suitable for the production of vegetables and corn, exploring areas ranging from 0.5
to 5 ha, developing subsistence agriculture with poor link with the market;
(ii) Emerging sector: currently occupies an infrastructured area of 540 ha, with
potential for the production of cereals and vegetables, exploring areas ranging from
4-48 ha per household and developing market-oriented agriculture and;
(iii) Commercial sector: occupying an infrastructured area of 9750 hectares located
in the interior areas of irrigated land, directed to the production of cereals, with land

38
size ranging between 450-8000 ha, developing a specialized agriculture with strong
links with the financial market and guaranteed access to credit.
3.3 Data collection
The collection of data was done in collaboration with the Lower Limpopo Irrigation
System Management Company from January to March 2016. During the
reconnaissance survey, the RBL professional staffs, department of agricultural and
meteorological offices and respondents were asked about the general state of the
irrigation system. From the analysis of the information obtained from preliminary
survey, three irrigation blocks were selected for observations.
The criteria for selection were the availability of organizational setup, the level of
technology, farmer categories, proximity to the weather station and the data
availability. The collected data encompasses primary data at field level and
secondary sources, using the following data collection methods: Reconnaissance
visits, semi-structured interviews, direct observation, literature review, field survey
and laboratory analysis. In each selected block for observation, three plots
corresponding water users were chosen from the top; middle and tail in the main
canal.

39
3.4 Methodology based on Objectives
3.4.1 Identification of the main factors affecting productivity and sustainable
water management in Lower Limpopo Irrigation system
To achieve the above objective, the methodology used involved a combination of
descriptive and quantitative. For data collection, a semi-structured interview and
periodic field observations were carried out to survey and examine the distribution
network condition, the water applications methods, agricultural practices, water
sources, labor availability and practices associated with water management
technologies. The interview was split into different categories of interest, namely:
Agronomic, socio-economic characteristics and sustainable agriculture production.
A total of 251 respondents out of 379 were interviewed. The sample size was
calculated using equation 3.1 below (Cochran, 1977), and all the farmers were
randomized in Microsoft Excel (random function), to select the plots to be observed.
Where:
n = the size sample
z= standard error related with the chosen level of confidence (1.96)
p = estimated percentage in the population
q= 100-p
e= admissible sample error (5%)
)1.3.(..............................................................................................................e
)pq(z=n
2
2

40
The data entry was done in MS Excel and SPSS windows, version 16. For data
analysis, the descriptive and analytical statistics were used. The descriptive statistic
function in MS Excel was used for the calculation of frequency, percent, standard
deviation, mean, the coefficient of variation and variance. Factor analysis approach
preceded by Kaiser-Meyer-Olkin and Bartlett tests was used for the identification of
factors affecting sustainable productivity and water management in the system.
3.4.2 Estimation of the overall Lower Limpopo irrigation performance
To achieve the above objective, five groups of relevant comparative performance
indicators (equations 2.1 to 2.10) were used to evaluate and compare the
performance Lower Limpopo Irrigation System. These are water supply, agricultural
output, financial and Environmental indicators. The required data for the calculation
of the selected comparative performance indicators include:
a) The canal capacity to deliver water at head: Was calculated using Hcanales for
windows software, version 2.1. The input data were obtained by field survey
measuring the canal profile using optical topographic level, canal cross section
survey using measuring tape and literature review. These include canal slope, water
depth, canal roughness and canal cross section area. The calculation of canal capacity
in Hcanales is based on the Manning equation, as presented below (equation 3.2).
Q = (1/n)AR2/3
S1/2
..................................................................................................(3.2)

41
where,
Q
=
flow
(m
3/s)
n = Manning coefficient
R = hydraulic radius (m)
S = channel slope (m/m)
A = Wetted are (m2)
b) The volume of water delivered: The total volume of water delivered was
measured using the current meter (Appendix B). The flows in the main canal were
measured two times (at the morning and afternoon) per each observation day for the
determination of the average daily discharges. The mean velocity in a vertical was
measured by the one-point method (WMO, 1994), placing the current meter at 0.6 of
the depth below the water surface.
The velocity for each measurement was obtained from the current meter table by
crossing the revolution from the current meter with the constant in the table. The
revolution per second was computed by dividing the total number of revolution per
total recorded time. The discharges per each measurement event were computed
using the velocity Area method (equation 3.3) and the total amount of water diverted
in each irrigation event (day) were computed by multiplying the discharges by the
total recorded irrigation time (equation 3.4).
Q = V*Aw...............................................................................................................(3.3)

42
Vtotal = Q*ttotal .........................................................................................................(3.4)
Where:
Q =
discharge
(m
3/s)
V = mean velocity
Aw = Wetted area
VTotal = Total volume of water diverted in each complete irrigation event
TTotal = Total time recorded
For measurement of flow in pipes and discharge from pumps (total amount placed in
the conveyance), the ultrasonic Flexim Fluxus F601 flow meter was used. The input
data were the pipe diameter, pipe production material (e.g. PVC, galvanized steel,
cast iron) and pipe thickness (appendix 2). The total amount of water diverted in each
irrigation event (day) were computed by multiplying the flow per unit time by the
total recorded irrigation time.
c) The cost of irrigation Infrastructures: The initial investment costs were
collected from the irrigation system design documents made available by RBL
Management Company. From these data, the present year construction costs were
calculated using the equation 3.5 below. The interest rate was obtained from the
Central Bank of Mozambique (BM, 2016) and final value was obtained by the
computation of the average of the interest rate from January, 01st to April, 01
st, 2016,
corresponding the period of data collection.

43
Present Net Worth (PNW) = (Initial cost / ha)*(1+ r)n..........................................(3.5)
Where:
r is the interest rate, which is taken from the design document and, n is the years
from construction time.
d) Operation and maintenance cost: At MozIndia irrigation block, the cost was
obtained from the farm manager. Since it was not possible to get the operation and
maintenance costs at Wambao and Ponela blocks due to complexity for calculation
since the major part of the costs are paid by the Government and Chinese partner, the
costs of other irrigation schemes presenting similar infrastructures and structural
condition were taken (Molden et al., 1998). Therefore, considering the costs
proposed by FAO (2005) for surface irrigation in Mozambique, the maintenance cost
was found to be approximately US$500/ha per year and the expense for
rehabilitation between US$500 and 1,500/ha, depending on the condition of the
system (the average value of US$1000 was taken).
Moreover, it was found from the farmers records that the amount of money normally
charged by the management company to cover the costs of operation and
maintenance of the main canals was 3000.00 MT, corresponding to approximately
US$66.7 per ha/year.

44
e) Crop water requirement: The net CWR and IR were calculated for each
irrigation block using data collected in 2014/2015 cropping season. The CROPWAT
Computer based program version 8, were used to compute the water requirement for
rice in all the growing stages based on Penman-Monteith equation and dependable
rain (FAO/AGLW formula) for the estimation of effective rainfall. The input data
were the soil type, sowing date, rainfall and temperature data and crop pattern. The
meteorological data were collected from the National Meteorology Institute.
d) Water diverted to the field: To compute the total amount diverted, the volume of
water upstream and downstream of the selected off take was measured using current.
The discharge was computed by calculating the difference between the upstream and
downstream the off-take and the total volume diverted per each irrigation event were
computed multiplying the discharge by the total recorded time.
e) Secondary data: The collected data include total yields, local prices and the
world price of main crops per season, crop patterns, production cost, revenue
generated, crop type and meteorological data. The above-stated data were obtained
from field survey and literature review provided by different Government
Institutions. The climatic data of the nearby weather stations of each irrigation block
were obtained from the National Meteorology Institute and the Irrigation System
design documents were collected from the respective Irrigation System Management
company.

45
e) Laboratory analyses: The Biological Oxygen Demand (BOD), Chemical Oxygen
Demand (COD), sodium, chlorides and nitrates (NO3) were determined at the
National Laboratory of Water and Hygiene. A total of six water samples, being two
per month, were collected for analysis at the pumping stations and drainage system
of each irrigation block at 0.6 depths below the water surface (Shaw, 1994). The
other water quality parameters such as pH, Conductivity, Total dissolved solids and
salinity were analyzed in-situ using portable instruments once per week and three
times per day.
The samples were collected in 500 ml glass container for microbial analysis and in
1500 mm plastic bottle for physical parameters analysis and transported in controlled
temperature in a cool box to the laboratory within 24 hours.
f) Standard Value of Production (SGVP): Was calculated using equation 2.5. The
rice was taken as the base crop and the world price was obtained from the World
Bank Commodity Price Outlook (WB, 2016).
3.5 Data analysis techniques and interpretation
The data analysis and interpretation were mainly concentrated on the calculation of
the selected indicators. The results of each calculated category of indicators for all
the blocks were plotted in MS Excel charts, and comparison was done between
results from different irrigation blocks and within the blocks. Furthermore, all the
results from the indicator calculation were then compared with the standard threshold
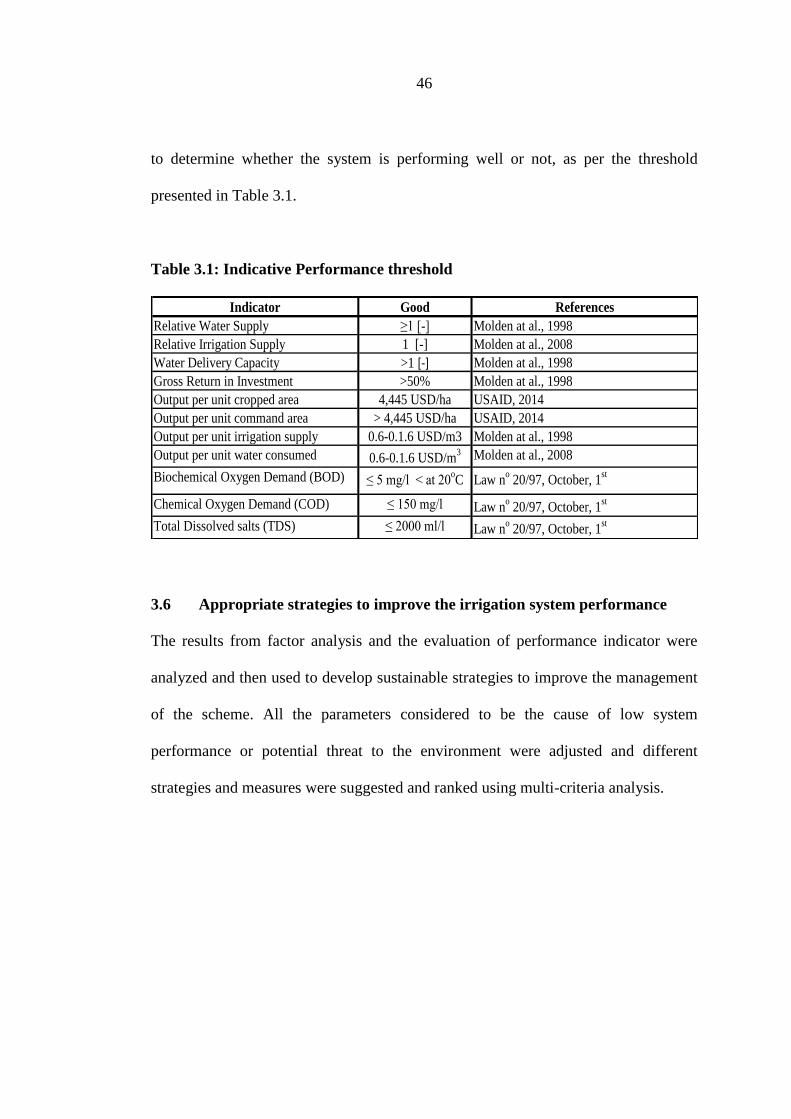
46
to determine whether the system is performing well or not, as per the threshold
presented in Table 3.1.
Table 3.1: Indicative Performance threshold
Indicator Good References
Relative Water Supply ≥1 [-] Molden at al., 1998
Relative Irrigation Supply 1 [-] Molden at al., 2008
Water Delivery Capacity >1 [-] Molden at al., 1998
Gross Return in Investment >50% Molden at al., 1998
Output per unit cropped area 4,445 USD/ha USAID, 2014
Output per unit command area > 4,445 USD/ha USAID, 2014
Output per unit irrigation supply 0.6-0.1.6 USD/m3 Molden at al., 1998
Output per unit water consumed 0.6-0.1.6 USD/m3 Molden at al., 2008
Biochemical Oxygen Demand (BOD) ≤ 5 mg/l < at 20oC Law n
o 20/97, October, 1
st
Chemical Oxygen Demand (COD) ≤ 150 mg/l Law no 20/97, October, 1
st
Total Dissolved salts (TDS) ≤ 2000 ml/l Law no 20/97, October, 1
st
3.6 Appropriate strategies to improve the irrigation system performance
The results from factor analysis and the evaluation of performance indicator were
analyzed and then used to develop sustainable strategies to improve the management
of the scheme. All the parameters considered to be the cause of low system
performance or potential threat to the environment were adjusted and different
strategies and measures were suggested and ranked using multi-criteria analysis.
47
CHAPTER FOUR
RESULTS AND DISCUSSION
4.1 Identification of the main factors affecting productivity and sustainable
water management in Lower Limpopo Irrigation system
Agricultural productivity can be influenced by a number of factors which can
influence it to enhance or decline hence, it is important to note that productivity and
sustainability are not an absolute measure, but rather a measure of the ratio between
inputs and agricultural outputs (Oluwatayo et al., 2008).
4.1.1 Personal characteristics of the farmers
Personal characteristics of the farmers consist of selected seven variables that can
affect sustainable agricultural production in an irrigation scheme. The selected
variables and their details are as per Table 4.1.
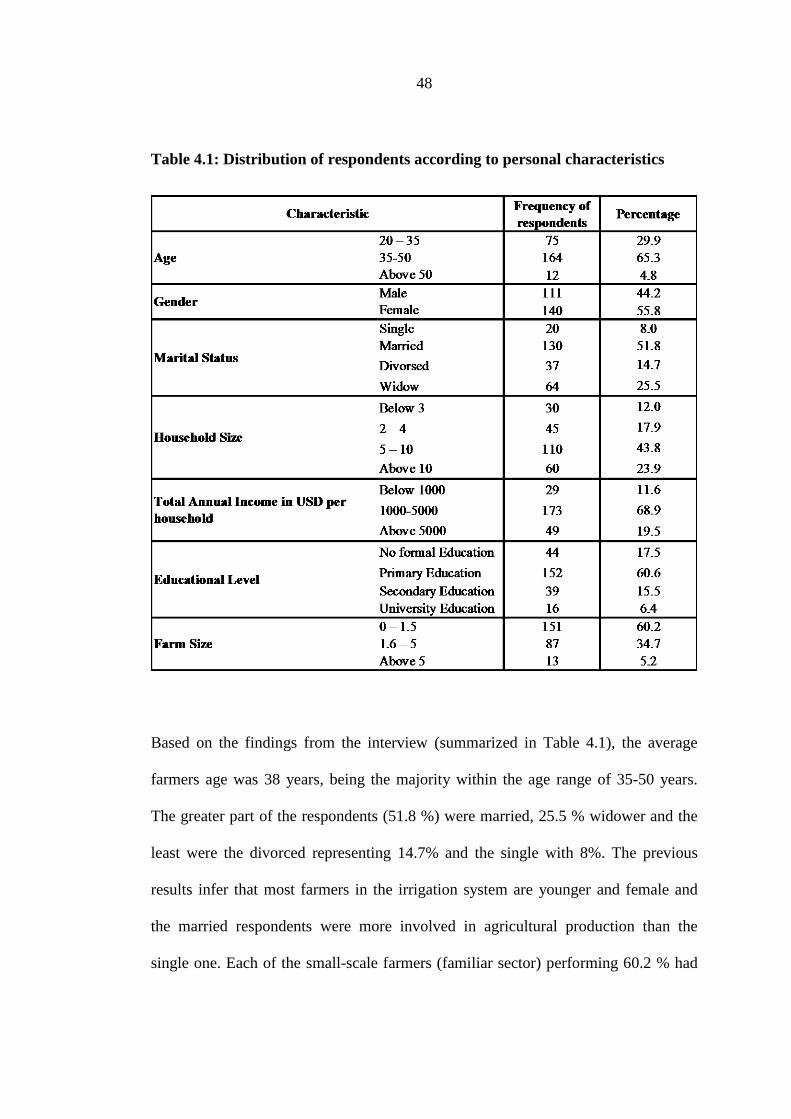
48
Table 4.1: Distribution of respondents according to personal characteristics
Based on the findings from the interview (summarized in Table 4.1), the average
farmers age was 38 years, being the majority within the age range of 35-50 years.
The greater part of the respondents (51.8 %) were married, 25.5 % widower and the
least were the divorced representing 14.7% and the single with 8%. The previous
results infer that most farmers in the irrigation system are younger and female and
the married respondents were more involved in agricultural production than the
single one. Each of the small-scale farmers (familiar sector) performing 60.2 % had

49
an average of 1 ha of irrigated area and 46.3 percent of people has between 1-5
hectare of land and about 34.7 % (emerging sector farmers) devote an average of
four hectare, this infers that majority (60.2%) of the farmer were mainly involved in
subsistence agriculture.
According to Adomi, et al. (2003), the age and the experience of the household head
is of capital importance for the improvement of their holdings productivity and
sustainability as it helps the farmer to build up knowledge of farm practices in
cultivating crops and occurrence of natural phenomena from previous cultivations
experience.
Also, the gender disparity (55.8 % female against 44.2 % male) and the existence of
household headed by widow women (25.5%) can be a constraint for the practice of
sustainable agriculture in the irrigation system, since the gender preconception
toward the right to get land, finance, and education for men tend to reduce the
performance of female households heads in agriculture activities if compared to male
household heads (Endale, 2011).
The high percentage of household with 5-10 persons which is 43.8% of the total
number of respondents if compared with the result of the total annual income per
household which shows that 69.8 % of the household have a total annual income in
the bracket of 1000-5000 USD per household, imply that the annual revenue of the
50
farmers was relatively low and quite insufficient to cover household needs and
running costs of the irrigation system.
4.1.2 Factors affecting sustainable irrigation system productivity and water
management
Agricultural productivity can be defined as the proportion of the total agricultural
income to the total agricultural inputs used in farm cultivation (Oluwatayo et al.,
2008). Historically irrigation has been seen as one of the major factors for increasing
crop productivity, but such depends on various other factors that can cause it to
increase or decrease, hence the importance of analyzing the limiting factors in RBL
irrigation system, as described hereafter.
The Table 4.2, shows the identified variables affecting optimal productivity and
irrigation water management in Lower Limpopo Irrigation system from the
interviewed farmer's perspective and perception. According to the results displayed
in the table 4.2, the inadequate agriculture input (Mean = 4.7, CV = 0.1), poor access
to improved production technology (mean= 4.2; CV = 0.2), yield potentiality (Mean=
4.1; CV = 0.2) and high mechanization cost (Mean = 4.1; CV= 0.19) are the four
most important factors affecting sustainable productivity and water management in
Lower Limpopo Irrigation System. In fact, the use of traditional seed (unimproved
seed), weak use of fertilizer and poor irrigation water management had been
appointed by Marquês (2006), as the major factors constraining productivity in
irrigation systems operated by small-scale farmers in Mozambique. Significant

51
number of small-scale farmer in the Ponela irrigation block reported that some
farmers are still using rice seed variety with maximum potential yield of 4 tons/ha,
prone to pest and disease and long growing period which is very low if compared
with that supplied by Chineses and Mozindia which can achieve a yield of about 12
tons/ha.
The last two values in the Table shows that in farmers‟ perspective the climate
change and variability (Mean = 1.7; CV = 0.27) and flood and drought (Mean = 1.9;
CV = 0.43) has the least effect on optimal productivity and sustainable irrigation
water management. Indeed, the data from different respondents in all the selected
irrigation blocks does not show significant differences between the yield per hectare
obtained per male household heads in compared with that obtained per female
household head.
The other variable in the Table 4.2 such as, access to inefficient marketing (Mean =
3.6; CV= 0.28), inadequate agricultural credit (mean = 3.5; CV = 0.24) and input
availability (Mean = 3.4; CV = 0.25) are other variable that were considered by the
respondents as they can affect considerably the sustainable productivity and
irrigation water management. The other variables, not least, are shown in Table 4.2.

52
Table 4.2: Factors limiting optimal productivity and water management
4.1.3 Factor analysis results
The main objective of performing the factor analysis was to come out with a reduced
set of factors that describe most of the dissimilarity that is observed in the selected
large set of manifest variables. For this regard, a total of twenty-five (25) variables
(Table 4.2) were selected and weighted by the farmer according to their perception
on how each of them can affect the sustainable productivity and water management.

53
The prior step to factor analysis was the calculation of Kaiser-Meyer-Olklin (KMO)
coefficient to examine the sampling adequacy, whether the partial relationship
among items are small and Bartlett's test of sphericity to verify if the correlation
matrix is an identity matrix. According to Kalantari, (2008) if KMO value is greater
than 0.5 it can safely be used in factor analysis and the Bartlett Test of Sphericity
(BTS) must be statistically significant (p <0.05). In the present study, based on the
result displayed in Table 4.3, the KMO coefficient is equal to 0.603 and Bartlett‟s
test is significant at 99% level (Sig= 000) hence, good figures to proceed with the
analysis.
Table 4.3: KMO and Bartlett's Test
Kaiser-Meyer-Olkin Measure of Sampling Adequacy. 0.603
Bartlett's Test of Sphericity Approx. Chi-Square 835
df 325
Sig. 0.000
After checking the suitability of the database for factor analysis, the factors were
extracted using Principal Component Factor (PCF) method and all the extracted
factor were then rotated using Orthogonal Varimax method to achieve significant
factors. Following the rule of eigenvalue (Kaiser criterion) only factors with
eigenvalues value greater than one were extracted, since all those with eigenvalue
less than one contribute very little to explain the variance in the original variables.
The extracted factors are presented in Table 4.4. These extracted nine factors
determine 70.37 % of total variance regarding optimal productivity and sustainable
water management in the overall irrigation system. In summary, these nine factors

54
can validate 70.37% of the factors limiting the productivity and sustainable irrigation
water management in the system. The number of factors was determined based on
the acceptable minimum accumulated percentage of 60% proposed by Hair et al.
(2006).
Table 4.4: Extracted factors with eigenvalues greater than one
Factor
numberName of factor
Total
eigenvalue
% of
Variance
Cumulativ
e %
1 Technological and Knowledge factor 3.84 16.69 16.69
2 Economic factors 2.75 11.94 28.63
3 Institutional and legal factors 1.70 7.41 36.03
4 Crop Factors 1.66 7.23 43.26
5 Social factors 1.46 6.35 49.61
6 Hydological factors 1.27 5.54 55.15
7 Environmental factors 1.24 5.38 60.53
8 Gender factor 1.20 5.20 65.73
9 Soil factor 1.07 4.64 70.37
Table 4.5 shows the rotated loading factors status after removing all the variable with
loading factors less than 0.5 since low values of commonality among a group of
variables is an indication that they are not linearly correlated and therefore should not
be included in the factor analysis (Schawb, 2007).

55
Table 4.5: Variable related to each extracted factor with loading factor
Principal Factor name VariableFactor
Loading
Poor access to extension agents 0.656
Access to improved production technology 0.647
Inadequate agriculture input 0.717
High mechanization cost 0.811
Inefficient marketing 0.691
Inadequate agricultural credit 0.844
Input availability 0.669
High cost of agriculture infrastructures 0.713
Poor quality of irrigation infrastructures 0.668
Poor implementation of policies 0.782Poor participation of farmer in water
management 0.599Absence of water meter and penalties for
water overuse 0.624
Inadequade Crop pattern 0.735
Yield potentiality 0.807
Seed availability and quality; 0.882
HIV 0.692
Level of education 0.560
Land tenure 0.668
Hydrological factors Droughts and floods 0.638
Climate change and variability 0.684
Water availability 0.633
Gender Factors Gender 0.636
Soil Factors Soil erosion and deterioration 0.826
Environmental factors
Social Factors
Econonic Factors
Tehcnological and Knowlogde factors
Crop Factors
Institutional and legal factors
As seen from the Table 4.5, in each extracted PCF, other variable exist with loading
factor greater than 0.5. So, since the aim of carrying out the PCF was to access the
factors explaining better the variance, the variables which their variance cannot be
explained by the main factor were removed in order to increase the amount of total
variance, based on Kalantari (2008) principle. Thus, in the extracted factors
described hereafter, the undesirable variables have been removed and variable with
loading equal to 0.30 and above were used to name the group of factors, as per the
result from the Varimax rotated factor matrix. The results of factor analysis
56
suggested nine factors with a significant effect on productivity and sustainable
irrigation water management in the system, specifically:
Technological and knowledge factors: This set of factors alone explains 16.69 % of
the total variance. In other words, poor technology and farmers‟ knowledge can
cause a decrease of 16.69 % of the productivity and water use efficiency. Poor access
to extension services, deficient access to improved production technology,
inadequate agriculture input are the other critical variables among technological and
knowledge factor.
The impact caused by different technologies adopted in the three observed irrigations
blocks on the increase of productivity per unit land was quite apparent. The examples
are the clear differences of low rice productivity of about 4 tons / ha achieved by the
farmer using conventional production technology if compared with the average of 7-
9 t / ha achieved by the farmer who adopted Chinese technology and about 12 tons /
ha for farmers who adopted the Indian technology. According to a study by USAID
(2014), the low agricultural productivity in Mozambique is derived from of a absence
of improved technologies, use of unimproved seed, and use of traditional cultivation
practices.
Despite the unquestionable increase in the productivity per unit land, based on the
real situation observed on the ground during the research, the small-holder farmer are
not really learning enough in such way that they can implement the technology by
57
themselves in upcoming growing season once almost all the technical activities are
being implemented by Chineses and RBL staff in form of service provider. As an
example, in Wambao block almost 90% of the farmers were not able to tell the cost
and quantity of seed used and the cost of any activity ongoing in their own plot even
how much they pay for water services. Moreover, there is deficient communication
between the Chinese technical team that is transferring the technologies and the
farmer because of the language barrier in between them.
Economic factors: These factors determine 11.94 % of the total variance. The most
outstanding variables of this group are inefficient marketing, inadequate agricultural
credit, high labor cost an input availability. The inefficient marking combined with
inadequate agricultural credit were the main issues raised by the farmer in this group
of factors. Farmers reported that the nearest available large market for vegetable sale
is located in Maputo province, which is about 240 km far from the production area.
This condition was raised as a constraint since is time-consuming and expensive for
small farmers.
Aune and Batiano (2008), stated that a poor development of agricultural markets can
create disproportionality between the input and output prices of agricultural products
which in turn affect the income farmers. Pratap et al. (2008), refer that special
attention is need when it comes to horticultural crops, since because of their
perishable nature; farmers sell them immediately after harvesting to avoid
postharvest losses. Therefore, that until the production reaches the final consumer

58
passes through different intermediaries, resulting in high marketing costs which in
turn reduce the profit margins of the small farmers.
With respect to agricultural credit, the farmers reported that they are only benefiting
by micro-credit from the Government and rarely receive funding from the
commercial banks since they normally do not have the collateral required as the land
cannot be used as collateral. According to National land law, "the land is the property
of the State and cannot be sold or otherwise alienated, mortgaged or encumbered"
(Law nº 19/97, Art. 3). The previous finding is supported by Marquês (2006) in his
previous study in Mozambique, where he found that the absence of land property
rights limits the access of small farmer to credit from commercial banks.
Legal and Institutional factors: It determines 7.41 % of the total variance. In
another sense, by minimizing the effect of these factors we can achieve 7.41 % of the
objectives of increasing productivity and sustainable irrigation water management.
Other variables associated with this factor which can affect productivity and
efficient irrigation water use are the Poor quality of irrigation infrastructures, poor
implementation of policies, the weak participation of farmers in water management,
the absence of water meters and penalties for water overuse. The study results
indicate that the reduced numbers and low qualifications of staff combined with the
low availability of transportation facilities remain a serious constraint for the
irrigation system management company. This scenario is exacerbated by the limited
ability of the management company, to attract and retain qualified extension staff,

59
since the government salary is significantly low if compared with that offered by
other non-Government agencies.
Crop Factors: These factors explain 7.23 % of the total variance. Inadequate crop
pattern, low yield potentiality and seed availability and quality, are other factors in
this group. In his research, Alemu et al. (2008), affirmed that improved seeds can
trigger a significant increase in agricultural productivity if other inputs are
maintained under optimal condition. In Lower Limpopo Irrigation System, the
impact generated by the use of improved rice seed is apparent. The farmers reported
that the increase of their productivity from an average of 4 tons/ha using traditional
seed three years ago, to an average of 7.5 tons/ha in 2014/2015 season when high
yield seed was introduced by Chineses farmers.
Social factors: These factors explain 6.35 % of the total variance. The other
important variables associated with this group are HIV/AIDS, the level of education
and land tenure. The prevalence of the HIV virus in Mozambique is reported by
USAID (2014) as one of the causes for low agriculture productivity as it attacks the
most productive people in the household and lead to the increase in their expense due
to medical costs and other cares.
Although the research results reveals absence of significant difference in the output
per hectare between the educated and non-educated farmers, the difference on know-
how between the two classes, was cleanly noted during the interview. The farmers

60
holding formal education were able to interpret and explain the different phenomena
affecting their productivity more fluently than those with none formal education.
USAID (2014), considered the education as of capital importance in the agrarian
community as it can help the farmers to understand easily the need for adoption of
new technologies and increase the willing to learn new practices.
The other four extracted factor can be seen in details in Table 4.5 and all together
determine a total of 20.76 % of the total variance. These include: Hydrological
factors (5.54 %), environmental factors (5.38 %), gender factor (5.20 %) and soil
factor (4.64 %). The study results show that the majority of female-headed
households have a land size in the bracket of 0.5-1.5 hectares and has low self-
sufficiency if compared with the land size of male headed households which have an
average of four hectares. Therefore, female-headed households cultivate much
reduced areas and have more difficulties to shift to new productive practices and
technologies because they normally have limited labor and financial resources.
The above results are supported by other studies carried out by Collier (2003), which
reported that in Mozambique the rural women is the most deprived group in terms of
economic opportunities and their farming is characterized by low productivity.
Likewise, it was observed that although the research results reported apparent gender
equity in term of land tenure, it was notorious that the division of labor between the
sexes is still being influenced by the local culture, being the men employed off-farm
leaving the day to day farm activities to women.

61
4.2 Estimation of the overall Lower Limpopo irrigation system performance
4.2.1 Overview
For the fulfillment of this objective, the Ponela, Wambao and MozIndia Blocks were
selected as they present differences on technology used, irrigation method and water
sources. The type of crop grown (rice) during the study period was the same in all the
three selected blocks and was taken as the base crop. .
The collected and processed core data in which the calculations of all the
comparative indicators were based are as per the summary in Table 4.6 and 4.7.
Table 4.6: Parameters for calculation of individual project performance
indicators
Table 4.7: SVGP calculation for all the selected irrigation blocks ( year
2014/2015)
Irrigation
Block
Irrigated
cropped
area (ha)
Irrigated
command
area (ha)
Yield
(t/ha)Yield (t)
PWorld
(USD/ton)
SGVP
(USD/year)
(1) (2) (3) (4) 5= (2x4) (6) (5X6)
Wambao 3300 8300 7.5 24750 370.48 9,169,380.00
Ponela 28 360 4.0 112 370.48 41,493.76
MozIndia 25 60 9.0 225 370.48 83,358.00
Note: Pworld is the World price obtained from World Bank, 2016 for the base crop (Rice)

62
4.2.1 Water Supply Indicators
This category of indicators describes the individual system with respect to the ratio
between water supply and demand. The results provide the condition of water
abundance or scarcity in the area and establish the relationship between supply and
demand (Molden et al., 1998). The indicators are as per the Figure 4.1.
0.0
1.0
2.0
3.0
4.0
5.0
6.0
Wambao irr. Block Ponela irri. Block MozIndia irri. Block
5.4
3.5
4.2
2.75
1.932.23
m3
/ha
Water supply Indicators
Relative Water Supply (m3/ha)
Relative Irrigation Supply (m3/ha)
Figure 4.1: Water supply indicators
The results in Figure 4.1 show that the values of the water supply indicators (RWS
and RIS) in all the blocks are higher than one, this indicates the abundance of water
in the system during the study period. Molden et al. (1998), recommend values of
RIS close to one rather than values higher or lower than one. Hence, high values of
RIS in all the observed blocks indicate that excess irrigation water was being
supplied.

63
Likewise, the results indicate that RWS values are greater than RIS which is an
indication that there was a substantial contribution of rainfall to the water supply for
agriculture in the area. It is important to note that the irrigation efficiency in all the
blocks is very low, meaning that more than irrigation demand is being supplied. The
RIS values vary from 1.93 to 2.75 which gives an indication of irrigation efficiency
in the bracket of 36% at Wambao irrigation block to 52% at Ponela irrigation block.
The low irrigation efficiency at Wambao Irrigation Block may be due to two main
reasons: (1) all the canals (main and secondary) are not lined and some of the
secondary canals are not well maintained as the maintenance activities are of sole
responsibility of the farmers and, (2) there is no strict control of water leak from the
flooded plots to the drainage ditch by the farmers.
Contrary, the irrigation efficiency in Ponela irrigation Block is reasonable and the
main reason is the fact that all the distribution system is piped, minimizing in that
way the water losses during the transportation. Likewise, the low irrigation efficiency
may also be attributed to the fact that almost all the observed irrigation block are
lacking discharge control structures leading to a weak capacity of farmers to have
adequate control on efficient water application. The results found are similar with
those found by Marquês (2006) in which he reported an irrigation efficiency of 40 to
50 % for small scale irrigation system in Mozambique.

64
4.2.3 Canal Delivery Capacity indicator
The water delivery capacity ration explains whether the conveyance system is
somehow a limitation to cope with the crop water demand at the pick period. Values
of WDC above one indicate that channel capacity is capable to meet the water
demand at the pick period. A ratio of WDC very close is sign that the canal may not
deliver enough water at the pick period to satisfy the short-tem demand.(Molden et
al., 1998). The indicator for irrigation infrastructure is per the Figure 4.2.
0.00
0.50
1.00
1.50
2.00
2.50
3.00
3.50
Wambao irr. Block
Ponela irri. Block
MozIndia irri. Block
1.43
0.99
3.09
%
Water Delivery Capacity (%)
Water Delivery Capacity (%)
Figure 4.2: Water Delivery Capacity indicator
The values of WDC in Figure 4.2, show that at Wambao and MozIndia irrigation
blocks the conveyance has enough capacity to deliver the necessary peak water
demand (WDC > 1), this mean that the canals carrying capacity in this two irrigation
blocks are not constrain. But in the Ponela block, the WDC value is less than one
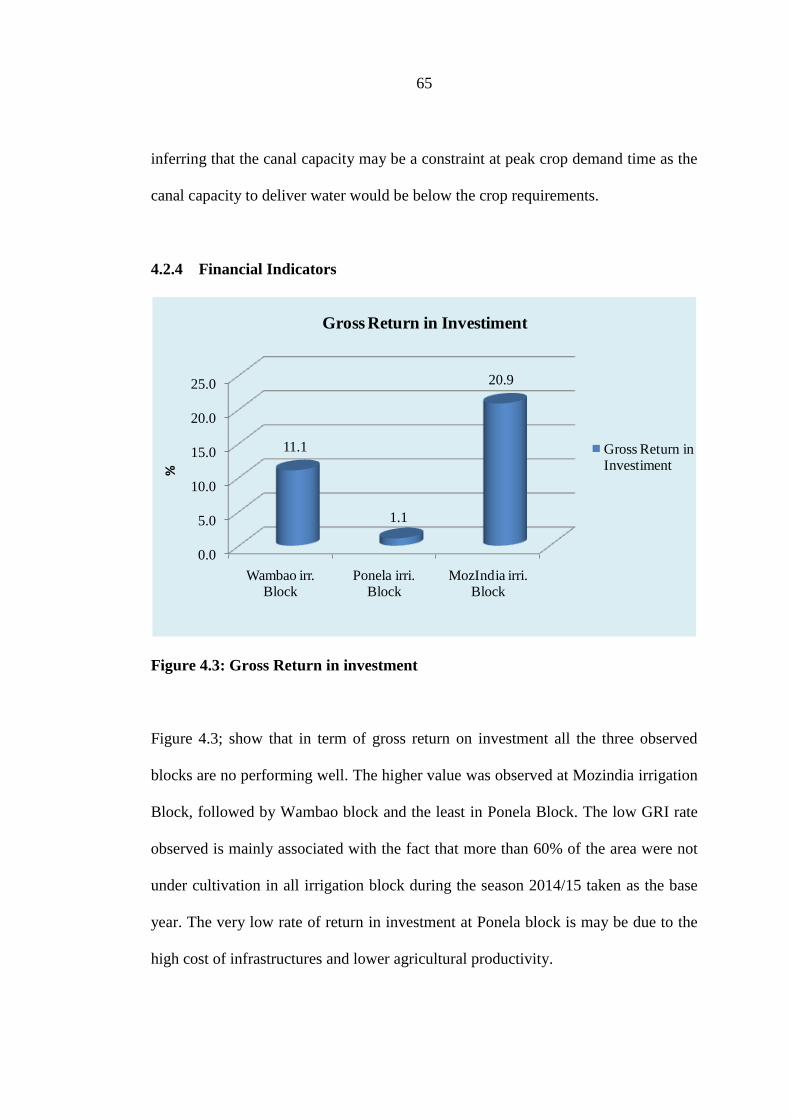
65
inferring that the canal capacity may be a constraint at peak crop demand time as the
canal capacity to deliver water would be below the crop requirements.
4.2.4 Financial Indicators
0.0
5.0
10.0
15.0
20.0
25.0
Wambao irr. Block
Ponela irri. Block
MozIndia irri. Block
11.1
1.1
20.9
%
Gross Return in Investiment
Gross Return in Investiment
Figure 4.3: Gross Return in investment
Figure 4.3; show that in term of gross return on investment all the three observed
blocks are no performing well. The higher value was observed at Mozindia irrigation
Block, followed by Wambao block and the least in Ponela Block. The low GRI rate
observed is mainly associated with the fact that more than 60% of the area were not
under cultivation in all irrigation block during the season 2014/15 taken as the base
year. The very low rate of return in investment at Ponela block is may be due to the
high cost of infrastructures and lower agricultural productivity.

66
The reported GRI rates, infer that in the line that the rice is being produced at Ponela
irrigation block is not profitable and may not cover the investment costs on
infrastructures within the useful life of the system.
The results found in this study are similar with those reported by Molden et al.
(1998), where the GRI of rice-based irrigation systems in Burkina Faso were low,
ranging from 6% to 30%.
Self-sufficiency Indicator (SSF)
The financial self-sufficiency indicator is the measure of how much the farmer can
pay for themselves the cost of irrigation operation and maintenance without an
external help, whether from the government or non-Government partner.
0.0
20.0
40.0
60.0
80.0
100.0
120.0
Wambao irr. Block
Ponela irri. Block
MozIndia irri. Block
6.713.4
110
%
Financial Self-sufficiency indicator
Financial Selt-
Suficiency
Figure 4.4: Self-Sufficiency indicator

67
As depicted in Figure 4.4, the financial self-sufficiency value was between 6.7 % and
110 %. The lowest SSF was observed at Wambao, followed by Ponela and the
highest was observed at MozIndia irrigation block. Values of SSF below 100 % at
Wambao and Ponela irrigation blocks indicate that the fees collected from irrigation
are not capable of covering the operation maintenance costs. According to Molden
(2010), the lack of capacity to cope with running expenses is one of the major
concerns for the sustainability of many irrigation systems in Africa.
Indeed, it was observed in the two irrigation blocks with low SSF values that the
irrigation system operation and maintenance costs are highly subsided by the
Government and partners and the farmers are only paying for water supply services a
symbolic value of 3000 Mt, approximately 67 USD/ha per season. This scenario
becomes even more dramatic if considering the fact that the water rates are not paid
depending on consumption, but rather per unit land, exacerbating the low farmer‟s
willingness to pay for the improvement of water application efficiency and adoption
of water saving technologies.
4.2.5 Land Productivity indicators
There are two selected indicators in this category. The first indicator the output per
cropped area explain the response of the area under cultivation on producing the
gross return and the second, the output unit command area, specify the average return
of each designed command area.

68
-
500
1,000
1,500
2,000
2,500
3,000
3,500
Wambao irr. Block
Ponela irri. Block MozIndia irri. Block
2,779
1,482
3,334
1,105
115
1,389
US
D/h
a
Land Productivity indicators
Output per unit cropped area
($/ha)
Output per unit comand area
($/ha)
Figure 4.5: Land productivity indicators
As per the Figure 4.5, the MozIndia Irrigation Block has the highest output per unit
command (1,389.00 USD/ha) area followed by Wambao irrigation Block (1,105.00
USD/ha) and the lowest was recorded in Ponela irrigation Block (115.00 USD/ha).
Likewise, the graph shows that all the irrigation block has significantly higher output
per unit cropped area than the output per command area, which is an indication of
cropping intensity less than one in all the blocks.
In fact, it was observed during the data collection that the area with infrastructure
under cultivation in 2014/2015 season was only 40 % at Wambao block, 7.8 % at
Ponela block and 19 % in MozIndia. The farmers reported that are not cultivating all
their area because of financial constraints to pay for the land preparation and
acquisition of agricultural inputs. The farmers also appointed the cyclic occurrence

69
of floods caused by climate variability as one of the causes for the very low cropping
intensity. If comparing the 6.8 tons/ha average productivity of the overall Lower
Limpopo irrigation system with the 2.5 to 4 ton/ha national average for paddy rice
(USAID, 2014), it can be stated that irrigation system is performing well in term of
land productivity.
4.2.6 Water Productivity Indicators
0.00
0.10
0.20
0.30
0.40
0.50
0.60
Wambao irr. Block Ponela irri. Block MozIndia irri. Block
0.100.08
0.19
0.40
0.19
0.52
US
D/m
3
Water Productivity indicators
Output per unit irrigation
supply ($/m3)
Output per unit water
consumed ($/m3)
Figure 4.6: Water Productivity Indicators
From the Figure 4.6, MozIndia Irrigation block has higher values of output per unit
water consumed (0.52 USD/ha) than Wambao (0.4) and Ponela (0.19) irrigation
blocks. This means that each unit of water applied in the field generated more yields
at MozIndia irrigation Block followed by Wambao and the least was Ponela
irrigation block. In other words, at MozIndia irrigation block the water was used

70
more efficiently from the economic point of view than in other two irrigation blocks.
Also, it is shown in the same graph that, in all the irrigation Blocks, the output per
water consumed is higher than output per irrigation supply. According to Molden et
al. (1998), this is an indication that significant part of the water applied through
irrigation was unproductive.
The differences in water productivity among the observed blocks should be
explained by the level of technology used in each block, which differs from one to
another and influences the water use by the crop. Taking as an example, at Wambao
block, the farmers are benefiting from a technology transfer package, which include
cautious soil leveling, use wet soil tillage technologies; use of improved seed and
high-yield varieties, and use of pre-germination technology which contribute to
improve the crop efficiency on water use while the farmers from Ponela Block are
still producing in unleveled soil, use of dry tillage and use of traditional seed.
4.2.7 Environmental Performance
The water quality parameter for the determination of loadings entering each
irrigation block were measured at the pumps delivery of each irrigation block and for
the load from the irrigated area to the drainage system, the water quality parameters
were measured at the point where the irrigation water leaves the drainage system,
immediately before entering into the river. The results of water quality are as per the
Table 4.7.

71
4.2.7.1 Irrigation Water Quality
The observation of water quality was considered to be of capital importance as is
proved that all the available irrigation water contain dissolved chemical substances
that may reduce the crop productivity and decline soil fertility (FAO, 1994).
According to the results in table 4.8 aforesaid, the quality of the water may be a
threat to land degradation and water body pollution if restrictive measures are not
observed considering the fact that the observed values are above the minimal
recommended for an unrestricted use of irrigation water.
Based on the potential irrigation problems and crop tolerance to salt, FAO (1994)
recommend the following values for unrestricted use of water for irrigation:
Chlorides (< 192 mg/l), Electric Conductivity (< 700 μS/cm ) and Total Dissolved
Solids (<450 mg/l) therefore, the recommended values are lower than those observed
in the field.
Table 4.8: Results of Water quality parameters
Receiving
Medium
(Max. Limit)
Intake Outlet Intake Outlet Intake Outlet Standard
pH _ 7.29 6.95 6.69 7.2 6.94 7.15 6.5-8.5
Conductivity μs/cm 1984 9000 976 3274 1025 3285 2500
COD mg/l O2 18 6.5 8.2 26 9.3 27 150
BOD mg/l O2 14 5 6 20 8 22 5
Chloride mg/l Cl 361.59 3332.3 191.43 219.79 239.3 274.74 336
TDS ml/l 1587.2 7200 780.8 2619.2 820 2628 2000
MozindiaObserved
ParameterUnity
Irrigation block
Wambao Ponela

72
4.2.7.2 Irrigation impact on the Environment
The evaluation of the possible irrigation impact on the environment is indispensable
because the practice of irrigation activities normally represent a modification of the
natural state of the environment, by diverting water from a source, addition of water
to areas where there was not any before, transfer and dispose of water. The condition
of the water being released to the environment from the irrigated areas and the
respective maximum recommended value are as per the Figure 4.7.
100 100 100
992
360
100 100
400
100131
100 100
440
100131
0
100
200
300
400
500
600
700
800
900
1000
1100
pH COD (mg/l) BOD (mg/l) Chloride (mg/l)
TDS (mg/l)
% a
bo
ve
th
e m
ax
. li
mit
Water Quality parameters in the outlet of the Drainage System
Wambao Outlet
Ponela Outlet
MozIndia Outlet
Max. LimitFor receiving medium
Figure 4.7: Water quality in the drainage system outlet
The Figure. 4.7, show that for all the irrigation blocks the water discharged into the
river contain values of TDS above the maximum limit recommended for effluent
discharge to the receiving medium in Mozambique. The results in Table 4.7, show
negative differences between the concentration of TDS in the water from the source
and the water from the drainage system, mainly in Wambao irrigation block.

73
According to FAO (1994), the increase of salts concentration in the drainage water is
an indication that there is another source of salts apart the irrigation water. The high
concentration of suspended solids in the drainage if compared with the water at the
intake point, may be originated from the (1) accumulated salts in the root zone due to
increased rates of leakage and poor drainage or (2) from water table rise caused by
excess irrigation and poor water management in the system. The discharge to the
river of untreated water with high concentration of salts may be a serious threat to
biodiversity as it can cause pollution to the previously fresh water, reduce biota
habitat (both land and water) and reduce the agricultural productivity.
As shown in Figure 4.7, the concentration of Biological Oxygen Demand is out of
the recommended standard values for effluent discharge to the receiving medium in
Mozambique, both at the intake from the river as well at the outlet in the drainage
system. FAO (1994) state that the discharge of effluent with high BOD into the fresh
water body may be harmful to the environment by affecting negatively the aquatic
life as it can accelerate bacterial growth and reduce the oxygen levels to the extent
that it may diminish to levels that are lethal for most aquatic organisms.
According to UNEP/FAO/PAP (1988), the not well-planned intensification of
irrigation activities in lower Limpopo valley is a threat to water quality as it reduces
considerably the amount of water released in Massingir dam, for “pushing” saline
water back to the ocean, thereby allowing the salt water to flow into the river. The
same source indicates that the salt intrusion in the Limpopo river mouth is one of the
74
main causes of salinization, which in dry years can affect area located up to 80 km
from the river outlet and cause the water to be unfit for irrigation (FAO, 2004).
4.2.8 Determination of overall system performance
After calculation and analysis of the various indicators individually, the indicators
were combined to derive one composite indicator for each category of performance
indicators, namely; one indicator for land productivity, one for water productivity,
one for water supply, one for finance and one environmental indicator. By so doing,
the various indicators were combined and weighted, considering each indicator to be
of equal importance.
For the assignment of value to each set of indicators, the indicator below or above
the threshold method was used to calculate the distance from the computed value to
the threshold or optimal value (OECD, 2008). An indicator that was significantly
equal or significantly above the threshold was considered to have a positive or
negative influence on the composite depending on the nature of indicator.
After weighing the value for each indicator were normalized and calculated the
overall performance indicate. The indicators with positive effect were maximized
and those with negative effect minimized. The overall system performance was then
obtained by the computation of the average of weighted values from each irrigation
block. The results are as per the in Table 4.9.

75
Table 4.9: Overall system Performance Index
EnvironmentLand
productivity
Water
productivity
Water
suplyWDC GRI
Wambao 0.1117 0.0663 0.0600 0.0606 0.1667 0.0238 0.49
Ponela 0.1300 0.0130 0.0267 0.0863 0.1650 0.0039 0.42
MozIndia 0.1300 0.0694 0.0783 0.0748 0.1667 0.0413 0.56
0.49Overall System Performance
Irrigation
Block
Weight per Indicator category
Performance
Index
According to result in Table 4.9, the overall system performance is not satisfactory
having performance index below 49%. The Gross Return in Investment and Land
productivity are the indicators with least values. As explained previously, the low
values of this two indicators can be justified by the existence of an otiose area in all
the irrigation blocks.
4.3 Strategies to improve Irrigation System performance.
The adoption of the following proposed strategies will contribute to the reduction of
the poor state of irrigation water management, improve agricultural productivity (in
relation water and land) and minimize the hazard impact of irrigation to the
environment. The strategies were developed from the Multi-criteria analysis (MCA)
for the improvement of Lower Limpopo irrigation system performance and were
ranked as follows:
4.3.1 Legal and Institutional aspects
The main institutional limitation in improving agriculture productivity among the
farmers is related to the fact that the water rates in almost all the irrigation blocks are

76
based on the cultivated area rather than on the volumetric consumption. For example,
the water rate in Wambao irrigation block is charged at MT3000/ha (≈67 USD/ha)
per annum. Furthermore, the farmer using water carelessly are not faced with an
additional cost, since the water use rights in the system are not clearly established.
Therefore, the proposed strategy meant to build up motivation among water users
managing badly the irrigation water through the implementation of volumetric water
rights and penalties with the proportional tax for each excessive unit of water
diverted from the canal.
Other measures identified for this category include reduction of irrigation subsidies
and introduction of water saving pricing and establishment of water user associations
to improve the participation of farmers in water management activities.
4.3.2 Economic aspects
During the data collection it was reported that the smallholder farmers are extremely
financially constrained. The restriction to credit access generally lead to the
reduction or totally not use of inputs such as chemical fertilizers, high-yielding seed,
and mechanization what in turn lead to low agricultural productivity?
Although there are a considerable number of farmers benefiting from a technology
transfer program with financing package included, at Wambao and Ponela irrigation
blocks, a huge part of the targeted farmer still continue showing weak self-
sufficiency with a little or total inability for self-financing if the funding package
77
ends. Thus, the proposed strategy to revert the above-stated scenario is based on the
reduction of farmer dependency on Government donation or credit for their
sufficiency. This will be achieved through the introduction of self-sufficient
household graduation program which must include prior training package on
business management and improved crop production technologies.
This means those farmers that are benefiting from credit or donation from the
Government have to be intensively trained in such way that after a given period of
time they become self-sufficient and stop receiving funding or credit from the
government. A household may be considered self-sufficient if the beneficiary is able
to cover all the production costs after adopting a new improved crop production
technology and fulfill its food needs for 12 months in the absence of funding or
credit from the Government.
4.3.3 Technologic and agronomics aspects
Having in mind that the different agricultural practices and technologies adopted in
the observed blocks such as full dependency on chemical fertilizer and pesticides are
being harmful to the environment, the strategy proposed hereafter aim to ensure
optimum production in an economical and sustainable sense. Thus, to ensure an
sustainable increase in land and water productivity, the adoption of Integrated
production and Pest Management (IPPM) concept has been seen as the most viable
strategy.
78
The strategy must be implemented through farmer field School learning process
having as the target the creation of capacity in farmer so that they can reduce their
dependence on agrochemicals, reduce the costs of production and increase
productivity, stabilize their yields, safeguard their health and Protect the
environment.
4.3.4 Managerial aspects
This strategy mainly aims to enhance water productivity by increasing the water
application efficiency. As observed on the field the actual practice consist on
flooding the field maintaining a water layer ranging from 5-20 cm height, which
leads to very high water abstraction, low irrigation efficiency, and land degradation
through salt accumulation in the crop root zone. Thus, the proposed strategy consists
on the reduction of the current water layer of about 5±20 cm to the condition of soil
saturation or at least to 2.5 cm depth. A study by Johnson (1965), show results of
experiments in which plants subjected to a water depth of 2.5 cm produced 5% more
than those whose layer height was greater than 10 cm and states that the deep water
inhibits tillering.
Other proposed measure include better irrigation scheduling based on actual crop
water requirement, oriented water saving tillage, new technologies of soil preparation
and continued on-farm training using Farmer Field School approach.

79
4.3.5 Socio-cultural aspects
As seen in the factor analysis, one of the main constraints for water productivity
improvement by the smallholder farmers which are simultaneously poor, are the lack
of knowledge and ability to adopt the technologies needed. The Poor knowledge
about new irrigation technologies, exacerbated by limited know how about markets,
deficient marketing strategies, cultural barrier and reduced labor due to HIV/AIDS,
prevent the small scale farmer from adopting high productivity irrigation
technologies.
So, being the socio-cultural acceptance the most important pre-requisite for new
technologies adoption, these socio-cultural barriers preventing farmers from adopting
water saving technologies must be removed from the mind of farmers through the
introducing literacy programs, recycling of drainage and tail water, continuous
training and advocacy.
4.3.6 Cross-cutting issues
The strategy in this session will address issues related to gender, HIV/AIDS, lack
information and environmental conditions which were considered complex and
challenging the ability certain population subgroups to address with the presence of
threats to their well-being. The most highlighted factors by the farmers during the
research was related do gender and HIV issues. Thus, to enhance the agriculture
productivity and sustainable water management the effort must be on building the
capacity of farmers, improving the ability of women to negotiate the access to land,

80
credit, improved inputs, extension services and her participation in decision-making
processes. Likewise, to motivate women participation in profitable productive sectors
and decision-making process, there is a need of lifting social barriers and remove
social and cultural biases that limit the women participation in wide range of social
and economic roles.

81
CHAPTER FIVE
CONCLUSIONS AND RECOMMENDATIONS
5.1 Conclusions
Performance assessment and description of three different irrigation blocks nested to
Lower Limpopo irrigation system were carried out based on comparative
performance indicators and environmental performance indicators. The agricultural
productivity was characterized by being variable from one block to another due to
several factors that influence crop production in each irrigation block. Thus, the
evaluation and comparison of the selected blocks helped to perceive the weaknesses
and strengths of these irrigation blocks in term of agricultural productivity and water
management. The following are the main conclusions from the study:
Due to their economic and social dependence, the peasant woman is relegated
to further vulnerability and its position in the decision-making process is
reduced. Therefore, they have low capacity to negotiate aspects of access to
extension services and technologies, land tenure, production of cash crops,
credit and markets.
From farmers‟ perspective, the main factors affecting productivity can be
grouped into nine categories. These include technological and knowledge
factors, economic factors, Institutional and legal factors, crop factors, social
factors, Hydrological factors, environmental, gender and soil factors.

82
MozIndia irrigation block is the most productive block, depicting high value
of SGVP, being the reason the use of improved input combined with good
irrigation water management. The productivity at Ponela irrigation block is
lowest (1,482.00 USD/ha) as compared to MozIndia (3,334.00 USD/ha) and
Wambao (2,779.00 USD/ha) irrigation blocks. The low productivity at Ponela
is due to using of traditional production methods, low use of input and use of
low yield seed.
The highest gross return on investment rate was observed at MozIndia
irrigation block followed by Wambao and the least was at Ponela Irrigation
block. The very low GRI rate at Ponela block is due to the observed low
productivity per unit area which was 4.5 tons/ha against 9 tons/ha at
MozIndia block and 7.5 tons/ha at Wambao irrigation block.
It has been noticed during the study that the yield increases per hectare come
at the cost of environmental and miss use of irrigation water. The yield
increase is mainly obtained by intensive use of heavy machinery for land
preparation, use of inorganic fertilizers and pesticides and misuse of irrigation
water, practices which are already threatening the environment health.
The high Relative Irrigation Supply ratio indicates that the irrigation
efficiency in all the irrigation blocks is in the bracket of 30 to 52 %, which
coincides with those obtained from the secondary data. The highest value was
observed at Ponela block and the lowest at Wambao irrigation block. The

83
Relative Water supply (RWS) values are greater than one indicating that there
the supply was generous if compared to the demand throughout the seasons.
5.2 Recommendations
The current productivity per unit area is good if compared to a national
average for the base crop (rice) however, the sustainability is threatened
unless institutional strategies are put in practice to motivate farmer for an
adoption of water saving practices. Thus, is recommended to the system
management company to find out mechanism to ensure the sustainability. of
the irrigation system.
To motivate farmer to adopt water saving practices, the water pricing and fees
should be based on the total volume of water consumed per each farmer. For
such, the preliminary work should be the construction of hydraulic discharge
metering structures in the entire irrigation block.
The overall irrigation efficiency is considerable low (approx. 44 %) due to
huge losses in the conveyance system, and poor water management by the
farmers. Therefore, it is very recommended to lined all the conveyance
system or construct them by concrete and the introduction of water saving
oriented practices.
To minimize the effect of cross-cutting issues, a participatory program for
capacity building and training in agriculture, agro-processing, and

84
entrepreneurship for the youth, which should account for the differentiated
needs of young girls and boys must be designed. The program must clearly
develop strategies to motivate women participation and remove gender bias
and socio-cultural barriers with relation to women and those affected by
HIV/AIDS.
The system management company (RBL, EP), must design strategies to avoid
direct discharge of polluted water from irrigation into the river. Constructed
wetland may be the most economic and environmentally viable alternative.

85
REFERENCES
Adeoti, A.I., Cofie, O. and Oladele, O.I. (2012). Gender analysis of the contribution
of urban agriculture to sustainable livelihoods in Accra, Ghana. Journal of
Sustainable Agriculture.
Adomi, E.E., Ogbomo, M.O. and Inoni, O.E. (2003). Gender factor in crop farmers‟
access to agricultural information in rural areas of Delta State, Nigeria.
Aggelopoulos, S., Mamalis, S. and Soutsas, K. (2011). Farmers‟ satisfaction with
agricultural credit: The case of Greece, Food Economics-Acta Agriculture
Scandinavica.
Alemu, D., Mwangi, W., Nigussie, M. and Spielman, D.J. (2008). The maize seed
system in Ethiopia: challenges and opportunities in drought prone areas.
Africa Journal of Agricultural Research.
Allen, R.G., Pereira L.S., Raes, D. and Smith, M. (1998).Guidelines for computing
crop water requirements. Food and Agriculture Organization of the United
Nations: Irrigation and Drainage paper 56, Rome, Italy. 1998.
Amaral, H. and Sommerhalder R. (2004). The Limpopo River Basin-Case Study on
Science and Politics of International Water Management. ETH-Zurich,
Switzerland.
Asfaw, A. and Admassie, A. (2004). The role of education on the adoption of
chemical fertilizer under different socio-economic environments in Ethiopia.
Agricultural Economics.
86
Aune, J.B. and Bationo, A. (2008). Agricultural intensification in the Sahel-The
ladder approach.
Bingen, J., Serrano, A. and Howard, J. (2003). Linking farmers to markets: different
approaches to human capital development. Food Policy, 28,
BM (2016). Taxas de Juro Medias Mensais.
[http://www.bancomoc.mz/fm_MercadosMMI.]. Site visited on 01/05/2016.
Bos M.G., Wolters W., Drovandi, A. and Morabito J.A. (1991). The Viejo Retamo
secondary canal-performance evaluation (case study).Mendoza, Argentina.
Irrigation and Drainage Systems.
Bos, M.G. (1997). Performance indicators for irrigation and drainage. Irrigation and
Drainage Systems.
Brito, R., Famba, F., Munguambe P., Ibraimo, N., and Julaia, C. (2009). Profile of
the Limpopo Basin in Mozambique, a contribution to the Challenge Program
on Water and Food Project 17.
Burton, R.J.F. (2013). The influence of farmer demographic characteristics on
environmental behavior.
Camara, M., Diakite, M., Gerson, K.K. and Wang, H. (2011). Impact Assessment of
Women Farmer Activity on Poverty Reduction and Food Security: A Case of
Kindia Region/Guinea. Journal of Agricultural Science.
Cochran, M. (1977). Sampling techniques. Third edition, New York, 1977.

87
Collier V.B. (2003). Gender Profile in Mozambique: Analysis and Action Plan for
the New Strategy.
Crawford, E., Kelly, V., Jayne, T.S. and Howard, J. (2003). Input use and market
development in Sub-Saharan Africa: an overview. Food Policy.
Dastane, N.G. (1974). Effective rainfall in irrigated agriculture. FAO Irrigation and
Drainage Paper 61: Food and Agriculture Organization, United Nations.
DCG (2009). Multi-criteria analysis. Department for Communities and Government:
London
DNA (1999). Water Resources of Mozambique-synopsis 1999. Ministry of Public
Works and Housing. Cooperation Portugal. Maputo, Mozambique.
Endale, K. (2011). Factors constraining the production of traditional exportable
agricultural products in Ethiopia. Volume III, edited by G Alemu W
Gebeyehu. Addis Ababa.
FAO (1989). Guidelines for Designing and Evaluating Surface Irrigation System:
Food and Agriculture Organization. Irrigation and Drainage Paper. No. 45. Rome.
FAO (1994). Water quality for agriculture. Food and Agriculture Organization of the
United Nations Rome, 1994.
FAO (1997). Irrigation potential in Africa. Organization of the United Nations: FAO
land and water bulletin 4, Rome, Italy.

88
FAO (1999). Poverty reduction and irrigated agriculture. Food And Agriculture
Organization of the United Nations: IPTRID: Issues Paper No.1, Rome, Italy.
FAO (2002). Agronomic Aspects of Irrigated Crop Production. Food And
Agriculture Organization of The United Nations. Sub-Regional Office for
East and Southern Africa. Harare.
FAO (2004). Drought impacts mitigation and prevention in the Limpopo River
Basin. A situation analysis. Food And Agriculture Organization of The United
Nations: Sub-Regional Office for East and Southern Africa. Harare
FAO (2005). Mozambique Country Profile. Food and Agriculture Organization of
the United Nations, Rome.
FAO (2014). Building a common vision for sustainable food and agriculture
principles and approaches. Food And Agriculture Organization Of The
United Nations. Rome, 2014.
FAO (2015). Regional Overview of Food Insecurity Africa. Food And Agriculture
Organization of the United Nations: African food security prospects brighter
than ever, Accra.
Faurès, J., Svendsen, M. and Turral, H. (2007). Water for Food, Water for Life: A
Comprehensive Assessment of Water Management in Agriculture. London,
UK.
Ganho, A.S. (2012). A terra e a água para os novos agro-investimentos em
Moçambique: o que está em jogo?, III Conferência Internacional do IESE:
Instituto de Estudos Sociais e Económicos, Maputo.

89
Ganho, A.S. (2013). „Friendship‟ Rice, Business, or Land‐grabbing‟? The
Hubei‐Gaza rice project in Xai‐Xai.
Hair, Jr., Black, W.C., Babin, B.J., Anderson, R.E. and Tatham, R.L. (2006).
Multivariate data analysis. 6ª edição. Upper saddle river, nj: Pearson prentice
hall.
Hussain, I. and Hanjra, M.A. (2004). Irrigation and poverty alleviation: Review of
the empirical evidence.
IFAD (2014). Investing in rural people in Mozambique. International Fund for
Agricultural Development, Rome, Italy, 2014.
IWMI/ARC (2003). Limpopo Basin Profile. CGIAR Challenge program on water
and food. Pretoria.
Janvry, A.D. (2010). Agriculture for Development: new paradigm and options for
success.
Joneydi M.S. (2012). Factors affecting in sustainability of agricultural production
systems in Iran.
Julaia, C.S. (2009). Performance assessment of water distribution in large scale
irrigation: Case study of Chokwe Irrigation System in Mozambique.
Kalantari, K.h. (2008). Processing and Analysis of Economic Data in Social
Research. Publications Consulting Engineers and Landscape Design, Tehran.

90
Kijne, J.W., Barker R. and Molden, D. (2003). Water productivity in agriculture:
limits and opportunities for improvement. International Water Management
Institute, Colombo-Sri Lanka.
Kindness, H. and Gordon, A. (2001). Agricultural marketing in developing countries:
The role of NGOs and CBOs. Natural Resources Institute.
Kintomo, A.A., Akintoye, H.A. and Alasiri, K.O. (2008). Role of Legume Fallow in
Intensified Vegetable-Based System. Communications in Soil Science and
Plant Analysis.
Louw, A. and Gichuki, F. (2003). Limpopo River Basin Profile: Strategic research
for enhancing agricultural water productivity.
Malano, H And Burton, M. (2001). Guidelines for benchmarking performance in the
Irrigation and drainage sector. Food and Agriculture Organization of the
United Nations Rome, 2001.
Marquês, M.R. (2006). Experiences with Micro Agricultural Water Management
technologies in Mozambique. International Water management Institute:
Southern Africa sub-regional office, Pretoria, South Africa, 2006.
Marquês, M.R., Vilanculos, M. and Mafalacusser, J. (2006). Soil physics
characterization of agricultural wetlands, Maputo.
Mertens, E.E. and Loureiro J.J. (1974). Mapai Hydrological Study (Limpopo‟s
River).Symposium on the Development of Water Resources Projects With
Inadequate Data. Studies and Reports in Hydrology. Vol. 16.

91
Mohammed, B.T. and Abdulquadri, A.F. (2011). Comparative analysis of gender
involvement in agricultural production in Nigeria.
Molden, D., Oweis, T., Steduto, P., Bidraban, P., Hanjra, and M.A., Kijne, J. (2010).
Improving agricultural water productivity: Between optimism and caution.
Agricultural Water Management 97.
Molden, D., Sakthivadivel, R., Perry, C.J. and Fraiture, C. (1998). Indicators for
Comparing Performance of Irrigated Agricultural Systems. International
Water Management Institute: Research Report 20. Colombo, Sri Lanka.
Morris, M., Kelly, V.A., Kopicki, R.J., and Byerlee, D. (2007). Fertilizer Use in
African Agriculture: the World Bank, Washington, DC.
OECD (2008). Handbook on Constructing Composite Indicators. Methodology and
user guide. Organization for Economic Co-operation And Development.
Oluwatayo, I.B., Sekurnade, A.B. and Adesoji, S.A. (2008). “Resource use
Efficiency of Maize Farmers In Rural Nigeria. Evidence from Ekiti State”.
World Journal of Agricultural Sciences 4.
Perry, C. (2007). Efficient irrigation, inefficient communication, flawed
recommendations. Irrigation and Drainage.
Pratap, B.S., Joshi, P.K., Chauhan, S. and Singh, H. (2008). Can Horticulture
Revitalize Agricultural Growth? Indian Journal of Agriculture Economics,
Vol. 63.
RBL, EP (2015). Relatório da Campanha 2014/2015.

92
Reddy, S.J. (1986). Agro-climate of Mozambique as relevant to dry-land agriculture.
Serie Terra e Água do Instituo Nacional de Investigação Agronómica,
Comunicação no 47. Maputo, Moçambique.
Schawb, A.J. (2007). Electronic Classroom. available on
(http://www.utexas.edu/ssw/eclassroom/schwab.html). Site visited on
07/03/2016.
Shaw, E.M. (1994). Hydrology in Practice. Third edition.
Sinclair, T.R., Tanner, C.B. and Bennett, J.M. (1984). Water-Use Efficiency in Crop
Production. American Institute of Biological Sciences. Vol. 34.
UNEP/FAO/PAP (1998). Xai-Xai District Coastal Area Management Strategy. East
African Regional Seas Technical Reports Series No. 2. Split, Croatia.
USAID (2014). Mozambique‟s natural resource boom. What potential impacts on
agriculture‟s competitiveness? United State Agency for International
Development: Final report, 2014.
USAID (2015). Risk, Vulnerability & Resilience in the Limpopo River Basin.
Climate change, water and biodiversity-A synthesis.
USDA (1997). Irrigation Guide. United states Department of Agriculture National
Engineering: Handbook, Part 652, US.
WB (2016). Commodity price outlook. Development Prospect Group. Washington
D.C.: The World Bank.

93
WMO (1994). Guide to Hydrological Practices. Data acquisition and processing
analysis. Fifth edition.
Xu, Z., Burke, W.J., Jayne, T.S. and Govereh, J. (2009). Do input subsidy programs
“crowed in” or “crowed out” commercial market development? Modeling
fertilizer demand in a two-channel marketing system.

94
APPENDICES
APPENDIX A
Map of Lower Limpopo irrigation scheme (RBL)
Source: Adapted from maps provided by RBL‐EP

95
APPENDIX B
Field survey measurements
Flow measurement in pipes using
ultrasonic flow meter
In situ water quality measurement Flow measurement in open
canals using current meter
Use of topographic level for
open canal measuring