performance appraisals and the impact of forced distribution - iza
TRANSCRIPT

DI
SC
US
SI
ON
P
AP
ER
S
ER
IE
S
Forschungsinstitut zur Zukunft der ArbeitInstitute for the Study of Labor
Performance Appraisals and the Impact ofForced Distribution: An Experimental Investigation
IZA DP No. 5020
June 2010
Johannes BergerChristine HarbringDirk Sliwka
Performance Appraisals and the Impact of Forced Distribution: An Experimental Investigation
Johannes Berger University of Cologne
Christine Harbring
Karlsruhe Institute of Technology and IZA
Dirk Sliwka
University of Cologne and IZA
Discussion Paper No. 5020 June 2010
IZA
P.O. Box 7240 53072 Bonn
Germany
Phone: +49-228-3894-0 Fax: +49-228-3894-180
E-mail: [email protected]
Any opinions expressed here are those of the author(s) and not those of IZA. Research published in this series may include views on policy, but the institute itself takes no institutional policy positions. The Institute for the Study of Labor (IZA) in Bonn is a local and virtual international research center and a place of communication between science, politics and business. IZA is an independent nonprofit organization supported by Deutsche Post Foundation. The center is associated with the University of Bonn and offers a stimulating research environment through its international network, workshops and conferences, data service, project support, research visits and doctoral program. IZA engages in (i) original and internationally competitive research in all fields of labor economics, (ii) development of policy concepts, and (iii) dissemination of research results and concepts to the interested public. IZA Discussion Papers often represent preliminary work and are circulated to encourage discussion. Citation of such a paper should account for its provisional character. A revised version may be available directly from the author.

IZA Discussion Paper No. 5020 June 2010
ABSTRACT
Performance Appraisals and the Impact of Forced Distribution: An Experimental Investigation
A real effort experiment is investigated in which supervisors have to rate the performance of individual workers who in turn receive a bonus payment based on these ratings. We compare a baseline treatment in which supervisors were not restricted in their rating behavior to a forced distribution system in which they had to assign differentiated grades. We find that productivity was significantly higher under a forced distribution by about 8%. But also in the absence of forced distribution, deliberate differentiation positively affected output in subsequent work periods. JEL Classification: C91, D83, J33, M52 Keywords: performance measurement, forced distribution, motivation, experiment Corresponding author: Christine Harbring Karlsruhe Institute of Technology Waldhornstr. 27 76131 Karlsruhe Germany E-mail: [email protected]

1 Introduction
In most jobs an employee�s true e¤orts are at best imprecisely captured by ob-
jective key �gures. Hence, organizations frequently use subjective appraisals
to evaluate substantial parts of an employee�s job performance. While this
may strengthen the setting of incentives as more facets of job performance are
evaluated, the opposite may be true when supervisors bias the evaluations
according to personal preferences.1
There is indeed strong evidence from numerous studies indicating that
subjective performance ratings tend to be biased. First of all, it has often
been stressed that supervisors are too �lenient�and reluctant to use the lower
spectrum of possible performance ratings. Moreover, supervisors typically do
not di¤erentiate enough between high and low performers such that ratings
tend to be compressed relative to the distribution of the true performance
outcomes.2 As rating scales nearly always have an upper boundary, rater
leniency often directly implies rating compression. While the existence of
these biases has been con�rmed in previous studies, there is surprisingly little
evidence on the performance consequences of biased performance appraisals
when they are tied to compensation. Rynes et al. (2005), for instance, stress
that �although there is a voluminous psychological literature on performance
evaluation, surprisingly little of this research examines the consequences of
linking pay to evaluated performance in work settings�(p. 572).
A simple economic logic suggests that both of the above mentioned bi-
ases should lead to weaker incentives. As high performance is not rewarded
and low performance is not sanctioned adequately, employees should have
lower incentives to exert e¤ort when they anticipate biased ratings. But on
1For an overview see for instance Murphy and Cleveland (1995), Arvey and Murphy(1998) or from an economics perspective Prendergast and Topel (1993), Prendergast andTopel (1996) or Gibbs et al. (2003).
2These two biases are often referred to in the literature as the �leniency�and �central-ity� bias. See for instance Landy and Farr (1980), Murphy (1992), Bretz et al. (1992),Jawahar and Williams (1997), Prendergast (1999), or Moers (2005).
2

the other hand, it may be argued that rating leniency can trigger positive
reciprocity and rating compression reduces inequity among coworkers which
both may lead to increased employee motivation.3
To avoid potential negative consequences of rater biases, some �rms have
adopted so-called �forced distribution�systems under which supervisors have
to follow a predetermined distribution of ratings. At General Electric for
example, the former CEO Jack Welch promoted what he called a �vitality
curve�according to which each supervisor had to identify the top 20% and
the bottom 10% of his team in each year. According to estimates, a quarter
of the Fortune 500 companies (e.g. Cisco, Intel, Hewlett Packard, Microsoft
etc.) link parts of individual bene�ts to a relative performance evaluation
(Boyle (2001)). However, the use of these systems is often very controversially
discussed and in some �rms even led to lawsuits as employees claimed to have
been treated unfairly.4
A key reason for the lack of �eld evidence on the consequences of a forced
distribution is that even when a �rm changes its system of performance
appraisals there is typically no control group within the same �rm with an
unaltered scheme which in turn makes it hard to identify the causal e¤ect
of the modi�cation. Moreover, to measure the performance consequences an
objective measure of individual performance is necessary. But such objective
measures are typically not available when subjective assessments are used.5
3Many experimental studies have now con�rmed that higher wage payments indeedtrigger positive reciprocity and in turn can lead to higher e¤orts. See, for instance, Fehret al. (1993), Fehr et al. (1997), Hannan et al. (2002) or Charness (2004). Evidencefrom �eld experiments is somewhat less pronounced. Recent studies �nd mostly moderatesupport for positive reciprocity. See for instance Gneezy and List (2006), Cohn et al.(2009), Kube et al. (2010), Bellemare and Shearer (2009) and Hennig-Schmidt et al. (2010).
4See for instance �Performance Reviews: Many Need Improvement� in the New YorkTimes (September 10, 2006).
5Typical examples of departments in which objective measures of performance areavailable are sales functions in which revenues of individual sales agents can be measured.But in these departments subjective assessments and in particular forced distributions arehardly ever used because the objective performance measures already lead to di¤erentiatedratings.
3

Hence, in this paper we investigate the performance consequences of a forced
distribution system in a real e¤ort experiment. In each experimental group,
one participant in the role of a supervisor has to evaluate the performance of
three participants in the role of employees over several rounds. Participants
have to work on a real-e¤ort task while the outcome of their work directly
determines the supervisor�s payo¤s. At the end of each round the supervisor
learns the work outcome of each individual employee and is then asked to
individually rate their performance on a �ve point scale. The employees
receive a bonus payment based on this performance rating. We examine
two experimental settings. In the baseline treatment supervisors are not
restricted in their rating behavior. In a forced distribution treatment they
have to give di¤erentiated ratings. We also investigate additional treatments
in which a forced distribution system is either abolished or introduced after
some rating experience with or without such a system.
Our key result is that worker productivity in our experiment is by about
8% higher under a forced distribution system. Moreover, we �nd that in the
absence of a forced distribution system, supervisors who care more for the
well-being of others tend to assign more lenient and therefore less di¤erenti-
ated ratings. But weaker degrees of di¤erentiation lead to lower performance
in subsequent rounds. If, for instance, an employee receives the best poten-
tial rating but does not have the highest work outcome in the group, his
subsequent performance decreases. Interestingly, supervisors seem to learn
the advantages of di¤erentiation as they assign less lenient and more di¤er-
entiated ratings after the forced distribution has been abolished as compared
to a setting in which it has never been used. But, on the other hand, the
performance e¤ect of a forced distribution is strongly reduced when the par-
ticipants have experienced the more �liberal� baseline setting before and,
hence, have di¤erent reference standards and expectations.
While to the best of our knowledge there are no previous studies investi-
gating the e¤ects of the introduction of a forced distribution on incentives,
4
some recent �eld studies investigate the e¤ects of rating compression on fu-
ture outcomes. Engellandt and Riphahn (2008), Bol (2009), Kampkötter and
Sliwka (2010) and Ahn et al. (2008) give some indication that rating com-
pression is associated with lower subsequent performance. Direct empirical
evidence on the e¤ects of forced distributions is very scarce. Recently, Schle-
icher et al. (2009) have experimentally investigated rater�s reaction to forced
distribution and �nd that rating decisions are perceived as more di¢ cult
and less fair under a forced distribution system than in a traditional setting.
Scullen et al. (2005) conduct a simulation study and show that forced distrib-
ution can increase performance in the short run as low performers are driven
out of the �rm. This e¤ect, however, becomes smaller over time. Neither
study examines the incentive e¤ects of forced distributions.
The paper proceeds as follows. In the next section the experimental design
and procedure are described. The experimental results are summarized in
section 3. We �rst provide evidence on the performance di¤erence between
our baseline treatment and the forced distribution condition. Then, we take a
closer look at rating decisions within the baseline treatment and their relation
to workers�performance as well as the connection between the supervisor�s
social preferences and rating behavior. Finally, we investigate the e¤ect of
past experience in a di¤erent rating setting on both the supervisor�s and the
workers�behavior. We discuss and conclude our results in the last section.
2 Experimental Design
We conduct a real e¤ort laboratory study. The majority of the subjects
has to work on a tedious task in the role of a �worker�. Their individual
performance is evaluated by other subjects who are assigned the role of a
�supervisor�. The experiment consists of several parts which are described
in the following.
5

Ability TestIn an initial pre-round all subjects have to work on the real e¤ort task
which is also used in the main part of the experiment, i.e. all have to repeat-
edly count the number �7�in blocks of randomly generated numbers. This
pre-round is conducted to collect a measure for each subject�s ability for the
task and also to familiarize participants with the task (also those who are in
the role of the supervisor). To make sure everybody has correctly understood
the task, an �exercise block� is presented on the computer screen prior to
the pre-round. Only after all subjects have correctly solved this block, the
pre-round which lasts for 2.5 minutes is started. During the pre-round sub-
jects�performance is measured by the number of �points�they collect which is
converted into Euro after the experiment. For each correct answer a subject
receives two points, for each wrong answer it loses 0.5 points. At the end
of the round, a piece-rate of 10 cents per point is paid to each participant�s
account. During the task subjects are also o¤ered the opportunity to use a
�time-out�button which locks the screen for 20 seconds during which sub-
jects cannot work on any blocks. Each time the time-out button is pushed
the subject receives 8 cents. This time-out button is implemented to simu-
late potential opportunity costs of working. At the end of the pre-round each
participant is informed about the total number of points achieved as well as
the number of correct and false answers and the resulting payo¤.6
Main Part: Performance Ratings and Bonus PaymentsAfter the ability test, instructions for the �rst part of the experiment are
distributed. Before this part of the experiment is started, participants have
to answer several test questions on the screen to make sure that they have
fully understood the procedure and the calculation of the payo¤s.7 This �rst
6To avoid losses, the total number of points for a period were set to zero when the totalfor this period was negative.
7Participants had to calculate the payo¤s for a worker and a supervisor for an outputas well as a rating they themselves could freely choose.
6
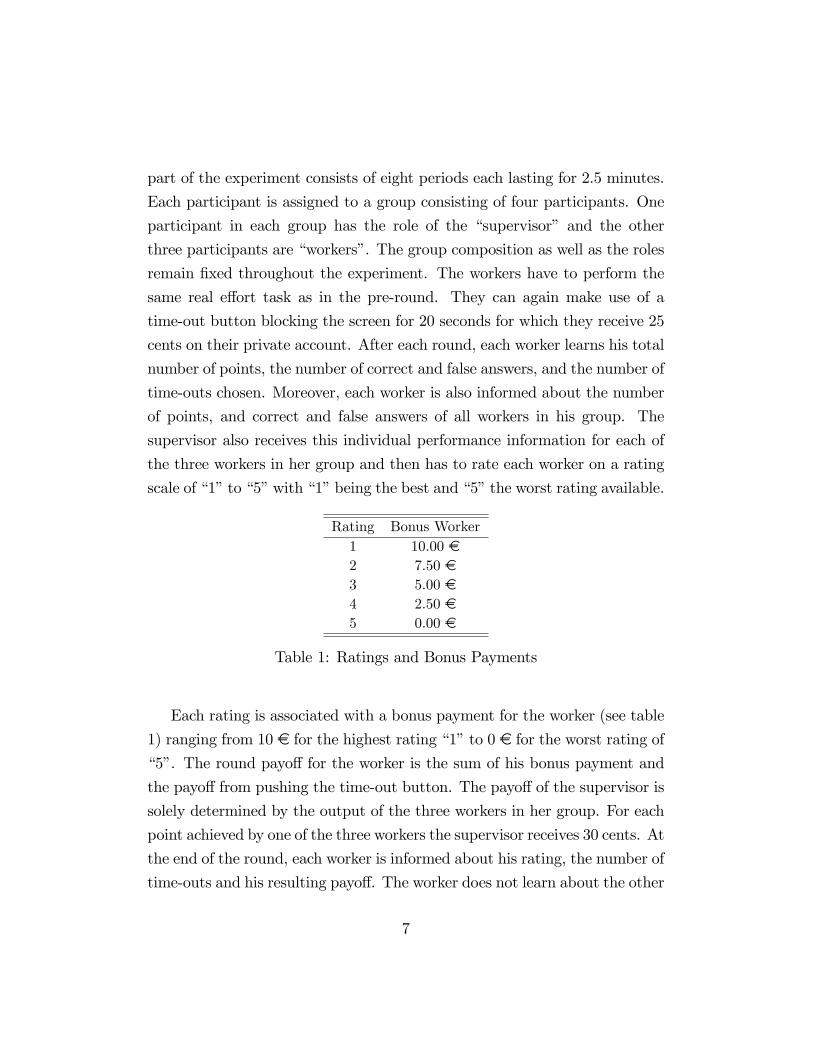
part of the experiment consists of eight periods each lasting for 2.5 minutes.
Each participant is assigned to a group consisting of four participants. One
participant in each group has the role of the �supervisor� and the other
three participants are �workers�. The group composition as well as the roles
remain �xed throughout the experiment. The workers have to perform the
same real e¤ort task as in the pre-round. They can again make use of a
time-out button blocking the screen for 20 seconds for which they receive 25
cents on their private account. After each round, each worker learns his total
number of points, the number of correct and false answers, and the number of
time-outs chosen. Moreover, each worker is also informed about the number
of points, and correct and false answers of all workers in his group. The
supervisor also receives this individual performance information for each of
the three workers in her group and then has to rate each worker on a rating
scale of �1�to �5�with �1�being the best and �5�the worst rating available.
Rating Bonus Worker1 10.00 e2 7.50 e3 5.00 e4 2.50 e5 0.00 e
Table 1: Ratings and Bonus Payments
Each rating is associated with a bonus payment for the worker (see table
1) ranging from 10 e for the highest rating �1�to 0 e for the worst rating of
�5�. The round payo¤ for the worker is the sum of his bonus payment and
the payo¤ from pushing the time-out button. The payo¤ of the supervisor is
solely determined by the output of the three workers in her group. For each
point achieved by one of the three workers the supervisor receives 30 cents. At
the end of the round, each worker is informed about his rating, the number of
time-outs and his resulting payo¤. The worker does not learn about the other
7

workers�ratings in his group. One round is randomly determined in each part
of the experiment which is payo¤-relevant (for details see "Procedures").
Matching of GroupsTo create a situation in which performance ratings are not straightfor-
wardly due to ability di¤erences, we match participants into homogeneous
groups. The matching procedure is based on the performance in the pre-
round, i.e. all 32 subjects are individually ranked in each session based on
their total number of points achieved in the pre-round. The four participants
with the best ranking are assigned to a group, the four best individuals of
the remaining participants to the next group etc. Within each group, the
participant with the best performance is assigned the role of the supervi-
sor. Participants are not informed about the matching procedure to avoid
strategic considerations. Subjects only know they will be grouped with three
other participants. At the end of the experiment, a few additional decision
games are played to elicit subjects�social preferences. After these games all
participants have to �ll out a questionnaire.
TreatmentsWe analyze two di¤erent settings: In the Baseline setting (Base) super-
visors are not restricted in their rating behavior. In the Forced Distribution
setting (Fds), however, supervisors have to give one worker a rating of �1�
or �2�, one worker a rating of �3�and another worker a �4�or �5�. This
restriction is explained to all participants in the treatment.
To also analyze the e¤ects of introducing or abolishing a forced distri-
bution system in a within-subject design, we split the experiment into two
parts each consisting of 8 consecutive rounds. The group matching as well
as the assigned roles are kept constant across both parts. In our treatment
BaseFds, for example, participants work in the baseline setting for 8 rounds
(�rst part) which are followed by 8 rounds of the forced distribution set-
ting (second part). To disentangle rating rule e¤ects from time and learning
8
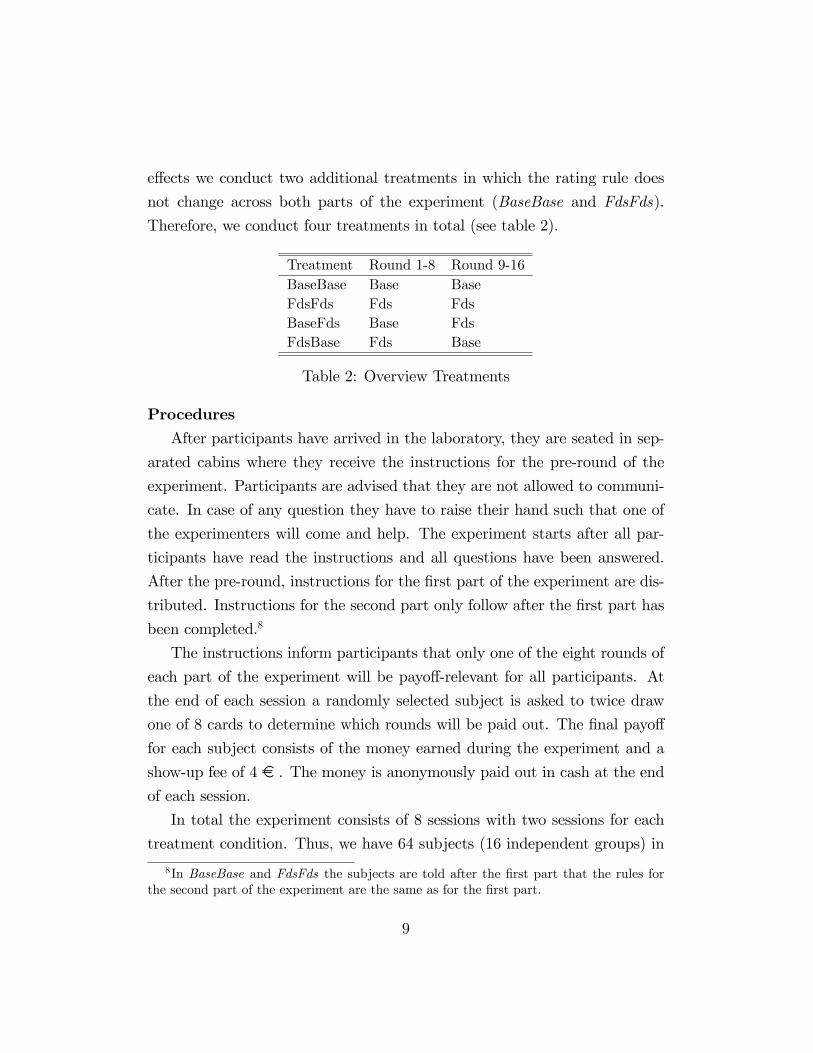
e¤ects we conduct two additional treatments in which the rating rule does
not change across both parts of the experiment (BaseBase and FdsFds).
Therefore, we conduct four treatments in total (see table 2).
Treatment Round 1-8 Round 9-16BaseBase Base BaseFdsFds Fds FdsBaseFds Base FdsFdsBase Fds Base
Table 2: Overview Treatments
ProceduresAfter participants have arrived in the laboratory, they are seated in sep-
arated cabins where they receive the instructions for the pre-round of the
experiment. Participants are advised that they are not allowed to communi-
cate. In case of any question they have to raise their hand such that one of
the experimenters will come and help. The experiment starts after all par-
ticipants have read the instructions and all questions have been answered.
After the pre-round, instructions for the �rst part of the experiment are dis-
tributed. Instructions for the second part only follow after the �rst part has
been completed.8
The instructions inform participants that only one of the eight rounds of
each part of the experiment will be payo¤-relevant for all participants. At
the end of each session a randomly selected subject is asked to twice draw
one of 8 cards to determine which rounds will be paid out. The �nal payo¤
for each subject consists of the money earned during the experiment and a
show-up fee of 4 e . The money is anonymously paid out in cash at the end
of each session.
In total the experiment consists of 8 sessions with two sessions for each
treatment condition. Thus, we have 64 subjects (16 independent groups) in
8In BaseBase and FdsFds the subjects are told after the �rst part that the rules forthe second part of the experiment are the same as for the �rst part.
9

each treatment with a total of 256 participants. It is ensured that no one
has been involved in an experiment with the same real e¤ort task before.
No subject participates in more than one session. On average a session lasts
for 2.5 hours and the average payo¤ amounts to 27 e. The experiment is
conducted at the Cologne Laboratory for Economic Research. All sessions are
computerized using the experimental software z-Tree (Fischbacher (2007))
and subjects are recruited with the online recruiting system ORSEE (Greiner
(2004)).
3 Results
In this section, we �rst give an overview of the performance e¤ect of the forced
distribution system by comparing the treatments BaseBase and FdsFds. We
then analyze the driving forces behind the observed di¤erences in more detail.
Finally, we provide an overview of spillover e¤ects observed when varying the
sequence of both settings in BaseFds and FdsBase.
3.1 Performance E¤ects of Forced Distribution
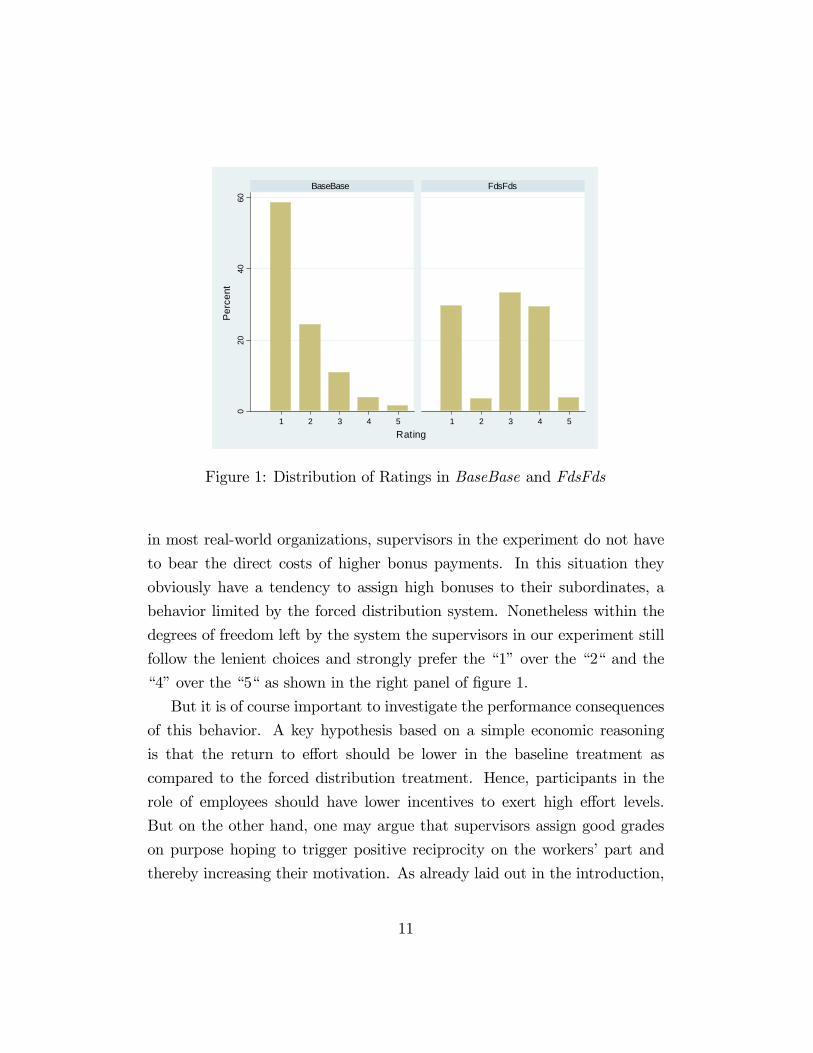
Figure 1 depicts the distribution of ratings in BaseBase and FdsFds. Ev-
idently, supervisors tend to assign very good ratings, i.e. a �1� or �2� in
the majority of cases in BaseBase (83%). Note that this pattern closely
resembles the typical �leniency bias�often observed in organizational prac-
tice. Bretz et al. (1992), for instance, describe this as follows: �Performance
appraisal systems typically have �ve levels to di¤erentiate employee perfor-
mance. However, even though most organizations report systems with �ve
levels, generally only three levels are used. Both the desired and the actual
distributions tend to be top heavy, with the top �Buckets� relatively full and
the bottom buckets relatively empty. . . It is common for 60-70% of an orga-
nization�s workforce to be rated in the top two performance levels. . . . Skewed
performance distributions not only exist, but are common�. As is the case
10
020
4060
1 2 3 4 5 1 2 3 4 5
BaseBase FdsFds
Per
cent
Rating
Figure 1: Distribution of Ratings in BaseBase and FdsFds
in most real-world organizations, supervisors in the experiment do not have
to bear the direct costs of higher bonus payments. In this situation they
obviously have a tendency to assign high bonuses to their subordinates, a
behavior limited by the forced distribution system. Nonetheless within the
degrees of freedom left by the system the supervisors in our experiment still
follow the lenient choices and strongly prefer the �1�over the �2� and the
�4�over the �5� as shown in the right panel of �gure 1.
But it is of course important to investigate the performance consequences
of this behavior. A key hypothesis based on a simple economic reasoning
is that the return to e¤ort should be lower in the baseline treatment as
compared to the forced distribution treatment. Hence, participants in the
role of employees should have lower incentives to exert high e¤ort levels.
But on the other hand, one may argue that supervisors assign good grades
on purpose hoping to trigger positive reciprocity on the workers�part and
thereby increasing their motivation. As already laid out in the introduction,
11

numerous gift-exchange experiments have now provided evidence for the fair
wage e¤ort hypothesis by Akerlof and Yellen (1990) showing that higher wage
payments indeed may lead to higher e¤orts.0
24
68
02
46
8
35 40 45 50 55 60 65 70 75 80 85 90 95 100 105
BaseBase
FdsFds
Per
cent
Group Output
Figure 2: Distribution of Output in BaseBase and FdsFds
Figure 2 displays the distribution of outputs in both treatments. The
�gure indicates that performance indeed seems to be higher under the forced
distribution. Average group output amounts to 65.02 in BaseBase and to
71.38 in FdsFds. Our matching procedure is designed to generate groups of
similar ability in both treatments. Thus, to give an accurate test without any
distributional assumptions on whether the apparent performance di¤erence
is statistically signi�cant we have to compare the groups across treatments
according to their rank in the ability test. Hence, we pair the highest ranking
group according to the ability test in BaseBase with the highest ranking
group in FdsFds and then the second highest groups from both treatments
and so on. We then counted in how many of these pairs the average group
performance across all rounds is higher in the FdsFds treatment. As this
12

is the case in 12 of the 16 pairs, the di¤erence is signi�cant (p = 0:038,
one-sided Binomial test).
We further investigate this performance di¤erence by running random-
e¤ects regressions with the group output (sum of the points of all 3 workers)
and alternatively the logarithm of group output in a period as the dependent
variable. Due to the matching procedure we have to control for innate group
ability measured by the group output from the initial pre-round. The results
are reported in table 3. As model (1) indicates group output is about 5 points
higher under forced distribution. Model (5) shows that this translates into
an average productivity di¤erence of 8%. Models (2) and (3) show that this
holds for both parts of the experiment. Model (4) adds an interaction term
between the Fds dummy variable and group ability. The signi�cant negative
coe¢ cient indicates that productivity enhancement is particularly high for
groups with a low output in the pre-round.
13

DependentVariable:
GroupOutput
LogGroupOutput
BaseBasevs.FdsFds
BaseBasevs.FdsFds
(1)
(2)
(3)
(4)
(5)
(6)
(7)
(8)
Periods
1-16
Periods
1-8
Periods
9-16
Periods
1-16
Periods
1-16
Periods
1-8
Periods
9-16
Periods
1-16
Fds
5.257**
4.728**
5.786**
18.98***
0.0781**
0.0723**
0.0839**
0.296***
(2.208)
(2.155)
(2.456)
(6.658)
(0.033)
(0.034)
(0.035)
(0.099)
GroupAbility
0.508***
0.501***
0.516***
0.696***
0.0075***
0.0078***
0.0071***
0.0105***
(0.082)
(0.078)
(0.091)
(0.092)
(0.001)
(0.001)
(0.001)
(0.001)
Fds�GroupAbility
-0.294**
-0.0047***
(0.123)
(0.002)
Constant
26.40***
27.01***
47.09***
17.77***
3.561***
3.548***
3.907***
3.424***
(3.362)
(3.016)
(4.720)
(4.740)
(0.051)
(0.048)
(0.071)
(0.067)
Observations
512
256
256
512
512
256
256
512
NumberofGroups
3232
3232
3232
3232
WaldChi2
1640.10
653.88
179.43
1487.50
1458.06
597.49
192.19
1613.19
Robuststandarderrorsinparentheses,***p<0.01,**p<0.05,*p<0.1
Randome¤ectsregression(perioddummiesincluded)
Table3:TheImpactofForcedDistributiononProductivity
14

5060
7080
Gro
up O
utpu
t
1 2 3 4 5 6 7 8 9 10 11 12 13 14 15 16Period
BaseBase FdsFds
The dashed l ine at period 8 indicates the beginning of the second part of the experiment
Figure 3: Output in BaseBase and FdsFds over Time
Taking a closer look at the evolution of work performance over time in
Figure 3, we see that performance di¤erences become larger in the second
part of the experiment. Hence, participants seem to have learned over the
course of the experiment that performance incentives are stronger under the
forced distribution.9 The increase in productivity under Fds is also re�ected
by a considerable decrease in the use of the time-out button in the second
part of the experiment. In only 8 out of 128 cases (6%) time-outs are observed
during the second part of the experiment under a forced distribution while
this is true for 48 out of 128 cases (38%) in the baseline setting.10
Investigating the treatment di¤erences with alternate productivity mea-
sures, such as the number of blocks �nished per group and the number of
9It is interesting to note that the qualitative shape of both graphs over time is quitesimilar re�ecting parallel e¤ects of learning and fatigue.10Note that even after excluding all periods in which subjects take timeouts, performance
is still signi�cantly higher under Fds. This suggests that subjects not only stop workingmore frequently but that they also exert less e¤ort while working on the task in the baselinecompared to the forced distribution.
15

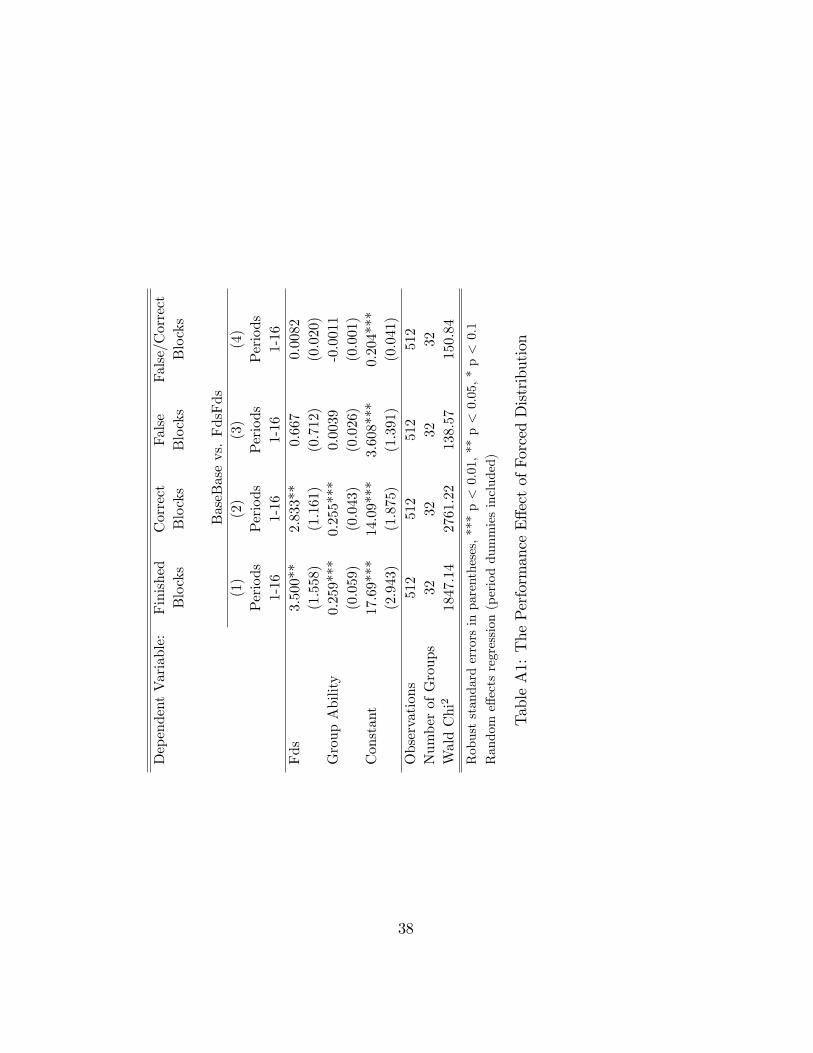
correct and false answers (see table A1 in the appendix) we �nd that un-
der forced distribution subjects count and solve more blocks correctly while
making only slightly and insigni�cantly more mistakes.
3.2 Di¤erentiation and Productivity
But why do people work harder under the forced distribution? A key con-
jecture is that under the forced distribution supervisors di¤erentiate more
according to individual performance which strengthens the incentives to ex-
ert e¤ort. We, therefore, analyze whether performance is rewarded di¤erently
in the two treatments. In principle, supervisors can condition their grading
behavior on two dimensions: they can reward absolute or relative perfor-
mance. We naturally should expect that the relative rank plays a key role
under the forced distribution. But even in the baseline treatment supervisors
may condition their grading behavior on the employee�s relative rank in the
group. However, they may do so to a smaller extent as they are not forced
to di¤erentiate. On the other hand, variations in absolute performance may
a¤ect the grades in both treatments. To investigate this we run random ef-
fects regressions with the bonus received in a period as dependent and the
absolute output and relative rank as independent variables.11 To test for
treatment di¤erences we include interaction terms with a dummy variable
for the forced distribution treatment.
The results are reported in table 4. Note that the relative rank matters
in both treatments but does so to a much larger extent under forced distri-
bution. Interestingly, while within-rank variation in output is rewarded in
both treatments, these rewards are stronger in the baseline treatment, i.e.,
for a given rank output and bonus are more strongly (positively) correlated
in the baseline treatment. But, apparently, competing for ranks generates
stronger incentives in the forced distribution treatment.12
11The last rank 3 is the reference group.12The competition for ranks indeed induces a �tournament�among the agents. As the
16

Dependent Variable: Individual Bonus
BaseBase(1) (2)
Periods1-8
Periods9-16
Output 0.281*** 0.275***(0.026) (0.029)
Output � Fds -0.216*** -0.221***(0.022) (0.020)
Rank 2 0.802*** 0.698***(0.252) (0.230)
Rank 1 1.104** 0.840**(0.436) (0.327)
Rank 2 � Fds 1.242*** 1.734***(0.353) (0.259)
Rank 1 � Fds 4.712*** 5.638***(0.626) (0.429)
Individual Ability -0.0650*** -0.0585**(0.022) (0.024)
Constant 3.173*** 2.278***(0.536) (0.622)
Observations 768 768Number of Subjects 96 96Wald Chi2 743.26 2970.26
Robust standard errors in parentheses (clustered on group_id)
*** p<0.01, ** p<0.05, * p<0.1Random e¤ects regression (period dummies included)
Table 4: The Impact of Rank and Output on Bonus Payments
17

020
4060
8010
0
Top Perf
ormer
Middle
Perform
er
Low P
erform
er
Top Perf
ormer
Middle
Perform
er
Low P
erform
er
BaseBase FdsFds
Grade 1 Grade 2 Grade 3 Grade 4 Grade 5
Per
cent
Figure 4: Distribution of Ratings according to Relative Performance in theGroup
Figure 4 shows the distribution of grades for the top, middle, and low
performers.13 In the forced distribution treatment 90% of the participants
with the highest rank receive a 1 or a 2 and 89% with the lowest rank a 4 or a
5. In contrast, in the baseline treatment about 64% of the worst performers
still receive a 1 or a 2.
Hence, the gains from improving the rank are much weaker in the baseline
treatment. Thus, it seems important to analyze whether these weaker bene-
�ts from improving one�s relative position can indeed explain lower outputs
in the baseline setting. We, therefore, investigate the impact of particu-
lar grades on individuals�subsequent performance in the baseline treatment.
literature on tournaments starting with Lazear and Rosen (1981) has shown, they canindeed be powerful incentive instruments. For experimental evidence on tournaments seefor example Schotter and Weigelt (1992), Orrison et al. (2004) or Harbring and Irlenbusch(2009).13We de�ne top, middle and low performers according to the relative performance rank
in the group in a given round.
18

Table 5 reports results from a random e¤ects regression in the baseline treat-
ment with individual output in t+ 1 as the dependent variable and dummy
variables for the grade assigned in period t as independent variables. The
reference category corresponds to receiving the top grade �1�. Analyzing
the reaction of all workers in model (1) we �nd that obtaining the medium
grade �3�instead of a �1�has a signi�cant positive e¤ect on output in the
subsequent round. Model (2) and (3) disentangle the overall e¤ect accord-
ing to the participants�rank. Model (2) only includes the observations of
the top performers in each period,14 model (3) only the observations of the
other subjects, i.e., middle and low performers. Interestingly, top perform-
ers do not adjust their e¤ort after receiving a lower grade instead of the
top grade. However, middle and low performers substantially increase their
outputs when receiving a �2�or a �3�compared to receiving the top grade
"1".15 Thus, those who know that they attained the highest output are not
motivated by getting lower ratings. In contrast, those who are not the best
performers and yet receive the top grade reduce their e¤orts which supports
the view that lenient and undi¤erentiated ratings indeed undermine perfor-
mance incentives.16
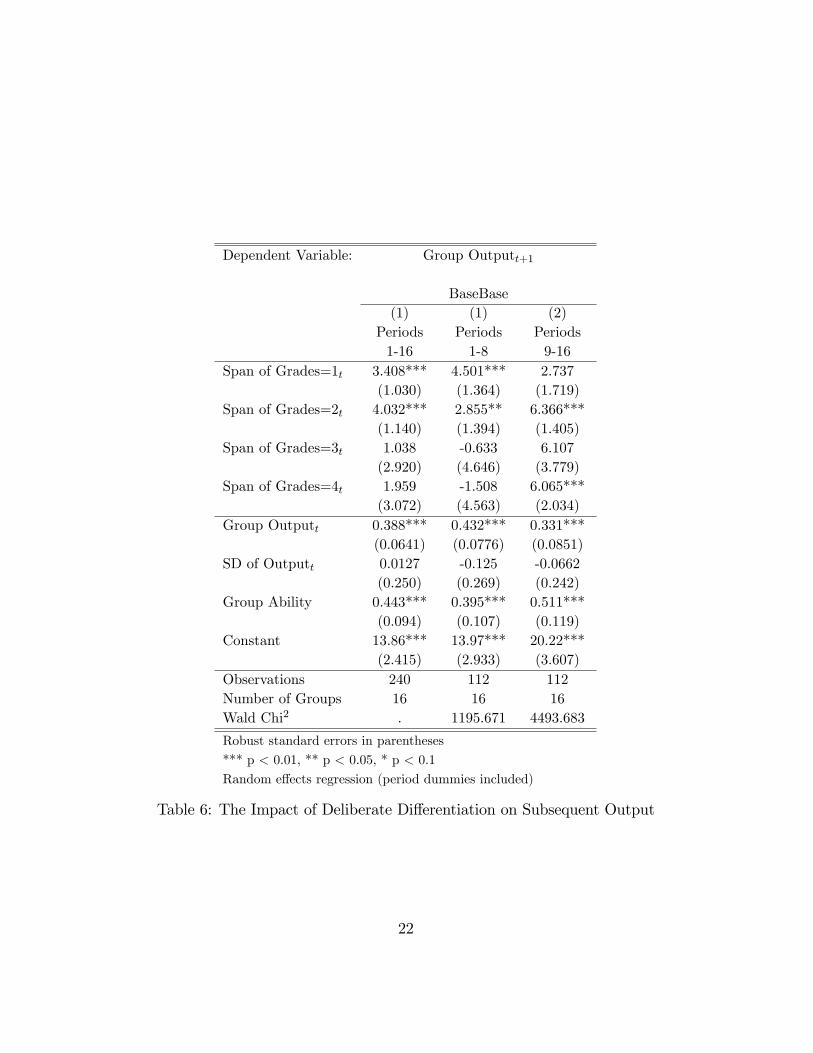
These results suggest that supervisors will induce higher performance in
subsequent rounds by using a larger span of grades. To test this we run ran-
dom e¤ects regressions in BaseBase using the group output in period t + 1
as the dependent variable and dummy variables for each span of grades, i.e.
the di¤erence between the worst and the best rating assigned by the super-
visor, in round t as key independent variables. The results are reported in
table 6. No di¤erentiation, i.e. cases in which each worker receives the same
14Note that the model identi�es the e¤ects of grading by comparing situations in whicha given person obtained the highest rank but received di¤erent grades.15Note that only a few top performers received a �3�. Moreover, even to the middle and
low performers �4�and �5�were rarely assigned.16This is in line with the experimental study by Abeler et al. (2010) who �nd that
e¤orts are substantially lower in a multiagent gift exchange experiment when principalsare forced to pay all agents the same wage.
19

Dependent Variable: Outputt+1
BaseBase(1) (2) (3)
All Workers Top Middle/LowPeriods1-16
Periods1-16
Periods1-16
Grade=2t 0.633 -0.0612 1.008**(0.492) (1.067) (0.413)
Grade=3t 2.317*** 1.769 2.182***(0.451) (1.722) (0.422)
Grade=4t 1.149 0.801(1.285) (1.450)
Grade=5t 3.631 2.029(2.213) (2.601)
Outputt 0.639*** 0.646*** 0.474***(0.061) (0.060) (0.101)
Individual Ability 0.296*** 0.460*** 0.317***(0.034) (0.108) (0.065)
Constant 3.013*** 1.450 4.811***(0.954) (1.659) (1.036)
Observations 720 260 460Number of Subjects 48 42 47
Robust standard errors in parentheses (clustered on group_id)
*** p < 0.01, ** p < 0.05, * p < 0.1
Random e¤ects regression (period dummies included)
Table 5: The Impact of Ratings on Individual Performance
20
rating, serves as our reference category.17 The results suggest that extending
the range of applied ratings from 0 to 2, for instance, increases subsequent
productivity on average by almost 3 points (4%) in the �rst part and more
than 6 points (9%) in the second part.18
Additional evidence for positive e¤ects of deliberate di¤erentiation can
be derived from our post-experimental questionnaire. As already mentioned
above we ask subjects in the role of the supervisors about their rating behav-
ior in both parts of the experiment. The items19 �I assigned bad ratings to
motivate the workers�and �I assigned bad ratings to sanction the workers�
are both positively correlated with higher a group output in the second part
of the experiment (signi�cant at the 10% and 5%-level). A regression analysis
shows that this is still true after controlling for group ability (see regression
table A2 in the Appendix). Moreover, these self reported measures of dif-
ferentiation are highly correlated with actual di¤erentiation in the second
part of the experiment (e.g. range of grades or standard deviation of grades)
controlling for group output.
3.3 Social Preferences and Di¤erentiation
As has already been revealed by psychological studies there is some evidence
that the personality of the supervisor matters for the evaluation behavior.20
In the language of (behavioral) economics we should straightforwardly expect
that the supervisor�s social preferences such as inequity aversion, altruism,
or surplus concerns a¤ect the way in which performance ratings are assigned.
To investigate this we elicit subjects�social preferences before �nal payo¤s
17In 27% of all rounds in BaseBase the supervisor assigned all workers the best rating"1" and in 29% of all rounds she/he assigned the same rating to all three participants.18Note that an observed range of grades larger than 2 occured in only 30 out of 256
rating decisions in the baseline treatment.19For all items we used a 7-point scale running from 1 "does not apply at all" to 7 "fully
applies".20See for instance Kane et al. (1995) or Bernardin et al. (2000).
21
Dependent Variable: Group Outputt+1
BaseBase(1) (1) (2)
Periods1-16
Periods1-8
Periods9-16
Span of Grades=1t 3.408*** 4.501*** 2.737(1.030) (1.364) (1.719)
Span of Grades=2t 4.032*** 2.855** 6.366***(1.140) (1.394) (1.405)
Span of Grades=3t 1.038 -0.633 6.107(2.920) (4.646) (3.779)
Span of Grades=4t 1.959 -1.508 6.065***(3.072) (4.563) (2.034)
Group Outputt 0.388*** 0.432*** 0.331***(0.0641) (0.0776) (0.0851)
SD of Outputt 0.0127 -0.125 -0.0662(0.250) (0.269) (0.242)
Group Ability 0.443*** 0.395*** 0.511***(0.094) (0.107) (0.119)
Constant 13.86*** 13.97*** 20.22***(2.415) (2.933) (3.607)
Observations 240 112 112Number of Groups 16 16 16Wald Chi2 . 1195.671 4493.683
Robust standard errors in parentheses
*** p < 0.01, ** p < 0.05, * p < 0.1
Random e¤ects regression (period dummies included)
Table 6: The Impact of Deliberate Di¤erentiation on Subsequent Output
22
are communicated in our experiment. We apply an incentivized experimental
procedure introduced by Blanco et al. (2007) and modi�ed by Dannenberg
et al. (2007). This simple two-step procedure, for instance, allows the exper-
imenter to measure subjects�preferences for equity in the well-known Fehr
and Schmidt (1999) utility model, according to which the utility of a person
i may not only depend on her own payo¤ xi but also on the di¤erence to the
payo¤s of other individuals. In a two-person case it is given by
u (xi; xj) = xi � �max fxj � xi; 0g � �max fxi � xj; 0g :
Hence, � measures the degree to which an individual su¤ers from disad-
vantageous inequity (�envy�) and � the aversion to advantageous inequity
(�compassion�).21 But as has been stressed for instance by Charness and
Rabin (2002) many individuals are also motivated by e¢ ciency concerns, i.e.
they may strive for maximizing the total surplus of all individuals to some
extent. As laid out by Blanco et al. (2007) (footnote 33 on p.33) the Fehr
Schmidt utility function also captures surplus concerns: An extended utility
function xi��0max fxj � xi; 0g� �0max fxi � xj; 0g+ (xi + xj) which al-lows that the agent also cares for the total surplus can be transformed into
a standard Fehr-Schmidt utility function in which higher surplus concerns
( ) simply lead to a weaker disutility from disadvantageous inequality and a
stronger disutility from advantageous inequality.22
We now expect that more �compassionate�supervisors (i.e. those with
higher values of �) who care more for the well-being of the agents should
assign more lenient ratings. As the rating scale is bounded, this should also
lead to a weaker performanced-based di¤erentiation. On the other hand, su-
pervisors with higher �s are more �envious�(or less interested in the surplus
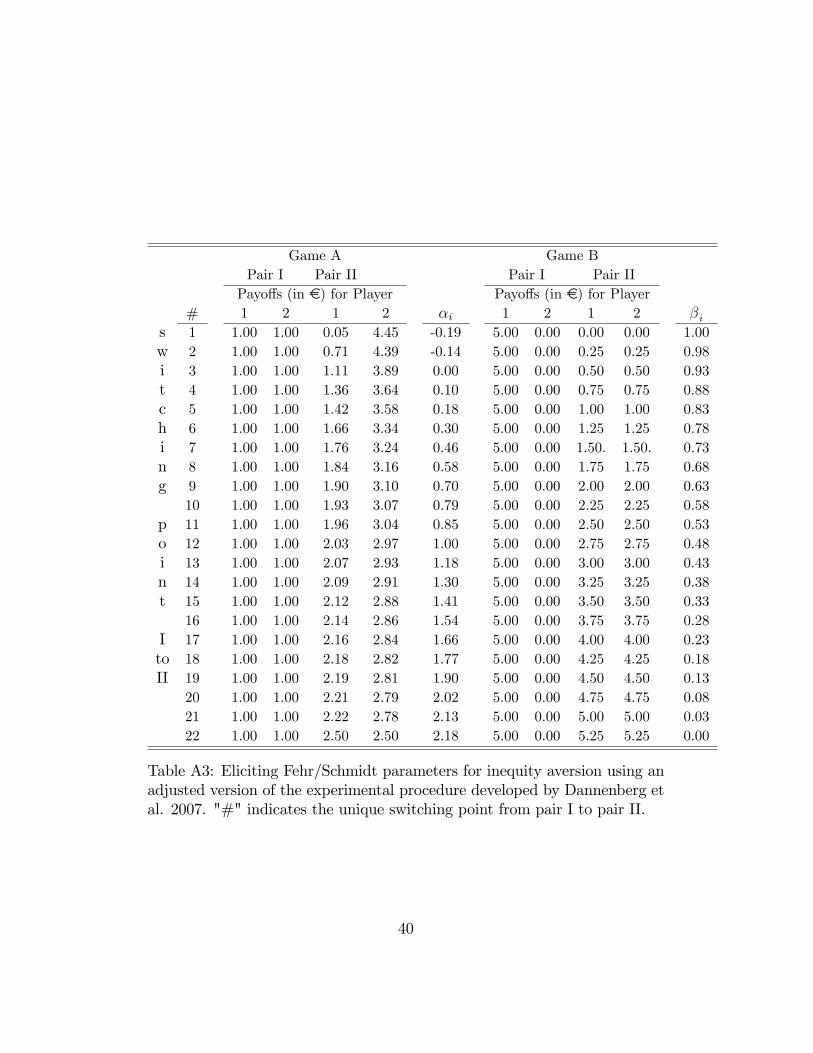
21See table A3 for the speci�c procedure used in this experiment.22To be more speci�c, the function is equivalent to an a¢ ne transformation of xS �
�0� 1+2 max fxj � xi; 0g�
�0+ 1+2 max fxi � xj ; 0g. Hence, the experimental procedure directly
yields estimates for � = �0� 1+2 and � =
�0+ 1+2 .
23
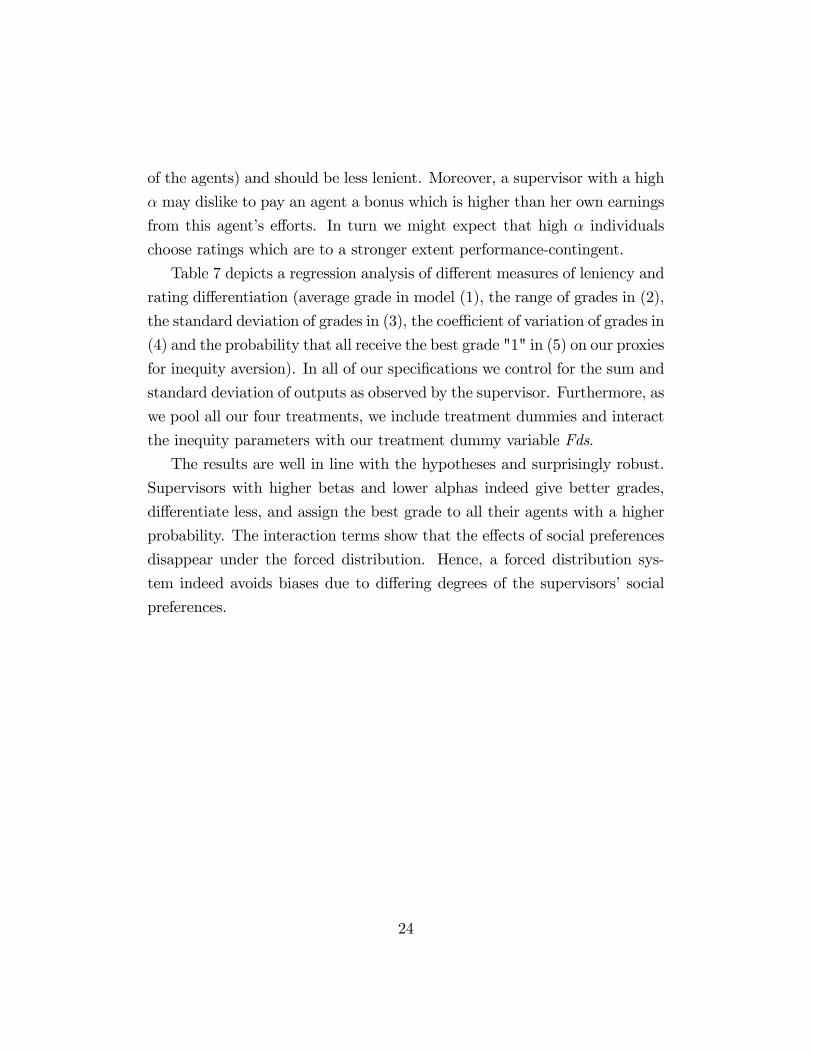
of the agents) and should be less lenient. Moreover, a supervisor with a high
� may dislike to pay an agent a bonus which is higher than her own earnings
from this agent�s e¤orts. In turn we might expect that high � individuals
choose ratings which are to a stronger extent performance-contingent.
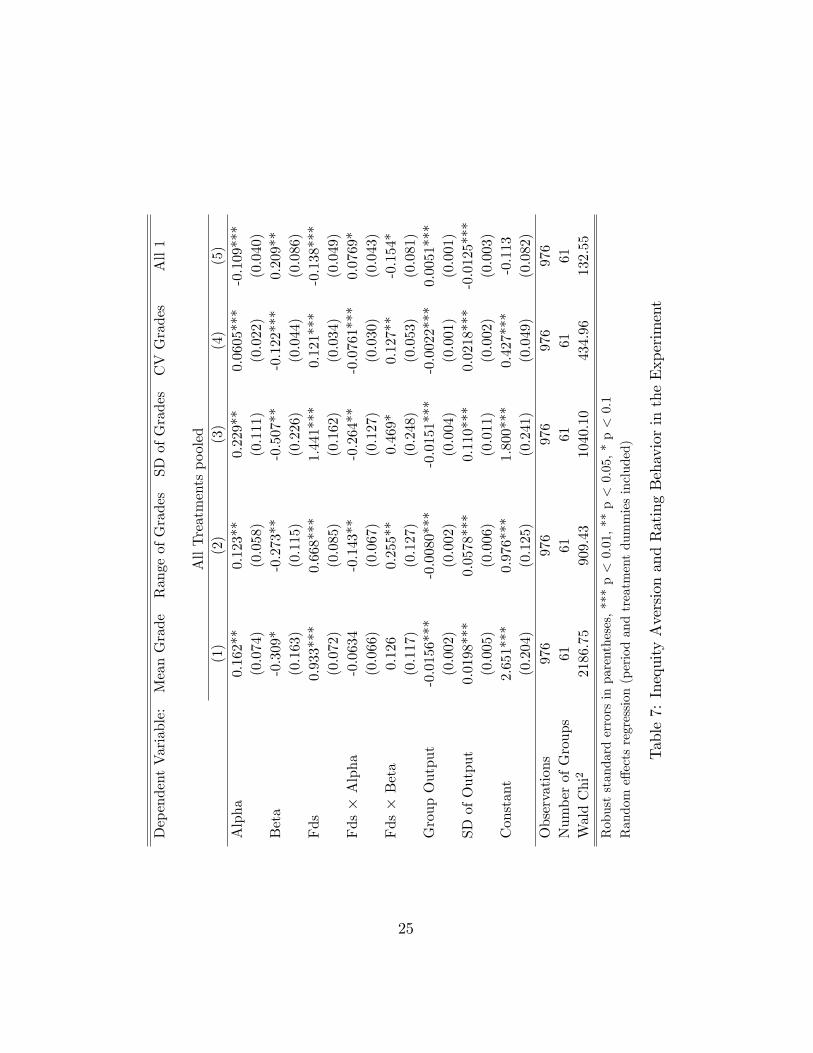
Table 7 depicts a regression analysis of di¤erent measures of leniency and
rating di¤erentiation (average grade in model (1), the range of grades in (2),
the standard deviation of grades in (3), the coe¢ cient of variation of grades in
(4) and the probability that all receive the best grade "1" in (5) on our proxies
for inequity aversion). In all of our speci�cations we control for the sum and
standard deviation of outputs as observed by the supervisor. Furthermore, as
we pool all our four treatments, we include treatment dummies and interact
the inequity parameters with our treatment dummy variable Fds.
The results are well in line with the hypotheses and surprisingly robust.
Supervisors with higher betas and lower alphas indeed give better grades,
di¤erentiate less, and assign the best grade to all their agents with a higher
probability. The interaction terms show that the e¤ects of social preferences
disappear under the forced distribution. Hence, a forced distribution sys-
tem indeed avoids biases due to di¤ering degrees of the supervisors�social
preferences.
24
DependentVariable:
MeanGrade
RangeofGradesSD
ofGradesCVGrades
All1
AllTreatmentspooled
(1)
(2)
(3)
(4)
(5)
Alpha
0.162**
0.123**
0.229**
0.0605***
-0.109***
(0.074)
(0.058)
(0.111)
(0.022)
(0.040)
Beta
-0.309*
-0.273**
-0.507**
-0.122***
0.209**
(0.163)
(0.115)
(0.226)
(0.044)
(0.086)
Fds
0.933***
0.668***
1.441***
0.121***
-0.138***
(0.072)
(0.085)
(0.162)
(0.034)
(0.049)
Fds�Alpha
-0.0634
-0.143**
-0.264**
-0.0761***
0.0769*
(0.066)
(0.067)
(0.127)
(0.030)
(0.043)
Fds�Beta
0.126
0.255**
0.469*
0.127**
-0.154*
(0.117)
(0.127)
(0.248)
(0.053)
(0.081)
GroupOutput
-0.0156***
-0.0080***
-0.0151***
-0.0022***
0.0051***
(0.002)
(0.002)
(0.004)
(0.001)
(0.001)
SDofOutput
0.0198***
0.0578***
0.110***
0.0218***
-0.0125***
(0.005)
(0.006)
(0.011)
(0.002)
(0.003)
Constant
2.651***
0.976***
1.800***
0.427***
-0.113
(0.204)
(0.125)
(0.241)
(0.049)
(0.082)
Observations
976
976
976
976
976
NumberofGroups
6161
6161
61WaldChi2
2186.75
909.43
1040.10
434.96
132.55
Robuststandarderrorsinparentheses,***p<0.01,**p<0.05,*p<0.1
Randome¤ectsregression(periodandtreatmentdummiesincluded)
Table7:InequityAversionandRatingBehaviorintheExperiment
25

We also test the relation between inequity aversion and the tendency to
compress ratings non-parametrically in our baseline treatment. After divid-
ing supervisors at the median of the beta distribution into two groups, we
use the Mann-Whitney U-test to explore di¤erences in rating behavior. Even
though we do not control for di¤erences in output, we have marginally signif-
icant results that the rating behavior is di¤erent across these two groups.23
3.4 Introducing or Abolishing a Forced Distribution?
In this last section we take a closer look at e¤ects of a within treatment
variation in the rules of performance evaluation. As a �rst step we investigate
the e¤ects of introducing a forced distribution in the second part of the
experiment after the agents have experienced the baseline condition in the
�rst part. Because we have to take learning e¤ects into account we compare
the performance with the treatment in which the baseline setting is played
in both parts (i.e. the second part of the BaseFds treatment with the second
part of BaseBase).
Given the results of the between treatment comparison described above,
we should expect an increase in performance after the forced distribution is
introduced. However, a direct comparison reveals that on average across all
periods of the second part the introduction of a forced distribution does not
lead to a higher performance as shown by column (1) of table 8. However, a
surprising pattern emerges when we compare the e¤ects per period as shown
in column (2). While performance increases by about 5 points in period 9, the
�rst period after the forced distribution has been introduced, and stays at this
level in period 10, it drops to a level roughly 2-3 points below the baseline level
in the last 6 periods. Hence, participants are apparently initially motivated
23We apply a two-tailed Mann-Whitney U-test to the di¤erent measures of rating dif-ferentiation to compare groups of supervisors whose betas are above the median of allsupervisors� betas in the treatment to those whose betas are below the median: Meangrade: p=0.138, range of grades: p=0.0899, standard deviation of grades: p=0.0901,coe¢ ent of variation: p=0.0807, frequency of the mean grade=1: p=0.0699.
26

to work harder under the forced distribution as they immediately seem to
understand that they have to put in higher e¤orts. However, they quickly
learn that it is much harder to attain good grades. But in contrast to a setting
in which a forced distribution is present from the outset, the participants now
have a di¤erent reference standard as they have already experienced more
favorable ratings, which may cause their reduced motivation. This is in line
with recent �eld studies by Ockenfels et al. (2010) and Clark et al. (2010)
showing that the violation of reference points for bonus payments can have
detrimental e¤ects on subsequent performance.
A di¤erent potential explanation for this observation would be that forced
distribution leads to a di¤erent pattern of exhaustion in the second part of the
experiment. To test this we compare the BaseFds treatment to the treatment
in which the forced distribution has been used throughout the experiment.
But as column (1) of table 9 shows, the forced distribution system in the
second part performs worse after the baseline setting as compared to the
situation in which agents work under a forced distribution right from the be-
ginning. Hence, it is indeed the experience of the baseline setting with higher
grades and bonuses which leads to a demotivational e¤ect of the forced distri-
bution. The negative perception of this relative loss of payments apparently
seems to counteract the positive forces of increased di¤erentiation.
We can also compare the performance of the baseline condition after the
experience of a forced distribution to the treatment in which the baseline
condition is kept over both parts of the experiment. The positive coe¢ cient
of FdsBase in column (2) indicates that the performance di¤erence to the
second part of BaseBase amounts to roughly 7% on average. Analogously to
the above reasoning workers in FdsBase seem to be particularly motivated
in the second part as they receive (on average) much better grades than un-
der the previous rating scheme. Relative to the workers who have already
received in�ated ratings over the �rst 8 rounds (BaseBase) the workers in
FdsBase could, thus, feel more inclined to reciprocate this relative increase
27

Dependent Variable: Group Outputt
BaseFds vs. BaseBase(1) (2)
Periods9-16
Periods9-16
BaseFds -0.855 5.372*(2.566) (3.147)
BaseFds � Period 10 -1.594(3.432)
BaseFds � Period 11 -7.844*(4.560)
BaseFds � Period 12 -8.125***(2.930)
BaseFds � Period 13 -8.844**(3.541)
BaseFds � Period 14 -7.438**(3.490)
BaseFds � Period 15 -7.781*(4.253)
BaseFds � Period 16 -8.188***(3.108)
Group Ability 0.675*** 0.675***(0.082) (0.083)
Constant 40.55*** 37.44***(4.576) (4.461)
Observations 256 256Number of Subjects 32 32Wald Chi2 148.70 325.12
Robust standard errors in parentheses
*** p<0.01, ** p<0.05, * p<0.1Random e¤ects regression (period dummies included)
Table 8: E¤ects of the Introduction of a Forced Distribution (BaseFds vs.BaseBase, periods 9-16)
28

in bonus payments. Yet, another factor driving this result is that supervi-
sors keep up di¤erentiation even after forced distribution has been abolished.
Indeed, we �nd some evidence that supervisors in FdsBase tend to di¤er-
entiate more during the second part than their counterparts in BaseBase.
Workers ranked 2nd or 3rd in a group are signi�cantly less likely to receive a
"1" for a given output and more likely to receive a "4" or "5" in second part
of FdsBase than in BaseBase (see table A4). Hence, the experience with
a forced distribution apparently has helped to establish a norm of making
performance-contingent ratings which indeed leads to a better performance.
Dependent Variable: Group Output
BaseFds vs. FdsFds BaseBase vs. FdsBase(1) (2)
Periods9-16
Periods9-16
BaseFds -5.763*(2.994)
FdsBase 4.591*(2.363)
Group Ability 0.514*** 0.644***(0.087) (0.105)
Constant 56.09*** 41.04***(5.187) (5.312)
Observations 256 256Number of Groups 32 32Wald Chi2 318.06 57.95
Robust standard errors in parentheses, *** p < 0.01, ** p < 0.05, * p < 0.1
Random e¤ects regression (period dummies included)
Table 9: Introducing and Abolishing Forced Distribution
Additional evidence for these arguments comes from our post-experimental
questionnaire. We pose participants who experience both settings in BaseFds
and FdsBase a variety of questions separately for both parts of the exper-
29

iment. Especially workers in BaseFds feel that their e¤ort pays more o¤
and that their well-being is more important to the supervisor during the
baseline setting. They also state that the supervisor�s behavior is more fair
and that he is more capable of giving appropriate ratings in the absence of
Fds.24 The supervisors naturally also express some dissatisfaction towards
the forced distribution as, for instance, they feel the rating decision to be
more di¢ cult in the second part of BaseFds which is well in line with the
�ndings by Schleicher et al. (2009).
4 Conclusion
We study the impact of a forced distribution in a real e¤ort experiment in
which performance is endogenously evaluated by participants. Our key result
is that performance is by about 8% higher under the forced distribution in a
between-subjects design. The reason for this substantial gain in performance
is that many supervisors in the baseline setting seem to be too lenient in their
rating decisions and, hence, performance incentives are too weak. But even
within the baseline setting those supervisors who choose less lenient and more
di¤erentiated ratings attain a higher performance. The forced distribution
system creates stronger performance incentives across all supervisors.
Moreover, we analyze potential e¤ects of the supervisor�s social prefer-
ences on rating behavior. We �nd that a supervisor�s social preferences have
a substantial impact on her rating behavior in the baseline setting. More
�compassionate�supervisors who care more for the well-being of the agents
indeed assign more lenient ratings, and more �envious� supervisors do the
opposite. These di¤erences vanish under a forced distribution.
But our results also indicate that it may be problematic to set up a forced
24We apply the Wilcoxon-Signed Rank test for dependent pairs for the answers of eachsubject related to the two settings Base and Fds in BaseFds. All di¤erences reportedhere are signi�cant at a level of at least 10%, two-tailed. Di¤erences in survey answers inFdsBase are quite similar but not consistently signi�cant.
30

distribution when employees have experienced a more �liberal�system of per-
formance evaluations before. Most importantly, in our within-subjects design
we �nd that the introduction of a forced distribution leads to a short-term
performance increase which is followed by a rather sharp drop in perfor-
mance. Apparently, while the participants initially understand that they
need to work harder under a forced distribution they are soon demotivated
as they cannot attain the good grades and high bonuses they have earned
before. On the other hand, some experience with the forced distribution in
the beginning demonstrates supervisors the bene�ts of di¤erentiation as they
tend to di¤erentiate more and attain a higher performance even in the base-
line setting as compared to supervisors without the experience of a forced
distribution.
Our results have several interesting implications for the design of per-
formance evaluation schemes in practice. First of all, forced distribution
systems may indeed lead to performance increases as sometimes conjectured
by practitioners. However, our results also show that �history matters�, i.e.
when changing the rules of performance evaluations, system designers have
to take the employees�as well as supervisors�reference standards and expec-
tations regarding appraisals and bonus payments into account. These have
been shaped by their previous experience and the way in which appraisals
have been assigned in the past. But these reference standards carry over to
the new system and a¤ect the social, economic and psychological mechanisms
at work in the appraisal process.
31

References
Abeler, J., S. Altmann, S. Kube, and M. Wibral (2010). Gift exchange
and workers� fairness concerns - when equality is unfair. Journal of the
European Economic Association (forthcoming).
Ahn, T. S., I. Hwang, and M.-I. Kim (2008). Discriminability of subjective
performance measures and its impact on ratee incentives. Working Paper .
Akerlof, G. A. and J. L. Yellen (1990). The fair wage-e¤ort hypothesis and
unemployment. The Quarterly Journal of Economics 105 (2), 255�83.
Arvey, R. and K. Murphy (1998). Performance evaluation in work settings.
Annual Review of Psychology 49 (1), 141�168.
Bellemare, C. and B. Shearer (2009). Gift giving and worker productiv-
ity: Evidence from a �rm-level experiment. Games and Economic Behav-
ior 67 (1), 233 �244. Special Section of Games and Economic Behavior
Dedicated to the 8th ACM Conference on Electronic Commerce.
Bernardin, H., D. Cooke, and P. Villanova (2000). Conscientiousness and
agreeableness as predictors of rating leniency. Journal of Applied Psychol-
ogy 85, 232�236.
Blanco, M., D. Engelmann, and H. Normann (2007). A within-subject analy-
sis of other-regarding preferences. Manuscript, Royal Holloway.
Bol, J. C. (2009). The determinants and performance e¤ects of supervisor
bias. Working Paper .
Boyle, M. (2001). Performance reviews: Perilous curves ahead. Fortune 143,
187�188.
Bretz, R. D. J., G. T. Milkovich, and W. Read (1992). The current state
of performance appraisal research and practice: Concerns, directions, and
implications. Journal of Management 18, 321�352.
32

Charness, G. (2004). Attribution and reciprocity in an experimental labor
market. Journal of LaborEconomics 22, 665�688.
Charness, G. and M. Rabin (2002). Understanding social preferences with
simple tests. Quarterly Journal of Economics 117, 817�869.
Clark, A. E., D. Masclet, and M. C. Villeval (2010). E¤ort and comparison
income: Experimental and survey evidence. Industrial and Labor Relations
Review 63 (3), 407�426.
Cohn, A., E. Fehr, and L. Goette (2009). Fairness and e¤ort: Evidence from
a �eld experiment. Working Paper .
Dannenberg, A., T. Riechmann, B. Sturm, and C. Vogt (2007). Inequity
aversion and individual behavior in public good games: An experimental
investigation. Working Paper .
Engellandt, A. and R. T. Riphahn (2008). Incentive e¤ects of bonus pay-
ments: Evidence from an international company. Industrial Labor Relation
Review forthcoming.
Fehr, E., S. Gächter, and G. Kirchsteiger (1997). Reciprocity as a contract
enforcement device - experimental evidence. Econometrica 64, 833�860.
Fehr, E., G. Kirchsteiger, and A. Riedl (1993). Does fairness prevent mar-
ket clearing? an experimental investigation. Quarterly Journal of Eco-
nomics 108, 437�460.
Fehr, E. and K. M. Schmidt (1999). A theory of fairness, competition, and
cooperation. Quarterly Journal of Economics 114, 817�868.
Fischbacher, U. (2007). z-tree: Zurich toolbox for ready-made economic
experiments. Experimental Economics, 171�178.
33

Gibbs, M., K. A. Merchant, W. A. van der Stede, and M. E. Vargus (2003).
Determinants and e¤ects of subjectivity in incentives. The Accounting
Review 79, 409�436.
Gneezy, U. and J. A. List (2006). Putting behavioral economics to work:
Testing for gift exchange in labor markets using �eld experiments. Econo-
metrica 74 (5), 1365�1384.
Greiner, B. (2004). The online recruitment system orsee - a guide for the
organization of experiments in economics.
Hannan, R. L., J. H. Kagel, and D. V. Moser (2002). Partial gift exchange in
an experimental labor market: Impact of subject population di¤erences,
productivity di¤erences, and e¤ort requests on behavior. Journal of Labor
Economics 20 (4), 923�951.
Harbring, C. and B. Irlenbusch (2009). Sabotage in tournaments: Evidence
from a laboratory experiment. IZA Discussion Paper No. 4205 .
Hennig-Schmidt, H., B. Rockenbach, and A. Sadrieh (2010). In search of
workers�real e¤ort reciprocity - a �eld and a laboratory experiment. Jour-
nal of the European Economic Association (forthcoming).
Jawahar, J. and C.Williams (1997). Where all the children are above average:
A meta analysis of the performance appraisal purpose a¤ect. Personnel
Psychology 50 (4), 905�925.
Kampkötter, P. and D. Sliwka (2010). Di¤erentiation and performance - an
empiricial investigation on the incentive e¤ects of bonus plans. mimeo.
Kane, J. S., H. J. Bernardin, P. Villanova, and J. Peyre�tte (1995). Stability
of rater leniency: Three studies. Academy of Management Journal 38 (4),
1036 �1051.
34
Kube, S., M. A. Maréchal, and C. Puppe (2010). Do wage cuts damage work
morale? evidence from a natural �eld experiment. IEW Working Paper
No. 377 .
Landy, F. J. and J. L. Farr (1980). Performance rating. Psychological Bul-
letin 87, 72�107.
Lazear, E. P. and S. Rosen (1981). Rank-order tournaments as optimum
labor contracts. Journal of Political Economy 89, 841�864.
Moers, F. (2005). Discretion and bias in performance evaluation: the impact
of diversity and subjectivity. Accounting, Organizations and Society 30,
67�80.
Murphy, K. J. (1992). Performance measurement and appraisal: Motivating
managers to identify and reward performance. In W. J. J. Burns (Ed.),
Performance Measurement, Evaluation, and Incentives, Boston, MA, pp.
37�62. Harvard Business School Press.
Murphy, K. R. and J. N. Cleveland (1995). Understanding Performance
Appraisal. Thousand Oaks: Sage.
Ockenfels, A., D. Sliwka, and P. Werner (2010). Bonus Payments and Refer-
ence Point Violations. IZA Discussion Paper No. 4795 .
Orrison, A., A. Schotter, and K. Weigelt (2004). Multiperson tournaments:
An experimental examination. Management Science 50 (2), 268�279.
Prendergast, C. and R. Topel (1996). Favoritism in organizations. Journal
of Political Economy 104, 958�978.
Prendergast, C. J. (1999). The provision of incentives in �rms. Journal of
Economic Literature 37, 7�63.
Prendergast, C. J. and R. H. Topel (1993). Discretion and bias in performance
evaluation. European Economic Review 37, 355�65.
35

Rynes, S., B. Gerhart, and L. Parks (2005). Personnel Psychology: Perfor-
mance Evaluation and Pay for Performance. Annual Review of Psychol-
ogy 56, 571�600.
Schleicher, D. J., R. A. Bull, and S. G. Green (2009). Rater reactions to
forced distribution rating systems. Journal of Management 35, 899�927.
Schotter, A. and K. Weigelt (1992). Asymmetric tournaments, equal oppor-
tunity laws, and a¢ rmative action: some experimental results. Quarterly
Journal of Economics 107, 511�539.
Scullen, S. E., P. K. Bergey, and L. Aiman-Smith (2005). Forced distribution
rating systems and the improvement of workforce potential: A baseline
simulation. Personnel Psychology 58, 1�32.
36

5 Appendix
37
DependentVariable:
Finished
Correct
False
False/Correct
Blocks
Blocks
Blocks
Blocks
BaseBasevs.FdsFds
(1)
(2)
(3)
(4)
Periods
1-16
Periods
1-16
Periods
1-16
Periods
1-16
Fds
3.500**
2.833**
0.667
0.0082
(1.558)
(1.161)
(0.712)
(0.020)
GroupAbility
0.259***
0.255***
0.0039
-0.0011
(0.059)
(0.043)
(0.026)
(0.001)
Constant
17.69***
14.09***
3.608***
0.204***
(2.943)
(1.875)
(1.391)
(0.041)
Observations
512
512
512
512
NumberofGroups
3232
3232
WaldChi2
1847.14
2761.22
138.57
150.84
Robuststandarderrorsinparentheses,***p<0.01,**p<0.05,*p<0.1
Randome¤ectsregression(perioddummiesincluded)
TableA1:ThePerformanceE¤ectofForcedDistribution
38

Dependent Variable: Group Output
BaseBase(1) (2)
Periods9-16
Periods9-16
Item: "I gave bad grades to motivate the workers" 0.989*(0.571)
Item: "I gave bad grades to sanction the workers" 1.305**(0.599)
Group Ability 0.654*** 0.639***(0.119) (0.075)
Constant 34.49*** 34.68***(5.526) (3.536)
Observations 128 128Number of Groups 16 16Wald Chi2 146.47 415.85
Robust standard errors in parentheses *** p < 0.01, ** p < 0.05, * p < 0.1
Random e¤ects regression (period dummies included)
Items on a 7-point scale running from 1 "does not apply at all" to 7 "fully applies"
Table A2: The Impact of Deliberate Di¤erentiation - Questionaire Items
39
Game A Game BPair I Pair II Pair I Pair IIPayo¤s (in e) for Player Payo¤s (in e) for Player
# 1 2 1 2 �i 1 2 1 2 �is 1 1.00 1.00 0.05 4.45 -0.19 5.00 0.00 0.00 0.00 1.00w 2 1.00 1.00 0.71 4.39 -0.14 5.00 0.00 0.25 0.25 0.98i 3 1.00 1.00 1.11 3.89 0.00 5.00 0.00 0.50 0.50 0.93t 4 1.00 1.00 1.36 3.64 0.10 5.00 0.00 0.75 0.75 0.88c 5 1.00 1.00 1.42 3.58 0.18 5.00 0.00 1.00 1.00 0.83h 6 1.00 1.00 1.66 3.34 0.30 5.00 0.00 1.25 1.25 0.78i 7 1.00 1.00 1.76 3.24 0.46 5.00 0.00 1.50. 1.50. 0.73n 8 1.00 1.00 1.84 3.16 0.58 5.00 0.00 1.75 1.75 0.68g 9 1.00 1.00 1.90 3.10 0.70 5.00 0.00 2.00 2.00 0.63
10 1.00 1.00 1.93 3.07 0.79 5.00 0.00 2.25 2.25 0.58p 11 1.00 1.00 1.96 3.04 0.85 5.00 0.00 2.50 2.50 0.53o 12 1.00 1.00 2.03 2.97 1.00 5.00 0.00 2.75 2.75 0.48i 13 1.00 1.00 2.07 2.93 1.18 5.00 0.00 3.00 3.00 0.43n 14 1.00 1.00 2.09 2.91 1.30 5.00 0.00 3.25 3.25 0.38t 15 1.00 1.00 2.12 2.88 1.41 5.00 0.00 3.50 3.50 0.33
16 1.00 1.00 2.14 2.86 1.54 5.00 0.00 3.75 3.75 0.28I 17 1.00 1.00 2.16 2.84 1.66 5.00 0.00 4.00 4.00 0.23to 18 1.00 1.00 2.18 2.82 1.77 5.00 0.00 4.25 4.25 0.18II 19 1.00 1.00 2.19 2.81 1.90 5.00 0.00 4.50 4.50 0.13
20 1.00 1.00 2.21 2.79 2.02 5.00 0.00 4.75 4.75 0.0821 1.00 1.00 2.22 2.78 2.13 5.00 0.00 5.00 5.00 0.0322 1.00 1.00 2.50 2.50 2.18 5.00 0.00 5.25 5.25 0.00
Table A3: Eliciting Fehr/Schmidt parameters for inequity aversion using anadjusted version of the experimental procedure developed by Dannenberg etal. 2007. "#" indicates the unique switching point from pair I to pair II.
40

Dependent Variable: Grade = 1 Grade = 4 or 5
FdsBase vs. BaseBase(1) (2)
Periods9-16
Periods9-16
Output 0.422*** -0.339***(0.066) (0.071)
FdsBase -2.183*** 1.395**(0.658) (0.673)
Constant -9.567*** 3.043***(1.541) (1.091)
Observations 493 493Number of Subjects 93 93Wald Chi2 47.84 25.16
Standard errors in parentheses
*** p < 0.01, ** p < 0.05, * p < 0.1
Random e¤ects probit regression (period dummies included)
Table A4: Ratings of Middle and Low Performers in the 2nd Part of theExperiment
Sample instructions for the �rst part of the experiment
First Part
This is the beginning of part one of the experiment. Please read the
following instructions carefully. After having read the instructions you will
�nd some test questions on your screen. The �rst part of the experiment is
going to start as soon as all participants will have answered all the questions
correctly.
SummaryThe �rst part of the experiment consists of 8 rounds. Each round lasts two
and a half minutes. In each round there are 4 participants per group. The
group composition will be kept constant over the 8 rounds. No participant
41
will ever learn about the identity of any other participant in the group.
In this part of the experiment there are supervisors and workers. Out of
the 4 participants per group one has the role of the supervisor and the other
three are workers. The workers are denoted as �Worker A�, �Worker B�or
�Worker C�. You will keep this name during the whole part.
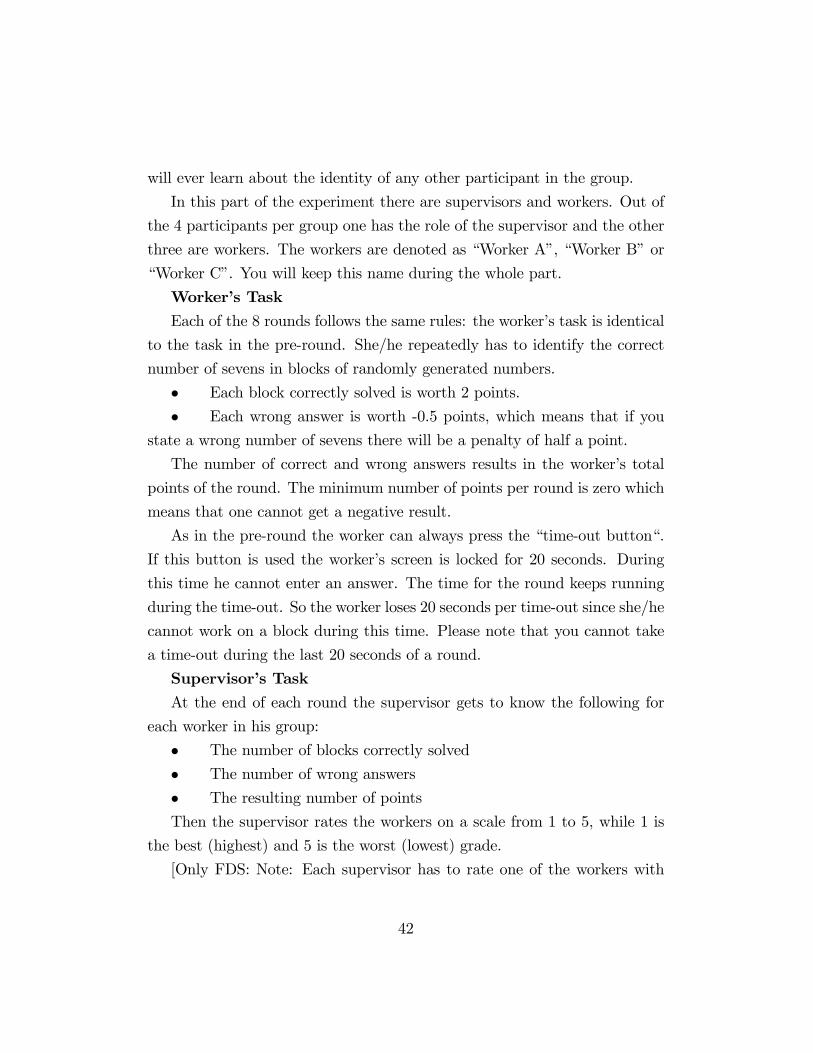
Worker�s TaskEach of the 8 rounds follows the same rules: the worker�s task is identical
to the task in the pre-round. She/he repeatedly has to identify the correct
number of sevens in blocks of randomly generated numbers.
� Each block correctly solved is worth 2 points.
� Each wrong answer is worth -0.5 points, which means that if you
state a wrong number of sevens there will be a penalty of half a point.
The number of correct and wrong answers results in the worker�s total
points of the round. The minimum number of points per round is zero which
means that one cannot get a negative result.
As in the pre-round the worker can always press the �time-out button�.
If this button is used the worker�s screen is locked for 20 seconds. During
this time he cannot enter an answer. The time for the round keeps running
during the time-out. So the worker loses 20 seconds per time-out since she/he
cannot work on a block during this time. Please note that you cannot take
a time-out during the last 20 seconds of a round.
Supervisor�s TaskAt the end of each round the supervisor gets to know the following for
each worker in his group:
� The number of blocks correctly solved
� The number of wrong answers
� The resulting number of points
Then the supervisor rates the workers on a scale from 1 to 5, while 1 is
the best (highest) and 5 is the worst (lowest) grade.
[Only FDS: Note: Each supervisor has to rate one of the workers with
42

�1�or �2�, another one with �3�and one with �4�or �5�after each round.]
After the supervisor has completed her/his rating the workers get to know
the following:
� The number of tasks correctly solved and number of wrong answers
by herself/himself and the other workers in the group
� The resulting points
� The own rating (not those of the others)
� The own frequency of pushing the �timeout-button�
� The own payment for the round
PaymentPlease note: Even though the amount is displayed after each round only
one of the 8 rounds will actually be paid out. The payo¤-relevant round
will be publicly allotted at the end of the experiment. As the round will
be randomly identi�ed each of the eight rounds could be relevant for your
payment which you will receive for the �rst part of the experiment.
Supervisor�s PaymentThe supervisor�s payment is solely determined by the points achieved by
his workers in the round. For each point achieved by a worker the supervisor
gets 30 cents.
Worker�s PaymentThe worker�s payment is determined by the rating assigned by the super-
visor for the round:
Rating Payment1 10.00 e2 7.50 e3 5.00 e4 2.50 e5 0.00 e
For the grade �1� the worker would receive 10 Euros, for a �2� 7.50 Euros,
43
for a �3� 5 Euros, for a �4� 2.50 Euros and for a �5� 0 Euro.
In addition to that the payment is determined by the frequency of pushing
the �timeout-button�. Per usage of the �timeout-button�the worker gets 25
cents.
If there are any questions left please raise your hand. We will then come
to your cabin.
44