performance and aging study of a proton exchange …
TRANSCRIPT
Int. J. Electrochem. Sci., 14 (2019) 10469 – 10489, doi: 10.20964/2019.11.54
International Journal of
ELECTROCHEMICAL SCIENCE
www.electrochemsci.org
Performance and Aging Study of a Proton Exchange Membrane
with Different Materials at Different Temperatures and
Humidities
Bai Qiang1, Li Shaobo1,*, Chuang-Yu Hsieh2, Fang-Bor Weng3, Hsiou-Ming Ou3
1 College of Mechanical Engineering, Guizhou University, Guiyang 550000, P R China; 2 Department of Automotive Engineering, Tsinghua University, Beijing 100084, P R China; 3 Department of Mechanical Engineering & Fuel Cell Center, Yuan Ze University, Taoyuan 320,
Taiwan *E-mail: [email protected]
Received: 29 May 2019 / Accepted: 10 September 2019 / Published: 7 October 2019
By changing the material for a membrane electrode assembly (MEA) of a fuel cell and controlling the
mode of gas inflow, along with the working temperature and humidity, the performance change of the
fuel cell and the aging of the MEA under low humidity were studied. It was found that with the
decrease of humidity from 100% RH to 50% RH, the decline of cell performance ranged from 8.4% to
64%. Due to the hydrophilicity of silicon dioxide (SiO2), the addition of SiO2 into the MEA helped the
membrane have better water retention; the current density greatly increased with a decline of cell
performance that ranged from 17% to 44% at 50% RH. After the area of the MEA was increased, it
was found that with a decrease of relative humidity, the performance decreased by 21% - 36%. Under
100% RH and after a 100-h cyclic dynamic load aging test, the performance decline of fuel cells was
27.2% and the performance decline of the ECSA was 33.3%. Under 50% RH, the performance
decrease was 51.8% and the ECSA decrease was 55.3%. The impedance increase and the fluctuating
decrease of the OCV of fuel cells under 100% RH were obviously less than those under 50% RH.
Keywords: Humidity; Silicon Dioxide; Membrane Aging; Performance Decline
1. INTRODUCTION
A proton exchange membrane fuel cell (PEMFC) has characteristics of low pollution, high
energy conversion efficiency (approximately 40-60%), near normal temperature operation (40-100℃)
and fast start-up [1-3]; thus, it is suitable for transportation, portable power and household generators.
However, there are several problems in the commercial use of fuel cells, one of which is water
management, which will affect the performance and life of the cells [4-6]. At present, one of the
Int. J. Electrochem. Sci., Vol. 14, 2019
10470
development directions of automotive and portable fuel cells is operating at high temperature and low
humidity. In this environment, a lack of water in the MEA will lead to insufficient hydrogen ion
conduction, which will decrease the performance of the cells. Currently, the research of MEA with
high temperature and low humidity is mainly divided into the following aspects: hydrophilic or
hydrophobic materials are added to the gas diffusion layer and the catalytic layer to improve the
performance of fuel cells in a high-temperature and low-humidity environment [7-11]; a MEA is
prepared by a new technology, and the operation of PEMFC under conditions of low or no humidity
are studied [12]; a change of the catalyst content in the MEA catalyst layer or the use of a new catalyst
material to explore the change of cell performance in a high-temperature and low-humidity
environment [11-13]; or a theoretical model of PEMFCs is established to analyze the water balance in
the working process, and the performance of the cells is improved by optimizing the parameters [14-
15]. In addition, long-term operation of the cells in a high-temperature and low-humidity environment
accelerates the aging and performance decline of MEA. Therefore, research on the causes of
membrane aging is also a hot topic in research. Researchers from several groups found that the
dissolution and aggregation of Pt catalysts were the main reasons for the performance decline of cells
[16-20]. At the same time, it was found that the corrosion of the carbon plate also led to a performance
decline of the cells [20]. Another important research direction is to improve the performance of cells or
delay the performance decline by changing the material of the catalyst or carbon plate [20-25]. It was
found that the performance decline of cells and the aging of MEA are quite different under different
working conditions (such as acidic, alkaline or with strongly oxidizing working conditions) or different
working modes (such as frequent stop-start, long-time full-load or low-load operations) [26-28]. Wang
Likun and coworkers [29,30] found that the technology of a nanoplatelet alloy/Nafion catalytic
interface and gold nanoparticle/titania ultrathin film heterogeneous catalysts can improve the PEMFC
performance in hydrogen containing a small amount of monoxide. This research will greatly promote
the commercialization of PEMFCs and reduce the cost of hydrogen.
In this paper, a Pt CCM (catalyst-coated membrane, a slow spraying process in which a catalyst
solution is sprayed directly on an MEA to overcome the wet expansion problem of the MEA) is
applied on an MEA; the content of the Pt catalyst at the anode and cathode is 0.2 mg/cm2 and 0.4
mg/cm2, respectively. The changes in cell performance at different operating temperatures, gas flow
rates and levels of relative humidity are studied. Based on the water retention of SiO2 [8, 9], the
performance change of the cell under high temperature and low humidity is investigated by adding
SiO2 to the catalyst layer. The changes to the electrochemically active surface area (ECSA), AC
impedance and open-circuit voltage (OCV) of the cell under different levels of humidity are studied by
dynamic load during long-term cycling, and the deep-seated causes of aging and decline of cell
performance are further analyzed.
2. EXPERIMENTAL
2.1. Preparation of a fuel cell membrane
The membrane was made by CCM technology in a laboratory. CCMs can be divided into two
methods, with one being decal transfer (Decal-CCM), which sprays the catalyst solution onto the

Int. J. Electrochem. Sci., Vol. 14, 2019
10471
transfer substrate and then transfers the catalyst layer to both sides of a membrane by hot pressing. The
substrate used in this method was smoother than a GDL, so the interface impedance could be reduced.
Decal-CCM cannot accurately control the catalyst load on the artificial operation, and it is easy to
cause MEA performance instability due to uneven coating. Another method is direct spraying, direct
spraying combined with ultrasonic oscillator in spraying process can greatly improve the uniformity of
MEA spraying and precisely control the amount of catalyst to ensure the stability of MEA
performance. In summary, the direct spraying method was used as the preparation method of MEA.
Catalysts were sprayed onto the membrane by an automatic spraying machine (Sono-Tek, US),
and the electrolyte membrane was Nafion®-HP (DuPont Co. US). First, the catalyst (Johnson Matthey,
HiSPEC 4310, UK) was mixed with a 5 wt% Nafion solution (DuPont Co., USA), and then
isopropanol solvent (Jingming Chemical Company of China) and deionized water were added. The
content ratio of catalyst to Nafion was 2:1, and the solution was placed in an ultrasonic oscillator for
two hours to make the solution evenly distributed. Second, isopropanol was used to clean the spraying
pipeline of the automatic spraying machine. The air bottle was opened, and the temperature of the
heating plate was set to 90℃. Third, when the temperature of the heating plate reached 90℃, the
solution was placed in the automatic spraying machine (Sono-Tek, USA), and the positioning test was
done to determine whether the solution could be sprayed. Fourth, the spraying parameters were set,
and a test path was run to determine whether the spraying position was correct. After confirming
everything was correct, the spraying experiment was carried out. Fifth, after spraying, the MEA was
placed in a circulating oven and dried at room temperature for 24 h. Finally, the dried MEA was
weighed on a micro balance (Meltler-Toledo Pac Rim AG-XS205, Switzerland), and the spray weight
was calculated to ensure that the catalyst content met the experimental requirements.
2.2. Assembly process of a fuel cell
Industrial alcohol (Youhe Trading Company, China) was used to wipe and remove surface
stains from a bipolar plate and a graphite plate. An end plate and the bipolar plate were placed
together. Eight bolts were inserted into fixed positions in the end plate, and then a Teflon tube was
used to cover the bolts to prevent the bolt positions from shaking and the cathode and anode from
interfering. The graphite runner plate was placed on the bipolar plate, and an airtight gasket was fixed
on the graphite runner plate by a bolt. The MEA was fitted with an airtight gasket and the other half of
the cell was gently buckled on the MEA and fixed by a bolt. Finally, the tightening pressure was
increased to 25 kgf‧cm by a diagonally progressive method with a torque wrench, and the cell was
assembled.
2.3. Explanation of fuel cell testing
The first step before cell testing was activation. After activation for 12 hours, the stability and
performance of the polarization curve met the requirements, which indicated that the activation was
Int. J. Electrochem. Sci., Vol. 14, 2019
10472
completed. The performance of the cell was tested by a scanning voltage mode. The ECSA of the fuel
cell catalyst was measured by cyclic voltammetry. The formulas are as follows:
For equation (1), the unit of ECSA is m2/gPt, Ad is the integral area of the hydrogen adsorption
peak (AV), c is the coefficient of hydrogen adsorption of Pt (0.21 mC/cm2), m is the content of Pt in
the cathode (mg), and v is the scanning speed of the cyclic voltammetry (mV/sec). Equation (2) is the
integral area of the hydrogen adsorption peak, where i represents the measured current (mA), iDL is the
double-layer current (mA), and the integral range is approximately 0.05-0.4 V. Using the change of
high and low current as an aging test method for the fuel cell corresponded to the actual working
conditions of the cell. The operating voltage that corresponded to the high and low current in this
experiment was 0.6-0.8 V. After applying a cyclic dynamic load for a long period, the aging extent of
the cell was judged by the performance of the polarization curve, and the aging of the catalyst and
MEA was analyzed for electrochemical characteristics to understand the performance of the
accelerated aging.
2.4. Experiments on CV and EIS
In this paper, a model 850C fuel cell test platform (Scribner Associates) was used. First, the
fuel cell was activated, then the performance polarization curve was drawn, and the AC impedance of
the cell was measured. Finally, the electrochemically active surface area (ECSA) of the cell was
measured by cyclic voltammetry. The scanning rate of CV curves(0V ~ 1.2V) are 50mV/s. The
scanning rate of long time dynamic load is 0.1V/3s, and the voltage rises from 0.6 V ~ 0.8 V as a cycle.
The frequency range of EIS is 10KHz~0.1Hz, and a wide range of frequency scanning can more
accurately to distinguish the losses caused by various effects.
AC impedance is also called electrochemical impedance spectroscopy (EIS). AC impedance is
a measurement method where a small amplitude sinusoidal wave potential (or current) is applied as a
disturbance signal. On the one hand, it avoids large changes to the system; on the other hand, it can
also make the disturbance impact on the system approximately linear, which simplifies the
measurement data processing. EIS was used to diagnose the AC impedance of the cell under different
conditions and to estimate the basic characteristics of the membrane impedance, electrode impedance
and electrochemical dynamic mechanism. EIS was also used to calculate the influence of various
operating conditions on the performance of the cell. The performance loss caused by various effects
can also be more accurately distinguished by a wide range of frequency scanning. Cyclic voltammetry
can check the ECSA of the catalyst on the electrode. The basic analysis and measurement system was
established based on the test platform where the cathode and the anode were respectively fed with
hydrogen and air, and a different potential was set for the cell to observe the peak area of hydrogen
adsorption.
(1)
(2)
Int. J. Electrochem. Sci., Vol. 14, 2019
10473
3. RESULTS AND DISCUSSION
3.1. Effect of different relative humidity and gas supply on cell performance
Through relevant papers [31, 32, 33, 34, 35, 36, 37, 38, 39] and previous experiments, it was
found that the working voltage of commercial fuel cells was generally between 0.6-0.8 V; within this
range, the cells achieved relatively stable maximum power and performance. Based on this, the current
density at 0.6 V was used as the standard of cell performance. To simulate real working situations, a
cyclic voltage of 0.6 V-0.8 V was used as the working mode for a long-term dynamic load experiment
to detect the aging condition of fuel cell performance.
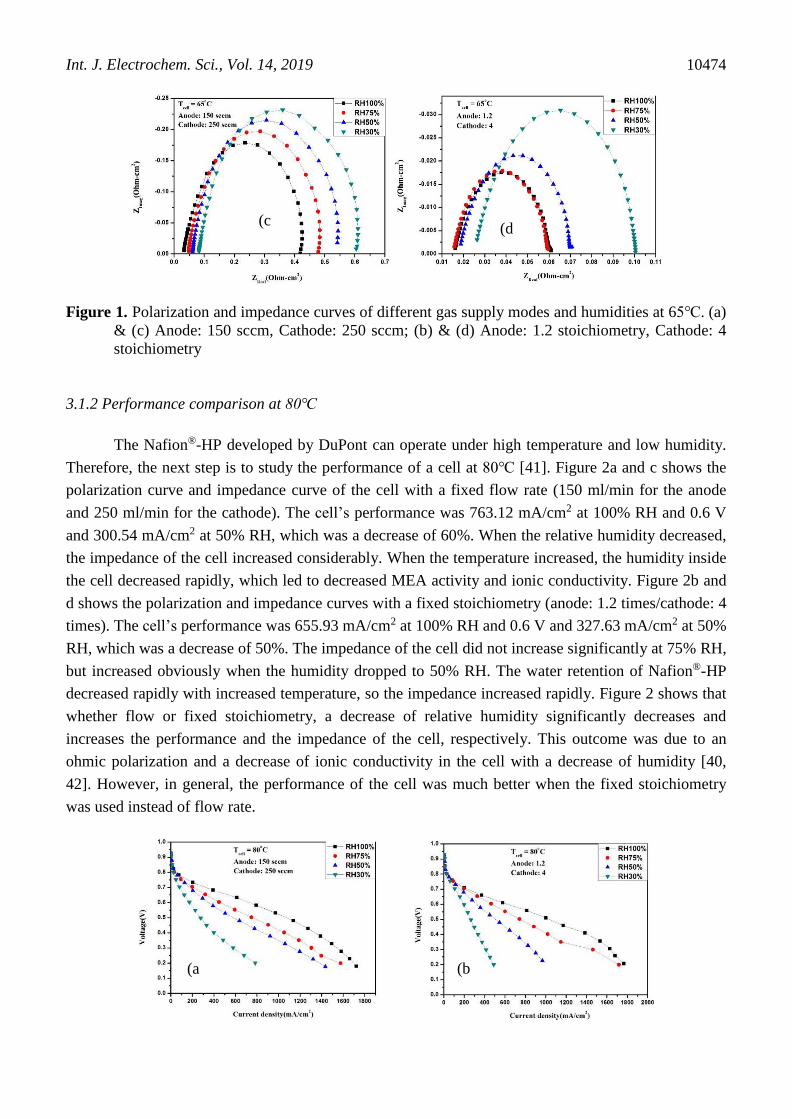
3.1.1 Performance comparison at 65℃ [40]
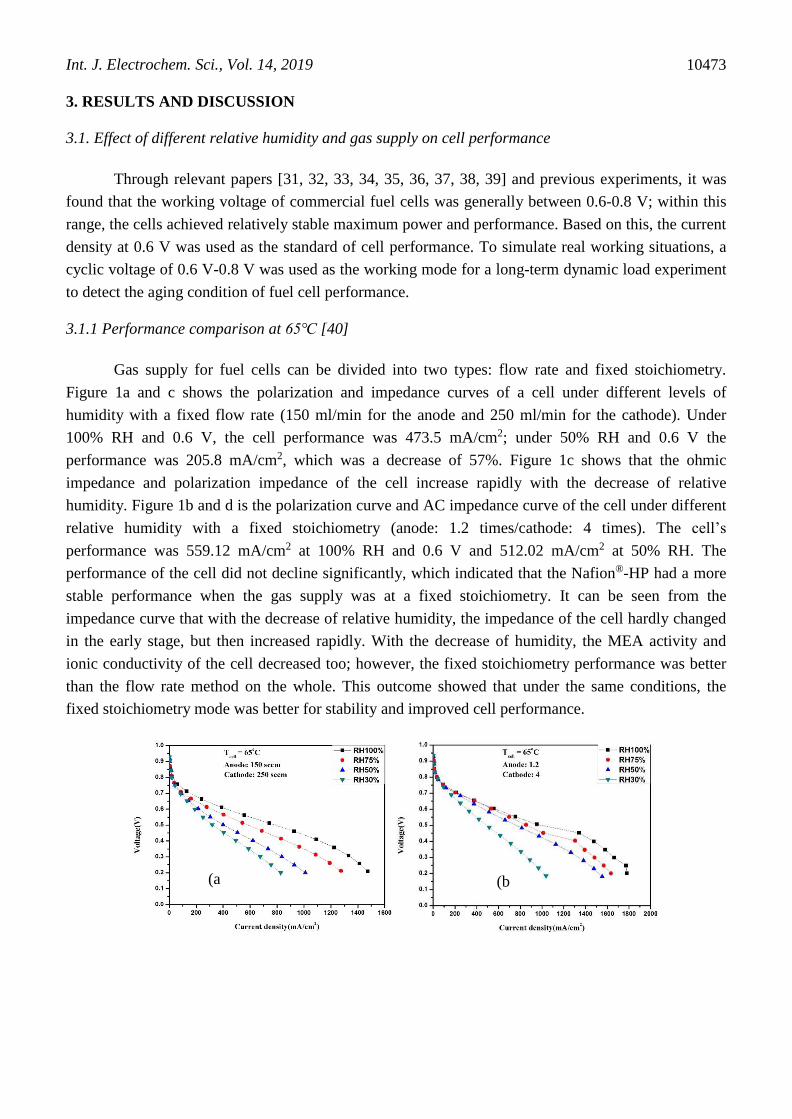
Gas supply for fuel cells can be divided into two types: flow rate and fixed stoichiometry.
Figure 1a and c shows the polarization and impedance curves of a cell under different levels of
humidity with a fixed flow rate (150 ml/min for the anode and 250 ml/min for the cathode). Under
100% RH and 0.6 V, the cell performance was 473.5 mA/cm2; under 50% RH and 0.6 V the
performance was 205.8 mA/cm2, which was a decrease of 57%. Figure 1c shows that the ohmic
impedance and polarization impedance of the cell increase rapidly with the decrease of relative
humidity. Figure 1b and d is the polarization curve and AC impedance curve of the cell under different
relative humidity with a fixed stoichiometry (anode: 1.2 times/cathode: 4 times). The cell’s
performance was 559.12 mA/cm2 at 100% RH and 0.6 V and 512.02 mA/cm2 at 50% RH. The
performance of the cell did not decline significantly, which indicated that the Nafion®-HP had a more
stable performance when the gas supply was at a fixed stoichiometry. It can be seen from the
impedance curve that with the decrease of relative humidity, the impedance of the cell hardly changed
in the early stage, but then increased rapidly. With the decrease of humidity, the MEA activity and
ionic conductivity of the cell decreased too; however, the fixed stoichiometry performance was better
than the flow rate method on the whole. This outcome showed that under the same conditions, the
fixed stoichiometry mode was better for stability and improved cell performance.
(a (b
Int. J. Electrochem. Sci., Vol. 14, 2019
10474
Figure 1. Polarization and impedance curves of different gas supply modes and humidities at 65℃. (a)
& (c) Anode: 150 sccm, Cathode: 250 sccm; (b) & (d) Anode: 1.2 stoichiometry, Cathode: 4
stoichiometry
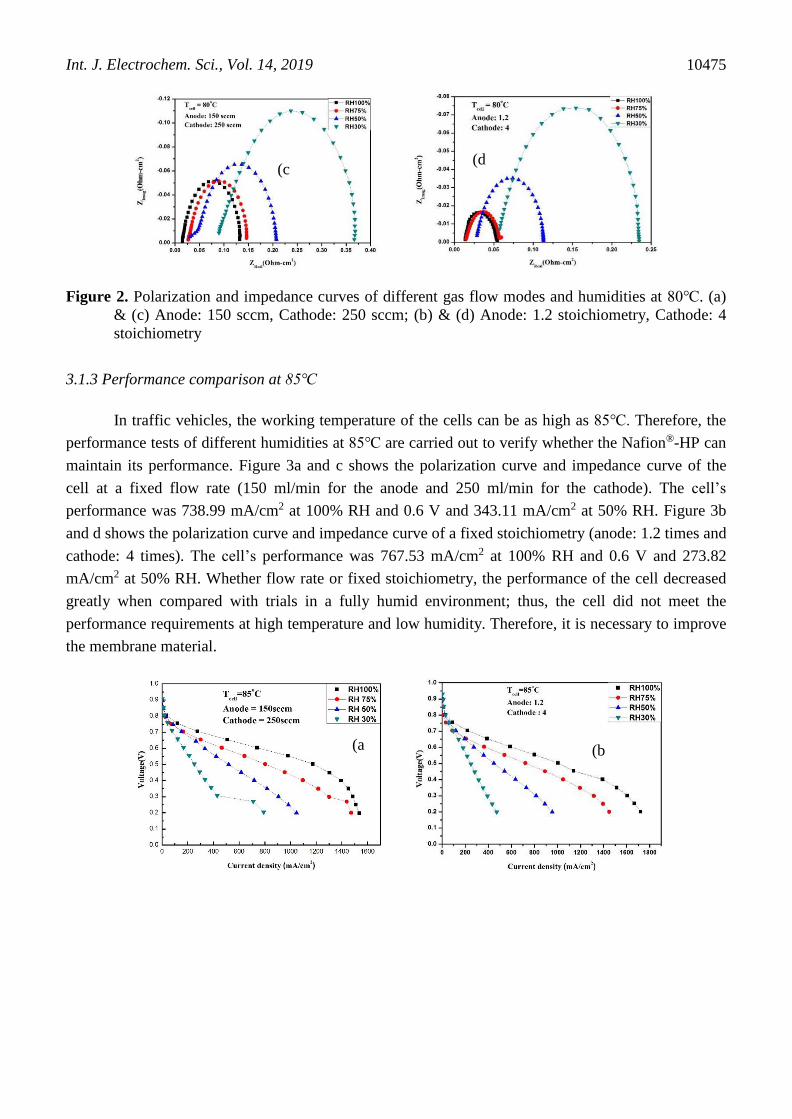
3.1.2 Performance comparison at 80℃
The Nafion®-HP developed by DuPont can operate under high temperature and low humidity.
Therefore, the next step is to study the performance of a cell at 80℃ [41]. Figure 2a and c shows the
polarization curve and impedance curve of the cell with a fixed flow rate (150 ml/min for the anode
and 250 ml/min for the cathode). The cell’s performance was 763.12 mA/cm2 at 100% RH and 0.6 V
and 300.54 mA/cm2 at 50% RH, which was a decrease of 60%. When the relative humidity decreased,
the impedance of the cell increased considerably. When the temperature increased, the humidity inside
the cell decreased rapidly, which led to decreased MEA activity and ionic conductivity. Figure 2b and
d shows the polarization and impedance curves with a fixed stoichiometry (anode: 1.2 times/cathode: 4
times). The cell’s performance was 655.93 mA/cm2 at 100% RH and 0.6 V and 327.63 mA/cm2 at 50%
RH, which was a decrease of 50%. The impedance of the cell did not increase significantly at 75% RH,
but increased obviously when the humidity dropped to 50% RH. The water retention of Nafion®-HP
decreased rapidly with increased temperature, so the impedance increased rapidly. Figure 2 shows that
whether flow or fixed stoichiometry, a decrease of relative humidity significantly decreases and
increases the performance and the impedance of the cell, respectively. This outcome was due to an
ohmic polarization and a decrease of ionic conductivity in the cell with a decrease of humidity [40,
42]. However, in general, the performance of the cell was much better when the fixed stoichiometry
was used instead of flow rate.
(c (d
(a (b
Int. J. Electrochem. Sci., Vol. 14, 2019
10475
Figure 2. Polarization and impedance curves of different gas flow modes and humidities at 80℃. (a)
& (c) Anode: 150 sccm, Cathode: 250 sccm; (b) & (d) Anode: 1.2 stoichiometry, Cathode: 4
stoichiometry
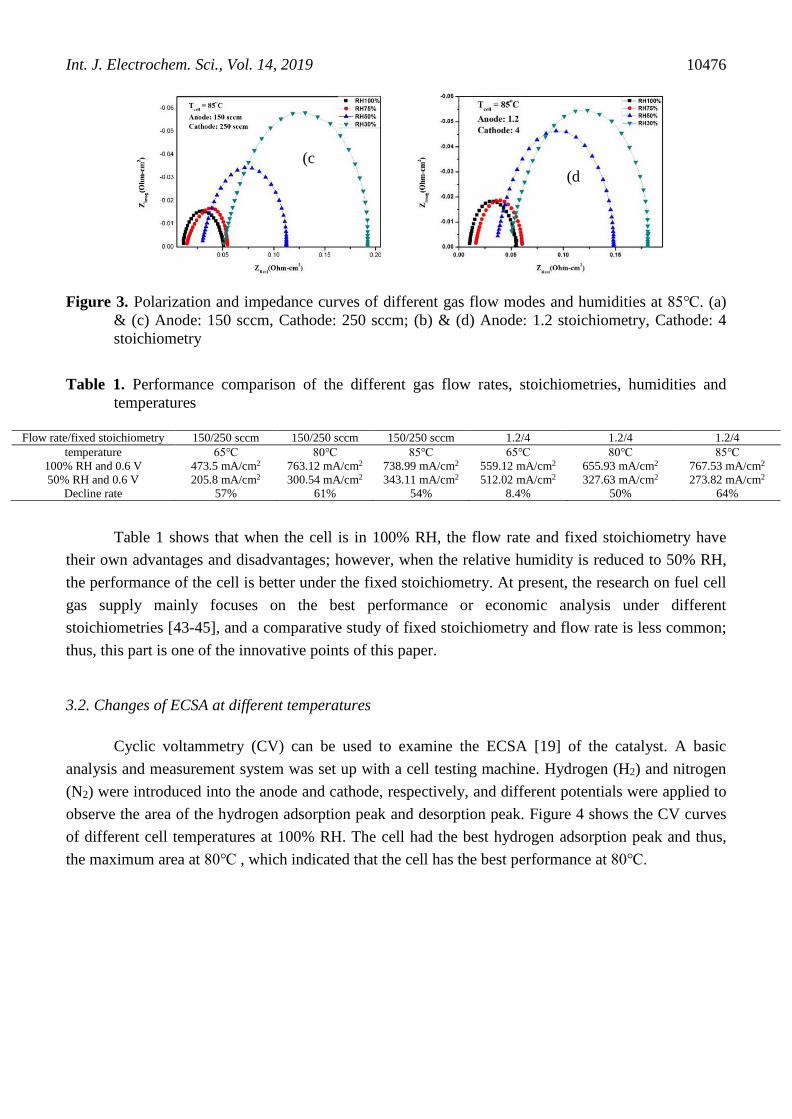
3.1.3 Performance comparison at 85℃
In traffic vehicles, the working temperature of the cells can be as high as 85℃. Therefore, the
performance tests of different humidities at 85℃ are carried out to verify whether the Nafion®-HP can
maintain its performance. Figure 3a and c shows the polarization curve and impedance curve of the
cell at a fixed flow rate (150 ml/min for the anode and 250 ml/min for the cathode). The cell’s
performance was 738.99 mA/cm2 at 100% RH and 0.6 V and 343.11 mA/cm2 at 50% RH. Figure 3b
and d shows the polarization curve and impedance curve of a fixed stoichiometry (anode: 1.2 times and
cathode: 4 times). The cell’s performance was 767.53 mA/cm2 at 100% RH and 0.6 V and 273.82
mA/cm2 at 50% RH. Whether flow rate or fixed stoichiometry, the performance of the cell decreased
greatly when compared with trials in a fully humid environment; thus, the cell did not meet the
performance requirements at high temperature and low humidity. Therefore, it is necessary to improve
the membrane material.
(c (d
(a (b
Int. J. Electrochem. Sci., Vol. 14, 2019
10476
Figure 3. Polarization and impedance curves of different gas flow modes and humidities at 85℃. (a)
& (c) Anode: 150 sccm, Cathode: 250 sccm; (b) & (d) Anode: 1.2 stoichiometry, Cathode: 4
stoichiometry
Table 1. Performance comparison of the different gas flow rates, stoichiometries, humidities and
temperatures
Flow rate/fixed stoichiometry 150/250 sccm 150/250 sccm 150/250 sccm 1.2/4 1.2/4 1.2/4
temperature
100% RH and 0.6 V
50% RH and 0.6 V
Decline rate
65℃
473.5 mA/cm2
205.8 mA/cm2
57%
80℃
763.12 mA/cm2
300.54 mA/cm2
61%
85℃
738.99 mA/cm2
343.11 mA/cm2
54%
65℃
559.12 mA/cm2
512.02 mA/cm2
8.4%
80℃
655.93 mA/cm2
327.63 mA/cm2
50%
85℃
767.53 mA/cm2
273.82 mA/cm2
64%
Table 1 shows that when the cell is in 100% RH, the flow rate and fixed stoichiometry have
their own advantages and disadvantages; however, when the relative humidity is reduced to 50% RH,
the performance of the cell is better under the fixed stoichiometry. At present, the research on fuel cell
gas supply mainly focuses on the best performance or economic analysis under different
stoichiometries [43-45], and a comparative study of fixed stoichiometry and flow rate is less common;
thus, this part is one of the innovative points of this paper.
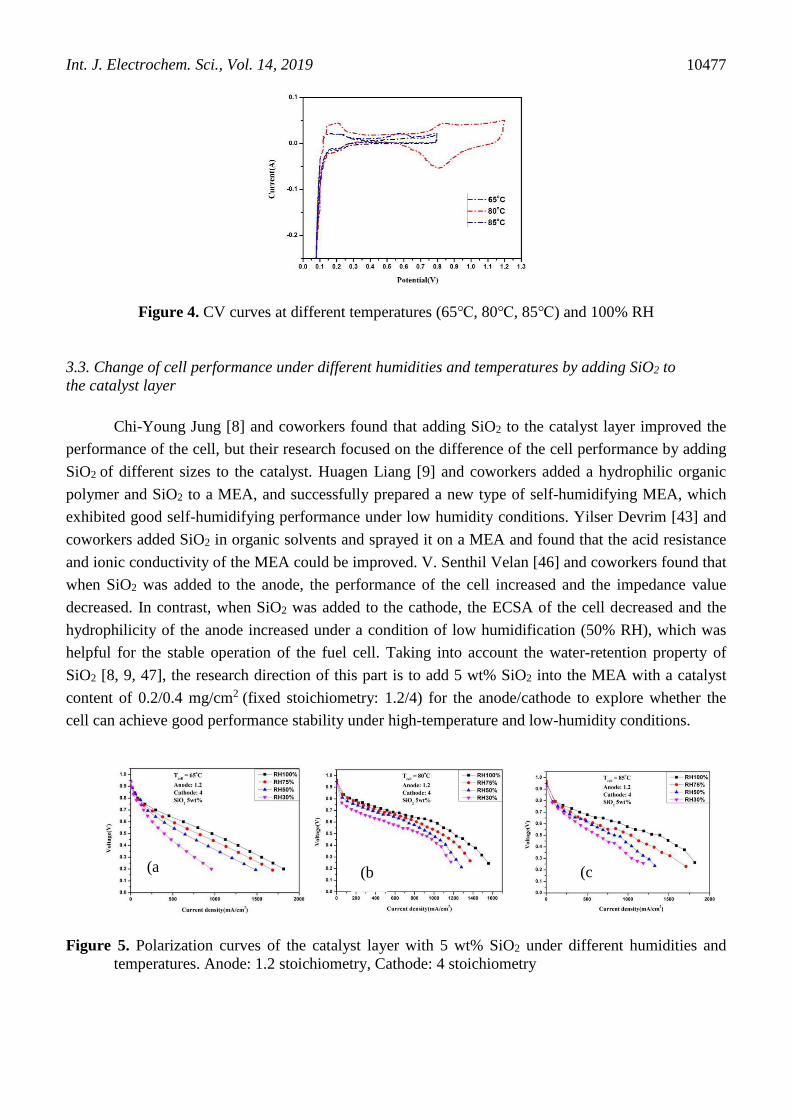
3.2. Changes of ECSA at different temperatures
Cyclic voltammetry (CV) can be used to examine the ECSA [19] of the catalyst. A basic
analysis and measurement system was set up with a cell testing machine. Hydrogen (H2) and nitrogen
(N2) were introduced into the anode and cathode, respectively, and different potentials were applied to
observe the area of the hydrogen adsorption peak and desorption peak. Figure 4 shows the CV curves
of different cell temperatures at 100% RH. The cell had the best hydrogen adsorption peak and thus,
the maximum area at 80℃ , which indicated that the cell has the best performance at 80℃.
(c
(d
Int. J. Electrochem. Sci., Vol. 14, 2019
10477
Figure 4. CV curves at different temperatures (65℃, 80℃, 85℃) and 100% RH
3.3. Change of cell performance under different humidities and temperatures by adding SiO2 to
the catalyst layer
Chi-Young Jung [8] and coworkers found that adding SiO2 to the catalyst layer improved the
performance of the cell, but their research focused on the difference of the cell performance by adding
SiO2 of different sizes to the catalyst. Huagen Liang [9] and coworkers added a hydrophilic organic
polymer and SiO2 to a MEA, and successfully prepared a new type of self-humidifying MEA, which
exhibited good self-humidifying performance under low humidity conditions. Yilser Devrim [43] and
coworkers added SiO2 in organic solvents and sprayed it on a MEA and found that the acid resistance
and ionic conductivity of the MEA could be improved. V. Senthil Velan [46] and coworkers found that
when SiO2 was added to the anode, the performance of the cell increased and the impedance value
decreased. In contrast, when SiO2 was added to the cathode, the ECSA of the cell decreased and the
hydrophilicity of the anode increased under a condition of low humidification (50% RH), which was
helpful for the stable operation of the fuel cell. Taking into account the water-retention property of
SiO2 [8, 9, 47], the research direction of this part is to add 5 wt% SiO2 into the MEA with a catalyst
content of 0.2/0.4 mg/cm2 (fixed stoichiometry: 1.2/4) for the anode/cathode to explore whether the
cell can achieve good performance stability under high-temperature and low-humidity conditions.
Figure 5. Polarization curves of the catalyst layer with 5 wt% SiO2 under different humidities and
temperatures. Anode: 1.2 stoichiometry, Cathode: 4 stoichiometry
(a (b (c

Int. J. Electrochem. Sci., Vol. 14, 2019
10478
Figure 5a shows the current density is 625.63 mA/cm2 at 0.6 V under 100% RH and 518.39
mA/cm2 at 50% RH, which is a decrease of 17%. The water generated by the electrochemical reaction
of the cell itself was preserved by adding SiO2, which improved the water content in the cell; thus, its
performance was better than without SiO2. Figure 5b shows that the performance with 0.6 V was
967.99 mA/cm2 at 80℃ and 100% RH, while the performance of 50% RH was 632.81 mA/cm2, which
was a decrease of 35%. Compared with a 50% decrease from a catalyst layer without added SiO2 and
under the same working conditions, the decreased performance was greatly reduced. It was found that
at low relative humidity, the addition of SiO2 in the catalyst layer moderately regulated the moisture
covering the catalyst surface and improved the performance and stability of the cell. Figure 5c shows a
performance of 991.02 mA/cm2 at 85℃, 100% RH and 0.6 V, which was consistent with the trend of
increasing current density when temperature increases. However, the performance at 50% RH was
557.74 mA/cm2, and the difference of performance between partial humidification and full
humidification was 44%. In low humidity, the dehydration of the cell was serious due to the increase
of temperature, and the performance of the MEA was greatly declined. Su [48] and coworkers added
10 wt% SiO2 to a catalyst layer to maintain performance stability at 28% RH. After 120 h of
accelerated aging, the decrease in performance was only approximately 10%. However, the operating
temperature of this research was 50℃ and found that with the increase of temperature, the
performance of the cell decreased rapidly, which was not in line with the actual operating conditions of
most fuel cells.
Table 2 shows that under the same working environment, adding 5 wt% SiO2 can greatly
improve the performance of the cell; when the relative humidity drops to 50% RH, adding 5 wt% SiO2
can reduce the decrease of the cell performance, which indicates that adding SiO2 can help the cell
maintain its performance in a low-humidity environment. The change of humidity had little effect on
the performance at low temperature, because low temperature reduces evaporation and was conducive
to moisture retention.
Table 2. Performance comparison of catalyst layers with and without SiO2
SiO2 No No No 5 wt% SiO2 5 wt% SiO2 5 wt% SiO2
temperature
100% RH and 0.6 V
50% RH and 0.6 V
Decline rate
65℃
559.12 mA/cm2
512.02 mA/cm2
8.4%
80℃
655.93
mA/cm2
327.63
mA/cm2
50%
85℃
767.53
mA/cm2
273.82
mA/cm2
64%
65℃
625.63
mA/cm2
518.39
mA/cm2
17%
80℃
967.99 mA/cm 2
632.81 mA/cm2
35%
85℃
991.02 mA/cm2
557.74 mA/cm2
44%
3.4 Expanding the MEA area to 25 cm2
Research on cell performance under high-temperature and low-humidity conditions has always
been a hot topic. Yan Yin and coworkers [11] found a novel Pt-C/Fe-N-S-C cathode dual catalyst layer
(CDCL), which was prepared using a catalyst sprayed membrane method. However, the performance
was not very stable and seriously deteriorated at high potential (0.7 V). Beom-Soo Koh and coworkers
[12] report a nanosized dense-structure (NSDS) layer coated onto a conventional catalyst layer, which

Int. J. Electrochem. Sci., Vol. 14, 2019
10479
formed a dual-layered electrode architecture that was favorable in promoting the self-humidification
process. At 0.6 V under 0% RH, the current density of MEA fabricated by this method was three times
higher than that of a traditional MEA. Sanying Hou and coworkers [49] prepared a MEA with a
Pt/SnO2-SiO2/C anode catalyst and achieved excellent low-humidity performance at 65℃. The
improvement of performance was attributed to the increased wettability of SnO2 and SiO2 in the cell
and the increased platinum activity of SnO2. Rong-Hsin Huang and coworkers [50] proposed using a
sputtering deposition to add hygroscopic zinc oxide (ZnO) nanoparticles to an anodic catalyst layer as
a water adsorbent. The MEA with 0.45 wt% ZnO in the anode catalyst layer revealed the best
performance at anode humidifier temperatures of 45℃ and 65℃, with power densities 43.91% and
25.80% higher than those without ZnO, respectively.
To meet the needs of commercial applications, the reaction area of MEA was expanded to 25
cm2, and the stoichiometry was fixed at 1.2 and 4. Figure 6 shows the performance curve at different
temperatures and relative humidities. Compared with 5 cm2, it was found that the cell ran smoothly
with an increase of MEA area, and the performance did not fluctuate greatly. This showed that a MEA
made by CCM technology had strong stability and the overall design and assembly of the cell was
reasonable.
Figure 6. Polarization curves at different temperatures and relative humidities after adding 5 wt% SiO2
to the catalyst layer (25 cm2). Anode: 1.2 stoichiometry, Cathode: 4 stoichiometry
Table 3. Performance changes of different areas under different humidities
area 5 cm2 5 cm2 5 cm2 25 cm2 25 cm2 25 cm2
temperature
100% RH and 0.6 V
50% RH and 0.6 V
Decline rate
65℃
625.63 mA/cm2
518.39 mA/cm2
17%
80℃
967.99
mA/cm2
632.81
mA/cm2
35%
85℃
991.02
mA/cm2
557.74
mA/cm2
44%
65℃
548.46
mA/cm2
428.49
mA/cm2
21%
80℃
826.36 mA/cm 2
558.06 mA/cm2
32%
85℃
705.60 mA/cm2
451.20 mA/cm2
36%
Table 3 compares the performance of MEA with an area of 5 cm2 and 25 cm2. The cell
performance decreased slightly with the increase of MEA area, because gas diffusion and water
management were more difficult with the increase of MEA area. However, it was also found that the
performance gap between 100% RH and 50% RH decreased to less than 36% with the increase of area,
which indicated that the large area MEA operated well in a low-humidity environment. With a
(a (b (c
Int. J. Electrochem. Sci., Vol. 14, 2019
10480
decrease of relative humidity, the performance of the cell also decreased, but regardless of the MEA
size, the decrease range was not significantly different, which indicated that the performance of the cell
remained stable when the area was enlarged.
3.5 Effect of a dynamic load on cell performance aging during long-term cycling
In this paper, the performance fluctuation of a cell under long working hours was analyzed
according to actual working conditions. Referring to relevant studies [51,52,53,54], it was found that
the operating temperature of commercial fuel cells was generally below 70℃, because the power
system with a smaller volume had less energy consumption. Higher working temperature increased the
complexity and volume of insulation equipment, increased the energy consumption of the whole
system, and reduced the life of the film. It was also found that temperature changes within a certain
range had little effect on cell performance [55]. On the other hand, water management has always been
a difficult problem for fuel cells. Reasonable water management will improve the performance of fuel
cells, but lack of water management will lead to performance degradation [56, 57, 58]. Relevant
studies found that higher temperature reduced the water content in the cell and resulted in decreased
conductivity of the membrane [57, 58]. With an increase of temperature, the evaporation rate of water
will also increase. When the temperature reaches the critical value of evaporating water exceeding the
water output of the fuel cell reaction, the membrane will begin to dry [59, 60, 61, 62] and decreases the
performance of the cell. It can be seen from the previous experiments that the cell performance at 65℃
was not much different or even slightly better than at 80℃ and 85℃ at 50% RH. An increased
evaporation and decreased membrane wettability led to no expected improvement in cell performance.
To investigate the aging of a small area (5 cm2) PEMFC under high temperature and low
humidity, dynamic high frequency load was used to carry out aging experiments to understand the
actual aging situation of the MEA in a PEMFC. Through I-V performance curves, ECSA, AC
impedance and the trend of cell performance changes, the key factors that led to MEA aging were
studied. The experimental method was cyclic voltammetry with a voltage continuously circulated
between 0.6 V and 0.8 V and the anode and cathode introduced to hydrogen and air (1.2 and 4),
respectively. The cell was operated under full and partial humidification and the current density and
maximum power density are compared at 0.6 V.
3.5.1 Dynamic load during long-term cycling under full humidification
Juhyuk Choi and Bin Li [35, 37] found that the performance degradation rate of cells under
long-term dynamic load were reduced by using a new catalyst preparation technology, but it was not
much different from this paper. It was found that the main reason for the deterioration of cell
performance was the degradation or aggregation of catalysts. Therefore, the technology used in the
above papers was mainly to improve the structure or particle size of catalysts.

Int. J. Electrochem. Sci., Vol. 14, 2019
10481
Figure 7. Polarization curves and power density curves of 100-h cyclic dynamic load accelerated
aging under full humidification (65℃, 50% RH). Anode: 1.2 stoichiometry, Cathode: 4
stoichiometry
Figure 7 shows a slight decline on fuel cell aging after 60,000 cycles (100 h) under cyclic
dynamic load (6 sec/cycle) in full humidity. The parameters of cell performance decline are shown in
Table 4. At 0.6 V, the current density at the beginning (0 h) was 856.56 mA/cm2 and the maximum
power density was 640.25 mW/cm2. After 30 h of cyclic dynamic load, the decrease of current density
was 5.11% and the decrease of maximum power density was 6.69%. After 100 h of cyclic dynamic
load, the current density (0.6 V) was 623.94 mA/cm2 and compared with 0 h, the decrease was 27.2%.
The maximum power density decreased from 640.25 mW/cm2 at 0 h to 526.10 mW/cm2 at 100 h
(decreased 17.8%), which was a significant aging in performance. The decline factor was the decrease
of ECSA (Pt). The aging of catalyst will be analyzed in detail by cyclic voltammetry (CV).
Table 4. Aging data of 0-100 h (60,000 cycles) with a dynamic load under full humidity
Time
OCV (V)
Maximum power
density
(mW/cm2)
Decrease of
maximum power
density
ECSA
(m2/gPt)
Decrease of
ECSA
Current density
of 0.6 V
(mA/cm2)
Decrease of
current
density
0 h
10 h
20 h
30 h
40 h
50 h
60 h
70 h
80 h
90 h
100 h
0.967
0.954
0.952
0.936
0.903
0.91
0.91
0.90
0.919
0.914
0.887
640.25
633.31
626.25
597.43
601.94
601.38
585.73
585.39
564.95
536.80
526.10
_
1.08%
2.19%
6.69%
5.98%
6.07%
8.52%
8.57%
11.8%
16.2%
17.8%
24.79
_
_
_
_
19.34
_
_
_
_
16.53
_
_
_
_
_
21.9%
_
_
_
_
33.3%
856.56
848.88
846.43
812.79
805.47
776.59
745.18
739.99
700.06
655.02
623.94
_
0.9%
1.18%
5.11%
5.96%
9.34%
13%
13.6%
18.3%
23.5%
27.2%
3.5.2 Dynamic load during long-term cycling under partial humidity
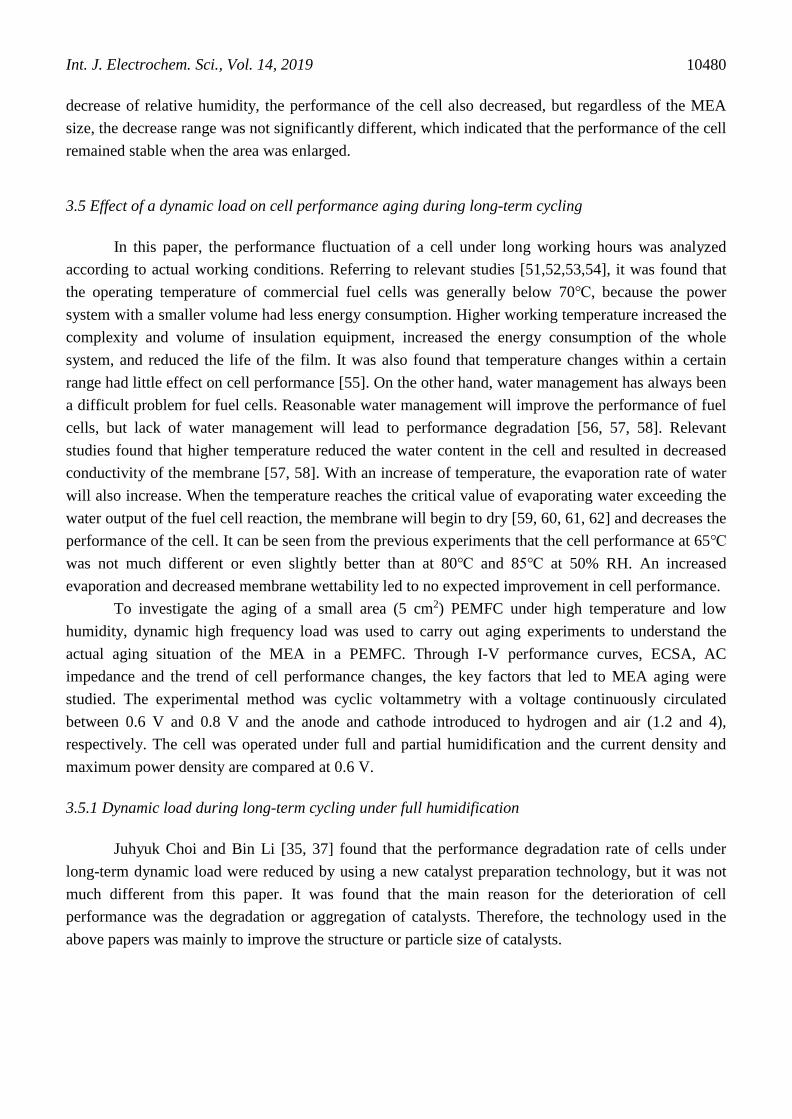
Figure 8 is the aging performance curve of the cell under a partial humidity cyclic dynamic
load of 100 h (6 sec/cycle). Detailed data about the performance decline can be found in Table 5. After
30 h, the decrease of current density was 8.35% and the decrease of maximum power density was
(a (b
Int. J. Electrochem. Sci., Vol. 14, 2019
10482
8.19%. After 60 h, the decrease of current density and maximum power density were 40.1% and
28.4%, respectively. The data showed that the decreased performance of MEA produced by CCM
technology was more serious under partial humidity than full humidity. Under a condition of partial
humidity, the gas flow in the cell reduced the wettability of the MEA, which resulted in the instability
of the cell performance.
Figure 8 Polarization curves and power density curves of 100-h dynamic load accelerated aging under
partial humidity (65℃, 50% RH). Anode: 1.2 stoichiometry, Cathode: 4 stoichiometry
Table 5. Aging data of 0-100 h (60000 cycles) with a dynamic load under partial humidity
Time OCV (V)
Maximum
power density
(mW/cm2)
Decrease of
maximum
power density
ECSA
(m2/gPt)
Decrease of
ECSA
Current density
of 0.6 V
(mA/cm2)
Decrease of
current density
0 h
10 h
20 h
30 h
40 h
50 h
60 h
70 h
80 h
90 h
100 h
0.952
0.973
0.946
0.935
0.903
0.905
0.872
0.839
0.823
0.828
0.834
536.25
515.88
514.44
492.35
502.69
453.96
384.09
360.59
357.51
350.19
333.52
_
3.79%
4.07%
8.19%
6.26%
15.3%
28.4%
32.8%
33.3%
34.7%
37.8%
18.76
_
_
_
_
11.78
_
_
_
_
8.38
_
_
_
_
_
37.2%
_
_
_
_
55.3%
804.20
774.52
767.44
737.08
732.14
570.23
481.55
469.37
417.74
402.12
387.43
_
3.69%
4.57%
8.35%
8.96%
29.1%
40.1%
41.6%
48.1%
50%
51.8%
3.6 Diagnostic analysis of cell performance aging
Based on the performance change of the cell after long-term cycling of a dynamic load in
section 3.5, the causes of the decline of cell performance and MEA aging were analyzed by measuring
the changes of catalyst ECSA, AC impedance and OCV under different working conditions.
(a (b

Int. J. Electrochem. Sci., Vol. 14, 2019
10483
3.6.1 Effect of a dynamic load on the ECSA during long-term cycling
The ECSA on the catalyst electrode was examined by cyclic voltammetry. The reverse
potential scanning of CV was to observe the phenomenon of hydrogen adsorption and desorption. The
scanning rate set by the experimental operation was relatively fast. Figure 9 shows CV curves of 100 h
of cyclic dynamic load. After cyclic dynamic load was completed, the causes were analyzed according
to the results of catalyst aging. Cyclic voltammetry can observe the electrochemical phenomena by
using the current value corresponding with the scanning voltage to distinguish the decline of catalyst
activity by observing the characteristics of CV curves. The largest ECSA was found at 0 h after the
activation of MEA, and the ECSA decreased gradually over time.
The ECSA was calculated by using the hydrogen adsorption peak and the capacitance of the
electric double layer. The change of ECSA after a 100-h cyclic dynamic load was studied under 100%
RH and 50% RH. Figure 9a shows that the ECSA was 24.79 (m2/gPt) under full humidity and Figure
9b shows the ECSA was 18.76 (m2/gPt) under partial humidity. It was found that the difference of cell
performance under different humidities was due to the difference of the ECSA caused by the different
concentration of active catalyst on the MEA, which indicated that the aging of the MEA caused by
cyclic dynamic loading was closely related to the decreased active area of the MEA.
Figure 9 Effects of cyclic dynamic load on the ECSA under full and partial humidity (65℃)
F. Ettingshausen and coworkers [63] found that under the start/stop conditions in automotive
operation, there was pronounced platinum dissolution accompanied by the formation of large platinum
precipitations in the membrane. The corrosion of carbon plates was also observed, but no significant
reduction in porosity and loss of platinum were observed. In contrast, MEA at high constant potential
caused serious damage to a 3D cathode structure due to carbon corrosion. Josef C. Meier and
coworkers [64] found four different degradation pathways where one single Pt/Vulcan aggregate was
clearly observed and inhomogeneous degradation behavior for different catalyst locations was shown;
the importance of particle size, as well as the catalyst pretreatment, on the degradation mechanism was
emphasized. Takeshi Yoda and coworkers [65] found that high potential and/or high temperature led to
(a (b

Int. J. Electrochem. Sci., Vol. 14, 2019
10484
a significant decrease in the ECSA of a cell, which also proved the rationality of the experimental
parameters in this paper.
The CV curves scanned by cyclic voltammetry showed that the current between 0.4 V and 0.8
V was not much different, which indicated that the corrosion of the carbon plate, the carrier of the
catalyst, did not increase continuously. This result indicated that the main reason of cell aging and
performance decline caused by cyclic dynamic loading was the reduction of ECSA of the catalyst.
However, the reduction of ECSA of the catalyst was not caused by carbon plate corrosion, but by the
rapid switching of the load, which resulted in the aggregation of the catalyst. It was found from the
measurement results that at 50% RH, the degree of decline of the ECSA was more than 100% RH. The
decrease of the ECSA at 50% RH was 55.3% after 100 h, while that at 100% RH was 33.3%. The
reason was the moisture content of the MEA was too low, which led to decreased wettability and cell
performance.
3.6.2 Effect of dynamic load on AC impedance during long-term cycling
Figure 10 shows the effect of voltage on the AC impedance in an accelerated aging test of the
cell at different cycle times. The curves were quadratic curves in complex coordinates, and the first
intersection point of the real axis was the resistance obtained by high frequency AC scanning.
According to the equivalent circuit theory, its impedance is the total impedance (Rb), which ignores the
capacitance effect. It was regarded as the MEA impedance under the same operating conditions and
cell. The difference between the two intersection points of the curve to the real axis is the charge-
transfer impedance (Rct) caused by low frequency scanning, which can be regarded as the catalyst layer
impedance under the same operating conditions and cell. At 50% RH, the translation of the curves
along the X-axis and the ohmic loss were particularly serious.
Figure 10 Effects of cyclic dynamic load on AC impedance under full and partial humidity. Anode:
1.2 stoichiometry, Cathode: 4 stoichiometry, 65℃, 100% RH and 50% RH
3.6.3 Effect of dynamic load on ohmic impedance and Rc impedance during long-term cycling
Figure 11 shows the ohmic impedance(RΩ) and contact impedance (Rc) of a cyclic dynamic
load under different levels of humidity. The performance under full humidity was much better than
(a (b

Int. J. Electrochem. Sci., Vol. 14, 2019
10485
that under partial humidity. The impedance (Rb) obtained from AC impedance (EIS) is only the
intrinsic resistance of cell materials, which includes electrolytes, electrodes, current collectors and the
resistance of the lead wire itself. The total ohmic impedance (RΩ) obtained from the voltage-current
curve fitting includes not only the intrinsic resistance of the cell, but also the structural resistance and
the contact resistance between the two phases. Therefore, the ohmic impedance obtained from the
voltage-current curve is larger than that from the AC impedance (Table6), and the difference between
the two is the contact impedance of the cell.
Figure 11. Cyclic dynamic load curves of ohmic impedance and Rc impedance under different
humidities (100% RH and 50% RH)
Table 6. RΩ, Rc,Rct and Rb analysis data of 0-100 h (60,000 cycles) under different humidities
100%
RH
RΩ
(Ohm-
cm2)
50% RH
RΩ
(Ohm-
cm2)
100% RH
Rc
(Ohm-
cm2)
50% RH
Rc
(Ohm-
cm2)
100% RH
Rct
(Ohm-
cm2)
50% RH
Rct
(Ohm-
cm2)
100% RH
Rb
(Ohm-
cm2)
50% RH
Rb
(Ohm-
cm2)
0 h
10 h
20 h
30 h
40 h
50 h
60 h
70 h
80 h
90 h
100 h
0.028
0.025
0.028
0.03
0.03
0.032
0.035
0.035
0.036
0.034
0.04
0.08
0.086
0.09
0.095
0.1
0.11
0.15
0.178
0.187
0.19
0.195
0.01
0.005
0.008
0.01
0.01
0.011
0.013
0.013
0.013
0.01
0.014
0.059
0.065
0.069
0.071
0.076
0.085
0.122
0.15
0.154
0.157
0.159
0.042
0.044
0.049
0.048
0.047
0.05
0.05
0.054
0.054
0.054
0.058
0.052
0.058
0.071
0.072
0.076
0.076
0.099
0.103
0.109
0.115
0.116
0.018
0.02
0.02
0.02
0.02
0.021
0.022
0.022
0.023
0.024
0.026
0.021
0.021
0.021
0.024
0.024
0.025
0.028
0.028
0.033
0.033
0.036
Table 6 and figure 11a shows that the ohmic impedance (RΩ) of the cell increased rapidly at
50% RH. The saturation of water content in the MEA affected the ionic conductivity of the proton
exchange membrane (PEM). When the water content in the membrane was reduced, the impedance of
ion conduction increased. At 100% RH, the RΩ did not significantly increase during the accelerated
aging test, but the semicircle curves of charge-transfer impedance increased with an increased cycle
number, which indicated that the catalyst or proton conductor in the catalyst layer gradually declined
during the accelerated aging test. The increased charge-transfer impedance indicated the aging of the
(b (a

Int. J. Electrochem. Sci., Vol. 14, 2019
10486
catalyst layer, which coincided with the loss of the ECSA mentioned above and caused a decreased
OCV.
According to the test results of AC impedance, ohmic impedance and Rc impedance, the Rc
value decreased sharply when the current increased, so the lower Rc value meant relatively higher cell
performance. Table 6 shows four impedances analysis data of 0-100 h (60,000 cycles) under different
humidities. At 50% RH, the Rc value from 0-50 h was between 0.06-0.085 Ω-cm2 and from 60-100 h,
the Rc value was between 0.12-0.16 Ω-cm2, which indicated that the performance significantly
declined after 60 h. At 100% RH, the increase of RΩ, Rc, Rct and Rb are much less than 50% RH, and
the change trend of the four are similar. Table 6 shows RΩ, Rc, Rct and Rb of the cell increase with the
increase of the cycle load time, which indicates that the performance degradation of the cell is
multifaceted.
3.6.4 Effect of dynamic load on OCV during long-term cycling
Figure 12 shows the effect of cyclic dynamic load on the OCV of the cell under full and partial
humidity. The OCV of the cell was stabilized for 10 min before the cyclic dynamic load was applied.
Figure 12a shows that the OCV decreases slightly during 100 h of operation under full humidity. It
was inferred that after 60,000 cycles of cyclic dynamic load, the performance of the cell would decline
slightly but still run steadily.
Figure 12b shows that although the OCV is high from 0-30 h under partial humidity, the OCV
significantly decreases after 50 h, indicating that the OCV decrease under different humidities is
consistent with the decline in performance and the ECSA.
Figure 12. OCV decline curves with full and partial humidity under cyclic dynamic load. Anode: 1.2
stoichiometry, Cathode: 4 stoichiometry, 65℃, 100% RH and 50% RH
4. CONCLUSION
In this paper, a Nafion®-HP membrane was used as the base of a MEA, and isopropanol was
used as a solvent instead of ethanol. CCM spraying technology was used to spray the catalyst onto the
(a (b
Int. J. Electrochem. Sci., Vol. 14, 2019
10487
surface of the MEA. By adding water-retaining materials in the MEA for the aging test, the following
conclusions were obtained.
Previous experiments showed that the performance and stability of the cell were better when
the gas was fed with a fixed stoichiometry method at high humidity (100% RH) or low humidity (50%
RH) than when fed with a flow rate mode. Through the impedance measurement of the cell, it was
found that the increase of ohmic impedance and polarization impedance of the cell was small when the
gas had a fixed stoichiometry, which indicated that the cell had good water retention under the same
conditions.
Based on the hydrophilicity of SiO2, 5 wt% SiO2 was added to the catalyst layer. It was found
that the addition of SiO2 improved the water retention and the performance of the cell at low relative
humidity, which proved that SiO2 helped the cell work in a low-humidity environment.
Expanding the MEA area from 5 cm2 to 25 cm2 showed that the performance of the cell
fluctuated within 20%, which indicated that the MEA made by CCM technology met the performance
requirements.
Cyclic voltammetry (CV) was used to test cell aging. After 100 h (60,000 cycles) of high
frequency cyclic dynamic load, it was found that the electrochemically active surface area (ECSA) of
the Pt catalyst gradually decreased over time; however, the catalyst carrier (carbon plate) did not
seriously corrode, which indicated that the reason for the decrease of ECSA was the aggregation or
oxidation of the catalyst itself.
In the accelerated aging test under full and partial humidity, the partial humidity performance
decrease was obviously faster than that under full humidity, which indicated that the humidity inside
the cell varied greatly with the increase of operating time, and the water content was an important
factor that affected the aging of the cell. At the same time, it was found that under partial humidity, the
increase of cell impedance was faster and the fluctuation of OCV was larger than those under full
humidity due to the decrease of the MEA wettability.
References
1. M. Hu, Z. Li and G. Cao, Int. J. Electrochem. Sci., 14 (2019) 651.
2. G. Hu, C. Ji, Y. Xia, Y. Suo, X. Wu and Z. Zhang, Int. J. Electrochem. Sci., 14 (2019) 1358.
3. Y. Tian, Z. Lü, X. Guo and P. Wu, Int. J. Electrochem. Sci., 14 (2019) 1093.
4. Ahmed DH, Sung H. J, Bae J and Lee DR, Int. J. Heat Mass Tran., 51 (2008) 2006.
5. Steiner NY, Mocoteguy P, Candusso D, Hissel D, Hernandez A and Aslanides A, J. Power Sources,
183 (2008) 260.
6. W. Dai, H. Wang, X. Yuan, J.J. Martin, D. Yang and J. Qiao, Int. J. Hydrogen Energy, 34(2009)
9461.
7. S. Hou, H. Su, H. Zou, D. Dang, H. Song, X. Li and S. Liao, Int. J. Hydrogen Energy, 40 (2015)
613.
8. C. Jung, J. Yi and S. Yi, Energy, 68 (2014) 794.
9. H. Liang, D. Dang, W. Xiong, H. Song and S. Liao, J. Power Sources, 241 (2013) 367.
10. C.W. Roh, J. Choi and H. Lee, Electrochem. Commun., 97(2018) 105.
11. Y. Yin, J. Liu, Y. Chang, Y. Zhu, X. Xie, Y. Qin and J. Zhang, Electrochim. Acta, 296 (2019) 450.
12. B. Koha, J. Yooa, E. Janga, Vasanth Rajendiran Jothia, C. Jungb and S. Yi, Electrochem. Commun.,
Int. J. Electrochem. Sci., Vol. 14, 2019
10488
93(2018) 76.
13. S. Martin, P.L. Garcia-Ybarra and J.L. Castillo, Appl Energ., 205 (2017) 1012.
14. Mulyazmi, W.R.W. Daud, E.H. Majlan and M.I. Rosli, Int. J. Hydrogen Energy, 38 (2013) 09.
15. Vincenzo Liso, Samuel Simon Araya and Anders Chrsistian Olesen, Int. J. Hydrogen Energy, 41
(2016) 79.
16. Pietro P. Lopes, Dusan Tripkovic and Pedro F.B.D, J. Electroanal. Chem., 819 (2018) 123.
17. Nejc Hodnik, Milena Zorko, Barbara Jozinović, Marjan Bele and Goran Dražič, Electrochem.
Commun., 30 (2013) 75.
18. Laetitia Dubau, Miguel Lopez-Haro, Luis Castanheira, Julien Durst and Marian Chatenet, Appl.
Catal. B-environ., 142 (2013) 801.
19. S.R. Dhanushkodi, S. Kundu, M.W. Fowler and M.D, J. Power Sources, 245 (2014) 35.
20. Milena Zorko, Barbara Jozinović, Marjan Bele, Nejc Hodnik and Miran Gaberšček,
Ultramicroscopy, 140 (2014) 44.
21. G.R. Mirshekari and C.A, J. Power Sources, 396 (2018) 606.
22. Miguel Lopez-Haro, Laetitia Dubau, Laure Guétaz and Pascale Bayle-Guillemaud, Appl. Catal. B-
environ., 152 (2014) 300.
23. Nyccolas E. Souza, Jose L. Bott-Neto, Thairo A. Rocha and Gabriel C. da Silva, Electrochim. Acta,
265 (2018) 523.
24. P. Dhanasekaran, S. Vinod Selvaganesh, Avanish Shukla, N. Nagaraju and S.D. Bhat, Electrochim.
Acta, 263 (2018) 596.
25. Napapat Chaisubanan, Witchaya Maniwan and Mali Hunsom, Energy, 127 (2017) 454.
26. Chikara Takei, Katsuyoshi Kakinuma, Kazuhito Kawashima and Keisuke Tashiro, J. Power
Sources, 324 (2016) 729.
27. Y. Park, Katsuyoshi Kakinuma, Makoto Uchida and Hiroyuki Uchida, Electrochim. Acta, 123
(2014) 84.
28. L. Dubau, L. Castanheira, G. Berthomé and F. Maillard, Electrochim Acta, 110 (2013) 273.
29. L. Wang, Y. Zhou and Miriam H. Rafailovich, ACS Catal., 9(2019)1446.
30. L. Wang, Y. Zhou, C. Nam and Miriam H. Rafailovich, ACS Appl. Energy Mater., 2(2019)3479.
31. G. Zhang, Q. Li, W. Chen, X. Meng and H. Deng, Int. J. Hydrogen Energy, 44(2019)370.
32. T. Wang, Q. Li and H. Yang, Energy Convers. Manage., 196(2019)866.
33. Kazuhiko Shinohara, Atsushi Ohma and Akihiro Iiyama, 220th ECS Meeting, 1103(2011).
34. L. Yin, Q. Li and W. Chen, Int. J. Hydrogen Energy, 44(2019)5499.
35. J. Choi, J. Jang and C. Roh, Appl. Catal. B-environ., 225(2018)530.
36. W. Li, R. Lin and Y. Yang, Electrochim. Acta, 302(2019)241.
37. B. Li, Drew C. Higgins and Q. Xiao, Appl. Catal. B-environ., 162(2015)133.
38. Bosung Kim, Dowon Cha and Yongchan Kim , Appl Energ., 138(2015)143.
39. B.H. Lim, E.H. Majlan, W.R.W. Daud, M.I. Rosli and T. Husaini, Energy, 168(2019)338.
40. Pourya Karimi Takalloo, Ehsan Shabahang Nia and Mohsen Ghazikhani, Energy Convers. Manage.,
114 (2016) 290.
41. Dilek Nur Ozen, Bora Timurkutluk and Kemal Altinisik, Renew Sust Energ. Rev., 59 (2016) 1298.
42. Hyo-Yup Kim and Kyoungyoun Kim, Int. J. Hydrogen Energy, 41 (2016) 776.
43. S. Li and Bengt Sunden, Int. J. Hydrogen Energy, 42 (2016) 323.
44. Torsten Berning, Int. J. Hydrogen Energy, 39 (2014) 449.
45. C. Li, S. Wu and W. Yu, Int. J. Hydrogen Energy, 39 (2014) 4502.
46. V.Senthil Velan, G.Velayutham and Neha Hebalkar, Int. J. Hydrogen Energy, 36 (2011) 14815.
47. Ylser Devrim, Hu seyin Devrim and Inci Eroglu, Int. J. Hydrogen Energy, 41 (2016) 44.
48. H. Su, L. Yang, S. Liao and Q. Zeng, Electrochim. Acta, 55 (2010) 8894.
49. S. Hou, R. Chen, H. Zou and T. Shu, Int. J. Hydrogen Energy, 41(2016)9197.
50. R. Huang, T. Chiu, T. Lin, C. Sun and W. Chao, J. Power Sources, 227(2013)229.
51. C. Hsieh, Xuan-Vien Nguyen, F. Weng, T. Kuo, Z. Huang and A. Su, Int. J. Electrochem. Sci.,

Int. J. Electrochem. Sci., Vol. 14, 2019
10489
11(2016)10449. 52. Erni Misran, Nik Suhaimi Mat Hassan and Wan Ramli Wan Daud, Int. J. Hydrogen Energy,
38(2013)9395.
53. B. Wang, R. Lin, D. Liu, J. Xu and B. Feng, Int. J. Hydrogen Energy, 44(2019)13737.
54. Chrysovalantou Ziogou, Spyros Voutetakis, Simira Papadopoulou and Michael C. Georgiadis,
Comput. Chem. Eng., 35(2011)1886.
55. S. Xia, R. Lin, X. Cui and J. Shan, Int. J. Hydrogen Energy, 41(2016)26.
56. Srinivasan Raman, K.B. Iyeswaria, Sridharakumar Narasimhan and Raghunathan Rengaswamy,
Int. J. Hydrogen Energy, 42(2017)23799.
57. M. Pérez-Page and V. Pérez-Herranz, Int. J. Electrochem. Sci., 6(2011)492.
58. O.S. Ijaodola, Zaki El- Hassan, E. Ogungbemi, F.N. Khatib and Tabbi Wilberforce, Energy,
179(2019)246.
59. Q. Yan, H. Toghiani and H. Causey, J. Power Sources, 161 (2006) 492.
60. Q. Yan, H. Toghiani and J. Wu, J. Power Sources, 158 (2006) 316.
61. M.M. Saleh, T. Okajima, M. Hayase, F. Kitamura and T. Ohsaka, J. Power Sources, 164 (2007) 503.
62. L. Wang, A. Husar, T. Zhou and H. Liu, Int. J. Hydrogen Energy, 28 (2003) 1263.
63. F. Ettingshausen, J. Kleemann, A. Marcu, G. Toth, H. Fuess and C. Roth, Fuel Cells, 2(2011)11.
64. Josef C. Meier, Carolina Galeano, Ioannis Katsounaros and Angel A. Topalov, ACS Catal.,
2(2012)832.
65. TakeshiYoda, Hiroyuki Uchida and MasahiroWatanabe, Electrochim. Acta, 52(2007)19.
© 2019 The Authors. Published by ESG (www.electrochemsci.org). This article is an open access
article distributed under the terms and conditions of the Creative Commons Attribution license
(http://creativecommons.org/licenses/by/4.0/).