performance analysis of options-based equity mutual funds, cefs
TRANSCRIPT

Highlights of “Performance Analysis of Options-Based
Equity Mutual Funds, CEFs, and ETFs”
Keith Black, Ph.D., CAIA, CFAManaging Director of CAIA (Chartered Alternative Investment Analyst Association)
Edward Szado, Ph.D., CFAAssistant Professor of Finance, Providence College
Director of Research, INGARM (Institute for Global Asset and Risk Management)
www.INGARM.org
Jan. 31, 2015The authors are grateful for the valuable research support of graduate students Satyabrota Das and Abdul Mohi Khizer from the Isenberg
School of Management at the University of Massachusetts-Amherst.
1"Performance Analysis of Options-Based Equity Mutual Funds, CEFs, and ETFs” (January 2015) Please see the last slide for important disclosures.

Introduction
Executive Summary
• The first SEC-registered funds focused on the trading of options were launched in the U.S. in 1977, and by 2003 there were twelve such funds. Over the last ten years the category has grown substantially, to the point where there are now at least 119 SEC-registered funds (including mutual funds (MFds), closed-end funds (CEFs), and exchange-traded funds (ETFs)), with an aggregate value of more than $46 billion in assets under management (AUM), that are focused on the use of exchange-listed options for portfolio management purposes. The fund performance analysis in this paper examines a subset of 80 (of the 119) funds that focus on the use of options in portfolios with broadly diversified U.S. equity holdings.
• There are several strategies that an options-based fund may follow, including selling covered calls, selling cash-secured puts, buying protective put options, or investing in collars. The Chicago Board Options Exchange ® (CBOE ®), which sponsored this study, lists several benchmark indices (including the BXMSM, BXYSM and PUTSM
indexes) that follow these strategies.
2
Summary of ResultsKey findings of the new study include:• GROWTH IN NUMBER OF FUNDS. An annual chart in the study
shows that the number of Options-Based Funds grew from 10 in 2000 to 119 in 2014.
• 15-YEAR ANALYSIS OF FUNDS. The study performed an analysis of the equal-weighted performance of 80 Options-Based Funds that focus on use of U.S. stock index options and/or equity options during the 15-year period from 2000 through 2014, and found that –
• HIGHER RISK-ADJUSTED RETURNS. The Options-Based Funds had similar returns as the S&P 500 ® Index with lower volatility and lower maximum drawdowns. The Options-Based Funds had higher risk-adjusted returns, as measured by the Sharpe Ratio, Sortino Ratio, and Stutzer Index.
• ANALYSIS OF OPTIONS-BASED BENCHMARKS OVER 26½ YEARS. The study also performed an analysis of the performance over the period from mid-1988 through the end of 2014 for various options-based benchmark indexes that use S&P 500® (SPXSM) options and for some traditional benchmark indexes.
• STRONG PERFORMANCE FOR BENCHMARKS THAT USE SPXSM INDEX OPTIONS. During the 26 ½ year-time period, both the CBOE S&P 500 PutWrite Index (PUTSM) and the CBOE S&P 500 2% OTM BuyWrite Index (BXYSM) had higher returns and lower volatility than the S&P 500 ® Index. A key source of strong risk-adjusted returns has been the fact that the index options usually have been richly priced.
"Performance Analysis of Options-Based Equity Mutual Funds, CEFs, and ETFs” (January 2015) Please see the last slide for important disclosures.
Please email comments to [email protected], [email protected] or [email protected].

Co-authors of the Study
Keith Black, Ph.D., CAIA, CFA
Keith Black has over twenty years of financial market experience, serving approximately half of that time as an academic and half as a trader and consultant to institutional investors. He currently serves as Managing Director of Curriculum and Exams for the CAIA Association. During his most recent role at Ennis Knupp + Associates, Keith advised foundations, endowments and pension funds ontheir asset allocation and manager selection strategies in hedge funds, commodities and managed futures. Prior experience includes commodities derivatives trading at First Chicago Capital Markets, stock options research and CBOE market-making for Hull TradingCompany, and building quantitative stock selection models for mutual funds and hedge funds for Chicago Investment Analytics. Dr.Black previously served as an assistant professor and senior lecturer at the Illinois Institute of Technology's Stuart school, where he taught courses in both traditional and alternative investments.
He contributes regularly to The CFA Digest, and has published in a number of journals, including The Journal of Trading and The Journal of Alternative Investments. He is the author of the book "Managing a Hedge Fund," as well as a contributor to the second and third editions of the CAIA Level I and Level II textbooks. Dr. Black was named to Institutional Investor magazine's list of "Rising Stars of Hedge Funds" in 2010.
Dr. Black earned a BA from Whittier College, an MBA from Carnegie Mellon University, and a Ph.D. from the Illinois Institute of Technology. He has earned the Chartered Financial Analyst (CFA) designation and was a member of the inaugural class of the Chartered Alternative Investment Analyst (CAIA) candidates.
Edward Szado, Ph.D., CFAEdward Szado is Assistant Professor of Finance, Providence College. He has also taught Risk Management at the Boston University School of Management, Derivatives at Clark University and a range of finance courses at the University of Massachusetts Amherst. He is also the Director of Research at the Institute for Global Asset and Risk Management. He is a former options trader and his experience includes product development in the areas of volatility-based investments and structured investment products. He has consulted to the Options Industry Council, the Chicago Board Options Exchange, the Chartered Alternative Investment Analyst Association and the Commodity Futures Trading Commission.
He has published numerous articles in a wide variety of journals and contributed to a number of books and trade magazines. Hepreviously served as an Assistant Editor of the Journal of Alternative Investments and was a Founding Editor of the Alternative Investment Analysts Review.
Dr. Szado earned a BComm from McMaster University, an MBA from Tulane University and a Ph.D. in Finance from the Isenberg School of Management, University of Massachusetts, Amherst. He has also earned the Chartered Financial Analyst (CFA) designation.
3"Performance Analysis of Options-Based Equity Mutual Funds, CEFs, and ETFs” (January 2015) Please see the last slide for important disclosures.

Methodology
• In November 2014, we undertook a comprehensive search for SEC-registered investment companies that invest in options, building on data sourced through Bloomberg and Morningstar. Using keyword searches for funds with options trading activity, we narrowed the list to those funds benchmarked to a broad US equity index. Funds with objectives other than broad-based US equities were eliminated, excluding the categories of fixed income, currencies, commodities, international and global equity, narrow sector funds (such as master limited partnerships), and futures based products (such as the CBOE Volatility Index® (VIX® index)).
• Once the candidate funds were identified, we confirmed each fund’s options trading activity using portfolio disclosures or summary fund descriptions provided in public filings or on the web site of each fund manager. Based on position information and strategy descriptions we excluded funds that used options sporadically and funds whose option positions were a trivial part of their overall portfolio. The goal was to include only broad-based US equity funds that used options as an integral part of their investment strategy.
• The sample utilized in the performance analysis of this study (in Exhibits 2 through 22) consists of 80 investment companies -- 51 open-end mutual funds (MFd), 22 closed-end funds (CEF), and 7 exchange-traded index funds (ETF). While we acknowledge that this study may have survivorship bias, we believe this to be of little impact due to the relatively new nature of this fund category and the minimal news on the liquidation of these publicly-traded funds. Our sample of 80 investment companies had assets under management (AUM) of $27.6 billion at the end of 2014.
• In Exhibit 1 only, we also included thirty-nine additional options-based funds with non-US equity objectives, so that Exhibit 1 has 119 funds with an aggregate total AUM of $46 billion at the end of 2014. Tables with lists of the names and ticker symbols for the 119 funds are provided in Exhibit 24. Funds benchmarked to indices beyond US equities are beyond the scope of this study.
• In order to analyze the performance of the Options-Based Funds, we created an equal-weighted (EW) index of the funds starting in January, 2000. This entailed calculating the average returns each month across all option-based funds that existed that month. While only six mutual funds were included in the Option-Based Funds EW category for the first month, additional MFs, CEFs and ETFs were added in subsequent months and the number of funds included in the calculation grew monthly as new funds entered the sample ultimately reaching 80 funds by December, 2014. In Exhibit 2 through 22, we provide a performance analysis for total return indices that are pre-tax and that include (for stock indexes) reinvested dividends.
4"Performance Analysis of Options-Based Equity Mutual Funds, CEFs, and ETFs” (January 2015) Please see the last slide for important disclosures.

Strategy Descriptions
5
Strategy Year Introduced Earliest Historical Price
CBOE S&P 500 Buy Write Index (BXM)
Purchase stocks in the S&P 500 index, and each month sell at-the-money index call options
2002 June 30, 1986
CBOE S&P 500 2% OTM Buy Write Index (BXY)
Purchase stocks in the S&P 500 index, and each month sell index call options 2% out-of-the-money
2006 June 1, 1988
CBOE S&P 500 PutWrite Index (PUT)
Purchase Treasury bills and sell cash-secured put options on the S&P 500 index
2007 June 30, 1986
CBOE S&P 500 95-110 Collar Index (CLL)
Purchase stocks in the S&P 500 index, and each month sell index call options at 110% of the index value, and each quarter purchase index put options at 95% of the index value
2008 June 30, 1986
Options-Based Funds (OBF)
Actively-managed and index funds trading options on US stocks and stock indices. Strategies can vary, but are most likely to sell calls or sell puts against stock, index, or cash holdings
2015 January 1, 2000
"Performance Analysis of Options-Based Equity Mutual Funds, CEFs, and ETFs” (January 2015) Please see the last slide for important disclosures.
Returns to CBOE indices are presented gross of fees, while Options-Based Fund returns are calculated net of fees.

6
Exhibit 1: Number of option-based funds included in the sample at year-end. Option-based funds benchmarked to a broad US equity index are included in the analysis. The "Other" category includes option-based closed-end, exchange traded and mutual funds which are excluded from the analysis since they have objectives other than broad-based US equities. These include fixed income, currencies, commodities, international and global equity, narrow sector funds (such as master limited partnerships), and futures based products (such as the VIX index). While CEF growth peaked in 2007, option-based mutual funds have been growing significantly in number since late-2008, and more recently, option-based ETFs have exhibited strong growth. While the exhibit only shows growth since 2000, the fund with the earliest inception date included in the study dates back to 1977.Sources: Morningstar and Bloomberg.
"Performance Analysis of Options-Based Equity Mutual Funds, CEFs, and ETFs” (January 2015) Please see the last slide for important disclosures.
10 11 12 1219
34 3849
56 5867
76
94
108119
0
20
40
60
80
100
120
140D
ec-0
0
Dec
-01
Dec
-02
Dec
-03
Dec
-04
Dec
-05
Dec
-06
Dec
-07
Dec
-08
Dec
-09
Dec
-10
Dec
-11
Dec
-12
Dec
-13
Dec
-14
Exhibit 1 - Number of Option-Based Funds in Sample(Dec. 31, 2000 to Dec 31, 2014)
Other Option-Based CEFs, ETFs, MFds
US Equity Mutual FundsUS Equity ETFs
US Equity CEFs
Num
ber o
f Fun
dsin
the
Sam
ple
at Y
ear-
End

7
Exhibit 2: Cumulative monthly total return since January 1, 2000 for a monthly rebalanced equally weighted portfolio of Options-Based Funds, the BXM index and various traditional indices. Performance is scaled to represent a starting value of $100 at the market close on December 31, 1999 for all indices. Performance of the Equally Weighted Option-Based Fund Portfolio closely tracks the BXM index. The Equally Weighted Option-Based Fund Portfolio returns are calculated by averaging the returns across all constituents in the sample available at each month-end. The number of funds included in the calculation grows monthly as new funds enter the sample.Sources: Bloomberg and Morningstar
"Performance Analysis of Options-Based Equity Mutual Funds, CEFs, and ETFs” (January 2015) Please see the last slide for important disclosures.
$40
$60
$80
$100
$120
$140
$160
$180
$200D
ec-9
9
Dec
-00
Dec
-01
Dec
-02
Dec
-03
Dec
-04
Dec
-05
Dec
-06
Dec
-07
Dec
-08
Dec
-09
Dec
-10
Dec
-11
Dec
-12
Dec
-13
Dec
-14
Cum
ulat
ive
Mon
thly
Tot
al R
etur
n In
dice
s Sc
aled
to a
Sta
rtin
g Va
lue
of $
100
on D
ecem
ber 3
1, 1
999
Exhibit 2 - Options-Based Funds and Stock Indices -
Cumulative Growth of $100(Jan. 1, 2000 to Dec. 31, 2014)
$186 -Options-Based Funds
$186 - S&P500
$182 - BXMIndex
$146 - MSCIEAFE USD

8"Performance Analysis of Options-Based Equity Mutual Funds, CEFs, and ETFs” (January 2015) Please see the last slide for important disclosures.
Exhibit 3: Annualized compound total returns for monthly rebalanced equal weighted index of Options-Based Funds and traditional indices. Annualized compound total returns represent the total cumulative growth over the period converted into an annual compounded return. Options-Based Funds have slightly outperformed the S&P 500 on a raw-return basis since January 1, 2000.Sources: Bloomberg and Morningstar
8.2%
4.2%
4.2%
4.1%
2.5%
1.0%
Citi Treasury 30 Yr
Options-Based Funds
S&P 500
BXM Index
MSCI EAFE USD
S&P GSCI
Exhibit 3 - Annualized Total Returns - Options-Based Funds and Benchmark Indices
(Jan. 1, 2000 to Dec. 31, 2014)
Many would argue that the current historically low Interest rates make it verydoubtful that T-Bonds could maintain such strong performance in the near future.

Exhibit 4: In addition, Options-Based Funds had a lower standard deviation than the S&P 500 IndexSources: Morningstar and Bloomberg.
9"Performance Analysis of Options-Based Equity Mutual Funds, CEFs, and ETFs” (January 2015) Please see the last slide for important disclosures.
23.4%
17.4%
15.3%
13.8%
11.4%
11.1%
0% 5% 10% 15% 20% 25%
S&P GSCI
MSCI EAFE USD
S&P 500
Citi Treasury 30 Yr
BXM Index
Options-Based Funds
Exhibit 4 - Annualized Standard Deviation - Options-Based Funds and Benchmark Indices
(Jan. 1, 2000 to Dec. 31, 2014)

Exhibit 5: Maximum Drawdown is an indicator of the worst loss an investment could have exhibited in a historical period. Options-Based Funds had lower drawdown risk than the S&P 500 Index.Sources: Morningstar and Bloomberg.
10"Performance Analysis of Options-Based Equity Mutual Funds, CEFs, and ETFs” (January 2015) Please see the last slide for important disclosures.
-26.0%
-35.8%
-42.2%
-50.9%
-56.7%
-69.4%
-80% -70% -60% -50% -40% -30% -20% -10% 0%
Citi Treasury 30 Yr
BXM - CBOE S&P 500 BuyWrite
Options-Based Funds
S&P 500
MSCI EAFE USD
S&P GSCI
Exhibit 5 - Maximum Drawdown - Options-Based Funds and Benchmark Indices
(Jan. 1, 2000 to Dec. 31, 2014)
"Performance Analysis of Options-Based Equity Mutual Funds, CEFs, and ETFs” (January 2015) Please see the last slide for important disclosures.
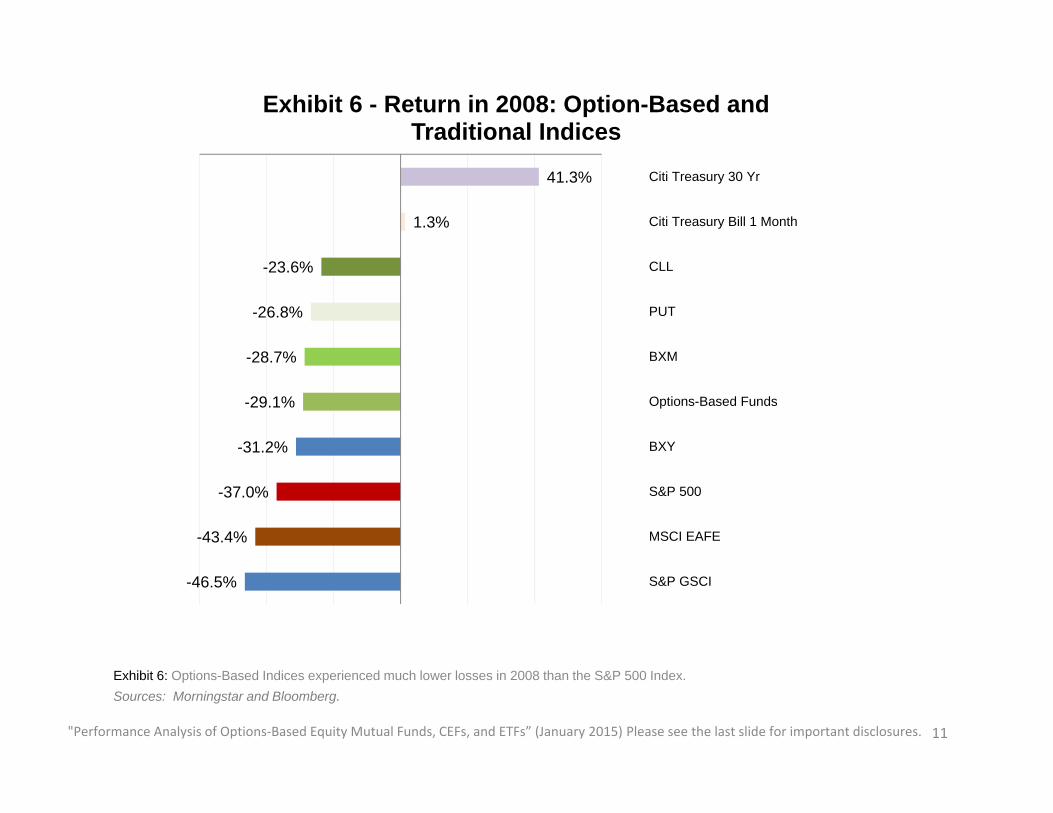
Exhibit 6: Options-Based Indices experienced much lower losses in 2008 than the S&P 500 Index.Sources: Morningstar and Bloomberg.
41.3%
1.3%
-23.6%
-26.8%
-28.7%
-29.1%
-31.2%
-37.0%
-43.4%
-46.5%
-60% -40% -20% 0% 20% 40% 60%
Citi Treasury 30 Yr
Citi Treasury Bill 1 Month
CLL
PUT
BXM
Options-Based Funds
BXY
S&P 500
MSCI EAFE
S&P GSCI
Exhibit 6 - Return in 2008: Option-Based and Traditional Indices
11
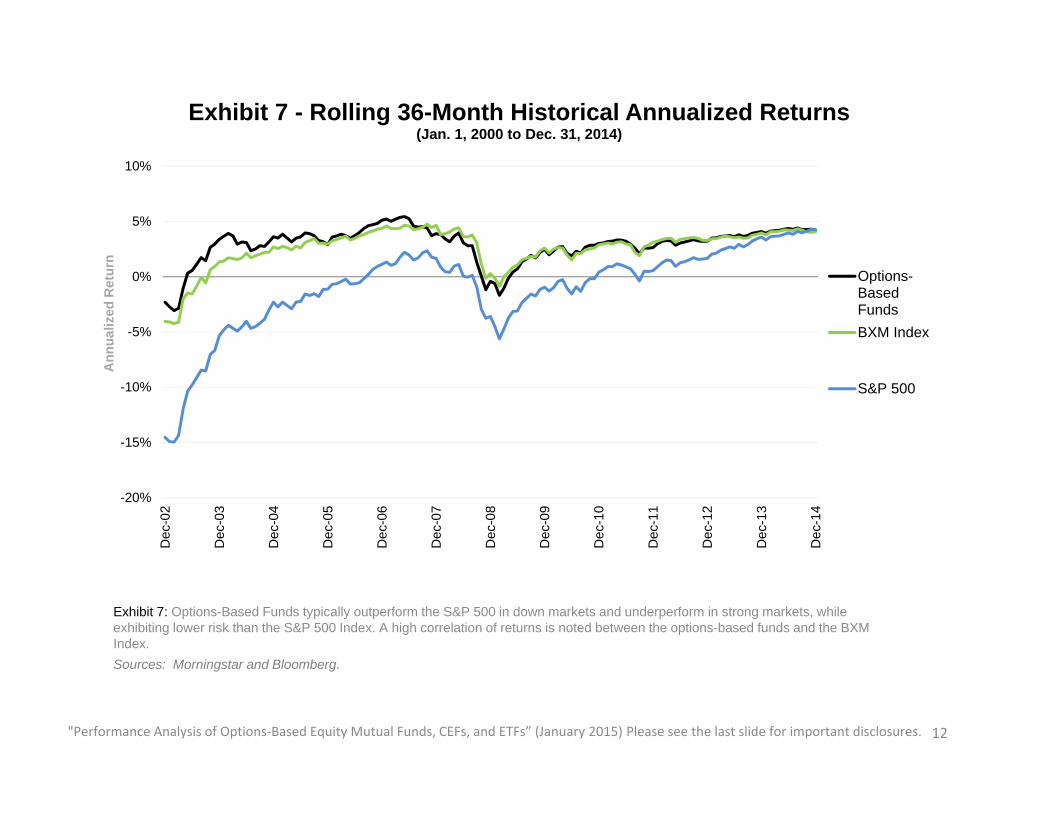
Exhibit 7: Options-Based Funds typically outperform the S&P 500 in down markets and underperform in strong markets, while exhibiting lower risk than the S&P 500 Index. A high correlation of returns is noted between the options-based funds and the BXM Index.Sources: Morningstar and Bloomberg.
12"Performance Analysis of Options-Based Equity Mutual Funds, CEFs, and ETFs” (January 2015) Please see the last slide for important disclosures.
-20%
-15%
-10%
-5%
0%
5%
10%D
ec-0
2
Dec
-03
Dec
-04
Dec
-05
Dec
-06
Dec
-07
Dec
-08
Dec
-09
Dec
-10
Dec
-11
Dec
-12
Dec
-13
Dec
-14
Exhibit 7 - Rolling 36-Month Historical Annualized Returns(Jan. 1, 2000 to Dec. 31, 2014)
Options-BasedFundsBXM Index
S&P 500
Ann
ualiz
ed R
etur
n

13"Performance Analysis of Options-Based Equity Mutual Funds, CEFs, and ETFs” (January 2015) Please see the last slide for important disclosures.
Exhibit 8: Options-Based Funds typically outperform the S&P 500 in down markets and underperform in strong markets, while exhibiting lower risk than the S&P 500 Index. A high correlation of returns is noted between the options-based funds and the BXM Index.Sources: Morningstar and Bloomberg.
8%
10%
12%
14%
16%
18%
20%
Dec
-02
Dec
-03
Dec
-04
Dec
-05
Dec
-06
Dec
-07
Dec
-08
Dec
-09
Dec
-10
Dec
-11
Dec
-12
Dec
-13
Dec
-14
Ann
ualiz
ed S
td D
evExhibit 8 - Rolling 36-Month Historical Annualized Standard
Deviation(Jan. 1, 2000 to Dec. 31, 2014)
S&P 500
BXM Index
Options-BasedFunds
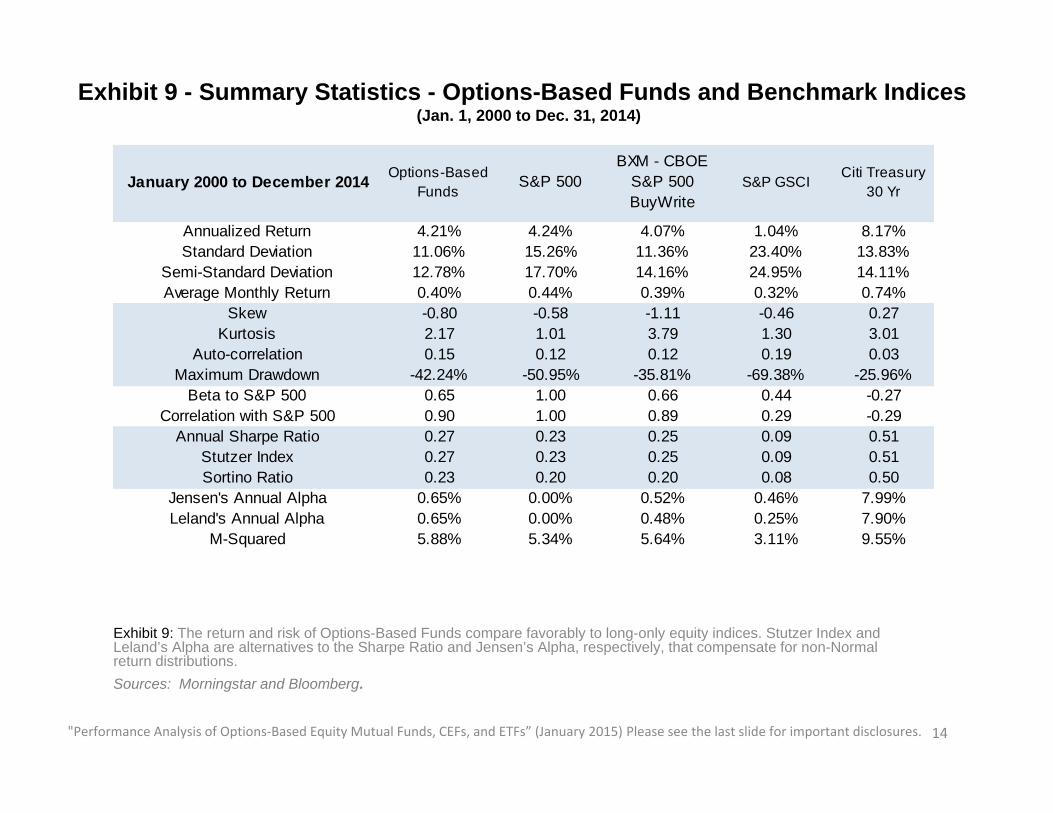
Exhibit 9: The return and risk of Options-Based Funds compare favorably to long-only equity indices. Stutzer Index and Leland’s Alpha are alternatives to the Sharpe Ratio and Jensen’s Alpha, respectively, that compensate for non-Normal return distributions.Sources: Morningstar and Bloomberg.
14
Exhibit 9 - Summary Statistics - Options-Based Funds and Benchmark Indices (Jan. 1, 2000 to Dec. 31, 2014)
"Performance Analysis of Options-Based Equity Mutual Funds, CEFs, and ETFs” (January 2015) Please see the last slide for important disclosures.
January 2000 to December 2014 Options-Based Funds
S&P 500BXM - CBOE
S&P 500 BuyWrite
S&P GSCICiti Treasury
30 Yr
Annualized Return 4.21% 4.24% 4.07% 1.04% 8.17%Standard Deviation 11.06% 15.26% 11.36% 23.40% 13.83%
Semi-Standard Deviation 12.78% 17.70% 14.16% 24.95% 14.11%Average Monthly Return 0.40% 0.44% 0.39% 0.32% 0.74%
Skew -0.80 -0.58 -1.11 -0.46 0.27Kurtosis 2.17 1.01 3.79 1.30 3.01
Auto-correlation 0.15 0.12 0.12 0.19 0.03Maximum Drawdown -42.24% -50.95% -35.81% -69.38% -25.96%
Beta to S&P 500 0.65 1.00 0.66 0.44 -0.27Correlation with S&P 500 0.90 1.00 0.89 0.29 -0.29
Annual Sharpe Ratio 0.27 0.23 0.25 0.09 0.51Stutzer Index 0.27 0.23 0.25 0.09 0.51Sortino Ratio 0.23 0.20 0.20 0.08 0.50
Jensen's Annual Alpha 0.65% 0.00% 0.52% 0.46% 7.99%Leland's Annual Alpha 0.65% 0.00% 0.48% 0.25% 7.90%
M-Squared 5.88% 5.34% 5.64% 3.11% 9.55%

Exhibit 10: Options-Based Funds had higher risk-adjusted returns than the S&P 500 Index. The Sortino ratio compares downside risk, while the Stutzer Index accounts for skewness and kurtosis in the risk measures.Sources: Morningstar and Bloomberg.
15"Performance Analysis of Options-Based Equity Mutual Funds, CEFs, and ETFs” (January 2015) Please see the last slide for important disclosures.
0.51
0.27
0.25
0.23
0.09
0.51
0.27
0.25
0.23
0.09
0.50
0.23
0.20
0.20
0.08
0.0 0.1 0.2 0.3 0.4 0.5 0.6
Citi Treasury 30 Yr
Options-Based Funds
BXM - CBOE S&P 500BuyWrite
S&P 500
S&P GSCI
Exhibit 10 - Return-to-Risk Ratios – Options-Based Funds and Benchmark Indices
(Jan. 1, 2000 to Dec. 31, 2014)
Annual Sharpe Ratio Stutzer Index Sortino Ratio

Exhibit 11: Jensen’s Alpha, Leland’s Alpha and M2 all provide measures of risk-adjusted performance relative to the S&P 500. Leland’s alpha accounts for skewness and kurtosis in the return distributions. Options-Based Funds had higher risk-adjusted returns than the S&P 500 Index by all three measures. Sources: Morningstar and Bloomberg.
16"Performance Analysis of Options-Based Equity Mutual Funds, CEFs, and ETFs” (January 2015) Please see the last slide for important disclosures.
7.99%
0.65%
0.52%
0.46%
0.00%
7.90%
0.65%
0.48%
0.25%
0.00%
9.55%
5.88%
5.64%
3.11%
5.34%
0% 2% 4% 6% 8% 10% 12%
Citi Treasury 30 Yr
Options-Based Funds
BXM - CBOE S&P 500 BuyWrite
S&P GSCI
S&P 500
Exhibit 11 - Risk-Adjusted Return Measures – Options-Based Funds and Benchmark Indices
(Jan. 1, 2000 to Dec. 31, 2014)
Jensen's Annual Alpha Leland's Annual Alpha M-Squared

Exhibit 12: The exhibit provides the annual average distribution yield calculated as the total distributions for each fund over a calendar year divided by the ending price of the fund for the previous year, and averaged across all funds in the Options-Based Funds index.Sources: Morningstar and Bloomberg.
17"Performance Analysis of Options-Based Equity Mutual Funds, CEFs, and ETFs” (January 2015) Please see the last slide for important disclosures.
0.00%
1.00%
2.00%
3.00%
4.00%
5.00%
6.00%
7.00%
8.00%
9.00%20
00
2001
2002
2003
2004
2005
2006
2007
2008
2009
2010
2011
2012
2013
2014
Exhibit 12 - Options-Based Funds Annual Distribution Yield(Jan. 1, 2000 to Dec. 31, 2014)
Average Distribution Yield

Exhibit 13: Annualized return and standard deviation for traditional and option-based indices as well as a portfolio consisting of 60% S&P 500 and 40% 30-year Treasury bonds, and a portfolio consisting of 20% Options-Based Funds and 80% invested in the 60/40 stock/bond portfolio. Options-Based Funds had risk and return more similar to a 60% stock, 40% bond portfolio rather than a long-only equity investment.Sources: Morningstar and Bloomberg.
18"Performance Analysis of Options-Based Equity Mutual Funds, CEFs, and ETFs” (January 2015) Please see the last slide for important disclosures.
BXM
PUT
BXY
CLL
S&P 500
S&P GSCI
30 Yr Treasury
T-Bill
Options-Based Funds
60/40
60/40 Plus Option-Based Funds
0%
1%
2%
3%
4%
5%
6%
7%
8%
9%
0% 5% 10% 15% 20% 25%
Ann
ualiz
ed R
etur
n
AnnualizedStandard Deviation
Exhibit 13 - Risk/Return Trade-Off - Options-Based Funds and Benchmark Indices
(Jan. 1, 2000 to Dec. 31, 2014)

19"Performance Analysis of Options-Based Equity Mutual Funds, CEFs, and ETFs” (January 2015) Please see the last slide for important disclosures.
Exhibit 14: Cumulative monthly total return since July 1, 1988 for the BXM index and various traditional indices. Performance is scaledto represent a starting value of $100 on June 30, 1988 for all indicesSources: Bloomberg and Morningstar.
$0
$200
$400
$600
$800
$1,000
$1,200
$1,400
$1,600Ju
n-88
Jun-
90
Jun-
92
Jun-
94
Jun-
96
Jun-
98
Jun-
00
Jun-
02
Jun-
04
Jun-
06
Jun-
08
Jun-
10
Jun-
12
Jun-
14
Cum
ulat
ive
Ret
urn
Exhibit 14 - Index Cumulative Growth of $100 Since Mid-1988 – Benchmark Indices
(Jul. 1, 1988 to Dec. 31, 2014) $1445 - BXY - CBOE S&P500 2% OTM BuyWrite
$1434 - PUT - CBOE S&P500 PutWrite Index
$1353 - S&P 500
$1041 - BXM - CBOE S&P500 BuyWrite
$802 - 30 Yr Tbond
$580 - CLL - CBOE S&P 50095-110 Collar Index
$369 - EAFE
$273 - GSCI

20
Exhibit 15: Options-Based Strategy Indices had a longer track record than most single funds. Over 25 years, BXY and PUT had a higher total return than the S&P 500. It is worth noting that BXY and PUT were introduced in 2006 and 2007, respectively, and earlier data has been backfilled.Sources: Morningstar and Bloomberg.
"Performance Analysis of Options-Based Equity Mutual Funds, CEFs, and ETFs” (January 2015) Please see the last slide for important disclosures.
10.6%
10.6%
10.3%
9.2%
8.2%
6.9%
5.1%
3.9%
3.2%
0% 2% 4% 6% 8% 10% 12%
BXY
PUT
S&P 500
BXM
30 Yr Tbond
CLL
EAFE
GSCI
Tbill
Exhibit 15 - Annualized Returns Since Mid-1988 –Benchmark Indices (Jul. 1, 1988 to Dec. 31, 2014)

Exhibit 16: While BXY and PUT had a higher total return than the S&P 500 over the past 25 years, they also had a lower standard deviation. It is worth noting that BXY and PUT were introduced in 2006 and 2007, respectively, and earlier data has been backfilled..
Sources: Morningstar and Bloomberg.21"Performance Analysis of Options-Based Equity Mutual Funds, CEFs, and ETFs” (January 2015) Please see the last slide for important disclosures.
0.7%
9.8%
10.3%
10.5%
12.0%
12.1%
14.5%
17.3%
20.9%
0% 5% 10% 15% 20% 25%
Tbill
PUT
BXM
CLL
BXY
30 Yr Tbond
S&P 500
EAFE
GSCI
Exhibit 16 - Annualized Standard Deviation Since Mid-1988 – Benchmark Indices
(Jul. 1, 1988 to Dec. 31, 2014)

Exhibit 17: Options-Based Strategy Indices can build more efficient portfolios, with similar return and lower risk than the S&P 500 Index.Sources: Morningstar and Bloomberg.
22"Performance Analysis of Options-Based Equity Mutual Funds, CEFs, and ETFs” (January 2015) Please see the last slide for important disclosures.
BXM
PUT BXY
CLL
S&P 500
S&P GSCI
30 Yr Treasury
T-Bill
EAFE
0%
2%
4%
6%
8%
10%
12%
0% 5% 10% 15% 20% 25%
Ann
ualiz
ed R
etur
n
Annualized Standard Deviation
Exhibit 17 – Risk/Return Trade-Off Since Mid-1988 –Benchmark Indices (Jul. 1, 1988 to Dec. 31, 2014)

Exhibit 18: BXM, PUT, and BXY had a positive alpha and a lower standard deviation of returns than the S&P 500 Index.Sources: Morningstar and Bloomberg.
23
Exhibit 18 - Summary Statistics Table Since Mid-1988 - Benchmark Indices (Jul. 1, 1988 - Dec. 31, 2014)
"Performance Analysis of Options-Based Equity Mutual Funds, CEFs, and ETFs” (January 2015) Please see the last slide for important disclosures.
Jul. 1, 1988 to Dec. 31, 2014BXM - CBOE
S&P 500 BuyWrite
PUT - CBOE S&P 500 PutWrite
Index
BXY - CBOE S&P 500 2% OTM
BuyWrite
CLL - CBOE S&P 500 95-110 Collar Index
S&P 500 S&P GSCICiti Treasury
30 Yr
Annualized Return 9.25% 10.57% 10.60% 6.86% 10.33% 3.87% 8.17%Standard Deviation 10.26% 9.78% 12.05% 10.49% 14.49% 20.90% 12.15%
Semi-Standard Deviation Below Mean 13.23% 12.83% 14.37% 11.06% 16.61% 21.33% 12.20%Average Monthly Return 0.78% 0.88% 0.90% 0.60% 0.91% 0.50% 0.72%
Skew -1.30 -1.99 -0.91 -0.17 -0.61 -0.18 0.23Kurtosis 4.86 9.51 2.75 -0.22 1.27 2.09 3.20
Auto-correlation 0.08 0.12 0.05 0.03 0.04 0.20 0.07Beta to S&P 500 0.62 0.55 0.78 0.66 1.00 0.24 -0.07
Correlation with S&P 500 0.88 0.82 0.93 0.92 1.00 0.17 -0.09Maximum Drawdown -35.81% -32.66% -40.31% -35.47% -50.95% -69.38% -25.96%Annual Sharpe Ratio 0.61 0.76 0.64 0.39 0.54 0.14 0.45
Stutzer Index 0.59 0.71 0.62 0.39 0.53 0.14 0.45Sortino Ratio 0.47 0.58 0.54 0.37 0.47 0.13 0.45Treynor Ratio 0.10 0.13 0.10 0.06 0.08 0.12 -0.74
Jensen's Annual Alpha 1.44% 3.13% 1.66% -1.10% 0.00% 0.98% 6.03%Leland's Annual Alpha 1.23% 2.85% 1.54% -0.86% 0.00% 0.33% 5.99%
M-Squared 11.99% 14.17% 12.42% 8.75% 10.93% 5.13% 9.67%

Exhibit 19: The BXM, BXY, and PUT strategies regularly sell S&P 500 Index options. The premium earned varies over time, but has averaged 1.8% per month for BXM. Premiums earned can support a high income yield for Options-Based Funds. Since mid-1988 the SPX call options monthly premium received per the hypothetical BXM strategy averaged 1.8% of the value of the stock position held. * Please note that while these gross amounts are positive values, a buy-write strategy can have negative net returns if the value of the stocks held declines. Source: www.cboe.com/buywrite .
24"Performance Analysis of Options-Based Equity Mutual Funds, CEFs, and ETFs” (January 2015) Please see the last slide for important disclosures.
0%
1%
2%
3%
4%
5%
6%
7%
8%
9%
Jun-
88
Jun-
90
Jun-
92
Jun-
94
Jun-
96
Jun-
98
Jun-
00
Jun-
02
Jun-
04
Jun-
06
Jun-
08
Jun-
10
Jun-
12
Jun-
14
Exhibit 19 - Monthly Options Premiums (Gross) Received by BXM Index
(Jun. 17, 1988 – Dec. 19, 2014)
Average gross* monthly premium received was 1.8% of the underlying.

Exhibit 20: Richness is calculated as the level of the VIX index at the start of a 30-day period (implied volatility) minus the annualized standard deviation of returns of the S&P 500 that is actually realized in that 30-day period (realized volatility). Since the VIX index is a forward looking measure, each VIX index level corresponds with the same 30-day period as the forward looking annualized standard deviation calculation. During times when this richness measure is positive, sellers of options may earn a profit relative to the amount by which implied volatility exceeds realized volatility. During the 25-year period shown in this chart, the average level of the VIX index was about 20.0 and the average realized volatility was 18.8%, so the S&P 500 Index options were richly priced by about 1.2%. Please note that the final calculation in this time series is made on Dec. 2, 2014 to cover data through Dec. 31, 2014 since these measures are forward looking.Sources: Morningstar and Bloomberg.
25"Performance Analysis of Options-Based Equity Mutual Funds, CEFs, and ETFs” (January 2015) Please see the last slide for important disclosures.
-25%
-20%
-15%
-10%
-5%
0%
5%
10%
15%19
90 Q
1
1991
Q1
1992
Q1
1993
Q1
1994
Q1
1995
Q1
1996
Q1
1997
Q1
1998
Q1
1999
Q1
2000
Q1
2001
Q1
2002
Q1
2003
Q1
2004
Q1
2005
Q1
2006
Q1
2007
Q1
2008
Q1
2009
Q1
2010
Q1
2011
Q1
2012
Q1
2013
Q1
2014
Q1
Exhibit 20 - Quarterly Average 30-Day Richness of S&P 500 (SPX) Options
(Jan. 1, 1990 to Dec. 31, 2014)

26"Performance Analysis of Options-Based Equity Mutual Funds, CEFs, and ETFs” (January 2015) Please see the last slide for important disclosures.
Exhibit 21: Fund managers examine trading liquidity and capacity when considering investment vehicles. The approximate daily notional value of trading in SPX options in 2014 can be estimated by multiplying the average daily volume (888,089 contracts) times the value of the S&P 500 Index (average of 1931) times the $100 options contract multiplier, for a value of more than $170 billion per day. Some investors use a delta-weighting multiplier to develop a more conservative estimate for notional value of options trading. Sources: Bloomberg and CBOE.
$13 $12 $12 $14 $22
$34
$54
$93 $86
$58
$79
$99 $96
$135
$172
$-
$20
$40
$60
$80
$100
$120
$140
$160
$180
$20020
00
2001
2002
2003
2004
2005
2006
2007
2008
2009
2010
2011
2012
2013
2014
Not
iona
l Val
ue (i
n $
Bill
ions
)
More than $170 billion in 2014
Exhibit 21 - Notional Value of Average Daily Volume in S&P 500 (SPX) Options (in $ Billions) (2000-2014)

"Performance Analysis of Options-Based Equity Mutual Funds, CEFs, and ETFs” (January 2015) Please see the last slide for important disclosures.
Exhibit 22 - Annual Returns - Options-Based Funds and Benchmark Indices (1987 - 2014)
Exhibit 22: Annual Returns for each year since 1987 of Options-Based Funds, options-based indices and traditional indices.Sources: Morningstar and Bloomberg.
BXM Options-Based Funds PUT BXY CLL S&P 500 GSCI 30 Yr
TBond EAFE
1987 -3.0% -2.6% 12.4% 5.3% 23.8% -8.0% 24.6%1988 21.0% 19.7% 6.1% 16.6% 27.9% 8.1% 28.3%1989 25.0% 24.6% 32.6% 26.0% 31.7% 38.3% 20.3% 10.5%1990 4.0% 8.9% 1.9% -0.1% -3.1% 29.1% 4.8% -23.4%1991 24.4% 21.3% 22.9% 13.6% 30.5% -6.1% 17.3% 12.1%1992 11.5% 13.8% 11.0% 4.3% 7.6% 4.4% 6.8% -12.2%1993 14.1% 14.1% 11.0% 6.2% 10.1% -12.3% 18.3% 32.6%1994 4.5% 7.1% 4.6% -2.0% 1.3% 5.3% -11.9% 7.8%1995 21.0% 16.9% 33.2% 34.4% 37.6% 20.3% 33.5% 11.2%1996 15.5% 16.4% 19.8% 18.5% 23.0% 33.9% -4.4% 6.0%1997 26.6% 27.7% 29.7% 23.9% 33.4% -14.1% 15.4% 1.8%1998 18.9% 18.5% 21.2% 18.8% 28.6% -35.7% 16.5% 20.0%1999 21.2% 21.0% 19.7% 9.0% 21.0% 40.9% -14.9% 27.0%2000 7.4% 2.9% 13.1% 2.0% -9.1% -9.1% 49.7% 20.0% -14.2%2001 -10.9% -1.5% -10.6% -11.4% 3.8% -11.9% -31.9% 3.4% -21.4%2002 -7.6% -8.0% -8.6% -12.3% -11.1% -22.1% 32.1% 16.2% -15.9%2003 19.4% 22.5% 21.8% 24.9% 17.9% 28.7% 20.7% 0.8% 38.6%2004 8.3% 4.6% 9.5% 9.7% 4.9% 10.9% 17.3% 8.7% 20.2%2005 4.2% -0.5% 6.7% 4.4% 2.0% 4.9% 25.6% 8.8% 13.5%2006 13.3% 19.4% 15.2% 17.1% 11.7% 15.8% -15.1% -1.1% 26.3%2007 6.6% -4.3% 9.5% 6.1% 0.9% 5.5% 32.7% 10.2% 11.2%2008 -28.7% -29.1% -26.8% -31.2% -23.6% -37.0% -46.5% 41.3% -43.4%2009 25.9% 32.5% 31.5% 32.1% 17.6% 26.5% 13.5% -25.9% 31.8%2010 5.9% 8.7% 9.0% 9.8% 4.1% 15.1% 9.0% 8.7% 7.8%2011 5.7% -1.5% 6.2% 7.2% -8.8% 2.1% -1.2% 35.4% -12.1%2012 5.2% 10.4% 8.1% 10.2% 6.8% 16.0% 0.1% 2.4% 17.3%2013 13.3% 16.3% 12.3% 20.8% 23.8% 32.4% -1.2% -15.0% 22.8%2014 5.6% 5.8% 6.4% 5.5% 9.2% 13.7% -33.1% 29.3% -4.9%
27

28
Exhibit 23 - List of 80 Options-Based Funds (focused on U.S. Equities)The largest funds in the sample are GATEX ($8.2B), ETY ($1.8B), BDJ ($1.7B) and NFJ ($1.7B), while GATEX (1977),
TDEYX (1978) and MEQFX (1992) have the earliest inception dates.
Exhibit 23: Eighty options-based equity funds are used in the analysis. These funds consist of 51 mutual funds (MFd), 22 closed-end funds (CEF), and 7 exchange-traded index funds (ETF). The sample has a current AUM of $27.6 billion. As shown in this exhibit, 39 additional options-based funds with objectives other than diversified US equity have been identified, bringing the AUM to over $46 billion. Funds benchmarked to indices other than US equities are beyond the scope of this study. Sources: Morningstar and Bloomberg.
"Performance Analysis of Options-Based Equity Mutual Funds, CEFs, and ETFs” (January 2015) Please see the last slide for important disclosures.
TYPE NAME TICKER TYPE NAME TICKER TYPE NAME TICKER
1 MFd Alliance Bernstein/TWM Global Equity & Covered Call Strategy Fund - Institutional
TWMLX 28 CEF Eaton Vance Tax-Managed Buy-Write Income Common
ETB 55 MFd Leigh Baldwin Total Return LEBOX
2 CEF AllianzGI NFJ Dividend Interest & Premium Common
NFJ 29 CEF Eaton Vance Tax-Managed Buy-Write Opportunities Common
ETV 56 MFd LS Theta - Institutional LQTIX
3 MFd AllianzGI Structured Return A-Class AZIAX 30 CEF Eaton Vance Tax-Managed Dividend Equity Income Common
ETY 57 MFd Madison Covered Call & Equity Income - Class A
MENAX
4 MFd AllianzGI US Equity-Hedged - Institutional AZUIX 31 CEF First Trust Enhanced Equity Income Common FFA 58 CEF Madison Covered Call & Equity Strategy MCN5 MFd AMG FQ US Equity - Institutional MEQFX 32 ETF First Trust High Income ETF FTHI 59 CEF Madison Strategic Sector Premium Common MSP
6 MFd Arin Large Cap Theta - Institutional AVOLX 33 ETF First Trust Low Beta Income ETF FTLB 60 MFd MD Sass Equity Income Plus Fund - Institutional
MDEIX
7 MFd ASTON/Anchor Capital Enhanced Equity - Institutional
AMDSX 34 MFd Frost Cinque Large Cap Buy-Write Equity - Class A
FCAWX 61 CEF Nuveen Core Equity Alpha Common JCE
8 CEF BlackRock Enhanced Capital & Income Common
CII 35 MFd Gateway - Class A GATEX 62 CEF Nuveen Dow 30 Dynamic Overwrite DIAX
9 CEF BlackRock Enhanced Equity Dividend Common BDJ 36 MFd Gateway Equity Call Premium - Class A GCPAX 63 CEF Nuveen NASDAQ 100 Dynamic Overwrite QQQX
10 MFd BPV Low Volatility BPVLX 37 MFd Glenmede Secured Options GTSOX 64 CEF Nuveen S&P 500 Buy-Write Income BXMX11 MFd BPV Wealth Preservation Advisor BPAPX 38 MFd GMO Risk Premium - Class III GMRPX 65 CEF Nuveen S&P 500 Dynamic Overwrite SPXX
12 MFd Bridgeway Managed Volatility BRBPX 39 CEF Guggenheim Enhanced Equity Income Common GPM 66 CEF Nuveen Tax-Advantaged Dividend Growth Common
JTD
13 MFd Camelot Excalibur Small Cap Income - Class A CEXAX 40 CEF Guggenheim Enhanced Equity Strategy Common
GGE 67 ETF PowerShares S&P 500 Buy-Write ETF PBP
14 MFd Camelot Premium Return - Class A CPRFX 41 CEF Guggenheim EW Enhanced Equity Common GEQ 68 ETF Recon Capital NASDAQ 100 Covered Call ETF QYLD
15 MFd Catalyst/Lyons Hedged Premium Return - Class A
CLPAX 42 MFd Hatteras Disciplined Opportunity - Institutional HDOIX 69 MFd RiverNorth Managed Volatility - Class R RNBWX
16 MFd Catalyst/SMH Total Return Income - Class A TRIFX 43 ETF Horizons S&P 500® Covered Call ETF HSPX 70 MFd RiverPark Structural Alpha - Institutional RSAIX
17 MFd Centaur Total Return TILDX 44 ETF Horizons US Equity Managed Risk ETF HUS.U 71 MFd RiverPark/Gargoyle Hedged Value - Institutional RGHIX
18 CEF Columbia Seligman Premium Technology STK 45 MFd Hussman Strategic Growth HSGFX 72 MFd Russell Strategic Call Overwriting - Class S ROWSX19 MFd Covered Bridge - Class A TCBAX 46 MFd ICON Risk-Managed Balanced - Class A IOCAX 73 MFd Schooner - Class A SCNAX
20 MFd Credit Suisse Volaris US Strategies - Class A VAEAX 47 MFd Investment Partners Opportunities - Class A IPOFX 74 MFd Schooner Hedged Alternative Income - Institutional
SHAIX
21 MFd Crow Point Defined Risk Global Equity Income - Class A
CGHAX 48 MFd Iron Horse - Class A IRHAX 75 MFd Swan Defined Risk - Class I SDRIX
22 MFd Dividend Plus Income Fund - Institutional MAIPX 49 MFd Ironclad Managed Risk IRONX 76 MFd Touchstone Dynamic Equity - Class Y TDEYX23 MFd Dunham Monthly Distribution Fund - Class A DAMDX 50 MFd JHancock Redwood - Class A JTRAX 77 ETF US Equity High Volatility Put Write ETF HVPW
24 CEF Eaton Vance Enhanced Equity Income Common EOI 51 MFd KF Griffin Blue Chip Covered Call - Class A KFGAX 78 MFd Virtus Low Volatility Equity - Class A VLVAX
25 CEF Eaton Vance Enhanced Equity Income II Common
EOS 52 MFd Kinetics Multi-Disciplinary Advisor - Class A KMDAX 79 MFd WP Large Cap Income Plus - Institutional WPLCX
26 MFd Eaton Vance Hedged Stock - Institutional EROIX 53 MFd KKM ARMOR A RMRAX 80 MFd YCG Enhanced YCGEX
27 CEF Eaton Vance Risk-Managed Diversified Equity Income Common
ETJ 54 MFd KKM US Equity ARMOR A UMRAX

29
Exhibit 24: 39 Additional Options-Based Funds with $18.6 billion AUM (Not Used in Analysis). These include 26 CEFs with AUM of $16.9 Billion, 11 Mutual Funds with AUM of $1.7 Billion and 2 ETFs with AUM of $30 Million. Additionally, two ETNs were identified (GLDI and BWV) which are not included in the above list.Sources: Morningstar and Bloomberg.
Exhibit 24 - List of 39 Additional Options-Based Funds (Not Included in Analysis)
"Performance Analysis of Options-Based Equity Mutual Funds, CEFs, and ETFs” (January 2015) Please see the last slide for important disclosures.
TYPE NAME TICKER21 CEF JH Hedged Equity & Income Fund HEQ22 CEF JH Tax Advantaged Global Shareholder Yield HTY23 CEF Kayne Anderson Midstream Energy KMF24 MFd Kinetics Alternative Income - No Load KWINX25 MFd Kinetics Multi-Disciplinary - No Load KMDNX26 CEF MS India Investment IIF27 CEF Nuveen Diversified Commodity CFD28 CEF Nuveen Long/Short Commodity Total Return CTF29 MFd Regal Total Return - Class A RTRTX
30 MFd Robeco Boston Partners All Cap Value - Institutional
BPAIX
31 CEF Salient Midstream & MLP SMM32 MFd Sandalwood Opportunity - Class A SANAX33 MFd Virtus Strategic Income - Class A VASBX
34 CEF Voya Global Advantage and Premium Opportunity
IGA
35 CEF Voya Global Equity Dividend&Premium Opportunity
IGD
36 CEF Voya Infrastructure Industrials & Materials IDE
37 CEF Voya International High Dividend Equity Income
IID
38 CEF Voya Natural Resources Equity Income IRR39 CEF Wells Fargo Adv Global Dividend Opportunity EOD
TYPE NAME TICKER1 ETF AdvisorShares STAR Global Buy-Write ETF VEGA2 CEF AllianzGI Equity & Convertible Income NIE3 MFd AMG FQ Global Risk-Balanced - Institutional MMAFX4 CEF BlackRock Global Opportunities BOE5 CEF BlackRock Health Sciences BME6 CEF BlackRock Resources & Commdity BCX7 CEF BlackRock Utility & Infrastructure Trust BUI
8 MFd Catalyst/MAP Global Capital Appreciation - Class A
CAXAX
9 MFd Catalyst/MAP Global Total Return Income - Class A
TRXAX
10 CEF Central Securities Corporation CET11 CEF Clough Global Opportunities GLO
12 CEF EV Tax-Managed Global Diversity Equity Income
EXG
13 CEF Fiduciary/Claymore MLP Opportunity FMO14 ETF First Trust CBOE® S&P 500 VIX®Tail Hedge ETF VIXH15 CEF First Trust MLP & Energy Income Fund FEI16 CEF Gabelli Equity Trust GAB
17 CEF GAMCO Global Gold Natural Resource & Income
GGN
18 CEF GAMCO Natural Resource Gold & Income GNT19 MFd Gateway International - Class A GAIAX20 MFd Glenmede International Secured Options NOVIX

The inclusion of references to registered funds in this paper should not be construed as an endorsement or an indication of the value of any product, security, fund, service, or other website. Such financial products are not sponsored, endorsed, sold or promoted by CBOE or INGARM. CBOE and INGARM make no representation regarding the advisability of investing in such products. An investor should consider the investment objectives, risks, charges, and expenses of these products carefully before investing. Before investing in any fund or security, please read closely the applicable prospectus and other legal information.
Chicago Board Options Exchange® (CBOE®) provided financial support for the research for this paper.
Options involve risk and are not suitable for all investors. Prior to buying or selling an option, a person must receive a copy of Characteristics and Risks of Standardized Options. Copies are available from your broker, by calling 1-888-OPTIONS, or from The Options Clearing Corporation at www.theocc.com. The information in this paper is provided for general education and information purposes only. No statement within this paper should be construed as a recommendation to buy or sell a security or to provide investment advice. The BXM, BXY, CLL and PUT indices (the “Indexes”) are designed to represent proposed hypothetical options strategies. The actual performance of investment vehicles such as mutual funds or managed accounts can have significant differences from the performance of the Indexes. Investors attempting to replicate the Indexes should discuss with their advisors possible timing and liquidity issues. Like many passive benchmarks, the Indexes do not take into account significant factors such as transaction costs and taxes. Transaction costs and taxes for strategies such as the Indexes could be significantly higher than transaction costs for a passive strategy of buying-and-holding stocks. Investors should consult their tax advisor as to how taxes affect the outcome of contemplated options transactions.
Past performance does not guarantee future results. This document contains index performance data based on back-testing, i.e., calculations of how the index might have performed prior to launch. Back-tested performance information is purely hypothetical and is provided in this paper solely for informational purposes. Back-tested performance does not represent actual performance and should not be interpreted as an indication of actual performance. It is not possible to invest directly in an index. CBOE calculates and disseminates the Indexes. Supporting documentation for any claims, comparisons, statistics or other technical data in this paper is available from CBOE upon request.
The methodologies of the Indexes are the property of Chicago Board Options Exchange, Incorporated (CBOE). CBOE®, Chicago Board Options Exchange®, CBOE Volatility Index® and VIX® are registered trademarks and BXM, BXY, BuyWrite, CLL, PUT, PutWrite and SPX are service marks of CBOE. S&P® and S&P 500®are registered trademarks of Standard and Poor's Financial Services, LLC and are licensed for use by CBOE. Financial products based on S&P indices are not sponsored, endorsed, sold or promoted by Standard & Poor’s, and Standard & Poor’s makes no representation regarding the advisability of investing in such products. All other trademarks and service marks are the property of their respective owners. The Indexes and all other information provided by CBOE and its affiliates and their respective directors, officers, employees, agents, representatives and third party providers of information (the “Parties”) in connection with the Indexes (collectively “Data”) are presented "as is" and without representations or warranties of any kind. The Parties shall not be liable for loss or damage, direct, indirect or consequential, arising from any use of the Data or action taken in reliance upon the Data. Redistribution, reproduction and/or photocopying in whole or in part are prohibited without the written permission of CBOE.
More information (including a later version of this paper) is or will be available at www.ingarm.org and www.cboe.com/funds.
Please email comments to [email protected], [email protected] or [email protected].
Copyright © 2015 CBOE. All Rights Reserved.
"Performance Analysis of Options-Based Equity Mutual Funds, CEFs, and ETFs” (January 2015) 30