perform, achieve & trade (pat) - institute for industrial … doc 9.pdf · perform, achieve...
TRANSCRIPT

Perform, Achieve & Trade (PAT) BEE Experience
S. P. Garnaik Bureau of Energy Efficiency
Ministry of Power, Govt. of India

India : Fact File
Population : 1.21 billion
GDP : $ 1.53 trillion GDP Growth : 8.5% pa
GDP Share : Service Sector (55.3%) Industry (28.6%) Agriculture ( 16.1%)
5th Largest Primary Energy Demand 1 / 4.7th of World per capita consumption 1 / 22nd of US per capita consumption
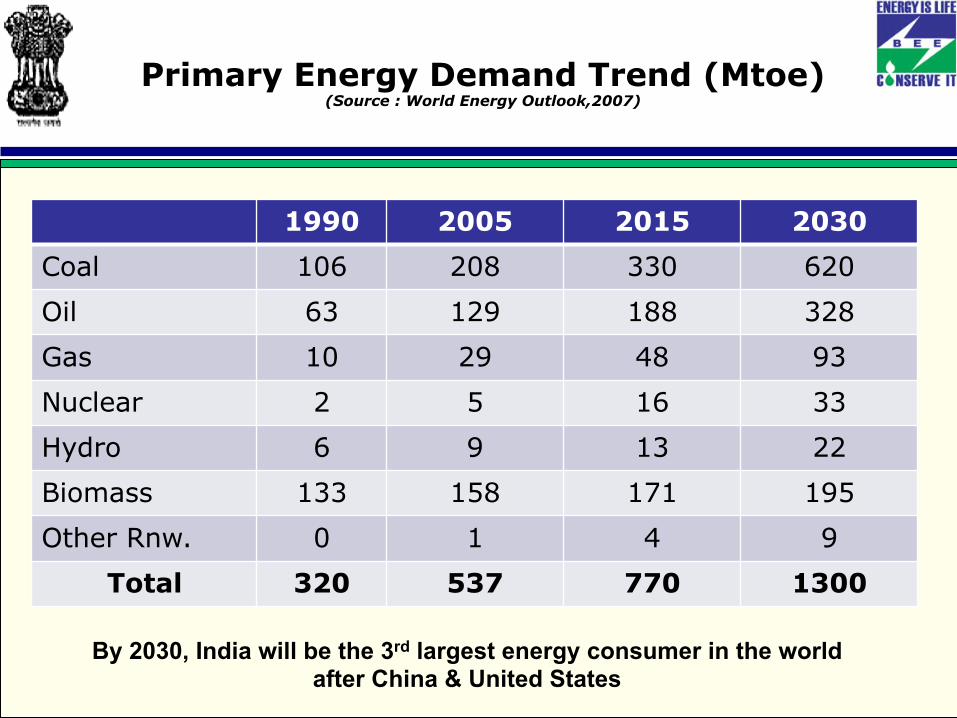
Primary Energy Demand Trend (Mtoe) (Source : World Energy Outlook,2007)
1990 2005 2015 2030 Coal 106 208 330 620
Oil 63 129 188 328
Gas 10 29 48 93
Nuclear 2 5 16 33
Hydro 6 9 13 22
Biomass 133 158 171 195
Other Rnw. 0 1 4 9
Total 320 537 770 1300
By 2030, India will be the 3rd largest energy consumer in the world after China & United States

Energy Efficiency is essential !

Par$culars 2004-‐05 2005-‐06 2006-‐07 2007-‐08
2008-‐09
Industry GDP (in Rs. Crore) 468,451 506,519 560,775 602,032 617,882
Commercial energy consump$on in Industry (in mtoe)
152.8 164.7 174.3 181.4 186.3
Energy Intensity of industry sector (mtoe per Billion Rs. GDP)
0.0326 0.0325 0.03102 0.03019 0.03015
Ra$o energy intensity: industry vs. agriculture and service sector
4 4.3 4.2 4.3 4.4
Note: GDP at factor cost at constant (1999-‐2000) prices (in Rs. Crore) Source: Green raEng Project, 2009, Centre for Science and Environment, New Delhi
The energy intensity i.e. energy consumed per unit of GDP for industrial sector has declined by about 1.5% per annum during 2004-05 to 2008-09 although the ratio of energy intensity in industry to agriculture & service sector hovers around 4.0 – 4.4
Energy Scenario in Industrial Sector

Increase Competitiveness
- Change in Technology - Retrofit Options - - In-House R&D
- -Adoption of EE Techniques - -Fuel Shift
Regulatory Compulsion
- EC Act 2001 - Energy Audits
- - Separate EC Cell
Increase Awareness About EC
- More Publicity thru various media
- Concept of CB options - - NECA
- -Rigorous Activities by various agencies
Reasons for Change in Energy Usage Pattern

Trend of SEC (Elect.) of Cement Industries (KWH/ton)
9188
8784
77.5 76.475.2
60
65
70
75
80
85
90
95
1999-00 2000-01 2001-02 2002-03 2005-06 2006-07 2007-08
Data of 38 major industries having Dry-Process Technology
Source : TERI
Data of 28 major industries having Dry-Process Technology
Source : BEE
SEC has reduced by about 1.7% per year
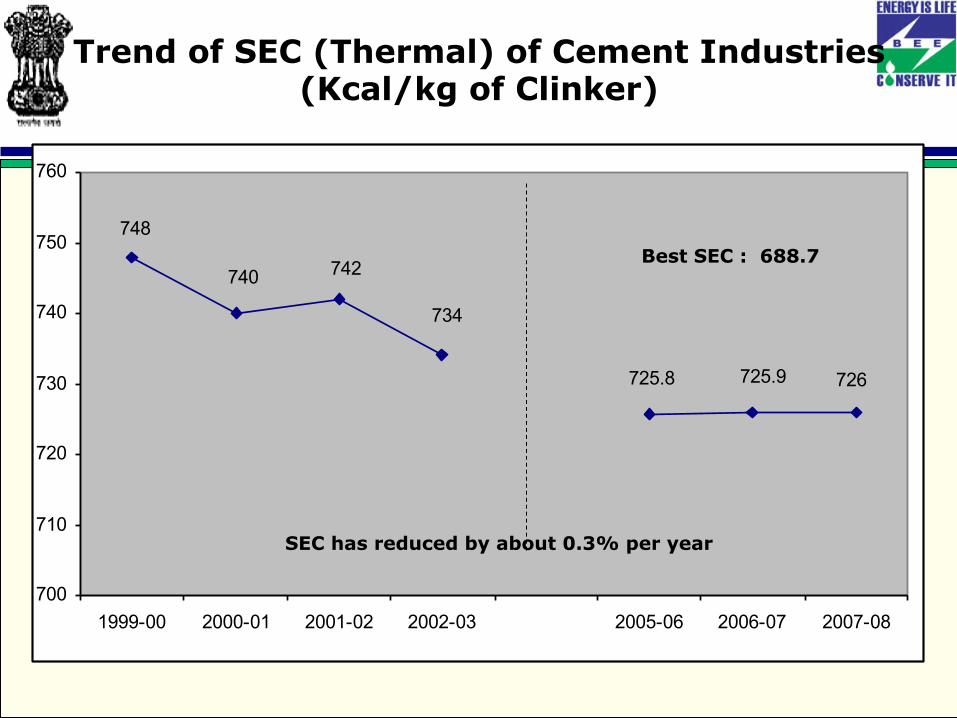
Trend of SEC (Thermal) of Cement Industries (Kcal/kg of Clinker)
SEC has reduced by about 1.7% per year
748
740 742
734
725.8 725.9 726
700
710
720
730
740
750
760
1999-00 2000-01 2001-02 2002-03 2005-06 2006-07 2007-08
SEC has reduced by about 0.3% per year
Best SEC : 688.7

NATIONAL MISSION FOR ENHANCED ENERGY EFFICIENCY (NMEEE)
Ø The National Action Plan on Climate Change was released by Honorable Prime Minister of India in June 2008
Ø The Action Plan Outlines 8 Missions including National Mission on Enhanced Energy Efficiency (NMEEE) Ø The Mission has outlined specific goals
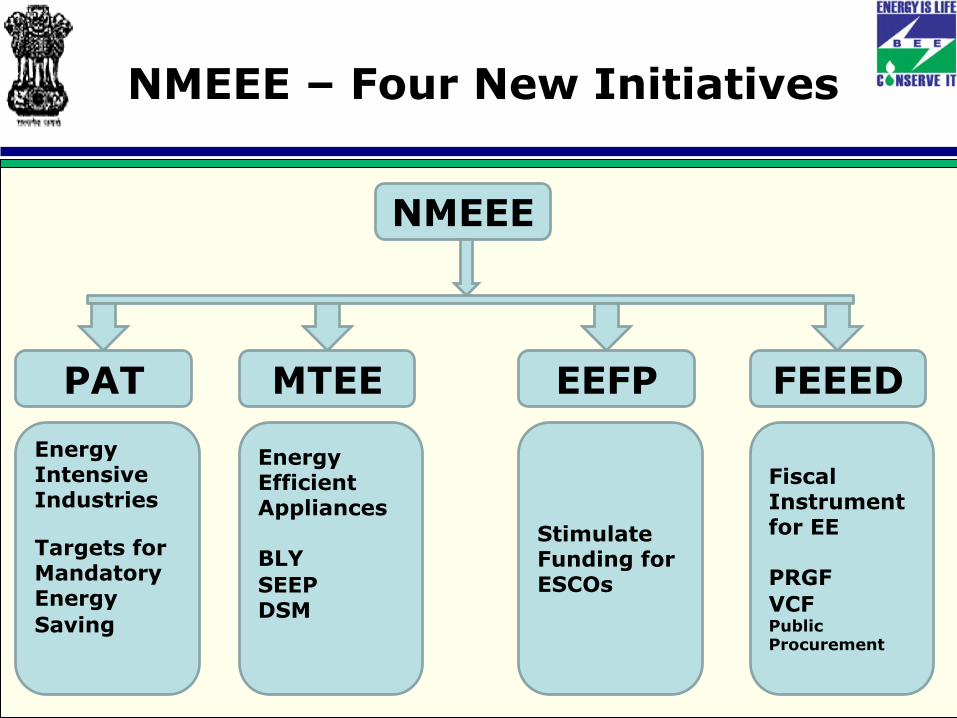
NMEEE – Four New Initiatives
NMEEE
PAT MTEE EEFP FEEED Energy Intensive Industries
Targets for Mandatory Energy Saving
Energy Efficient Appliances BLY SEEP DSM
Stimulate Funding for ESCOs
Fiscal Instrument for EE PRGF VCF Public Procurement

PAT Scheme : Background & Scope
Ø Covers 477 designated consumers in 8 sectors Ø All DCs consume about 165 mtoe energy Ø Targets would be given to all DCs to achieve the same within a time frame • Achievement > Target E-Scerts • Achievement < Target Purchase E-Scerts / Penalty
Ø National Target = 6.6 mtoe at the end of 1st PAT Cycle ( by 2014-15)

Concept of Target, Compliance, Escerts & Penalty
Target
Baseline SEC
Target SEC
Achieved SEC
Scenario 1 Scenario 2
Compliance
Issued Escerts
Purchase Escerts
Penalty
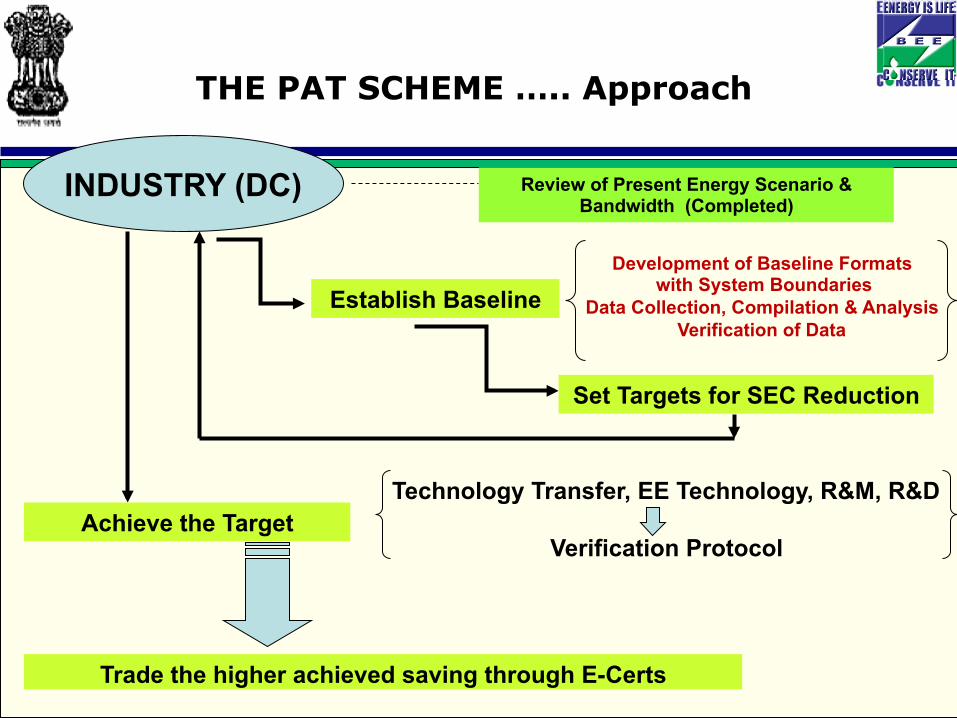
THE PAT SCHEME ….. Approach
INDUSTRY (DC)
Establish Baseline
Review of Present Energy Scenario & Bandwidth (Completed)
Development of Baseline Formats with System Boundaries
Data Collection, Compilation & Analysis Verification of Data
Set Targets for SEC Reduction
Achieve the Target Technology Transfer, EE Technology, R&M, R&D
Verification Protocol
Trade the higher achieved saving through E-Certs

The energy usage pattern varies widely in industries of a particular sector due to various diversities like - Scale of Production (Installed Capacities) - Use of Raw Material - Process Technology - Vintage - O & M Practices - Type of Product Output etc.
Reasons for Large Energy Usage Bandwidth
Factors of Diversity Most Affected Sectors a) Raw Material Input Pulp & Paper, FerElizer, Power Plant, TexEle a) Quality of Raw Material / Fuel All sectors a) Process & Technology Aluminium, Iron & steel, Chlor-‐Alkali, Paper a) Final Product output TexEle, Iron & Steel, Aluminium a) Vintage All Sectors a) Capacity UElilizaEon All sectors

Reported Data by Different DCs have revealed the impact on SEC due to various diversities
No. of DCs Range of SEC 145 1740 -‐ 4028 Kcal/kwh 65 0.052 -‐ 0.112 toe/ t 80 0.02 -‐ 14.75 toe/ t 28 2.68 -‐ 16.89 toe/ t 10 0.183 -‐ 6.405 toe/ t 31 0.215 -‐ 1.57 toe/ t 85 0.01 -‐ 7.8 toe/ t 18 0.194 -‐ 1.833 toe/ t
Sector 0 1 2 3 4 5 6 7 8 9 10 11 12 13 14 15 16 17
CementIron & SteelFertilizerAluminiumPulp & PaperTextileChlor-‐Alkali
toe / ton of product
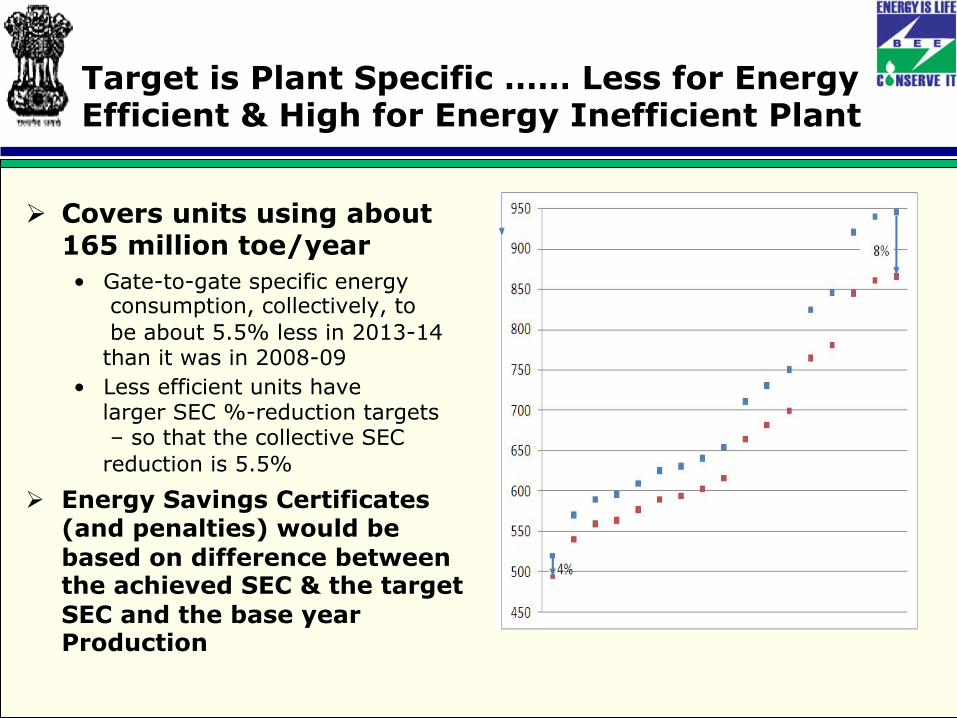
Target is Plant Specific …… Less for Energy Efficient & High for Energy Inefficient Plant
Ø Covers units using about 165 million toe/year • Gate-to-gate specific energy
consumption, collectively, to be about 5.5% less in 2013-14 than it was in 2008-09
• Less efficient units have larger SEC %-reduction targets – so that the collective SEC reduction is 5.5%
Ø Energy Savings Certificates (and penalties) would be based on difference between the achieved SEC & the target SEC and the base year Production

SEC Spread in Baseline & Target Year
Pulp & Paper Sector Wood Based Chemical Pulping Process Non-Specialty paper
17 DCs
Baseline SEC
8.51% Higher Target for Energy In-Efficient
Plants

SEC Spread as per Grouping of DCs in Pulp & Paper Sector
Wood : Ch. Pulping + NSP
100% market Pulp
Wood : Ch. Pulping + SP
Agro based RCF :
News Print
Wood : News Print
RCF : Non-News Print

Approach for Setting Targets Depends upon the Objective of the Scheme
Total Saving Objective = 6.6 MTOE
Sector No. of Iden$fied DCs
Reported Energy Consump$on
Share of Consump$on
Appor$oned Energy
reduc$on
(MTOE) (%) (MTOE) Iron & Steel 76 28.00 46.66% 1.647 Cement 82 11.87 19.78% 0.698 FerElizers 29 7.86 13.10% 0.462 Aluminium 10 7.73 12.88% 0.455 Paper & pulp 31 2.09 3.48% 0.123
TexEle 85 1.62 2.70% 0.095 Chlor-‐Alkali 22 0.84 1.40% 0.049 Sub_Total 335 60.01 100% 3.53
TPPs 142 104.56 100% 3.10 TOTAL 477 164.57 6.63

Challenge before PAT
Ø In order to achieve the target set for the industry in a sector, the industry has to look for
- Efficiency improvement in existing plant through retrofit options
- Introduce best available technology - R & M of existing plants - Recovery of Waste Energy
It is quite necessary to overcome the barrier (High Initial Cost) to make the energy efficient technologies as an attractive option.
Technology Transfer is quite necessary at an affordable cost and acceptable mechanism.
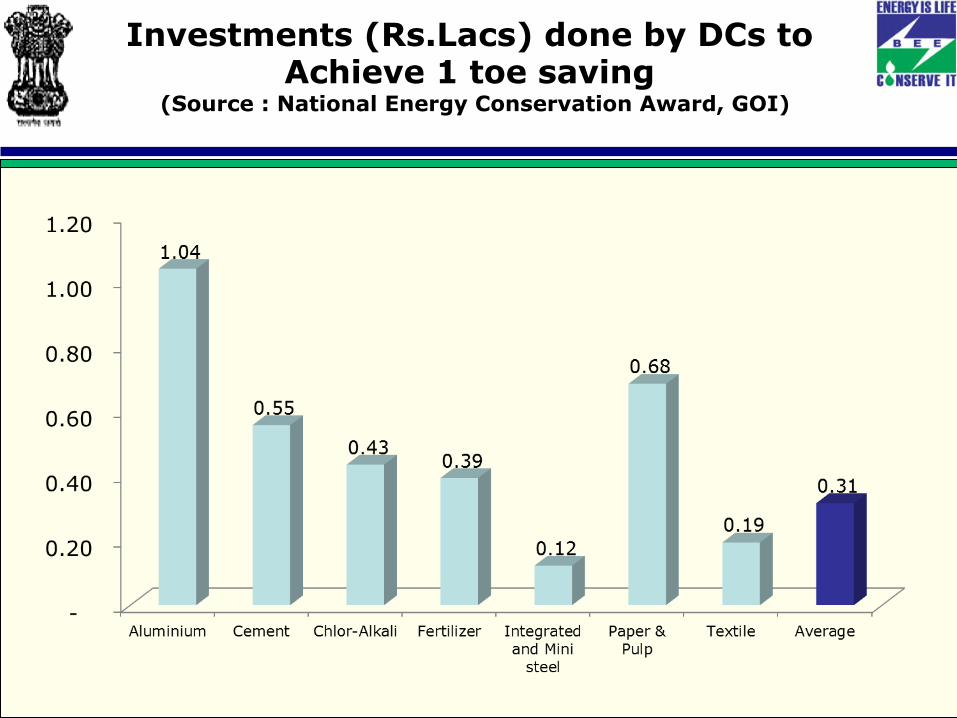
Investments (Rs.Lacs) done by DCs to Achieve 1 toe saving
(Source : National Energy Conservation Award, GOI)

Investments Expected to Achieve PAT Targets
S. No
Sector / Sub sector
Investment per toe
(in Rs. Lakhs)
Saving (in mtoe)
Investment (Rs. Cr)
1 Aluminium 1.037 0.455 4717 2 Cement 0.555 0.698 3873 3 Chlor-Alkali 0.433 0.049 212 4 Fertilizer 0.392 0.462 1812 5 Iron & Steel 0.122 1.647 2007 6 Paper & Pulp 0.682 0.123 839 7 Textile 0.193 0.095 184
Sub-Total 3.530 13,644 8 Thermal Power Plants 2.00 3.100 62,000
Grand Total 6.63 75,644
23
Thanks …. For further information, Please Contact
S.P.Garnaik Energy Economist
Bureau of Energy Efficiency,
Ministry of Power, GOI
Ph.: 011-23359736
Email: [email protected]

• National Solar Mission • National Mission for Enhanced Energy Ef4iciency • National Mission on Sustainable Habitat • National Water Mission • National Mission for Sustaining the Himalayan Ecosystem • National Mission for a Green India • National Mission for Sustainable Agriculture • National Mission for Strategic Knowledge for Climate Change
Missions under NAPCC
Mission Goals
Ø Market-based approaches to unlock energy efficiency opportunities, estimated to be about Rs. 74,000 Crores
Ø By 2014-15: • Annual fuel savings in excess of 23 million toe • Cumulative avoided electricity capacity addition of
19,000 MW • CO2 emission mitigation of 98 million tons per year

Industry Sector Annual Energy Consumption Norm to be
DC (mtoe)
No. of Identified DCs
Aluminum 7500 10 Cement 30000 82
Chlor-Alkali 12000 22 Fertilizer 30000 29
Pulp & Paper 30000 31 Power 30000 142
Iron & Steel 30000 76 Textiles 3000 85
List of DCs

Sector MTOE Power (Thermal) 104.14 Iron & Steel 28.00 Cement 11.87 FerElizer 7.86 Aluminium 7.73 Paper 2.09 TexEle 1.62 Chlor-‐Alkali 0.84
TOTAL 164.15
Estimated Energy Consumption in DCs
About 70% of DCs Contribute 97% of Total
Consumption
About 30% of DCs contribute rest 3% of Total Consumption

Target in PAT
Target is defined as the % reduction of ‘Specific Energy Consumption (SEC)’ from Baseline value.
Plant System Boundary
All forms of Energy Product
E P
SEC = E / P SEC
Y1 Y2 Y3
Baseline SEC
Target SEC Reduction in SEC
Expressed in %