percolation in suspensions of polydisperse hard rods
TRANSCRIPT

Percolation in suspensions of polydisperse hard rods: Quasi universality and finite-size effectsHugues Meyer, Paul van der Schoot, and Tanja Schilling Citation: The Journal of Chemical Physics 143, 044901 (2015); doi: 10.1063/1.4926946 View online: http://dx.doi.org/10.1063/1.4926946 View Table of Contents: http://scitation.aip.org/content/aip/journal/jcp/143/4?ver=pdfcov Published by the AIP Publishing Articles you may be interested in Effect of carbon nanotube geometry upon tunneling assisted electrical network in nanocomposites J. Appl. Phys. 113, 234313 (2013); 10.1063/1.4809767 Geometric percolation in polydisperse systems of finite-diameter rods: Effects due to particle clustering andinter-particle correlations J. Chem. Phys. 137, 134903 (2012); 10.1063/1.4755957 Effect of quenched size polydispersity on the fluid-solid transition in charged colloidal suspensions J. Chem. Phys. 134, 154504 (2011); 10.1063/1.3580284 A finite-size dynamic-scaling approach for the diffusion front of particles J. Chem. Phys. 121, 328 (2004); 10.1063/1.1756853 A percolation model for lifetime variability in polymeric materials under creep conditions J. Appl. Phys. 88, 76 (2000); 10.1063/1.373627
This article is copyrighted as indicated in the article. Reuse of AIP content is subject to the terms at: http://scitation.aip.org/termsconditions. Downloaded to IP:
158.64.77.126 On: Fri, 31 Jul 2015 13:58:52
THE JOURNAL OF CHEMICAL PHYSICS 143, 044901 (2015)
Percolation in suspensions of polydisperse hard rods: Quasi universalityand finite-size effects
Hugues Meyer,1 Paul van der Schoot,2,3 and Tanja Schilling11Research Unit for Physics and Materials Science, Université du Luxembourg,L-1511 Luxembourg, Luxembourg2Department of Applied Physics, Eindhoven University of Technology, P.O. Box 513,3500 MB Eindhoven, The Netherlands3Institute for Theoretical Physics, Utrecht University, Leuvenlaan 4, 3584 CE Utrecht, The Netherlands
(Received 1 June 2015; accepted 7 July 2015; published online 22 July 2015)
We present a study of connectivity percolation in suspensions of hard spherocylinders by means ofMonte Carlo simulation and connectedness percolation theory. We focus attention on polydispersityin the length, the diameter, and the connectedness criterion, and we invoke bimodal, Gaussian, andWeibull distributions for these. The main finding from our simulations is that the percolation thresholdshows quasi universal behaviour, i.e., to a good approximation, it depends only on certain cumulantsof the full size and connectivity distribution. Our connectedness percolation theory hinges on aLee-Parsons type of closure recently put forward that improves upon the often-used second virialapproximation [T. Schilling, M. Miller, and P. van der Schoot, e-print arXiv:1505.07660 (2015)].The theory predicts exact universality. Theory and simulation agree quantitatively for aspect ratios inexcess of 20, if we include the connectivity range in our definition of the aspect ratio of the particles.We further discuss the mechanism of cluster growth that, remarkably, differs between systems thatare polydisperse in length and in width, and exhibits non-universal aspects. C 2015 AIP PublishingLLC. [http://dx.doi.org/10.1063/1.4926946]
I. INTRODUCTION
Composite nanomaterials have long attracted attentionbecause of their potential application, for instance, in elec-tronics, display technology, and photovoltaics.2 Of particularinterest in this context are their heat and charge transport prop-erties.3 Adding a sufficient amount of electrically conductivenanoparticles, such as carbon nanotubes or graphene, to aninsulating polymer matrix produces a conductive compositethe conductivity of which can be tuned by the choice of fillertype, filler loading, and processing.4 For many technologicalapplications, the minimum filler loading required to reach aconductive state, the so-called percolation threshold, is desiredto be as low as possible.5 Rod-like particles are particularlysuitable for this kind of application since they present very lowpercolation thresholds.6 For the purpose of the rational designof such materials, it is crucial to be able to describe and predictthe percolation threshold of assemblies of filler particles andunderstand the underlying mechanisms of the buildup of thesystem-spanning network required for effective conduction.
In experimental reality, the properties of the filler nanopar-ticles are not always well controlled.7 Indeed, they are usuallychemically and otherwise polydisperse, that is, consist of amixture of particles of different dimensions and conductiveproperties. This complexity makes prediction of the percola-tion threshold and of the network structure very difficult, notleast because of the huge parameter space. In this paper, wepresent a simulation and theoretical study of percolation indispersions of polydisperse nanorods, specifically allowing forhard core interactions and targeting aspect ratios that are of anintermediate range, i.e., not in the scaling limit.8–10
Even though we find qualitative agreement with workon polydisperse ideal (penetrable) rods10 and very long hardrods8,9 (showing that the percolation threshold obeys laws thatwithin a good approximation depend only on a few moments ofthe full distributions functions), quantitatively our results arevery different. In fact, we find strong deviations in the depen-dence of the percolation threshold on the appropriate measuresfor the mean aspect ratio and connectivity of the particles.Finally, we find that the network connectivity properties areaffected differently by variabilities in length, diameter, andconnectivity criterion.
It is important to point out that the model systems that havebeen studied in the literature so far usually capture only oneor a few aspects relevant to experimental reality. A very largefocus is on the particle shape, attractive interactions, and aspectratio.11 While there is a huge body of the literature dealing withmonodisperse systems, relatively little attention has been paidto polydisperse systems.11–27 Recently, Chatterjee28 and Ottenand Van der Schoot8,9 have developed theories of continuumpercolation that take polydispersity into account and predictuniversal scaling laws for the percolation threshold. Thesepredictions have only to a small extent been tested numerically.
In a recent simulation study, Nigro and co-workers confirmthat for hard and penetrable rods that are polydisperse only inlength, the percolation threshold depends only weakly on theexact shape of the length distribution.10 A similar finding wasobtained by Mutiso and collaborators for mutually penetrablelength and width polydisperse rods.29 They also find that finite-aspect-ratio corrections on the predictions of Otten and Vander Schoot are quite significant up to aspect ratios of about100.8,9
0021-9606/2015/143(4)/044901/9/$30.00 143, 044901-1 © 2015 AIP Publishing LLC
This article is copyrighted as indicated in the article. Reuse of AIP content is subject to the terms at: http://scitation.aip.org/termsconditions. Downloaded to IP:
158.64.77.126 On: Fri, 31 Jul 2015 13:58:52

044901-2 Meyer, van der Schoot, and Schilling J. Chem. Phys. 143, 044901 (2015)
Here, we go considerably beyond the scope of earlierwork and report on simulation results for three differenttypes of polydispersity that we investigate separately. Thecoupling between different kinds of polydispersity, predictedto be relevant for many experimental systems,9 is post-poned to future work. We show that the different kindsof polydispersity exhibit non-trivial universal behaviour. Weinvoke a treatment of connectedness percolation theory ofhard rods recently put forward by us,1 which is aimed atpredicting finite-aspect-ratio corrections rather than obtainingthem phenomenologically from simulations, as was done inRef. 29.
The remainder of this paper is arranged as follows. Wepresent in Section II the methods implemented in the Monte-Carlo simulations. Section III deals with the derivation of ourversion of connectivity percolation theory for polydispersespherocylinders, including the Lee-Parsons approximation. Fi-nally, we focus in Section IV on both numerical and theoreticalresults, first about the percolation thresholds and then about thecluster mechanisms. We end the paper with conclusions and asummary of the main findings in Section V.
II. SIMULATION METHODS
We consider hard spherocylinders consisting of cylindersof length Li and diameter Di, each capped by two hemispheresof the same diameter. See Fig. 1. The particles are not allowedto overlap but do not directly interact with each other whenthey are not in contact. The corresponding interaction poten-tial is therefore either zero or infinite, making their resultingequilibrium properties temperature independent. We initializea simulation box in which around 10 000 spherocylinders areperfectly aligned and regularly placed on square lattices spacedfrom each other along the rod direction. At each simulationstep, the particles are then randomly rotated and translated.Equilibration is monitored by computing the nematic orderparameter, which is expected to reach a constant value at theequilibrium (0 in the isotropic phase). Once the system isequilibrated, we generate ca. 5000 independent configurationsof the system and average all quantities of interest over thoseconfigurations. In order to detect overlapping particles effi-ciently, the box is divided into a fine grid,30 where the unitcell length is chosen equal to the greatest rod diameter in the
FIG. 1. Definition of the particle dimensions and connectivity range.
system, so that the computational cost increases linearly withthe number of particles. This method is very fast but ratherexpensive in terms of memory.
We take polydispersity into account by assigning to eachrod a length and a diameter according to a probability densityfunction PL and PD. To generate a finite number of rodsfrom a continuous distribution, we define an interval ∆x wherex = L,D stands for length and width, and force the system tocontain NPx(x0)∆x rods, whose dimension lies between x0and x0 + ∆x. This method turns out to give much more accurateresults than simply drawing the rod dimensions directly fromthe distribution under study. In this work, the mean aspectratio lies around L/D = 15 and the widest distributions weconsidered spread up to an aspect ratio of approximatively L/D= 80 for the very longest rods. In order to clearly distinguishbetween the effects of length and diameter polydispersity, wechoose only uncorrelated distributions. As already advertised,this assumption does not necessarily apply to all experimentalsystems.
Connectedness percolation requires the definition of aninter-particle connectedness criterion. We define for each rodi a spherocylindrical shell of length Li and diameter Di + ξithat contains the particle, where the connectivity parameterξi obeys some distribution function P(ξ). Two particles arethen connected if their surrounding shells overlap. Clustersare defined by contiguous pairwise connections. We define aconfiguration percolating if one of its clusters is connected toits image under periodic boundary conditions. To every config-uration corresponds a percolation probability that is either 1(it percolates) or 0 (it does not percolate), and averaging overmany configurations, we compute a global continuous perco-lation probability for a particular system. A typical snapshot ofsuch a sample and of its corresponding largest cluster is shownin Fig. 2.
In order to estimate the percolation threshold for a partic-ular length, diameter, or connectivity distribution, we performsimulations using this distribution for a range of rod volumefractions. The volume fraction φ is defined with respect tothe hard core volume of the particles and does not take into
account the connectivity shell: φ = 1a3
Ni=1
vi where vi = π4 LiD2
i
+ π6 D3
i is the volume of the particle i, and a is the simulationbox length. The percolation probability in a finite system isa sigmoidal function of the volume fraction running from 0to 1. Its transition steepness increases with the box size andreaches a Heaviside step function in the limit of infinite boxvolume. The curves that correspond to different box volumescross each other slightly below the concentration at which theprobability reaches the value of 0.5. As we are interested in thescaling behaviour of the percolation threshold with the aspectratio and cumulants of the size distribution of the particles,we do not need very accurate estimates. Hence, we ignorefinite size effects and assume that the percolation threshold isthe volume fraction corresponding to a percolation probabilityof 0.5. We verify that our box is sufficiently large to ensurethat the percolation probability goes from 0.2 to 0.8 within amaximal volume fraction range ∆φmax = 0.005. We assumethis criterion to be restrictive enough for our results to achievea satisfactory accuracy.
This article is copyrighted as indicated in the article. Reuse of AIP content is subject to the terms at: http://scitation.aip.org/termsconditions. Downloaded to IP:
158.64.77.126 On: Fri, 31 Jul 2015 13:58:52

044901-3 Meyer, van der Schoot, and Schilling J. Chem. Phys. 143, 044901 (2015)
FIG. 2. Snapshot of an equilibrated configuration of diameter polydisperse spherocylinders at the critical volume fraction (left) and of the largest cluster within
this particular configuration (right). Distribution is of the Weibull form P(D)∝ (Dβ
)α−1e−(D/β)α with α = 2.83 and β = 1.16. Lengths and connectedness
distances are all fixed to L = 15 and ξ = 0.2, respectively.
The effects of polydispersity on the percolation behaviourwill also depend on the proximity of the system to phase transi-tions. On increasing concentration, spherocylindrical particlesundergo a transition to the nematic phase, the orientationalorder of which influences the connectivity in the system. It istherefore a major concern to know if percolation is reached at alower or higher density than the isotropic-nematic phase tran-sition. This phenomenon has, for instance, been shown to beimportant in suspensions of percolating platelets.31 However,ξ can be adjusted in order to lower or raise the percolationthreshold, since it plays a role in the connectedness propertiesbut not in the structure of the fluid. Our simulations were runwith values of ξ that are in the order of the electron tunnelinglength in metallic fibres in composite materials. For thesevalues, percolation always occurs in the isotropic phase.
III. THEORY
Percolation of clusters of nanoparticles in a fluid back-ground medium can be investigated theoretically invokingwhat in essence is liquid state integral equation theory.5 Thetheoretical framework is called connectedness percolationtheory and it has been applied to hard and soft rod-like parti-cles.8,9,12 Here, we follow the same recipe, except that we willnot rely on the second virial approximation that becomes exactin the limit of infinite aspect ratio. Instead, we opt for a closurethat was recently shown to provide an accurate description ofpercolation of monodisperse, hard rods with an aspect ratiolarger than roughly 10.1
Within the framework of connectedness percolation the-ory, the cluster size S can be expressed in terms of a functionT , averaged over all of the attributes of orientation vector u anddimensions x ≡ (L,D, ξ) of the particles,9
S = ⟨T(x,u)⟩x,u. (1)
The function T itself is a pair connectedness function averagedover its attributes and the solution of a generalised connected-
ness Ornstein-Zernike equation
T(x,u) − ρC+(0,x,x′,u′)T(x′,u′)�x′,u′ = 1. (2)
Here, ρ is the number density of particles and C+ = C+(q,u,u′),the spatial Fourier transform of the connectedness direct corre-lation function, that is, the direct correlation function for parti-cles that are part of the same cluster, and q the wave vector. Toaverage over the entire volume of the system, we have to takethe zero wave vector limit, q → 0.
In the isotropic phase, the rods are randomly oriented,implying that T(x,u) = T(x), which in turn allows us to rede-fine C+ as its average over the possible orientations, producingthe simplified connectedness Ornstein-Zernike equation
T(x) − ρC+(0,x,x′)T(x′)�x′ = 1. (3)
This equation needs to be closed and we follow Schillinget al.1 by invoking the following ansatz: C+(0,x,x′) = Γ(φ) f +
(0,x,x′).1 Here, f + = e−βu+
is the connectedness Mayer func-tion and f +, its spatial Fourier transform,9 with β the reciprocalthermal energy and u+ the so-called connectedness potential,and Γ(φ), a coefficient that depends on the volume fraction φof the particles. For hard spheres, we write C(r) = Γ(φ) f (r)where the Mayer function f (r) produces the second virialexcess free energy if we choose as the reference state thezero density gas. Γ(φ) is chosen such that we reproduce theCarnahan-Starling equation of state. Therefore, the thermo-dynamics is at the level of Carnhan-Starling but the struc-ture is that of a second virial fluid. Then, we make use ofthe identity C = C+ + C∗, with C+ the connectedness directcorrelation function and C∗ the blocking or disconnectednessdirect correlation function. We furthermore have the identity f= f + + f ∗, which completes our derivation, giving C+ = Γ(φ)f +. The functional form of Γ is obtained from the Lee-Parsonsexpression for the excess free energy, interpolating betweenthe Percus-Yevick equation of state for hard spheres and theOnsager equation of state for hard rods.32–37 Similar closurerelations have recently been developed by Chatterjee for disk
This article is copyrighted as indicated in the article. Reuse of AIP content is subject to the terms at: http://scitation.aip.org/termsconditions. Downloaded to IP:
158.64.77.126 On: Fri, 31 Jul 2015 13:58:52
044901-4 Meyer, van der Schoot, and Schilling J. Chem. Phys. 143, 044901 (2015)
percolation.38 Within this ansatz, we have
Γ(φ) = 1 − 34φ
(1 − φ)2 . (4)
Notice that in the limit φ → 0, Γ → 1 and we obtain the secondvirial theory that is valid in the Onsager limit of very slenderrods. As we demonstrated recently,1 corrections to the Onsagerlimit are significant for aspect ratios below a few hundreds.
For the case of hard rods, the connectedness Mayer func-tion is 1 if the distance between two rods is between D and∆ ≡ D + ξ and 0 otherwise. The zero-wave vector Fouriertransform of the connectedness Mayer function f +(0,x,x′) canbe separated into contributions from interactions between thedifferent portions of the spherocylindrical particles. We useOnsager’s expression for the excluded volume of two hardspherocylinders to obtain39
f +(0,x,x′) = LL′∆ + ∆′
2f11 + (L + L′)
(∆ + ∆′
2
)2
f10
+
(∆ + ∆′
2
)3
f00 − LL′D + D′
2f11
− (L + L′)(
D + D′
2
)2
f10 −(
D + D′
2
)3
f00 (5)
where ∆ = D + ξ and the coefficients f00 = 4π/3, f10 = π,and f11 = π/2, respectively, indicate the cylinder-cylinder,cylinder-hemisphere and hemisphere-hemisphere contribu-tions. Note that because u+ is infinite for particles with overlap-ping hard cores and for those that are not connected, and zerofor connected ones, f + is essentially the difference betweenthe excluded volume of two particles with hard-core radius ∆minus that of particles with hard-core radius D.
Let us first focus on length polydispersity alone, and setD = D′ and ∆ = ∆′. In this particular case, Eq. (5) becomes
f +(L,L′) = LL′ω1 f11 + (L + L′)ω2 f10 + ω3 f00, (6)
where ωn = ∆n − Dn are differences between powers of the
interaction ranges ∆ and D. Inserting this into Equation (3),we find
T(L) − ρΓ(φ)(Lω1 f11 + ω2 f10) ⟨LT(L)⟩L− ρΓ(φ)(Lω2 f10 + ω3 f00)⟨T(L)⟩L = 1. (7)
The two unknown coupled quantities are ⟨T(L)⟩L and ⟨LT(L)⟩L; therefore, we need two independent equations relatingthem. The first one we obtain by averaging Equation (7),whereas the second we derive by first multiplying Equation (7)with L and averaging the resulting equation. As these relationsare linear, we can summarize them by defining two vectors Xand Y and a matrix M:
X =
⟨T(L)⟩⟨LT(L)⟩
, Y =
1⟨L⟩
,
M =
1 − kα1 −k β1
−kα2 1 − k β2
, M X = Y ,
(8)
where we use the notation k ≡ ρΓ(φ), α1 ≡ ⟨L⟩ω2 f10 + ω3 f00,α2 ≡
L2�ω2 f10 + ⟨L⟩ω3 f00, β1 ≡ ⟨L⟩ω1 f11 + ω2 f10, and β2
≡L2�ω1 f11 + ⟨L⟩ω2 f10. The cluster size S = ⟨T(L)⟩ is the
first element of X = M−1Y . Each element of the matrix M−1
is a fraction whose denominator is the determinant of M .Therefore, S can be written as
S =
n,p,q
Anpq ⟨Ln⟩ Dpξq
det M, (9)
where Anpq are coefficients which involve the quantities kand f i j. However, their exact expressions are not importantfor the remaining calculations, so we do not reproduce themhere. The percolation threshold is the volume fraction φc forwhich S diverges, or, equivalently, that makes det M = 1 − k(α1 + β2) + k2(α1β2 − α2β1) vanish. Therefore, we determineφc by solving this simple second-order polynomial equationfor k and by then relating k and φ, φΓ(φ) = k ⟨v⟩, where ⟨v⟩= π
4
�⟨L⟩ D2 + 23 D3� is the average volume of a particle. The
polynomial equation yields two solutions k±. We define thenγ± = k± ⟨v⟩.
The final equation that we have to solve is therefore(γ± +
34
)φ2c − (1 + 2γ±)φc + γ± = 0, (10)
which has two solutions for φc,
φc =1 + 2γ± ±
1 + γ±
2γ± + 32
. (11)
We have four solutions for φc but we only keep the positivesolution below unity for obvious physical reasons.
The analysis of the cases of diameter and connectednesspolydispersity is completely analogous to that of length poly-dispersity, that is, the same method is applied starting fromEq. (5) setting L = L′ and ξ = ξ ′, and L = L′ and D = D′,respectively. M then turns into a 3 × 3 matrix for diameterpolydispersity and a 4 × 4 one for connectedness polydisper-sity. This leads to third and fourth order polynomial equationsthat need to be solved. It is important to note that the percola-tion threshold will then explicitly depend on the higher ordermoments ⟨Dn⟩ with n ≤ 4 and ⟨ξm⟩ with m ≤ 6, respectively.To derive a theory for a system polydisperse in length, diam-eter, and connectedness simultaneously is possible, but it doesnot simplify Equation (5). Such calculations would thereforeinvolve quantities of the form ⟨LnDpξq⟩ and could handlecorrelated as well as uncorrelated distributions. However, forclarity of exposition, we decided to keep this for future work.
IV. RESULTS
A. Percolation thresholds
If we invoke the second-virial approximation and neglectthe end-cylinder and end-end interactions, the percolationthreshold, φc, becomes proportional to the reciprocal weightaverage length ⟨L⟩−1
w ≡ ⟨L⟩ / L2�, the mean square widthD2�, and a measure for the mean reciprocal connectivity
length⟨ξ⟩ +
ξ2�−1
, depending on the type of polydisper-
sity.8–10 Although this approximation produces results that arenot very accurate for aspect ratios that are not huge, it is usefulto take it as a reference because it shows what cumulants of
This article is copyrighted as indicated in the article. Reuse of AIP content is subject to the terms at: http://scitation.aip.org/termsconditions. Downloaded to IP:
158.64.77.126 On: Fri, 31 Jul 2015 13:58:52

044901-5 Meyer, van der Schoot, and Schilling J. Chem. Phys. 143, 044901 (2015)
the full distribution are expected to govern the percolationthreshold. We note in this context that the nature of lengthand diameter polydispersity is fundamentally different fromthat of connectedness distance polydispersity. The first tworelate to polydispersity in the particle dimensions and hencein the interactions between particles, whilst the third one is apolydispersity in the electrical connectivity length scale only,which does not affect the structure of the liquid but only theresulting cluster size distribution.
To separate these various effects, we define two new dim-ensionless quantities, being χ = ⟨L⟩w/
D2
�and λ =
⟨ξ⟩
+
ξ2�
/2
D2�. The former, χ, becomes equal to either
⟨L⟩w/D or L/
D2�
depending on the type of polydispersityand is analogous to the aspect ratio, as we cannot define aunique aspect ratio in polydisperse systems. The latter, λ, be-comes
⟨ξ⟩ +
ξ2�
/2D for rods with a monodisperse diam-eter, and represents a characteristic connectedness shell thick-ness compared to the particle diameter. In addition, we derivean approximative expression of the percolation threshold as afunction of both χ and λ,
φc =
43+ 2λ(χ + 8)
−1
. (12)
This expression is obtained within the context of length poly-dispersity, by first truncating the polynomial equation det M= 0 at the first order in density in order to turn it into a triviallinear equation. This yields an approximative solution of thepercolation threshold within the second virial approximation inwhich we only keep the leading order terms. Finally, we insertthis expression into Equation (11) (in place of γ±) in which weTaylor expand the square root up to the first order. Since wederived it from the context of length polydispersity, the finalformula only contains ⟨L⟩w, D, and ξ. However, we extrapolateit to diameter and connectedness polydispersity by replacing⟨L⟩w/D by χ and ξ/D by λ, yielding Equation (12), whichincludes simultaneously the three types of polydispersity.
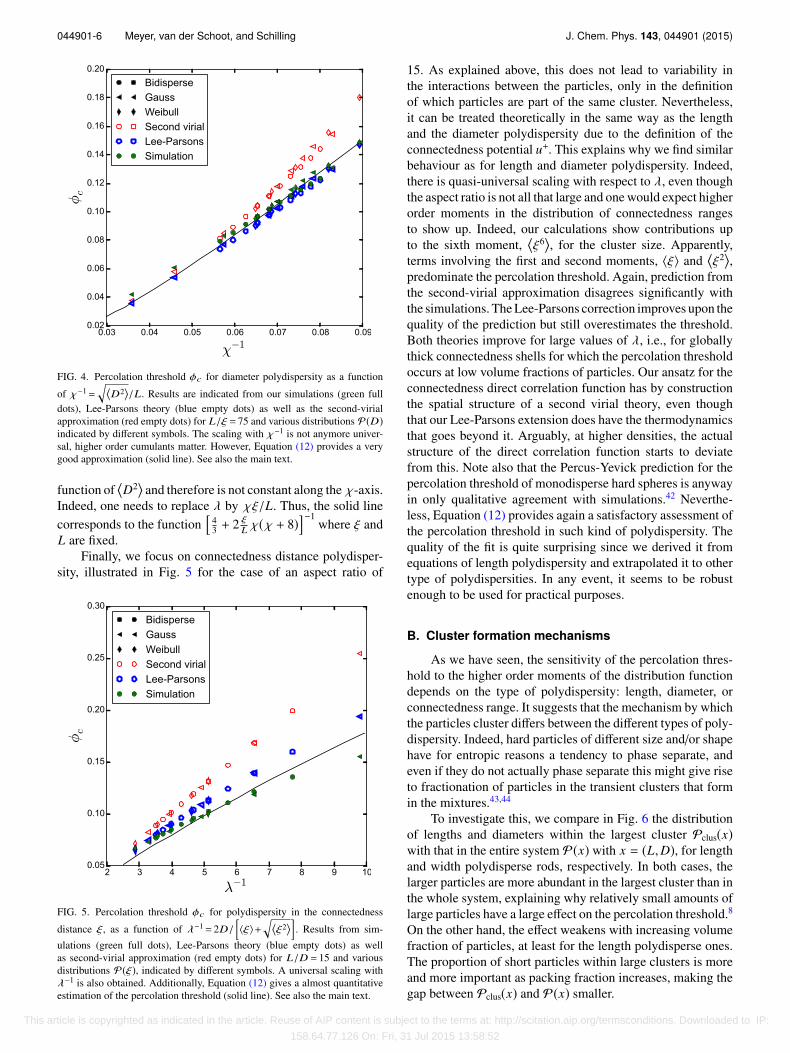
We compare the percolation threshold obtained from oursimulations, predictions based on the theory presented in Sec.III and those from the second-virial theory for which Γ = 1, asa function of χ−1 for length and diameter polydispersity and asa function of λ−1 for connectedness polydispersity. For all threekinds of polydispersity, we tested bidisperse, Gaussian, andWeibull distributions. The first describes binary mixtures, thesecond seems relevant as Gaussian distributions are commonin many fields of physics, and the third has been experimentallyobserved in polymer-fiber composites that are polydisperse inlength.40,41 The simulation data is listed in Tables I–III.
Fig. 3 shows the percolation threshold for the case oflength polydispersity as a function of the inverse aspect ratioχ−1. Both theory and simulations display a remarkable uni-versal behaviour of the percolation threshold as a function of⟨L⟩w. The three different distributions that we tested are verydifferent in shape, but we find that the percolation threshold isnot sensitive to this if expressed in terms of the weight averagelength ⟨L⟩w. This was also shown by Nigro et al.10 for pene-trable particles and in a more limited fashion for hard particles.We find that the Lee-Parsons theory and our simulation results
FIG. 3. Percolation threshold φc for length polydispersity as a functionof the reciprocal aspect ratio χ−1=D/⟨L⟩w. Results are indicated fromsimulations (green full dots), Lee-Parsons theory (blue empty dots) as well asthe second-virial approximation (red empty dots) for ξ/D = 0.2 and variousdistributions P(L) indicated by different symbols. A remarkable universalscaling with χ−1 is observed in the three cases. Simulation data are almostperfectly fit by Equation (12) (solid line). See also the main text.
quantitatively converge in the range χ > 20 and are in qualita-tive agreement below that, whereas the theoretical predictionderived from the second virial approximation deviates notablyeven for relatively large aspect ratios. For monodisperse rods,the Lee-Parsons approach produces quantitative results alreadyfor χ > 10.1 Nevertheless, Equation (12) fits the simulationdata surprisingly well, given the high level of approximationused to derive it. In polydisperse systems, the discrepanciesbetween theory and simulations extend to larger average aspectratios because of the shorter rods that are also present in thesystem. Note that the simulation results are always below thetheoretical prediction. Hence, composite materials that containfibres of short aspect ratio do not need as high filler loadingsas theoretically expected in order to become conductive.
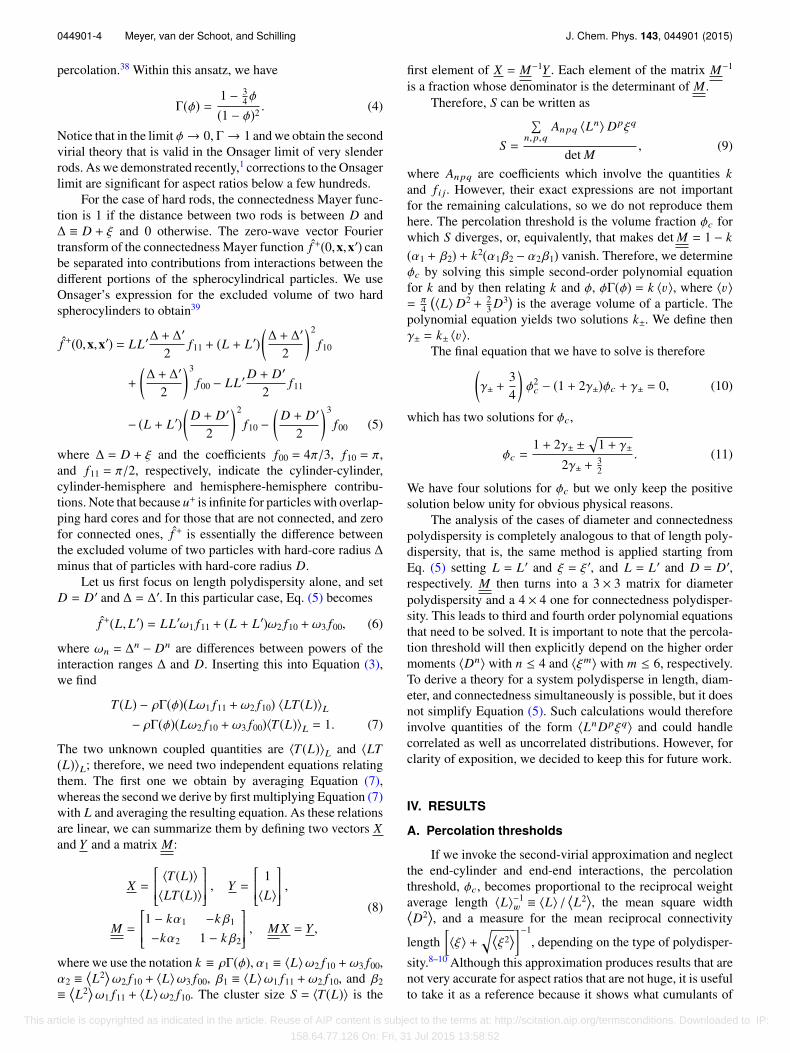
Also for diameter polydispersity, the second order cumu-lant is expected to be the most relevant one according to thesecond-virial theory, at least if we neglect end effects.9 Thisis confirmed in Fig. 4 by both our simulation results and themore accurate predictions of Lee-Parsons theory albeit thatwe do not observe strictly universal behaviour. This suggeststhat higher order cumulants must be important too, at leastfor aspect ratios below 25. Remarkably, even the second-virialprediction yields results that are in almost quantitative agree-ment with the simulations for χ > 15. The Lee-Parsons theoryis in very good agreement with the simulation results evenfor relatively short particles. We note that this theory under-estimates the percolation threshold for diameter polydispersespherocylinders while it overestimates it for length polydis-perse ones. Moreover, Equation (12) constitutes a very goodestimation of the percolation threshold. However, we have toemphasize that this expression requires to be slightly rewrittenin this particular case of diameter polydispersity, since λ is a
This article is copyrighted as indicated in the article. Reuse of AIP content is subject to the terms at: http://scitation.aip.org/termsconditions. Downloaded to IP:
158.64.77.126 On: Fri, 31 Jul 2015 13:58:52
044901-6 Meyer, van der Schoot, and Schilling J. Chem. Phys. 143, 044901 (2015)
FIG. 4. Percolation threshold φc for diameter polydispersity as a function
of χ−1=
D2
�/L. Results are indicated from our simulations (green full
dots), Lee-Parsons theory (blue empty dots) as well as the second-virialapproximation (red empty dots) for L/ξ = 75 and various distributions P(D)indicated by different symbols. The scaling with χ−1 is not anymore univer-sal, higher order cumulants matter. However, Equation (12) provides a verygood approximation (solid line). See also the main text.
function ofD2� and therefore is not constant along the χ-axis.
Indeed, one needs to replace λ by χξ/L. Thus, the solid linecorresponds to the function
43 + 2 ξ
Lχ(χ + 8)−1
where ξ andL are fixed.
Finally, we focus on connectedness distance polydisper-sity, illustrated in Fig. 5 for the case of an aspect ratio of
FIG. 5. Percolation threshold φc for polydispersity in the connectedness
distance ξ, as a function of λ−1= 2D/⟨ξ⟩+
ξ2�
. Results from sim-
ulations (green full dots), Lee-Parsons theory (blue empty dots) as wellas second-virial approximation (red empty dots) for L/D = 15 and variousdistributions P(ξ), indicated by different symbols. A universal scaling withλ−1 is also obtained. Additionally, Equation (12) gives a almost quantitativeestimation of the percolation threshold (solid line). See also the main text.
15. As explained above, this does not lead to variability inthe interactions between the particles, only in the definitionof which particles are part of the same cluster. Nevertheless,it can be treated theoretically in the same way as the lengthand the diameter polydispersity due to the definition of theconnectedness potential u+. This explains why we find similarbehaviour as for length and diameter polydispersity. Indeed,there is quasi-universal scaling with respect to λ, even thoughthe aspect ratio is not all that large and one would expect higherorder moments in the distribution of connectedness rangesto show up. Indeed, our calculations show contributions upto the sixth moment,
ξ6�, for the cluster size. Apparently,
terms involving the first and second moments, ⟨ξ⟩ andξ2�,
predominate the percolation threshold. Again, prediction fromthe second-virial approximation disagrees significantly withthe simulations. The Lee-Parsons correction improves upon thequality of the prediction but still overestimates the threshold.Both theories improve for large values of λ, i.e., for globallythick connectedness shells for which the percolation thresholdoccurs at low volume fractions of particles. Our ansatz for theconnectedness direct correlation function has by constructionthe spatial structure of a second virial theory, even thoughthat our Lee-Parsons extension does have the thermodynamicsthat goes beyond it. Arguably, at higher densities, the actualstructure of the direct correlation function starts to deviatefrom this. Note also that the Percus-Yevick prediction for thepercolation threshold of monodisperse hard spheres is anywayin only qualitative agreement with simulations.42 Neverthe-less, Equation (12) provides again a satisfactory assessment ofthe percolation threshold in such kind of polydispersity. Thequality of the fit is quite surprising since we derived it fromequations of length polydispersity and extrapolated it to othertype of polydispersities. In any event, it seems to be robustenough to be used for practical purposes.
B. Cluster formation mechanisms
As we have seen, the sensitivity of the percolation thres-hold to the higher order moments of the distribution functiondepends on the type of polydispersity: length, diameter, orconnectedness range. It suggests that the mechanism by whichthe particles cluster differs between the different types of poly-dispersity. Indeed, hard particles of different size and/or shapehave for entropic reasons a tendency to phase separate, andeven if they do not actually phase separate this might give riseto fractionation of particles in the transient clusters that formin the mixtures.43,44
To investigate this, we compare in Fig. 6 the distributionof lengths and diameters within the largest cluster Pclus(x)with that in the entire system P(x) with x = (L,D), for lengthand width polydisperse rods, respectively. In both cases, thelarger particles are more abundant in the largest cluster than inthe whole system, explaining why relatively small amounts oflarge particles have a large effect on the percolation threshold.8
On the other hand, the effect weakens with increasing volumefraction of particles, at least for the length polydisperse ones.The proportion of short particles within large clusters is moreand more important as packing fraction increases, making thegap between Pclus(x) and P(x) smaller.
This article is copyrighted as indicated in the article. Reuse of AIP content is subject to the terms at: http://scitation.aip.org/termsconditions. Downloaded to IP:
158.64.77.126 On: Fri, 31 Jul 2015 13:58:52

044901-7 Meyer, van der Schoot, and Schilling J. Chem. Phys. 143, 044901 (2015)
FIG. 6. Difference between the length and diameter distribution Pcluster(x) ofthe largest cluster and the distribution P(x) of the whole system, normalizedby the value of the distribution at its peak, P(xp), as a function of the lengthx = L or width x =D scaled to the peak value, for two volume fractionsin both cases. The length (triangles) and diameter (circles) distributions
of the entire system are of the Weibull form P(x)∝ (xβ
)α−1e−(x/β)α with
α = 2.37 and β being such that the distribution peaks lie at L = 15 and D = 1.Larger and thicker particles cluster more easily. The difference betweenthe distributions within clusters and the global ones become smaller withincreasing volume fraction. Notice that length polydispersity has a muchstronger fractionation effect than diameter polydispersity.
FIG. 7. Radius of gyration of clusters as a function of their size on alogarithmic scale for hard rods. Compared are results for monodisperse andfor length and width polydisperse rods (see legend key). We set D = 1 andL = 15 in the monodisperse system. Length and width distributions are of
the Weibull form P(x)∝ (xβ
)α−1e−(x/β)α with α = 2 and β chosen such
that ⟨L⟩w = 15 andD2�= 1 in both other systems. φ ≃φc and ξ = 0.2 in
all three cases. Monodisperse systems as well as systems polydisperse indiameter superimpose and can be fitted by a power law exhibiting an exponentaround 0.35 (deviations from this scaling for very large clusters are finite-sizeeffects). This is not true for length polydispersity.
Another measure for the cluster structure is the fractaldimension d f of the critical cluster. We obtain this by measur-ing the radius of gyration Rf ∼ N
1/d f
cluster of the clusters as afunction of the number of particles in it, Ncluster, see Fig. 7.This quantity is sensitive to length polydispersity and less todiameter polydispersity. The latter and that for monodisperserods collapse exactly on the same curve that seems to exhibit
TABLE I. Percolation thresholds computed from MC simulations for sphe-rocylinders polydisperse in length, with D = 1 and ξ = 0.2.
Bidisperse distributionGaussian
distributionWeibull
distribution
L1 L2 p φc L0 σ φc β α φc
10 20 0 0.082 8 1 0.136 23.50 1.80 0.06510 20 0.1 0.083 8 2 0.133 21.39 1.98 0.07210 20 0.2 0.085 8 3 0.129 19.37 2.27 0.08010 20 0.5 0.092 10 2 0.121 19.14 2.55 0.08110 20 0.6 0.095 10 4 0.114 17.52 2.82 0.08810 20 0.8 0.105 10 6 0.106 16.06 4.10 0.09610 20 0.9 0.113 10 8 0.09710 20 1.0 0.123 10 10 0.0905 15 0.2 0.102 12 3 0.1085 15 0.3 0.104 12 4 0.1055 15 0.4 0.106 15 1 0.0985 15 0.5 0.110 15 2 0.0975 15 0.6 0.114 15 3 0.0965 15 0.7 0.120 15 4 0.0945 15 0.8 0.128 15 5 0.0925 15 0.9 0.141
TABLE II. Percolation thresholds computed from MC simulations for sphe-rocylinders polydisperse in diameter, with L = 15 and ξ = 0.2.
Bidisperse distributionGaussian
distribution Weibull distribution
D1 D2 p φc D0 σ φc β α φc
0.8 1.2 0 0.123 0.4 0.32 0.042 1.01 11.703 0.0950.8 1.2 0.1 0.120 0.6 0.32 0.060 1.04 5.53 0.0970.8 1.2 0.2 0.116 0.8 0.32 0.083 1.09 3.65 0.1040.8 1.2 0.3 0.111 1.0 0.32 0.107 1.17 2.82 0.1170.8 1.2 0.4 0.107 1.2 0.32 0.130 1.26 2.37 0.1320.8 1.2 0.5 0.1020 1.0 0.20 0.102 1.36 2.11 0.1490.8 1.2 0.6 0.097 1.0 0.45 0.1150.8 1.2 0.7 0.091 1.0 0.52 0.1220.8 1.2 0.8 0.085 1.0 0.58 0.1280.8 1.2 0.9 0.079
TABLE III. Percolation thresholds computed from MC simulations for sphe-rocylinders polydisperse in connectedness range, with L = 15 and D = 1.
Bidisperse distributionGaussian
distribution Weibull distribution
D1 D2 p φc ξ0 σ φc β α φc
0.1 0.3 0.1 0.077 0.1 0.03 0.155 0.201 11.703 0.1000.1 0.3 0.2 0.081 0.15 0.045 0.118 0.234 2.82 0.0940.1 0.3 0.3 0.085 0.2 0.06 0.097 0.292 1.93 0.0780.1 0.3 0.4 0.090 0.25 0.075 0.083 0.356 1.64 0.0670.1 0.3 0.5 0.095 0.3 0.09 0.0730.1 0.3 0.6 0.1020.1 0.3 0.7 0.1110.1 0.3 0.8 0.1210.1 0.3 0.9 0.136
a power law scaling and a fractal dimension of d f = 2.8. Notethat finite box-size effects cause deviations from pure power-law behaviour. For length polydisperse rods, we also do notfind power law scaling but the trend seems to conform to the
This article is copyrighted as indicated in the article. Reuse of AIP content is subject to the terms at: http://scitation.aip.org/termsconditions. Downloaded to IP:
158.64.77.126 On: Fri, 31 Jul 2015 13:58:52
044901-8 Meyer, van der Schoot, and Schilling J. Chem. Phys. 143, 044901 (2015)
same fractal dimension but with a larger prefactor. The fractaldimension of 2.8 is larger than the mean-field value of 2 weexpect to hold for very long rods45 and that we obtain from thesecond virial approximation, but close to the accepted value of2.5 in three dimensions for standard percolation.46 We expectthat because in our simulations the aspect ratio of the particlesis not very large that we find a deviation from the mean-fieldexponent.
We conclude that having varying lengths or diameterswithin a collection of hard rods does not fundamentally changethe way percolation is reached. Still, the volume fraction atthe percolation threshold is different from that for monodis-perse rods, even if the average diameters (or lengths) areequal.
V. CONCLUSIONS
In summary, we have presented a theoretical and com-puter simulation study on the effects of polydispersity on thegeometrical percolation in suspensions of hard spherocylin-ders. We compare results for bidisperse, Gaussian, and Weibulldistributions and show that the percolation threshold is quiteinsensitive to the precise distribution. In the case of length andconnectedness polydispersity, the thresholds superpose within
numerical error when scaled with the appropriate second ordercumulant of the size distribution. For diameter polydispersity,however, higher order moments seem to matter, as the super-position of the different distributions is not quite perfect. Toanalyse the simulation results, we also present a theoreticaltreatment of the problem within connectedness percolationtheory that we find to quantitatively predict the percolationthreshold for hard rods of aspect ratios above 20.
ACKNOWLEDGMENTS
This project was completed within the framework of theARPE program of the École Normale Supérieure de Cachan,France. Data from computer simulations presented in this pa-per were carried out using the HPC facilities of University ofLuxembourg.
APPENDIX: DEFINITION OF SIZE DISTRIBUTIONS
We report in Tables I–III the percolation thresholdscomputed from our simulations and plotted in this article.All values admit an error bar of ∆φ = 0.002. We recall thethree distributions used (the gaussian is effectively a truncatedgaussian distribution).
Bidisperse distribution P(x) = pδ(x − x1) + (1 − p)δ(x − x2)
Gaussian distribution P(x) = 1
σ
π2
(1 + erf
(x0
σ√
2
)) exp(− (x − x0)2
2σ2
)
Weibull distribution P(x) = α
β
(xβ
)α−1
exp(−(
xβ
)α) .
1T. Schilling, M. Miller, and P. van der Schoot, “Percolation in suspensionsof hard nanoparticles: From spheres to needles,” e-print arXiv:1505.07660(2015).
2S. Park, M. Vosguerichian, and Z. Bao, “A review of fabrication and appli-cations of carbon nanotube film-based flexible electronics,” Nanoscale 5(5),1727–1752 (2013).
3B. Li and W. H. Zhong, “Review on polymer/graphite nanoplatelet nanocom-posites,” J. Mater. Sci. 46(17), 5595–5614 (2011).
4M. Ghislandi, Nano-Scaled Carbon Fillers and their Functional PolymerComposites (Eindhoven University of Technology, Eindhoven, 2012).
5S. Torquato, Random Heterogeneous Materials: Microstructure and Macro-scopic Properties (Springer, 2002), Vol. 16.
6C. Koning, M. C. Hermant, and N. Grossiord, Polymer Carbon NanotubeComposites: The Polymer Latex Concept (CRC Press, 2012).
7E. Tkalya, M. Ghislandi, R. H. J. Otten, M. Lotya, A. Alekseev, P. vander Schoot, J. Coleman, G. de With, and C. Koning, “Experimental andtheoretical study of the influence of the state of dispersion of graphene on thepercolation threshold of conductive graphene/polystyrene nanocomposites,”ACS Appl. Mater. Interfaces 6(17), 15113–15121 (2014).
8R. H. J. Otten and P. van der Schoot, “Continuum percolation of polydispersenanofillers,” Phys. Rev. Lett. 103, 225704 (2009).
9R. H. J. Otten and P. van der Schoot, “Connectivity percolation of polydis-perse anisotropic nanofillers,” J. Chem. Phys. 134(9), 094902 (2011).
10B. Nigro, C. Grimaldi, P. Ryser, A. P. Chatterjee, and P. van der Schoot,“Quasiuniversal connectedness percolation of polydisperse rod systems,”Phys. Rev. Lett. 110, 015701 (2013); e-print arXiv:1301.6006v1.
11T. Schilling, S. Jungblut, and M. A. Miller, “Networks of nanorods,” inHandbook of Nanophysics (Taylor and Francis, 2009).
12A. V. Kyrylyuk and P. van der Schoot, “Continuum percolation of carbonnanotubes in polymeric and colloidal media,” Proc. Natl. Acad. Sci. U. S.A. 105(24), 8221–8226 (2008).
13Y. B. Yi and A. M. Sastry, “Analytical approximation of the percolationthreshold for overlapping ellipsoids of revolution,” Proc. R. Soc. London,Ser. A 460(2048), 2353–2380 (2004).
14X. Wang and A. Chatterjee, “Connectedness percolation in athermal mix-tures of flexible and rigid macromolecules: Analytic theory,” J. Chem. Phys.118, 10787–10793 (2003).
15K. Leung and D. Chandler, “Theory of percolation in fluids of long mole-cules,” J. Stat. Phys. 63(5-6), 837–856 (1991).
16A. P. Chatterjee, “Continuum percolation in macromolecular fluids,” J.Chem. Phys. 113, 9310 (2000).
17S. H. Munson-McGee, “Estimation of the critical concentration in an aniso-tropic percolation network,” Phys. Rev. B 43, 3331–3336 (1991).
18A. Celzard, E. McRae, C. Deleuze, M. Dufort, G. Furdin, and J. F. Marêché,“Critical concentration in percolating systems containing a high-aspect-ratiofiller,” Phys. Rev. B 53, 6209–6214 (1996).
19G. E. Pike and C. H. Seager, “Percolation and conductivity: A computerstudy. I,” Phys. Rev. B 10, 1421–1434 (1974).
20Z. Neda, R. Florian, and Y. Brechet, “Reconsideration of continuum percola-tion of isotropically oriented sticks in three dimensions,” Phys. Rev. E 59(3),3717 (1999).
This article is copyrighted as indicated in the article. Reuse of AIP content is subject to the terms at: http://scitation.aip.org/termsconditions. Downloaded to IP:
158.64.77.126 On: Fri, 31 Jul 2015 13:58:52
044901-9 Meyer, van der Schoot, and Schilling J. Chem. Phys. 143, 044901 (2015)
21M. Foygel, R. D. Morris, D. Anez, S. French, and V. L. Sobolev, “Theo-retical and computational studies of carbon nanotube composites andsuspensions: Electrical and thermal conductivity,” Phys. Rev. B 71, 104201(2005).
22R. M. Mutiso and K. I. Winey, “Electrical percolation in quasi-two-dimensional metal nanowire networks for transparent conductors,” Phys.Rev. E: Stat., Nonlinear, Soft Matter Phys. 88(3), 032134 (2013).
23A. P. Chatterjee, “Geometric percolation in polydisperse systems of finite-diameter rods: Effects due to particle clustering and inter-particle correla-tions,” J. Chem. Phys. 137, 134903 (2012).
24L. Berhan and A. M. Sastry, “Modeling percolation in high-aspect-ratio fibersystems. I. Soft-core versus hard core models,” Phys. Rev. E 75(4), 041120(2007).
25T. Schilling, S. Jungblut, and M. A. Miller, “Depletion-induced percolationin networks of nanorods,” Phys. Rev. Lett. 98(10), 108303 (2007).
26G. Ambrosetti, C. Grimaldi, I. Balberg, T. Maeder, A. Danani, and P.Ryser, “Solution of the tunneling-percolation problem in the nanocompositeregime,” Phys. Rev. B 81(15), 155434 (2010).
27B. Vigolo, C. Coulon, M. Maugey, C. Zakri, and P. Poulin, “An experi-mental approach to the percolation of sticky nanotubes,” Science 309, 920(2005).
28A. P. Chatterjee, “Percolation thresholds for rod-like particles: Polydisper-sity effects,” J. Phys.: Condens. Matter 20(25), 255250 (2008).
29R. M. Mutiso, M. C. Sherrott, J. Li, and K. I. Winey, “Simulations and gener-alized model of the effect of filler size dispersity on electrical percolation inrod networks,” Phys. Rev. B 86(21), 214306 (2012).
30R. L. C. Vink and T. Schilling, “Interfacial tension of the isotropic–nematicinterface in suspensions of soft spherocylinders,” Phys. Rev. E 71, 051716(2005).
31M. Mathew, T. Schilling, and M. Oettel, “Connectivity percolation in suspen-sions of hard platelets,” Phys. Rev. E 85(6), 061407 (2012).
32J. D. Parsons, “Nematic ordering in a system of rods,” Phys. Rev. A 19(3),1225–1230 (1979).
33S. D. Lee, “A numerical investigation of nematic ordering based on a simplehard rod model,” J. Chem. Phys. 87(8), 4972–4974 (1987).
34J. K. Percus and G. J. Yevick, “Analysis of classical statistical mechanics bymeans of collective coordinates,” Phys. Rev. 110(1), 1–13 (1958).
35E. Thiele, “Equation of state for hard spheres,” J. Chem. Phys. 39, 474–479(1963).
36G. Cinacchi and F. Schmid, “Density functional for anisotropic fluids,” J.Phys.: Condens. Matter 14(46), 12223 (2002).
37M. Franco-Melgar, A. J. Haslam, and G. Jackson, “A generalisation of theonsager trial-function approach: Describing nematic liquid crystals with analgebraic equation of state,” Mol. Phys. 106(5), 649–678 (2008).
38A. P. Chatterjee, “Percolation thresholds for polydisperse circular disks: Alattice-based exploration,” J. Chem. Phys. 141(3), 034903 (2014).
39L. Onsager, “The effects of shape on the interaction of colloidal particles,”Ann. N. Y. Acad. Sci. 51(4), 627–659 (1949).
40S. Wang, Z. Liang, B. Wang, and C. Zhang, “Statistical characterizationof single-wall carbon nanotube length distribution,” Nanotechnology 17(3),634 (2006).
41P. J. Hine, H. R. Lusti, and A. A. Gusev, “Numerical simulation of the effectsof volume fraction, aspect ratio and fibre length distribution on the elastic andthermoelastic properties of short fibre composites,” Compos. Sci. Technol.62, 1445–1453 (2002).
42T. DeSimone, S. Demoulini, and R. M. Stratt, “A theory of percolation inliquids,” J. Chem. Phys. 85, 391 (1986).
43P. van der Schoot, “Structure factor of a semidilute solution of polydisperserodlike macromolecules,” Macromolecules 25(11), 2923–2927 (1992).
44R. van Roij and B. Mulder, “Demixing versus ordering in hard-rod mixtures,”Phys. Rev. E 54(6), 6430 (1996).
45R. H. J. Otten and P. van der Schoot, “Connectedness percolation of elon-gated hard particles in an external field,” Phys. Rev. Lett. 108(8), 088301(2012).
46D. Stauffer and A. Aharony, Introduction to Percolation Theory (CRC press,1994).
This article is copyrighted as indicated in the article. Reuse of AIP content is subject to the terms at: http://scitation.aip.org/termsconditions. Downloaded to IP:
158.64.77.126 On: Fri, 31 Jul 2015 13:58:52