perceptions of crime, engagement with the police, authorities dealing with anti-social behaviour
TRANSCRIPT

Perceptions of crime, engagement with the police, authorities dealing with anti-social behaviour and Community Payback: Findings from the 2010/11 British Crime Survey Supplementary Volume 1 to Crime in England and Wales 2010/11
Debbie Moon (Ed.), John Flatley (Ed.), Jenny Parfrement-Hopkins, Philip Hall, Jacqueline Hoare, Ivy Lau and Jenny Innes
November 2011 18/11
Home Office Statistical Bulletin
Statistical Bulletins are prepared by
staff in Home Office Statistics under
the National Statistics Code of
Practice and can be downloaded
from both the UK Statistics Authority
website and the Home Office
website:
http://www.statistics.gov.uk
http://www.homeoffice.gov.uk/science-
research
© Crown Copyright 2011
You may re-use this information (not
including logos) free of charge in
any format or medium, under the
terms of the Open Government
Licence. To view this licence, visit
http://www.nationalarchives.gov.uk/doc/o
pen-government-licence/
or write to the Information Policy
Team, The National Archives, Kew,
London, TW9 4DU or e-mail:
ISSN 1759-7005 ISBN 978 1 84987 598 1

2
Perceptions of crime, engagement with the police, authorities dealing with anti-social behaviour and Community Payback: Findings from the 2010/11 British Crime Survey Supplementary Volume 1 to Crime in England and Wales 2010/11
Debbie Moon (Ed.), John Flatley (Ed.), Jenny Parfrement-Hopkins, Philip Hall, Jacqueline Hoare, Ivy Lau and Jenny Innes
ISSN 1759-7005
ISBN 978 1 84987 598 1
November 2011
3

Acknowledgements This publication and the accompanying web tables have been prepared by staff in the Crime Statistics Programme, which is part of the Home Office Statistics Unit of Home Office Science. The editors and authors are grateful for the support received from: Maya Bhudia, Andrew Britton, Sam Giddings, Eddie Hallett, Jabeen Paracha, Tim Pateman, Paul Robb and Paul Taylor. Special thanks are due to Irene Ogunbor who coordinated the production of the volume.
The editors also thank David Blunt, the Home Office Chief Statistician and Head of Profession for Statistics for his support and guidance during the preparation of this report. Thanks also to colleagues who commented on a draft report during quality assurance of this bulletin and to colleagues in the Communications Development Section who assisted in preparing the report.
We would also like to thank staff involved in the work on the British Crime Survey (BCS) at TNS-BMRB, the interviewers working on the BCS and the members of the public who kindly agreed to take part in the survey.
Further information
Copies of other Home Office publications are available from the Home Office Science Internet pages: http://www.homeoffice.gov.uk/science-research/research-statistics/
The dates of forthcoming publications are pre-announced and can be found via the UK National Statistics Publication Hub: http://www.statistics.gov.uk/hub/index.html
For further information about the British Crime Survey and police recorded crime statistics, please email [email protected] or write to: Home Office Statistics, 5th Floor, Peel Building, 2 Marsham Street, London, SW1P 4DF Home Office Responsible Statistician David Blunt, Chief Statistician and Head of Profession for Statistics Contact via [email protected]
This publication should be read in conjunction with the User Guide to Home Office Crime Statistics, a useful reference guide with explanatory notes regarding the issues and classifications which are key to the production and presentation of the crime statistics:http://www.homeoffice.gov.uk/publications/science-research-statistics/research-statistics/crime-research/user-guide-crime-statistics/
This statistical bulletin is a National Statistics output produced to the highest professional standards and free from political interference. It has been produced by statisticians working in the Home Office Statistics Unit in accordance with the Home Office’s Statement of Compliance with the Code of Practice for Official Statistics which covers our policy on revisions and other matters. The governance arrangements in the Home Office for statistics were strengthened on 1 April 2008 to place the statistical teams under the direct line management of a Chief Statistician, who reports to the National Statistician with respect to all professional statistical matters. Future responsibility for the compilation and publication of these statistics will transfer to the Office for National Statistics in April 2012.
4
Contents
Page
Introduction ....................................................................................................................................... 7
Lists of figures ...................................................................................................................................... 9
Lists of tables ..................................................................................................................................... 10
Chapter 1 Policing and community engagement ..................................................................... 12
Jenny Parfrement-Hopkins
1.1 Summary ................................................................................................................ 12
1.2 Introduction ............................................................................................................ 13
1.3 Visibility of the local police ..................................................................................... 13
1.4 Contact with the police ........................................................................................... 17
Chapter 2 Public confidence in the authorities tackling anti-social behaviour and awareness of Community Payback.......................................................................... 38
Ivy Lau and Jacqueline Hoare
2.1 Summary ................................................................................................................ 38
2.2 Introduction ............................................................................................................ 39
2.3 Public confidence in the authorities tackling anti-social behaviour ........................ 39
2.4 Awareness and experience of seeing Community Payback ................................. 44
Chapter 3 Understanding perceptions of crime ....................................................................... 53
Philip Hall and Jennifer Innes
3.1 Summary ................................................................................................................ 53
3.2 Introduction ............................................................................................................ 54
3.3 Perceptions of crime .............................................................................................. 54
3.4 Sources of information ........................................................................................... 56
3.5 Newspapers and television .................................................................................... 57
3.6 Official statistics ..................................................................................................... 59
3.7 Crime maps ............................................................................................................ 61
3.8 Experience of victimisation .................................................................................... 63
5

Supplementary Volume 1 to Crime England and Wales 2010/11
3.9 Local environment ................................................................................................. 64
3.10 Conclusion ........................................................................................................... 66
Bibliography ..................................................................................................................................... 73
6

Introduction
This bulletin is the first in a series of supplementary volumes that accompany the main annual Home
Office Statistical Bulletin, ‘Crime in England and Wales 2010/11’ (Chaplin et al., 2011). These
supplementary volumes report on additional analysis not included in the main annual publication.
Figures included in this bulletin are from the British Crime Survey (BCS), a large, nationally
representative, face-to-face victimisation survey in which people resident in households in England
and Wales are asked about their experiences of crime in the 12 months prior to interview.1
Since 2001/02 the BCS has run continuously with interviewing being carried out throughout the year.
Until recently the BCS did not cover crimes against those aged under 16, but since January 2009
interviews have been carried out with children aged 10 to 15. BCS respondents are also asked about
their attitudes towards different crime-related issues such as the police and criminal justice system,
and about their perceptions of crime and anti-social behaviour. BCS figures in the main body of this
report are limited to adults aged over 16 as in previous years, but experimental statistics for children
are shown separately in Chapter 1.
This bulletin presents findings from additional analyses based on the 2010/11 BCS on people’s
contact and engagement with the police, their views of how the authorities in the local area are dealing
with anti-social behaviour, their awareness and perceptions of Community Payback and their
perceptions of crime.
1 For more information about the BCS see the User Guide to Home Office Crime Statistics.
7
Conventions used in figures and tables
Table abbreviations
‘0’ indicates no response in that particular category or less than 0.5% (this does not apply when percentages are presented to one decimal point).
‘n/a’ indicates that the BCS question was not applicable or not asked in that particular year.
‘-’ indicates that for recorded crime percentage changes are not reported because the base number of offences is less than 50, for the BCS indicates that data are not reported because the unweighted base is less than 50.
‘..’ indicates for police recorded crime that data are not available.
‘**’ indicates for BCS that the change is statistically significant at the five per cent level. Where an apparent change over time is not statistically significant this is noted in the text.
Unweighted base
All BCS percentages and rates presented in the tables are based on data weighted to compensate for differential non response. Tables show the unweighted base which represents the number of people/households interviewed in the specified group.
Percentages
Row or column percentages may not add to 100% due to rounding.
Most BCS tables present cell percentages where the figures refer to the percentage of people/households who have the attribute being discussed and the complementary percentage, to add to 100%, is not shown.
A percentage may be quoted in the text for a single category that is identifiable in the tables only by summing two or more component percentages. In order to avoid rounding errors, the percentage has been recalculated for the single category and therefore may differ by one percentage point from the sum of the percentages derived from the tables.
Year-labels on BCS figures and tables
Prior to 2001/02, BCS respondents were asked about their experience of crime in the previous calendar year, so year-labels identify the year in which the crime took place. Following the change to continuous interviewing, respondents’ experience of crime relates to the 12 full months prior to interview (i.e. a moving reference period). Year-labels from 2001/02 onwards identify the BCS year of interview. Other questions on the BCS (e.g. attitudes to policing, confidence in the criminal justice system) ask the respondent their current views or attitudes, and thus the data are referenced as the year in which the respondent was interviewed (e.g. 1996, 2008/09).
‘No answers’ (missing values)
All BCS analysis excludes don’t know/refusals unless otherwise specified.
Numbers of BCS incidents
Estimates are rounded to the nearest 10,000.
8

List of figures Chapter 1 Policing and community engagement ..................................................................... 12
Figure 1.1 How often adult respondents saw police officers or PCSOs on foot patrol in the local area, 2006/07 to 2010/11 BCS
Figure 1.2 Visibility of the police and confidence in the police and local council, 2006/07 to 2010/11 BCS
Figure 1.3 Trends in respondent-initiated contact with the police, 1993 to 2010/11 BCS
Figure 1.4 Trends in police-initiated contact: respondent in a vehicle stopped by the police, 1991 to 2010/11 BCS
Figure 1.5 Trends in police-initiated contact: respondent on foot stopped by the police, 1991 to 2010/11 BCS
Figure 1.6 Trends in police-initiated contact: other reasons, 1993 to 2010/11 BCS
Chapter 3 Understanding perceptions of crime ....................................................................... 53
Figure 3.1 Perception of crime rate in the local area by decile within the Crime domain of the English Indices of Deprivation, 2010/11 BCS
Figure 3.2 Television news channels and perceptions of crime, 2009/10 BCS
Figure 3.3 Amount of television watched and perceptions of crime, 2009/10 BCS
Figure 3.4 The relationship between the use of crime maps, perceptions and objective measures of crime in the local area, 2010/11 BCS
Figure 3.5 Perceptions of crime in the local area by level of physical disorder in respondent’s immediate area by Crime domain of the English Indices of Deprivation, 2010/11 BCS
Figure 3.6 Perceptions of crime by problems in the local area, 2010/11 BCS
Figure 3.7 Perceptions of crime in the local area by number of problems in the local area by Crime domain of the English Indices of Deprivation, 2010/11 BCS
9
List of tables Chapter 1 Policing and community engagement ..................................................................... 12
Table 1a Perceived change in visibility of the local police on foot patrol, 2009/10 and 2010/11 BCS
Table 1b Awareness of neighbourhood policing team, 2009/10 and 2010/11 BCS
Table 1c Whether the police searched respondent or anyone with respondent, 2009/10 and 2010/11 BCS
Table 1.01 Visibility of local police on foot patrol, 2006/07 to 2010/11 BCS
Table 1.02 Knowledge about local police, 2009/10 and 2010/11 BCS
Table 1.03 Contact with the police about local issues, 2009/10 and 2010/11 BCS
Table 1.04 Other contact with the police about local issues, 2009/10 and 2010/11 BCS
Table 1.05 Public-initiated contact with the police, 2009/10 and 2010/11 BCS
Table 1.06 Police-initiated contact: respondent in vehicle stopped by police, 2009/10 and 2010/11 BCS
Table 1.07 Police-initiated contact: respondent on foot stopped by police, 2009/10 and 2010/11 BCS
Table 1.08 Police-initiated contact: other, 2009/10 and 2010/11 BCS
Table 1.09 Awareness of local police on foot patrol amongst children aged 10 to 15, 2009/10 and 2010/11 BCS
Table 1.10 Awareness of local police in/around school premises amongst children aged 10 to 15, 2009/10 and 2010/11 BCS
Table 1.11 Familiarity of local police amongst children aged 10 to 15, 2009/10 and 2010/11 BCS
Table 1.12 Contact with the police amongst children aged 10 to 15, 2009/10 and 2010/11 BCS
Table 1.13 Satisfaction with police contact amongst children aged 10 to 15, 2009/10 and 2010/11 BCS
Chapter 2 Public confidence in the authorities tackling anti-social behaviour and awareness of Community Payback.......................................................................... 38
Table 2a Number of the five elements of anti-social behaviour perceived as a problem in the local area
Table 2b Association between being informed about tackling anti-social behaviour in local area and the authorities’ effectiveness at dealing with anti-social behaviour
Table 2.01 Views of respondents who perceived a problem with anti-social behaviour in their local area about tackling anti-social behaviour in the local area by personal characteristics
10
Supplementary Volume 1 to Crime England and Wales 2010/11
Table 2.02 Views of respondents who perceived a problem with anti-social behaviour in their local area about tackling anti-social behaviour in the local area by household and area characteristics
Table 2.03 Views of respondents who perceived a problem with anti-social behaviour in their local area about tackling anti-social behaviour in the local area
Table 2.04 Views of respondents who perceived a problem with anti-social behaviour in their local area about tackling anti-social behaviour in the local area by crime and police-related perceptions
Table 2.05 Perceptions about Community Payback by personal characteristics
Table 2.06 Perceptions about Community Payback by household and area characteristics
Table 2.07 Proportion of adults who felt that Community Payback was effective as a punishment
Table 2.08 Association between awareness of Community Payback and perceptions of effectiveness of Community Payback and the criminal justice system
Chapter 3 Understanding perceptions of crime ....................................................................... 53
Table 3a Trust in official statistics by attention paid to them, 2010/11 BCS
Table 3b Trust in official statistics by perceptions of crime, 2010/11 BCS
Table 3c Perceptions of the local crime rate by experience of victimisation, 2010/11 BCS
Table 3.01 Sources of perceptions of changes in crime in country as a whole over the past few years
Table 3.02 Sources of perceptions of changes in crime in local area over the past few years
Table 3.03 Newspaper readership and perceptions of crime in country as a whole
Table 3.04 Television news channel watched most often and perceptions of crime
Table 3.05 Amount of television watched and perceptions of crime
Table 3.06 Reasons for trust or distrust in official crime statistics
Table 3.07 Attitudes towards presentation of crime statistics by politicians, the Home Office, the media and the police
11

1 Policing and community engagement
Jenny Parfrement-Hopkins
1.1 SUMMARY
The BCS collects a wide range of information about the police and their engagement with the local community, including questions relating to people’s general awareness of the police in their local area, contact with the police about local issues and contact for other reasons (for example, to report a crime).
The 2010/11 BCS showed that just over half of people (55%) said that they had seen a police officer or Police Community Support Officer (PCSO) on foot patrol at least once a month and about two-fifths (39%) had seen an officer on foot patrol at least once a week. A quarter (25%) said that they never saw police officers on foot patrol in the local area. These figures are similar to those from the 2009/10 BCS, but follow more substantial year-on-year increases in awareness since 2006/07, when the question was introduced.
Specific questions about people’s awareness of local neighbourhood policing teams showed that awareness had increased from 39 per cent in 2009/10 to 44 per cent in 2010/11.
The 2010/11 BCS showed that about a third (32%) of adults had seen, read or heard details about their local police and over half of people (57%) said they knew how to contact the police about policing, crime or anti-social behaviour (up from 54% in 2009/10). Ten per cent had contacted the police about local issues.
Since 1991, the BCS has asked about any other contact people may have had with the police (other than about local policing priorities or issues), including contact initiated by themselves (for example, to report a crime) and contact initiated by the police (for example, if they were stopped by the police in a vehicle or on foot).
Around a quarter of people (23%) had made contact with the police (other than about local issues) in 2010/11. This was most commonly to report a personal or household crime (37%) or a crime of which someone else was a victim (15%), or to report any other disturbance (13%).
The numbers of people contacting the police for reasons other than to talk about local issues decreased from 43 per cent in 1993 to 23 per cent in 2010/11, with a flattening out in levels of contact in more recent years. It is not possible to be certain of the reasons for this decrease, but it is likely to be a result of a number of factors including police deployment, policing methods and falls in actual levels of crime.
The 2010/11 BCS showed that around one in ten people (9%) had been in a car or motorcycle which was approached or stopped by the police in the last 12 months (most commonly so that the police could carry out routine checks on the vehicle or to check ownership). Of those who had been stopped in a vehicle in 2010/11, eight per cent had also been searched or the vehicle was searched (this represents less than 1% of the general population).
A much smaller proportion of people had been stopped and asked questions by the police when they were on foot in the last 12 months (3% in 2010/11). Of those who had been stopped on foot in 2010/11, 30 per cent had also been searched (again, this represents less than 1% of the general population).
12
Supplementary Volume 1 to Crime in England and Wales 2010/11
1.2 INTRODUCTION
The British Crime Survey (BCS) collects a variety of information about different aspects of policing and about community engagement with the police, such as questions relating to people’s contact with the police about local issues. Previous findings for these questions were reported in Scribbins et al. (2010); this chapter largely repeats these analyses and provides updated figures from the 2010/11 survey.
1 Questions about the visibility of the local police have been included on the BCS since
2006/07 and trends since then are shown for this question. Longer-term trends are shown for questions that have been included in the BCS since 1991, including those relating to people’s experiences of contact with the police about other issues; for example, their experiences of contacting the police about crime, of being stopped by the police in a vehicle or on foot and contact the police had initiated with them for any other reason.
The chapter concentrates on findings for adult respondents (aged 16 and over) to the BCS. Since January 2009 interviews have been carried out with children aged 10 to 15. As for adults, the main focus of the child interview is their experience of victimisation in the previous 12 months, but additional modules also ask about children’s experiences of crime and policing-related issues. First results for questions about children’s awareness and contact with the police were reported in Scribbins et al. (2011); updated findings for 2010/11 are included in Box 1.5 of this chapter.
1.3 VISIBILITY OF THE LOCAL POLICE
In recent years the development of the neighbourhood policing model has focussed local policing activities on:
the presence of visible, accessible and locally known police officers and Police Community Support Officers (PCSOs);
community engagement in identifying priorities; and
targeted policing and problem solving to tackle public concerns in the neighbourhood.
Questions relating to people’s experiences of seeing the police in their local area have been included on the BCS since 2006/07. The following sections discuss people’s general awareness of their local police as well as exploring some of the key elements of the neighbourhood policing model in more detail.
Seeing officers on foot patrol
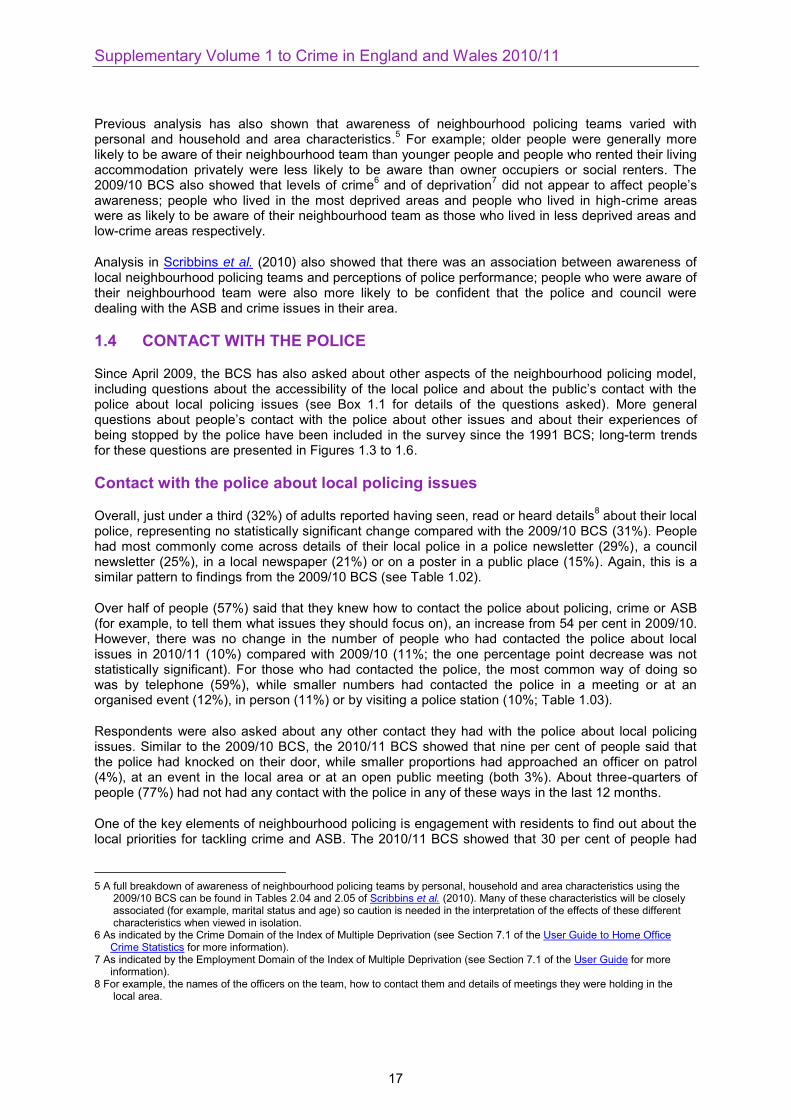
The 2010/11 BCS showed that just over half of people (55%) said they had seen police officers or PCSOs on foot patrol in their local area once a month or more often. This breaks down as follows:
39 per cent of people had seen an officer on foot patrol at least once a week (25% had seen an officer about once a week and 14% at least once a day); and
16 per cent of people had seen an officer on foot patrol about once a month (for full breakdowns see Table 1.01).
Around one in five people (19%) had seen an officer on foot patrol less than once a month and a quarter (25%) said that they had never seen officers on foot patrol in their local area.
1 A history and trends for questions relating to perceptions of police performance were also included in Scribbins et al. (2010)
but are not repeated here.
13

Policing and community engagement
The proportion of people who said they never saw officers on foot patrol fell by two percentage points (from 27% to 25%) between the 2009/10 and 2010/11 BCS. There were small corresponding increases in the proportions of people saying they had seen an officer on foot patrol in the local area more than once a day (4%, up from 3% in 2009/10) and for those saying that they had seen an officer about once a month (16%, up from 15% in 2009/10).
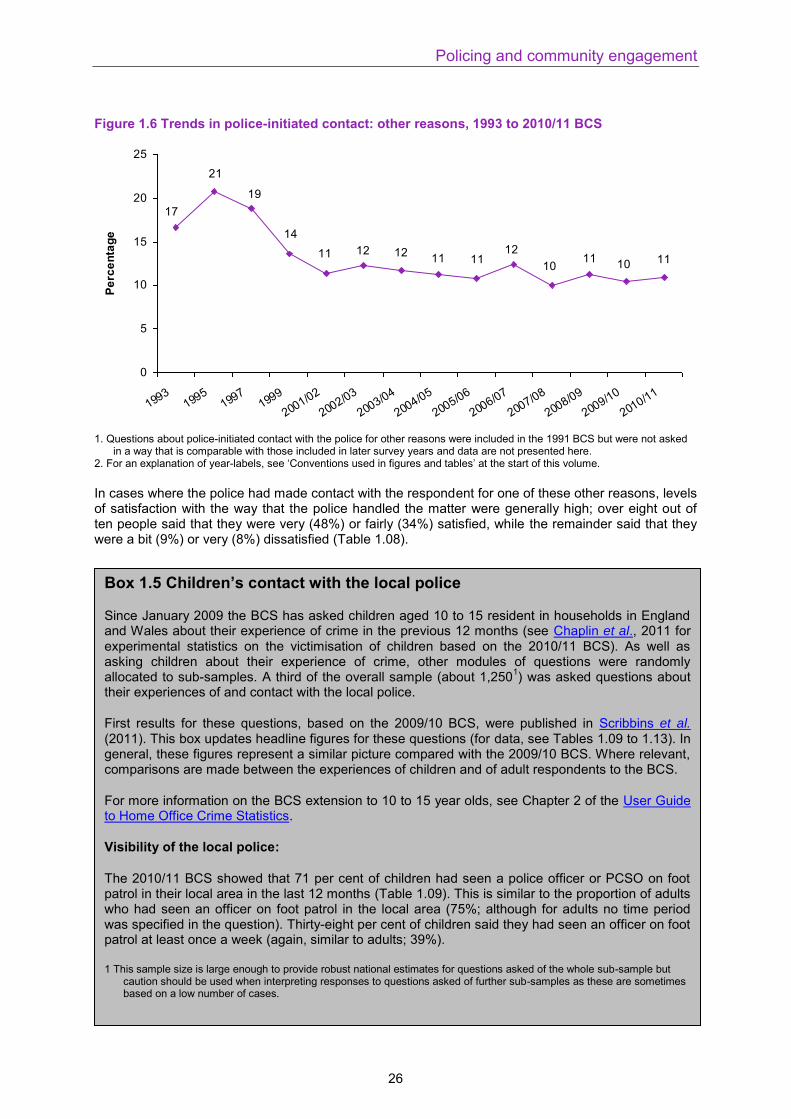
Trends since 2006/07 (when the question was introduced) show an increase in the proportions of people who saw officers on foot patrol at least once a month (from 38% to 55%; see Figure 1.1 below).There was no change in visibility between the 2009/10 and 2010/11 BCS (the one percentage point increase was not statistically significant).
Figure 1.1 How often adult respondents saw police officers or PCSOs on foot patrol in the local area, 2006/07 to 2010/11 BCS
38
4548
5455
22 21 2119 19
40
3431
2725
0
10
20
30
40
50
60
2006/07 2007/08 2008/09 2009/10 2010/11
Perc
enta
ge
At least once a month Less than once a month Never
There was a 15 percentage point decrease in the proportion of people who said they had never seen an officer on foot patrol in their local area (from 40% in the 2006/07 BCS to 25% in 2010/11) and a small decrease in the number of people who had seen officers on foot patrol in the local area less than once a month (22% in 2006/07 compared with 19% in 2010/11).
As noted above, there was a corresponding increase in the proportion of people who had seen an officer at least once a month. Within this combined category, the largest increase between the 2006/07 and 2010/11 BCS was for the proportion of people who had seen an officer about once a week (from 18% in 2006/07 to 25% in 2010/11; see Table 1.01).
Previous analysis has shown that how often respondents had seen the local police varied with personal and household and area characteristics.
2 Scribbins et al. (2010) showed that, in particular,
there was substantial variation by the type of area a person lived in. For example, people living in urban areas were much more likely to have seen an officer on foot patrol at least once a month than those living in rural areas. There were more subtle differences in how often a person saw officers on foot patrol by personal and household characteristics.
2 A full breakdown of how often people saw officers on foot patrol by personal, household and area characteristics using the
2009/10 BCS can be found in Tables 2.02 and 2.03 of Scribbins et al. (2010). Many of these characteristics will be closely associated (for example, marital status and age) so caution is needed in the interpretation of the effects of these different characteristics when viewed in isolation.
14
Supplementary Volume 1 to Crime in England and Wales 2010/11
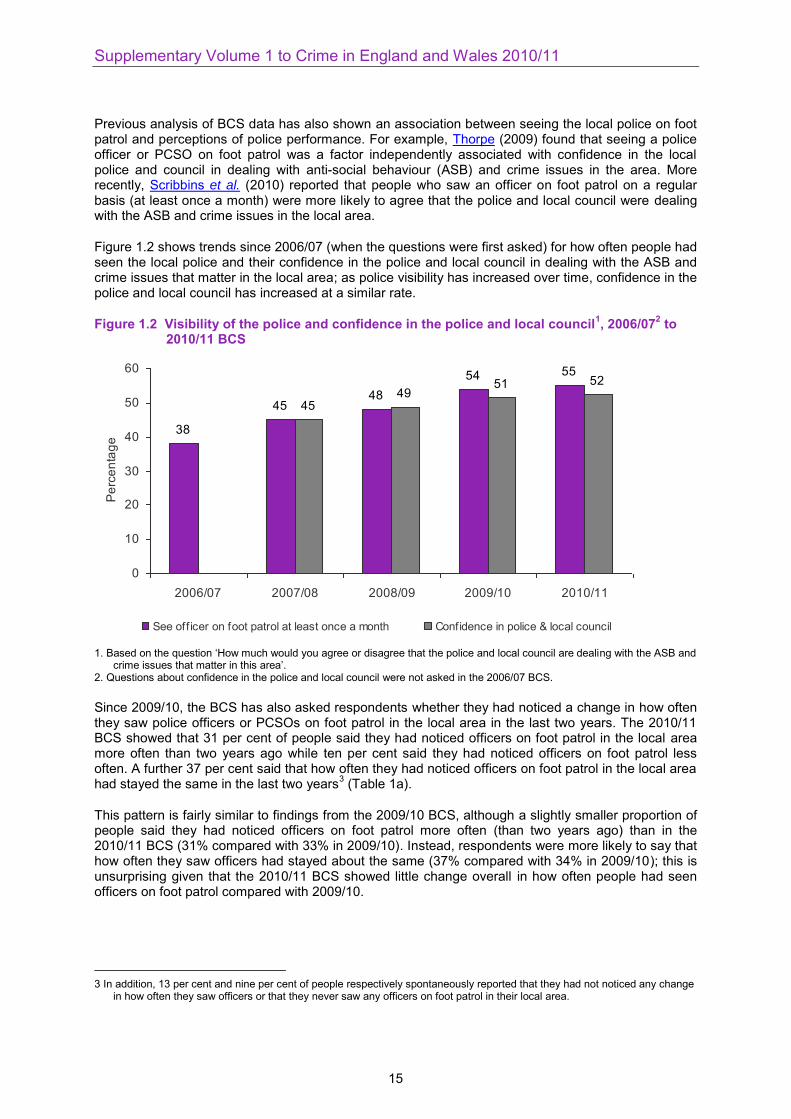
Previous analysis of BCS data has also shown an association between seeing the local police on foot patrol and perceptions of police performance. For example, Thorpe (2009) found that seeing a police officer or PCSO on foot patrol was a factor independently associated with confidence in the local police and council in dealing with anti-social behaviour (ASB) and crime issues in the area. More recently, Scribbins et al. (2010) reported that people who saw an officer on foot patrol on a regular basis (at least once a month) were more likely to agree that the police and local council were dealing with the ASB and crime issues in the local area.
Figure 1.2 shows trends since 2006/07 (when the questions were first asked) for how often people had seen the local police and their confidence in the police and local council in dealing with the ASB and crime issues that matter in the local area; as police visibility has increased over time, confidence in the police and local council has increased at a similar rate.
Figure 1.2 Visibility of the police and confidence in the police and local council1, 2006/072 to 2010/11 BCS
38
4548
54 55
4549
51 52
0
10
20
30
40
50
60
2006/07 2007/08 2008/09 2009/10 2010/11
Pe
rce
nta
ge
See off icer on foot patrol at least once a month Confidence in police & local council
1. Based on the question ‘How much would you agree or disagree that the police and local council are dealing with the ASB and crime issues that matter in this area’.
2. Questions about confidence in the police and local council were not asked in the 2006/07 BCS.
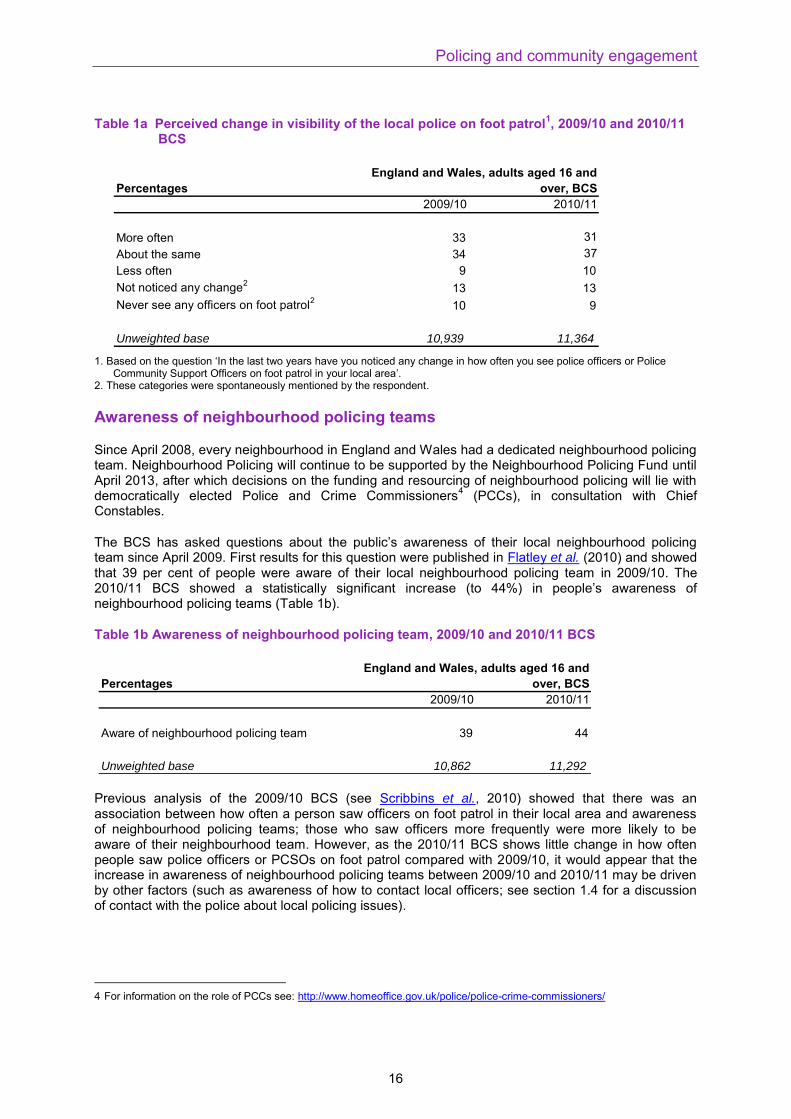
Since 2009/10, the BCS has also asked respondents whether they had noticed a change in how often they saw police officers or PCSOs on foot patrol in the local area in the last two years. The 2010/11 BCS showed that 31 per cent of people said they had noticed officers on foot patrol in the local area more often than two years ago while ten per cent said they had noticed officers on foot patrol less often. A further 37 per cent said that how often they had noticed officers on foot patrol in the local area had stayed the same in the last two years
3 (Table 1a).
This pattern is fairly similar to findings from the 2009/10 BCS, although a slightly smaller proportion of people said they had noticed officers on foot patrol more often (than two years ago) than in the 2010/11 BCS (31% compared with 33% in 2009/10). Instead, respondents were more likely to say that how often they saw officers had stayed about the same (37% compared with 34% in 2009/10); this is unsurprising given that the 2010/11 BCS showed little change overall in how often people had seen officers on foot patrol compared with 2009/10.
3 In addition, 13 per cent and nine per cent of people respectively spontaneously reported that they had not noticed any change
in how often they saw officers or that they never saw any officers on foot patrol in their local area.
15
Policing and community engagement
Table 1a Perceived change in visibility of the local police on foot patrol1, 2009/10 and 2010/11 BCS
Percentages2009/10 2010/11
More often 33 31
About the same 34 37
Less often 9 10
Not noticed any change2
13 13
Never see any officers on foot patrol2
10 9
Unweighted base 10,939 11,364
England and Wales, adults aged 16 and over, BCS
1. Based on the question ‘In the last two years have you noticed any change in how often you see police officers or Police Community Support Officers on foot patrol in your local area’.
2. These categories were spontaneously mentioned by the respondent.
Awareness of neighbourhood policing teams
Since April 2008, every neighbourhood in England and Wales had a dedicated neighbourhood policing team. Neighbourhood Policing will continue to be supported by the Neighbourhood Policing Fund until April 2013, after which decisions on the funding and resourcing of neighbourhood policing will lie with democratically elected Police and Crime Commissioners
4 (PCCs), in consultation with Chief
Constables.
The BCS has asked questions about the public’s awareness of their local neighbourhood policing team since April 2009. First results for this question were published in Flatley et al. (2010) and showed that 39 per cent of people were aware of their local neighbourhood policing team in 2009/10. The 2010/11 BCS showed a statistically significant increase (to 44%) in people’s awareness of neighbourhood policing teams (Table 1b).
Table 1b Awareness of neighbourhood policing team, 2009/10 and 2010/11 BCS
Percentages2009/10 2010/11
Aware of neighbourhood policing team 39 44
Unweighted base 10,862 11,292
England and Wales, adults aged 16 and over, BCS
Previous analysis of the 2009/10 BCS (see Scribbins et al., 2010) showed that there was an association between how often a person saw officers on foot patrol in their local area and awareness of neighbourhood policing teams; those who saw officers more frequently were more likely to be aware of their neighbourhood team. However, as the 2010/11 BCS shows little change in how often people saw police officers or PCSOs on foot patrol compared with 2009/10, it would appear that the increase in awareness of neighbourhood policing teams between 2009/10 and 2010/11 may be driven by other factors (such as awareness of how to contact local officers; see section 1.4 for a discussion of contact with the police about local policing issues).
4 For information on the role of PCCs see: http://www.homeoffice.gov.uk/police/police-crime-commissioners/
16
Supplementary Volume 1 to Crime in England and Wales 2010/11
Previous analysis has also shown that awareness of neighbourhood policing teams varied with personal and household and area characteristics.
5 For example; older people were generally more
likely to be aware of their neighbourhood team than younger people and people who rented their living accommodation privately were less likely to be aware than owner occupiers or social renters. The 2009/10 BCS also showed that levels of crime
6 and of deprivation
7 did not appear to affect people’s
awareness; people who lived in the most deprived areas and people who lived in high-crime areas were as likely to be aware of their neighbourhood team as those who lived in less deprived areas and low-crime areas respectively.
Analysis in Scribbins et al. (2010) also showed that there was an association between awareness of local neighbourhood policing teams and perceptions of police performance; people who were aware of their neighbourhood team were also more likely to be confident that the police and council were dealing with the ASB and crime issues in their area.
1.4 CONTACT WITH THE POLICE
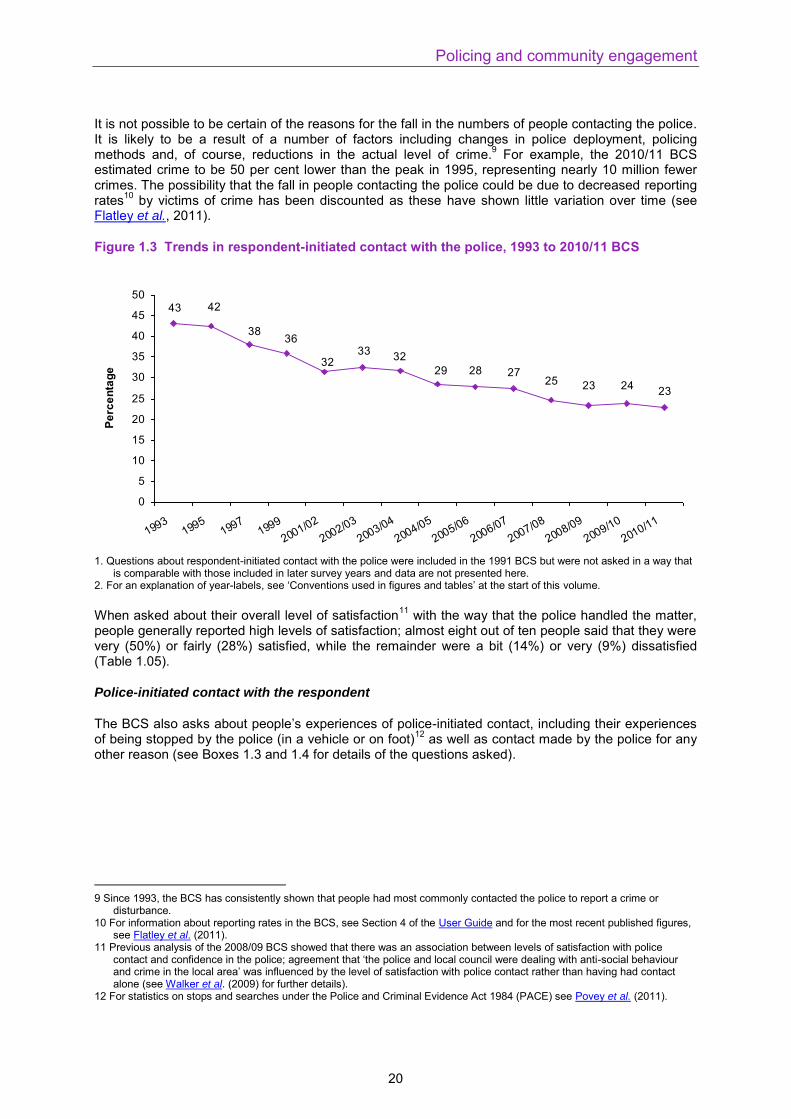
Since April 2009, the BCS has also asked about other aspects of the neighbourhood policing model, including questions about the accessibility of the local police and about the public’s contact with the police about local policing issues (see Box 1.1 for details of the questions asked). More general questions about people’s contact with the police about other issues and about their experiences of being stopped by the police have been included in the survey since the 1991 BCS; long-term trends for these questions are presented in Figures 1.3 to 1.6.
Contact with the police about local policing issues
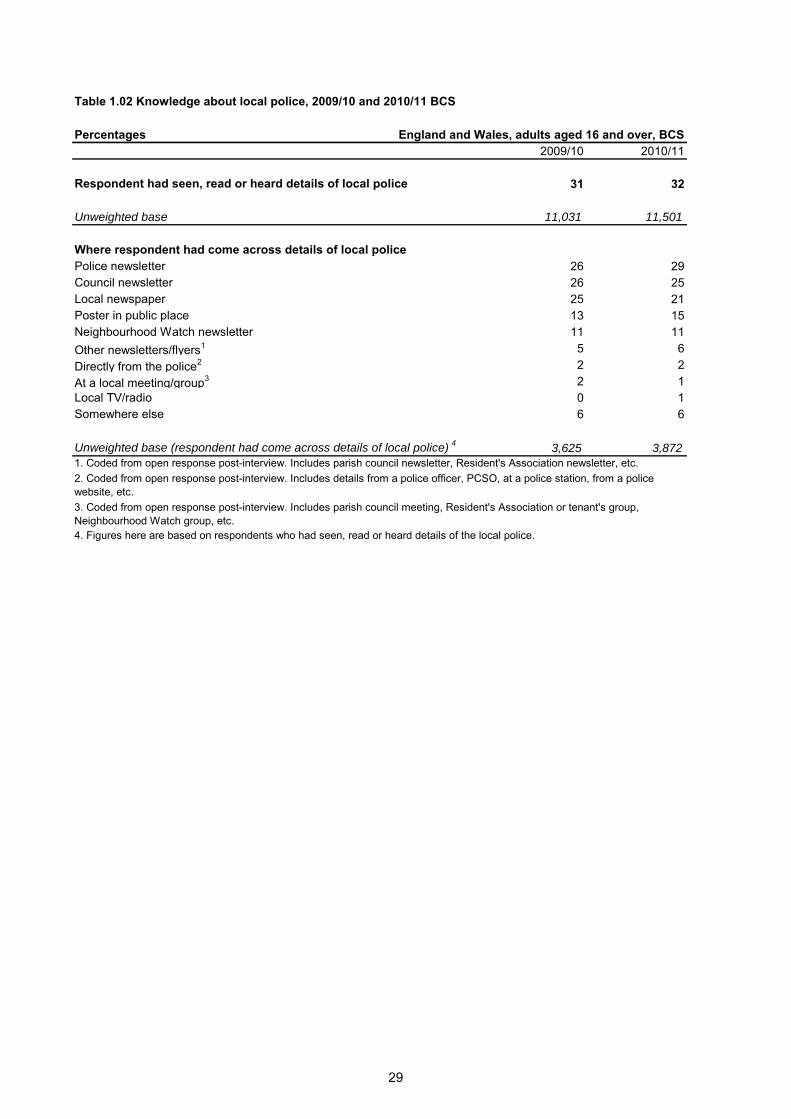
Overall, just under a third (32%) of adults reported having seen, read or heard details8 about their local
police, representing no statistically significant change compared with the 2009/10 BCS (31%). People had most commonly come across details of their local police in a police newsletter (29%), a council newsletter (25%), in a local newspaper (21%) or on a poster in a public place (15%). Again, this is a similar pattern to findings from the 2009/10 BCS (see Table 1.02).
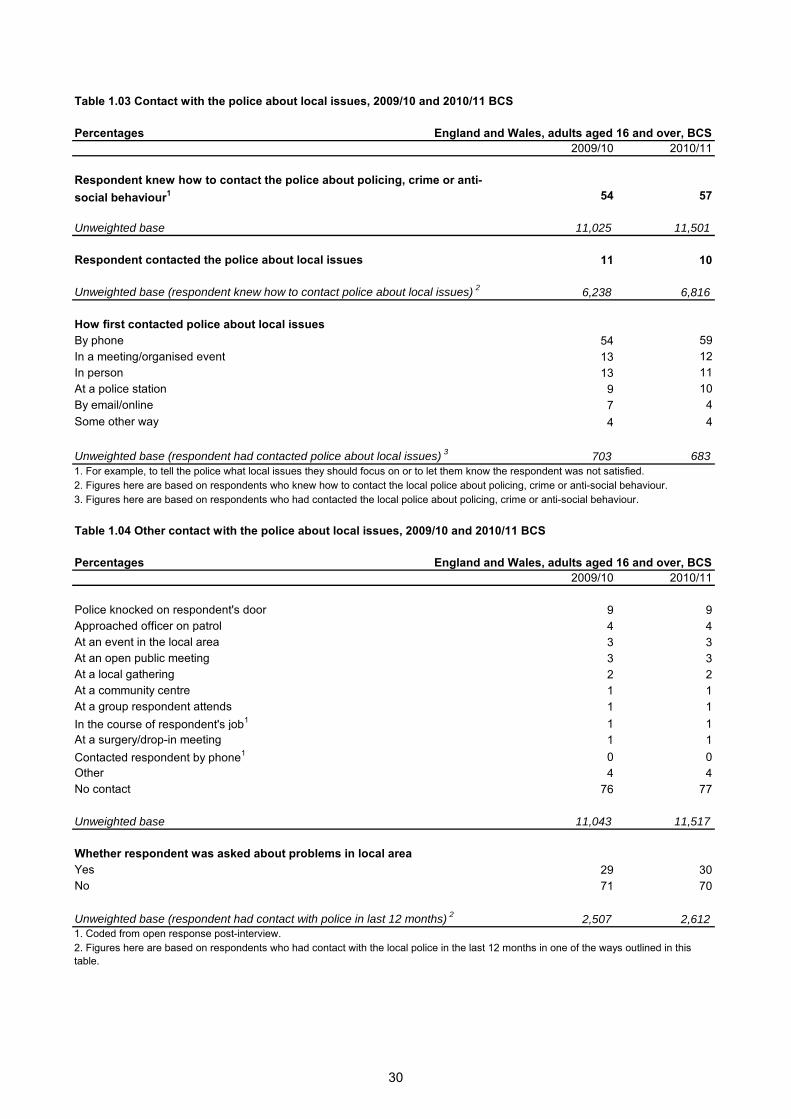
Over half of people (57%) said that they knew how to contact the police about policing, crime or ASB (for example, to tell them what issues they should focus on), an increase from 54 per cent in 2009/10. However, there was no change in the number of people who had contacted the police about local issues in 2010/11 (10%) compared with 2009/10 (11%; the one percentage point decrease was not statistically significant). For those who had contacted the police, the most common way of doing so was by telephone (59%), while smaller numbers had contacted the police in a meeting or at an organised event (12%), in person (11%) or by visiting a police station (10%; Table 1.03).
Respondents were also asked about any other contact they had with the police about local policing issues. Similar to the 2009/10 BCS, the 2010/11 BCS showed that nine per cent of people said that the police had knocked on their door, while smaller proportions had approached an officer on patrol (4%), at an event in the local area or at an open public meeting (both 3%). About three-quarters of people (77%) had not had any contact with the police in any of these ways in the last 12 months.
One of the key elements of neighbourhood policing is engagement with residents to find out about the local priorities for tackling crime and ASB. The 2010/11 BCS showed that 30 per cent of people had
5 A full breakdown of awareness of neighbourhood policing teams by personal, household and area characteristics using the
2009/10 BCS can be found in Tables 2.04 and 2.05 of Scribbins et al. (2010). Many of these characteristics will be closely associated (for example, marital status and age) so caution is needed in the interpretation of the effects of these different characteristics when viewed in isolation.
6 As indicated by the Crime Domain of the Index of Multiple Deprivation (see Section 7.1 of the User Guide to Home Office Crime Statistics for more information).
7 As indicated by the Employment Domain of the Index of Multiple Deprivation (see Section 7.1 of the User Guide for more information).
8 For example, the names of the officers on the team, how to contact them and details of meetings they were holding in the local area.
17
Policing and community engagement
been asked what the problems were in the local area when they had been in contact with the police (this is similar to results for 2009/10 (29%); Table 1.04).
Box 1.1 BCS questions about contact with the local police
Respondents are asked a series of questions about their contact with the local police, including;
For respondents that said they had actually contacted the police in the local area in the last 12 months to let them know their views about policing, crime or ASB, such as to tell them what local issues they should focus on or to let them know they were not satisfied with what they were doing:
How did you FIRST contact them? (interviewer codes only one option):
By email/online
Phone call
In a meeting or organised event
Approached/contacted officer in person
At the police station
Some other way
During the last 12 months, have you had contact with police officers or Police Community Support Officers in your local area in any of the ways shown on this card? (respondents are asked to choose all options that applied from a card they were shown):
At an open public meeting
At a surgery or drop-in centre
At a gathering in street near here
They knocked on my door
Approached officers on foot/bike patrol
At a group I go to
At an event in the local area
At a community centre
Other
For respondents that said they had seen, read or heard any details about their local police:
Where did you come across these details about your local police? (interviewer codes all options that applied):
Police newsletter
Council newsletter
Neighbourhood Watch newsletter
Poster in public place (e.g. library, community centre, etc.)
Local newspaper
Local TV/radio
Somewhere else
18

Supplementary Volume 1 to Crime in England and Wales 2010/11
Other contact with the police
The previous section discussed contact with the police about local policing issues and priorities. Since 1991, the BCS has also asked about other contact people may have had with the police, including contact initiated by themselves (for example, to report a crime; see Box 1.2 for details of the questions asked) as well as contact initiated by the police (for example, if they had been stopped by the police in a vehicle or on foot; see Boxes 1.3 and 1.4 for details of the questions asked). These questions do not refer specifically to the local area so will cover people’s experiences of both their local police and of the police in other areas.
Respondent-initiated contact with the police
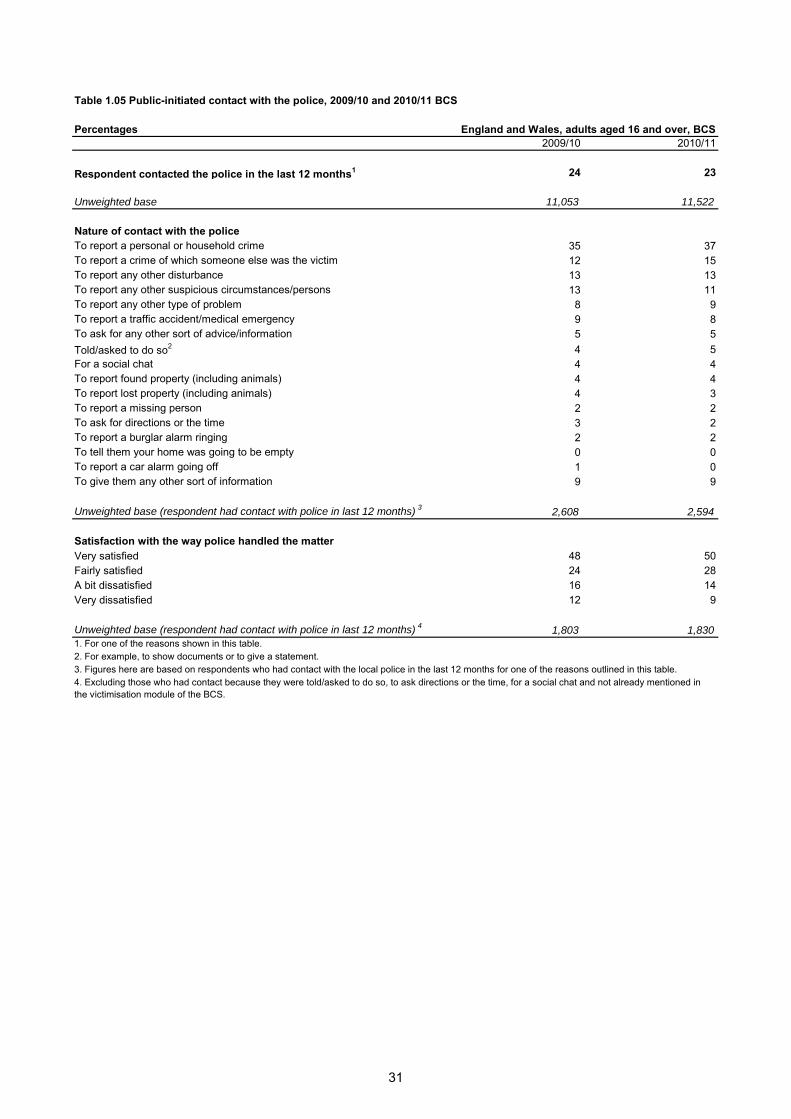
The BCS asks respondents about any general contact they had made with police officers in the last 12 months and about their reasons for doing so. Around a quarter of people (23%) had made contact with the police in the last 12 months; of those people this was most commonly to report a personal or household crime (37%) or a crime of which someone else was the victim (15%), to report any other disturbance (13%) or other suspicious circumstances or persons (11%; Table 1.05). This is a similar pattern to findings from the 2009/10 BCS.
Longer-term trends show a decrease in the number of people contacting the police for one of the reasons outlined in Box 1.2; from 43 per cent in 1993 to 23 per cent in 2010/11. Trends in contact with the police in more recent years (since 2007/08) have levelled (see Figure 1.3).
Box 1.2 BCS questions about other contact with the police
Respondents are asked questions about their contact with the police (other than about local policing issues), including;
For respondents who had contacted the police about issues other than local policing:
Looking at the reasons on this card, why have you yourself contacted the police in the last 12 months? (respondents asked to choose all that applied from a card they were shown):
To report a crime they, someone in their household, or of which someone else (not in their household) was the victim
Because they were asked to do so
To report a traffic accident or medical emergency
To report a burglar alarm or a car alarm going off
To report any other suspicious circumstances or persons
To report any type of disturbance, noise or nuisance (other than alarms going off)
To report a missing person
To report they had lost or found something (including animals)
To tell them that their house was going to be empty
To report any other type of problem or difficulty
To ask for directions or the time
To ask for or to give them any other sort of advice or information
Just for a social chat
19
Policing and community engagement
It is not possible to be certain of the reasons for the fall in the numbers of people contacting the police. It is likely to be a result of a number of factors including changes in police deployment, policing methods and, of course, reductions in the actual level of crime.
9 For example, the 2010/11 BCS
estimated crime to be 50 per cent lower than the peak in 1995, representing nearly 10 million fewer crimes. The possibility that the fall in people contacting the police could be due to decreased reporting rates
10 by victims of crime has been discounted as these have shown little variation over time (see
Flatley et al., 2011).
Figure 1.3 Trends in respondent-initiated contact with the police, 1993 to 2010/11 BCS
42
3836
3233
32
29 28 2725 23 24
23
43
0
5
10
15
20
25
30
35
40
45
50
19931995
19971999
2001/02
2002/03
2003/04
2004/05
2005/06
2006/07
2007/08
2008/09
2009/10
2010/11
Perc
enta
ge
1. Questions about respondent-initiated contact with the police were included in the 1991 BCS but were not asked in a way that is comparable with those included in later survey years and data are not presented here.
2. For an explanation of year-labels, see ‘Conventions used in figures and tables’ at the start of this volume.
When asked about their overall level of satisfaction11
with the way that the police handled the matter, people generally reported high levels of satisfaction; almost eight out of ten people said that they were very (50%) or fairly (28%) satisfied, while the remainder were a bit (14%) or very (9%) dissatisfied (Table 1.05).
Police-initiated contact with the respondent
The BCS also asks about people’s experiences of police-initiated contact, including their experiences of being stopped by the police (in a vehicle or on foot)
12 as well as contact made by the police for any
other reason (see Boxes 1.3 and 1.4 for details of the questions asked).
9 Since 1993, the BCS has consistently shown that people had most commonly contacted the police to report a crime or
disturbance. 10 For information about reporting rates in the BCS, see Section 4 of the User Guide and for the most recent published figures,
see Flatley et al. (2011). 11 Previous analysis of the 2008/09 BCS showed that there was an association between levels of satisfaction with police
contact and confidence in the police; agreement that ‘the police and local council were dealing with anti-social behaviour and crime in the local area’ was influenced by the level of satisfaction with police contact rather than having had contact alone (see Walker et al. (2009) for further details).
12 For statistics on stops and searches under the Police and Criminal Evidence Act 1984 (PACE) see Povey et al. (2011).
20
Supplementary Volume 1 to Crime in England and Wales 2010/11
Box 1.3 BCS questions about experiences of being stopped by the police in a vehicle or on foot
Respondents are asked a series of questions about their experiences of being stopped by the police in a vehicle or on foot
1, including:
For those who had been stopped in a vehicle in the last 12 months and the police gave a reason for stopping them: What was the reason they gave? (interviewer codes all options that applied):
Speeding
Suspected drink driving
Some other driver-related behaviour
Some vehicle defect (e.g. faulty brake lights, tyres, etc.)
Parking offence
Other motoring/traffic offence
To check car ownership
Routine check (e.g. checking tax disk)
Some other (non-motoring/non-vehicle) offence
Police had received information (tip-off) about an offence
Matched suspect description for a crime
Case of mistaken identity
In vicinity of a crime
Some matter other than an offence
For those who had been stopped on foot in the last 12 months and the police gave a reason for stopping them: What was the reason they gave? (interviewer codes all options that applied):
Police had received information (tip-off) about an offence
Matched suspect description for a crime
Case of mistaken identity
Respondent seen in vicinity of a crime
To ask whether respondent had witnessed anything
Said respondent looked suspicious / was acting suspiciously
Said respondent was acting disorderly / was drunk and disorderly / making a nuisance
Just making general enquiries / asking for information / asking for directions
Some other matter than an offence 1 Questions relating to respondent’s experiences of being stopped in a vehicle or on foot were removed from the 2011/12
BCS.
21

Policing and community engagement
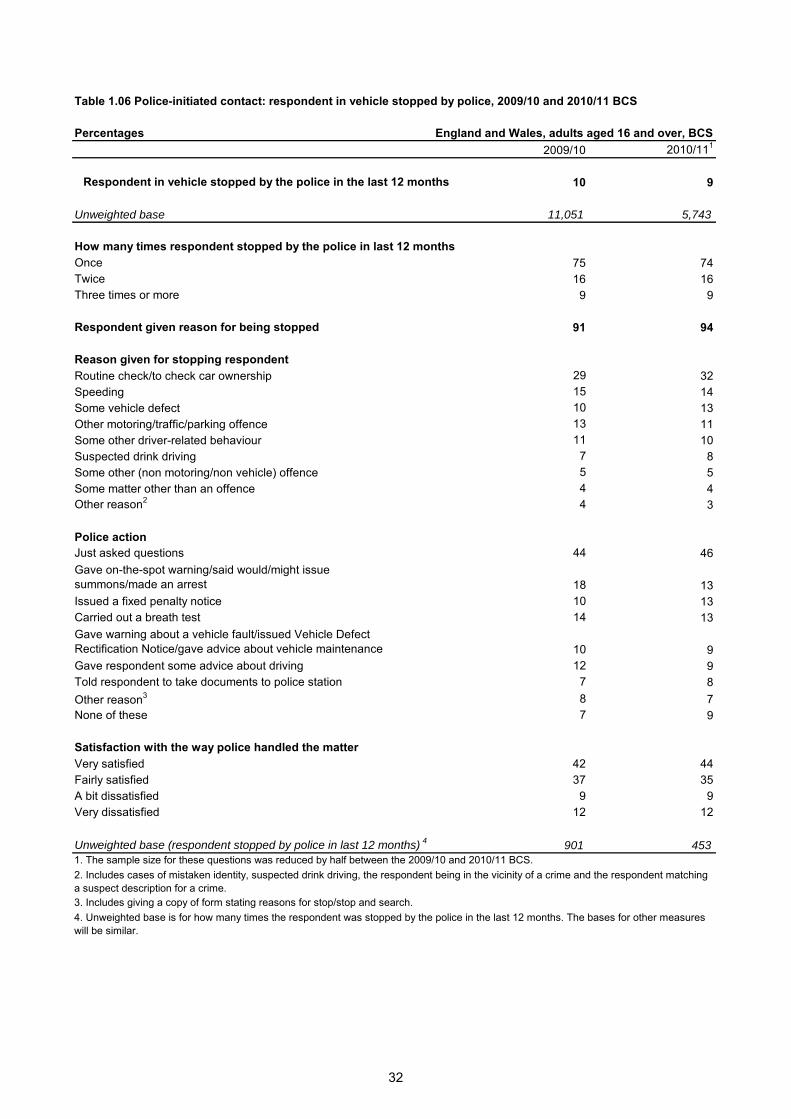
The 2010/11 BCS showed that around one in ten people (9%) had been in a car or motorcycle which was approached or stopped by the police in the last 12 months. This represents no statistically significant change compared with the 2009/10 BCS (10%). Most people who had been stopped had only been so once (74%); smaller numbers had been stopped either twice (16%) or three times or more (9%). In the majority of cases where the respondent had been stopped in a vehicle the respondent was given a reason for being stopped (94%). These were most commonly so that the police could carry out routine checks on the vehicle or to check car ownership (32%), because the respondent was suspected of speeding (14%) or because of some vehicle defect (13%; Table 1.06).
Figure 1.4 shows long-term trends for people’s experiences of being stopped by the police whilst in a vehicle. The likelihood of being stopped in a vehicle fell by six percentage points between the 1991 BCS and the 2002/03 (from 16% to 10%) and has remained flat (at between 9% and 10%) between 2002/03 and 2010/11. This decrease is likely to be due to a complex range of factors, including changes in police tactics, police numbers and the number of vehicles on the roads.
Box 1.3 BCS questions about experiences of being stopped by the police in a vehicle or on foot (cont’d)
For those who had either been stopped in a vehicle or on foot in the last 12 months: [Thinking just about the last time you were stopped] did the police do any of the things on this card? (respondents are asked to choose all options that applied from a card they were shown):
Gave an on-the-spot warning about an offence committed
Said they would/might issue a summons
Made an arrest
Gave a copy of form stating reasons for stop/stop and search
Just asked questions
Took name and address (stopped on foot only)
Carried out a breath test (stopped in vehicle only)
Issued a Fixed Penalty Notice for an offence (stopped in vehicle only)
Told to take documents to the police station (stopped in vehicle only)
Gave a warning about a vehicle fault (stopped in vehicle only)
Issued a Vehicle Defect Rectification Notice (stopped in vehicle only)
Gave some advice about vehicle maintenance (stopped in vehicle only)
Gave some advice about driving (stopped in vehicle only)
Other action
22

Supplementary Volume 1 to Crime in England and Wales 2010/11
Figure 1.4 Trends in police-initiated contact: respondent in a vehicle stopped by the police, 1991 to 2010/11 BCS
91099
109101010
11
12
15151516
0
2
4
6
8
10
12
14
16
18
20
19911993
19951997
1999
2001/02
2002/03
2003/04
2004/05
2005/06
2006/07
2007/08
2008/09
2009/10
2010/11
Perc
enta
ge
1. For an explanation of year-labels, see ‘Conventions used in figures and tables’ at the start of this volume.
Respondents who had been stopped by the police in a vehicle in the last 12 months were asked what actions the police took as a result of stopping them. The most common action taken was the police just asking questions, mentioned by almost half of those who had been stopped (46%). A smaller number of people who had been stopped were given an on-the-spot warning, were told that the police might or would issue a summons or the police made an arrest (13%) or were issued a fixed penalty notice (also 13%).
A much smaller proportion of people (3%) had been stopped and asked questions by the police when they were on foot in the last 12 months. There has been very little variation in the numbers of people stopped by the police whilst on foot since the 1991 BCS (see Table 1.07 and Figure 1.5).
Figure 1.5 Trends in police-initiated contact: respondent on foot stopped by the police, 1991 to 2010/11 BCS
333
33333
4 43
2 3 3 3
0
1
2
3
4
5
6
7
8
9
10
19911993
19951997
1999
2001/02
2002/03
2003/04
2004/05
2005/06
2006/07
2007/08
2008/09
2009/10
2010/11
Perc
enta
ge
1. For an explanation of year-labels, see ‘Conventions used in figures and tables’ at the start of this volume.
When asked about their overall level of satisfaction with the way that the police handled the matter, people who had been stopped in a vehicle were generally positive; almost eight out of ten people said that they were very (44%) or fairly (35%) satisfied, while the remainder said they were either a bit (9%)
23
Policing and community engagement
or very (12%) dissatisfied (Table 1.06). The high levels of satisfaction13
among those who had been stopped in a vehicle may be explained by the mainly routine reasons the police gave for stopping them (for example, to carry out routine checks). In only a small number of cases did the police take any serious action, such as making an arrest.
Only a small number of respondents in the 2010/11 BCS had been stopped whilst on foot (113) and as a result, figures for questions about reasons for being stopped on foot, police actions and the respondent’s satisfaction with how the police handled the matter are not presented here.
Previous research has shown that the likelihood of being stopped by the police (either in a vehicle or while on foot) varied by personal and household and area characteristics.
14 For example, Nicholas et
al. (2008) showed that young men aged 16 to 24 were more likely to be stopped in a vehicle and on foot, compared with the average for England and Wales.
Experience of being searched by the police
Respondents who had been stopped by the police in the last 12 months were also asked whether the police had searched the vehicle or anyone in it (if stopped in a car or on a motorcycle) or whether they, anyone with them or any bags or cases were searched (if stopped on foot). Of those who had been stopped in a vehicle, eight per cent had also been searched or the vehicle had been searched. This represents less than one per cent of the general population (i.e. including those who had not been stopped in the last year and therefore not asked the question). Of those who had been stopped on foot
15, 30 per cent had also been searched (Table 1c, below). Again, this represents less than one
per cent of the general population once those who had not been stopped have been taken into account.
The results of other questions relating to the respondent’s experience of being searched (for example, who or what was searched and whether a reason was given for the search) are not presented here due to the small numbers of people who had been searched in the last 12 months.
Table 1c Whether the police searched respondent or anyone with respondent, 2009/10 and 2010/11 BCS
Percentages
2009/10 2010/111
2009/10 2010/111
Searched2
10 8 27 30
Unweighted base3
902 452 254 113
England and Wales, adults aged 16 and over, BCSIn vehicle On foot
1. The sample size for these questions was reduced by half between the 2009/10 and 2010/11 BCS. 2. Includes police looking into any bags or cases. 3. Unweighted base is all respondents stopped in last year.
13 It is possible that satisfaction with the police handling of the matter varied according to why the respondent was stopped;
however, the relatively small numbers of people who had been stopped in a vehicle do not allow for robust breakdowns of satisfaction by reasons for being stopped.
14 The sample size for these questions in 2010/11 was reduced from a quarter to an eighth compared with the 2009/10 BCS, preventing any analysis of contact with the police by personal, household and area characteristics. However, a breakdown of contact with the police by personal, household and area characteristics using the 2006/07 BCS can be found in Table 4.4 of Nicholas et al. (2008). Many of these characteristics will be closely associated (for example, marital status and age) so caution is needed in the interpretation of the effects of these different characteristics when viewed in isolation.
15 Only a small number of respondents in the 2010/11 BCS had been stopped whilst on foot (113) and as a result, figures for whether they had been searched should be treated with caution.
24
Supplementary Volume 1 to Crime in England and Wales 2010/11
Other police-initiated contact with the respondent
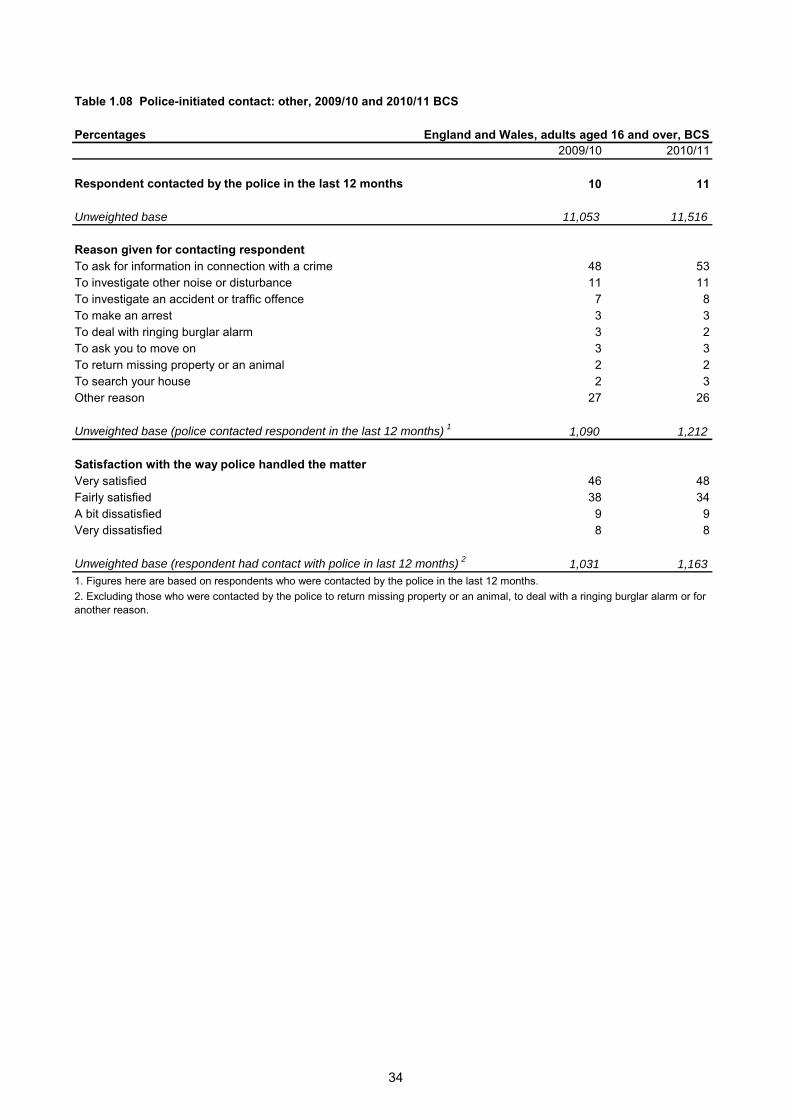
Respondents were also asked whether the police had made contact with them in the last 12 months, other than to stop them when in a vehicle or on foot. Around one in ten (11%) people had been contacted by the police in the last 12 months, and for half of these people (53%) the reason was to ask the respondent for information in connection to a crime. A smaller number of people had been contacted by the police as part of an investigation into any other noise or disturbance or about an accident or traffic offence. These findings are very similar to the 2009/10 BCS (Table 1.08).
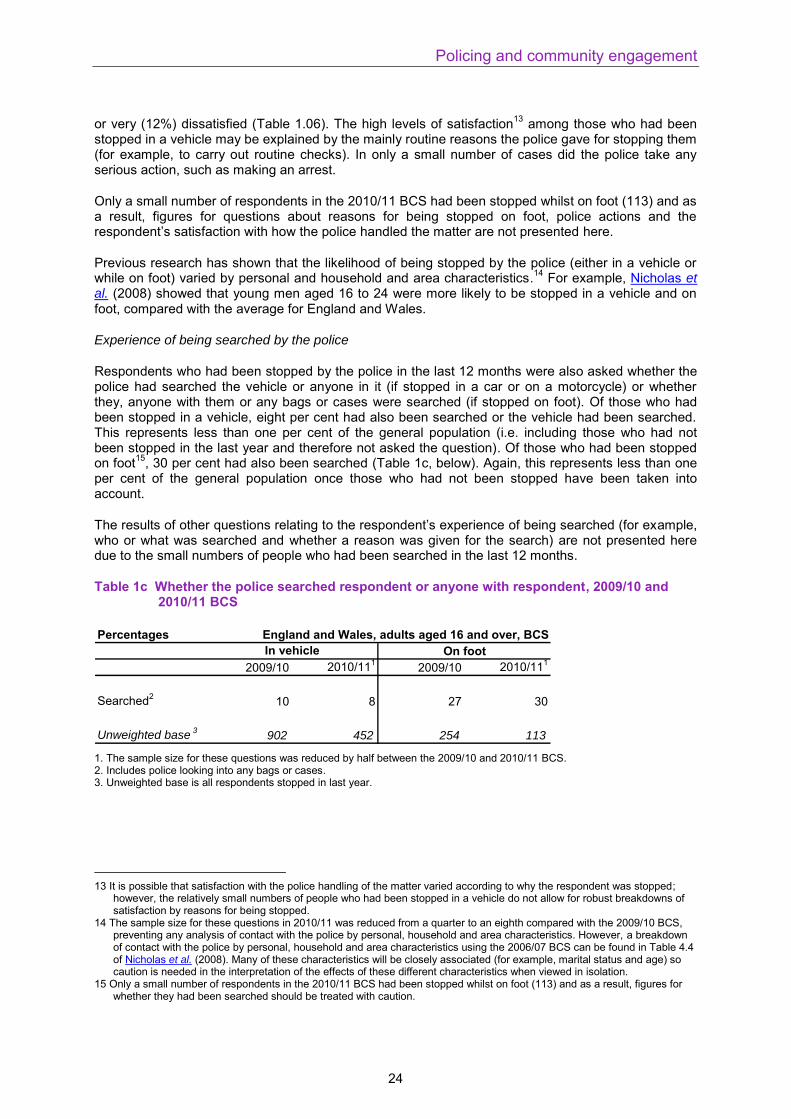
Longer-term trends for this question show a decrease in the number of people who were contacted by the police for one of the ‘other’ reasons shown in Box 1.4; from 17 per cent in 1993 to 11 per cent in the 2010/11 BCS (see Figure 1.6) due mainly to a sharp fall between the 1995 BCS and 2001/02 BCS, after which the trend has remained relatively flat. The fall in police-initiated contact is likely to be a result of a combination of factors, such as changes in police deployment, policing methods and reductions in levels of BCS crime.
Box 1.4 BCS questions about other police-initiated contact with the respondent
Respondents are asked questions about other contact initiated by the police, including;
For respondents who had been contacted by the police:
Looking at the reasons on this card, why have the police contacted you in the last 12 months?
To return missing property or an animal
To deal with a ringing burglar alarm
To investigate another noise or disturbance
To ask for information in connection with a crime that had been committed
To investigate an accident or traffic offence in which you were involved
To search your house
To make an arrest
To ask you to move on
For any other reason
25
Policing and community engagement
Figure 1.6 Trends in police-initiated contact: other reasons, 1993 to 2010/11 BCS
111011
10
121111
121211
14
19
21
17
0
5
10
15
20
25
19931995
19971999
2001/02
2002/03
2003/04
2004/05
2005/06
2006/07
2007/08
2008/09
2009/10
2010/11
Perc
enta
ge
1. Questions about police-initiated contact with the police for other reasons were included in the 1991 BCS but were not asked in a way that is comparable with those included in later survey years and data are not presented here.
2. For an explanation of year-labels, see ‘Conventions used in figures and tables’ at the start of this volume.
In cases where the police had made contact with the respondent for one of these other reasons, levels of satisfaction with the way that the police handled the matter were generally high; over eight out of ten people said that they were very (48%) or fairly (34%) satisfied, while the remainder said that they were a bit (9%) or very (8%) dissatisfied (Table 1.08).
Box 1.5 Children’s contact with the local police
Since January 2009 the BCS has asked children aged 10 to 15 resident in households in England and Wales about their experience of crime in the previous 12 months (see Chaplin et al., 2011 for experimental statistics on the victimisation of children based on the 2010/11 BCS). As well as asking children about their experience of crime, other modules of questions were randomly allocated to sub-samples. A third of the overall sample (about 1,250
1) was asked questions about
their experiences of and contact with the local police.
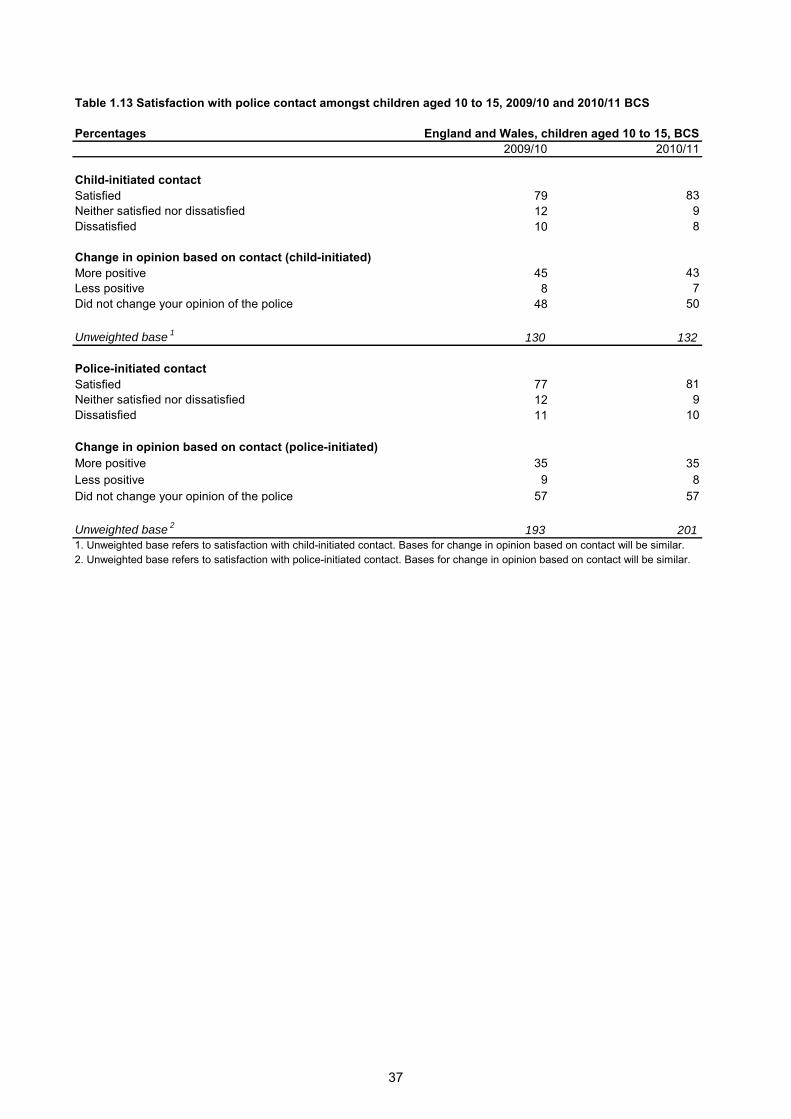
First results for these questions, based on the 2009/10 BCS, were published in Scribbins et al. (2011). This box updates headline figures for these questions (for data, see Tables 1.09 to 1.13). In general, these figures represent a similar picture compared with the 2009/10 BCS. Where relevant, comparisons are made between the experiences of children and of adult respondents to the BCS.
For more information on the BCS extension to 10 to 15 year olds, see Chapter 2 of the User Guide to Home Office Crime Statistics.
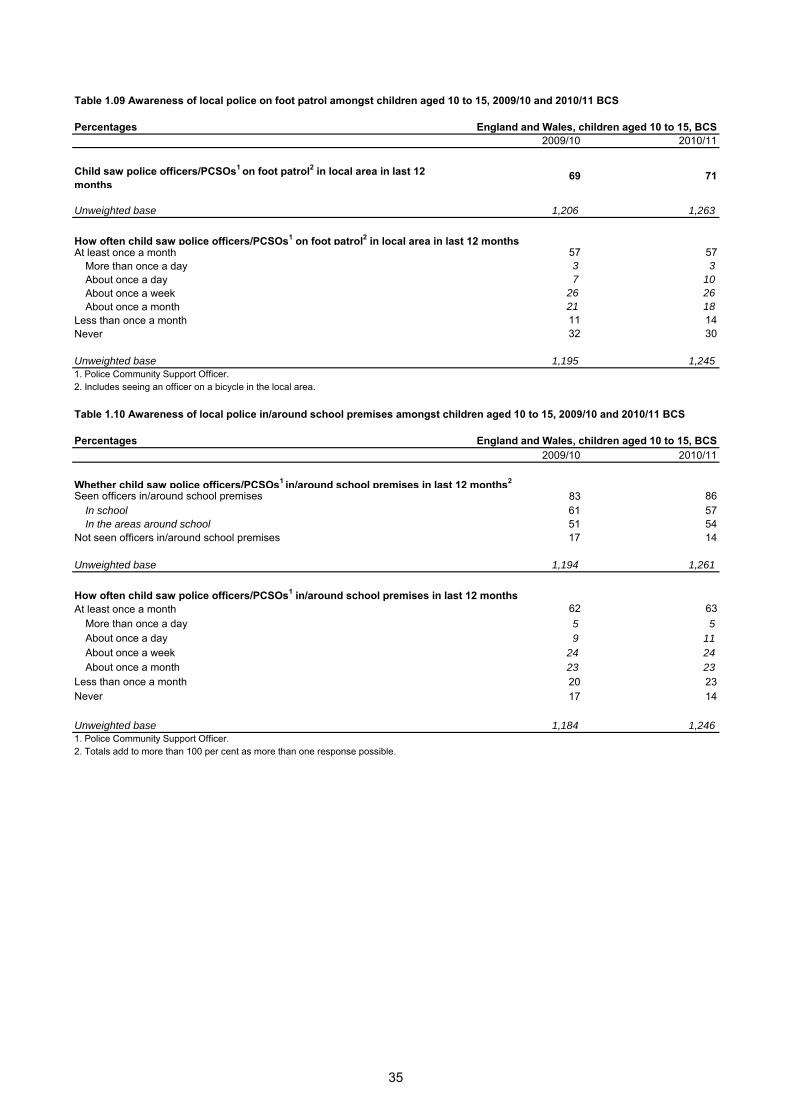
Visibility of the local police:
The 2010/11 BCS showed that 71 per cent of children had seen a police officer or PCSO on foot patrol in their local area in the last 12 months (Table 1.09). This is similar to the proportion of adults who had seen an officer on foot patrol in the local area (75%; although for adults no time period was specified in the question). Thirty-eight per cent of children said they had seen an officer on foot patrol at least once a week (again, similar to adults; 39%).
1 This sample size is large enough to provide robust national estimates for questions asked of the whole sub-sample but caution should be used when interpreting responses to questions asked of further sub-samples as these are sometimes based on a low number of cases.
26
Supplementary Volume 1 to Crime in England and Wales 2010/11
Box 1.5 Children’s contact with the local police (cont’d)
Children were also asked about whether they had seen officers in or around their school and were more likely to say that they had seen a police officer or PCSO in this environment in the last 12 months (86%). The frequency with which children saw an officer in or around school was similar to how often they saw the police in the local area; 40 per cent had seen an officer at least once a week (Table 1.10).
As an indication of the extent to which the police were engaging with children in their local communities, children were asked how familiar they were with police officers and PCSOs in their local area. Just under half (46%) of children said that they knew an officer, with 23 per cent knowing officers by both name and sight. The remaining 54 per cent did not know any of the police officers or PCSOs in the local area (Table 1.11).
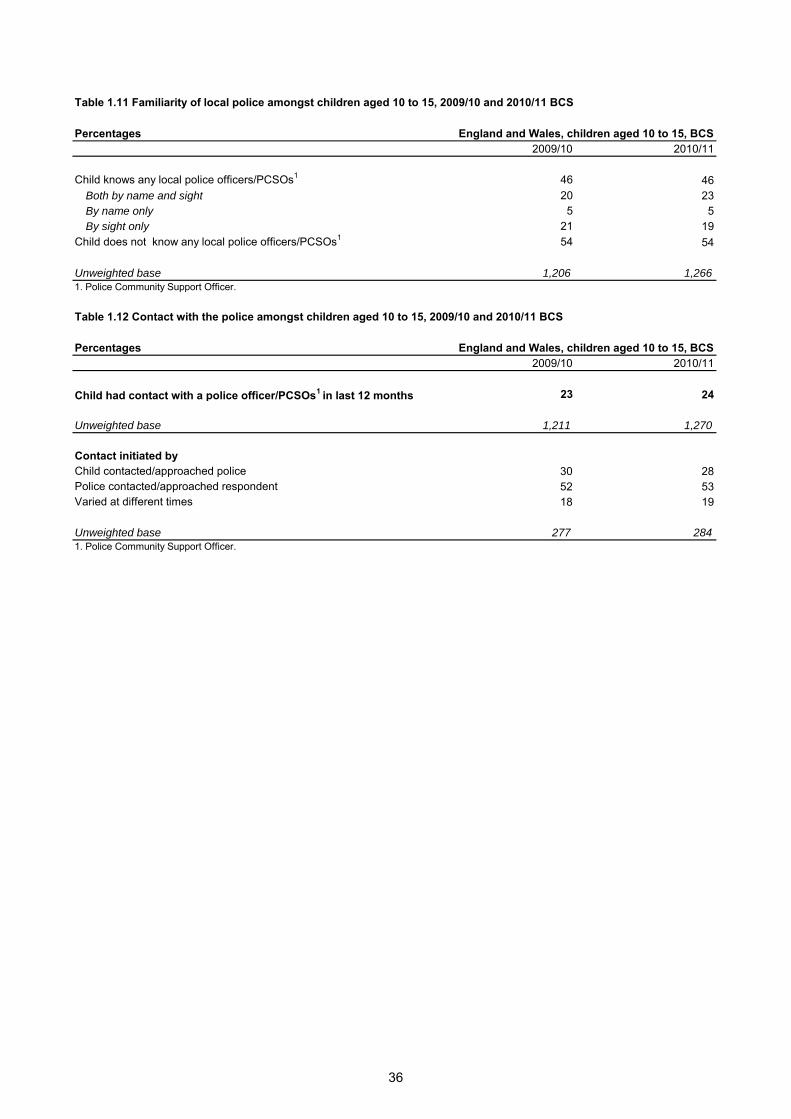
Contact with the local police:
Around a quarter of children (24%) aged 10 to 15 had had contact with the police in the last 12 months. Of those who had contact with the police, about half (53%) said that they had been contacted or approached by the police, 28 per cent had contacted or approached the police themselves and for 19 per cent it had varied at different times (Table 1.12).
27

Percentages England and Wales, adults aged 16 and over, BCS
2006/07 2007/08 2008/09 2009/10 2010/11
Statistically
significant
change,
2006/07 to
2010/11
Statistically
significant
change,
2009/10 to
2010/11
How often respondent saw a police officer/PCSO1 on foot patrol
At least once a month 38 45 48 54 55 **
More than once a day 2 2 3 3 4 ** **
About once a day 6 7 8 10 10 **
About once a week 18 21 22 25 25 **
About once a month 13 15 15 15 16 ** **
Less than once a month 22 21 21 19 19 **
Never 40 34 31 27 25 ** **
Unweighted base 10,744 11,598 11,436 11,009 11,462
Table 1.01 Visibility of local police on foot patrol, 2006/07 to 2010/11 BCS
1. Police Community Support Officer.
28
Percentages England and Wales, adults aged 16 and over, BCS2009/10 2010/11
31 32
Unweighted base 11,031 11,501
Where respondent had come across details of local policePolice newsletter 26 29
Council newsletter 26 25
Local newspaper 25 21
Poster in public place 13 15
Neighbourhood Watch newsletter 11 11
Other newsletters/flyers1 5 6
Directly from the police2 2 2
At a local meeting/group3 2 1
Local TV/radio 0 1
Somewhere else 6 6
Unweighted base (respondent had come across details of local police)4
3,625 3,872
Table 1.02 Knowledge about local police, 2009/10 and 2010/11 BCS
4. Figures here are based on respondents who had seen, read or heard details of the local police.
Respondent had seen, read or heard details of local police
1. Coded from open response post-interview. Includes parish council newsletter, Resident's Association newsletter, etc.
2. Coded from open response post-interview. Includes details from a police officer, PCSO, at a police station, from a police
website, etc.
3. Coded from open response post-interview. Includes parish council meeting, Resident's Association or tenant's group,
Neighbourhood Watch group, etc.
29
Percentages England and Wales, adults aged 16 and over, BCS2009/10 2010/11
54 57
Unweighted base 11,025 11,501
Respondent contacted the police about local issues 11 10
Unweighted base (respondent knew how to contact police about local issues)2
6,238 6,816
How first contacted police about local issuesBy phone 54 59
In a meeting/organised event 13 12
In person 13 11
At a police station 9 10
By email/online 7 4
Some other way 4 4
Unweighted base (respondent had contacted police about local issues)3
703 683
Percentages England and Wales, adults aged 16 and over, BCS2009/10 2010/11
Police knocked on respondent's door 9 9
Approached officer on patrol 4 4
At an event in the local area 3 3
At an open public meeting 3 3
At a local gathering 2 2
At a community centre 1 1
At a group respondent attends 1 1
In the course of respondent's job1 1 1
At a surgery/drop-in meeting 1 1
Contacted respondent by phone1 0 0
Other 4 4
No contact 76 77
Unweighted base 11,043 11,517
Whether respondent was asked about problems in local areaYes 29 30
No 71 70
Unweighted base (respondent had contact with police in last 12 months)2
2,507 2,612
Table 1.03 Contact with the police about local issues, 2009/10 and 2010/11 BCS
2. Figures here are based on respondents who had contact with the local police in the last 12 months in one of the ways outlined in this
table.
1. For example, to tell the police what local issues they should focus on or to let them know the respondent was not satisfied.
2. Figures here are based on respondents who knew how to contact the local police about policing, crime or anti-social behaviour.
3. Figures here are based on respondents who had contacted the local police about policing, crime or anti-social behaviour.
Respondent knew how to contact the police about policing, crime or anti-social behaviour1
Table 1.04 Other contact with the police about local issues, 2009/10 and 2010/11 BCS
1. Coded from open response post-interview.
30
Percentages England and Wales, adults aged 16 and over, BCS2009/10 2010/11
Respondent contacted the police in the last 12 months1 24 23
Unweighted base 11,053 11,522
Nature of contact with the policeTo report a personal or household crime 35 37
To report a crime of which someone else was the victim 12 15
To report any other disturbance 13 13
To report any other suspicious circumstances/persons 13 11
To report any other type of problem 8 9
To report a traffic accident/medical emergency 9 8
To ask for any other sort of advice/information 5 5
Told/asked to do so2 4 5
For a social chat 4 4
To report found property (including animals) 4 4
To report lost property (including animals) 4 3
To report a missing person 2 2
To ask for directions or the time 3 2
To report a burglar alarm ringing 2 2
To tell them your home was going to be empty 0 0
To report a car alarm going off 1 0
To give them any other sort of information 9 9
Unweighted base (respondent had contact with police in last 12 months)3
2,608 2,594
Satisfaction with the way police handled the matterVery satisfied 48 50
Fairly satisfied 24 28
A bit dissatisfied 16 14
Very dissatisfied 12 9
Unweighted base (respondent had contact with police in last 12 months)4
1,803 1,830
4. Excluding those who had contact because they were told/asked to do so, to ask directions or the time, for a social chat and not already mentioned in
the victimisation module of the BCS.
Table 1.05 Public-initiated contact with the police, 2009/10 and 2010/11 BCS
3. Figures here are based on respondents who had contact with the local police in the last 12 months for one of the reasons outlined in this table.
1. For one of the reasons shown in this table.
2. For example, to show documents or to give a statement.
31
Percentages England and Wales, adults aged 16 and over, BCS2009/10 2010/11
1
10 9
Unweighted base 11,051 5,743
Once 75 74
Twice 16 16
Three times or more 9 9
Respondent given reason for being stopped 91 94
Reason given for stopping respondentRoutine check/to check car ownership 29 32
Speeding 15 14
Some vehicle defect 10 13
Other motoring/traffic/parking offence 13 11
Some other driver-related behaviour 11 10
Suspected drink driving 7 8
Some other (non motoring/non vehicle) offence 5 5
Some matter other than an offence 4 4
Other reason2
4 3
Police actionJust asked questions 44 46
Gave on-the-spot warning/said would/might issue
summons/made an arrest 18 13
Issued a fixed penalty notice 10 13
Carried out a breath test 14 13
Gave warning about a vehicle fault/issued Vehicle Defect
Rectification Notice/gave advice about vehicle maintenance 10 9
Gave respondent some advice about driving 12 9
Told respondent to take documents to police station 7 8
Other reason3 8 7
None of these 7 9
Satisfaction with the way police handled the matterVery satisfied 42 44
Fairly satisfied 37 35
A bit dissatisfied 9 9
Very dissatisfied 12 12
Unweighted base (respondent stopped by police in last 12 months)4
901 453
4. Unweighted base is for how many times the respondent was stopped by the police in the last 12 months. The bases for other measures
will be similar.
3. Includes giving a copy of form stating reasons for stop/stop and search.
Table 1.06 Police-initiated contact: respondent in vehicle stopped by police, 2009/10 and 2010/11 BCS
2. Includes cases of mistaken identity, suspected drink driving, the respondent being in the vicinity of a crime and the respondent matching
a suspect description for a crime.
1. The sample size for these questions was reduced by half between the 2009/10 and 2010/11 BCS.
Respondent in vehicle stopped by the police in the last 12 months
How many times respondent stopped by the police in last 12 months
32

Percentages England and Wales, adults aged 16 and over, BCS2009/10 2010/11
1
Respondent on foot stopped by the police in the last 12 months 3 3
Unweighted base 11,048 5,747
Table 1.07 Police-initiated contact: respondent on foot stopped by police, 2009/10 and 2010/11 BCS
1. The sample size for these questions was reduced by half between the 2009/10 and 2010/11 BCS.
33
Percentages England and Wales, adults aged 16 and over, BCS2009/10 2010/11
10 11
Unweighted base 11,053 11,516
Reason given for contacting respondentTo ask for information in connection with a crime 48 53
To investigate other noise or disturbance 11 11
To investigate an accident or traffic offence 7 8
To make an arrest 3 3
To deal with ringing burglar alarm 3 2
To ask you to move on 3 3
To return missing property or an animal 2 2
To search your house 2 3
Other reason 27 26
Unweighted base (police contacted respondent in the last 12 months)1
1,090 1,212
Satisfaction with the way police handled the matterVery satisfied 46 48
Fairly satisfied 38 34
A bit dissatisfied 9 9
Very dissatisfied 8 8
Unweighted base (respondent had contact with police in last 12 months)2
1,031 1,163
Table 1.08 Police-initiated contact: other, 2009/10 and 2010/11 BCS
1. Figures here are based on respondents who were contacted by the police in the last 12 months.
2. Excluding those who were contacted by the police to return missing property or an animal, to deal with a ringing burglar alarm or for
another reason.
Respondent contacted by the police in the last 12 months
34
Percentages England and Wales, children aged 10 to 15, BCS2009/10 2010/11
Child saw police officers/PCSOs1 on foot patrol2 in local area in last 12 months
69 71
Unweighted base 1,206 1,263
How often child saw police officers/PCSOs1 on foot patrol2 in local area in last 12 monthsAt least once a month 57 57
More than once a day 3 3
About once a day 7 10
About once a week 26 26
About once a month 21 18
Less than once a month 11 14
Never 32 30
Unweighted base 1,195 1,245
Percentages England and Wales, children aged 10 to 15, BCS2009/10 2010/11
Whether child saw police officers/PCSOs1 in/around school premises in last 12 months2
Seen officers in/around school premises 83 86
In school 61 57
In the areas around school 51 54
Not seen officers in/around school premises 17 14
Unweighted base 1,194 1,261
How often child saw police officers/PCSOs1 in/around school premises in last 12 monthsAt least once a month 62 63
More than once a day 5 5
About once a day 9 11
About once a week 24 24
About once a month 23 23
Less than once a month 20 23
Never 17 14
Unweighted base 1,184 1,246
Table 1.09 Awareness of local police on foot patrol amongst children aged 10 to 15, 2009/10 and 2010/11 BCS
2. Totals add to more than 100 per cent as more than one response possible.
2. Includes seeing an officer on a bicycle in the local area.
1. Police Community Support Officer.
Table 1.10 Awareness of local police in/around school premises amongst children aged 10 to 15, 2009/10 and 2010/11 BCS
1. Police Community Support Officer.
35
Percentages England and Wales, children aged 10 to 15, BCS2009/10 2010/11
Child knows any local police officers/PCSOs1
46 46
Both by name and sight 20 23
By name only 5 5
By sight only 21 19
Child does not know any local police officers/PCSOs1
54 54
Unweighted base 1,206 1,266
Percentages England and Wales, children aged 10 to 15, BCS2009/10 2010/11
Child had contact with a police officer/PCSOs1 in last 12 months 23 24
Unweighted base 1,211 1,270
Contact initiated by Child contacted/approached police 30 28
Police contacted/approached respondent 52 53
Varied at different times 18 19
Unweighted base 277 284
Table 1.11 Familiarity of local police amongst children aged 10 to 15, 2009/10 and 2010/11 BCS
1. Police Community Support Officer.
1. Police Community Support Officer.
Table 1.12 Contact with the police amongst children aged 10 to 15, 2009/10 and 2010/11 BCS
36
Percentages England and Wales, children aged 10 to 15, BCS2009/10 2010/11
Child-initiated contact Satisfied 79 83
Neither satisfied nor dissatisfied 12 9
Dissatisfied 10 8
Change in opinion based on contact (child-initiated)More positive 45 43
Less positive 8 7
Did not change your opinion of the police 48 50
Unweighted base1
130 132
Police-initiated contact Satisfied 77 81
Neither satisfied nor dissatisfied 12 9
Dissatisfied 11 10
Change in opinion based on contact (police-initiated)More positive 35 35
Less positive 9 8
Did not change your opinion of the police 57 57
Unweighted base2
193 201
2. Unweighted base refers to satisfaction with police-initiated contact. Bases for change in opinion based on contact will be similar.
Table 1.13 Satisfaction with police contact amongst children aged 10 to 15, 2009/10 and 2010/11 BCS
1. Unweighted base refers to satisfaction with child-initiated contact. Bases for change in opinion based on contact will be similar.
37

2 Public confidence in the authorities tackling anti-social behaviour and awareness of Community Payback
Ivy Lau and Jacqueline Hoare
2.1 SUMMARY
This chapter presents further analysis of the 2010/11 British Crime Survey (BCS), focusing on public attitudes about the effectiveness of authorities in tackling anti-social behaviour (ASB) and perceptions of Community Payback.
Public confidence in authorities tackling ASB
The 2010/11 BCS asked respondents how confident they were that the authorities in their local area were effective at tackling ASB. The analysis in this chapter is focused solely on people who perceived at least one of the following five behaviours to be a problem in their local area: noisy neighbours, teenagers hanging around, vandalism and graffiti, people using or dealing drugs, and people being drunk or rowdy (that is, 48% of respondents).
Of people who perceived at least one of the five elements of ASB as a problem in the local area, half (52%) were confident that the authorities were effective at reducing ASB; two in five (41%) were confident that the authorities were effective in bringing ASB offenders to justice; and a third (34%) felt well informed about what was being done to tackle ASB. There was little variation in these perceptions according to personal, household or area characteristics.
However, as might be expected, perceptions of the effectiveness of the authorities in tackling ASB were associated with other measures of confidence in crime and policing-related issues. For example, those who thought the police in the local area were doing a good or excellent job were twice as likely to be confident in the effectiveness of the authorities at reducing ASB compared with those who thought the police were doing a fair or poor job (70% and 35% respectively).
The number of anti-social behaviours perceived as a problem was associated with perceptions of the effectiveness of the authorities. For example, people who perceived just one of the five anti-social behaviours as a problem in their area were twice as likely to feel confident that the authorities were effective at bringing ASB offenders to justice as those who perceived all five behaviours as a problem (50% and 27% respectively).
Awareness and experience of seeing Community Payback
The proportion of respondents that had heard of Community Payback was high (85%), but levels of awareness of activities in the local area were much lower: only 15 per cent of adults had personally seen offenders carrying out Community Payback work in the local area in the last 12 months.
Overall two-thirds of adults (67%) felt that Community Payback was a very or fairly effective form of punishment. Only a small proportion of people thought it was not at all effective (5%).
There was an inverse relationship between awareness of Community Payback and confidence in the criminal justice system (CJS) as a whole: those who had heard about, were aware of, or had personally seen Community Payback were less confident in the effectiveness of the CJS. However, caution is needed in the interpretation of this result when viewed in isolation as it is likely that other factors may be contributing to this pattern.
38

Supplementary Volume 1 to Crime in England and Wales 2010/11
2.2 INTRODUCTION
Anti-social behaviour is defined by the Crime and Disorder Act 1998 as acting in ‘a manner that caused or was likely to cause harassment, alarm or distress to one or more persons not of the same household’. Terms such as ‘nuisance’ and ‘disorder’ are also used to describe some of this behaviour.
1 Dealing with ASB continues to be a priority for the Government
2; action to tackle ASB may
be initiated by a number of agencies, including the police, local councils and registered social landlords.
The term ‘anti-social behaviour’ as used in the British Crime Survey (BCS) covers a range of behaviours and outcomes from criminal behaviour (such as damage to property) to general nuisance, all of which may impinge on the quality of people’s lives. The BCS has included questions on perceptions of ASB for a number of years including questions about how much of a problem a range of different types of ASB are perceived to be in the local area.
3 In 2010/11, questions were added to
the BCS to evaluate people’s perceptions of the effectiveness of agencies in tackling ASB; these questions are a focus of this chapter.
This chapter also looks at public perceptions of Community Payback (part of the adult non-custodial sentence
4 available to courts). Community Payback is one possible element of a community order
which involves offenders doing compulsory unpaid work for the benefit of the community. Courts are given the power to sentence offenders to undertake between 40 and 300 hours of Community Payback. This type of sentence is available only where the offence is serious enough to warrant a community sentence, but not so serious that custody is unavoidable.
Unpaid work of this kind was previously known as ‘community service’ or ‘community punishment’ but was relabelled as Community Payback in 2005 to increase public awareness. Following recommendations in the 2008 review by Louise Casey ‘Engaging Communities in Fighting Crime’
5,
this type of activity has been consistently referred to as Community Payback (the new term was not always used following its introduction in 2005). In addition, Casey recommended that such schemes should be made more visible to the members of the public. In accepting these recommendations, the previous administration promoted the wearing of high-visibility orange jackets with ‘Community Payback’ insignia displayed on the front and back by those engaged in such work. Typically, local probation trusts invite members of the public to put forward ideas for work that offenders can carry out in their neighbourhoods. Projects involve activities that may not otherwise be carried out, such as removing graffiti and working on environmental projects.
2.3 PUBLIC CONFIDENCE IN THE AUTHORITIES TACKLING ANTI-SOCIAL BEHAVIOUR
The 2010/11 BCS asked respondents how confident they were that the authorities in their area were effective at reducing ASB and in bringing to justice those who carry out ASB.
6 These questions were
asked after respondents were given a reminder about the types of problems that might be considered as ASB and had been mentioned earlier in the interview (see Box 2.1).
The question on whether people were confident in the authorities’ effectiveness at reducing ASB was asked of all respondents in the sub-sample, irrespective of whether respondents had answered
1 http://webarchive.nationalarchives.gov.uk/20100407205403/asb.homeoffice.gov.uk/article.aspx?id=9066 2 The 2011-2015 Home Office business plan (http://www.number10.gov.uk/wp-content/uploads/HO-Business-Plan1.pdf) states
that part of the Home Office vision is to ‘enable the police and local communities to step up the fight against crime and anti-social behaviour.’
3 See Section 6.3 of the User Guide to Home Office Crime Statistics for more information on the BCS measure of perceived anti-social behaviour.
4 The range of requirements available as part of a community order are: compulsory (unpaid) work; participation in activities; programmes aimed at changing offending behaviour; prohibition from certain activities; curfew; exclusion from certain areas; residence requirement; mental health treatment; drug treatment and testing; alcohol treatment; supervision; attendance centre requirement.
5 http://www.justice.gov.uk/publications/docs/community-payback-research.pdf 6 These questions are asked of a half sample from the 2010/11 BCS.
39

Public confidence in the authorities tackling anti-social behaviour and awareness of Community Payback
previously that they perceived anti-social behaviour to be a problem in their local area or not. However, the analysis on public confidence in the authorities tackling ASB in this chapter is restricted to respondents who perceived one or more of the five anti-social behaviours listed in the preamble to the first question relating to confidence in the authorities as a problem (see Box 2.1).
Almost half (48%) of respondents perceived a problem in their local area with at least one of the five specific anti-social behaviours mentioned in the question, i.e. noisy neighbours, teenagers hanging around, vandalism and graffiti, people using or dealing drugs, and people being drunk or rowdy (Table 2a).
It should be made clear that the group of respondents described here as perceiving a problem with at least one of these five elements of ASB is different to the standard ASB measure routinely published from the BCS where seven questions are used to provide an overall index of levels of perceived ASB, which also includes the two ASB measures on rubbish or litter lying around on the streets and abandoned or burnt-out cars. For example, only 29 per cent of respondents who perceived at least one of the five elements of ASB as a problem had a high level of perceived anti-social behaviour according to the standard BCS ASB measure.
7 This means that the approach used in this chapter
7 This measure is derived from responses to the seven individual anti-social behaviour strands as described in Section 6.3 of
the User Guide. In the 2010/11 BCS 14 per cent of respondents perceived there to be a high level of ASB in their local area (Chaplin et al., 2011).
Box 2.1 BCS questions about tackling anti-social behaviour
Respondents were asked a series of questions about tackling anti-social behaviour, including:
Earlier I asked you about problems in your local area such as noisy neighbours, teenagers hanging around, vandalism and graffiti, people using or dealing drugs and people being drunk or rowdy.
Still thinking about these types of problems, how confident are you that the authorities in your area are effective at reducing anti-social behaviour?
Very confident
Fairly confident
Not very confident
Not at all confident
SPONTANEOUS ONLY: No problem with anti-social behaviour in this area
Still thinking about these types of problems, how confident are you that the authorities in your area are effective in bringing to justice those who carry out anti-social behaviour?
Very confident
Fairly confident
Not very confident
Not at all confident
Overall, how well informed do you feel about what is being done to tackle these sorts of problems in your local area?
Very well informed
Fairly well informed
Not very well informed
Not informed at all
40
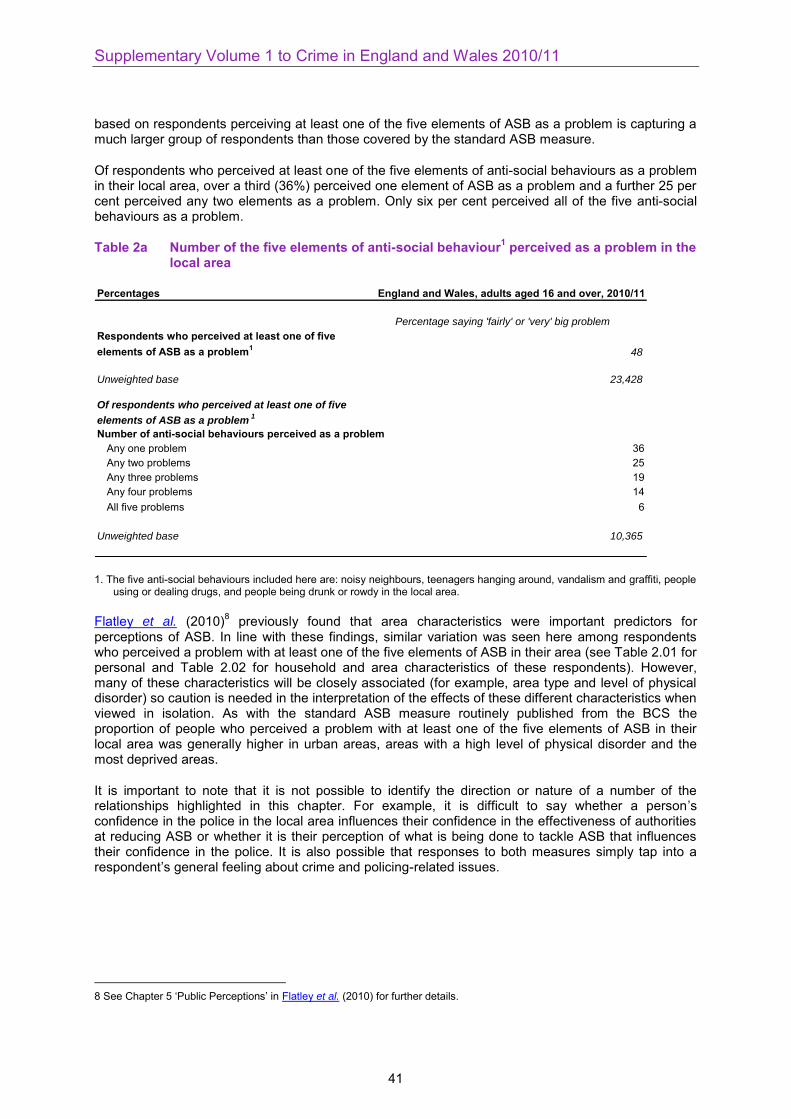
Supplementary Volume 1 to Crime in England and Wales 2010/11
based on respondents perceiving at least one of the five elements of ASB as a problem is capturing a much larger group of respondents than those covered by the standard ASB measure.
Of respondents who perceived at least one of the five elements of anti-social behaviours as a problem in their local area, over a third (36%) perceived one element of ASB as a problem and a further 25 per cent perceived any two elements as a problem. Only six per cent perceived all of the five anti-social behaviours as a problem.
Table 2a Number of the five elements of anti-social behaviour1 perceived as a problem in the local area
Percentages
Respondents who perceived at least one of five elements of ASB as a problem1
48
Unweighted base 23,428
Number of anti-social behaviours perceived as a problemAny one problem 36
Any two problems 25
Any three problems 19
Any four problems 14
All five problems 6
Unweighted base 10,365
Percentage saying 'fairly' or 'very' big problem
England and Wales, adults aged 16 and over, 2010/11
Of respondents who perceived at least one of five
elements of ASB as a problem1
1. The five anti-social behaviours included here are: noisy neighbours, teenagers hanging around, vandalism and graffiti, people using or dealing drugs, and people being drunk or rowdy in the local area.
Flatley et al. (2010)8 previously found that area characteristics were important predictors for
perceptions of ASB. In line with these findings, similar variation was seen here among respondents who perceived a problem with at least one of the five elements of ASB in their area (see Table 2.01 for personal and Table 2.02 for household and area characteristics of these respondents). However, many of these characteristics will be closely associated (for example, area type and level of physical disorder) so caution is needed in the interpretation of the effects of these different characteristics when viewed in isolation. As with the standard ASB measure routinely published from the BCS the proportion of people who perceived a problem with at least one of the five elements of ASB in their local area was generally higher in urban areas, areas with a high level of physical disorder and the most deprived areas.
It is important to note that it is not possible to identify the direction or nature of a number of the relationships highlighted in this chapter. For example, it is difficult to say whether a person’s confidence in the police in the local area influences their confidence in the effectiveness of authorities at reducing ASB or whether it is their perception of what is being done to tackle ASB that influences their confidence in the police. It is also possible that responses to both measures simply tap into a respondent’s general feeling about crime and policing-related issues.
8 See Chapter 5 ‘Public Perceptions’ in Flatley et al. (2010) for further details.
41

Public confidence in the authorities tackling anti-social behaviour and awareness of Community Payback
Confidence in the effectiveness of the authorities at reducing ASB
Half of those who perceived a problem with at least one of the five specific elements of ASB in their local area (52%) were confident that the authorities in their area were effective at reducing ASB (4% were very confident and 48% were fairly confident, Table 2.03).
Among people who perceived at least one element of ASB as a problem, there was little variation in confidence in the authorities being effective at reducing ASB according to personal, household and area characteristics. For example, similar proportions of people who perceived a problem with at least one of the five specific elements of ASB living in urban (52%) or rural (55%) areas felt confident that the authorities were effective at reducing ASB, as did those in areas of high physical disorder compared with those living in areas where physical disorder was not high (both 52%, Tables 2.01 and 2.02).
Levels of confidence in the effectiveness of the authorities at reducing ASB were also considered alongside other perceptions of crime and policing-related issues. As might be expected, the likelihood of feeling confident in the effectiveness of the authorities at reducing ASB was associated with other measures of confidence in crime and policing-related issues (Table 2.04). For example:
Respondents who thought the police in the local area were doing a good or excellent job were twice as likely to be confident in the effectiveness of the authorities at reducing ASB compared with those who thought the police were doing a fair or poor job (70% and 35% respectively).
Those who agreed that the police and local council were dealing with the ASB and crime issues that matter in the local area were much more likely to be confident in the effectiveness of the authorities at reducing ASB (75%) compared with those who disagreed or neither agreed nor disagreed with that statement (32%).
Levels of confidence declined as the number of ASB problems respondents perceived in their local area increased; for example, two-thirds (66%) of people who perceived only one type of ASB as a problem felt confident compared with 28 per cent of those who perceived all five types of ASB as a problem.
Confidence in the effectiveness of the authorities at bringing to justice those who carry out ASB
Respondents were also asked how confident they were that the authorities in their local area were effective in bringing to justice those who carry out ASB. Two in five respondents (41%) who perceived a problem with at least one of the five specific elements of ASB were confident that the authorities were effective in bringing ASB offenders to justice; three per cent were very confident and 38 per cent were fairly confident (Table 2.03).
There was little variation by personal, household and area characteristics (Tables 2.01 and 2.02). However, similar to the pattern described in the previous section, respondents’ confidence in the authorities in bringing to justice those who carry out ASB varied greatly with perceptions of other crime and policing-related issues (Table 2.04).
Sixty-two per cent of people who agreed that the police and local council were dealing with the ASB and crime issues that matter in the local area felt confident that the authorities were bringing ASB offenders to justice, compared with 22 per cent of those who neither agreed nor disagreed.
Those perceiving fewer numbers of ASB problems in the local area were more likely to feel confident that the authorities were effective at bringing ASB offenders to justice; for example, people who perceived just one of the five types of ASB as a problem were twice as likely to feel confident than those who perceived all five behaviours as a problem (50% and 27% respectively).
42
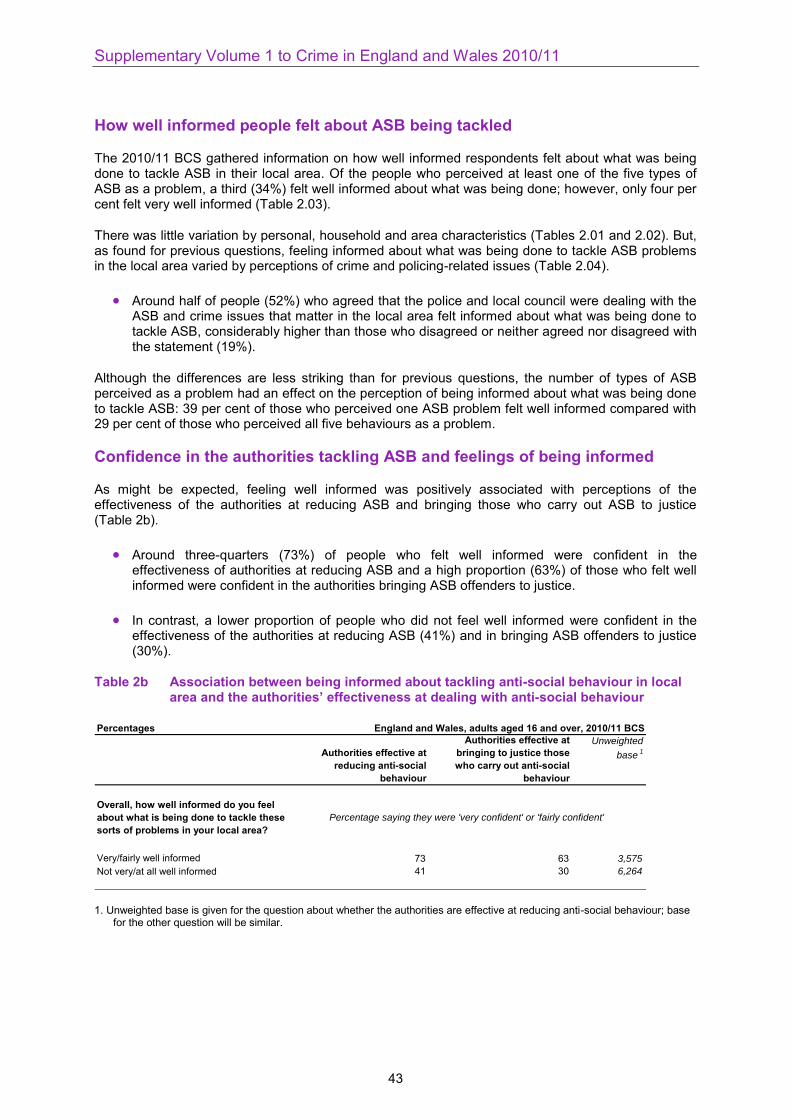
Supplementary Volume 1 to Crime in England and Wales 2010/11
How well informed people felt about ASB being tackled
The 2010/11 BCS gathered information on how well informed respondents felt about what was being done to tackle ASB in their local area. Of the people who perceived at least one of the five types of ASB as a problem, a third (34%) felt well informed about what was being done; however, only four per cent felt very well informed (Table 2.03).
There was little variation by personal, household and area characteristics (Tables 2.01 and 2.02). But, as found for previous questions, feeling informed about what was being done to tackle ASB problems in the local area varied by perceptions of crime and policing-related issues (Table 2.04).
Around half of people (52%) who agreed that the police and local council were dealing with the ASB and crime issues that matter in the local area felt informed about what was being done to tackle ASB, considerably higher than those who disagreed or neither agreed nor disagreed with the statement (19%).
Although the differences are less striking than for previous questions, the number of types of ASB perceived as a problem had an effect on the perception of being informed about what was being done to tackle ASB: 39 per cent of those who perceived one ASB problem felt well informed compared with 29 per cent of those who perceived all five behaviours as a problem.
Confidence in the authorities tackling ASB and feelings of being informed
As might be expected, feeling well informed was positively associated with perceptions of the effectiveness of the authorities at reducing ASB and bringing those who carry out ASB to justice (Table 2b).
Around three-quarters (73%) of people who felt well informed were confident in the effectiveness of authorities at reducing ASB and a high proportion (63%) of those who felt well informed were confident in the authorities bringing ASB offenders to justice.
In contrast, a lower proportion of people who did not feel well informed were confident in the effectiveness of the authorities at reducing ASB (41%) and in bringing ASB offenders to justice (30%).
Table 2b Association between being informed about tackling anti-social behaviour in local area and the authorities’ effectiveness at dealing with anti-social behaviour
Percentages
Authorities effective at reducing anti-social
behaviour
Authorities effective at bringing to justice those who carry out anti-social
behaviour
Unweighted
base1
Very/fairly well informed 73 63 3,575
Not very/at all well informed 41 30 6,264
Percentage saying they were 'very confident' or 'fairly confident'
Overall, how well informed do you feel about what is being done to tackle these sorts of problems in your local area?
England and Wales, adults aged 16 and over, 2010/11 BCS
1. Unweighted base is given for the question about whether the authorities are effective at reducing anti-social behaviour; base for the other question will be similar.
43
Public confidence in the authorities tackling anti-social behaviour and awareness of Community Payback
2.4 AWARENESS AND EXPERIENCE OF SEEING COMMUNITY PAYBACK
The 2010/11 BCS included questions about people’s awareness of Community Payback and whether people have actually seen offenders carrying out unpaid work in their area. The survey also asked about perceptions of the effectiveness of Community Payback (see Box 2.2).
These questions were asked of a quarter of the overall BCS interview sample. Respondents were assigned this module on a random basis meaning that the results are based on a nationally representative sample. However, it is important to note that these questions were not asked in the BCS to enable an evaluation of the impact of Community Payback. Rather they were designed to assess awareness of the scheme and to find out more about the attitudes of those who were aware. Information was not available on whether, and how, such schemes were operating in areas across the country.
Awareness of Community Payback
The 2010/11 BCS showed that the proportion of people who had heard of offenders being made to carry out unpaid work for the benefit of the community was high; 85 per cent said that they had heard of this.
There was little variation in the types of adults who had heard of Community Payback according to personal, household and area characteristics (Tables 2.05 and 2.06). However, people with a higher
Box 2.2 BCS questions about Community Payback
Respondents were asked a series of questions about their awareness, experience and perceptions of Community Payback:
As part of a community sentence, offenders can be made to carry out unpaid work for the benefit of the community. Before this interview had you heard of offenders being made to carry out unpaid work for the benefit of the community?
Yes
No Are you aware of offenders doing Community Payback work in your local area in the last 12 months?
Yes
No Can I check, have you actually SEEN offenders doing Community Payback work in your local area in the last 12 months?
Yes
No How effective do you feel Community Payback is as a punishment?
Very effective
Fairly effective
Not very effective
Not at all effective
44
Supplementary Volume 1 to Crime in England and Wales 2010/11
level of education and those living in more affluent or rural areas were more likely to have heard of Community Payback, for example:
Adults with some educational qualifications (for example, 87% of adults with O level/GCSE qualifications and 89% of adults with degree or diploma qualifications) were more likely than those without any educational qualifications (77%) to have heard of Community Payback.
People living in rural areas (89%) were more likely to have heard of Community Payback compared with those living in an urban area (84%).
Awareness of Community Payback generally increased with household income; for example, 81 per cent of people in households with income of less than £10,000 were aware of Community Payback rising to 92 per cent of people in households with an income of £40,000 or more.
People in managerial and professional occupations were most likely to have heard of Community Payback (91%) compared with all other occupations (for example, 83% of those in routine or manual occupations).
While the proportion of respondents saying they had heard of the scheme was high, levels of awareness of Community Payback activities in the local area were much lower. One-quarter of adults (25%) were aware of offenders doing Community Payback work in their local area in the last 12 months; three in five (60%) of these adults had personally seen offenders doing work in the last 12 months, equivalent to 15 per cent of all adults overall.
There were some differences in the characteristics associated with having heard of Community Payback and those associated with seeing the scheme in the local area, notably that:
Adults living in urban areas were more likely to have seen the scheme in their local area compared with those living in rural areas (15% and 12% respectively) despite there being lower overall awareness of Community Payback in urban areas compared with rural areas (84% and 89% respectively).
Adults living in areas of high physical disorder were more likely to have seen offenders doing Community Payback than where physical disorder was not high (19% and 14% respectively), contrasting with the pattern for overall awareness (76% had heard of Community Payback in areas of high physical disorder compared with 86% where physical disorder was not high).
The proportion of adults who had seen Community Payback decreased with decreasing levels of crime (from 17% in the most deprived areas according to the Crime deprivation index to 10% in the least deprived areas) while overall awareness generally increased with decreasing levels of crime (82% of those in the most deprived areas had heard of Community Payback compared with 91% in the least deprived areas).
Effectiveness of Community Payback
Overall two-thirds of adults (67%) felt that Community Payback was a very or fairly effective form of punishment. One in ten (10%) thought it was very effective and 57 per cent thought it was fairly effective. Only a small proportion of people thought it was not at all effective (5%, Table 2.07).
There was no strong pattern of variation in perceptions of Community Payback being effective as a punishment according to personal, household or area characteristics (Tables 2.05 and 2.06), contrasting with the patterns seen when looking at general awareness of the scheme. For example, there was no statistically significant difference in the proportion of adults who thought that Community Payback was effective as a punishment in urban or rural areas (66% and 68% respectively).
45
Public confidence in the authorities tackling anti-social behaviour and awareness of Community Payback
Awareness of Community Payback was not associated with perceptions of its effectiveness as a form of punishment. For example, around two-thirds of adults felt Community Payback was effective whether they had heard of offenders being made to carry out unpaid work in the community or not (67% and 65% respectively). The same held true for whether people were aware of Community Payback work in the local area or not (68% and 66% respectively), and whether adults had personally seen offenders doing Community Payback work or not (69% and 66% respectively, Table 2.08).
Although people’s feelings about the effectiveness of Community Payback appeared independent of their awareness or experience of personally seeing it, there seemed to be an inverse relationship to confidence in the criminal justice system (CJS) as a whole: those who had heard about, were aware of, or had personally seen Community Payback were least confident in the effectiveness of the CJS. However, caution is needed in the interpretation of this effect when viewed in isolation as it is likely that other factors
9 could be contributing to this pattern (Table 2.08):
Among adults who had heard of Community Payback, two in five (40%) were confident in the CJS as a whole being effective compared with 50 per cent of those who had not heard of Community Payback.
People who were aware of offenders doing Community Payback work in the local area had lower levels of confidence in the effectiveness of the CJS than those who weren’t (36% and 43% respectively).
Further analysis which controlled for other factors such as occupation, age, ethnicity, type of area and victimisation showed that the relationship between awareness of Community Payback and confidence in the CJS described above remained. However, the independent effect of awareness of Community Payback on confidence in the CJS was not as strong as these other factors.
Exploratory research has previously suggested that a large proportion of people surveyed in a small number of selected areas known to be undertaking work and communications on Community Payback felt unable to assess the likely impact of Community Payback on their levels of confidence in the fairness and effectiveness of the CJS (Moore et al., 2010).
9 That is, the characteristics of adults who were more likely to have heard of Community Payback may be the same or similar to
the characteristics which are independently associated with lower levels of confidence in the CJS.
46

PercentagesRespondents who
perceived at least one of five elements of ASB
as a problem
Unweighted
base2
Authorities effective at reducing anti-social
behaviour
Authorities effective at bringing to justice
those who carry out anti-social behaviour
Informed about what is being done to tackle
anti-social behaviour
Unweighted
base3
Percentage saying they
were 'very informed' or
'well informed'
ALL ADULTS 48 23,428 52 41 34 9,868
16-24 61 1,956 51 45 24 1,136
25-34 57 3,203 56 43 33 1,722
35-44 50 3,933 48 37 34 1,819
45-54 46 3,908 52 38 34 1,708
55-64 45 4,107 48 37 40 1,727
65-74 35 3,378 60 46 42 1,115
75+ 24 2,943 60 47 50 641
Men 47 10,523 50 39 34 4,389
16-24 59 879 53 47 26 493
25-34 58 1,427 57 44 33 752
35-44 49 1,782 45 34 34 806
45-54 44 1,797 46 33 31 745
55-64 46 1,893 43 33 41 796
65-74 35 1,548 58 41 39 514
75+ 26 1,197 50 35 44 283
Women 48 12,905 54 43 35 5,479
16-24 64 1,077 49 43 23 643
25-34 56 1,776 55 43 34 970
35-44 50 2,151 51 40 35 1,013
45-54 48 2,111 56 43 36 963
55-64 45 2,214 53 41 39 931
65-74 35 1,830 62 50 45 601
75+ 23 1,746 68 56 55 358
Ethnic groupWhite 46 21,573 51 39 34 8,871
Non-White 59 1,825 57 51 35 995
Mixed 55 173 51 34 28 83
Asian or Asian British 60 837 56 50 36 471
Black or Black British 60 494 64 57 42 280
Chinese or other 58 321 56 51 27 161
Marital statusMarried 43 10,934 53 40 37 4,136
Cohabiting 54 2,093 46 37 30 1,035
Single 58 4,863 52 43 30 2,587
Separated 52 762 56 43 37 352
Divorced 51 2,110 56 42 38 998
Widowed 31 2,658 63 52 46 756
Respondent's employment statusIn employment 50 12,733 51 38 32 5,745
Unemployed 66 678 54 47 31 404
Economically inactive 42 9,965 54 45 39 3,700
Student 57 570 53 47 28 314
Looking after family/home 54 1,189 49 45 37 617
Long-term/temporarily sick/ill 61 1,050 48 41 40 619
Retired 32 6,825 58 46 45 2,000
Other inactive 49 331 57 55 34 150
Respondent's occupationManagerial and professional occupations 43 7,809 51 36 34 2,914
Intermediate occupations 44 4,823 49 36 34 1,908
Routine and manual occupations 51 8,863 54 45 36 4,089
Never worked and long-term unemployed 54 817 55 55 40 371
Full-time students 58 911 53 48 26 500
Not classified 53 205 51 40 40 86
Highest qualificationDegree or diploma 45 7,710 51 37 35 3,046
Apprenticeship or A/AS level 51 4,090 51 38 31 1,851
O level/GCSE 51 4,499 51 42 33 2,121
Other 43 1,036 57 50 35 397
None 45 6,037 56 48 38 2,436
Long-standing illness or disability Long-standing illness or disability 47 6,928 50 39 37 2,955
Limits activities 47 4,992 50 40 38 2,143
Does not limit activities 47 1,933 49 37 33 809
No long-standing illness or disability 48 16,462 53 42 33 6,905
Newspaper of choice'Popular' 51 13,914 53 42 34 6,371
The Sun 57 5,138 56 45 33 2,711
The Daily Mirror 51 2,390 51 43 34 1,120
The Daily Mail 44 4,649 52 39 36 1,803
The Daily Express 41 1,177 55 39 38 443
The Daily Star 55 560 46 37 30 294
'Broadsheet' 41 5,697 50 36 33 2,049
The Daily Telegraph 37 1,778 48 32 33 582
The Guardian 48 1,365 51 37 30 563
The Independent 40 655 47 35 37 231
The Times 39 1,732 51 37 34 590
The Financial Times 53 167 49 38 32 83
Some other newspaper 51 363 59 54 46 162
No one newspaper in particular 52 218 51 43 35 97
Would not want to read any newspaper 44 2,406 49 41 35 882
Table 2.01 Views of respondents who perceived a problem with anti-social behaviour in their local area1 about tackling anti-social behaviour in the local area by personal characteristics
Percentage saying they were 'very confident' or 'fairly
confident'
1. This includes respondents who said they had a 'very' or 'fairly' big problem with one or more of the following anti-social behaviours asked about in the BCS: noisy neighbours, teenagers hanging around, vandalism and
graffiti, people using or dealing drugs, and people being drunk or rowdy. This differs from the standard BCS measure of perceived levels of ASB (see Section 6.3 of the User Guide to Home Office Crime Statistics for more
information).
4. See Section 7.3 of the User Guide for definitions of personal characteristics.
2. Base is the half-sample of the 2010/11 BCS who are asked questions about tackling anti-social behaviour.
3. Unweighted base is given for the question about whether the authorities are effective at reducing anti-social behaviour; bases for other questions will be similar. All questions are only asked of a half-sample of the 2010/11
BCS and analysis includes only those who said they perceived a 'very' or 'fairly' big problem with at least one of five anti-social behaviours mentioned in the question: noisy neighbours, teenagers hanging around, vandalism
and graffiti, people using or dealing drugs, and people being drunk or rowdy.
England and Wales, adults aged 16 and over, 2010/11 BCS
47

PercentagesRespondents who
perceived at least one of five elements of ASB
as a problem
Unweighted
base2
Authorities effective at reducing anti-social
behaviour
Authorities effective at bringing to justice
those who carry out anti-social behaviour
Informed about what is being done to tackle
anti-social behaviour
Unweighted
base3
Percentage saying they
were 'very informed' or
'well informed'
ALL ADULTS 48 23,428 52 41 34 9,868
Structure of householdSingle adult & child(ren) 64 1,214 51 43 35 707
Adults & child(ren) 51 4,939 51 42 34 2,292
Adult(s) & no children 45 17,275 53 41 34 6,869
Total household incomeLess than £10,000 53 3,298 58 51 40 1,578
£10,000 less than £20,000 51 4,654 53 42 37 2,105
£20,000 less than £30,000 49 3,155 51 40 36 1,393
£30,000 less than £40,000 48 2,363 52 37 32 989
£40,000 less than £50,000 47 1,615 51 38 33 694
£50,000 or more 42 3,224 51 34 31 1,169
No income stated or not enough information
provided 46 5,099 51 44 32 1,940
TenureOwners 42 15,810 50 38 34 5,898
Social renters 62 3,889 53 45 38 2,186
Private renters 53 3,643 56 47 31 1,749
Accommodation type Houses 46 19,984 52 40 34 8,030
Detached 31 6,180 51 36 34 1,643
Semi-detached 46 7,469 53 41 33 3,008
Terraced 58 6,335 51 41 35 3,379
Flats/maisonettes 61 2,976 54 45 34 1,633
Other accommodation 20 58 59 62 55 13
Output area classificationBlue collar communities 60 3,979 52 42 35 2,167
City living 51 1,066 53 43 32 532
Countryside 22 3,582 53 41 35 688
Prospering suburbs 34 5,509 55 38 34 1,623
Constrained by circumstances 62 2,368 52 43 37 1,348
Typical traits 49 4,920 49 38 33 2,239
Multicultural 68 2,004 54 46 33 1,271
Area typeUrban 52 17,510 52 41 34 8,343
Rural 29 5,918 55 40 36 1,525
Level of physical disorderHigh 76 1,119 52 45 40 805
Not high 46 21,924 52 41 34 8,885
Crime deprivation index10% Most Deprived output areas 68 1,934 52 43 35 1,211
2 63 1,921 49 41 36 1,140
3 58 1,993 55 45 35 1,084
4 53 1,874 50 41 32 925
5 51 1,923 56 43 34 900
6 47 2,073 53 38 32 881
7 40 2,130 52 37 35 773
8 38 2,448 54 42 33 826
9 33 2,251 54 41 36 655
10% Least Deprived output areas 26 2,906 54 41 38 649
Table 2.02 Views of respondents who perceived a problem with anti-social behaviour in their local area1 about tackling anti-social behaviour in the local area by household and area characteristics
Percentage saying they were 'very confident' or 'fairly
confident'
4. See Sections 7.1 and 7.2 of the User Guide for definitions of area and household characteristics.
1. This includes respondents who said they had a 'very' or 'fairly' big problem with one or more of the following anti-social behaviours asked about in the BCS: noisy neighbours, teenagers hanging around, vandalism
and graffiti, people using or dealing drugs, and people being drunk or rowdy. This differs from the standard BCS measure of perceived levels of ASB (see Section 6.3 of the User Guide for more information).
2. Unweighted base is the half-sample of the 2010/11 BCS who are asked questions about tackling anti-social behaviour.
3. Unweighted base is given for the question about whether the authorities are effective at reducing anti-social behaviour; bases for other questions will be similar. All questions are only asked of a half-sample of the
2010/11 BCS and analysis includes only those who said they perceived a 'very' or 'fairly' big problem with at least one of five anti-social behaviours mentioned in the question: noisy neighbours, teenagers hanging
around, vandalism and graffiti, people using or dealing drugs, and people being drunk or rowdy.
England and Wales, adults aged 16 and over, 2010/11 BCS
48
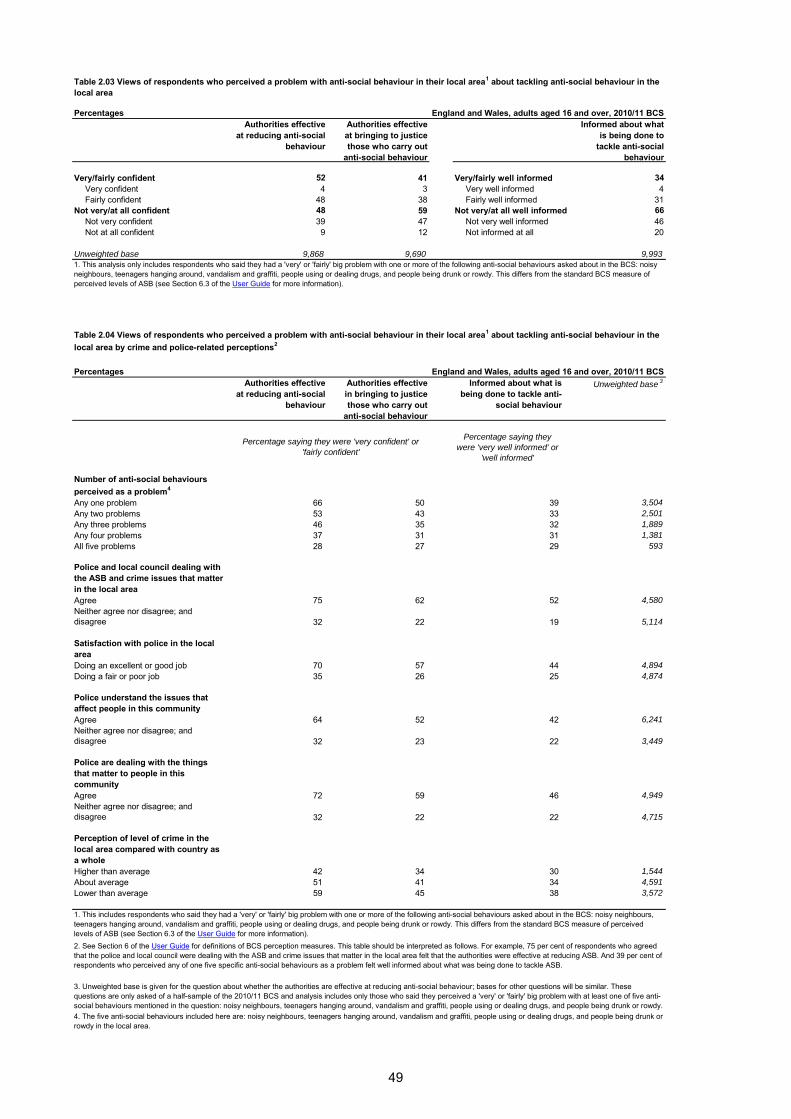
PercentagesAuthorities effective
at reducing anti-social behaviour
Authorities effective at bringing to justice those who carry out
anti-social behaviour
Informed about what is being done to
tackle anti-social behaviour
Very/fairly confident 52 41 Very/fairly well informed 34 Very confident 4 3 Very well informed 4
Fairly confident 48 38 Fairly well informed 31
Not very/at all confident 48 59 Not very/at all well informed 66 Not very confident 39 47 Not very well informed 46
Not at all confident 9 12 Not informed at all 20
Unweighted base 9,868 9,690 9,993
PercentagesAuthorities effective
at reducing anti-social behaviour
Authorities effective in bringing to justice those who carry out
anti-social behaviour
Informed about what is being done to tackle anti-
social behaviour
Unweighted base3
Percentage saying they
were 'very well informed' or
'well informed'
Number of anti-social behaviours perceived as a problem4
Any one problem 66 50 39 3,504
Any two problems 53 43 33 2,501
Any three problems 46 35 32 1,889
Any four problems 37 31 31 1,381
All five problems 28 27 29 593
Police and local council dealing with the ASB and crime issues that matter in the local areaAgree 75 62 52 4,580
Neither agree nor disagree; and
disagree 32 22 19 5,114
Satisfaction with police in the local areaDoing an excellent or good job 70 57 44 4,894
Doing a fair or poor job 35 26 25 4,874
Police understand the issues that affect people in this communityAgree 64 52 42 6,241
Neither agree nor disagree; and
disagree 32 23 22 3,449
Police are dealing with the things that matter to people in this communityAgree 72 59 46 4,949
Neither agree nor disagree; and
disagree 32 22 22 4,715
Perception of level of crime in the local area compared with country as a wholeHigher than average 42 34 30 1,544
About average 51 41 34 4,591
Lower than average 59 45 38 3,572
2. See Section 6 of the User Guide for definitions of BCS perception measures. This table should be interpreted as follows. For example, 75 per cent of respondents who agreed
that the police and local council were dealing with the ASB and crime issues that matter in the local area felt that the authorities were effective at reducing ASB. And 39 per cent of
respondents who perceived any of one five specific anti-social behaviours as a problem felt well informed about what was being done to tackle ASB.
1. This analysis only includes respondents who said they had a 'very' or 'fairly' big problem with one or more of the following anti-social behaviours asked about in the BCS: noisy
neighbours, teenagers hanging around, vandalism and graffiti, people using or dealing drugs, and people being drunk or rowdy. This differs from the standard BCS measure of
perceived levels of ASB (see Section 6.3 of the User Guide for more information).
Table 2.03 Views of respondents who perceived a problem with anti-social behaviour in their local area1 about tackling anti-social behaviour in the local area
England and Wales, adults aged 16 and over, 2010/11 BCS
3. Unweighted base is given for the question about whether the authorities are effective at reducing anti-social behaviour; bases for other questions will be similar. These
questions are only asked of a half-sample of the 2010/11 BCS and analysis includes only those who said they perceived a 'very' or 'fairly' big problem with at least one of five anti-
social behaviours mentioned in the question: noisy neighbours, teenagers hanging around, vandalism and graffiti, people using or dealing drugs, and people being drunk or rowdy.
4. The five anti-social behaviours included here are: noisy neighbours, teenagers hanging around, vandalism and graffiti, people using or dealing drugs, and people being drunk or
rowdy in the local area.
Percentage saying they were 'very confident' or
'fairly confident'
Table 2.04 Views of respondents who perceived a problem with anti-social behaviour in their local area1 about tackling anti-social behaviour in the local area by crime and police-related perceptions2
England and Wales, adults aged 16 and over, 2010/11 BCS
1. This includes respondents who said they had a 'very' or 'fairly' big problem with one or more of the following anti-social behaviours asked about in the BCS: noisy neighbours,
teenagers hanging around, vandalism and graffiti, people using or dealing drugs, and people being drunk or rowdy. This differs from the standard BCS measure of perceived
levels of ASB (see Section 6.3 of the User Guide for more information).
49
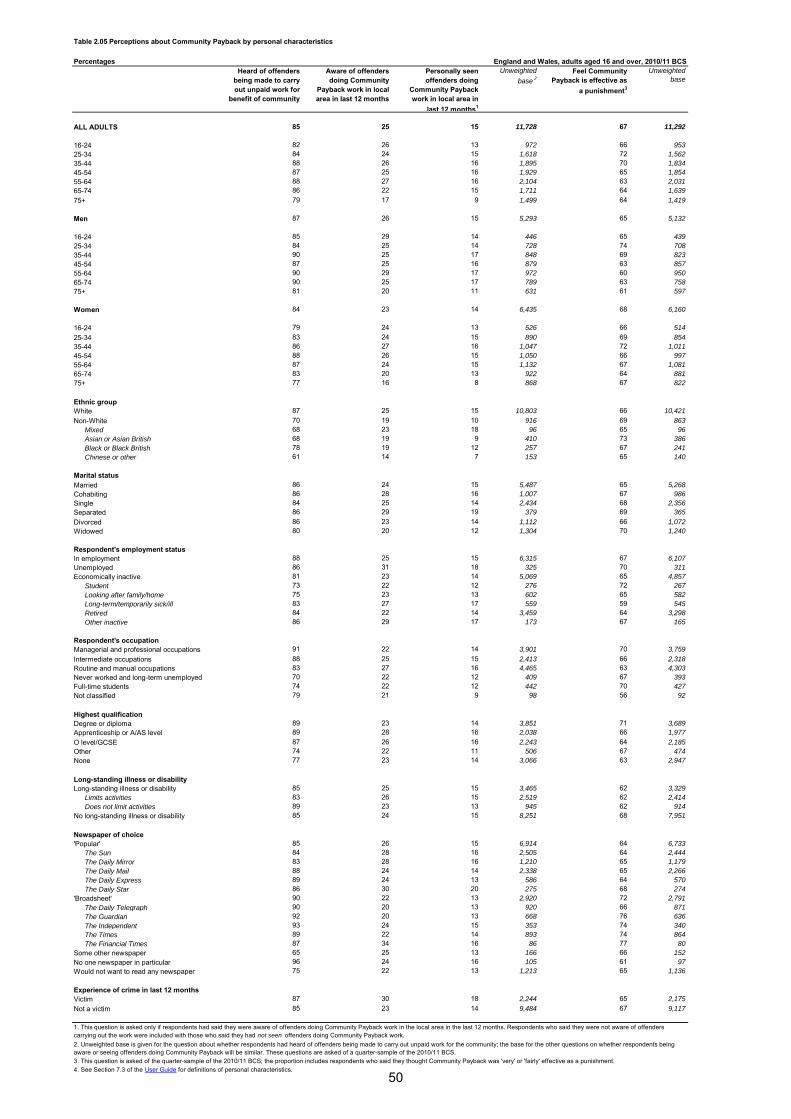
Table 2.05 Perceptions about Community Payback by personal characteristics
PercentagesHeard of offenders
being made to carry out unpaid work for
benefit of community
Aware of offenders doing Community
Payback work in local area in last 12 months
Personally seen offenders doing
Community Payback work in local area in
last 12 months1
Unweighted
base2
Feel Community Payback is effective as
a punishment3
Unweighted
base
ALL ADULTS 85 25 15 11,728 67 11,292
16-24 82 26 13 972 66 953
25-34 84 24 15 1,618 72 1,562
35-44 88 26 16 1,895 70 1,834
45-54 87 25 16 1,929 65 1,854
55-64 88 27 16 2,104 63 2,031
65-74 86 22 15 1,711 64 1,639
75+ 79 17 9 1,499 64 1,419
Men 87 26 15 5,293 65 5,132
16-24 85 29 14 446 65 439
25-34 84 25 14 728 74 708
35-44 90 25 17 848 69 823
45-54 87 25 16 879 63 857
55-64 90 29 17 972 60 950
65-74 90 25 17 789 63 758
75+ 81 20 11 631 61 597
Women 84 23 14 6,435 68 6,160
16-24 79 24 13 526 66 514
25-34 83 24 15 890 69 854
35-44 86 27 16 1,047 72 1,011
45-54 88 26 15 1,050 66 997
55-64 87 24 15 1,132 67 1,081
65-74 83 20 13 922 64 881
75+ 77 16 8 868 67 822
Ethnic groupWhite 87 25 15 10,803 66 10,421
Non-White 70 19 10 916 69 863
Mixed 68 23 18 96 65 96
Asian or Asian British 68 19 9 410 73 386
Black or Black British 78 19 12 257 67 241
Chinese or other 61 14 7 153 65 140
Marital statusMarried 86 24 15 5,487 65 5,268
Cohabiting 86 28 16 1,007 67 986
Single 84 25 14 2,434 68 2,356
Separated 86 29 19 379 69 365
Divorced 86 23 14 1,112 66 1,072
Widowed 80 20 12 1,304 70 1,240
Respondent's employment statusIn employment 88 25 15 6,315 67 6,107
Unemployed 86 31 18 325 70 311
Economically inactive 81 23 14 5,069 65 4,857
Student 73 22 12 276 72 267
Looking after family/home 75 23 13 602 65 582
Long-term/temporarily sick/ill 83 27 17 559 59 545
Retired 84 22 14 3,459 64 3,298
Other inactive 86 29 17 173 67 165
Respondent's occupationManagerial and professional occupations 91 22 14 3,901 70 3,759
Intermediate occupations 88 25 15 2,413 66 2,318
Routine and manual occupations 83 27 16 4,465 63 4,303
Never worked and long-term unemployed 70 22 12 409 67 393
Full-time students 74 22 12 442 70 427
Not classified 79 21 9 98 56 92
Highest qualificationDegree or diploma 89 23 14 3,851 71 3,689
Apprenticeship or A/AS level 89 28 16 2,038 66 1,977
O level/GCSE 87 26 16 2,243 64 2,185
Other 74 22 11 506 67 474
None 77 23 14 3,066 63 2,947
Long-standing illness or disability Long-standing illness or disability 85 25 15 3,465 62 3,329
Limits activities 83 26 15 2,519 62 2,414
Does not limit activities 89 23 13 945 62 914
No long-standing illness or disability 85 24 15 8,251 68 7,951
Newspaper of choice'Popular' 85 26 15 6,914 64 6,733
The Sun 84 28 16 2,505 64 2,444
The Daily Mirror 83 28 16 1,210 65 1,179
The Daily Mail 88 24 14 2,338 65 2,266
The Daily Express 89 24 13 586 64 570
The Daily Star 86 30 20 275 68 274
'Broadsheet' 90 22 13 2,920 72 2,791
The Daily Telegraph 90 20 13 920 66 871
The Guardian 92 20 13 668 76 636
The Independent 93 24 15 353 74 340
The Times 89 22 14 893 74 864
The Financial Times 87 34 16 86 77 80
Some other newspaper 65 25 13 166 66 152
No one newspaper in particular 96 24 16 105 61 97
Would not want to read any newspaper 75 22 13 1,213 65 1,136
Experience of crime in last 12 monthsVictim 87 30 18 2,244 65 2,175
Not a victim 85 23 14 9,484 67 9,117
4. See Section 7.3 of the User Guide for definitions of personal characteristics.
England and Wales, adults aged 16 and over, 2010/11 BCS
1. This question is asked only if respondents had said they were aware of offenders doing Community Payback work in the local area in the last 12 months. Respondents who said they were not aware of offenders
carrying out the work were included with those who said they had not seen offenders doing Community Payback work.
2. Unweighted base is given for the question about whether respondents had heard of offenders being made to carry out unpaid work for the community; the base for the other questions on whether respondents being
aware or seeing offenders doing Community Payback will be similar. These questions are asked of a quarter-sample of the 2010/11 BCS.
3. This question is asked of the quarter-sample of the 2010/11 BCS; the proportion includes respondents who said they thought Community Payback was 'very' or 'fairly' effective as a punishment.
50

Table 2.06 Perceptions about Community Payback by household and area characteristics
PercentagesHeard of offenders
being made to carry out unpaid work for
benefit of community
Aware of offenders doing Community
Payback work in local area in last 12 months
Personally seen offenders doing
Community Payback work in local area in
last 12 months1
Unweighted
base2
Feel Community Payback is effective as
a punishment3
Unweighted
base
ALL ADULTS 85 25 15 11,728 67 11,292
Structure of householdSingle adult & child(ren) 82 30 19 628 71 601
Adults & child(ren) 85 26 16 2,403 68 2,329
Adult(s) & no children 85 24 14 8,697 66 8,362
Total household incomeLess than £10,000 81 26 15 1,715 67 1,657
£10,000 less than £20,000 84 27 17 2,344 65 2,255
£20,000 less than £30,000 88 27 17 1,594 66 1,533
£30,000 less than £40,000 88 25 16 1,148 68 1,119
£40,000 less than £50,000 92 23 14 799 69 772
£50,000 or more 92 23 14 1,592 71 1,544
No income stated or not enough
information provided 79 23 12 2,531 64 2,408
TenureOwners 88 24 14 7,832 66 7,549
Social renters 81 29 17 1,984 65 1,906
Private renters 82 25 14 1,867 69 1,793
Accommodation type Houses 86 25 15 9,923 66 9,568
Detached 89 21 13 3,088 68 2,956
Semi-detached 86 26 16 3,676 66 3,570
Terraced 84 27 17 3,159 65 3,042
Flats/maisonettes 78 22 12 1,573 70 1,502
Other accommodation . . . 35 . 35
Output area classificationBlue collar communities 83 30 19 1,986 63 1,920
City living 83 18 12 539 73 515
Countryside 90 21 12 1,775 70 1,704
Prospering suburbs 89 22 12 2,735 66 2,636
Constrained by circumstances 83 28 16 1,194 64 1,161
Typical traits 88 27 17 2,491 66 2,402
Multicultural 74 23 13 1,008 69 954
Area typeUrban 84 25 15 8,817 66 8,511
Rural 89 21 12 2,911 68 2,781
Level of physical disorderHigh 76 28 19 585 66 569
Not high 86 24 14 10,960 67 10,550
Crime deprivation index10% Most Deprived output areas 82 25 17 957 65 918
2 78 25 16 965 68 931
3 84 27 16 1,006 70 975
4 86 29 16 959 64 932
5 87 24 13 981 66 942
6 86 25 14 1,067 63 1,026
7 85 24 15 1,052 69 1,009
8 88 22 14 1,203 67 1,173
9 87 23 13 1,120 67 1,077
10% Least Deprived output areas 91 19 10 1,456 70 1,392
England and Wales, adults aged 16 and over, 2010/11 BCS
4. See Sections 7.1 and 7.2 of the User Guide for definitions of area and household characteristics.
1. This question is asked only if respondents had said they were aware of offenders doing Community Payback work in the local area in the last 12 months. Respondents who said they were not aware of
offenders carrying out the work were included with those who said they had not seen offenders doing Community Payback work.
2. Unweighted base is given for the question about whether respondents had heard of offenders being made to carry out unpaid work for the community; the base for the other questions on whether
respondents being aware or seeing offenders doing Community Payback will be similar. These questions are asked of a quarter-sample of the 2010/11 BCS.
3. This question is asked of the quarter-sample of the 2010/11 BCS; the proportion includes respondents who said they thought Community Payback was 'very' or 'fairly' effective as a punishment.
51

Table 2.07 Proportion of adults who felt that Community Payback was effective as a punishment
PercentagesEngland and Wales, adults aged 16
and over, 2010/11 BCS
Very/fairly effective 67 Very effective 10
Fairly effective 57
Not very/at all effective 33 Not very effective 29
Not at all effective 5
Unweighted base 11,292
PercentagesFeel Community
Payback is effective as a punishment
The criminal justice system as a whole is
effective
Unweighted
base2
Percentage saying 'very
effective' or 'fairly
effective'
Percentage saying 'very
confident' or 'fairly
confident'
Yes 67 40 9,768
No 65 50 1,517
Yes 68 36 2,806
No 66 43 8,446
Yes 69 35 1,712
No 66 38 1,082
66 43 8,446
2. Unweighted base is given for the question about whether respondents felt Community Payback is effective as a punishment; the base for the question on the
effectiveness of the CJS as a whole will be similar. Questions on awareness and experience of Community Payback are asked of a quarter-sample of the 2010/11
BCS.
Table 2.08 Association between awareness of Community Payback and perceptions of effectiveness of Community Payback and the criminal justice system1
1. This table should be interpreted as follows. For example, 67 per cent of the respondents who had heard of offenders being made to carry out unpaid work for the
benefit of community (i.e. those who answered 'Yes' to that question) felt that Community Payback was effective as a punishment. Forty-three per cent of
respondents who were not aware of offenders doing Community Payback work in the local area in the last 12 months felt the that criminal justice system as a whole
was effective.
England and Wales, adults aged 16 and over, 2010/11 BCS
Heard of offenders being made to carry out unpaid work for benefit of community
Aware of offenders doing Community Payback work in local area in last 12 months
Personally seen offenders doing Community Payback work in local area in last 12 months
Heard of Community Payback but not aware of in the local area
52
3 Understanding perceptions of crime
Philip Hall and Jennifer Innes
3.1 SUMMARY
This chapter presents findings from the 2009/10 and 2010/11 BCS examining some of the factors relating to people’s perceptions of crime nationally and locally.
According to the 2010/11 BCS 60 per cent of people thought that crime in the country as a whole had increased over the last few years, but only 28 per cent of people thought the same about crime in their local area.
Ten per cent of people thought that crime in their local area was ‘higher than average’, compared with 51 per cent who thought it was ‘lower than average’.
The media was most commonly cited by respondents when asked about which sources of information gave them the impression that national crime rates were increasing. While the media was also reported to be important in informing perceptions of changes in local levels of crime, personal experience was much more influential than it was in the case of perceptions of the national picture.
Levels of media consumption were high, with 73 per cent of people reading newspapers and 91 per cent of people watching the news on television. There were some differences in perceptions of crime depending on which newspaper someone read and which television channel they used to view the news.
The level of trust in official statistics was mixed, with 38 per cent of people saying that they trusted crime statistics produced by the Home Office and 34 per cent saying that they distrusted them (and the remainder unsure). The police were most trusted to present crime figures in a fair and balanced way and politicians were least trusted.
Those who had used online crime maps in the last 12 months and who lived in a relatively low-crime area were more likely to think that crime in their local area was ‘lower than average’ than those who had not (83% compared with 65%). However, there was no relationship between use of crime maps and perceptions of crime in relatively high-crime areas.
The use of crime data, such as via online crime maps or published as official Home Office statistics, was relatively low when compared with media consumption. Thirty-six per cent of respondents said that they take notice of official statistics when they are published and four per cent said that they had used crime maps in the last 12 months.
There was some evidence that perceptions of crime in the local area were related to personal experiences. Those who had been victims of crime in their local area, those living in areas of high physical disorder and those who experienced problems with anti-social behaviour in their local area were more likely to think that crime in the local area was ‘higher than average’ or ‘about average’.
53

Supplementary Volume 1 to Crime in England and Wales 2010/11
3.2 INTRODUCTION
As well as being used to estimate levels of crime in England and Wales, the British Crime Survey (BCS) also contains questions on respondents’ perceptions of crime. Two key crime perception measures are covered here: respondent perceptions of the change in levels of crime over the last few years (both nationally and locally) and the perceived level of crime in a respondent’s local area compared with the level of crime nationally (see the User Guide to Home Office Crime Statistics for more information).
Analysis of the BCS has previously shown the existence of two ‘perception gaps’ (Moon et al., 2009). The first of these is a difference between perceptions of changes in crime levels and changes in crime levels measured by official statistics. The majority of respondents to the 2010/11 BCS (60%) said that they thought crime had gone up nationally in the last few years. However, BCS and police recorded measures of crime have shown the opposite. For example, in 2010/11 BCS overall crime was eight per cent lower than in 2008/09
1 and police recorded crime showed a similar overall decrease of 12 per
cent over the same period (Chaplin et al., 2011).
The second perceptions gap is between perceptions of crime nationally and locally. For example, while a majority (60%) of respondents to the 2010/11 BCS thought that crime in the country as a whole had increased over the past few years, only a minority (28%) thought it had increased in their local area. In addition, when asked about the level of crime in the local area compared with nationally, only a small number of respondents (10%) said that crime in their local area was ‘higher than average’ and around half (51%) that crime was ‘lower than average’. The remaining 39 per cent said that crime in their local area was ‘about average’.
2
These results indicate that respondents have a less negative view of crime in their local area than in the rest of the country and leads to an apparent paradox in which respondents generally think that crime is high or increasing nationally but few identify that this is the case in their local area.
This chapter explores this difference in perceptions by examining what may be behind them and how these views are formed, in particular looking at various sources of information which might influence respondent perceptions of crime. The relationship between the use of media and perceptions of the national crime rate is explored and crime maps, personal experience of victimisation and the local environment are examined for their effect on perceptions of the local crime rate.
3.3 PERCEPTIONS OF CRIME
Previous analysis has shown that variations in respondents’ perceptions of crime in their local area broadly reflect differences in crime levels that are confirmed by other measures, such as the Crime domain of the English Indices of Deprivation (Moon et al., 2009). Both this, and the fact that perceptions of the crime rate nationally are very different to the picture portrayed in official statistics, suggest that the imbalance between views on crime locally and nationally could be due to overly negative perceptions of crime nationally. If this is the case, when asked to compare crime locally with crime nationally (see Box 3.1), respondents who perceive a lot of crime locally may be inclined to describe this as ‘about average’. They may perceive the high level of crime in their local area to be similar to the high level of crime they perceive to exist nationally. Previous analysis suggests that this might be the case, as people in the highest crime areas are the most likely to say that the local crime rate is ‘about average’ (Moon et al., 2009).
1 Comparisons with other years are available (Chaplin et al., 2011). 2 There is no specific definition of ‘local area’ given in these questions, although in an earlier question the respondent’s local
area is defined as ‘within a 15-minute walk of here’.
54
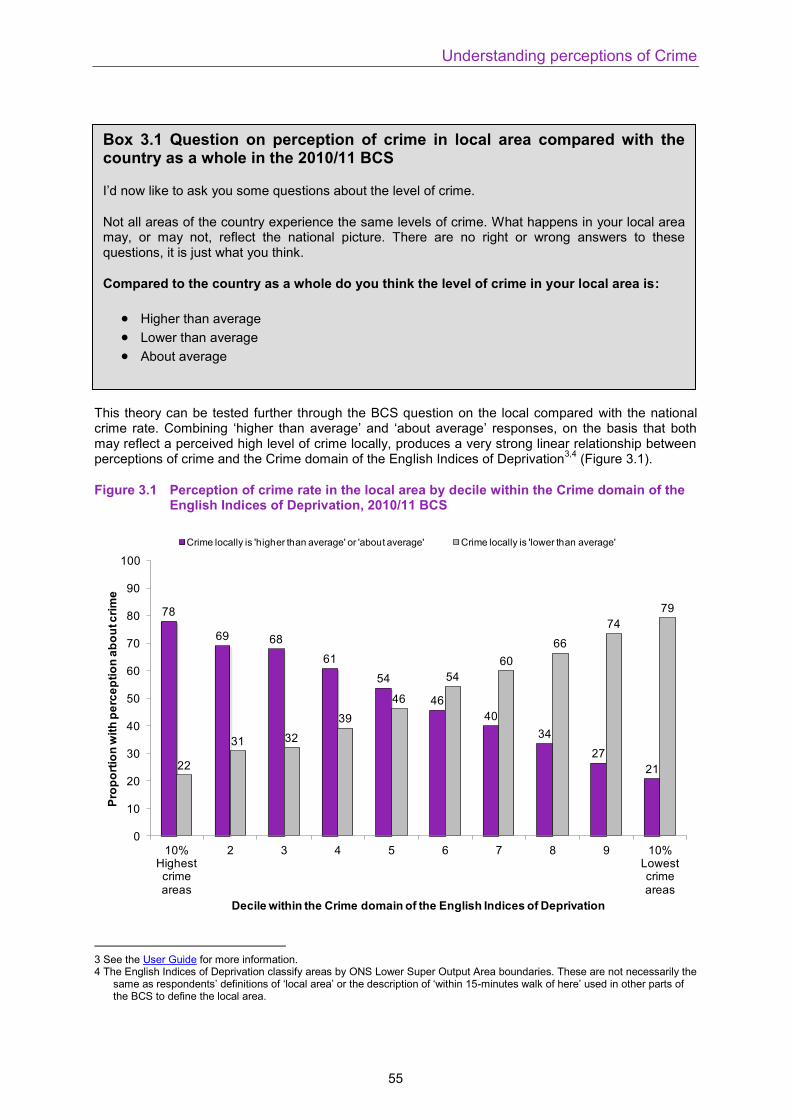
Understanding perceptions of Crime
This theory can be tested further through the BCS question on the local compared with the national crime rate. Combining ‘higher than average’ and ‘about average’ responses, on the basis that both may reflect a perceived high level of crime locally, produces a very strong linear relationship between perceptions of crime and the Crime domain of the English Indices of Deprivation
3,4 (Figure 3.1).
Figure 3.1 Perception of crime rate in the local area by decile within the Crime domain of the English Indices of Deprivation, 2010/11 BCS
78
69 68
61
54
46
40
34
27
2122
31 32
39
46
54
60
66
74
79
0
10
20
30
40
50
60
70
80
90
100
10% Highest crime areas
2 3 4 5 6 7 8 9 10% Lowest crime areas
Prop
ortio
n w
ith p
erce
ptio
n ab
out c
rime
Decile within the Crime domain of the English Indices of Deprivation
Crime locally is 'higher than average' or 'about average' Crime locally is 'lower than average'
3 See the User Guide for more information. 4 The English Indices of Deprivation classify areas by ONS Lower Super Output Area boundaries. These are not necessarily the
same as respondents’ definitions of ‘local area’ or the description of ‘within 15-minutes walk of here’ used in other parts of the BCS to define the local area.
Box 3.1 Question on perception of crime in local area compared with the country as a whole in the 2010/11 BCS
I’d now like to ask you some questions about the level of crime.
Not all areas of the country experience the same levels of crime. What happens in your local area may, or may not, reflect the national picture. There are no right or wrong answers to these questions, it is just what you think.
Compared to the country as a whole do you think the level of crime in your local area is:
Higher than average
Lower than average
About average
55

Supplementary Volume 1 to Crime in England and Wales 2010/11
The strength of the relationship between perceptions and another measure of crime in the local area provides good evidence that respondents’ perceptions of relative local crime levels are more closely aligned with the actual amount of crime. This is in contrast to perceptions of crime nationally which appear to be unduly negative.
3.4 SOURCES OF INFORMATION
As well as being asked what they think has happened to crime in the country as a whole and in their local area over the past few years, BCS respondents are also asked what sources of information have given them this impression.
5
The media was an important source of information on crime in the country as a whole. The most commonly cited source was news programmes on television or radio (59% of respondents). Other common sources were local newspapers (32% of respondents), tabloid newspapers (30% of respondents) and word of mouth or information from other people (28% of respondents; Table 3.01).
The media was also an important source of information on crime locally, with respondents most commonly saying that information came from local newspapers (47%). However, word of mouth or information from other people (44%) and personal experience (41%) were also important sources of information on local crime for respondents. Very few respondents said that they used information from the police to form their impression of crime in the local area (less than 1%; Table 3.02).
Different sources of information were associated with different perceptions of crime. Respondents who said that they thought that crime in the country as a whole had gone up over the past few years were most likely to cite news programmes on television or radio (62%), local newspapers (35%) or tabloid newspapers (35%) as the source of their impression (Table 3.01). The fact that these are also the most popular sources overall may partially explain why the view that crime is increasing nationally is so prevalent.
Those who said that they thought crime in the country as a whole had gone down were also most likely to cite news on the television or radio (50%), suggesting that the relationship between the use of media and perceptions of crime is not the same for all respondents. This was followed by broadsheet newspapers (31% of respondents) and personal experience (25% of respondents), far less common sources overall.
Respondents who perceived that local crime had risen over the past few years were most likely to cite local newspapers as the source of their impression of crime (54%), followed by word of mouth or information from other people (49%) and personal experience (35%; Table 3.02).
Personal experience was the most common source of information on crime given by those who said that crime in the local area had gone down in the past few years (44% of respondents). This source was more likely to be cited by respondents that perceived a decrease in crime locally than respondents that perceived an increase in crime locally (35%). It was also more commonly cited as a source of information locally than nationally, which may partially explain why perceptions of crime locally are generally more positive.
These results provide possible explanations for the difference in perceptions of crime nationally and locally. The media in the form of television, radio and local and tabloid newspapers are frequently cited as influences on perceptions of national crime and these sources are also associated with perceptions of crime increasing. Although these sources also have an effect on local perceptions, personal experience is more commonly cited as a source of information on local crime than it is for crime in the country as a whole, and is more commonly associated with perceptions of crime decreasing.
5 Respondents are asked to cite where their impression of crime has come from and can select more than one source.
Therefore the total number of sources cited will add up to more than 100 per cent.
56

Understanding perceptions of Crime
3.5 NEWSPAPERS AND TELEVISION
As shown above, the media is often a source of people’s impressions of crime, particularly at a national level. The media is usually the only source of information on serious but low volume crimes for the majority of people and is often linked to the misconception that crime is going up when it is actually going down. This was discussed by Pfeiffer et al. (2005) who conducted research on media use and its impact on crime perceptions, sentencing attitudes and crime policy. They linked patterns of television viewing to views of rises in crime in Germany at a time when crime had actually fallen, suggesting this is not a pattern seen only in England and Wales.
According to the 2010/11 BCS, 73 per cent of adults aged 16 or over had read a newspaper in the last three months (data not shown). The question on sources of information analysed above only asked respondents if their perception of crime was influenced by broadsheet or tabloid newspapers. However, the BCS can also be used to relate perceptions of crime to readership of individual newspapers.
6 Analysis of the 2010/11 BCS showed that the style of newspaper was strongly
associated with perceptions of crime, with those who had read more ‘popular’7 newspapers more likely
to perceive that crime had increased nationally (81%) than readers of traditionally ‘broadsheet’8
newspapers (59%; Table 3.03).
Among ‘popular’ newspapers, perceptions of crime were very similar across all newspapers. However, among traditionally ‘broadsheet’ newspapers there was some indication that there was a relationship with individual newspapers (for example, 74% of Daily Telegraph readers thought that crime had gone up in the country as a whole over the last few years, compared with 46% of Guardian readers).
Respondents are also asked how frequently they watch television and whether or not they watch the news on television. Results from the 2009/10 BCS (questions about television watching were not included in the 2010/11 BCS) show that 99 per cent of adults say that they watch television and 91 per cent say that they watch the news on television (data not shown). Adults who said that they watch news on the television were more likely to think crime had gone up in the country as a whole over the past few years than those who did not watch news on the television (81% compared with 75%).
As with newspapers, perceptions of crime were also associated with what channel the news was watched on. Those who watched the news on ITV most often were more likely to think that crime had gone up in the country as a whole over the past few years (88%) compared with those who watched the news on BBC channels (78%). Viewers of Channel 4 and other satellite or cable news channels were the least likely to think crime had risen (69% and 65% respectively; Figure 3.2 and Table 3.04).
6 Respondents are asked which newspaper they have read most often over the past three months. If they have read two or
more equally frequently they are asked which is their preferred newspaper. 7 ‘Popular’ newspapers consist of The Sun, The Daily Mirror, The Daily Mail, The Daily Express and The Daily Star. 8 ‘Broadsheet’ newspapers consist of The Daily Telegraph, The Guardian, The Independent, The Times and The Financial
Times.
57
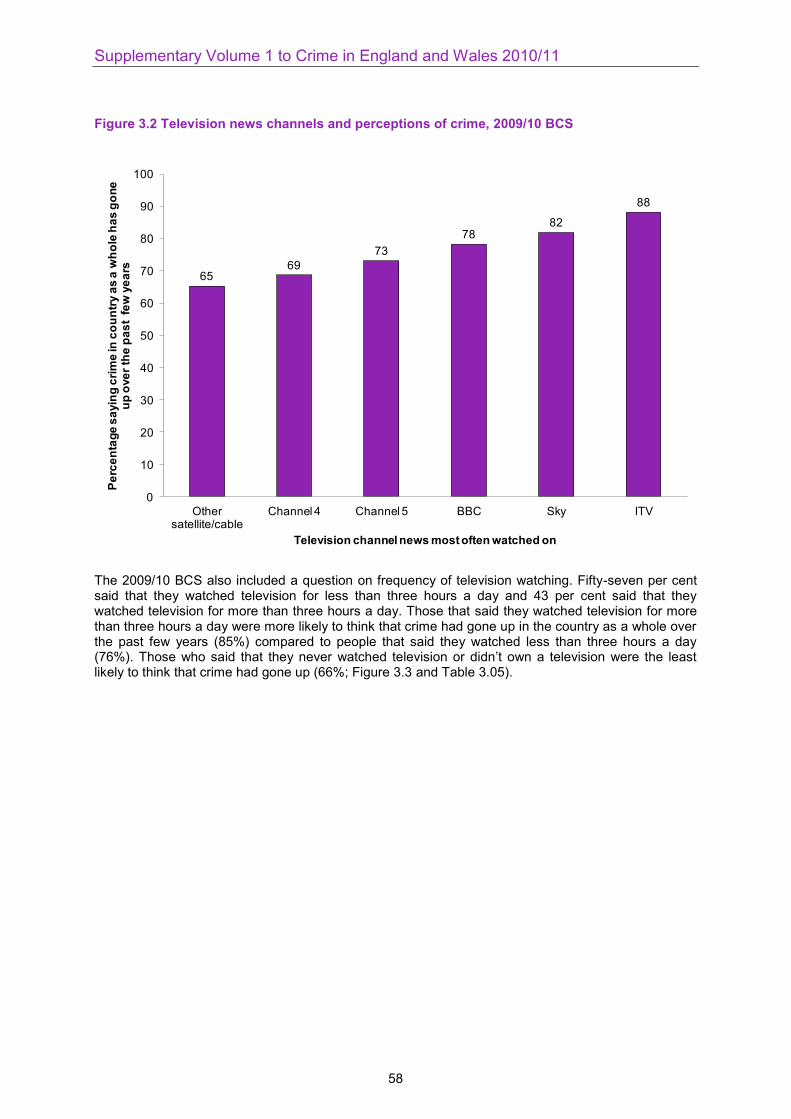
Supplementary Volume 1 to Crime in England and Wales 2010/11
Figure 3.2 Television news channels and perceptions of crime, 2009/10 BCS
6569
73
7882
88
0
10
20
30
40
50
60
70
80
90
100
Other satellite/cable
Channel 4 Channel 5 BBC Sky ITV
Perc
enta
ge s
ayin
g cr
ime
in c
ount
ry a
s a
who
le h
as g
one
up o
ver t
he p
ast
few
yea
rs
Television channel news most often watched on
The 2009/10 BCS also included a question on frequency of television watching. Fifty-seven per cent said that they watched television for less than three hours a day and 43 per cent said that they watched television for more than three hours a day. Those that said they watched television for more than three hours a day were more likely to think that crime had gone up in the country as a whole over the past few years (85%) compared to people that said they watched less than three hours a day (76%). Those who said that they never watched television or didn’t own a television were the least likely to think that crime had gone up (66%; Figure 3.3 and Table 3.05).
58

Understanding perceptions of Crime
Figure 3.3 Amount of television watched and perceptions of crime, 2009/10 BCS
66
72
79
85
0
10
20
30
40
50
60
70
80
90
Never Less than 2 hours a day 2-3 hours a day More than 3 hours a day
Perc
enta
ge s
ayin
g cr
ime
in th
e co
untry
as
a w
hole
has
gon
e up
Number of hours of television watched during the week
These figures appear to reinforce the results above, that media consumption is associated with the perception that crime is increasing in the country as a whole. In addition, there was a relationship between the style of media used by respondents and their perceptions of crime. However, it is not possible to identify the direction or nature of this relationship. While respondents do state that their opinions are influenced by television and newspapers, it is possible that these factors may reflect other social and demographic factors which are also related to perceptions. In addition, it may be the case that rather than a person’s choice of newspaper or television channel influences their perception of crime the reverse is the case, i.e. readers chose media that reflect their own pre-existing views.
9
3.6 OFFICIAL STATISTICS
New questions were added to the 2010/11 BCS to assess levels of trust in official statistics. Respondents are asked about their opinions on official crime statistics and whether they trust those produced by the Home Office. While these generally show trust in Home Office crime statistics to be higher than other surveys have shown (see Bailey et al., 2010, discussed below), it is possible that responses may be influenced by respondents knowing that they are being interviewed on behalf of the Home Office. Social desirability, where the respondent answers in a way that is considered most socially acceptable, may also have an influence, making respondents more likely to say that they have used and trust official statistics. In addition, it is possible that non-responders refuse to take part in the BCS due to distrust in official statistics, although it is not possible to identify the extent to which this is the case. In any of these situations, BCS figures for the level of trust in Home Office statistics may be an overestimate.
Around a third (36%) of respondents said that they take notice of official crime statistics when they are published. Overall levels of trust in crime statistics were mixed, with 38 per cent of adults saying that they trusted that crime figures published by the Home Office gave a true picture of what is happening
9 The relationship between newspaper readership and views was explored in a study by Duffy and Rowden (2005).
59
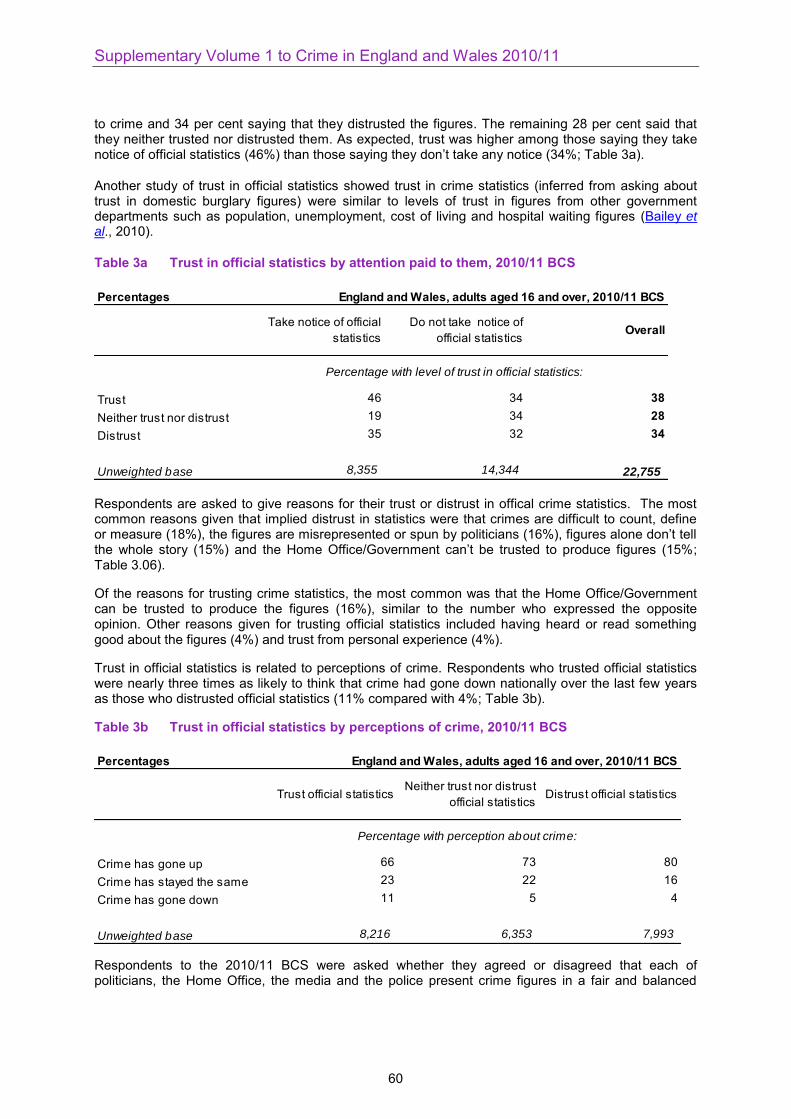
Supplementary Volume 1 to Crime in England and Wales 2010/11
to crime and 34 per cent saying that they distrusted the figures. The remaining 28 per cent said that they neither trusted nor distrusted them. As expected, trust was higher among those saying they take notice of official statistics (46%) than those saying they don’t take any notice (34%; Table 3a).
Another study of trust in official statistics showed trust in crime statistics (inferred from asking about trust in domestic burglary figures) were similar to levels of trust in figures from other government departments such as population, unemployment, cost of living and hospital waiting figures (Bailey et al., 2010).
Table 3a Trust in official statistics by attention paid to them, 2010/11 BCS
Percentages England and Wales, adults aged 16 and over, 2010/11 BCS
Take notice of official
statistics
Do not take notice of
official statisticsOverall
Trust 46 34 38Neither trust nor distrust 19 34 28Distrust 35 32 34
Unweighted base 8,355 14,344 22,755
Percentage with level of trust in official statistics:
Respondents are asked to give reasons for their trust or distrust in offical crime statistics. The most common reasons given that implied distrust in statistics were that crimes are difficult to count, define or measure (18%), the figures are misrepresented or spun by politicians (16%), figures alone don’t tell the whole story (15%) and the Home Office/Government can’t be trusted to produce figures (15%; Table 3.06).
Of the reasons for trusting crime statistics, the most common was that the Home Office/Government can be trusted to produce the figures (16%), similar to the number who expressed the opposite opinion. Other reasons given for trusting official statistics included having heard or read something good about the figures (4%) and trust from personal experience (4%).
Trust in official statistics is related to perceptions of crime. Respondents who trusted official statistics were nearly three times as likely to think that crime had gone down nationally over the last few years as those who distrusted official statistics (11% compared with 4%; Table 3b).
Table 3b Trust in official statistics by perceptions of crime, 2010/11 BCS
Percentages England and Wales, adults aged 16 and over, 2010/11 BCS
Trust official statisticsNeither trust nor distrust
official statisticsDistrust official statistics
Crime has gone up 66 73 80
Crime has stayed the same 23 22 16
Crime has gone down 11 5 4
Unweighted base 8,216 6,353 7,993
Percentage with perception about crime:
Respondents to the 2010/11 BCS were asked whether they agreed or disagreed that each of politicians, the Home Office, the media and the police present crime figures in a fair and balanced
60
Understanding perceptions of Crime
way. According to the 2010/11 BCS, respondents were most likely to agree that this was true of the police (47%) and least likely to agree that this was true of politicians (14%; Table 3.07).
When looking at the difference between those who agreed or disagreed with each statement, it appears that the police are most trusted (24 percentage points more agreeing than disagreeing) and politicians are least trusted (46 percentage points less agreeing than disagreeing; Table 3.07). These findings are in line with other research on public confidence in official statistics which asked respondents to rate how much they trusted figures from various institutions on a scale from zero to ten (where zero meant do not trust at all and ten meant trust completely). NHS figures were the most highly trusted, with a mean score of 7.14. Police figures had a mean score of 6.33 and were more trusted than figures produced by the civil service (5.48) and government (4.40; Bailey et al., 2010).
3.7 CRIME MAPS
From January 2011, all police forces have been required to supply street-level crime data to a central portal (http://www.police.uk). These data are applied to maps which act as another source of information for the public to form opinions about crime in their local area. Prior to this, forces published this information on their own websites at neighbourhood level, typically wards, and national crime maps were also available through a central portal hosted by the National Policing Improvement Agency (http://www.npia.police.uk/).
10 Therefore, in the 2010/11 BCS where interviews were
conducted between April 2010 and March 2011, the majority of respondents answering questions about crime maps would have been referring to this older form of information. Figures for overall awareness and use of online crime maps have been published previously (Chaplin et al., 2011) and showed that according to the 2010/11 BCS, 15 per cent of people were aware of crime maps and four per cent had looked at or used crime maps in the last 12 months.
Analysis of the 2010/11 BCS shows that use of crime maps was related to perceptions of the crime rate in the local area. Overall, respondents who had looked at crime maps in the last 12 months were more likely to perceive that crime in their local area was below average than those who hadn’t (59% compared with 49%).
In this context, one factor that is important to consider is how respondent perceptions relate to objective measures of crime locally and whether these are more closely aligned as a result of using crime maps. To judge this, respondent perceptions were classified as either being ‘more closely aligned’ or ‘less closely aligned’ according to the model below:
Low level of crime perceived in the local area
1
High level of crime perceived in the local area
1
Respondent lives in a relatively low-crime area (Area ranked within the bottom half of the Crime domain of the English Indices of Deprivation
2)
More closely aligned Less closely aligned
Respondent lives in a relatively high-crime area (Area ranked within the top half of the Crime domain of the English Indices of Deprivation
2)
Less closely aligned More closely aligned
1. Respondents are classified as perceiving a low level of crime in the local area if they said the local crime rate was ‘lower than average’. Respondents are classified as perceiving a high level of crime in the local area if they said the local crime rate was ‘about average’ or ‘higher than average’. See Section 3.3 for explanation.
2. Crime levels measured by the Crime domain of the English Indices of Deprivation (2010). ‘Relatively low-crime’ and ‘relatively high-crime’ areas include those ranked within the bottom 50% and top 50% of the Crime domain respectively.
10 Neither wards nor street-level crime data are necessarily coterminous with ONS Output Area boundaries used by the English
Indices of Deprivation nor the respondent’s definition of ‘local area’ or ‘within 15-minutes walk of here’ used in the BCS.
61
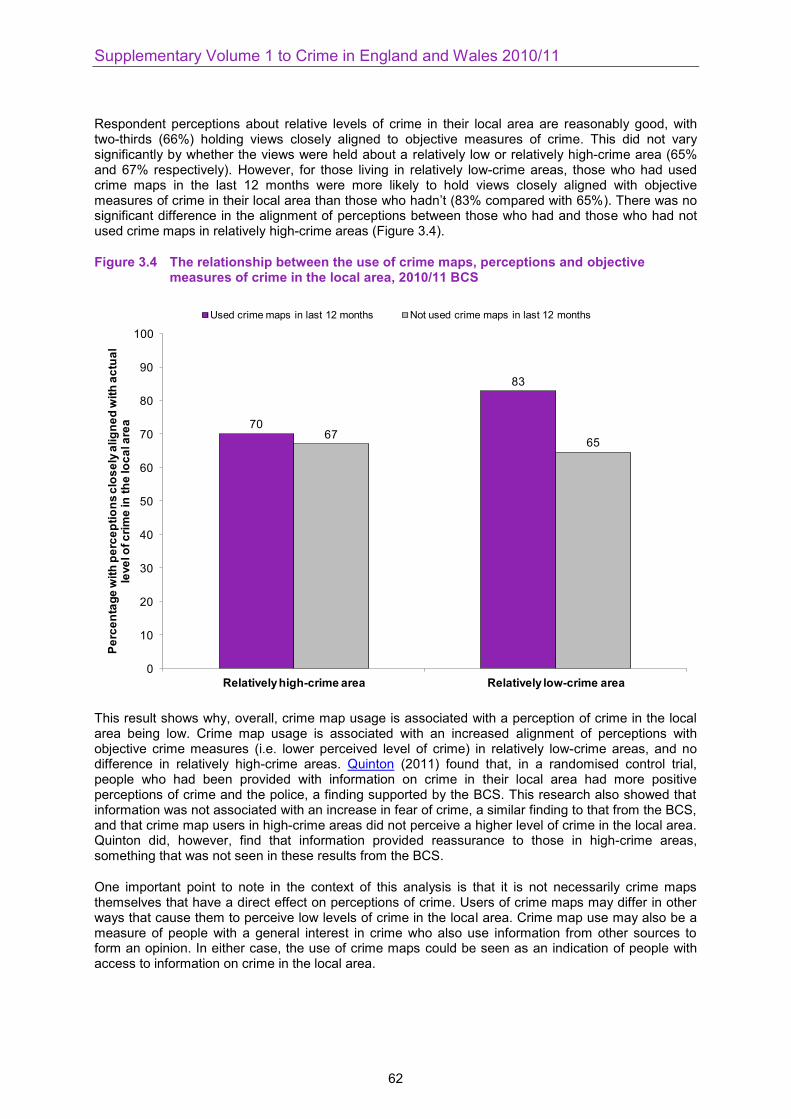
Supplementary Volume 1 to Crime in England and Wales 2010/11
Respondent perceptions about relative levels of crime in their local area are reasonably good, with two-thirds (66%) holding views closely aligned to objective measures of crime. This did not vary significantly by whether the views were held about a relatively low or relatively high-crime area (65% and 67% respectively). However, for those living in relatively low-crime areas, those who had used crime maps in the last 12 months were more likely to hold views closely aligned with objective measures of crime in their local area than those who hadn’t (83% compared with 65%). There was no significant difference in the alignment of perceptions between those who had and those who had not used crime maps in relatively high-crime areas (Figure 3.4).
Figure 3.4 The relationship between the use of crime maps, perceptions and objective measures of crime in the local area, 2010/11 BCS
70
83
6765
0
10
20
30
40
50
60
70
80
90
100
Relatively high-crime area Relatively low-crime area
Perc
enta
ge w
ith p
erce
ptio
ns c
lose
ly a
ligne
d w
ith a
ctua
l le
vel o
f crim
e in
the
loca
l are
a
Used crime maps in last 12 months Not used crime maps in last 12 months
This result shows why, overall, crime map usage is associated with a perception of crime in the local area being low. Crime map usage is associated with an increased alignment of perceptions with objective crime measures (i.e. lower perceived level of crime) in relatively low-crime areas, and no difference in relatively high-crime areas. Quinton (2011) found that, in a randomised control trial, people who had been provided with information on crime in their local area had more positive perceptions of crime and the police, a finding supported by the BCS. This research also showed that information was not associated with an increase in fear of crime, a similar finding to that from the BCS, and that crime map users in high-crime areas did not perceive a higher level of crime in the local area. Quinton did, however, find that information provided reassurance to those in high-crime areas, something that was not seen in these results from the BCS.
One important point to note in the context of this analysis is that it is not necessarily crime maps themselves that have a direct effect on perceptions of crime. Users of crime maps may differ in other ways that cause them to perceive low levels of crime in the local area. Crime map use may also be a measure of people with a general interest in crime who also use information from other sources to form an opinion. In either case, the use of crime maps could be seen as an indication of people with access to information on crime in the local area.
62
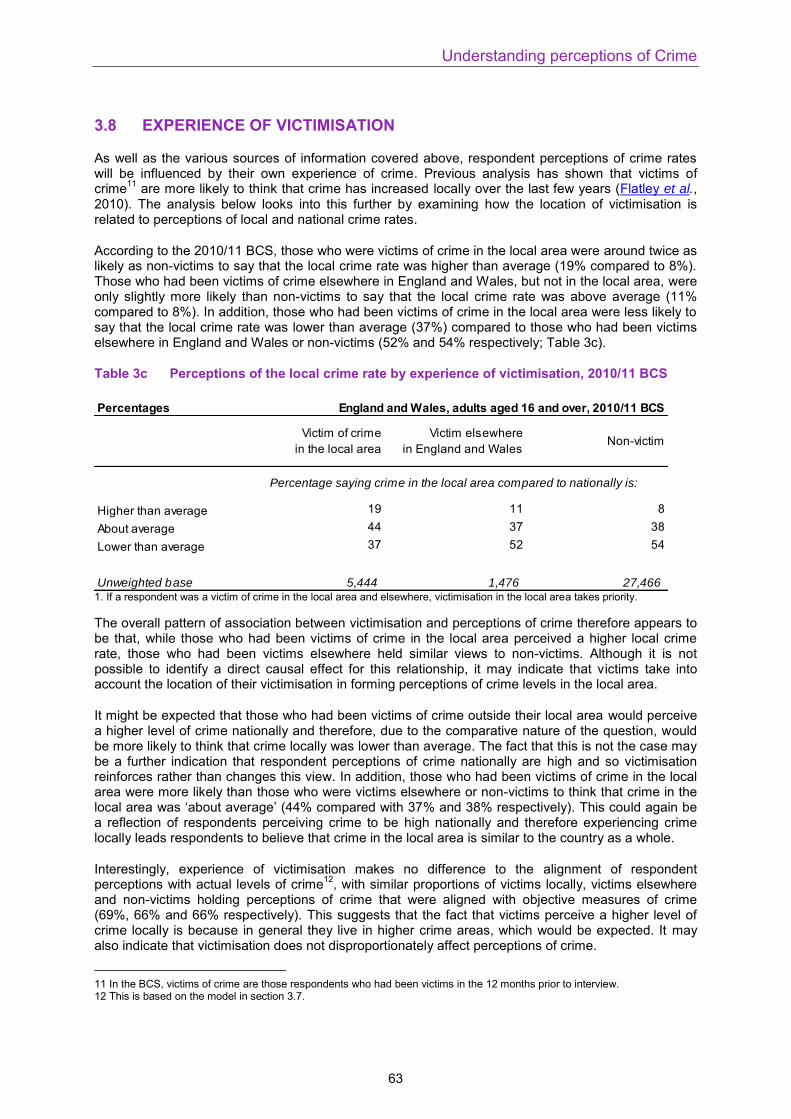
Understanding perceptions of Crime
3.8 EXPERIENCE OF VICTIMISATION
As well as the various sources of information covered above, respondent perceptions of crime rates will be influenced by their own experience of crime. Previous analysis has shown that victims of crime
11 are more likely to think that crime has increased locally over the last few years (Flatley et al.,
2010). The analysis below looks into this further by examining how the location of victimisation is related to perceptions of local and national crime rates.
According to the 2010/11 BCS, those who were victims of crime in the local area were around twice as likely as non-victims to say that the local crime rate was higher than average (19% compared to 8%). Those who had been victims of crime elsewhere in England and Wales, but not in the local area, were only slightly more likely than non-victims to say that the local crime rate was above average (11% compared to 8%). In addition, those who had been victims of crime in the local area were less likely to say that the local crime rate was lower than average (37%) compared to those who had been victims elsewhere in England and Wales or non-victims (52% and 54% respectively; Table 3c).
Table 3c Perceptions of the local crime rate by experience of victimisation, 2010/11 BCS
Percentages England and Wales, adults aged 16 and over, 2010/11 BCS
Victim of crime
in the local area
Victim elsewhere
in England and WalesNon-victim
Higher than average 19 11 8
About average 44 37 38
Lower than average 37 52 54
Unweighted base 5,444 1,476 27,466
Percentage saying crime in the local area compared to nationally is:
1. If a respondent was a victim of crime in the local area and elsewhere, victimisation in the local area takes priority.
The overall pattern of association between victimisation and perceptions of crime therefore appears to be that, while those who had been victims of crime in the local area perceived a higher local crime rate, those who had been victims elsewhere held similar views to non-victims. Although it is not possible to identify a direct causal effect for this relationship, it may indicate that victims take into account the location of their victimisation in forming perceptions of crime levels in the local area.
It might be expected that those who had been victims of crime outside their local area would perceive a higher level of crime nationally and therefore, due to the comparative nature of the question, would be more likely to think that crime locally was lower than average. The fact that this is not the case may be a further indication that respondent perceptions of crime nationally are high and so victimisation reinforces rather than changes this view. In addition, those who had been victims of crime in the local area were more likely than those who were victims elsewhere or non-victims to think that crime in the local area was ‘about average’ (44% compared with 37% and 38% respectively). This could again be a reflection of respondents perceiving crime to be high nationally and therefore experiencing crime locally leads respondents to believe that crime in the local area is similar to the country as a whole.
Interestingly, experience of victimisation makes no difference to the alignment of respondent perceptions with actual levels of crime
12, with similar proportions of victims locally, victims elsewhere
and non-victims holding perceptions of crime that were aligned with objective measures of crime (69%, 66% and 66% respectively). This suggests that the fact that victims perceive a higher level of crime locally is because in general they live in higher crime areas, which would be expected. It may also indicate that victimisation does not disproportionately affect perceptions of crime.
11 In the BCS, victims of crime are those respondents who had been victims in the 12 months prior to interview. 12 This is based on the model in section 3.7.
63

Supplementary Volume 1 to Crime in England and Wales 2010/11
3.9 LOCAL ENVIRONMENT
As well as crime levels, BCS respondents and interviewers are also asked about other features of the local area. These include questions on the local community and problems related to anti-social behaviour. Although it is not possible to check whether conditions in the local environment lead directly to crime, the BCS can be used to examine whether respondents’ perceptions of crime are related to conditions in the local area.
BCS interviewers provide observational data on the level of physical disorder in the immediate area around respondents’ homes. This is then classified as a ‘high’ or ‘low’ level of physical disorder.
13
Analysis of the 2010/11 BCS shows that the level of physical disorder in the local area is closely related to perceptions of crime. Overall, respondents living in areas of high physical disorder were more likely to perceive crime in the local area to be ‘higher than average’ or ‘about average’ than those in an area of low physical disorder (73% compared with 48%). Although this effect can be seen across both high and low-crime areas, the difference in perceptions by the level of physical disorder in the local area was generally greater in low-crime areas (Figure 3.5).
Figure 3.5 Perceptions of crime in the local area by level of physical disorder in respondent’s immediate area by Crime domain of the English Indices of Deprivation, 2010/11 BCS
78
68 67
59
53
45
39
33
26
21
80 7977
74 73
53
71
56
50
57
0
10
20
30
40
50
60
70
80
90
100
10% highest crime
2 3 4 5 6 7 8 9 10% lowest crime
Perc
enta
ge s
ayin
g th
at c
rime
in th
e lo
cal a
rea
is 'h
ighe
r th
an a
vera
ge' o
r 'ab
out a
vera
ge'
Crime decile within the English Indices of Deprivation
Low physical disorder High physical disorder
Respondents to the BCS were also asked about other problems in their local area related to low-level crime and anti-social behaviour.
14 For each of the individual issues asked about, respondents who
said that it was a problem in their local area were more likely to perceive that there was a high level of crime in the local area than those who said that it was not a problem (Figure 3.6). In addition, while the majority of respondents (63%) reported either no problems or only one problem in the local area,
13 See the User Guide for details of how this is classified. 14 Problems asked about are: noisy neighbours or loud parties, teenagers hanging around on the streets, rubbish or litter lying
around, vandalism, graffiti and other deliberate damage to property or vehicles, people using or dealing drugs, people being drunk or rowdy in public places and abandoned or burnt-out cars.
64
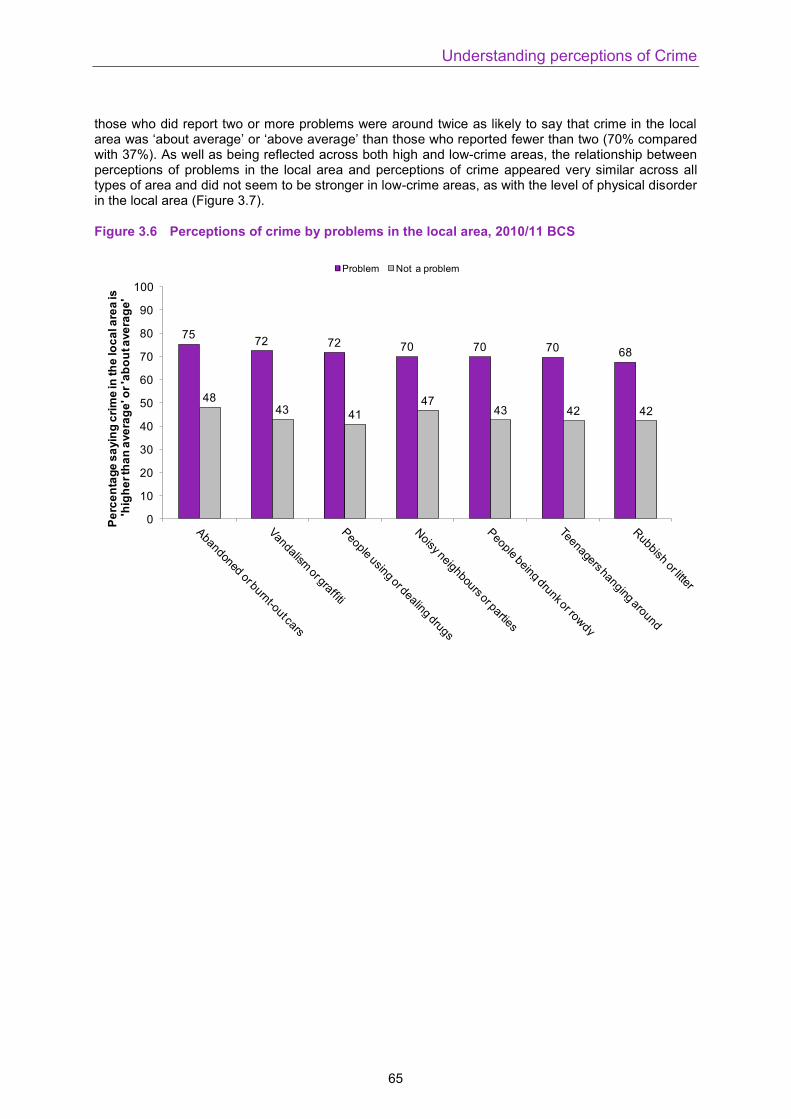
Understanding perceptions of Crime
those who did report two or more problems were around twice as likely to say that crime in the local area was ‘about average’ or ‘above average’ than those who reported fewer than two (70% compared with 37%). As well as being reflected across both high and low-crime areas, the relationship between perceptions of problems in the local area and perceptions of crime appeared very similar across all types of area and did not seem to be stronger in low-crime areas, as with the level of physical disorder in the local area (Figure 3.7).
Figure 3.6 Perceptions of crime by problems in the local area, 2010/11 BCS
7572 72 70 70 70 68
4843 41
4743 42 42
0
10
20
30
40
50
60
70
80
90
100
Perc
enta
ge s
ayin
g cr
ime
in th
e lo
cal a
rea
is'h
ighe
r tha
n av
erag
e' o
r 'ab
out a
vera
ge'
Problem Not a problem
65

Supplementary Volume 1 to Crime in England and Wales 2010/11
Figure 3.7 Perceptions of crime in the local area by number of problems in the local area by Crime domain of the English Indices of Deprivation, 2010/11 BCS
69
5855
51
43
37
32
26
2117
84
7880
7270
6158
55
48
40
0
10
20
30
40
50
60
70
80
90
100
10% highest crime
2 3 4 5 6 7 8 9 10% lowest crime
Perc
enta
ge s
ayin
g th
at c
rime
in th
e lo
cal a
rea
is 'h
ighe
r th
an a
vera
ge' o
r 'ab
out a
vera
ge'
Crime decile of the English Indices of Deprivation
0 or 1 problem 2 or more problems
Both of these findings suggest that perceptions of crime levels are strongly related to environmental conditions in the local area. This could be because respondents in areas of high physical disorder or with other problems simply perceive more crime, or that where people perceive problems in the local area, they may view these as crimes. It may also be that respondent perceptions are in line with crime as measured by the English Indices of Deprivation but that even in areas where crime is relatively low there are small pockets of high physical disorder and other problems which are also associated with high levels of crime. In either case, the strong association between perceptions of crime and the local environment across both high and low-crime areas indicates that these conditions are highly localised and that across all parts of England and Wales there are small areas where a poor local environment is associated with people perceiving a high level of crime.
One issue with this analysis is that these relationships do not necessarily imply causality. While it could be hypothesised that a person’s perception of their local environment influences their perceptions of crime levels, they may both reflect the same thing, which is a respondent’s general feeling about the local area. Respondents who have a general negative feeling about their local area are likely to answer negatively across several questions, and therefore may describe crime in the local area as high and also say that there are a number of problems in the local area. However, the measure of physical disorder around the respondent’s property is independently measured by a BCS interviewer and does show an association with perceptions of crime, suggesting there is more to these relationships than a general discontent among some respondents.
3.10 CONCLUSION
For the crime types and population it covers, the BCS has shown that crime in England and Wales has fallen considerably since 1995, a trend which is largely backed up by recorded crime statistics. However, the BCS has consistently shown that the overall perception is that crime is increasing in the country as a whole (Chaplin et al., 2011). In contrast to this, respondent perceptions of relative levels
66
Understanding perceptions of Crime
of crime in their local area vary in close alignment with crime as measured by statistical sources, such as the Crime domain of the English Indices of Deprivation. Differences in the sources of information used by respondents to obtain information on both the national and local crime rate may partly explain this discrepancy.
The perception that the crime rate in the local area had gone down over the last few years was associated with respondents’ own personal experiences, including experience of victimisation and other conditions present in the local environment. In contrast, the prevailing view about the national crime rate, that it has increased, was associated with the media usage and increased media consumption, particularly of tabloid media.
The use of other sources of information was also related to perceptions. The use of and trust in official statistics was associated with the view that crime nationally had decreased. The use of crime maps was associated with closer alignment of perceptions of crime in the local area with objective measures of crime. These sources were also identified by respondents as generally reliable. In contrast, respondents were less likely to agree that the media and politicians present crime figures in a fair and balanced way.
It may be that in fact personal experience and access to information are the key reasons for differences in the perceived level of crime locally and nationally. Respondents’ personal experiences reflect the level of crime reported in official statistics and sources of information, such as crime maps from the police, which are generally perceived to be reliable. However, by its nature, personal experience is most closely related with perceptions of the local area. Nationally, the main source of information for respondents is the media, associated with a higher perceived crime rate, and both newspapers and television news have a far larger audience than official statistics or crime maps. Crime is naturally newsworthy, particularly serious crime. The most serious types of crime are however, generally low in volume, leading to an imbalance in the level of news coverage and their prevalence in society. This is supported by results from the 2009/10 BCS which showed that the greatest discrepancies between national and local perceptions of crime were for the more serious types but also relatively low volume crimes: gun and knife crime (Flatley et al., 2010). It is understandably difficult for the public to distinguish between the amount of crime reported on in the media and the amount of crime there is nationally. Therefore, despite viewing the media as an unreliable source of information, for many respondents its use is associated with increased perceptions of crime nationally as it is their only source of information.
It is also important to consider that crimes are difficult to measure and define. Crime as defined in official statistics may not reflect respondent definitions of crime. The results above show that respondents who perceive problems related to anti-social behaviour in their local area, which may not be included in the overall BCS count of crime, are more likely to perceive a high level of crime in the local area. In addition, the 2009/10 BCS showed that bank and credit card fraud was the crime type most likely to be perceived as increasing locally and 90 per cent of respondents thought it was increasing nationally (Flatley et al., 2010). This crime type, however, is not included in the overall BCS count of crime. These possible differences in definitions of crime may have an effect on the difference between perceived and measured levels of crime.
67

Table 3.01 Sources of perceptions of changes in crime in country as a whole over the past few years
Percentages England and Wales, adults aged 16 and over, 2010/11 BCS
Source influenced perception of change in national crime level
Source influenced perception that
crime has gone up
Source influenced perception that
crime has stayed the same
Source influenced perception that
crime has gone down
Statistically significant difference
in influence on perception that
crime has gone up or down
News programmes on TV/radio 59 62 49 50 **
Local newspapers 32 35 27 23 **
Tabloid newspapers 30 35 15 16 **
Word of mouth/information from other people 28 29 27 20 **
Personal experience 24 20 38 25 **
Broadsheet newspapers 22 21 20 31 **
TV documentaries 21 23 12 15 **
Relatives' and/or friends' experiences 18 18 21 13 **
Radio programmes 13 13 13 16 **
Internet/world-wide-web 12 12 12 16 **
Some other source 1 1 1 3 **
Unweighted base 17,420 13,166 3,229 1,025
Table 3.02 Sources of perceptions of changes in crime in local area over the past few years
Percentages England and Wales, adults aged 16 and over, 2010/11 BCS
Source influenced perception of change in local crime level
Source influenced perception that
crime has gone up
Source influenced perception that
crime has stayed the same
Source influenced perception that
crime has gone down
Statistically significant difference
in influence on perception that
crime has gone up or down
Local newspapers 47 54 43 41 **
Word of mouth/information from other people 44 49 42 40 **
Personal experience 41 35 45 44 **
News programmes on TV/radio 26 29 23 23 **
Relatives' and/or friends' experiences 24 30 22 18 **
Tabloid newspapers 8 12 6 6 **
Broadsheet newspapers 8 10 6 8
TV documentaries 7 10 5 6 **
Radio programmes 7 9 6 8
Internet/world-wide-web 5 6 5 5
Information from the police1 0 0 1 1 **
Some other source 1 1 1 3 **
Unweighted base 16,905 6,287 9,094 1,524
1. Question on information about the police was only asked about perceptions of crime in the local area.
68
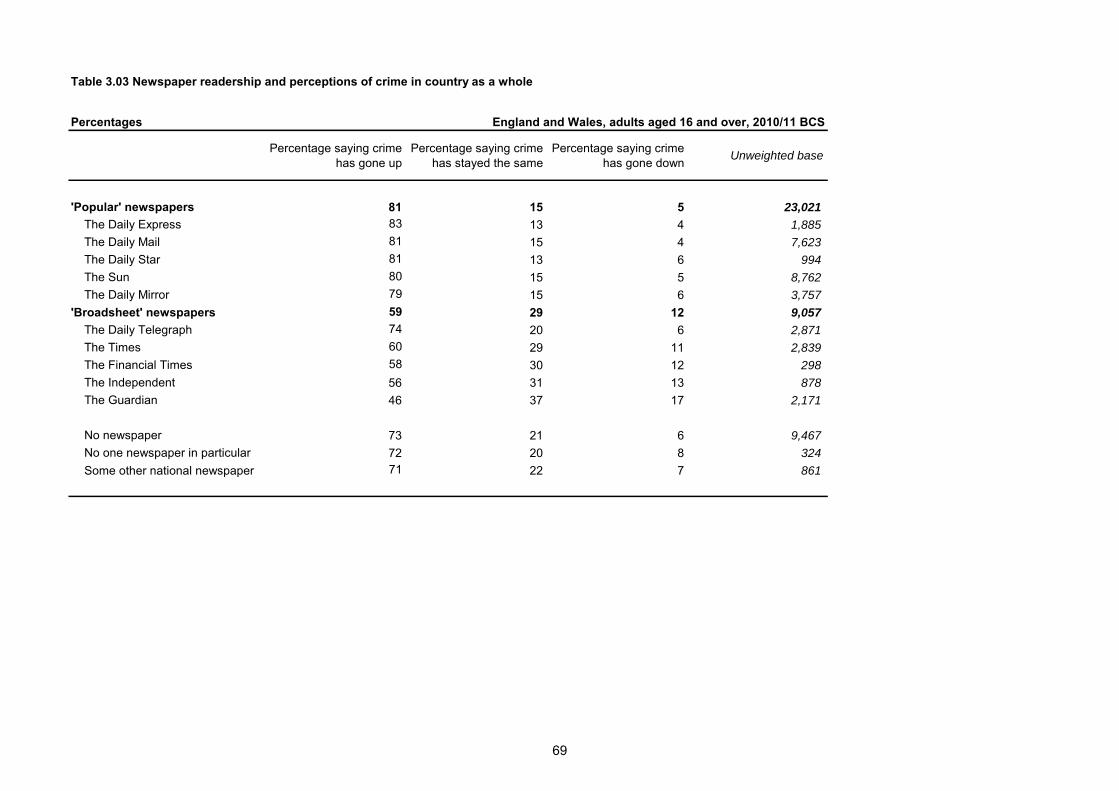
Table 3.03 Newspaper readership and perceptions of crime in country as a whole
Percentages England and Wales, adults aged 16 and over, 2010/11 BCS
Percentage saying crime
has gone up
Percentage saying crime
has stayed the same
Percentage saying crime
has gone downUnweighted base
'Popular' newspapers 81 15 5 23,021
The Daily Express 83 13 4 1,885
The Daily Mail 81 15 4 7,623
The Daily Star 81 13 6 994
The Sun 80 15 5 8,762
The Daily Mirror 79 15 6 3,757
'Broadsheet' newspapers 59 29 12 9,057
The Daily Telegraph 74 20 6 2,871
The Times 60 29 11 2,839
The Financial Times 58 30 12 298
The Independent 56 31 13 878
The Guardian 46 37 17 2,171
No newspaper 73 21 6 9,467
No one newspaper in particular 72 20 8 324
Some other national newspaper 71 22 7 861
69
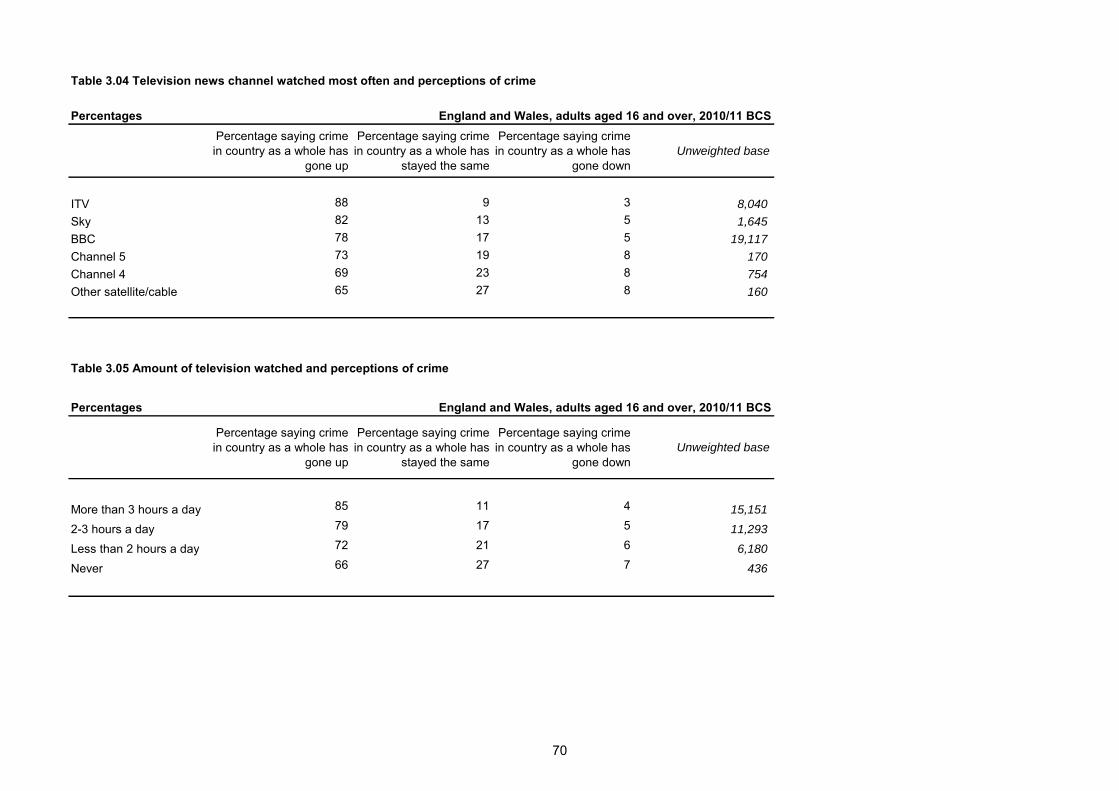
Table 3.04 Television news channel watched most often and perceptions of crime
Percentages England and Wales, adults aged 16 and over, 2010/11 BCSPercentage saying crime
in country as a whole has
gone up
Percentage saying crime
in country as a whole has
stayed the same
Percentage saying crime
in country as a whole has
gone down
Unweighted base
ITV 88 9 3 8,040
Sky 82 13 5 1,645
BBC 78 17 5 19,117
Channel 5 73 19 8 170
Channel 4 69 23 8 754
Other satellite/cable 65 27 8 160
Table 3.05 Amount of television watched and perceptions of crime
Percentages England and Wales, adults aged 16 and over, 2010/11 BCS
Percentage saying crime
in country as a whole has
gone up
Percentage saying crime
in country as a whole has
stayed the same
Percentage saying crime
in country as a whole has
gone down
Unweighted base
More than 3 hours a day 85 11 4 15,151
2-3 hours a day 79 17 5 11,293
Less than 2 hours a day 72 21 6 6,180
Never 66 27 7 436
70
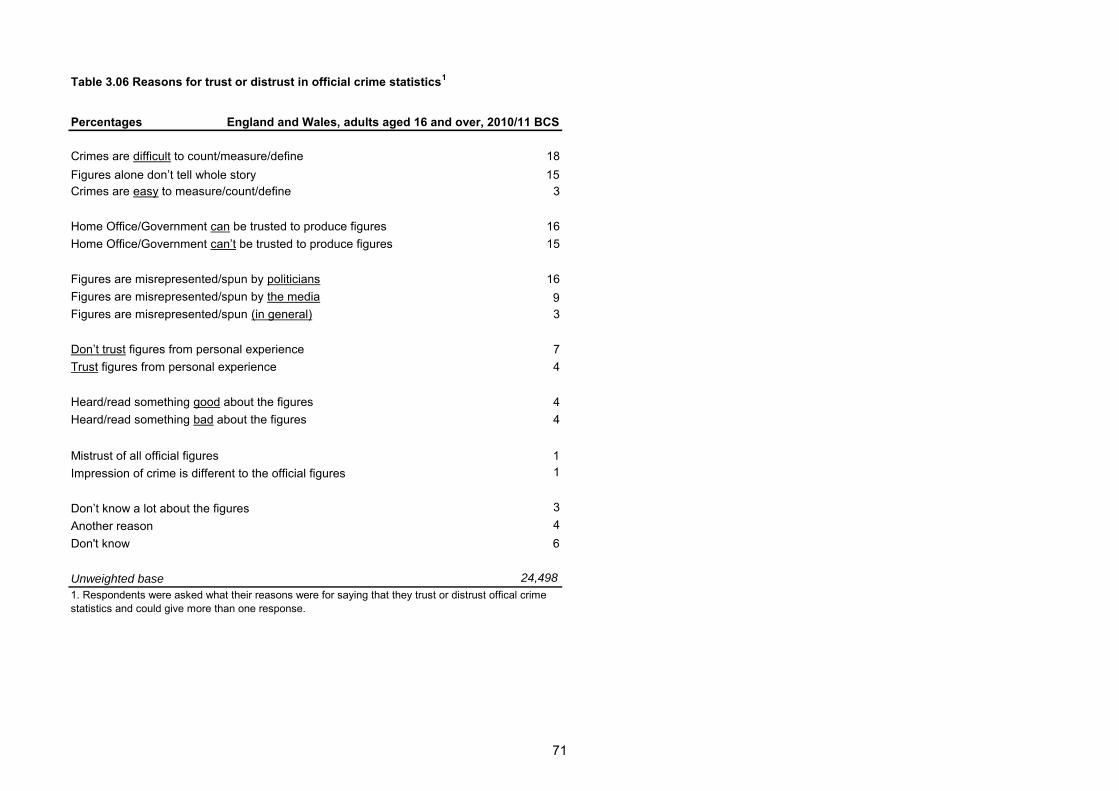
Table 3.06 Reasons for trust or distrust in official crime statistics1
Percentages England and Wales, adults aged 16 and over, 2010/11 BCS
Crimes are difficult to count/measure/define 18
Figures alone don’t tell whole story 15
Crimes are easy to measure/count/define 3
Home Office/Government can be trusted to produce figures 16
Home Office/Government can’t be trusted to produce figures 15
Figures are misrepresented/spun by politicians 16
Figures are misrepresented/spun by the media 9
Figures are misrepresented/spun (in general) 3
Don’t trust figures from personal experience 7
Trust figures from personal experience 4
Heard/read something good about the figures 4
Heard/read something bad about the figures 4
Mistrust of all official figures 1
Impression of crime is different to the official figures 1
Don’t know a lot about the figures 3
Another reason 4
Don't know 6
Unweighted base 24,498
1. Respondents were asked what their reasons were for saying that they trust or distrust offical crime
statistics and could give more than one response.
71

Table 3.07 Attitudes towards presentation of crime statistics by politicians, the Home Office, the media and the police
Percentages England and Wales, adults aged 16 and over, 2010/11 BCS
Agree No opinion Disagree
Difference between proportion agreeing
and disagreeingUnweighted base
The police present crime figures in a fair and balanced way 47 30 23 24 22,794
The Home Office present crime figures in a fair and balanced way 37 35 28 9 22,679
The media present crime figures in a fair and balanced way 22 24 54 -32 23,010
Politicians present crime figures in a fair and balanced way 14 27 60 -46 22,889
1. The order of these questions was randomised for each respondent.
72
Bibliography
Where annual updates are provided, the most recent are referenced here. Bailey, R., Rofique, J. and Humphrey, A. (2010). Public confidence in Official Statistics 2009. London: National Centre for Social Research. http://www.natcen.ac.uk/media/665121/public%20confidence%20in%20official%20statistics%202009.doc Chaplin, R., Flatley, J. and Smith, K. (Eds.) (2011). Crime in England and Wales 2010/11. Home Office Statistical Bulletin 10/11 London: Home Office. http://www.homeoffice.gov.uk/publications/science-research-statistics/research-statistics/crime-research/hosb1011/ Duffy, B. and Rowden, L. (2005). You are what you read? London: MORI Social Research Institute. http://www.ipsos-mori.com/researchpublications/publications/240/You-are-what-you-read.aspx Flatley, J., Kershaw, C., Smith, K., Chaplin, R. and Moon, D. (Eds.) (2010). Crime in England and Wales 2009/10. Home Office Statistical Bulletin 12/10 London: Home Office. http://www.homeoffice.gov.uk/rds/pdfs10/hosb1210.pdf Home Office (2011) User Guide to Home Office Crime Statistics (2011). London: Home Office. http://www.homeoffice.gov.uk/publications/science-research-statistics/research-statistics/crime-research/user-guide-crime-statistics/ Moon, D. (Ed), Walker, A. (Ed), Murphy, R., Flatley, J., Parfrement-Hopkins, J. and Hall, P. (2009). Perceptions of crime and anti-social behaviour: Supplementary Volume to Crime in England and Wales 2008/09. Home Office Statistical Bulletin 17/09. London: Home Office. http://www.homeoffice.gov.uk/rds/pdfs09/hosb1709.pdf Moore, L., Phillips, A. and Kostadintcheva, K. (2010). Community Payback and local criminal justice engagement initiatives: public perceptions and awareness. Ministry of Justice Research Summary 3/10. http://www.justice.gov.uk/publications/docs/community-payback-research.pdf Nicholas, S. (Ed), Flatley, J. (Ed), Hoare, J., Patterson, A., Southcott, C., Moley, S. and Jansson, K. (2008). Circumstances of crime, Neighbourhood Watch membership and perceptions of policing: Supplementary Volume 3 to Crime in England and Wales 2006/07. Home Office Statistical Bulletin 06/08. London: Home Office. http://webarchive.nationalarchives.gov.uk/20110218135832/rds.homeoffice.gov.uk/rds/pdfs08/hosb0608.pdf Pfeiffer, C., Windzio, M. and Kleimann, M. (2005). Media Use and its Impacts on Crime Perceptions, Sentencing Attitudes and Crime Policy. European Journal of Criminology, Volume 2 (3): 259-285. Quinton, P. (2011). The impact of information about crime and policing on public perceptions. London: National Policing Improvement Agency. http://www.npia.police.uk/en/docs/Full_Report_-_Crime_and_Policing_Information.pdf
73

Scribbins, M. (Ed), Flatley, J. (Ed), Parfrement-Hopkins, J. and Hall, P. (2010). Public perceptions of policing, engagement with police and victimisation: Findings from the 2009/10 British Crime Survey (Supplementary Volume 1 to Crime in England and Wales 2009/10). Home Office Statistical Bulletin 19/10. London: Home Office. http://www.homeoffice.gov.uk/publications/science-research-statistics/research-statistics/police-research/hosb1910/?view=Standard&pubID=864236 Scribbins, M. (Ed), Flatley, J. (Ed), Hoare, J., Parfrement-Hopkins, J., Britton, A. and Hall, P. (2011). Children’s experience and attitudes towards the police, personal safety and public spaces: Findings from the 2009/10 British Crime Survey interviews with children aged 10 to 15 (Supplementary Volume 3 to Crime in England and Wales 2009/10). Home Office Statistical Bulletin 08/11. London: Home Office. http://www.homeoffice.gov.uk/publications/science-research-statistics/research-statistics/crime-research/hosb0811/hosb0811?view=Binary Thorpe, K. (2009). Public perceptions of the police and local partners – results from the BCS year ending September 2008. London: Home Office. http://www.homeoffice.gov.uk/rds/pdfs09/hosb0109supp.pdf Walker, A., Flatley, J., Kershaw, C. and Moon, D. (2009). Crime in England and Wales 2008/09. Home Office Statistical Bulletin 11/09. London: Home Office. http://www.homeoffice.gov.uk/rds/pdfs09/hosb1109vol1.pdf Copies of recent Home Office publications based on the British Crime Survey, including reports that report jointly on the BCS and police recorded crime, can be downloaded from: http://www.homeoffice.gov.uk/publications/science-research-statistics/research-statistics/
74