perception and attitude towards the mutual fund investors...
TRANSCRIPT

CHAPTER IV
4.1 INTRODUCTION
4.2 RELIABILITY ANALYSIS
4.3 INVESTORS PERCEPTION OF MUTUAL FUND INVESTMENT
4.4 INVESTORS ATTITUDES OF MUTUAL FUND INVESTMENT
4.5 REASON FOR PREFERRING MUTUAL FUND INVESTMENT
4.6 SOCIO-ECONOMIC CONDITION OF MUTUAL FUND INVESTMENT
4.7 MOTIVATION FACTOR OF MUTUAL FUND INVESTMENT
4.8 PURPOSE OF MUTUAL FUND INVESTMENT
4.9 AWARENESS OF THE SCHEMES OF MUTUAL FUND INVESTMENT
PERCEPTION AND ATTITUDE TOWARDS THE MUTUAL
FUND INVESTORS IN NAMAKKAL DISTRICT
Please purchase PDF Split-Merge on www.verypdf.com to remove this watermark.

89
CHAPTER IV
PERCEPTION AND ATTITUDE TOWARDS MUTUAL FUND
INVESTORS IN NAMAKKAL DISTRICT
4.1 INTRODUCTION
The Fourth chapter of the present study gives the analysis of perceptions
and attitude of the Mutual Fund Investors in the study area. Before perception, the
investors must have a knowledge of sources of Mutual fund Investment, various
schemes of mutual fund investment, various schemes of mutual funds, purposes
and facilities. This chapter analyses the perception of mutual fund investors by
using data related to the Gender of the Respondent, their Marital Status, Age,
Educational Qualification, Occupations and Income.
The Second part of this chapter analyses the attitude of the Mutual Fund
Investors. The Garrett Ranking Technique was employed to analyze the preference
given by the mutual fund Investors towards the mutual fund investment. After that,
the inter-correlation and multiple regression model have been fitted to analyse the
determinants of mutual fund Investors to invest their fund in the mutual funds.
The association between the economic conditions and the various factors related to
the mutual fund Investors has been analysed.
4.2 RELIABILITY ANALYSIS
The reliability of scales used in this study was calculated by Cronbach's
coefficient alpha. Cronbach‟s alpha reliability coefficient normally ranges between
0 and 1. However, there is actually no lower limit to the coefficient. The closer
Cronbach‟s alpha coefficient is 1.0 the greater the internal consistency of the items
in the scale. The coefficient alpha values exceeded the minimum standard of .70.
It has provided good estimates of internal consistency reliability.
Please purchase PDF Split-Merge on www.verypdf.com to remove this watermark.

90
• The formula is as follows:
• K is the number of items in the scale.
• R is the average correlation pairs of items.
• As the number of items in the scale (k) increases, the value of alpha
becomes larger.
• If the inter-correlation between items is large, the corresponding alpha will
also be larger.
Table 4.1 Presents Reliability scales -opinion factors related to level of
satisfaction towards Mutual fund Investment.
Table 4.1
Reliability Scales - Opinion Factors Related to Level of Satisfaction towards
Mutual Fund Investment
S. No. Opinion (Items)
Scale
Mean If
Item
Deleted
Cronbach's
Alpha If
Item
Deleted
1 Schemes 64.42 .710
2 Risk and Return 63.92 .713
3 Services 64.42 .700
4 Relationship 65.22 .751
5 Claim 64.55 .762
6 Grievances 64.41 .730
7 Fund management 64.22 .729
8 NAV Updating 64.79 .703
9 Security 64.63 .727
10 Entry Load 64.51 .716
11 Exit Load 64.79 .700
rk
kr
)1(1
Please purchase PDF Split-Merge on www.verypdf.com to remove this watermark.

91
S. No. Opinion (Items)
Scale
Mean If
Item
Deleted
Cronbach's
Alpha If
Item
Deleted
12 New Fund Scheme (or) offer based on
Return 64.41 .701
13 Existing Fund based on return 64.51 .700
14 Asset management company service
(AMCS) 64.76 .700
15 Promptness in information giving 64.49 .707
16 Clarification towards technical doubts 64.62 .700
17 Reminding of premium payment 64.49 .709
18 Informing time about default payment 64.22 .700
19 Satisfied with remedial measures
(Redressal)
64.82 .700
Mean 68.12
Variance 76.55
Std. Deviation 8.75
Cronbach's Alpha Based On Standardized Items 0.700
Cronbach's Alpha 0.719
No. Of Items 19
It is inferred from table 4.1 that the reliability scales used for this study was
calculated by the closer Cronbach‟s alpha coefficient is 1.0 the greater the internal
consistency of the items in the scale. Based upon the formula a= rk / [1 + (k -1) r]
where k is the number of items considered and r is the mean of the inter-item
correlations the size of alpha is determined by both the number of items in the
scale and the mean inter-item correlations. The coefficient alpha values exceeded
the minimum standard of 0.70. It has provided good estimates of internal
consistency reliability. As shown in Table 4.1, all constructs obtained an
acceptable level of a coefficient alpha above 0.70, indicating that the scales used
in this study were reliable. It provides the following rules of thumb: “_ > .9 –
Excellent, _ > .8 – Good, _ > .7 – Acceptable, _ > .6 – Questionable, _ > .5 – Poor
Please purchase PDF Split-Merge on www.verypdf.com to remove this watermark.

92
and _ < .5 – Unacceptable”. While increasing the value of alpha is partially
dependent upon the number of items in the scale, it should be noted that this has
diminishing returns. It should also be noted that an alpha of 0.719 is probably a
reasonable goal. It should also be noted that while a high value for Cronbach‟s
alpha indicates good internal consistency of the items in the scale, it does not
mean that the scale is unidimensional. Factor analysis is a method to determine the
dimensionality of a scale.
Table 4.2 is Shows the Reliability Scales-Factors Related to Sources of
Information for Selecting the Schemes.
Table 4.2
Reliability Scales -Factors Related to Sources of Information
for Selecting the Schemes
S. No. Sources (Items)
Scale Mean
If Item
Deleted
Cronbach's
Alpha If
Item
Deleted
1 Funds/scheme's performance record 88.30 .870
2 Funds/scheme's reputation or brand name 88.50 .873
3 Scheme's expense ratio 88.90 .857
4 Scheme's portfolio of investment 88.90 .868
5 Reputation of scheme(s),portfolio
manager(s) 88.50 .866
6 Withdrawal facilities 88.50 .872
7 Favorable rating by a rating agency 88.90 .866
8 Innovativeness of the scheme 89.20 .870
9 Products with tax benefits 88.60 .874
10 Entry and Exit load 88.70 .860
11 Reputation of a sponsoring firm 88.60 .870
12 Sponsor offers a wide range of schemes
with different investment objectives 88.40 .854
Please purchase PDF Split-Merge on www.verypdf.com to remove this watermark.

93
S. No. Sources (Items)
Scale Mean
If Item
Deleted
Cronbach's
Alpha If
Item
Deleted
13 Sponsor has a recognized brand name 88.80 .847
14 Sponsor has a well developed Agency
Network / Infrastructure 88.50 .861
15 Sponsor has an efficient research wing 88.70 .869
16 Sponsor's expertise in managing money 88.50 .859
17
Disclosure of investment objectives,
method and periodicity of valuation in
advertisement
88.50 .864
18
Disclosure of the method and periodicity
of the scheme's sales and repurchase in
the offer documents
88.30 .855
19 Disclosure of NAV on every trading day 88.60 .870
20 Disclosure of deviation of the
investments from the original pattern 88.40 .876
21 Disclosure of scheme's investments on
every trading days 88.80 .853
22 Mutual Fund Investor's grievance
redressal machinery 89.00 .855
23
Fringe benefit like free insurance, free
credit card, loans on collateral, tax
benefits etc.
89.30 .863
Mean 92.7
Variance 188.68
Std. Deviation 13.74
Cronbach's Alpha Based On Standardized Items 0.872
Cronbach's Alpha 0.869
No. Of Items 23
Table 4.2 reveals that all the twenty-three measurement scale items are
reliable as the Cronbach alpha coefficient of 0.869. It is greater than the threshold
level of 0.70. It‟s provided good estimates of internal consistency reliability and
Please purchase PDF Split-Merge on www.verypdf.com to remove this watermark.

94
also coefficient alpha values ranged from 0.847 to 0.876 for all the constructs. It is
indicating that the scales used in this study were reliable. It clearly indicates that
the above scale items are consistent with each other and they are the reliable
measures of sources of information for selection of scheme.
Table 4.3 shows Reliability scales - factors related to extent of awareness
on the schemes of mutual fund.
Table 4.3
Reliability Scales- Factors Related to Extent of Awareness on the
Schemes of Mutual Fund
S. No. Schemes (Items)
Scale Mean
If Item
Deleted
Cronbach's
Alpha If Item
Deleted
1 Income fund scheme 29.50 .806
2 Growth fund Scheme 29.60 .812
3 Conservative fund scheme 30.10 .801
4 Equity fund 29.40 .841
5 Bond fund 30.20 .836
6 Balanced fund 29.90 .805
7 Sectoral fund 30.20 .842
8 Fund of funds 30.00 .823
9 Leverage fund 29.90 .777
10 Index fund 29.80 .787
11 Tax savings schemes 29.60 .812
12 Gold exchange traded fund 29.80 .843
13 Real estate fund 29.90 .789
14 Other schemes 30.70 .833
Mean 32.2
Variance 28.83
Std. Deviation 5.37
Cronbach's Alpha Based On Standardized Items 0.812
Cronbach's Alpha 0.828
No. Of Items 14
Please purchase PDF Split-Merge on www.verypdf.com to remove this watermark.

95
It is observed from table 4.3 that all the fourteen measurement scale items
are reliable as the Cronbach alpha coefficient of 0.828. It is greater than the
threshold level of 0.70. It has provided good estimates of internal consistency
reliability and also the coefficient alpha values ranged from 0.777 to 0.843 for all
the constructs. It is indicating that the scales used in this study were reliable. It clearly
indicates that the above scale items are consistent with each other and they are the
reliable measures of the extent of awareness on the schemes of mutual fund.
Table 4.4 Reliability shows scales-factors related to purpose of Mutual fund
investment.
Table 4.4
Reliability Scales - Factors Related to Purpose of Mutual Fund Investment
S. No. Purpose(Items) Scale Mean If
Item Deleted
Cronbach's
Alpha If Item
Deleted
1 Savings 28.90 .700
2 Better investments 28.90 .694
3 Tax Benefit 29.60 .713
4 Children's Education 28.70 .717
5 Marriage 29.20 .783
6 Medical Expenses 29.40 .639
7 Low Risk 28.00 .758
8 Switching Facility 29.10 .713
9 Other purpose 29.00 .688
Mean 32.6
Variance 44.75
Std. Deviation 6.69
Cronbach's Alpha Based On Standardized Items 0.717
Cronbach's Alpha 0.736
No. Of Items 9
Please purchase PDF Split-Merge on www.verypdf.com to remove this watermark.

96
Table 4.4 shows that all the nine measurement scale items are reliable as
the Cronbach alpha coefficient is 0.736. It is greater than the threshold level of
0.70. It has provided good estimates of internal consistency reliability and also the
coefficient alpha values ranged from 0.688 to 0.758 for all the constructs. It is
indicating that the scales used in this study were reliable. It clearly indicates that
the above scale items are consistent with each other and they are the reliable
measures of the purpose of mutual fund investment and opinion.
Table 4.5 presents Reliability scales - factors related to facilities provided
by the mutual fund companies.
Table 4.5
Reliability Scales - Factors Related to Facilities Provided by the
Mutual Fund Companies in India
S. No. Facilities (Items)
Scale
Mean If
Item
Deleted
Cronbach's
Alpha If
Item
Deleted
1 Message services 28.20 .927
2 Online Services 28.00 .934
3 Computer Age Management Services (CAMS) 28.40 .925
4 Information directly by mutual fund
companies
28.20 .930
5 Information through mutual fund agent 28.40 .936
6 Information about mutual fund through
specialized journals
28.20 .933
7 Switching facilities 28.00 .933
8 Systematic Investment Plan (SIP) 28.10 .934
9 Direct Investment 28.10 .926
Mean 31.7
Variance 82.62
Std. Deviation 9.09
Cronbach's Alpha Based On Standardized Items 0.939
Cronbach's Alpha 0.938
No. Of Items 9
Please purchase PDF Split-Merge on www.verypdf.com to remove this watermark.

97
Table 4.5 reveals that all the nine measurement scale items are reliable as
the Cronbach alpha coefficient of 0.938. It is greater than the threshold level of
0.70. It has provided good estimates is internal consistency reliability and also the
coefficient alpha values ranged from 0.925 to 0.934 for all the constructs. It is
indicating that the scales used in this study were reliable. It clearly indicates that
the above scale items are consistent with each other and they are the reliable measures
of the factors related to facilities provided by the mutual fund companies.
4.3 INVESTORS‟ PERCEPTION OF MUTUAL FUND INVESTMENT
Perception is a significant concept in understanding and studying the
behavior of mutual fund Investors towards mutual fund Investment. Under this
part, the perception of mutual fund investors have been analyzed in terms of
Gender, Age Marital Status, Occupation, Educational Qualification, Income
earned with suitable statistical tools.
4.3.1 Gender
Gender may have an influence in the investors‟ perception. Mobility and
Contact of male members may be higher than female. So male investors‟ may
have high level of perception.
Table 4.6
Gender of the Respondents
Gender Freq % Mean S.D Range
MIN MAX
Male 280 70.0 96.62 11.71 69.00 112.00
Female 120 30.0 83.55 13.80 69.00 112.00
Total 400 100.0
Source: Primary Data
Please purchase PDF Split-Merge on www.verypdf.com to remove this watermark.

98
It is represented from the table 4.6 that 70 per cent of the respondents are
males and that investors perception of mutual fund investment on the male ranged
between 69 and 112 with an average of 96.62 and the remaining 30 per cent of the
respondents are females and that investors perception of mutual fund investment
on the females ranged between 69 and 112 with an average of 83.55. Thus the
table reveals a high perception on male respondents of mutual fund investment
than female respondents.
In order to find out the association between the gender and the level of
perception towards mutual fund investor, tables 4.7 and 4.8 were presented.
Table 4.7
Gender and Level of Investors Perception of Mutual Fund Investment
Gender Level of Perception
Total Low Medium High
Male Freq 45 133 102 280
% 11.3 33.3 25.5 70
Female Freq 75 27 18 120
% 18.8 6.8 4.5 30
Total Freq 120 160 120 400
% 30.0 40.0 30.0 100.0
Source: Primary Data
Table 4.7 depicts that out of 400 mutual fund investors, 280 (70 per cent)
are males and among them 45 (11.3%) investors have a low level perception;
133 (33.3%) investors have a medium level of perception and 102 (25.5%)
investors have a high level of perception on the mutual fund investment.
Please purchase PDF Split-Merge on www.verypdf.com to remove this watermark.
99
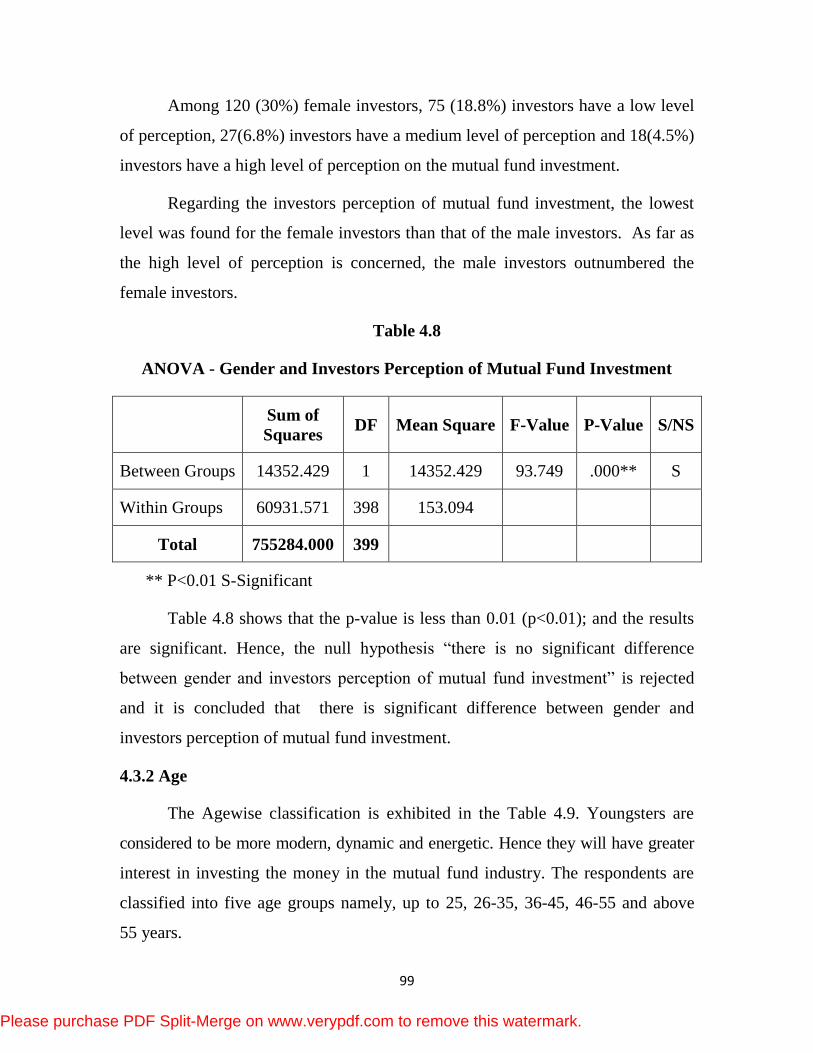
Among 120 (30%) female investors, 75 (18.8%) investors have a low level
of perception, 27(6.8%) investors have a medium level of perception and 18(4.5%)
investors have a high level of perception on the mutual fund investment.
Regarding the investors perception of mutual fund investment, the lowest
level was found for the female investors than that of the male investors. As far as
the high level of perception is concerned, the male investors outnumbered the
female investors.
Table 4.8
ANOVA - Gender and Investors Perception of Mutual Fund Investment
Sum of
Squares DF Mean Square F-Value P-Value S/NS
Between Groups 14352.429 1 14352.429 93.749 .000** S
Within Groups 60931.571 398 153.094
Total 755284.000 399
** P<0.01 S-Significant
Table 4.8 shows that the p-value is less than 0.01 (p<0.01); and the results
are significant. Hence, the null hypothesis “there is no significant difference
between gender and investors perception of mutual fund investment” is rejected
and it is concluded that there is significant difference between gender and
investors perception of mutual fund investment.
4.3.2 Age
The Agewise classification is exhibited in the Table 4.9. Youngsters are
considered to be more modern, dynamic and energetic. Hence they will have greater
interest in investing the money in the mutual fund industry. The respondents are
classified into five age groups namely, up to 25, 26-35, 36-45, 46-55 and above
55 years.
Please purchase PDF Split-Merge on www.verypdf.com to remove this watermark.

100
Table 4.9
Age of the Respondents
Age Freq % Mean S.D Range
Min Max
Up to 25 years 64 16.0 83.58 9.92 69.00 112.00
26-35 years 139 34.7 99.91 10.89 77.00 112.00
36-45 years 92 23.0 89.02 11.91 69.00 112.00
46-55 years 65 16.3 99.72 1.89 98.00 112.00
Above 55 years 40 10.0 75.83 15.24 69.00 112.00
Total 400 100.0
Source: Primary Data
Table 4.9 represents that 16 per cent of the respondents belong to age group
of up to 25 years and that investors perception of mutual fund investment on this
age group ranged between 69 and 112 with an average of 83.58; 34.7 per cent of
the respondents belong to 26 - 35 years age group and that investors perception of
mutual fund investment on this age group ranged between 77 and 112 with an
average of 99.91; 23 per cent of the respondents belong to 36-45 years of age and
that investors perception of mutual fund investment on this age group ranged
between 69 and 112 with an average of 89.2; 16.3 per cent of the respondents
belong to 46 - 55 years of age and that investors perception of mutual fund
investment on this age group ranged between 98 and 112 with an average of 99.72
and the remaining 10 per cent of the respondents belong to above 55 years of age
and that investors perception of mutual fund investment on this age group ranged
between 69 and 112 with an average of 75.83 per cent.
Table 4.10 and 4.11 present the degree of association between the age
groups and investors level of perception towards mutual fund investment.
Please purchase PDF Split-Merge on www.verypdf.com to remove this watermark.

101
Table 4.10
Age and Level of Investor‟s Perception
Age Level of Perception
Total Low Medium High
Up to 25 years Freq 45 15 4 64
% 11.3 3.8 1.0 16.0
26-35 years Freq 3 42 94 139
% .8 10.5 23.5 34.8
36-45 years Freq 39 38 15 92
% 9.8 9.5 3.8 23.0
46-55 years Freq - 63 2 65
% - 15.8 .5 16.3
Above 55 years Freq 33 2 5 40
% 8.3 .5 1.3 10.0
Total Freq 120 160 120 400
% 30.0 40.0 30.0 100.0
Source: Primary Data
Table 4.10 represents that among 400 respondents 64 (16%) of the investors
belong to the age up to 25 years and of them 45 (11.3%) investors have a low level
of perception, 15 (3.8%) investors have a medium level of perception and 4 (1%)
have a high level of perception on mutual fund investment.
Out of 139 (34.8%) investors belong to the age group of 26 to 35 years and
among them three (0.8%) investors have a low level of perception, 42 (10.5%)
investors have a medium level of perception and 94 (23.5%) investors have a high
level of perception on mutual fund investment.
Please purchase PDF Split-Merge on www.verypdf.com to remove this watermark.

102
Among 92 (23.0%) investors belong to the age group of 36 to 45 years and
among them 39 (9.8%) investors have a low level of perception, 38 (9.5%) investors
have a medium level of perception and 15 (3.8%) investors have a high level of
perception on mutual fund investment.
Out of 65 (16.3%) investors belong to the age group of 46-55 years. There
are no investors with low level of perception 63 (15.8%) investors have a medium
level of perception and 2 (0.5%) investors have a high level of perception on
mutual fund investment.
Among 40 (10%) investors belong to the age above 55 years. 33 (8.3%)
investors have a low level of perception, 2 (0.5%) investors have a medium level of
perception and 5 (1.3%) investors have a high level of perception on mutual fund
investment.
The level of perceptions has been analyzed for investors of different age
groups, a high percentage (11.3) is found in low level perception in the age group of
upto 25 years and a high percentage (23.5) in high level of perception in the age
group of 26-36 years.
Table 4.11
ANOVA - Age and Investor‟s Perception of Mutual Fund Investment
Sum Of
Squares DF Mean Square F-Value P-Value S/Ns
Between Groups 30527.860 4 7631.965 67.357 .000** S
Within Groups 44756.140 395 113.307
Total 75284.000 399
** P<0.01 S-Significant
Table 4.11 shows that the p-value is less than 0.01; and the results are
significant. Hence, the null hypothesis “there is no significant difference between
Please purchase PDF Split-Merge on www.verypdf.com to remove this watermark.

103
age of the respondents and investors perception of mutual fund investment” is
rejected and it is concluded that there is a significant difference between age of the
respondents and investors perception of mutual fund investment.
4.3.3 Marital Status
In today‟s world both men and women are working to earn money, so risk
and returns are shared by them. But the unmarried category has a certain limit to
take risk because they can not share their risk. So, mainly married category people
invest more. Marital status of sample respondents are classified into groups
namely married and unmarried respectively.
Table 4.12
Marital Status of the Respondents
Marital Status Freq % Mean S.D Range
Min Max
Married 249 62.2 92.92 14.39 69.00 112.00
Unmarried 151 37.8 92.34 12.62 69.00 113.00
Total 400 100.0
Source: Primary Data
Table 4.12 reveals that the level of investor‟s perception of mutual fund
investment among the married respondents was ranged between 69 and 112 with
a percentage and average of 92.92. The level of investor‟s perception of mutual
fund investment among the unmarried respondents ranged between 69 and 113
with a percentage and average of 92.34. It is concluded that the married respondents
have more perception of mutual fund investment in the study area.
The degree of association between marital status and investor‟s level of
perception towards mutual fund investment were presented in table 4.13 and 4.14.
Please purchase PDF Split-Merge on www.verypdf.com to remove this watermark.
104
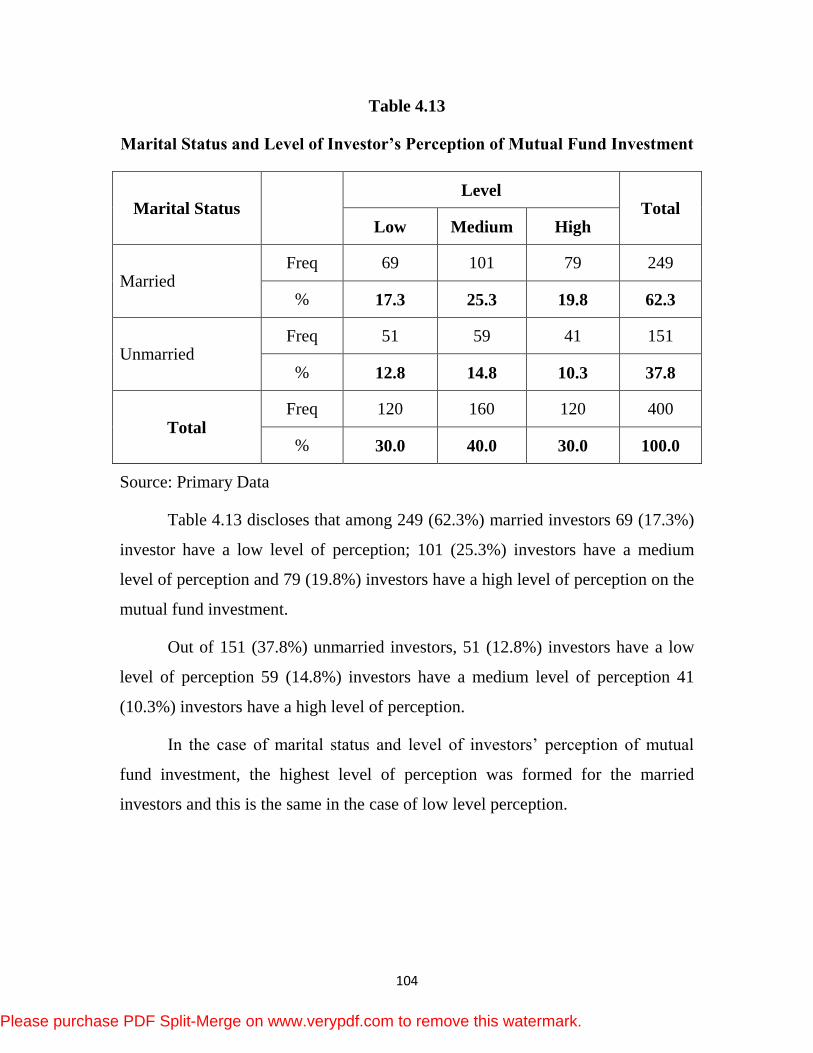
Table 4.13
Marital Status and Level of Investor‟s Perception of Mutual Fund Investment
Marital Status Level
Total Low Medium High
Married Freq 69 101 79 249
% 17.3 25.3 19.8 62.3
Unmarried Freq 51 59 41 151
% 12.8 14.8 10.3 37.8
Total Freq 120 160 120 400
% 30.0 40.0 30.0 100.0
Source: Primary Data
Table 4.13 discloses that among 249 (62.3%) married investors 69 (17.3%)
investor have a low level of perception; 101 (25.3%) investors have a medium
level of perception and 79 (19.8%) investors have a high level of perception on the
mutual fund investment.
Out of 151 (37.8%) unmarried investors, 51 (12.8%) investors have a low
level of perception 59 (14.8%) investors have a medium level of perception 41
(10.3%) investors have a high level of perception.
In the case of marital status and level of investors‟ perception of mutual
fund investment, the highest level of perception was formed for the married
investors and this is the same in the case of low level perception.
Please purchase PDF Split-Merge on www.verypdf.com to remove this watermark.

105
Table 4.14
ANOVA - Marital Status and Investor‟s Perception of
Mutual Fund Investment
Sum of
Squares DF
Mean
Square F-Value P-Value S/Ns
Between Groups 30.678 1 30.678 .162 .687 NS
Within Groups 75253.322 398 189.079
Total 755284.000 399
NS- Not Significant
It is identified from the table 4.14 that the p-value is greater than 0.05; and the
results are not significant. Hence, the null hypothesis “there is no significant
difference between marital status of the respondents and investors perception of
mutual fund investment” is accepted and it is concluded that there is no significant
difference between marital status and investor‟s perception of mutual fund investment.
4.3.4 Educational Qualification
Education is very essential for all human beings. It is very important for
one in the modern electronic world to adapt himself to modern principles and
techniques. For this purpose the Educational levels of the respondents are classified
into four groups namely School Level, Graduation, Post-Graduation and Professional.
Education plays an important role in improving knowledge, attitude, tendency and
temperament of the mutual fund investors.
Please purchase PDF Split-Merge on www.verypdf.com to remove this watermark.

106
Table 4.15
Educational Qualification of the Respondents
Educational Qualification Freq % Mean S.D Range
Min Max
School Level 68 17.0 99.31 11.26 69 112
Under-Graduation 105 26.2 88.26 12.99 69 112
Post-Graduation 95 23.8 88.49 15.93 70 113
Professional 132 33.0 95.86 11.51 69 112
Total 400 100.0
Source: Primary Data
It is represented from the table 4.15 that the level of investors perception of
mutual fund investment among the School Level respondents was ranged between
69 and 112 with a percentage and an average of 17 and 99.31 respectively and the
level of investors perception of mutual fund investment among the Graduation
respondents was ranged between 69 and 112 with a percentage and an average of
26.3 and 88.26 respectively. The level of impact on corporate retailers among the
Post-Graduation level respondents was ranged between 1 and 3 with a percentage
and an average of 14.2 and 1.88 respectively. The level of investor‟s perception of
mutual fund investment among the HSc level respondents was ranged between
70 and 113 with a percentage and an average of 23.8 and 88.49 and the remaining
level of investor‟s perception of mutual fund investment among the professional
was ranged between 69 and 112 with a percentage and an average of 33 and 95.86
respectively.
To examine the association between educational qualification and investors‟
level of perception towards mutual fund investment, the table 4.16 and 4.17 were
presented.
Please purchase PDF Split-Merge on www.verypdf.com to remove this watermark.

107
Table 4.16
Educational Qualification and Level of Investor‟s Perception of
Mutual Fund Investment
Educational Qualification Level of Perception
Total Low Medium High
School Level Freq 10 17 41 68
% 2.5 4.3 10.3 17.0
Under-Graduation Freq 46 42 17 105
% 11.5 10.5 4.3% 26.3
Post-Graduation Freq 32 38 25 95
% 8.0 9.5 6.3 23.8
Professional Freq 32 63 37 132
% 8.0 15.8 9.3 33.0
Total Freq 120 160 120 400
% 30.0 40.0 30.0 100.0
Source: Primary Data
Table 4.16 shows that among 400 respondents 68 (17%) of the investors‟
educational qualification is at school level and among them, 10 (2.5%) investors
have a low level of perception, 17 (4.3%) investors have a medium level of
perception and 41 (10.3%) investors have a high level of perception on the mutual
fund investment.
Out of 105 (26.3%) of the investors‟ educational qualification is under-
Graduation and among them, 46 (11.5%) investors have a low level of perception,
42 (10.5%) investors have a medium level of perception and 17 (4.3%) investors
have a high level of perception on the mutual fund.
Please purchase PDF Split-Merge on www.verypdf.com to remove this watermark.

108
Among 95 (23.8%) of the investors educational qualification is post-
Graduation and among them, 32 (8.0%) investors have a low level of perception,
38 (9.5%) investors have a medium level of perception and 25 (6.3%) investors
have a high level of perception on the mutual fund.
Out of 132 (33.0%) of the investors are professionals and among them,
32 (8.0%) investors have a low level of perception, 63 (15.8%) investors have a
medium level of perception and 37 (9.3%) investors have a high level of
perception on the mutual fund.
The researcher has also analyzed the Level of Perception of Investors of mutual
fund investment among the investors of different educational qualifications. A high
percentage (11.5) is found in low level of perception in under-graduates category and a
high percentage (10.3) is found in high level of perception in school level educated
category.
Table 4.17
ANOVA - Educational Qualification and Investor‟s Perception of
Mutual Fund Investment
** P<0.01 S-Significant
Table 4.17 depicts that the p-value is less than 0.01; and the results are
significant. Hence, the null hypothesis “there is no significant difference between
educational qualification of the respondents and investors perception of mutual
fund investment” is rejected and it is concluded that there is a significant
difference between educational qualification of the respondents and investors
perception of mutual fund investment.
Sum Of
Squares DF
Mean
Square F-Value P Value S/Ns
Between Groups 8037.416 3 2679.139 15.777 .000** S
Within Groups 67246.584 396 169.815
Total 75284.000 399
Please purchase PDF Split-Merge on www.verypdf.com to remove this watermark.

109
4.3.5 Occupation
Occupationwise distributions of sample respondents are classified according to
their employment position. Occupation is a status symbol in society. Hence the
respondents are classified into groups namely Agriculturists, Govt. Employees,
Private Employees, Businessmen / Professionals and others.
Table 4.18
Occupation of the Respondents
Occupation Freq % Mean S.D Range
Min Max
Agriculturists 77 19.3 94.86 13.56 69 112
Govt. Employees 105 26.3 92.23 16.21 69 112
Private Employees 95 23.7 89.19 11.26 69 112
Businessmen / Professionals 87 21.7 98.45 11.62 69 112
Others 36 9.0 84.83 10.38 77 107
Total 400 100.0
Source: Primary Data
Table 4.18 discloses that 19.3 per cent of the respondents are Agriculturists
and level of their perception of mutual fund investment ranged between 69 and
112 with an average of 94.86 and 26.3 per cent of the respondents are Govt.
Employees and level of their perception of mutual fund investment ranged
between 69 and 112 with an average of 92.23; 23.7 per cent of the respondents are
Private Employees and level of their perception of mutual fund investment ranged
between 69 and 112 with an average of 89.19 and 21.7 per cent of the respondents
are Businessmen / Professionals and their perception of mutual fund investment
ranged between 69 and 112 with an average of 98.45 and the remaining 9 per cent
Please purchase PDF Split-Merge on www.verypdf.com to remove this watermark.

110
of the respondents are others and the level of investors perception of mutual fund
investment ranged between 77 and 107 with an average of 84.83. Majority of the
respondents are Govt. Employees.
Table 4.19 and 4.20 shows the association between the occupational status
and the level of investor‟s perception towards mutual fund investment.
Table 4.19
Occupation and Level of Investor‟s Perception of Mutual Fund Investment
Occupation Level of Perception
Total Low Medium High
Agriculturists Freq 17 26 34 77
% 4.3 6.5 8.5 19.3
Govt. Employees Freq 37 33 35 105
% 9.3 8.3 8.8 26.3
Private Employees Freq 33 51 11 95
% 8.3 12.8 2.8 23.8
Businessmen / Professionals Freq 11 38 38 87
% 2.8 9.5 9.5 21.8
Others Freq 22 12 2 36
% 5.5 3.0 .5 9.0
Total Freq 120 160 120 400
% 30.0 40.0 30.0 100.0
Source: Primary Data
Table 4.19 depicts that among 400 respondents 77 (19.3%) of the investors‟
occupational status is agriculturists and among them, 17 (4.3%) investors have a
low level of perception 26 (6.5%) investors have a medium level of perception and
344 (8.5%) investors have a high level of perception on mutual fund investment.
Please purchase PDF Split-Merge on www.verypdf.com to remove this watermark.

111
Out of 105 (26.3%) investors‟ occupational status is Govt. employees and
among them, 37 (9.3%) investors have a low level of perception, 33 (8.3%)
investors have a medium level of perception and 35 (8.8%) investors have a high
level of perception on mutual fund investment.
Among 95 (23.8%) investors occupational status is private employees and
among them, 33 (8.3%) investors have a low level of perception 51 (12.8%) investors
have a medium level of perception and 11 (2.8%) investors have medium level of
perception and 2 (0.5%) investors have a high level of perception on mutual fund
investment.
Out of 87 (21.8%) investors occupational status is businessmen/professionals
and among them, 11 (2.8%) investors have a low level of perception 38 (9.5%)
investors have a medium level of perception and 38 (9.5%) investors have a high
level of perception on mutual fund investment.
Among 36 (9%) investors cum under other occupational status and among
them, 22 (5.5%) investors have a low level of perception 12 (3%) investors have a
medium level of perception and 2 (0.5%) investors have a high level of perception
and 2 (0.5%) investors have high level of perception on mutual fund investment.
The researcher has also analyzed level of perception of investors of mutual
fund investment among the investors of different occupational status. A high
percentage (9.3) is found in low level of perception in Govt. Employees and a high
percentage (9.5) is found in high level of perception in businessmen /
professionals.
Please purchase PDF Split-Merge on www.verypdf.com to remove this watermark.

112
Table 4.20
ANOVA - Occupation and Investor‟s Perception of Mutual Fund Investment
Sum Of
Squares DF
Mean
Square F-Value
P-
Value S/Ns
Between Groups 6654.950 4 1663.738 9.576 .000** S
Within Groups 68629.050 395 173.744
Total 75284.000 399
** P<0.01 S-Significant
It is revealed from table 4.20 that the p-value is less than 0.01; and the results are
significant. Hence, the null hypothesis “there is no significant difference between
occupation of the respondents and investors perception of mutual fund
investment” is rejected and it is concluded that there is a significant difference
between occupation of the respondents and investors perception of mutual fund
investment.
4.3.6 Income Earned
Income is important for all human beings, because each and everything is
based on income. It induces individuals to spend their hard earned money on
different products and services. In this study, the income has been studied closely
to see its relationship with mutual funds investments. The respondent‟s income
was studied under four different categories. For this purpose the monthly income
level of the respondents are classified into five levels namely, (i) up to Rs.10,000,
(ii) between Rs.10,001 and Rs.20,000, (iii) between Rs.20,001 and Rs.30,000, (iv)
between Rs.30,001 and Rs.40,000, (v) above Rs.40,000.
Please purchase PDF Split-Merge on www.verypdf.com to remove this watermark.

113
Table 4.21
Income Earned of the Respondents
Monthly Income Freq % Mean S.D Range
Min Max
Up to Rs.10,000 91 22.7 92.90 13.86 69 112
Rs.10,001 – Rs.20,000 109 27.3 92.59 13.46 69 112
Rs.20,001 – Rs.30,000 65 16.2 93.52 14.12 69 112
Rs.30,001 - Rs.40,000 68 17.0 92.54 14.05 69 112
Above Rs.40,000 67 16.8 91.97 13.69 69 112
Total 400 100.0
Source: Primary Data
Table 4.21 represents that 22.7 per cent of the respondents earn up to
Rs.10,000 income per month and their perception of mutual fund investment
ranged between 69 and 112 with an average of 92.9; 27.3 per cent of the
respondents earn between Rs.10,001 – Rs.20,000 income per month and the level
of their perception of mutual fund investment ranged between 69 and 112 with an
average of 92.59; 16.2 per cent of the respondents earn between Rs.20,001 –
Rs.30,000 income per month and the level of their perception of mutual fund
investment ranged between 69 and 112 with an average of 93.52; 17 per cent of the
respondents earn Rs.30,001 – Rs.40,000 income per month and the level of their
perception of mutual fund investment ranged between 69 and 112 with an average
of 92.54 and the remaining 16.8 per cent of the respondents earn above Rs.40,000
income per month and the level of their perception of mutual fund investment
ranged between 69 and 112 with an average of 91.97.
Table 4.22 and 4.23 present the association between the monthly income
and level of investors perception towards mutual fund investment,
Please purchase PDF Split-Merge on www.verypdf.com to remove this watermark.

114
Table 4.22
Income Earned and Level of Investor‟s Perception of
Mutual Fund Investment
Monthly Income Level of Perception
Total Low Medium High
Up to Rs. 10,000 Freq 26 37 28 91
% 6.4 9.3 7.0 22.7
Rs. 10,001 - Rs. 20,000 Freq 33 46 30 109
% 8.3 11.5 7.5 27.3
Rs. 20,001 - Rs. 30,000 Freq 18 25 22 65
% 4.4 6.3 5.5 16.2
Rs. 30,001 - Rs. 40,000 Freq 23 23 22 68
% 5.8 5.8 5.5 17.0
above Rs.40,000 Freq 20 29 18 67
% 5.0 7.3 4.5 16.8
Total Freq 120 160 120 400
% 30.0 40.0 30.0 100.0
Source: Primary Data
Table 4.22 shows that among 400 respondents, 91 (22.7%) investors whose
monthly income is up to Rs.10, 000 and among them, 26 (6.4%) investors have a
low level of perception, 37 (9.3%) investors have a medium level of perception
and 28 (7%) investors have a high level of perception on mutual fund investment.
Out of 109 (27.3%) investors whose monthly income is Rs 10,001-
Rs 20,000 and among them, 33 (8.3%) investors have a low level of perception, 46
(11.5%) investors have a medium level of perception and 30 (7.5%) investors have
a high level of perception on mutual fund investment.
Please purchase PDF Split-Merge on www.verypdf.com to remove this watermark.

115
Out of 65 (16.2%) investors whose monthly income is Rs 20,001-
Rs 30,000 and among them, 18 (4.4%) investors have a low level of perception,
25 (6.3%) investors have a medium level of perception and 22 (5.5%) investors
have a high level of perception on mutual fund investment.
Out of 68 (17%) investors whose monthly income is Rs 30,001- Rs 40,000
and among them, 23 (5.8%) investors have a low level of perception, 23 (5.8%)
investors have a medium level of perception and 22 (5.5%) investors have a high
level of perception on mutual fund investment.
Out of 67 (16.8%) investors whose monthly income is above Rs 40,000 and
among them, 20 (5.0%) investors have a low level of perception, 29 (7.3%) investors
have a medium level of perception and 18 (4.5%) investors have a high level of
perception on mutual fund investment.
The Investors‟ who fall under the income category from Rs.10,001 to
Rs. 20,000 were found to be the highest perceivers in the low level of perception
and highest perceivers in the high level of perception.
Table 4.23
ANOVA - Income Earned and Investors‟ Perception of
Mutual Fund Investment
Sum Of
Squares DF
Mean
Square
F-
Value
P-
Value S/NS
Between Groups 86.445 4 21.611 .114 .978 NS
Within Groups 75197.555 395 190.374
Total 75284.000 399
NS-Not Significant
It is revealed from table 4.23 that the p-value is greater than 0.01; and the
results are not significant. Hence, the null hypothesis “there is no significant
difference between monthly income of the respondents and investors‟ perception
Please purchase PDF Split-Merge on www.verypdf.com to remove this watermark.

116
of mutual fund investment” is accepted and it is concluded that there is no
significant difference between monthly income of the respondents and investors
perception of mutual fund investment.
4.4 INVESTORS‟ ATTITUDES OF MUTUAL FUND INVESTMENT
Studying attitude of mutual fund investors‟ help to know in what way their
attitude prevails and how they opined about the mutual fund investment. In this
section, opinion of mutual fund investors has been studied by taking their opinion
in relation to Gender, Occupation and their monthly income.
Table 4.24 shows Chi-square test for Gender and Opinion about Investment
options of mutual fund.
Table 4.24
Gender and Opinion about Investment Options of Mutual Fund
Gender
Opinion About Investment Options Of Mutual Fund
Total Growth
option
Dividend
payout
option
Dividend re-
investment
option
Retirement
pension
option
Insurance
Option
Male Freq 40 134 58 40 8 280
% 10.0% 33.5% 14.5% 10.0% 2.0% 70.0%
Female Freq 40 23 22 0 35 120
% 10.0% 5.8% 5.5% .0% 8.8% 30.0%
Total Freq 80 157 80 40 43 400
% 20.0% 39.3% 20.0% 10.0% 10.8% 100.0%
Chi
square
calculated
value
104.323
DF 4
P-value 0.000** (s)
**P<0.01 S- Significant
Please purchase PDF Split-Merge on www.verypdf.com to remove this watermark.

117
Table 4.24 describes that the p-value is less than 0.01; and the results are
significant. Hence, the null hypothesis “there is no significant relationship between
gender of the respondents and opinion about investment options of mutual fund” is
rejected and it is concluded that there is a significant relationship between gender
of the respondents and opinion about investment options of mutual fund.
Table 4.25 reveals the occupation and opinion about Investment options of
Mutual fund.
Table 4.25
Occupation and Opinion about Investment Options of Mutual Fund
Occupation
Opinion about investment options of mutual fund
Total Growth
option
Dividend
payout
option
Dividend
re-
investment
option
Retirement
pension
option
Insurance
Option
Agriculturists Freq 13 22 32 4 6 77
% 3.3% 5.5% 8.0% 1.0% 1.5% 19.3%
Govt.
Employees
Freq 14 46 33 6 6 105
% 3.5% 11.5% 8.3% 1.5% 1.5% 26.3%
Private
Employees
Freq 36 22 9 20 8 95
% 9.0% 5.5% 2.3% 5.0% 2.0% 23.8%
Businessmen/
Professionals
Freq 11 61 6 4 5 87
% 2.8% 15.3% 1.5% 1.0% 1.3% 21.8%
Others Freq 6 6 0 6 18 36
% 1.5% 1.5% .0% 1.5% 4.5% 9.0%
Total Freq 80 157 80 40 43 400
% 20.0% 39.3% 20.0% 10.0% 10.8% 100.0%
Chi square
calculated
value
176.660
DF 16
P-value 0.000** (s)
**P<0.01 S- Significant
Please purchase PDF Split-Merge on www.verypdf.com to remove this watermark.

118
It is identified from the table 4.25 that the p-value is less than 0.01; and the
results are significant. Hence, the null hypothesis “there is no significant relationship
between occupational status of the respondents and opinion about investment options
of mutual fund” is rejected and it is concluded that there is a significant relationship
between occupational status of the respondents and opinion about investment options
of mutual fund.
Income earned and opinion about Investment options of Mutual fund is
presented in table 4.26.
Table 4.26
Income Earned and Opinion about Investment Options of Mutual Fund
Monthly
Income
Opinion about investment options of mutual fund
Total Growth
option
Dividend
payout
option
Dividend
re-
investment
option
Retirement
pension
option
Insurance
Option
Up to
Rs. 10,000
Freq 21 35 22 6 7 91
% 5.3% 8.8% 5.5% 1.5% 1.8% 22.8%
Rs. 10,001
to
Rs. 20,000
Freq 18 49 17 11 14 109
% 4.5% 12.3% 4.3% 2.8% 3.5% 27.3%
Rs. 20,001
to
Rs. 30,000
Freq 15 26 13 7 4 65
% 3.8% 6.5% 3.3% 1.8% 1.0% 16.3%
Rs. 30,001
to
Rs. 40,000
Freq 12 22 14 11 9 68
% 3.0% 5.5% 3.5% 2.8% 2.3% 17.0%
Above
Rs. 40,000
Freq 14 25 14 5 9 67
% 3.5% 6.3% 3.5% 1.3% 2.3% 16.8%
Total Freq 80 157 80 40 43 400
% 20.0% 39.3% 20.0% 10.0% 10.8% 100.0%
Chi-square
calculated
value
12.794
DF 16
P-value 0.688 (NS)
NS- Not Significant
Please purchase PDF Split-Merge on www.verypdf.com to remove this watermark.

119
Table 4.26 shows that the p-value is greater than 0.05; and the results are not
significant. Hence, the null hypothesis “there is no significant relationship between
monthly income of the respondents and opinion about investment options of mutual
fund” is accepted and it is concluded that there is no significant relationship
between monthly income of the respondents and opinion about investment options
of mutual fund.
4.5 REASON FOR PREFERRING MUTUAL FUND INVESTMENT
Every Mutual fund investor has their own reason for investing their money
into the mutual fund investment. The mutual fund investment is preferred by the
investors for various reasons. A particular reason is attributed to a particular type
of investors therefore; the preference differs from investor to investor. In this
analytical part, Gannett ranking technique has been employed to rank the
preferences of the mutual fund investors.
Garret Ranking Technique
This technique was used to rank the preference of the respondents on
different aspects of the study. The order of merit given by the respondents was
converted into ranks by using the following formula2.
Percentage Position = 100(Rij-0.5)
Nj
Where Rij = Rank given for ith
factor by jth
individual.
Nj = Number of factors ranked by jth
individual.
The percentage position of each rank thus obtained is converted into scores
by referring to the table given by Henry E.Garret. Then for each factor the scores
of individual respondents are added together and divided by the total number of
respondents for whom the scores were added.
Please purchase PDF Split-Merge on www.verypdf.com to remove this watermark.

120
These mean scores for all the factors were arranged in the descending order,
ranks given and most important aspects identified and presented in table 4.27.
Table 4.27
Reason for Preferring Mutual Fund Investment
S. No. Factors Total Score Mean Score Rank
1 Owned by government 28200 70.5 I
2 Better investors relationship 16960 42.4 V
3 Prompt payment at maturity 20320 50.8 IV
4 Low premium & high return 25680 64.2 II
5 Better liquidity 20400 51.0 III
6 Diversified investment 12840 32.1 VI
Source: Primary Data
The above table 4.27 reveals the ranking of reason for preferring mutual
fund investment. “Owned by government” was ranked first by the select sample
respondents with the total score of 28200 and mean score of 70.5. “Low premium
& high return” was ranked second with the total score of 25680 and mean score of
64.2. “Better liquidity” occupied third position with the total score of 20400 mean
score of 51. “Prompt payment at maturity” was ranked fourth with the total score
of 20320 and mean score of 50.8. “Better investors‟ relationship” occupied fifth
position with the total score of 16960 and mean score of 42.4. “Diversified investment”
occupied last position with the total score of 12840 and mean score of 32.1. It is
evident that most of the respondents gave top priority to “Owned by government”
as the first rank for preferring mutual fund investment.
Exhibit 4.1 shows the reason for preferring mutual fund investment.
Please purchase PDF Split-Merge on www.verypdf.com to remove this watermark.

121
Exhibit 4.1
REASON FOR PREFERRING MUTUAL FUND INVESTMENT
Please purchase PDF Split-Merge on www.verypdf.com to remove this watermark.

122
4.6 SOCIO-ECONOMIC CONDITION OF MUTUAL FUND INVESTMENT
The Socio-Economic Conditions of the people determine the mutual fund
investments. The investors, who are having sound financial position, prefer mutual
fund investment with their surplus funds. Apart from the Socio-Economic Conditions
of the mutual fund investors, there are some other factors from the market forces
which determine the mutual fund investment. In this part, the factors such as
product qualities, fund sponsor qualities and investors services have been taken into
account in relation to Age, Gender, Educational Qualifications and Occupation.
Chi-Square Analysis
Ho5: There is no association between Gender and the selection of mutual fund
scheme.
Table 4.28
Gender and the Selection of Mutual Fund Scheme - Product Qualities
Product Qualities Calculated
value DF P-value S/NS
Funds/scheme‟s performance record 89.320 3 .000** S
Funds/scheme‟s reputation or brand name 22.937 3 .000** S
Scheme‟s expense ratio 41.280 3 .000** S
Scheme‟s portfolio of investments 166.260 4 .000** S
Reputation of scheme(s),portfolio
manager(s) 29.302 3 .000** S
Withdrawal facilities 48.175 3 .000** S
Favorable rating by a rating agency 111.260 4 .000** S
Innovativeness of the scheme 82.054 4 .000** S
Products with tax benefits 26.333 2 .000** S
Entry and Exit load 129.667 3 .000** S
**P<0.01 S-Significant
Table 4.28 exposes that the p-value is less than 0.01; and the results are
significant. Hence, the null hypothesis “there is no significant relationship between
Please purchase PDF Split-Merge on www.verypdf.com to remove this watermark.

123
Gender of the respondents and all Product Qualities factors related to selection of
mutual fund scheme” is rejected and it is concluded that there is a significant
relationship between Gender of the respondents and all Product Qualities factors
related to selection of mutual fund schemes.
Table 4.29 shows the Age and the Selection of Mutual Fund Schemes
Product Qualities.
Table 4.29
Age and the Selection of Mutual Fund Scheme - Product Qualities
Product Qualities Calculated
value DF
P-
value S/NS
Funds/scheme‟s performance record 450.746 12 .000** S
Funds/scheme‟s reputation or brand
name 435.016 12 .000** S
Scheme‟s expense ratio 570.263 12 .000** S
Scheme‟s portfolio of investments 588.486 16 .000** S
Reputation of scheme(s),portfolio
manager(s) 385.743 12 .000** S
Withdrawal facilities 474.871 12 .000** S
Favorable rating by a rating agency 586.690 16 .000** S
Innovativeness of the scheme 453.845 16 .000** S
Products with tax benefits 140.292 8 .000** S
Entry and Exit load 269.907 12 .000** S
**P<0.01 S-Significant
It is identified from the table 4.29 that the p-value is less than 0.01; and the
results are significant. Hence, the null hypothesis “there is no significant relationship
between age of the respondents and all Product Qualities factors related to selection of
Please purchase PDF Split-Merge on www.verypdf.com to remove this watermark.

124
mutual fund scheme” is rejected and it is concluded that there is a significant
relationship between age of the respondents and all Product Qualities factors related to
selection of mutual fund scheme.
Table 4.30 deals with the Educational Qualification and the Selection of
mutual Fund Scheme – Product Qualities.
Table 4.30
Educational Qualification and the Selection of Mutual Fund Scheme -
Product Qualities
Product Qualities Calculated
value DF
P-
value S/NS
Funds/scheme‟s performance record 96.168 9 .000** S
Funds/scheme‟s reputation or brand
name 102.106 9 .000** S
Scheme‟s expense ratio 173.867 9 .000** S
Scheme‟s portfolio of investments 250.513 12 .000** S
Reputation of scheme(s),portfolio
manager(s) 82.454 9 .000** S
Withdrawal facilities 114.080 9 .000** S
Favorable rating by a rating agency 148.489 12 .000** S
Innovativeness of the scheme 129.869 12 .000** S
Products with tax benefits 54.534 6 .000** S
Entry and Exit load 176.114 9 .000** S
**P<0.01 S-Significant
Table 4.30 shows that the p-value is less than 0.01; and the results are
significant. Hence, the null hypothesis “there is no significant relationship between
educational qualification of the respondents and all Product Qualities factors
Please purchase PDF Split-Merge on www.verypdf.com to remove this watermark.

125
related to selection of mutual fund scheme” is rejected and it is concluded that
there is a significant relationship between educational qualification of the respondents
and all Product Qualities factors related to selection of mutual fund scheme.
Table 4.31 shows the Occupational Status and the Selection of Mutual Fund
Schemes – Product Qualities.
Table 4.31
Occupational Status and the Selection of Mutual Fund
Scheme - Product Qualities
Product Qualities Calculated
value DF
P-
value S/NS
Funds/scheme‟s performance record 125.392 12 .000** S
Funds/scheme‟s reputation or brand
name 95.832 12 .000** S
Scheme‟s expense ratio 127.623 12 .000** S
Scheme‟s portfolio of investments 142.814 16 .000** S
Reputation of scheme(s),portfolio
manager(s) 76.960 12 .000** S
Withdrawal facilities 103.344 12 .000** S
Favorable rating by a rating agency 158.573 16 .000** S
Innovativeness of the scheme 130.289 16 .000** S
Products with tax benefits 46.835 8 .000** S
Entry and Exit load 121.459 12 .000** S
**P<0.01 S-Significant
It is observed from the table 4.31 that the p-value is less than 0.01; and the
results are significant. Hence, the null hypothesis “there is no significant relationship
between occupational status of the respondents and all Product Qualities factors
Please purchase PDF Split-Merge on www.verypdf.com to remove this watermark.

126
related to selection of mutual fund scheme” is rejected and it is concluded that
there is a significant relationship between occupational status of the respondents
and all Product Qualities factors related to selection of mutual fund scheme.
Table 4.32 deals with Gender and the selection of Mutual Fund Scheme-Fund
Sponsor Qualities.
Table 4.32
Gender and the Selection of Mutual Fund Scheme - Fund Sponsor Qualities
Fund Sponsor qualities Calculated
value DF P-value S/NS
Reputation of a sponsoring firm 48.175 3 .000** S
Sponsor offers a wide range of schemes
with different investment objectives 121.508 3 .000** S
Sponsor has a recognized brand name 112.000 4 .000** S
Sponsor has a well developed Agency
Network / Infrastructure 66.286 3 .000** S
Sponsor has an efficient research wing 127.893 3 .000** S
Sponsor‟s expertise in managing money 95.258 3 .000** S
**P<0.01 S-Significant
Table 4.32 portrays that the p-value is less than 0.01; and the results are
significant. Hence, the null hypothesis “there is no significant relationship between
Gender of the respondents and all Fund Sponsor qualities factors related to
selection of mutual fund scheme” is rejected and it is concluded that there is a
significant relationship between Gender of the respondents and all Fund Sponsor
qualities factors related to selection of mutual fund scheme.
Table 4.33 shows the Age and the Selection of Mutual Fund Scheme–Fund
Sponsor Qualities.
Please purchase PDF Split-Merge on www.verypdf.com to remove this watermark.

127
Table 4.33
Age and the Selection of Mutual Fund Scheme - Fund Sponsor Qualities
Fund Sponsor qualities Calculated
value DF P-value S/NS
Reputation of a sponsoring firm 427.333 12 .000** S
Sponsor offers a wide range of schemes
with different investment objectives 460.578 12 .000** S
Sponsor has a recognized brand name 618.844 16 .000** S
Sponsor has a well developed Agency
Net Work / Infrastructure 389.710 12 .000** S
Sponsor has an efficient research wing 397.725 12 .000** S
Sponsor‟s expertise in managing money 507.980 12 .000** S
**P<0.01 S-Significant
Table 4.33 discloses that the p-value is less than 0.01; and the results are
significant. Hence, the null hypothesis “there is no significant relationship between
age of the respondents and all fund sponsor qualities factors related to selection of
mutual fund scheme” is rejected and it is concluded that there is a significant
relationship between age of the respondents and all fund sponsor qualities factors
related to selection of mutual fund scheme.
Table 4.34 deals with the Educational Qualification and the Selection of
Mutual Fund Scheme–Fund Sponsor Qualities.
Please purchase PDF Split-Merge on www.verypdf.com to remove this watermark.
128
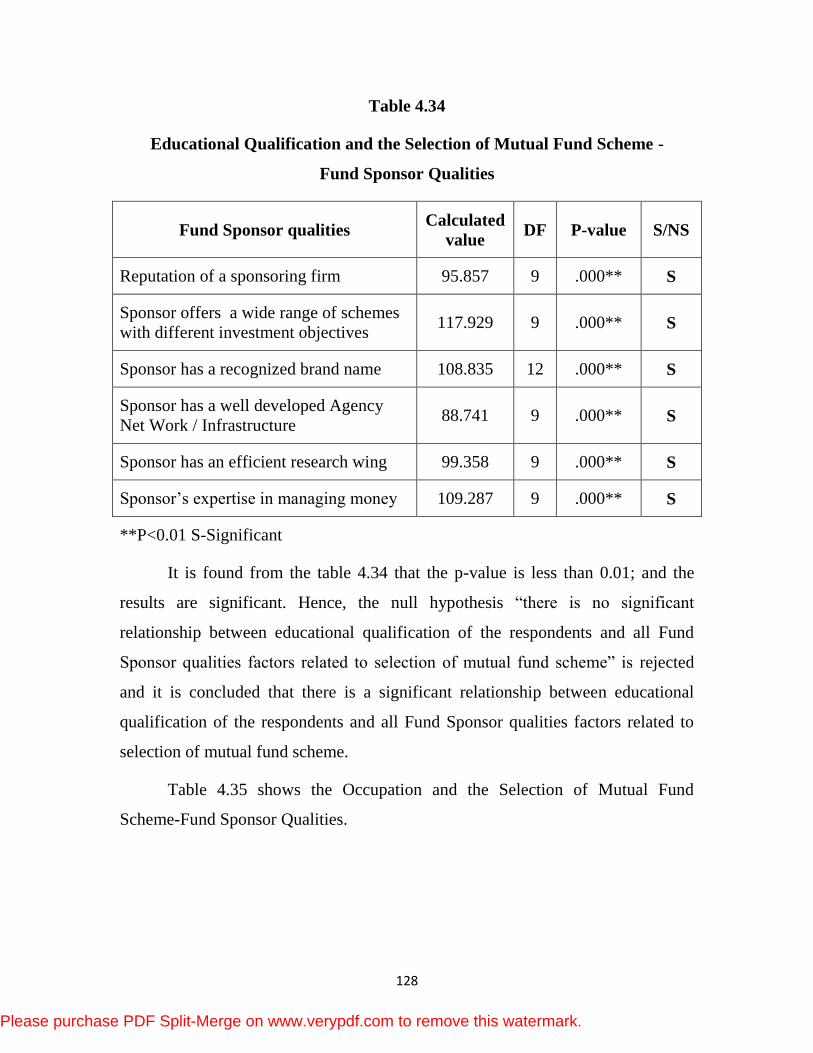
Table 4.34
Educational Qualification and the Selection of Mutual Fund Scheme -
Fund Sponsor Qualities
Fund Sponsor qualities Calculated
value DF P-value S/NS
Reputation of a sponsoring firm 95.857 9 .000** S
Sponsor offers a wide range of schemes
with different investment objectives 117.929 9 .000** S
Sponsor has a recognized brand name 108.835 12 .000** S
Sponsor has a well developed Agency
Net Work / Infrastructure 88.741 9 .000** S
Sponsor has an efficient research wing 99.358 9 .000** S
Sponsor‟s expertise in managing money 109.287 9 .000** S
**P<0.01 S-Significant
It is found from the table 4.34 that the p-value is less than 0.01; and the
results are significant. Hence, the null hypothesis “there is no significant
relationship between educational qualification of the respondents and all Fund
Sponsor qualities factors related to selection of mutual fund scheme” is rejected
and it is concluded that there is a significant relationship between educational
qualification of the respondents and all Fund Sponsor qualities factors related to
selection of mutual fund scheme.
Table 4.35 shows the Occupation and the Selection of Mutual Fund
Scheme-Fund Sponsor Qualities.
Please purchase PDF Split-Merge on www.verypdf.com to remove this watermark.

129
Table 4.35
Occupation and the Selection of Mutual Fund Scheme -
Fund Sponsor Qualities
Fund Sponsor qualities Calculated
value DF P-value S/NS
Reputation of a sponsoring firm 78.812 12 .000** S
Sponsor offers a wide range of schemes
with different investment objectives 89.290 12 .000** S
Sponsor has a recognized brand name 128.509 16 .000** S
Sponsor has a well developed Agency
Network / Infrastructure 37.903 12 .000** S
Sponsor has an efficient research wing 77.987 12 .000** S
Sponsor‟s expertise in managing money 124.816 12 .000** S
**P<0.01 S-Significant
Table 4.35 describes that the p-value is less than 0.01; and the results are
significant. Hence, the null hypothesis “there is no significant relationship between
occupational status of the respondents and all Fund Sponsor qualities factors
related to selection of mutual fund scheme” is rejected and it is concluded that
there is a significant relationship between occupational status of the respondents
and all Fund Sponsor qualities factors related to selection of mutual fund scheme.
Table 4.36 reveals the Gender and the Selection of Mutual Fund Scheme-
Investor Services.
Please purchase PDF Split-Merge on www.verypdf.com to remove this watermark.

130
Table 4.36
Gender and the Selection of Mutual Fund Scheme - Investor Services
Investor services Calculated
value DF
P-
value S/NS
Disclosure of investment objectives,
method and periodicity of valuation in
advertisement
122.000 3 .000** S
Disclosure of the method and periodicity
of the scheme‟s sales and repurchase in the
offer documents
127.698 2 .000** S
Disclosure of NAV on every trading day 65.506 3 .000** S
Disclosure of deviation of the investments
from the original pattern 93.571 3 .000** S
Disclosure of scheme‟s investments on
every trading day 118.810 4 .000** S
Mutual Fund Investor‟s grievance
redressal machinery 159.702 4 .000** S
Fringe benefits like free insurance, free
credit card, loans on collateral, tax benefits
etc.
26.746 4 .000** S
**P<0.01 S-Significant
It is observed from the table 4.36 that the p-value is less than 0.01; and the
results are significant. Hence, the null hypothesis “there is no significant
relationship between Gender of the respondents and all Investor services factors
related to selection of mutual fund scheme” is rejected and it is concluded that
there is a significant relationship between Gender of the respondents and all
Investor services factors related to selection of mutual fund scheme.
Table 4.37 deals with the Age and the Selection of Mutual Scheme-Investor
Services.
Please purchase PDF Split-Merge on www.verypdf.com to remove this watermark.

131
Table 4.37
Age and the Selection of Mutual Fund Scheme - Investor Services
Investor services Calculated
value DF P-value S/NS
Disclosure of investment objectives,
method and periodicity of valuation in
advertisement
461.226 12 .000** S
Disclosure of the method and periodicity of
the scheme‟s sales and repurchase in the
offer documents
292.575 8 .000** S
Disclosure of NAV on every trading day 390.548 12 .000** S
Disclosure of deviation of the investments
from the original pattern 268.585 12 .000** S
Disclosure of scheme‟s investments on
every trading day 612.326 16 .000** S
Mutual Fund Investor‟s grievance redressal
machinery 473.403 16 .000** S
Fringe benefits like free insurance, free
credit card, loans on collateral, tax benefits
etc.
521.991 16 .000** S
**P<0.01 S-Significant
Table 4.37 reveals that the p-value is less than 0.01; and the results are
significant. Hence, the hypothesis “there is no significant relationship between age
of the respondents and all investor services factors related to selection of mutual
fund scheme” is rejected and it is concluded that there is a significant relationship
between age of the respondents and all investor services factors related to selection
of mutual fund scheme.
Table 4.38 deals with the Educational Qualification and the Selection of
Mutual Fund Scheme-Investor Services.
Please purchase PDF Split-Merge on www.verypdf.com to remove this watermark.

132
Table 4.38
Educational Qualification and the Selection of Mutual Fund Scheme -
Investor Services
Investor services Calculated
value DF
P-
value S/NS
Disclosure of investment objectives,
method and periodicity of valuation in
advertisement
74.709 9 .000** S
Disclosure of the method and
periodicity of the scheme‟s sales and
repurchase in the offer documents
53.729 6 .000** S
Disclosure of NAV on every trading day 81.559 9 .000** S
Disclosure of deviation of the
investments from the original pattern 181.161 9 .000** S
Disclosure of scheme‟s investments on
every trading day 130.238 12 .000** S
Mutual Fund Investor‟s grievance
redressal machinery 159.045 12 .000** S
Fringe benefits like free insurance,
free credit card, loans on collateral, tax
benefits etc.
145.155 12 .000** S
**P<0.01 S-Significant
It is revealed from table 4.38 that the p-value is less than 0.01; and the
results are significant. Hence, the hypothesis “there is no significant relationship
between educational qualification of the respondents and all Investor services
factors related to selection of mutual fund scheme” is rejected and it is concluded
that there is a significant relationship between educational qualification of the
respondents and all Investor services factors related to selection of mutual
fund scheme.
Please purchase PDF Split-Merge on www.verypdf.com to remove this watermark.

133
Table 4.39 shows the Occupational Status and the Selection of Mutual Fund
Scheme-Investor Services.
Table 4.39
Occupational Status and the Selection of Mutual Fund Scheme -
Investor Services
Investor services Calculated
value DF P-value S/NS Remarks
Disclosure of investment objectives,
method and periodicity of valuation
in advertisement
94.921 12 .000** S Rejected
Disclosure of the method and
periodicity of the scheme‟s sales
and repurchase in the offer
documents
57.889 8 .000** S Rejected
Disclosure of NAV on every trading
day 66.722 12 .000** S Rejected
Disclosure of deviation of the
investments from the original
pattern
108.296 12 .000** S Rejected
Disclosure of scheme‟s investments
on every trading day 151.585 16 .000** S Rejected
Mutual Fund Investor‟s grievance
redressal machinery 129.982 16 .000** S Rejected
Fringe benefits like free insurance,
free credit card, loans on collateral,
tax benefits etc.
92.150 16 .000** S Rejected
**P<0.01 S-Significant
Table 4.39 depicts that the p-value is less than 0.01; and the results are
significant. Hence, the null hypothesis “there is no significant relationship between
occupational status of the respondents and all Investor services factors related to
selection of mutual fund scheme” is rejected and it is concluded that there is a
significant relationship between occupational status of the respondents and all
Investor services factors related to selection of mutual fund scheme.
Please purchase PDF Split-Merge on www.verypdf.com to remove this watermark.

134
4.7 MOTIVATION FACTOR OF MUTUAL FUND INVESTMENT
There are certain motivational forces which pull the potential investors to
invest into the mutual fund investment. These motivational forces have been
analyzed so that their inter-relationship and multiple regression model has been
used to find the determinants of mutual fund investment. Under this section, the
significance of each motivational factor and their contribution in determining the
mutual investment have been given.
Multiple Regression Analysis
Multiple regression co-efficient measures the relationship between two
variables in such a way that the effects of other related variables are eliminated.
In other words, it measures the relation between a dependent variable and a
particular independent variable by holding all other variables constant. Thus, each
multiple regression co-efficient measures the effect of its independent variable on
the dependent variable. Multiple regression analysis of motivation factors for
investing in mutual fund (Y) was performed with variables and Risk and returns
(X1), Savings (X2), Tax benefit (X3), Scheme (X4), Occupational (X5) and Monthly
Income (X6) the following regression model is fitted for performance:
X16 = bo + b1X1 + b2 X2 +b3 X3 + ……….
Where b1, b2 …. and b6 are partial regression coefficients; bo-constant the results
are presented in table 4.40.
Please purchase PDF Split-Merge on www.verypdf.com to remove this watermark.

135
Table 4.40
Inter-Correlation between Select Variables with the Motivation Factors for
Investing in Mutual Fund
S.
No. Factors 1 2 3 4 5 6
(Constant) 1.000
1 Risk and return .527** 1.000
2 Savings -.263** .136** 1.000
3 Tax Benefit -.433** .000 .240** 1.000
4 Scheme .164** .477** .006 .384** 1.000
5 Occupational -.012 -.182** -.242** -.230** -.145* 1.000
6 Monthly income .025 .002 .011 -.051 .000 .005 1.000
Source: Primary Data
Table 4.40 reveals that the correlation analysis that has been done on all the
data that have been collected through interview schedule. Motivation is correlated
with the rest of the variables. This analysis is done to show the existing relation
among the study variables namely risk and return, savings, tax, benefit, schemes
occupational and monthly income. It can be seen that one variable namely x1, risk
and return r.527 p<0.01 has significant positive correlation with the motivation
factors for investing in mutual fund. Other two variables namely x2 savings
r.-0.263, p<0.01 and x3 tax benefits r.-433 p<0.01 have significant but negative
correlation with motivation factors for investing in mutual fund. In this all of the
predictor variables were entered simultaneously because the predicator variables
and the enter method were used.
Please purchase PDF Split-Merge on www.verypdf.com to remove this watermark.

136
Ho6: There is no significant difference between select variables like Risk and
return, Savings, Tax Benefit, Scheme, Occupational, Monthly income and
the motivation factors for investing in mutual fund.
Table 4.41
Multiple Regression Analysis of the Select Variables with the Motivation
Factors for Investing In Mutual Fund
S. No. Factors
Standardized
Coefficients
(β)
t-value p-value S/NS
(Constant) - 7.668 .000** S
1 Risk and return 0.518 12.370 .000** S
2 Savings -0.251 -6.725 .000** S
3 Tax Benefit -0.412 -10.050 .000** S
4 Scheme 0.067 1.497 0.135 NS
5 Occupational -0.063 -1.712 0.088 NS
6 Monthly
income
0.007 0.195 0.845 NS
R
R2
Adjusted R2
F Change
Sig in F change
0.728
0.530
0.523
73.771**
0.000***
**p <0.01, S-Significant NS- Not significant
The above table 4.41 represents the statistical significance of the model.
The R2 value at 0.530 states that all the six independent variables that is risk and
return, savings, tax benefit, scheme, occupational and a monthly income have 53%
influence on the dependent variable motivation.
Please purchase PDF Split-Merge on www.verypdf.com to remove this watermark.

137
It is clear that out of the six independent variables risk and return, savings,
tax benefit have significant influence on the dependent variable motivation scheme
and the remaining do not have significant influence on the motivation.
Table 4.42
ANOVA-The Select Variables with the Motivation Factors for
Investing in Mutual Fund
Model Sum of
Squares DF Mean Square F-value P-value S/NS
Regression 230.946 6 38.491 73.771 .000** S
Residual 205.054 393 .522
Total 436.000 399
**p <0.01, S-Significant
Table 4.42 reveals the p-value which is less than 0.01 and the overall
ANOVA results which assess the overall significance [F.73.77]. This model is
statistically significant. This shows that there is a significant difference between
select variables and motivation for investing in mutual fund investment.
4.8 PURPOSE OF MUTUAL FUND INVESTMENT
There are so many purposes for which the mutual fund investors invest
their movies into the mutual investment. But, the weightage of each and every
purpose cannot be ranked with subjective mind. In order to rank the various
purposes, the Friedman rank test was used and its results were given.
Friedman Rank Test
In the Friedman rank test the scores in each row of the data file stands
independently of every other row. The Friedman chi-square tests the null hypothesis
that the ranks of the variables do not differ from their expected value. For a
Please purchase PDF Split-Merge on www.verypdf.com to remove this watermark.

138
constant sample size, the higher the value of this chi-square statistic, the larger the
difference between each variables rank sum and its expected value.
Table 4.43 shows the Purpose of Mutual Fund Investment.
Table 4.43
Purpose of Mutual Fund Investment and Opinion
S. No. Factors Mean Value Rank
1 Savings 6.80 I
2 Better investments 5.20 IV
3 Tax Benefit 5.50 II
4 Children‟s Education 5.25 III
5 Marriage 4.90 V
6 Medical Expenses 4.10 VIII
7 Low Risk 3.90 IX
8 Switching Facility 4.65 VII
9 Other purpose 4.70 VI
Source: Primary Data
Table 4.43 reveals the Purpose of Mutual fund Investment. The variable
“Savings” was ranked first by the select sample respondents with the mean score
of 6.80. “Tax Benefit” was ranked second with the mean score of 5.50. “Children‟s
Education” occupied third position with the mean score of 5.25. “Better investments”
was ranked fourth with the mean score of 5.20. “Marriage” occupied fifth position
with the mean score of 4.90. “Low risk” occupied last position with the mean
score of 3.90. It is evident that most of the respondents gave top priority to savings
as the first rank for preferring mutual fund investment. Exhibit 4.2 presents the
purpose of mutual fund investment and opinion.
Please purchase PDF Split-Merge on www.verypdf.com to remove this watermark.

139
Exh
ibit
4.2
Pu
rpo
se o
f M
utu
al
Fu
nd
In
ves
tmen
t a
nd
Op
inio
n
Please purchase PDF Split-Merge on www.verypdf.com to remove this watermark.

140
Ho 7: There is no significant difference between mean ranks for respondent‟s
purpose and opinion of mutual fund investment.
Table 4.44 Friedman Test
**P<0.01 S-Significant
Table 4.44 presents the result of the Friedman test. For these rankings, the
chi-square value is 374.9; Degree of freedom is equal to the number of values
minus 1. As nine purpose and opinion of mutual fund investment are ranked, there
are 8 degrees of freedom. It is clear from the above table that significance level is
0.000 at 1 per cent level of significance. Hence the hypothesis is rejected.
4.9 AWARENESS ON THE SCHEMES OF MUTUAL FUND INVESTMENT
The fund sponsoring companies offer various schemes to their investors
with special features. It is not easy to say that all the investors are aware of all the
schemes which are offered by the fund sponsoring companies. The levels of
awareness realized by the investors were studied with the help of weighted
average score.
Weighted Average Score
Table 4.45 deals with the Awareness on the Schemes of Mutual Fund
Investment.
No. of respondents 400
Calculated value 374.94
DF 8
Asymp. Sig. 0.00**
S/NS S
Please purchase PDF Split-Merge on www.verypdf.com to remove this watermark.

141
Table 4.45
Awareness on the Schemes of Mutual Fund Investment
S. No. Name of the Schemes Total Score
Weight
Average
Score
Rank
1 Income fund scheme 1066 2.67 II
2 Growth fund Scheme 1099 2.75 I
3 Conservative fund scheme 830 2.08 X
4 Equity fund 1035 2.59 III
5 Bond fund 1020 2.55 IV
6 Balanced fund 920 2.30 VI
7 Sectoral fund 800 2.00 XII
8 Fund of funds 940 2.35 V
9 Leverage fund 910 2.28 VII
10 Index fund 900 2.25 VIII
11 Tax savings schemes 810 2.03 XI
12 Gold exchange traded fund 560 1.40 XIV
13 Real estate fund 890 2.23 IX
14 Other Schemes 600 1.50 XIII
Source: Primary Data
Table 4.45 exposes the ranking of awareness on the schemes of mutual
fund. “Growth fund Scheme” was ranked first by the select sample respondents
with the total score of 1099 and mean score of 2.75. “Income fund scheme” was
ranked second with the total score of 1066 and mean score of 2.67. “Equity fund”
occupied third position with the total score of 1035 mean score of 2.59. “Bond
Please purchase PDF Split-Merge on www.verypdf.com to remove this watermark.

142
fund” was ranked fourth with the total score of 1020 and mean score of 2.55.
“Fund of funds and Balanced fund” occupied fifth and sixth position with the total
score of 940 & 920 and mean score of 2.35 & 2.3. “Leverage fund” occupied
seventh position with the total score of 910 and mean score of 2.28. “Index fund”
occupied eighth position with the total score of 900 and mean score of 2.25. “Real
estate fund” occupied ninth position with the total score of 890 and mean score of
2.23.“Conservative fund scheme” occupied tenth position with the total score of
830 and mean score of 2.08. “Tax savings schemes” occupied eleventh position
with the total score of 810 and mean score of 2.03. “Sectoral fund” occupied twelfth
position with the total score of 800 and mean score of 2.00. “Other schemes”
occupied thirteenth position with the total score of 600 and mean score of 1.5.
“Gold exchange traded fund” occupied last position with the total score of 560
and mean score of 1.4. It is evident that most of the respondents gave top priority
to Growth fund Scheme as awareness on the schemes of mutual fund.
Exhibit 4.3 shows the Awareness on the schemes of mutual fund
investment.
Please purchase PDF Split-Merge on www.verypdf.com to remove this watermark.
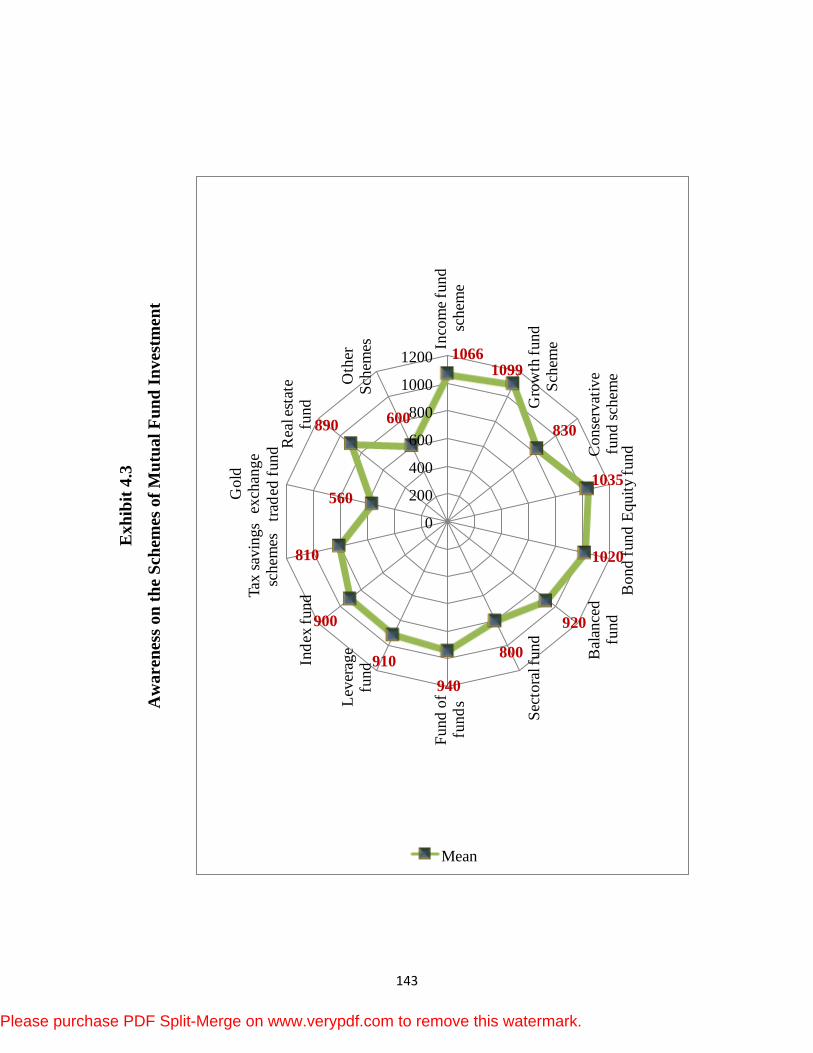
143
10661099
830
1035
1020
920
800
940
910
900
810
560
890600
0
200
400
600
800
1000
1200
Inco
me
fund
sc
hem
e
Gro
wth
fu
nd
S
chem
e
Conse
rvat
ive
fun
d s
chem
eE
qu
ity
fu
nd
Bo
nd
fu
nd
Bal
ance
d
fun
d
Sec
tora
l fu
nd
Fund
of
fun
dsL
ever
age
fundIn
dex
fu
ndT
ax s
avin
gs
sch
emes
Go
ld
exch
ang
e
trad
ed f
un
d Rea
l est
ate
fun
d
Oth
er
Sch
emes
Mean
Exh
ibit
4.3
Aw
are
nes
s o
n t
he
Sch
emes
of
Mu
tua
l F
un
d I
nv
estm
en
t
Please purchase PDF Split-Merge on www.verypdf.com to remove this watermark.