percentages fatigue characterization of enrobés à module
TRANSCRIPT
Fatigue characterization of Enrobés à Module Elevé with high RAPpercentages
Salil Mohan1, a, Robbert Naus1, b
1 Dura Vermeer Infrastructuur BV, Hoofddorp, Netherlands
a [email protected] [email protected]
Digital Object Identifier (DOI): dx.doi.org/10.14311/EE.2016.410
ABSTRACTTo address the increasing traffic on Dutch highways, the application of high modulus asphalt mixtures such as EME, has provento be an excellent concept. The use of a relative low pen binder combined with an increased binder content results in a mixturewith improved stiffness, fatigue and rutting properties. In structural pavement design analysis, the improved properties result in athinner total required asphalt thickness while maintaining the same lifetime expectancy compared to an conventional asphaltmixture.As part for further improving this concept, a laboratory study was carried out to develop an understanding of the effect ofdifferent RAP percentages on mixture performance. Displacement controlled fatigue tests were performed at two strain levelsusing a four – point bending test setup. In this study one type of EME was examined containing RAP percentages of 0, 30, 50 and70%. Additional to fatigue testing, stiffness measurements were also performed.Results from fatigue tests were analyzed using the widely used phenomenological method and a more fundamental approachbased on dissipated energy concepts. Results from both methods were used in an mechanistic – empirical design environment tocalculate minimum required asphalt thicknesses for a chosen situation. In terms of mechanical behaviour, preliminary resultsindicate that the addition of RAP results in marginal differences between the studied mixtures.The paper reports of the different steps and motivation behind choices. Laboratory findings are discussed and compared withexisting models enabling an progress in rational pavement design.
Keywords: Functional specifications, Performance testing, Reclaimed asphalt pavement (RAP) Recycling, Structural fatigue
E&E Congress 2016 | 6th Eurasphalt & Eurobitume Congress | 1-3 June 2016 | Prague, Czech Republic
1. INTRODUCTION
In France in the early eighties an asphalt mixture was developed in order to reduce the pavement thickness with
conservation of the good deformation- and fatigue-properties. This so-called enrobé à module élevé (EME), asphalt
with high stiffness modulus, is nowadays applied on a large scale to realise thin, low-maintenance pavements. The good
French experiences and the Dutch attention for sustainable development and innovation were the reason that Dura
Vermeer Infrastructuur introduced this mixture in the Netherlands (Naus 1998). The first application was in 1998 at the
east carriageway of the A6 (part Muiderberg - Almere Stad West). A reduction in thickness of 25 % with respect to the
design with conventional asphalt was applied.
Since then EME was applied successfully in the Netherlands on larger scale. Additionally, the application of this
mixture was found suitable for strengthening purposes where limits for the underpass at crossovers is critical. The
thickness reduction of 25% results in lower emissions at the asphalt plant, transport and processing per square meter
since the amount of material to be produced and processed is lower.
To further improve this concept, the effect of introducing reclaimed asphalt pavements, hereafter RAP, was studied for
different percentages. With the introduction of higher RAP percentages the amount of to be added new materials
reduces and therefore an overall lower impact on the environment.
The aim of this study was to develop an understanding of the effect of different RAP percentages on EME. For this
purpose laboratory tests were performed, two different fatigue approaches were utilized and pavement design
calculations were performed under Dutch conditions.
2. MATERIALDS AND METHODS
2.1 Mixture design
In this study one type of EME mixture was analyzed containing different RAP percentages. The target design curve and
type of RAP was kept constant for all mixtures. To quantify the effects of different RAP percentages on mixture
properties and its consequences in pavement design analysis, an reference base layer, AC 22 Base 50% RAP, was also
studied.
The type of stone and sand was kept constant for all the mixtures. In the EME mixtures a limestone filler was used
while in the reference mixture a composite filler was used containing hydrated lime. The total bitumen content of the
EME mixtures was kept constant while the reference mixture contained a lower bitumen content of 1% by mass. The
added new bitumen was a pen 15/25 type for the EME mixtures while for the reference mixture a pen 70/100 bitumen
was used. Due to time constraints little attention was paid to fully characterize the different bitumen’s and respectively
blends. The amount of new bitumen was calculated using the so called pen rule:
log 𝑝𝑒𝑛𝑚𝑖𝑥 = 𝐴 ∙ log(𝑝𝑒𝑛𝑅𝐴𝑃) + 𝐵 ∙ log(𝑝𝑒𝑛𝑉𝑖𝑟𝑔𝑖𝑛)
Where
penmix = penetration of the bitumen blend (dmm);
penrap = penetration of the RAP bitumen (dmm);
penvirgin = penetration of the virgin bitumen (dmm);
A, B = individual share (%); A+ B = 1;
The conventional properties of the different bitumen’s are summarized in table 1.
Table 1: Conventional properties of used bitumen
ID Penetration (dmm) Tr&b (°C) P.I.
Pen 70/100 80 47 -0,8
Pen 15/25 20 65 0
RAP bitumen 24 62 -0,2
It is interesting to observe the minimal difference between the field aged bitumen, recovered from the RAP, and the
virgin pen 15/25 bitumen. The conventional results indicate that the “hardness” of the low pen binder and the RAP
binder is almost identical. The low pen binder results from tailor made refinery processes while the RAP bitumen is
assumed to be a product from “conventional” refinery processes. As a result their mechanical behavior might differ.
E&E Congress 2016 | 6th Eurasphalt & Eurobitume Congress | 1-3 June 2016 | Prague, Czech Republic

2.2 Sample preparation and testing
All the mixtures were prepared and tested within the scope of the so called “Type testing” according to European
standard EN 13108 – 20. The sequence of adding the virgin materials and mixing time was kept constant in the
laboratory. After adding the stone and sand fraction, the filler is added followed by the RAP. Hereafter the mixer is
turned on and the bitumen is added gradually. The mixing time was kept constant for 4 minutes. Target mixing
temperatures were set to 185°C for the EME mixtures respectively 160°C for the reference AC 22 Base mixture. The
RAP was pre – heated for a maximum of 3 hours at the chosen mixing temperatures. Mixing was performed using a
laboratory mixer containing two in different directions operating mixing arms and compaction was performed using a
steel roller sector compaction device, see figure 1.
Figure 1: Used mixing (left) and compaction (right) equipment
After compaction, rectangular beams (50*50*450mm) were prepared out of the compacted slabs. Hereafter all the
beams were stored in climate chamber at a temperature between 10 – 15 °C for 14 days and humidity around 70%. In
this study the overall determined air voids varied between 2 and 3% while the average sample density of all the
mixtures was 2385 kg/m³. Stiffness and fatigue tests were performed in a strain – controlled mode using a four – point
bending test setup at one temperature of 20°C. For stiffness measurements, a strain amplitude of 50 µm/m was adapted
at frequencies of 0.1, 0.2, 0.5, 1, 2, 5, 8, 10, 20 and 30 Hz. Fatigue tests were performed at a frequency of 30 Hz. Table
2 gives an overview of the used strain levels for fatigue testing and the number of beams tested for each case.
Table 2: Applied strain levels in fatigue tests (UL= upper level, ML= mid level, LL= lower level)
ID UL ML LL
EME 0% RAP 267 (6) 155 (3)
EME 30% RAP 267 (6) 155 (4)
EME 50% RAP 262 (6) 217 (6) 156 (6)
EME 70% RAP 267 (6) 155 (5)
AC 22 Base 50% RAP 255 (6) 166 (6) 109 (5)
2.3 Fatigue models
Fatigue test results were analyzed using the widely used phenomenological method and a more rational based energy
approach. The phenomenological approach relates the stress or strain in the asphalt layer to the number of load
repetitions that causes failure (Pell, 1962). It is a combination of the phenomenological observation and the laboratory-
tabulated data derived from designated fatigue tests. This approach has been widely used together with Miner’s (1945)
linear law of cumulative damage in structural pavement design because of its simplicity. Results from fatigue tests are
typically formulated as follows depending on the mode:
𝑁𝑓 = 𝐴( 1
𝜖 )𝑏 for strain – controlled tests
E&E Congress 2016 | 6th Eurasphalt & Eurobitume Congress | 1-3 June 2016 | Prague, Czech Republic

𝑁𝑓 = 𝐶( 1
𝜎 )𝑑 for stress - controlled tests
Where
Nf = number of load application to failure;
ε, σ = tensile strain or stress repeatedly applied;
A, b, C, d = material coefficients, derived of fitting the data
Although widely used, the traditional phenomenological approach does not provide a mechanism of damage
accumulation in the mixture under the repetitive load. Furthermore, the accumulated damage is treated as linear in the
strain-fatigue life relationship, which has been found incorrect at low strain/damage condition (Carpenter et al., 2003).
Because it is material and loading mode dependent, this approach cannot be applied directly to the complex loading
scenarios that are actually common to in-service pavements. The traditional approach also does not account for the
complexity of asphalt mixture mechanisms such as healing and stress redistributions, which are known to have
significant effect on the fatigue behavior of asphalt mixtures. Nevertheless it should be noted that over 50 years of
experience has been build up with this approach and its application in pavement design analysis. Therefore from
practical point of view when studying non traditional mixtures and/or materials, the phenomenological approach can
serve as an excellent starting point to develop an estimation.
In addition to the phenomenological method, a dissipated energy approach was utilized to analyze fatigue data.
Applying a load to a material, the area under the stress-strain curve represents the energy being put into the material.
During the loading-unloading process, if the unloading curves do not coincide with the loading but follow different
paths, an energy loss has occurred within the material. Part of the energy is dissipated out of the material system due to
the external work, in the form of mechanical work, heat generation, or damage. The following equation can be used to
calculate the dissipated energy:
𝐷𝐸𝑖 = 𝜋𝜎𝑖휀𝑖sin𝛿𝑖
Where
DEi = dissipated energy in cycle i;
σi = stress level in cycle i;
εi = strain level in cycle i;
δi = phase angle between σ and ε in cycle i;
The relative change in the amount of the dissipated energy is directly related to damage accumulation. A low amount of
relative change in energy dissipation can be found either in high fatigue resistance materials, low external loading
amplitudes, or both. Such relative change in dissipated energy represents the total effect of fatigue damage without the
necessity of considering material type, loading modes and severity separately, Shen and Carpenter (2007).
This concept was first initiated by Carpenter and Jansen (1997) who suggested using the change in dissipated energy to
relate damage accumulation and fatigue life. The work was refined and expanded by Ghuzlan and Carpenter (2000), and
then well applied and verified by Carpenter et al. (2003) who used the ratio of dissipated energy change (RDEC) as an
energy parameter to describe asphalt fatigue damage. This ratio can be represented as:
𝑅𝐷𝐸𝐶𝑎 =𝐷𝐸𝑎 − 𝐷𝐸𝑏
𝐷𝐸𝑎 (𝑏 − 𝑎)
Where
RDECa = the average ratio of dissipated energy change at load cycle a, compared to the next cycle b;
a, b = load cycle a and b;
DEa, DEb= the dissipated energy produced in load cycle a and b respectively;
RDEC eliminates the energy that is dissipating in other forms without producing damage. This provides a true
indication of the damage being done to the mixture from one cycle to another by comparing the previous cycle’s energy
level and determining how much of it caused damage.
Introduced by Ghuzlan (2001) and Carpenter et al. (2003, 2006), the damage curve represented by RDEC vs. loading
cycle’s shows three stages: a rapid decrease, followed by a plateau stage (stage II) for the majority of the fatigue cycles.
E&E Congress 2016 | 6th Eurasphalt & Eurobitume Congress | 1-3 June 2016 | Prague, Czech Republic
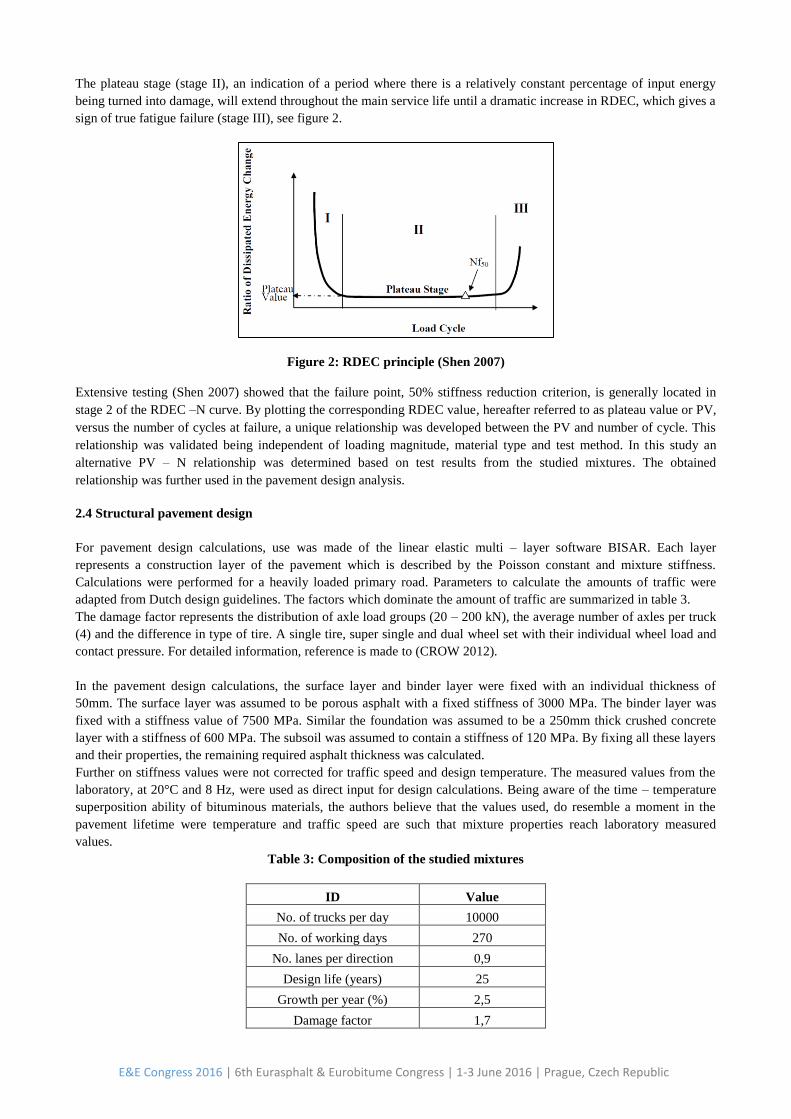
The plateau stage (stage II), an indication of a period where there is a relatively constant percentage of input energy
being turned into damage, will extend throughout the main service life until a dramatic increase in RDEC, which gives a
sign of true fatigue failure (stage III), see figure 2.
Figure 2: RDEC principle (Shen 2007)
Extensive testing (Shen 2007) showed that the failure point, 50% stiffness reduction criterion, is generally located in
stage 2 of the RDEC –N curve. By plotting the corresponding RDEC value, hereafter referred to as plateau value or PV,
versus the number of cycles at failure, a unique relationship was developed between the PV and number of cycle. This
relationship was validated being independent of loading magnitude, material type and test method. In this study an
alternative PV – N relationship was determined based on test results from the studied mixtures. The obtained
relationship was further used in the pavement design analysis.
2.4 Structural pavement design
For pavement design calculations, use was made of the linear elastic multi – layer software BISAR. Each layer
represents a construction layer of the pavement which is described by the Poisson constant and mixture stiffness.
Calculations were performed for a heavily loaded primary road. Parameters to calculate the amounts of traffic were
adapted from Dutch design guidelines. The factors which dominate the amount of traffic are summarized in table 3.
The damage factor represents the distribution of axle load groups (20 – 200 kN), the average number of axles per truck
(4) and the difference in type of tire. A single tire, super single and dual wheel set with their individual wheel load and
contact pressure. For detailed information, reference is made to (CROW 2012).
In the pavement design calculations, the surface layer and binder layer were fixed with an individual thickness of
50mm. The surface layer was assumed to be porous asphalt with a fixed stiffness of 3000 MPa. The binder layer was
fixed with a stiffness value of 7500 MPa. Similar the foundation was assumed to be a 250mm thick crushed concrete
layer with a stiffness of 600 MPa. The subsoil was assumed to contain a stiffness of 120 MPa. By fixing all these layers
and their properties, the remaining required asphalt thickness was calculated.
Further on stiffness values were not corrected for traffic speed and design temperature. The measured values from the
laboratory, at 20°C and 8 Hz, were used as direct input for design calculations. Being aware of the time – temperature
superposition ability of bituminous materials, the authors believe that the values used, do resemble a moment in the
pavement lifetime were temperature and traffic speed are such that mixture properties reach laboratory measured
values.
Table 3: Composition of the studied mixtures
ID Value
No. of trucks per day 10000
No. of working days 270
No. lanes per direction 0,9
Design life (years) 25
Growth per year (%) 2,5
Damage factor 1,7
E&E Congress 2016 | 6th Eurasphalt & Eurobitume Congress | 1-3 June 2016 | Prague, Czech Republic

The calculated traffic was corrected with a so – called “shift factor” to compensate for the difference between
continuous loading in the lab, and rest periods between axle passages in practice. For this purpose use was made of the
empirical relationship adapted from the Dutch design guidelines;
𝑆𝐹 = 1 + 0,0000419 ∙ 𝑉𝑏1,06 ∙ 𝑝𝑒𝑛2,45, 𝑤𝑖𝑡ℎ 𝑆𝐹 ≤ 4
Where
SF = shift factor;
Vb = total mass percentage of bitumen (%m/m ‘in’);
pen = penetration of the bitumen or bitumen blend (dmm);
For the phenomenological approach, allowable strain levels were calculated knowing the N-ε relationship for each
individual mixture. For the RDEC approach, first the PV – N relationship was determined. After knowing the allowable
PV the allowable strain can be calculated if the PV – ε relationship is known for each individual mixture.
3. RESULTS AND DISCUSSION
3.1 Stiffness and fatigue
As stated in the introduction, the objective of this study was to develop an understanding on the effect of different RAP
percentages on the fatigue performance. To compare the performance of the different mixtures use was also made of the
up till now gathered practical knowledge regarding beam testing to distinguish between real differences between
mixtures and differences caused by scatter in experimental data.
Table 4 summarizes the measured stiffness values and fatigue performance of the different mixtures. It can be observed
from the results that the addition of 30% RAP increases the stiffness with approximately 10%. This increase is not
observed when stiffness values of the 30% and 70% RAP mixtures are compared. When the standard deviation for the
individual mixtures is also considered, the results indicate that the difference between the EME mixtures is marginal.
The difference in stiffness values between the 50% RAP mixtures is believed to be the result of the difference in type of
virgin bitumen. The EME 50% RAP mixture has a bitumen content which is 1% higher then the AC 22 mixture. Since
the RAP is constant, the difference can only be explained by the difference in type of bitumen. With the addition of
RAP, a lesser amount of the pen 15/25 bitumen is added to the mixtures and therefore the final performance of the
mixture is believed to be dominated by the properties of the RAP bitumen.
Since the RAP bitumen and pen 15/25 contain identical conventional properties, the marginal differences in mixture
stiffness values indicate that both binders and/or their blends show similar mechanical behavior. No additional tests
were performed to confirm this.
Table 4: Measured mixture characteristics
ID Smix 20°C; 8Hz
(MPa)
ε6
(µm/m)
EME 0% RAP 10979 ± 882 165
EME 30% RAP 12318 ± 265 163
EME 50% RAP 11919 ± 713 166
EME 70% RAP 11863 ± 342 160
AC 22 Base 50% RAP 8512 ± 457 119
Identical as the stiffness results, ε6 values do not differ which imply identical fatigue performance. Further on figure 3
illustrates the marginal differences in fatigue lines between the different mixtures. However the effect of difference in
slope values can best be described by the EME 0% RAP mixture. When compared with the remaining EME mixtures, it
can be observed that the allowable number of cycles at the higher strain levels is the highest for this mixture and the
lowest at the lower strain levels. Although Smix and ε6 values indicate similar behavior between the EME mixtures, in
structural design analysis the phenomenological approach might result in under or over estimated asphalt thicknesses.
E&E Congress 2016 | 6th Eurasphalt & Eurobitume Congress | 1-3 June 2016 | Prague, Czech Republic

Figure 3: Fatigue results phenomenological approach
In figure 4 an example is given of the RDEC versus number of cycles plot for the EME mixture with 0% RAP. In this
experiment the plateau value, PV, was determined by calculating the average RDEC value within a fixed interval. For
this purpose the reduction in mixture stiffness was used as an indicator. For all the studied mixtures, the PV was
consequently calculated in an arbitrary chosen interval between 80 and 65%, see figure 4.
Figure 4: Calculation principle of PV (example: EME 0% PR)
In identical manner the PV was calculated for all the tested beams. Outliers were identified by using Peirce’s criterion
(Ross 2003).
The final results of the PV calculations are summarized in the figures 5 and 6. When average values are compared, a
clear trend is observed with increasing RAP percentages. This increase in plateau value would indicate a decrease in
fatigue performance. When the scatter is taken also taken into consideration, no difference between mixtures is
observed. At the lower strain level, figure 6, the same trend is observed.
1.00E+03
1.00E+04
1.00E+05
1.00E+06
1.00E+07
1.00E+08
50
N
ε (µm/m)
EME 0% RAP
EME 30% RAP
EME 50% RAP
EME 70% RAP
AC 22 Base 50% RAP
E&E Congress 2016 | 6th Eurasphalt & Eurobitume Congress | 1-3 June 2016 | Prague, Czech Republic

Figure 5: Fatigue results, RDEC approach (upper strain level)
Figure 6: Fatigue results, RDEC approach (lower strain level)
In figure 7 the obtained PV-N relationship in this experiment is compared with the unique PV – N relationship found in
literature (Shen 2007). It can be observed from figure 7 that some difference exists between the two models. Although
the measured model is based on limited results, the authors believe that the differences are caused by the difference in
test methods, and data processing techniques. Nevertheless the obtained results confirm the unique relationship between
the plateau value and the number of loading cycles.
E&E Congress 2016 | 6th Eurasphalt & Eurobitume Congress | 1-3 June 2016 | Prague, Czech Republic

Figure 7: Comparison of PV – N relationships
After determining the PV-N relationship, an attempt was made to use the model in a mechanistic – empirical design
environment. For this purpose use was made of the method proposed in the NCHRP Project 9-44. Calculations were
performed for a chosen situation using input from both the phenomenological approach and the energy approach. The
following section discusses the design considerations.
3.2 Pavement design analysis
Pavement design calculations were performed for a heavily loaded primary road. Occurring strains at the bottom of the
base asphalt layer were calculated using BISAR. As already shown in table 4 and figure 3, the fatigue results described
by the phenomenological approach did not differ significantly between the EME mixtures.
For the energy approach, relationships between the PV and the applied strain were derived from the data in order to
calculate allowable strain levels at the bottom of the asphalt layer.
A power function was fitted in the test data.
Figure 8 and table 5 compare the obtained PV – ε relation of the different mixtures.
Table 5: Obtained model parameters PV – ε relationship
ID A B R²
EME 0% RAP 9E-21 5,9793 0,98
EME 30% RAP 6E-19 5,2834 0,94
EME 50% RAP 2E-17 4,6646 0,98
EME 70% RAP 3E-19 5,4692 0,94
AC 22 Base 50% RAP 4E-17 4,7726 0,98
y = 0,1242x-0,931
R² = 0,9554
y = 0,4428x-1,11
1.00E-08
1.00E-07
1.00E-06
1.00E-05
1.00E-04
1.00E-03
1.00E+03 1.00E+04 1.00E+05 1.00E+06 1.00E+07
PV
Nf 50%
Measured
Shen & Carpenter 2007
E&E Congress 2016 | 6th Eurasphalt & Eurobitume Congress | 1-3 June 2016 | Prague, Czech Republic

Figure 8: Comparison of PV – ε relationships
It is pointed out that the obtained relationships in figure 8 are based on limited testing and therefore should be
considered with care. Here the obtained relationships are used for comparison purposes.
Knowing the PV – N relationship, the allowable PV was determined for the chosen traffic level. Substituting this value
in the obtained relationships from figure 8, the allowable strain levels and thus the minimum required asphalt
thicknesses were calculated, see figure 9
It can be concluded from figure 9 that the total required asphalt thicknesses do not vary significant between the different
EME mixtures. The observed differences fall in between the “natural” variation of layer thicknesses in practice. This
observation holds for both the phenomenological and the RDEC approach. Between the two approaches some
difference is observed. The authors believe that additional testing is required to explain these differences. Finally it can
be concluded from figure 9 that a widely use layer reduction of 25 – 30% remains valid for all the studied EME
mixtures.
Figure 9: Comparison of layer thicknesses
1.00E-08
1.00E-07
1.00E-06
1.00E-05
1.00E-04
100
PV
ε (µm/m)
EME 0% RAP
EME 30% RAP
EME 50% RAP
EME 70% RAP
AC 22 Base 50% RAP
0
50
100
150
200
250
300
350
EME 0%
RAP
EME 30%
RAP
EME 50%
RAP
EME 70%
RAP
AC 22 Base
50% RAP
N-ε approach
N-PV approach
To
tal
asp
ha
lt t
hic
kn
ess
(mm
)
E&E Congress 2016 | 6th Eurasphalt & Eurobitume Congress | 1-3 June 2016 | Prague, Czech Republic

4. CONCLUSIONS AND RECOMMENDATIONS
The effect of increasing RAP percentages on mixture stiffness and fatigue performance was studied for one type of
EME. For this purpose use was made of a four point bending test setup. Results from fatigue tests were analyzed using
two different approaches and finally differences were quantified by means of total required asphalt thicknesses for a
chosen situation. On the basis of all the obtained results it is concluded that higher RAP percentages do not affect
mixture performance in a negative way. Marginal differences observed are believed to be a result of data processing
techniques and the natural occurring variance present in laboratory testing. Additional testing is recommended to further
prove this.
The RDEC approach is a promising method to describe the fatigue of asphalt mixtures. Its applicability in structural
pavement design analysis was demonstrated. For this purpose a relationship between the applied strain level and plateau
value needs to be established for the mixture in consideration. It is recommended to further explore if this relation is
independent of the test method.
REFERENCES
Carpenter, S. H., and Jansen M., “Fatigue Behavior Under New Aircraft Loading Conditions”, In Aircraft/Pavement
Technology: In the Midst of Change, Seattle, Washington, 17-21 August 1997. Edited by F.V. Hermann. American
Society of Civil Engineers, New York. pp. 259-271. 1997.
Carpenter, S. H., Ghuzlan, K., and Shen, S., “Fatigue Endurance Limit for Highway and Airport
Pavements”, In Transportation Research Record: Journal of the Transportation Research Board, No. 1832, TRB,
National Research Council, Washington D.C., 2003, pp. 131-138. 2003.
Carpenter, S. H. and Shen, S., “A Dissipated Energy Approach to Study Hot-Mix Asphalt Healing in Fatigue”,
Transportation Research Record (TRR): Journal of the Transportation Research Board, No. 1970, pp.178-185. 2006.
CROW, “Achtergrondrapport Ontwerpinstrumentarium asfaltverhardingen”, CROW-rapport D11-05, Ede 2012.
NEN 13108 – 20: Bituminous mixtures – Material specifications – Part 20: Type testing.
Ghuzlan, K, and Carpenter S.H., “ Energy-Derived/Damage-Based Failure Criteria for Fatigue Testing”, In
Transportation Research Record: Journal of the Transportation Research Board, No.1723, TRB, National Research
Council, Washington D.C. pp. 141-149. 2000.
Ghuzlan, K., “Fatigue Damage Analysis in Asphalt Concrete Mixtures Based upon Dissipated Energy Concept”, PhD
thesis. University of Illinois at Urbana-Champaign, August, 2001.
Miner, M. A., “Cumulative Damage in Fatigue”, Journal of Applied Mechanics, Vol.12, No.3, September 1945, pp.
A159 – A164
Naus R.W.M., Klein de Groot A.J., Eikelboom J.,Jansen Venneboer J.W., “EME, meer met minder”, Wegbouwkundige
werkdagen, CROW Ede, 1998.
NCHRP 9 – 44, “Developing a Plan for Validating an Endurance Limit for HMA Pavements”,
http://onlinepubs.trb.org/onlinepubs/archive/NotesDocs/NCHRP09-44_ResearchPlan.pdf, National Cooperative
Highway Research Program, 2008.
Pell, P.S., “ Fatigue characteristics of bitumen and bituminous mixes”, In Proceedings of the 1st International
Conference on the Structural Design of asphalt pavements, Ann Arbor, Michigan, 20-24 August 1962. Department of
Civil Engineering, University of Michigan, Ann Arbor, Mich., pp- 310-323.
Ross S.M., “Peirce’s criterion for the elimination of suspect experimental data”, Journal of Engineering Technology,
Fall 2003.
Shen, S., Carpenter, S., “Dissipated Energy concept for HMA Performance: Fatigue and Healing”, Department of
Civil and Environmental Engineering. University of Illinois at Urbana-Champaign: Urbana, Illinois. 2007.
E&E Congress 2016 | 6th Eurasphalt & Eurobitume Congress | 1-3 June 2016 | Prague, Czech Republic