percent, ratio, and rate suggested time: 5 · pdf filepercent, ratio, and rate ... ratios, and...
TRANSCRIPT

Percent, Ratio, and Rate
Suggested Time: 5 Weeks

GRADE 8 MATHEMATICS DRAFT CURRICULUM GUIDE142
PERCENT, RATIO, AND RATE
Unit Overview
Focus and Context In this unit, students will work with percents, ratios, and rates, and
solve problems using proportional reasoning. Percents, ratios and
rates, just like fractions and decimals, are comparisons of quantities.
Signifi cant work was done with fractions, decimals, and percents in
Grade 7. However, students worked only with percents between 1%
and 100%. This will now be extended to include percents between 0%
and 1% and greater than 100%. The use of percents is ever-present in
the retail and business worlds, as students will see through problems
involving sales tax and discount. They will also solve problems using
combined percents and percent increase and decrease.
Fractions, decimals and percents are different representations of the
same underlying value. Students will now extend this representation to
include ratios and rates.
A ratio is a comparison of two or more quantities with the same unit,
whereas a rate is a comparison of two quantities measured in different
units. A unit rate, which provides a useful strategy for comparing rates,
is a quantity associated with a single unit of another quantity. Students
will use proportional reasoning to solve problems involving ratios and
rates. It also has a place in other areas of mathematics. For example,
work with similar triangles, dilations, and solving algebraic equations all
involve proportional reasoning.
Math Connects We live in a world of percentages, ratios, rates and proportional
reasoning. Computations with percents are frequently encountered in
real-life situations, from sales tax and discounts to data analysis. On a
daily basis, students encounter percents in the context of test scores,
sports statistics, weather reports, public opinion surveys, nutrition facts
on food packages, and deciding how big a tip to leave in a restaurant.
They should be aware of the role of percents in currency conversions,
interest charges, commission, and wage increases.
Ratios and rates have as many applications. The ratios of a recipe’s
various ingredients are important to ensure the intended outcome.
Rates exist in everyday situations involving speed, fuel consumption,
Internet downloading, and measuring heart rate. The ability to reason
with proportions has a host of applications in everyday life. When
consumers are making price comparisons to determine the better buy,
or when a worker who earns $300 for 8 hours uses this to determine
the number of hours required to earn $1000, proportional reasoning
occurs.
GRADE 8 MATHEMATICS DRAFT CURRICULUM GUIDE 143
PERCENT, RATIO, AND RATE
Process Standards
Key
Curriculum
Outcomes
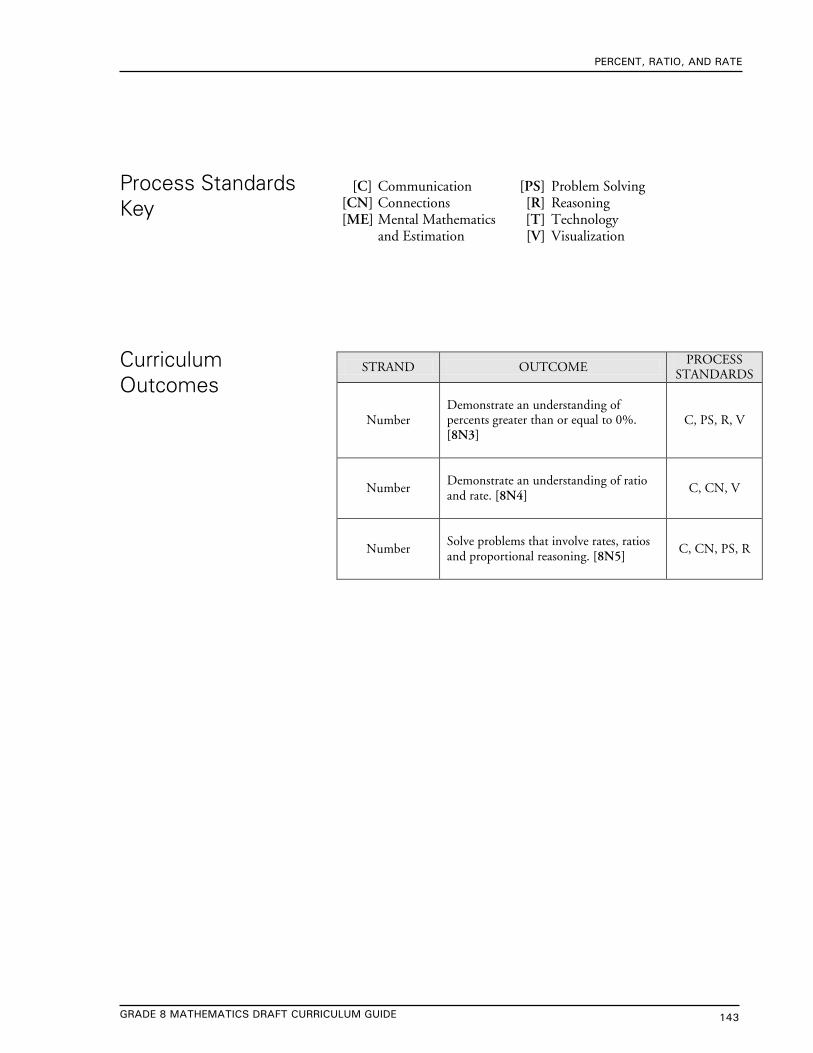
[C] Communication [PS] Problem Solving [CN] Connections [R] Reasoning [ME] Mental Mathematics [T] Technology and Estimation [V] Visualization
STRAND OUTCOME PROCESS
STANDARDS
Number
Demonstrate an understanding of percents greater than or equal to 0%. [8N3]
C, PS, R, V
Number
Demonstrate an understanding of ratio and rate. [8N4]
C, CN, V
Number
Solve problems that involve rates, ratios and proportional reasoning. [8N5]
C, CN, PS, R

144 GRADE 8 MATHEMATICS DRAFT CURRICULUM GUIDE
Outcomes
PERCENT, RATIO, AND RATE
Elaborations—Strategies for Learning and Teaching
Students will be expected to
Strand: Number
8N3 Demonstrate an
understanding of percents greater
than or equal to 0%.
[CN, PS, R, V]
Achievement Indicator:
8N3.1 Provide a context where a percent may be more than 100% or between 0% and 1%.
Discuss with students the relevance of percents in real world
applications.
Compile with students a list of situations where percents are used. This
list may include, but is not limited to:
• test marks (78% on a science test)
• sales tax (13% tax on all sales)
• discount (25% off all purchases)
• probability (10% chance of rain)
• athletic statistics (scored 25% of shots on goal)
Discuss with students situations that may result in percents
• greater than 100%
i) What percent would a student receive on a test containing bonus questions if they got all questions correct?
ii) What percent has the cost of soda pop increased when today’s cost is compared to the cost 50 years ago?
• between 0% and 1%.
i) Ask a hockey fan – What is the percent chance of your favourite team winning the Stanley Cup playoffs?
ii) What is the percent chance that it will snow in August?
In Grade 7, students worked with percents from 1% to 100%. They
converted between percent form, fractional form and decimal form,
and problem solving involved fi nding a percent of a number. Previous
work will now be extended to include percents between 0% and 1% and
percents greater than 100%. Problem solving situations will be more
varied. Students will apply knowledge of percents to fi nd a number
when a percent of it is known, and solve problems involving percent
increase and decrease, combined percents, and fi nding the percent of a
percent.

145GRADE 8 MATHEMATICS DRAFT CURRICULUM GUIDE
Suggested Assessment Strategies Resources/Notes
PERCENT, RATIO, AND RATE
General Outcome: Develop Number Sense
Group Discussion
• Topic 1: When your coach tells you to “give 110%”, what does he
mean? (8N3.1)
• Topic 2: What is the chance that the principal will give you the day
off school because of your smile? (8N3.1)
• Topic 3: A newspaper article includes 200% in its headline. Give a
situation to which the article may be referring. (8N3.1)
Journal
• Paul bragged that he received a 105% on his math test. Is this mark possible? Give an example to support your answer. (8N3.1)
• Jill predicted that the chance of Maple Academy winning the championship game against Evergreen Collegiate is 0.50%. Which school do you think Jill attends? Explain your choice. (8N3.1)
Math Makes Sense 8
Lesson 5.1: Relating Fractions,
Decimals, and Percents
Lesson 5.2: Calculating Percents
ProGuide: pp.4-11, 12-17
Student Book (SB): pp.234-241,
242-247

146 GRADE 8 MATHEMATICS DRAFT CURRICULUM GUIDE
Outcomes
PERCENT, RATIO, AND RATE
Elaborations—Strategies for Learning and Teaching
Students will be expected to
Strand: Number
8N3 Continued
Achievement Indicators:
8N3.2 Represent a given fractional percent using grid paper.
8N3.3 Represent a given percent greater than 100 using grid paper..
8N3.4 Determine the percent represented by a given shaded region on a grid and record it in decimal, fractional and percent form.
Students have been introduced to whole percents from 1% to 100% in
previous grades. It is assumed they represented whole number percents
using grid paper. In Grade 8, this is expanded to percents between 0%
and 1%, percents greater than 100%, as well as other fractional percents.
Begin with using a hundreds grid chart to represent percents. Each small
square represents 1%. For fractional percents that are easily recognizable,
i.e. 0.5%, the hundreds grid will be suffi cient (shade ½ of one small
square). To represent 29.5% using grid paper the hundreds grid block is
suffi cient, since 0.5% would represent half a block. (See diagram below)
In th is d iagram , out o f the 100 b locks , 29 fu ll b locks and ha lf o f another b lock are shaded. T h is w ould represent 29.5% .
However, other percents may need to utilize the hundredths grid chart.
At this point, the focus for achievement indicator 8N3.4 will be on
representing the percent using grid paper. Decimal and fractional form
of percents will be explored later in the unit.
Consider 30.15%; a hundreds chart is needed to indicate the 30%, but
0.15 of a block is harder to recognize. To accomplish this we introduce
a smaller hundreds chart to the side of the original chart. This smaller
chart will represent the hundredths partitions of the 31st square. By
shading 15 of the blocks in this smaller chart we indicate the 0.15%.
In th is d iagram , out o f the 100 b locks, 30 fu ll b locks and part o f another b lock are shaded. S ince it is harder to recognise 0 .15 o f the b lock be ing shaded, the hundredths grid chart is used and 15 o f those 100 b locks are shaded.
Continued

147GRADE 8 MATHEMATICS DRAFT CURRICULUM GUIDE
Suggested Assessment Strategies Resources/Notes
PERCENT, RATIO, AND RATE
General Outcome: Develop Number Sense
Math Makes Sense 8
Lesson 5.1: Relating Fractions,
Decimals, and Percents
Lesson 5.2: Calculating Percents
ProGuide: pp.4-11, 12-17
CD-ROM: Master 5.21, 5.22
SB: pp.234-241, 242-247
Practice and HW Book: pp.102-
104, 105-106
Paper and Pencil
• Refer to the NL government website for Representing Percents.
www.ed.gov.nl.ca/edu/k12/curriculum/guides/mathematics/
(8N3.2, 8N3.3, 8N3.4)

148 GRADE 8 MATHEMATICS DRAFT CURRICULUM GUIDE
Outcomes
PERCENT, RATIO, AND RATE
Elaborations—Strategies for Learning and Teaching
Students will be expected to
Strand: Number
8N3 Continued
Achievement Indicators:
8N3.2 Continued
8N3.3 Continued
8N3.4 Continued
Fractional percents less than 1% can also be represented using the
hundredths chart, as no full blocks would be shaded in the hundreds
chart. The diagram below represents 0.28%.
In th is d iagram , part o f a b lock is shaded. The hundred ths chart is used and 28 b locks ou t o f 100 a re shaded.
Percents greater than 100% are represented using more than one
hundreds grid chart. The diagram below represents 240%.
In th is d iag ram , two fu ll hundreds charts and 40 b locks o f ano ther hundred chart a re shaded .

149GRADE 8 MATHEMATICS DRAFT CURRICULUM GUIDE
Suggested Assessment Strategies Resources/Notes
PERCENT, RATIO, AND RATE
General Outcome: Develop Number Sense
Math Makes Sense 8
Lesson 5.1: Relating Fractions,
Decimals, and Percents
Lesson 5.2: Calculating Percents
ProGuide: pp.4-11, 12-17
CD-ROM: Master 5.21, 5.22
SB: pp.234-241, 242-247
Practice and HW Book: pp.102-
104, 105-106

150 GRADE 8 MATHEMATICS DRAFT CURRICULUM GUIDE
Outcomes
PERCENT, RATIO, AND RATE
Elaborations—Strategies for Learning and Teaching
Students will be expected to
Strand: Number
8N3 Continued
Achievement Indicators:
8N3.5 Express a given percent in decimal or fractional form.
8N3.6 Express a given decimal in percent or fractional form.
8N3.7 Express a given fraction in decimal or percent form.
8N3.4 Continued
In previous grades, students have shifted between percent, fraction and
decimal equivalents for whole number percents between 1% and 100%.
They will apply these skills to fractional percents between 0% and 1%,
percents greater than 100%, as well as other fractional percents.
Fractional percents between 0% and 1% must be developed at a sensible
pace. There is sometimes a tendency among students to see the percent
0.1% as the decimal 0.1. It is important to distinguish the difference
in these two forms. Similarly, students may confuse 34
% with 75%.
The hundreds and hundredths grid charts will help distinguish these
differences. Given a shaded region on a grid, students will be expected
to express the shaded region in fraction, decimal or percent form.
Another strategy that can be used when dealing with percents greater
than 100% and between 0% and 1% is patterning.
For example:
Percent Decimal Fraction 0.3% 0.003 3
1000
3% 0.03 3
100
30% 0.3 3
10
300% 3 3
1
Percent Decimal Fraction 70% 0.7 7
10
7% 0.07 7
100
0.7% 0.007 7
1000
0.07% 0.0007 7
10000

151GRADE 8 MATHEMATICS DRAFT CURRICULUM GUIDE
Suggested Assessment Strategies Resources/Notes
PERCENT, RATIO, AND RATE
General Outcome: Develop Number Sense
Paper and Pencil
• Copy and complete the following table. (8N3.5, 8N3.6, 8N3.7)
Percent Decimal Fraction 148%
7
20%
26.4% 2.65 0.003 0.254 8
5
1
250
3
8
• As a decimal 140% = 1.40. Use patterning to write the following percents in decimal form.
(i) 14%(ii) 1.4%(iii) 0.14%
(8N3.5, 8N3.6, 8N3.7)
• As a fraction 0.09% = 10000
9 , use patterning to write the following percents in fraction form.
(i) 0.9%(ii) 9%(iii) 90%(iv) 900%
(8N3.5, 8N3.6, 8N3.7)
Journal
• Your friend was absent from school when your teacher explained fractional percents. When he was studying for his test, he said that
12
% was 0.5 as a decimal. How would you help him to understand the mistake he made? (8N3.5, 8N3.6, 8N3.7)
Math Makes Sense 8
Lesson 5.1: Relating Fractions,
Decimals, and Percents
Lesson 5.2: Calculating Percents
ProGuide: pp.4-11, 12-17, Master
5.6a, 5.6b
CD-ROM: Master 5.21, 5.22
SB: pp.234-241, 242-247
Practice and HW Book: pp.102-
104, 105-106

152 GRADE 8 MATHEMATICS DRAFT CURRICULUM GUIDE
Outcomes
PERCENT, RATIO, AND RATE
Elaborations—Strategies for Learning and Teaching
Students will be expected to
Strand: Number
8N3 Continued
Achievement Indicators:
8N3.8 Solve a given problem involving percents.
In grade 7, students explored various strategies to calculate the percent of
a number. These strategies are found in Unit 3 of the grade 7 curriculum
guide and teachers should review these for themselves before proceeding.
In grade 8, the focus will be on problems involving calculating the whole
when the percent is given, and percent increase and decrease. Problems
may also include fi nding percents when given the part and the whole,
which is the same as changing from fraction form to percent form.
First Method
A visual model can be used to develop this notion using benchmark
percentages like 10%, 25% or 50%.
25% of a number is 80. What is the number?
0% 100%25%
0 80 ?
0% 25% 50% 75% 100%
0 80 160 240 320
Place 80 above the 25% mark on a number line that runs from 0% to 100%.
Write appropriate multiples of 80 above the appropriate multiples of 25% until you reach 100%. The matching multiples, 320 and 100%, are equivalent.
Second Method
5% of a number is 20. What is the number?
Since 5% of a number is 20, then 1% must be 4. ( )20 5 4÷ =
Multiply 4 by 100; the answer 400 must be 100%.
Therefore, the number is 400.
Later, students may use properties of proportions to fi nd wholes given
parts of wholes.
Continued

153GRADE 8 MATHEMATICS DRAFT CURRICULUM GUIDE
Suggested Assessment Strategies Resources/Notes
PERCENT, RATIO, AND RATE
General Outcome: Develop Number Sense
Math Makes Sense 8
Lesson 5.2: Calculating Percents
Lesson 5.3: Solving Percent Problems
Lesson 5.4: Sales Tax and Discount
ProGuide: pp.12-17, 18-25, 26-33
CD-ROM: Master 5.22, 5.23, 5.24
SB: pp.242-247, 248-255, 256-262
Practice and HW Book: pp.105-106, 107-109, 110-111
Paper and Pencil
• Trina received an 80% on a recent math test. If she answered 48 questions correctly, how many questions were on the test? (8N3.8)
• Adam increased his song list by 40%. If he had 300 songs originally, how many songs does he now have? (8N3.8)
• Shawn earned $85 and spent $15. What percent of his money did he spend? (8N3.8)
• Last week the canteen sold 60 sandwiches. This week they sold 48 sandwiches. Calculate the percent change. How can you check that the percent change is correct? (8N3.8)
Journal
• Catherine said that her amount of homework increased 400% when it went from one half hour of work to two hours of work. Do you agree? Explain. (8N3.8)

154 GRADE 8 MATHEMATICS DRAFT CURRICULUM GUIDE
Outcomes
PERCENT, RATIO, AND RATE
Elaborations—Strategies for Learning and Teaching
Students will be expected to
Strand: Number
8N3 Continued
Achievement Indicators:
8N3.8 Continued Problems involving percent increase and decrease are present in many
applications. Consider the following example.
The enrolment in junior high last year was 120 students. This year
enrolment increased by 15%. What is the enrolment this year?
( )( )15% of 120 0.15 120 18
Add 18 to 120 : 18 120 138
= =
+ =
The enrolment this year is 138 students.
Another application of percent increase and decrease is to fi nd the
amount of change as a percentage rather than the fi nal/initial amounts.
The formula for this calculation is:
% of change = 100
Final Amount Original Amount
Original Amount
−×
Example 1: A tree which was 3.7 m high last year is measured and found to
now be 4.8 m tall. What is the percent change in the height of the tree?
% of change = 100
4.8 3.7% of change = 100
3.7
1.1% of change = 100
3.7
% of change = 29.7%
Final Amount Original Amount
Original Amount
−×
− ×
×
The height of the tree increased by 29.7% in one
year.
Example 2: A large bag of potato chips used to cost $2.99. The store offered
the chips at the new price of $2.65 during the Christmas season. What is the
percent change in the price of the chips over the Christmas season?
% of change = 100
2.65 2.99% of change = 100
2.99
0.34% of change = 100
2.99
% of change = 11.4%
Final Amount Original Amount
Original Amount
−×
− ×
− ×
−
Notice that the percent change is a negative number. This means that the
change is a decrease.

155GRADE 8 MATHEMATICS DRAFT CURRICULUM GUIDE
Suggested Assessment Strategies Resources/Notes
PERCENT, RATIO, AND RATE
General Outcome: Develop Number Sense
Math Makes Sense 8
Lesson 5.2: Calculating Percents
Lesson 5.3: Solving Percent Problems
Lesson 5.4: Sales Tax and Discount
ProGuide: pp.12-17, 18-25, 26-33
CD-ROM: Master 5.22, 5.23, 5.24
SB: pp.242-247, 248-255, 256-262
Practice and HW Book: pp.105-106, 107-109, 110-111
Performance
• “Beat that Percent” Game (8N3.8)
Goal
The goal of the game is to obtain 10 points before your opponent(s).
How to Play
1. Shuffl e the cards. Deal four cards to each player. 2. The aces count as 1, the face cards count as 0 and numbered
cards count as their face values. 3. Each player chooses two of the cards to form a two digit
number that represents a percent. The remaining two cards form a two digit number.
4. Calculate the percent of the number. 5. Compare results with your opponent(s). The one with the
greatest value gets a point.

156 GRADE 8 MATHEMATICS DRAFT CURRICULUM GUIDE
Outcomes
PERCENT, RATIO, AND RATE
Elaborations—Strategies for Learning and Teaching
Students will be expected to
Strand: Number
8N3 Continued
Achievement Indicator:
8N3.9 Solve a given problem involving combined percents.
A common example of combined percents is addition of percents, such
as GST + PST. Students encounter combined percentages everyday
when they buy items at stores. Tax is charged in Newfoundland and
Labrador by both the federal and provincial government. Currently, the
Federal government charges 6% (GST – Goods & Services Tax) and the
Provincial government charges 7% (PST – Provincial Sales Tax). This
means a total of 13% tax is charged on purchases in Newfoundland and
Labrador. This is called HST, or Harmonized Sales Tax.
Jason purchases a hockey stick that has a sticker price of $74.99. Find the
total price Jason must pay for the stick, and also fi nd the amount of that
total price that is GST and what amount is PST.
( )( )Total Price = Sticker Price + Sales Tax
Total Price = 74.99 0.13 74.99
Total Price = 74.99 9.75
Total Price = 84.74
+
+
The total price is $84.74.
GST Calculation PST Calculation
( ) ( )74.99 0.06 4.50× =
GST = $4.50
( ) ( )74.99 0.07 5.25× =
PST = $5.25
Notice that GST + PST = $9.75, which was the calculated HST.

157GRADE 8 MATHEMATICS DRAFT CURRICULUM GUIDE
Suggested Assessment Strategies Resources/Notes
PERCENT, RATIO, AND RATE
General Outcome: Develop Number Sense
Math Makes Sense 8
Lesson 5.4: Sales Tax and
Discount
ProGuide: pp. 26-32
CD-ROM: Master 5.24
SB: pp.256-262
Practice and HW Book: pp.110-
111
Paper and Pencil
• Sheri regularly travels across Canada. She plans on purchasing a new laptop. The laptop sells for $2150 in both provinces. In which province should Sheri purchase the laptop? Explain. (8N3.9)
Note: A table of provincial tax rates is found in the student book on page 256.
Journal
• Your friend lives in Ontario. You plan a trip together to Quebec City and want to wear matching jackets during the trip. The jacket costs $59.90 in each province. Write an email to your friend to convince her in which of the three provinces, Ontario, Newfoundland and Labrador, or Quebec, the jackets should be purchased, and why. (8N3.9)

158 GRADE 8 MATHEMATICS DRAFT CURRICULUM GUIDE
Outcomes
PERCENT, RATIO, AND RATE
Elaborations—Strategies for Learning and Teaching
Students will be expected to
Strand: Number
8N3 Continued
Achievement Indicator:
8N3.10 Solve a given problem that involves finding the percent of a percent.
There are situations in everyday life that involve applying percentage
calculations more than once before an answer is found. An example
of this is when stores hold a “NO TAX” sale. It can be discussed with
students why the price they pay at such a sale is always a little bit less
than the sticker price. They might have believed that the price they pay
would simply be the price on the sticker if there was no tax. However,
by law, stores have to charge tax. They will fi rst discount the price by
the tax rate. Then, they add the tax back on to that discounted amount.
Since they are calculating tax on a smaller amount the fi nal price will be
a little less than the original sticker price.
Brenda fi nds the perfect coat for winter at the local mall on a day the mall is
having a NO TAX sale. The coat is marked $125. How much will Brenda
pay for the coat?
First the store must discount the coat by 13%.
( )( )125 0.13 125
125 16.25
108.75
−
−
Now the store must add 13% tax to this discounted price.
( )( )108.75 108.75 0.13
108.75 14.14
122.89
+
+
Notice $122.89 is a little less than the original price of $125.
Combined percents are not limited to consumer purchases problems.
Students should be exposed to other types of problems as well.

159GRADE 8 MATHEMATICS DRAFT CURRICULUM GUIDE
Suggested Assessment Strategies Resources/Notes
PERCENT, RATIO, AND RATE
General Outcome: Develop Number Sense
Math Makes Sense 8
Lesson 5.4: Sales Tax and Discount
ProGuide: pp.26-32
CD-ROM: Master 5.24
SB: pp.256-262
Practice and HW Book: pp.110-111
Paper and Pencil
• Two stores offer different discount rates as follows:
Store A: 50% off one day only.
Store B: 25% off one day followed by 25% off the reduced price the second day.
Which store has the better sale? (8N3.10)
Journal
• A jacket cost $100. The discount on the jacket is 15%. However you must also pay 15% sales tax. Would the jacket cost you $100, less than $100 or more than $100? Explain your reasoning. (8N3.10)
• Charlie works part-time at a local fast food restaurant. On his next pay check, he will receive a 5% increase in pay on top of a 10% performance bonus. Charlie tells his friends he is receiving a15% raise in pay. Is he correct? Explain. (8N3.10)
Problem Solving
• Cyril collects hockey cards. He had 150 cards in his collection. His birthday was in June and his friends gave him hockey cards as presents which increased his collection by 20%. At Christmas his hockey card collection increased by another 15%. How many cards are in his collection after this 15% increase? (8N3.10)

160 GRADE 8 MATHEMATICS DRAFT CURRICULUM GUIDE
Outcomes
PERCENT, RATIO, AND RATE
Elaborations—Strategies for Learning and Teaching
Students will be expected to
Strand: Number
8N4 Demonstrate an
understanding of ratio and rate.
[C, CN, V]
Achievement Indicators:
8N4.1 Express a two-term ratio from a given context in the forms 3:5 or 3 to 5.
Students have had previous exposure to ratios. In grade 6, they defi ned,
represented and interpreted ratios presented to them concretely. In grade
7, they related ratio to fractions and percent, and solved proportions
within problem solving situations involving percent. In this unit,
students will build on and extend their knowledge of ratio. They will
also be introduced to rate. They will describe and record rates using real-
life examples. Exposure to problem solving situations using unit rates
and unit prices should lead them to make connections between math
and everyday life.
It may be necessary to remind students that a ratio is a comparison of
two numbers. Consider the following examples.
13 people rode the rollercoaster; 2 of them were girls. The ratio of
people to girls was 13:2, and this gives an example of a whole-to-part
ratio.
In an orchard with 80 trees, 43 of the trees were apple trees and the rest
were pear trees. The ratio of apple trees to pear trees was 43:37, which
represents a part-to-part ratio.
These examples can be developed into three-term ratios.
If 13 people rode the rollercoaster and 2 of them were girls, the ratio can
also be expressed as Boys : Girls : Total People = 11:2:13, or 11 to 2 to 13.
Similarly, in an orchard with 80 trees, if 43 of the tress were apple trees
and the rest were pear trees, a resulting three-term ratio compares Apple
to Pear to Total Trees, or 43 to 37 to 80 = 43:37:80.
8N4.2 Express a three-term ratio from a given context in the forms 4:7:3 or 4 to 7 to 3.

161GRADE 8 MATHEMATICS DRAFT CURRICULUM GUIDE
Suggested Assessment Strategies Resources/Notes
PERCENT, RATIO, AND RATE
General Outcome: Develop Number Sense
Math Makes Sense 8
Lesson 5.5: Exploring Ratios
ProGuide: pp.34-38
CD-ROM: Master 5.25
SB: pp.264-268
Practice and HW Book: pp.112-
114
Discussion
• In your classroom state these ratios:
(i) Boys to girls(ii) Girls to boys(iii) Boys to total students(iv) Boys to girls to total students(v) Window to doors(vi) Desks to chairs (8N4.1,8N4.2)
Paper and Pencil
• Write a part:part:whole ratio for each situation.
(i) A bag contains 3 jujubes and 5 lollipops.(ii) A fi shing basket holds 6 trout and 5 smelt.(iii) In the harbour there are two types of boats: dories and
longliners. There are 40 boats in total and seven of them are longliners.
(8N4.2)

162 GRADE 8 MATHEMATICS DRAFT CURRICULUM GUIDE
Outcomes
PERCENT, RATIO, AND RATE
Elaborations—Strategies for Learning and Teaching
Students will be expected to
Strand: Number
8N4 Continued
8N5 Solve problems that involve
rates, ratios and proportional
reasoning.
[C, CN, PS, R]
Achievement Indicators:
8N4.3 Express a part-to-part ratio as a part-to-whole fraction.
8N5.1 Explain the meaning of ab
within a given context.
8N5.2 Provide a context in
which ab
represents a:
• fraction
• rate
• ratio
• quotient
• probability.
8N4.4 Identify and describe ratios from real-life examples, and record them symbolically.
Once students have an understanding that a part-to-part ratio compares
one part of a set to another part of a set, while a part-to-whole ratio
compares one part of a set to the whole set, they should be able to
convert a part-to-part ratio to a part-to-whole ratio. For example, 1 can
concentrate of frozen juice to 4 cans of water can be represented as 15
,
which is the ratio of concentrate to solution, or 45
, which is the ratio of
water to solution.
It should be emphasized that only part-to-whole ratios can be expressed
as fractions because the denominator is always referencing the whole.
Students could be asked to explain a ratio such as in the context of a
real-life example. It could be described as a part-to-whole ratio, where
the numerator represents a part of the whole, and the denominator
represents the whole. For example, Daniel gets a hit 2 out of every 9
times he goes to bat. The ratio of hits to bats is 2:9.
Teachers should note that probability will be studied in a later unit:
Data Analysis and Probability. Ratios can then be re-examined to
determine probabilities of events.
Ratios are encountered frequently when describing real world situations.
Students should be encouraged to write ratios in words fi rst. This
may assist them in writing the terms of a ratio in the correct order of
comparison when expressing them in number form.

163GRADE 8 MATHEMATICS DRAFT CURRICULUM GUIDE
Suggested Assessment Strategies Resources/Notes
PERCENT, RATIO, AND RATE
General Outcome: Develop Number Sense
Math Makes Sense 8
Lesson 5.5: Exploring Ratios
ProGuide: pp.34-38
CD-ROM: Master 5.25
SB: pp.264-268
Practice and HW Book: pp.112-
114
Paper and Pencil
• Write each ratio as a fraction in simplest form.
(i) 14 to 6 (ii) 4:22 (iii) 18:12 (iv) 25 to 20 (v) 18:21 (vi) 18:3(vii) 7:21(viii) 20 to 9(ix) 4:10(x) 84 to 16
(8N4.3)

164 GRADE 8 MATHEMATICS DRAFT CURRICULUM GUIDE
Outcomes
PERCENT, RATIO, AND RATE
Elaborations—Strategies for Learning and Teaching
Students will be expected to
Strand: Number
8N4 and 8N5 Continued
Students were exposed to converting from a fraction to a percent
in previous grades. They revisited this earlier in the unit when they
expressed a fraction in percent form.
To effectively solve ratio problems, comparing ratios is necessary. The
following are effective strategies that can be used for ratio comparison.
• Use equivalent ratios
• Use unit ratios
• Use percents
Relate equivalent ratios to earlier work with equivalent fractions.
Remind students that fi nding an equivalent fraction involves
multiplying the numerator and denominator by the same non-zero
number. A brief review of reducing fractions to simplest form may be
necessary.
A unit ratio has a term of 1. To compare 20:5 with 140:20, note that
20:5 = 4:1 and 140:20 = 7:1. It should then be clear that 140:20 is the
greater ratio.
Students will now apply work with ratios to problem solving situations.
There are many types of problems involving ratios, and students
should be exposed to a variety. In many problem solving situations,
one term of a proportion is missing and must be determined. Students
must be made aware that a proportion is a relationship in which two
ratios are equal. Proportional reasoning problems can be solved using
several different methods. A possible solution method is given with the
following example.
The ratio of indoor basketballs to outdoor basketballs at the recreation centre
is 6:3. If the recreation centre has 45 basketballs, how many of them are
indoor basketballs?
Let x represent the number of indoor basketballs. It is necessary to compare
the number of indoor balls to the total number of balls, resulting in the part-
to-whole ratio 6:9. Use a proportion and solve with equivalent fractions.
69 45
x=
Since 9 5 45× = , multiply the numerator by 5 as well. This results in
6 5x = × . Therefore, there are 30 indoor basketballs.
Achievement Indicators:
8N4.5 Express a given ratio as a percent.
8N5.3 Solve a given problem involving ratio.

165GRADE 8 MATHEMATICS DRAFT CURRICULUM GUIDE
Suggested Assessment Strategies Resources/Notes
PERCENT, RATIO, AND RATE
General Outcome: Develop Number Sense
Math Makes Sense 8
Lesson 5.5: Exploring Ratios
Lesson 5.6: Equivalent Ratios
Lesson 5.7: Comparing Ratios
Lesson 5.8: Solving Ratio
Problems
ProGuide: pp.34-38, 39-45, 49-
56, 57-63, Master 5.6a, 5.6b
CD-ROM: Master 5.25, 5.26,
5.27, 5.28
SB: pp.264-268, 269-275, 279-
286, 287-293
Practice and HW Book: pp.112-
114, 115-117, 118-121, 122-123

166 GRADE 8 MATHEMATICS DRAFT CURRICULUM GUIDE
Outcomes
PERCENT, RATIO, AND RATE
Elaborations—Strategies for Learning and Teaching
Students will be expected to
Strand: Number
8N4 and 8N5 Continued
Achievement Indicators:
8N4.6 Express a given rate using words or symbols, e.g., 20 L per 100 km or 20L/100 km.
8N4.7 Identify and describe rates from real-life examples, and record them symbolically.
8N5.1 Explain the meaning of ab
within a given context.
8N5.2 Provide a context in
which ab
represents a:
• fraction
• rate
• ratio
• quotient
• probability.
Students have worked with ratios, which compare quantities with the
same unit. Now the focus shifts to rates, which involve quantities with
different units. However, the mathematics used to talk about rates is
the same as the mathematics used to talk about ratios. Both represent
comparisons. Problems involving rates can be solved using the same
techniques as those involving ratios.
Students must be reminded to include the units when writing rates.
Because a rate compares quantities measured in different units, without
the units a rate has no meaning.
Students should be familiar with numerous and various examples of
rates already, even if they couldn’t previously identify them as rates.
Have the class brainstorm to identify as many real-life examples of rates
as possible. Some examples that students should relate to include speed
(km/h), text messaging rates ($/month), and school schedules (periods/day
or days/cycle).
It is important to continue emphasizing that a rate compares two
different things. In any context students may provide in which ab
represents a rate, two quantities in different units must be compared.
The distinction between ratios and rates is subtle. As students work with
rates, they should be encouraged to continue to examine the similarities
and differences and make connections between ratios and rates.
A fundamental difference between the two is the ability to represent a
ratio, but not a rate, as a percent. Students should recall from previous
work with ratios in this unit that part-to-whole ratios can be expressed
as a percent, whereas part-to-part ratios cannot. For example, if Daniel
gets a hit 2 out of every 9 times at bat, this is a ratio that can be writ-
ten as a percent. If the hits are thought of as successful at bats, parts of
a whole are being compared to the whole. A percent compares part of a
whole to the whole. Because the units in a rate are different, there isn’t a
whole to make a comparison to. Therefore, a rate cannot be represented
as a percent.
8N4.8 Explain why a rate cannot be represented as a percent.
167GRADE 8 MATHEMATICS DRAFT CURRICULUM GUIDE
Suggested Assessment Strategies Resources/Notes
PERCENT, RATIO, AND RATE
General Outcome: Develop Number Sense
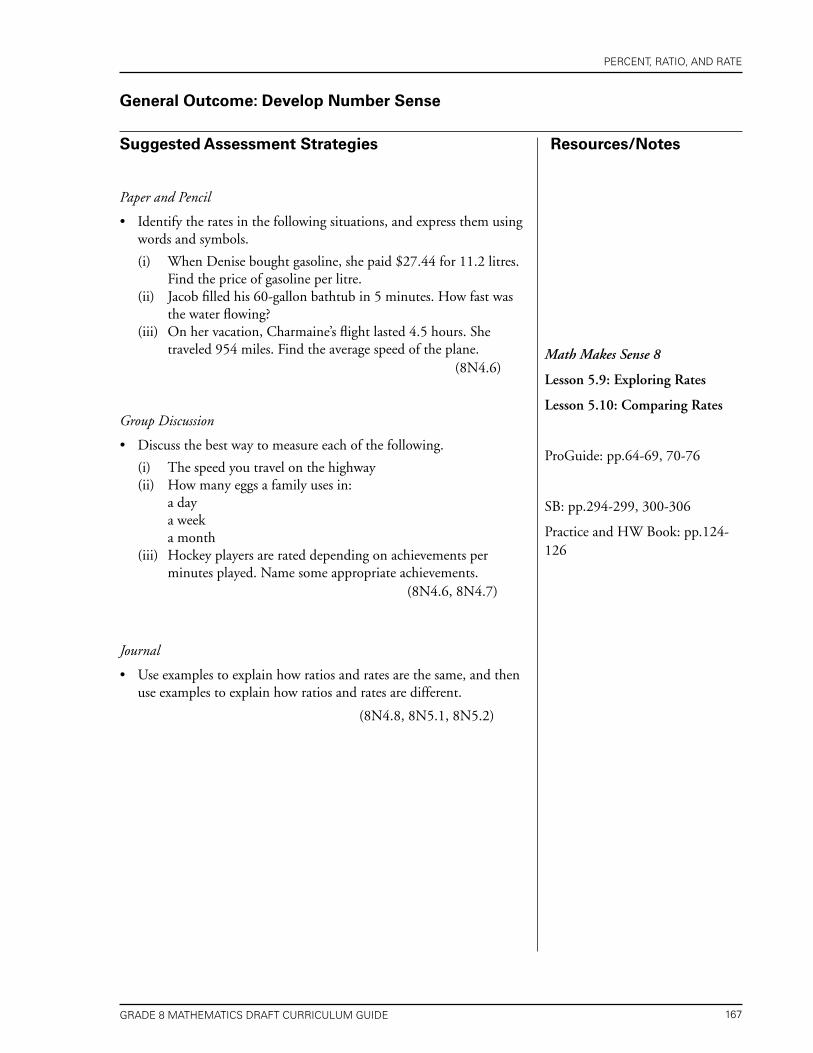
Paper and Pencil
• Identify the rates in the following situations, and express them using words and symbols.
(i) When Denise bought gasoline, she paid $27.44 for 11.2 litres. Find the price of gasoline per litre.
(ii) Jacob fi lled his 60-gallon bathtub in 5 minutes. How fast was the water fl owing?
(iii) On her vacation, Charmaine’s fl ight lasted 4.5 hours. She traveled 954 miles. Find the average speed of the plane.
(8N4.6)
Group Discussion
• Discuss the best way to measure each of the following.
(i) The speed you travel on the highway(ii) How many eggs a family uses in: a day a week a month(iii) Hockey players are rated depending on achievements per
minutes played. Name some appropriate achievements.
(8N4.6, 8N4.7)
Journal
• Use examples to explain how ratios and rates are the same, and then use examples to explain how ratios and rates are different.
(8N4.8, 8N5.1, 8N5.2)
Math Makes Sense 8
Lesson 5.9: Exploring Rates
Lesson 5.10: Comparing Rates
ProGuide: pp.64-69, 70-76
SB: pp.294-299, 300-306
Practice and HW Book: pp.124-
126

168 GRADE 8 MATHEMATICS DRAFT CURRICULUM GUIDE
Outcomes
PERCENT, RATIO, AND RATE
Elaborations—Strategies for Learning and Teaching
Students will be expected to
Strand: Number
8N5 Continued
Achievement Indicator:
8N5.4 Solve a given problem involving rate.
Proportional reasoning can be developed through activities that
compare and determine the equivalence of ratios and rates, and
solving proportions in a wide variety of problem-based contexts. It is
important that students see the usefulness of proportions. The topic
is rich in problem-solving opportunities and lends itself to real-world
applications. For example, ratios, rates and proportions are commonly
used for scale models, altering a recipe, and comparison shopping.
Problem solving with rates often involves comparing rates. When
writing equivalent rates, students should check to be sure the
positioning of the units in the terms within each rate is the same. For
example, a rate equivalent to 100 km/h should be able to be written as
a fraction with the measurement of distance in the numerator and the
measurement of time in the denominator.
To solve problems involving distance, time and average speed, or to
determine the better buy in consumer situations, it is often benefi cial to
use unit rates. A unit rate illustrates two measurements that are directly
proportional, where one term is 1.
It is important for students to be aware that when they are comparing
unit rates, the numbers must be in the same units. For example, if
comparing one quantity measured in grams with another measured
in kilograms, the options are to change both measurements to grams
or kilograms. The unit of measurement used for such a unit rate is
often the student’s choice. A review of conversion from one unit of
measurement to another may be necessary here.
Sample problems with two possible solution methods follow on the next
two-page spread.
Continued

169GRADE 8 MATHEMATICS DRAFT CURRICULUM GUIDE
Suggested Assessment Strategies Resources/Notes
PERCENT, RATIO, AND RATE
General Outcome: Develop Number Sense
Math Makes Sense 8
Lesson 5.9: Exploring Rates
Lesson 5.10: Comparing Rates
ProGuide: pp.64-69, 70-76,
Master 5.7a, 5.7c
CD-ROM: Master 5.29
SB: pp.294-299, 300-306
Practice and HW Book: pp.124-
126, 127-128
Paper and Pencil
• Jane found a good deal on soft drinks. She could buy 12 packs for $2.99. She needs 72 cans for her party. Explain how she can calculate the cost. (8N5.4)
• Which is the better buy: 1.2 L of orange juice for $2.50, or 0.75 L of orange juice for $1.40? Explain why it is the better buy. (8N5.4)
Interview
• When making lemonade Sue uses 5 scoops of powder for 6 cups of water, and Sarah uses 4 scoops of powder for 5 cups of water.
i) Are the situations proportional to each other? Explain why or why not.
ii) In which situation is it likely the lemonade will be more fl avourful? What assumptions did you make? (8N5.4)
• Explain why 1: 20,000,000 is another way to describe the ratio of 1 cm representing 200 km on a map. (8N5.4)
Journal
• Discuss whether or not the following could be solved using a proportion:
David is 6 years old and Ellen is 2 years old. How old will Ellen be when David is 12 years old? (8N5.4)
Portfolio
• A statue of John Cabot was made from a model. The height of the model was 25 cm. Find the height in metres of the statue if it was made using a scale of 1:15 (scale represents ratio of model to actual height). (8N5.4)

170 GRADE 8 MATHEMATICS DRAFT CURRICULUM GUIDE
Outcomes
PERCENT, RATIO, AND RATE
Elaborations—Strategies for Learning and Teaching
Students will be expected to
Strand: Number
The local drugstore is advertising cases of macaroni and cheese at a sale price of $8.99, with 12 boxes in a case. The grocery store across the street is selling the same macaroni and cheese at a price of $5 for 6 boxes. Which is the better deal?
Solution #1: Unit Rates Solution #2: Equivalent Rates
Drug Store: $8.99 $0.75
12 1boxes box=
Grocery Store: $5.00 $0.83
6 1boxes box=
The sale the drugstore offers is the better buy.
Drugstore: $8.99
12boxes
Grocery Store: $5.00 $10.00
6 12boxes boxes=
The drugstore offers the better deal.
Fred received a gift card for his birthday. He used it to download some new music for his MP3 player. Fred downloaded 12 songs in 15 minutes. At this rate, how many songs could he download in 1 hour?
Solution #1: Unit Rates Solution #2: Equivalent Rates 12 0.8
15min 1min
songs songs=
Since there are 60 minutes in 1 hour, multiply 0.8 by 60. He can download 48 songs in an hour.
12
15min 60min
songs x songs=
To create an equivalent rate,
multiply by 4 and 48x = .
8N5 Continued
Achievement Indicator:
8N5.4 Continued

171GRADE 8 MATHEMATICS DRAFT CURRICULUM GUIDE
Suggested Assessment Strategies Resources/Notes
PERCENT, RATIO, AND RATE
General Outcome: Develop Number Sense
Math Makes Sense 8
Lesson 5.9: Exploring Rates
Lesson 5.10: Comparing Rates
ProGuide: pp.64-69, 70-76,
Master 5.7a, 5.7c
CD-ROM: Master 5.29
SB: pp.294-299, 300-306
Practice and HW Book: pp.124-
126, 127-128
Project
• Research a local or national long-distance running event, and compare the performance of winners from different years. Compare the distance travelled to the time it takes to complete the race.
(8N5.4)
• Determine the fuel economy for your family vehicle. You can prepare and use a log such as the one that follows to track fuel purchases, kilometres driven, and fuel economy over several weeks.
(8N5.4)
Amount of Gas
Purchased (L)
Beginning Odometer Reading
(km)
Ending Odometer Reading
(km)
Total Distance Travelled
Fuel Efficiency

GRADE 8 MATHEMATICS DRAFT CURRICULUM GUIDE172
PERCENT, RATIO, AND RATE