perceivedshapesimilarityamongunfamiliarobjectsand ... ·...
TRANSCRIPT

Behavioral/Systems/Cognitive
Perceived Shape Similarity among Unfamiliar Objects andthe Organization of the Human Object Vision Pathway
Hans P. Op de Beeck, Katrien Torfs, and Johan WagemansLaboratory of Experimental Psychology, Katholieke Universiteit Leuven, 3000 Leuven, Belgium
Humans rely heavily on shape similarity among objects for object categorization and identification. Studies using functional magneticresonance imaging (fMRI) have shown that a large region in human occipitotemporal cortex processes the shape of meaningful as well asunfamiliar objects. Here, we investigate whether the functional organization of this region as measured with fMRI is related to perceivedshape similarity. We found that unfamiliar object classes that are rated as having a similar shape were associated with a very similarresponse pattern distributed across object-selective cortex, whereas object classes that were rated as being very different in shape wereassociated with a more different response pattern. Human observers, as well as object-selective cortex, were very sensitive to differencesin shape features of the objects such as straight versus curved versus “spiky” edges, more so than to differences in overall shape envelope.Response patterns in retinotopic areas V1, V2, and V4 were not found to be related to perceived shape. The functional organization in areaV3 was partially related to perceived shape but without a stronger sensitivity for shape features relative to overall shape envelope. Thus,for unfamiliar objects, the organization of human object-selective cortex is strongly related to perceived shape, and this shape-basedorganization emerges gradually throughout the object vision pathway.
Key words: object recognition; categorization; pattern classification; brain imaging; visual perception; familiarity
IntroductionObject shape and shape similarity among objects is important forthe categorization and identification of objects (Rosch et al.,1976; Tversky and Hemenway, 1984; Biederman and Ju, 1988).The lateral occipital complex (LOC), a large region in humanventral visual cortex, plays a central role in the perception ofobject shape (Malach et al., 1995; Grill-Spector et al., 1998b;Murray et al., 2002; Grill-Spector and Malach, 2004). The overallLOC response depends on the perception of a coherent objectshape (Grill-Spector et al., 1998a; Kourtzi and Kanwisher, 2000,2001; Lerner et al., 2002; Hayworth and Biederman, 2006), andthe shape representations in LOC are relatively invariant to imagetransformations such as size, position, and viewpoint (Grill-Spector et al., 1999; Vuilleumier et al., 2002; Ewbank et al., 2005).Furthermore, LOC is activated irrespectively of whether objectsare meaningful (e.g., cars, flowers, etc.) or not (Malach et al.,1995; Kanwisher et al., 1997b).
Despite this overwhelming evidence that LOC processes per-ceived object shape, it is currently unknown what the role is ofshape features for the functional organization of human LOC.
Previous studies reporting distributed patterns of selectivity inLOC for well known object classes (cars, flowers, etc.) have notdissociated shape from nonvisual factors such as function andmeaning, and from low-level visual factors such as retinotopicenvelope (Haxby et al., 2001; Spiridon and Kanwisher, 2002; Coxand Savoy, 2003; O’Toole et al., 2005). Suggesting a role for visualfactors, recent studies showed that unfamiliar, artificial objectsevoke a distributed response pattern in LOC that is different fordifferent objects (Op de Beeck et al., 2006; Williams et al., 2007).However, these recent studies included a very small stimulus setwith only three object classes, and differences between the threeobject classes in their retinotopic envelope might explain theobject-specific response patterns, especially as several recentstudies have suggested that at least part of LOC contains a retino-topic map (Brewer et al., 2005; Larsson and Heeger, 2006). Arecent study in monkeys (Op de Beeck et al., 2008b) suggestedthat the selectivity for unfamiliar objects in regions homolog tohuman LOC [monkey inferior temporal (IT) cortex] is tolerantto changes in stimulus position and task context; but also, thisstudy did not directly show that the selectivity for unfamiliarobjects is related to perceived shape.
Here, we present a study with stimuli from nine artificial ob-ject classes that was designed to directly show that the functionalorganization of LOC is related to perceived shape similarity. Asdone in many previous studies (Nosofsky, 1986; Edelman, 1998;Op de Beeck et al., 2001; Kayaert et al., 2005), we empiricallyverified perceived shape similarity among these object classeswith similarity ratings. We found a highly significant relationshipbetween the rated shape similarity among object classes and theamount of overlap in the pattern of selectivity in LOC. These
Received June 3, 2008; revised Aug. 13, 2008; accepted Aug. 24, 2008.This work was supported by a Federal Research Action Grant (Inter-Universitaire Attractie-Pool P6/29), the
Research Council of Katholieke Universiteit Leuven (IMPH/06/GHW and CREA/07/004), and the Fund for ScientificResearch–Flanders (G.0281.06 and 1.5.022.08). H.P.O.d.B. is a postdoctoral fellow of the Fund for ScientificResearch–Flanders. We thank R. Peeters for technical support, A. Baeck for assistance with the first behavioralexperiment, and C. Baker, G. Kayaert, and R. Vogels for helpful comments on this manuscript.
Correspondence should be addressed to Hans P. Op de Beeck, Laboratory of Experimental Psychology,Tiensestraat 102, Katholieke Universiteit Leuven, 3000 Leuven, Belgium. E-mail: [email protected].
DOI:10.1523/JNEUROSCI.2511-08.2008Copyright © 2008 Society for Neuroscience 0270-6474/08/2810111-13$15.00/0
The Journal of Neuroscience, October 1, 2008 • 28(40):10111–10123 • 10111

findings demonstrate that the organiza-tion of human object-selective regions isrelated to perceived shape similarity.
Materials and MethodsSubjectsTwenty-eight adult volunteers participated infour experiments, two behavioral experiments(N � 8 in each) and two functional magneticresonance imaging (fMRI) experiments (N � 6in each; including eight males and 10 righthanded). Each subject participated in only oneexperiment. The experiments were approved bythe relevant ethical boards, that is, the ethicalcommittee of the Faculty of Psychology and Ed-ucational Sciences (Katholieke UniversiteitLeuven, Leuven, Belgium) and the committeefor medical ethics of the Katholieke UniversiteitLeuven, Leuven, Belgium, respectively.
StimuliThe stimulus set consisted of exemplars fromnine object classes. The prototype (“average ex-emplar”) of each object class is shown in Figure1 A, B. Other exemplars from an object classwere very similar to the prototype (Fig. 1C), andwithin-class variation was very small comparedwith the differences between classes. We in-cluded multiple exemplars per object class inthe fMRI experiment to be consistent with pre-vious work and because we hoped that thiswithin-class variation would reduce theamount of interstimulus adaptation in thefMRI blocks compared with a situation inwhich the same image would be shownthroughout a block. More details on stimulusconstruction and the within-class variation in object shape can be foundin previous studies (Op de Beeck et al., 2006). For all subjects in thebehavioral experiments and for six subjects in the fMRI study (experi-ment 1), the novel object images were presented on a gray background(Fig. 1 A). For the other six fMRI subjects (experiment 2), all novel objectimages were equated in their spatial frequency amplitude spectrum; thisimage manipulation resulted in extra 1/f frequency noise inserted on topof objects and background (Fig. 1 B).
Each image was presented with a resolution of 200 � 200 pixels (cor-responding to a retinal stimulus size between 8 and 10 visual degrees).The software used for stimulus presentation and response registration inthe behavioral experiments was E-Prime (Psychology Software Tools).The software used for stimulus presentation and response registration inthe fMRI study was PsychToolbox (Brainard, 1997).
As a simple measure of retinotopic overlap among the stimuli fromdifferent object classes, we computed a pixel-based measure of similaritybetween pairs of object classes, using the prototypical class exemplars.For each pair of images, we computed the difference in each pixel (max-imal difference 1), squared it, summed it across all pixels, took the squareroot of this sum, and normalized the resulting number by the square rootof the number of pixels. As the resulting number is a difference measure(diff) instead of a similarity index (sim), we inverted it to get an index ofpixel-based similarity: sim � 1 � diff. Pixel-based measures have beenused previously as a benchmark for physical similarity (Cutzu and Edel-man, 1998; Grill-Spector et al., 1999; Op de Beeck et al., 2001; Allred etal., 2005). Although this measure is very simplistic, its relevance for low-level visual coding is supported by the correlation of 0.83 between thepixel-based physical similarity and the similarity among our stimuli inhow they activate the simple cell-like S1 units in the input layer of thehierarchical model of Riesenhuber and Poggio (for this, the stimuli wererescaled to size 128 � 128 pixels) (Jiang et al., 2006). All these measuresshow higher similarity for images with the same shape envelope (same
column in Fig. 1 A) than for images with a different shape envelope (ratioof 1.37 over 1).
Behavioral experimentsWe performed a behavioral experiment to assess perceived shape simi-larity. The experiment started with a very short familiarization phase inwhich the nine prototypes of the object classes were shown in a randomorder (1 s per image). This short preview was included to familiarizesubjects with the range of objects in the experiment.
Next, subjects were requested to rate the similarity in shape betweenthe successively presented prototypes of different object classes (stimulusduration, 150 ms; interstimulus interval, 500 ms) by pressing a key from1 (shape is not similar at all) to 7 (very similar in shape). Subjects wereinstructed to use the entire scale for their responses in the rating task, andthe preview phase allows them to calibrate the scale (as such avoiding ashort period of instability at the start of the rating task). This procedureallows us to compare the relative similarity of different object pairs withmaximal sensitivity. For each subject, each unique order of the nineobject images was presented six times. No trials were included in whichthe two objects were exactly the same. These data were averaged to forma 9 � 9 similarity matrix, and further averaging of corresponding cells[e.g., cell (i,j) with cell (j,i)] was done to make this matrix symmetric.
In addition to this first behavioral experiment, we performed a controlexperiment that was an almost identical replication of the first experi-ment. There was one critical difference: the instructions in the controlexperiment and the behavioral labels of the rating scale did not mention“shape”. Instead, subjects were asked to rate the overall similarity be-tween objects.
ScanningFunctional images were acquired in a 3T Philips Intera magnet (Depart-ment of Radiology, Katholieke Universiteit Leuven, Leuven, Belgium)with a 8-channel SENSE head coil with an echo-planar imaging sequence(105 time points per time series or “run”; repetition time, 3 s; echo time,
Figure 1. Stimulus set used in all experiments. A, B, The prototypical exemplar from the nine object classes on a gray back-ground (A) and after processing to equate Fourier amplitude spectrum (B). We refer to shape features to denote the shapeproperties that are the same within rows and different between rows, and shape envelope to denote the shape properties that arethe same within columns and different between columns. C, The prototype of each class (middle row) is shown together with theexemplars that are most distinct from the prototype.
10112 • J. Neurosci., October 1, 2008 • 28(40):10111–10123 Op de Beeck et al. • Shape Similarity in Human Cortex

30 ms; acquisition matrix 104 � 104, resulting in a 2.1 � 2.1 in-planevoxel size; 50 slices oriented approximately halfway between a coronaland horizontal orientation and including most of cortex except the mostsuperior parts of frontal and parietal cortex, with slice thickness 2 mmand interslice gap 0.2 mm). We also acquired a T1-weighted anatomicalimage (resolution 1 � 1 � 1.2 mm).
Experimental runs. Runs (N � 9) consisted of 21 blocks of 15 s, includ-ing three fixation blocks (at the start, middle, and end of the run) and twoblocks of each novel object class. The order of the conditions was coun-terbalanced across runs and across subjects. Twenty different exemplarsof a particular object class were presented for 150 ms (interstimulusinterval, 600 ms) in each stimulus block (the same 20 exemplars in eachblock of a particular condition). The spatial position of each stimulus wasdetermined randomly with a maximum position offset from the fixationpoint of 6 visual degrees.
The task instructions in the experimental runs were different for twogroups of subjects. In experiment 1, the six subjects performed a color-change detection task on images presented on a gray background. Forthis task, the objects were presented in color (low in saturation), andsubjects had to press a key each time an object had a different color thanthe previous object (three changes in each block of 20 stimuli). Thesaturation of the color was adapted between runs so that the task requiredsome effort to solve (low saturation) but was still associated with goodperformance (across all four subjects, 94% of the color changes weredetected). In experiment 2, the six subjects viewed the images of Figure1 B with objects on a textured background. These subjects were given ashort preview of the prototype exemplars from the nine object classesbefore the experiment, and they were instructed to simply press a buttoneach time the object images changed from one class to another (so at thestart of each block of 15 s). Subjects detected 93% of the block transitions.It is clear that the manipulations of image spatial frequency content andtask are confounded across subjects. The purpose of these manipulationswas not to investigate each factor by itself but to minimize the possibilitythat any effect of perceived shape similarity that we would observe wouldbe restricted to a specific way of presenting the shape information (withor without differences among stimuli in spatial frequency content) or toa specific task context.
Localizer runs for object-selective cortex. Runs (N � 2) consisted of 15 sblocks of fixation spot, intact object images, and Fourier-scrambled im-ages (stimulus duration, 300 ms; interstimulus interval, 450 ms). In ex-periment 1, subjects performed the same color task during the localizerruns as they did during the experimental runs. In experiment 2, subjectswere instructed to passively look at the fixation spot. In each stimulusblock, stimulus position was either in the upper or in the lower visualfield (border of the stimulus 0.6 visual degrees from the horizontal me-ridian), with a jitter in the horizontal stimulus position of maximum 4visual degrees from the vertical meridian.
Retinotopic mapping. Eight subjects (six from experiment 1 and twofrom experiment 2) participated in a short additional scan session inwhich we determined the anatomical location of the representations ofthe horizontal and vertical meridian. Runs (N � 3) consisted of 15 sblocks of fixation spot and of horizontally or vertically oriented wedges.The wedges were shown on a gray background and contained black andwhite patterns that changed at a frequency of 2.7 Hz (maximal extent ofthe wedges was 11.5 visual degrees from the fixation point). Changesincluded not only luminance reversals but also changes in the structure ofthe patterns (checkerboards with varying position of the checks and withrectangular as well as circular checks). Subjects were instructed to fixate asmall red dot at the center of the screen.
Analysis of imaging dataData were analyzed using the Statistical Parametric Mapping softwarepackage (SPM5, Wellcome Department of Cognitive Neurology,London, UK), as well as custom Matlab code.
Preprocessing. Preprocessing involved realignment to correct for mo-tion, coregistration of functional and anatomical images, segmentation(Ashburner and Friston, 2005), and spatial normalization to a MontrealNeurological Institute template. During spatial normalization, func-tional images were resampled to a voxel size of 2 � 2 � 2 mm. Finally,
functional images were spatially smoothed (4 mm full-width-half-maximum kernel). We have shown previously in contrast-enhancedmonkey fMRI that smoothing of twice the voxel size increases the signal-to-noise ratio also for multivoxel analyses with these stimuli (Op deBeeck et al., 2008b), and similar observations were made in the context ofthe present study (supplemental Fig. 1, available at www.jneurosci.org assupplemental material).
Localizer runs and object-selective regions of interest. Statistical model-ing of the signal in each voxel in each subject included a general linearmodel applied on preprocessed images, with four independent variables(one variable for each combination of intact vs Fourier-scrambled im-ages and upper vs lower visual field) and six covariates (the translationand rotation parameters needed for realignment). Region of interest(ROI) definition was based on a combination of functional and anatom-ical criteria. LOC was defined as all voxels in lateral occipital (LO) andventral occipitotemporal regions that were significantly activated in thecontrast (intact objects � scrambled images). For some analyses, wemade a further distinction between LO and occipitotemporal posteriorfusiform (PF). If these two subregions were hard to distinguish becausethe object-selective activation was continuous, then we were conservativeto include voxels, and we left out the voxels on the border. In nine oftwelve subjects, significance for the ROI selection was determined with athreshold of p � 0.0001 (uncorrected for multiple comparisons). In threeother subjects, we decided to take a more liberal threshold ( p � 0.001 orp � 0.01, uncorrected for multiple comparisons) to compensate for alower quality of the localizer data in these subjects. Across subjects, theLOC, LO, and PF ROI contained a median of 602, 321, and 189 voxels,respectively.
Retinotopic mapping. Statistical modeling of the signal in each voxel ineach subject included a general linear model applied on preprocessedimages, with two independent variables (horizontal and vertical wedges)and six covariates (the translation and rotation parameters needed forrealignment). The anatomical location of areas V1, V2, V3, and V4v wasdetermined based on the activation in the contrast of horizontal versusvertical wedges. The selected voxels do not include the foveal confluencebecause of problems to reliably differentiate the retinotopic areas at thisposition (Dumoulin and Wandell, 2008); voxels on the border of areaswere not included at all, and voxels were further constrained to be in graymatter. Across subjects, the V1, V2, V3, and V4v ROI contained a medianof 279, 237, 156, and 149 voxels, respectively. As LOC was defined basedon a functional criterion that might avoid the inclusion of voxels withnoisy signal, we also defined a pooled V1 � V2 ROI for which we furtherconstrained voxels to be significantly activated ( p � 0.0001, uncorrectedfor multiple comparisons) during the object localizer scans in at least oneof the following contrasts: upper visual field stimuli versus rest, lowervisual field stimuli versus rest, or upper visual field stimuli versus lowervisual field stimuli. This V1 � V2 ROI contained a median of 251 voxels.
Experimental runs. For each block of each condition, we calculated theaverage signal in the time window 6 –12 s after block onset in each LOCvoxel, and we converted these arbitrary signal values in values of percent-age signal change compared with the fixation blocks in the same run.Similar results were obtained by using the parameter estimates obtainedafter fitting a general linear model to the data (with nine conditions andsix covariates to model the alignment parameters) instead of extractingPSC values directly from the raw data.
In the correlational analyses, we computed correlations after previ-ously introduced methods for multivoxel pattern analysis (Haxby et al.,2001). The data were divided in two random subsets of runs (one withfive runs and another one with four runs). We constructed lists as long asthe number of voxels, and each list contained the PSC for all voxels for aparticular condition in one subset. Then the values in each list of the firstsubset were correlated with the values in each list of the second subset,resulting in an asymmetrical 9 � 9 correlation matrix. This matrix wasmade symmetrical by averaging corresponding cells [e.g., cell (i,j) withcell (j,i)]. The procedure of dividing the data in two random subsets wasapplied nine times, and the obtained similarity matrices were averagedacross these nine comparisons. These values are referred to as LOC, LO,PF, and V1 similarity (depending on the ROI). Finally, the similaritymatrices of individual subjects were averaged.
Op de Beeck et al. • Shape Similarity in Human Cortex J. Neurosci., October 1, 2008 • 28(40):10111–10123 • 10113

Analysis of similarity matricesFor each type of similarity (e.g., perceived similarity, LOC similarity, andV1 similarity, etc.), we have a similarity matrix per subject and an aver-aged similarity matrix. In addition, we have a similarity matrix that con-tains the pixel-based similarity. We performed several analyses on thesesimilarity matrices.
Computation of reliability. Following methods published previously(Op de Beeck et al., 2008b), we determined the reliability of the data ineach matrix by split-half analyses as commonly applied in psychometrics(Cronbach, 1949; Lewis-Beck, 1994). First, we vectorized each matrix byputting all 36 cells below the diagonal into a vector. Second, we split thetotal group of subjects in two halves, and we correlated the two vectorscorresponding to the matrix of the two subject halves (we did this 50times for each dataset to get a good estimate of reliability). Finally, wecorrected this split-half correlation to get the reliability of the full datasetaccording to the Spearman-Brown formula: reliability � 2 � r/(1 � r).
Reliability as an upper bound for correlations between datasets. Thereliability of an experiment takes into account the noise in a dataset, andit provides us with an upper bound of the correlation that we can expect(the explainable variance) if we correlate data from different experi-ments, or data obtained from different sources (e.g., similarity ratings vsactivation patterns in the brain). As explained previously (Op de Beeck etal., 2008b), if two datasets have a reliability R1 and R2, then the maximalcorrelation between the two experiments that we can expect given thenoise within each experiment is equal to �R1 � R2.
Permutation statistics. We performed permutation statistics to deter-mine the significance of correlations between vectorized similarity ma-trices, taking into account the variability across subjects. For each sub-ject, we randomly shuffled the order of the nine conditions, and wereordered the individual similarity matrices according to the new condi-tion order. Then we performed the aforementioned analyses to deter-mine the reliability of the reshuffled data and the correlation betweenreshuffled datasets. We performed this procedure 1000 times, and wecomputed the probability that the reliability and correlations were equalor larger than, respectively, the reliability and correlations observed withthe unshuffled data. The results from these permutation statistics wereconsistent with results from conventional parametric tests. For example,the correlation between LOC similarity and perceived shape similaritywas also significantly higher than zero according to a t test across subjects(across all subjects: t � 9.66, p � 0.0001; experiment 1: t � 6.47, p �0.0013; experiment 2: t � 6.73, p � 0.0011).
Multivoxel pattern classification. We used a linear support vector ma-chine (SVM) and a cross-validation procedure (Kamitani and Tong,2005; Li et al., 2007) to further investigate the effects found in the corre-lational analyses. The input of the classifier was expressed in PSC as usedfor the correlational analyses. Linear SVM was implemented using theOSU SVM matlab toolbox (www.sourceforge.net/projects/svm/). Foreach pair of conditions, a linear SVM was trained using the data from fiveindividual runs to find the hyperplane that separates the data from thetwo conditions, and the performance of the classifier on this pairwiseclassification was calculated for the average data from the remaining fourruns; this procedure was applied nine times per pair of conditions with arandom assignment of runs to the training and test set.
Multidimensional scalingWe performed multidimensional scaling (MDS) (using the AlternatingLeast-squares SCALing algorithm of F. W. Young, Psychometric Labo-ratory, University of North Carolina, Chapel Hill, NC) to visualize therepresentation space of the nine object classes according to the variousmetrics that we obtained (pixel-based, perceived, and LOC similarity).MDS places the nine stimuli in a low-dimensional space in a way thatoptimizes the correspondence between the relative proximity among thestimuli and the similarity in the similarity matrix (Shepard, 1980). Foreach two-dimensional space that is shown, we mention the proportion ofthe variance in the similarity data that is explained by the distances be-tween stimuli. In this study, we use MDS as an exploratory tool forvisualization, not as the basis for any statistical analysis, nor do we claimthat two dimensions are the “true” dimensionality of each dataset.
ResultsWe designed a stimulus set containing artificial objects that al-lowed us to dissociate perceived object shape from the retino-topic envelope of stimuli (Fig. 1A,B). The stimulus set includedobject classes that overlapped strongly in retinotopic envelopeand overall aspect ratio, shown in the same column. We will usethe label “shape envelope” for the properties in common to objectclasses from the same column. At the same time, the object classeswithin each column differed greatly in the properties of the linesand angles that make up the object shape. In Figure 1A,B, the firstrow contains objects with smoothly varying contours, the secondrow objects with sharp protrusions/spikes, and the third row ob-jects with straight edges and angles. We will use the label “shapefeatures” for the properties in common to object classes from thesame row. Note that we use these two labels, envelope and fea-tures, as descriptive terms to summarize a wide variety of under-lying shape changes, but without any claim that these are the twodimensions along which shape is represented.
As an indication of the similarity of these object classes ac-cording to simple metrics of the local, pixel-wise overlap of im-ages, we calculated a measure of pixel-based similarity, and weapplied MDS to visualize the overall pattern of similarity (seeMaterials and Methods). The MDS-derived two-dimensionalpixel-based object space (Fig. 2) reveals that object classes with acorresponding shape-envelope cluster together (indicating highsimilarity), whereas object class with corresponding shape fea-tures do not.
Perceived shape similarity among the novel object classesWe asked human volunteers to rate the similarity in shape amongpairs of novel object classes. Different subjects agreed very well inthe object pairs they rated as being very similar and in the objectpairs they rated as being more different in shape. Based on inter-subject agreement, the reliability of the averaged similarity rat-ings was 0.94 ( p � 0.001; see Materials and Methods, Permuta-tion statistics).
As shown in Figure 3A, we computed for each observer theaverage rated similarity for pairs of objects that overlapped inshape envelope (“same envelope”), in shape features (“same fea-tures”), or in none of these properties (“all different”). Acrosssubjects (two-tailed paired t test, N � 8), the rated similarity inthe all-different pairs was significantly different from the same-features pairs (t � 6.27; p � 0.0004) and also from the same-envelope pairs (t � 5.92; p � 0.0006). Same-features pairs tendedto be more similar than same-envelope pairs, but this differencedid not reach significance (t � 1.83; p � 0.11).
On top of averaging the data across such a limited number ofconditions, we used MDS to analyze the full similarity matrix.The MDS-derived two-dimensional perceived object space inFigure 3B shows how important the shape features are for per-ceived shape: objects with corresponding shape features tend tobe located in proximal locations. This result is very different fromthe pixel-based object space shown in Figure 2, where clusteringwas dominated by correspondence in shape envelope. Thus, it isespecially the pairs with correspondence in shape features thatallow for a dissociation between pixel-based similarity and per-ceived similarity. Across all possible object pairs (N � 36), thecorrelation between perceived similarity and pixel-based similar-ity was only 0.16 ( p � 0.17; see Materials and Methods, Permu-tation statistics). Thus, the perceived shape similarity among twoobjects was independent from the pixel-based similarity amongthese objects. As a consequence, we can dissociate these two vari-ables in how they relate to spatial patterns of brain activity.
10114 • J. Neurosci., October 1, 2008 • 28(40):10111–10123 Op de Beeck et al. • Shape Similarity in Human Cortex

Perceived shape similarity and similarity in the pattern ofselectivity in object-selective cortexSubjects were scanned while they viewed exemplars from the nineobject classes, and LOC was localized in each subject (Fig. 4A).We used multivoxel correlational analyses, a sensitive tool forinvestigating patterns of activation distributed across voxels(Haxby et al., 2001; Norman et al., 2006; Downing et al., 2007),because univariate methods did not consistently reveal individualvoxels with significant selectivity (either at a corrected thresholdof p � 0.05 or an uncorrected threshold of p � 0.0001) in pairwisecontrasts of object classes in the present study.
We applied these correlational analyses in the independentlylocalized LOC to investigate whether distributed patterns of se-lectivity were present in our data and, most importantly, whetherthe similarity of the selectivity patterns for different object classeswas related to perceived shape similarity. We obtained two mea-
sures of the pattern of selectivity for each object class in eachsubject by splitting time series in independent subsets of runs(illustrated for a few object classes in Fig. 4B). Next, the pattern ofselectivity in one subset for each object class was correlated withthe pattern of selectivity in the other subset for each object class.The strength of this correlation is a measure of how similar thepatterns of selectivity are, here referred to as “LOC similarity.”Confirming the existence of reproducible patterns of selectivity,we found a significantly higher LOC similarity when comparingthe same object class than when comparing different objectclasses (paired t test across all 12 subjects, t � 7.83; p � 0.0001).Thus, we obtained enough data for each object class to find reli-able patterns of selectivity (even higher same-object correlationswould be obtained if we would have more data per condition,requiring fewer conditions with equal scan time) (supplementalFig. 1, available at www.jneurosci.org as supplemental material).
Here, we are interested in how LOC similarity varies depend-
Figure 2. Pixel-based physical similarity among the nine object classes. A, Pixel-based sim-ilarity as a function of correspondence in shape envelope and shape features. The averagesimilarity is shown for three groups of object pairs: objects that correspond in shape envelope(Env), objects that correspond in shape features (Ftr), and objects that are different in bothenvelope and features (all different). Error bars represent the SEM across stimulus pairs. B, TheMDS-derived two-dimensional representation space of the nine prototypical exemplars basedon the pixel-based measure of image similarity. If two stimuli are physically similar, then theirpoints in this spatial representation are close together. The representation space shows thatstimuli with the same shape envelope have a high pixel-based similarity. The R 2 illustrates thefit between pixel-based similarity and the proximity between points.
Figure 3. Perceived shape similarity among the nine object classes. A, Perceived similarity asa function of correspondence in shape envelope and shape features. The average similarity isshown for three groups of object pairs: objects that correspond in shape envelope (Env), objectsthat correspond in shape features (Ftr), and objects that are different in both shape envelopeand features (all different). Error bars represent the SEM across subjects. B, The MDS-derivedtwo-dimensional representation space of the nine object classes based on perceived shapesimilarity.
Op de Beeck et al. • Shape Similarity in Human Cortex J. Neurosci., October 1, 2008 • 28(40):10111–10123 • 10115

ing on which two object classes are compared. As done previouslyfor perceived similarity in Figure 3A, we computed for each ob-server the average LOC similarity for specific subgroups of objectpairs (Fig. 5A): the correlation in the pattern of selectivity for thesame object class between odd and even runs (“all same” pairs),or for two different object classes that overlapped in shape enve-lope (same-envelope pairs), in shape features (same-featurespairs), or in none of these properties (all-different pairs). Acrossall 12 subjects, the LOC similarity in the same-features pairs wassignificantly higher than in the all-different pairs (t � 6.13; p �0.0001; two-tailed paired t test, N � 12). A similar trend wasobserved for same-envelope pairs, but this effect did not reachsignificance (comparison of same-envelope pairs and all-different pairs, t � 2.09; p � 0.061). There was a significantdifference between same-features pairs and same-envelope pairs(t � 3.87; p � 0.0026). Thus, of all comparisons of differentobject classes, the object classes that correspond in shape features,being perceptually very similar (Fig. 3), yielded the most similarpatterns of selectivity in object-selective cortex. Despite this rel-atively high similarity in the pattern of selectivity, even the object
classes that correspond in shape features (but differ in shape en-velope) can be discriminated based on the pattern of selectivity inobject-selective cortex: the LOC similarity in same-features pairswas significantly smaller than the LOC similarity in all same pairs(t � 6.13; p � 0.001).
From a brain decoding perspective, we expected that objectclasses that are perceptually similar would be hard to classifyusing a linear pattern classifier. For each pair of object classes, wedetermined how accurately linear SVMs could learn to assign apattern of selectivity to the correct object class. As shown in Fig-ure 5B, we computed for each observer the average classificationperformance for pairs of objects in three of the conditions de-fined previously (the fourth condition identified before, all same,is not applicable here as the classifier specifically serves to differ-entiate different conditions): pairs of objects that overlapped inshape envelope (same envelope), in shape features (same fea-tures), or in none of these properties (all different). Across sub-jects (two-tailed paired t test, N � 12), the classification perfor-mance in the same-features pairs was significantly worse than inthe all-different pairs (t � 3.09; p � 0.01) and in the same-
Figure 4. Illustration of distributed patterns of selectivity in human object-selective cortex. A, Location of the LOC in a single subject. LOC voxels in lateral occipital and ventral occipitotemporalcortex were selected as having a significant preference in the contrast (intact objects � scrambled images) (thresholded at p � 0.0001, uncorrected for multiple comparisons). Data are shown ontop of the PALS human atlas using CARET software (Van Essen et al., 2001, 2002) in a ventrolateral view of the inflated cortical surface. B, Patterns of selectivity for the same subject in LOC in odd runsfor one object class (“smoothies”) and in even runs for a few object classes. Responses are expressed as PSC relative to the mean response to all object classes. These selectivity maps are notthresholded for significance, and individual voxels rarely display reliable selectivity for particular object classes. Nevertheless, part of the pattern of selectivity across voxels replicates acrossindependent datasets. For each object class shown for the even runs, the correlation with the selectivity pattern for smoothies in odd runs is given below the images.
10116 • J. Neurosci., October 1, 2008 • 28(40):10111–10123 Op de Beeck et al. • Shape Similarity in Human Cortex

envelope pairs (t � 7.33; p � 0.0001). The classification perfor-mance was not different in the same-envelope pairs comparedwith the all-different pairs (t � 1.93; p � 0.080). Thus, of allcomparisons of different object classes, the object classes thatcorrespond in shape features, being perceptually very similar(Fig. 3), yielded the most confusable patterns of selectivity inobject-selective cortex.
All these analyses focused on the average similarity in groupsof object pairs. In addition, we analyzed the full similarity matrixwith MDS. The MDS-derived two-dimensional perceived objectspace, shown in Figure 5C, reveals that the LOC object space issimilar to the perceived object space shown in Figure 3B, in thatobjects with corresponding shape features tend to be located inproximal locations. This result is again very different from thepixel-based object space shown in Figure 2.
The role of perceived similarity and other factors forexplaining LOC similarity in experiments 1 and 2Confirming the existence of reproducible patterns of selectivity,we found a significantly higher LOC similarity when comparingthe same object class than when comparing different objectclasses in each experiment (experiment 1: t � 10.18, p � 0.0001;experiment 2: t � 4.47, p � 0.0066). The importance of corre-spondence in shape features for the overlap in the spatial patternof selectivity in LOC was also confirmed in each experiment (Fig.6A). Each experiment showed a significant difference betweensame-features pairs and same-envelope pairs, with higher LOCsimilarity in the same-features pairs (experiment 1: t � 2.59, p �0.049; experiment 2: t � 3.62, p � 0.0152). In addition, we cor-related how LOC similarity varied across all 36 individual objectpairs with how perceived shape similarity varied across objectpairs (Fig. 6B; supplemental Table 1, available at www.jneurosci.org as supplemental material, shows correlationswithin the three subsets of object pairs defined above). Acrossthese object pairs, LOC similarity correlated strongly with per-ceived shape similarity in experiment 1 (r � 0.49, p � 0.003;Materials and Methods, Permutation statistics) and in experi-ment 2 (r � 0.54, p � 0.001). Thus, the selectivity patterns in LOCare related to perceived similarity in each experiment.
We found one significant difference between experiment 1and experiment 2 and that is the strength of the correlations in theall same condition, which proved to be higher in experiment 1than in experiment 2: t(10) � 2.65; p � 0.024. This finding sug-gests that the selectivity patterns were more reliable and probablystronger in experiment 1. Note, however, that the correlationwith perceived similarity was at least as strong in experiment 2compared with experiment 1 (see above).
Figure 5. Similarity among the nine object classes with respect to the selectivity pattern inobject-selective cortex (LOC similarity). A, The average LOC similarity is shown for four groups ofobject pairs: a comparison of the same object in odd and even runs (all same), a comparison oftwo objects that correspond in shape envelope (Env), in shape features (Ftr), or objects that aredifferent in both envelope and features (all different). Error bars represent the SEM acrosssubjects. B, Performance of a linear support vector machine classifier among the nine objectclasses as a function of correspondence in shape envelope and shape features. Error bars repre-sent the SEM across subjects. Note that object pairs that are high in similarity in panel A (the Ftrcondition), are more easily confused by a classifier. C, The MDS-derived two-dimensional rep-resentation space of the nine object classes based on LOC similarity.
Figure 6. Relationship between LOC similarity and perceived shape similarity in experiment1 (left) and in experiment 2 (right). A, The average LOC similarity is shown for four groups ofobject pairs: a comparison of the same object in odd and even runs (all same), a comparison oftwo objects that correspond in shape envelope (Env), in shape features (Ftr), or objects that aredifferent in both envelope and features (all different). Error bars represent the SEM acrosssubjects. B, Scatter plots of LOC similarity against perceived shape similarity for all object pairs.Coloring in these scatterplots refers to the object pair group that each pair belongs to in panel A:red for Env, green for Ftr, and blue for all different.
Op de Beeck et al. • Shape Similarity in Human Cortex J. Neurosci., October 1, 2008 • 28(40):10111–10123 • 10117
Although we found that the correspondence in how two un-familiar objects activate LOC is correlated strongly with per-ceived shape similarity in each experiment, the correlation is notequal to one. There are two possible explanations. First, the cor-relation might be less than one because data are inherently notperfect and contain a noise factor. Further analyses indicate thatthe correlation is definitely limited by noise inherent to the data.Based on intersubject agreement in the pattern of similarityacross the 36 different object pairs, we computed the reliability ofthe averaged LOC similarity matrix (see Materials and Methods).This reliability was significantly higher than zero (Materials andMethods, Permutation statistics) in experiment 1 (r � 0.68; p �0.001) and in experiment 2 (r � 0.67; p � 0.001). Based on thisreliability and the reliability of our measure of perceived similar-ity (reliability of 0.94), the maximal correlation that can be ex-pected given the limitations posed by data noise is 0.80 (experi-ment 1) and 0.79 (experiment 2). If we compare these values withthe observed correlations of 0.49 and 0.54, then it is clear that asubstantial part of LOC similarity is explained by perceived shapesimilarity.
Nevertheless, there is still some room for other factors thatmight contribute partly to LOC similarity. These factors might bemethodological in nature and relate to the difficulty of compar-ing totally different variables (behavioral ratings and fMRI activ-ity patterns). If this would be true, then perceived shape wouldstill be a perfect explanation for LOC similarity, but methodolog-ical limitations would prevent us from finding a perfect fit. Thesimplest possibility would be that one of the measures would haveto be monotonically scaled before comparing it with the othermeasure, but such a problem is not immediately obvious in thescatter plots.
A second explanation is suggested by a comparison of Figure3A with Figure 5A and the related statistical analyses of eachdataset. For perceived similarity, the effect of correspondence inshape envelope was significant, and it was approximately half aslarge as the effect of correspondence in shape features. For LOCsimilarity, the effect of correspondence in shape envelope (com-pared with the condition all different) failed to reach significance,and the LOC similarity in the same-envelope condition wasmuch closer to the all-different than to the same-features condi-tion. Is there really a differential role of shape envelope for per-ceived similarity compared with LOC similarity? Any explicit testof this question has to deal with the problem that the two types ofsimilarity are expressed on different scales. To solve this problem,we calculated a normalized index that takes the similarity insame-envelope condition minus the similarity in the all-differentcondition, normalizing the resulting value by dividing it by thesimilarity in same-features condition minus the similarity in theall-different condition. The values in the numerator were calcu-lated per individual subject, whereas the values in the denomina-tor were averaged across subjects (the latter was done to improvethe reliability of the index). Higher values indicate stronger ef-fects of correspondence in shape envelope relative to the effect ofcorrespondence in shape features. On average, this index was 0.51(SEM � 0.29) for perceived similarity and 0.23 (SEM � 0.11) forLOC similarity. These two values were not significantly different(unpaired t test, t(18) � 1.03; p � 0.32). Thus, there is no signifi-cant difference between perceived similarity and LOC similarityin the effect of shape envelope.
Another explanation for the less than perfect fit between per-ceived shape similarity and LOC similarity is that other func-tional properties in addition to perceived shape might contributeto how LOC responds to unfamiliar objects. We investigated
whether a simple, pixel-based metric of image similarity mightexplain part of the LOC similarity, but this was not the case (sup-plemental Fig. 2, scatter plots, available at www.jneurosci.org assupplemental material): LOC similarity was not correlated withpixel-based similarity in experiment 1 (r � �0.09; p � 0.69) norin experiment 2 (r � 0.017; p � 0.42).
We wondered what other properties the object classes mighthave that are not shape. With familiar objects, several candidateswould exist (e.g., semantic associations), but this is less clear withunfamiliar objects. Thus, we replicated our basic behavioral ex-periment with one small change: we asked subjects to rate theoverall similarity between objects without mentioning shape inthe instructions or in the verbal labels of the different numbers ofthe scale. If there would be any functional properties that subjectsdeem relevant for similarity but that do not fall under the conceptof shape, then we would expect that this slight difference in theinstructions and in the definition of the scale would matter andthat it would affect the similarity ratings. However, the two be-havioral experiments resulted in the same rated similarity: acrossall possible object pairs (N � 36), the correlation between per-ceived shape similarity (data from the initial experiment) andperceived “overall” similarity (data from the control experiment)was 0.94. Overall similarity was also affected strongly by corre-spondence in shape features, significantly more strongly ( p �0.05; paired t test across subjects) than by correspondence inshape envelope (higher similarity in same-features pairs than insame-envelope pairs). Thus, human observers do not use anyother object features to rate overall similarity than the propertiesthat are used in ratings of shape similarity.
The role of perceived shape similarity in subdivisions of LOCBecause LOC is a large cortical region, previous studies have fo-cused on smaller subregions (Grill-Spector and Malach, 2004).The most common distinction is between the lateral occipitalgyrus (area LO) and occipitotemporal or posterior fusiform cor-tex (area PF). Confirming the existence of reproducible patternsof selectivity in each area, we found a significantly higher similar-ity when comparing the same object class than when comparingdifferent object classes (area LO: t � 9.5, p � 0.0001; area PF: t �4.97, p � 0.0004; paired t tests across all 12 subjects). In addition,the same-condition correlations were significantly higher in areaLO compared with area PF (t � 5.92; p � 0.0001).
Other analyses reveal that the selectivity patterns in each ofthese regions are related to perceived shape similarity. First, eachregion showed a significant difference between same-featurespairs and same-envelope pairs (Fig. 7A), with highest similarity inselectivity patterns in the same-features pairs (area LO: t � 2.21,p � 0.049; area PF: t � 3.25, p � 0.0078). Second, the similarity ofselectivity patterns correlated strongly with perceived shape sim-ilarity across all object pairs in area LO (r � 0.54, p � 0.001;Materials and Methods, Permutation statistics) and in area PF(r � 0.59; p � 0.001). No correlation was found with pixel-basedsimilarity (area LO: r � 0.0062, p � 0.47; area PF: r � 0.013, p �0.45) (supplemental Fig. 3, scatter plots, available at www.jneurosci.org as supplemental material). Thus, the selectivity pat-terns in each subregion of LOC are related to perceived shapesimilarity.
The pattern of selectivity in retinotopic cortexWe expected a role of perceived shape similarity for the func-tional organization of higher regions in the object vision path-way. It is unclear to what extent shape contributes to the organi-zation of lower stages in this hierarchically organized pathway.
10118 • J. Neurosci., October 1, 2008 • 28(40):10111–10123 Op de Beeck et al. • Shape Similarity in Human Cortex

Several hypotheses can be formulated. First, lower stages in thishierarchy, such as primary visual cortex or V1, are known to beretinotopically organized, so the selectivity patterns in these re-gions might be related instead to our pixel-based measure ofsimilarity that relates to the retinotopic envelope of the objectclasses. However, because we presented the objects with a widescatter in retinotopic position (see Materials and Methods), wedid not expect a strong effect of retinotopy.
Second, neurons in retinotopic regions process various at-tributes that are related to shape and curvature (Pasupathy andConnor, 1999; Hegde and Van Essen, 2000, 2007). It is possiblethat these functional properties determine part of the organiza-tion of these regions, resulting in reliable patterns of selectivitythat might be partially related to perceived shape similarity.
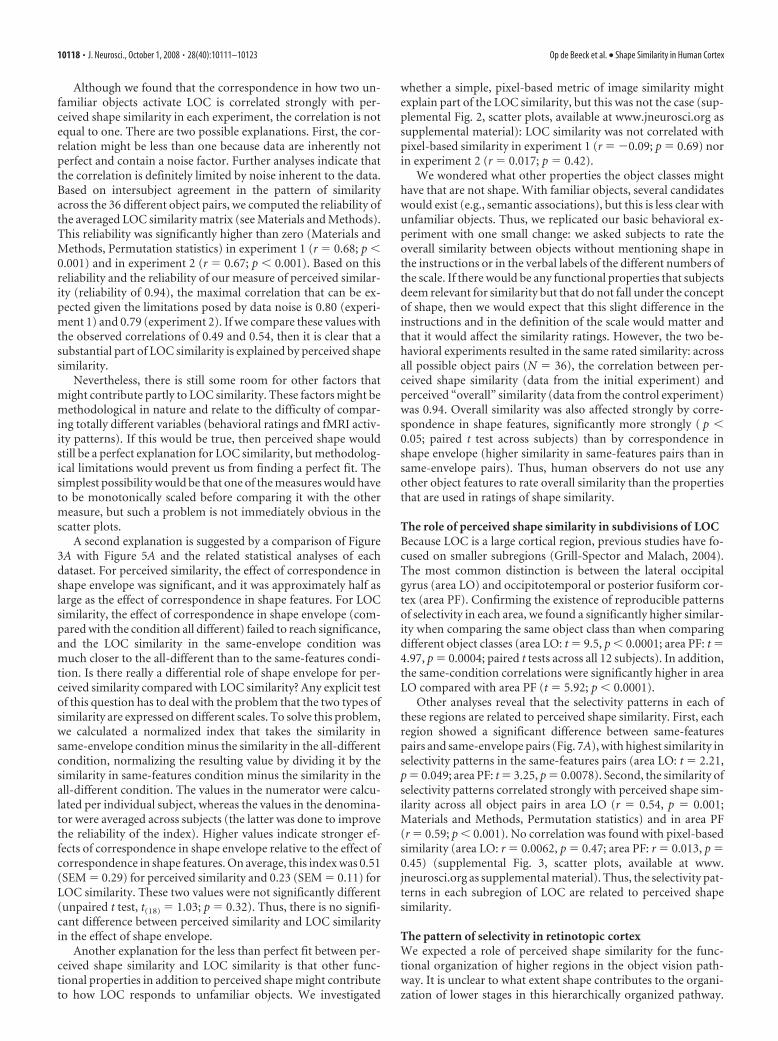
We defined the retinotopic areas V1, V2, V3, and V4v in eightsubjects, and we obtained a measure of neural similarity in eachROI by correlating the pattern of selectivity for each object classin random subsets of runs with the pattern of selectivity for eachobject class in the other runs. The results are shown in Figures 8and 9. In V1 and V2, we found no significantly higher similaritywhen comparing the same object class than when comparingdifferent object classes (V1: t � 1.86, p � 0.11; V2: t � 2.03, p �0.08), nor did V1 or V2 similarity correlate significantly withperceived shape similarity (V1: r � 0.25, p � 0.10; V2: r � 0.21,p � 0.12) or with pixel-based similarity (V1: r � 0.18, p � 0.17;V2: r � 0.23, p � 0.11). We also defined a pooled V1 � V2 ROIrestricted to functionally active voxels (see Materials and Meth-ods). This pooled V1 � V2 ROI still did not show ( p � 0.10) asignificantly higher similarity when comparing the same objectclass than when comparing different object classes nor did it showa significant correlation with perceived similarity (r � 0.22; p �
0.11). In contrast, the correlation between V1 � V2 similarityand pixel-based similarity did reach significance (r � 0.32; p �0.028).
In V3 and V4, the patterns of selectivity were reliable, as wefound a significantly higher similarity when comparing the sameobject class than when comparing different object classes (V3: t �3.68, p � 0.0078; V4: t � 2.92, p � 0.022). The correlations in theall same condition in V3 were significantly higher than in V1 (t �2.64; p � 0.033) and in V2 (t � 2.48; p � 0.042), but of similarstrength as in V4 (t � 0.58; p � 0.4). V3 similarity correlatedsignificantly with perceived shape similarity (r � 0.53; p �0.003), whereas the correlation between V4 similarity and per-ceived shape similarity failed to reach significance (V4: r � 0.27,p � 0.052). V3 and V4 similarity did not correlate significantlywith pixel-based similarity (V3: r � 0.27, p � 0.064; V4: r � 0.24,p � 0.11). Thus, of all these retinotopic regions, area V3 was theonly one in which we found a significant correlation with per-ceived shape similarity.
As before, we also grouped object pairs in the previously de-scribed conditions same envelope, same features, and all differ-ent. All of the retinotopic regions, including area V3, showed aslightly higher similarity in same envelope compared with same-features, but this effect did not approach significance in any ofthese regions ( p � 0.4). Note that area LOC showed the oppositeeffect, higher similarity in same-features than in same envelope(for the same group of eight subjects: t � 3.11; p � 0.017). Toobtain an index of the same-features preference for each corticalregions, we subtracted same-envelope similarity from same-features similarity. This same-features preference in area LOCtended to be larger than in each retinotopic region: V1, p � 0.056;V2, p � 0.024; V3, p � 0.092; V4, p � 0.034 ( p values accordingto a two-tailed t test across subjects; all p values would be �0.05according to a one-tailed test).
Figure 7. Relationship between similarity in selectivity patterns and perceived shape in LOgyrus (left) and in the PF region (right). A, The average LO and PF similarity is shown for fourgroups of object pairs: a comparison of the same object in odd and even runs (all same), acomparison of two objects that correspond in shape envelope (Env), in shape features (Ftr), orobjects that are different in both envelope and features (all different). Error bars represent theSEM across subjects. B, Scatter plots of LO and PF similarity against perceived shape similarityfor all object pairs. Coloring in these scatterplots refers to the object pair group that each pairbelongs to in panel A: red for Env, green for Ftr, and blue for all different.
Figure 8. Selectivity patterns in retinotopic areas V1, V2, V3, and V4v. The average similarityis shown for four groups of object pairs: a comparison of the same object in odd and even runs(all same), a comparison of two objects that correspond in shape envelope (Env), in shapefeatures (Ftr), or objects that are different in both envelope and features (all different). Errorbars represent the SEM across subjects.
Op de Beeck et al. • Shape Similarity in Human Cortex J. Neurosci., October 1, 2008 • 28(40):10111–10123 • 10119
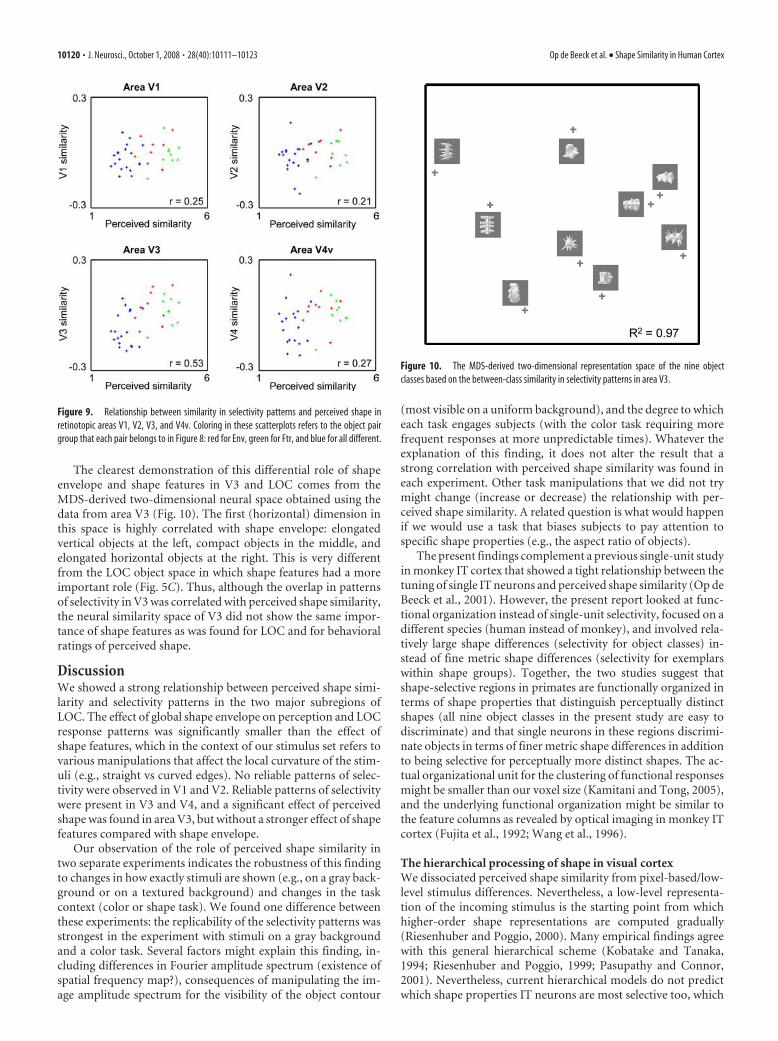
The clearest demonstration of this differential role of shapeenvelope and shape features in V3 and LOC comes from theMDS-derived two-dimensional neural space obtained using thedata from area V3 (Fig. 10). The first (horizontal) dimension inthis space is highly correlated with shape envelope: elongatedvertical objects at the left, compact objects in the middle, andelongated horizontal objects at the right. This is very differentfrom the LOC object space in which shape features had a moreimportant role (Fig. 5C). Thus, although the overlap in patternsof selectivity in V3 was correlated with perceived shape similarity,the neural similarity space of V3 did not show the same impor-tance of shape features as was found for LOC and for behavioralratings of perceived shape.
DiscussionWe showed a strong relationship between perceived shape simi-larity and selectivity patterns in the two major subregions ofLOC. The effect of global shape envelope on perception and LOCresponse patterns was significantly smaller than the effect ofshape features, which in the context of our stimulus set refers tovarious manipulations that affect the local curvature of the stim-uli (e.g., straight vs curved edges). No reliable patterns of selec-tivity were observed in V1 and V2. Reliable patterns of selectivitywere present in V3 and V4, and a significant effect of perceivedshape was found in area V3, but without a stronger effect of shapefeatures compared with shape envelope.
Our observation of the role of perceived shape similarity intwo separate experiments indicates the robustness of this findingto changes in how exactly stimuli are shown (e.g., on a gray back-ground or on a textured background) and changes in the taskcontext (color or shape task). We found one difference betweenthese experiments: the replicability of the selectivity patterns wasstrongest in the experiment with stimuli on a gray backgroundand a color task. Several factors might explain this finding, in-cluding differences in Fourier amplitude spectrum (existence ofspatial frequency map?), consequences of manipulating the im-age amplitude spectrum for the visibility of the object contour
(most visible on a uniform background), and the degree to whicheach task engages subjects (with the color task requiring morefrequent responses at more unpredictable times). Whatever theexplanation of this finding, it does not alter the result that astrong correlation with perceived shape similarity was found ineach experiment. Other task manipulations that we did not trymight change (increase or decrease) the relationship with per-ceived shape similarity. A related question is what would happenif we would use a task that biases subjects to pay attention tospecific shape properties (e.g., the aspect ratio of objects).
The present findings complement a previous single-unit studyin monkey IT cortex that showed a tight relationship between thetuning of single IT neurons and perceived shape similarity (Op deBeeck et al., 2001). However, the present report looked at func-tional organization instead of single-unit selectivity, focused on adifferent species (human instead of monkey), and involved rela-tively large shape differences (selectivity for object classes) in-stead of fine metric shape differences (selectivity for exemplarswithin shape groups). Together, the two studies suggest thatshape-selective regions in primates are functionally organized interms of shape properties that distinguish perceptually distinctshapes (all nine object classes in the present study are easy todiscriminate) and that single neurons in these regions discrimi-nate objects in terms of finer metric shape differences in additionto being selective for perceptually more distinct shapes. The ac-tual organizational unit for the clustering of functional responsesmight be smaller than our voxel size (Kamitani and Tong, 2005),and the underlying functional organization might be similar tothe feature columns as revealed by optical imaging in monkey ITcortex (Fujita et al., 1992; Wang et al., 1996).
The hierarchical processing of shape in visual cortexWe dissociated perceived shape similarity from pixel-based/low-level stimulus differences. Nevertheless, a low-level representa-tion of the incoming stimulus is the starting point from whichhigher-order shape representations are computed gradually(Riesenhuber and Poggio, 2000). Many empirical findings agreewith this general hierarchical scheme (Kobatake and Tanaka,1994; Riesenhuber and Poggio, 1999; Pasupathy and Connor,2001). Nevertheless, current hierarchical models do not predictwhich shape properties IT neurons are most selective too, which
Figure 9. Relationship between similarity in selectivity patterns and perceived shape inretinotopic areas V1, V2, V3, and V4v. Coloring in these scatterplots refers to the object pairgroup that each pair belongs to in Figure 8: red for Env, green for Ftr, and blue for all different.
Figure 10. The MDS-derived two-dimensional representation space of the nine objectclasses based on the between-class similarity in selectivity patterns in area V3.
10120 • J. Neurosci., October 1, 2008 • 28(40):10111–10123 Op de Beeck et al. • Shape Similarity in Human Cortex

are properties such as whether objects contain straight or curvededges (Kayaert et al., 2005). Likewise, these models do not predictthe organization of shape-selective cortex as described here. Forexample, in our data, the correlation between similarity based onthe output of the higher-level representations (“V4” units, andlikewise for view-tuned units) in the model of Riesenhuber andPoggio (1999) and LOC similarity was only in the order of 0.10 –0.15 (data not shown). Thus, the importance of these shape prop-erties for shape representations is not a trivial consequence of theincrease in invariance and complexity as implemented in thisclass of models. A more comprehensive computational model ofshape recognition might include an adaptive feature dictionary(Serre et al., 2007) so that the tuning becomes more informativefor object categorization (Biederman, 1987; Edelman and Intra-tor, 2000; Ullman et al., 2002; Kiani et al., 2007; Ullman, 2007).
Although the relationship between perceived shape similarityand the organization of object-selective cortex is not easily cap-tured by existing biologically plausible object recognition mod-els, our experiments with a relatively small set of essentially arbi-trary complex objects do not inform us about the features,dimensions, or basis functions (Gallant et al., 1993) by whichshape is represented. We based our choice of stimulus differenceson previous studies in monkeys (Kayaert et al., 2005) and theneed to dissociate perceived shape from pixel-based similarity,but the exact stimuli are still arbitrary and might not include themost optimal stimuli or shape properties. With our stimulus set,our data show a strong effect of what we have conveniently la-beled shape features, a descriptive label that refers to a wide set ofcurvature properties of the objects: do objects consist of smoothlycurved segments, sharp protrusions, or straight segments? Theaforementioned biological model of object recognition does notexplicitly code object curvature, in contrast to older models(Biederman, 1987). Neurophysiological studies have also sug-gested explicit processing of local shape curvature from area V1up to area V4 (Dobbins et al., 1987; Pasupathy and Connor, 1999;Hegde and Van Essen, 2007). Thus, the sensitivity for shape fea-tures as defined here might relate to the coding of curvature atvarious stages of the cortical hierarchy. In our study, which fo-cused on functional organization instead of single-unit selectiv-ity, the stronger sensitivity of shape features such as straight ver-sus curved contours than for other shape properties such asaspect ratio was mostly found at the level of object-selective cor-tex and not in the retinotopic areas. Even area V3, in which thefunctional organization was correlated with perceived shape sim-ilarity, did not show a similarly strong sensitivity for shape fea-tures. The differences between V3 and LOC are consistent withthe notion that shape processing progresses from orientation spe-cific representations in V3 (high sensitivity for the orientation ofthe global shape envelope) (Fig. 10) to more orientation-independent representations in LOC (high sensitivity for shapefeatures that might be helpful to achieve viewpoint indepen-dence) (Kayaert et al., 2003).
Unfamiliar objects versus familiar and meaningful objectsTo what extent does object shape explain the category selectivityfor highly familiar objects? Many previous studies have reportedcategory-selective cortical patches and patterns of selectivity inthe object vision pathway (Kanwisher et al., 1997a; Epstein andKanwisher, 1998; Downing et al., 2001, 2006; Haxby et al., 2001;Schwarzlose et al., 2005; Spiridon et al., 2006). Two studies alsocompared the differences in activation patterns for familiar ob-jects with similarity metrics, exactly as we did here, using eitherperceived similarity (Edelman et al., 1998) or image-based at-
tributes (O’Toole et al., 2005). However, because these studiesused exemplars from familiar object categories and did not ex-plicitly dissociate perceived similarity for simple pixel-based met-rics, this selectivity for familiar objects might be related to manyfactors: low-level visual similarity, object form/shape (Haxby etal., 2000), the way objects are processed (Gauthier, 2000), seman-tic attributes (Chao et al., 1999), and eccentricity biases (Hassonet al., 2002).
We reduced these confounds to a minimum by using unfamil-iar object classes. Nevertheless, these factors cannot be excludedtotally. For example, when we asked subjects to try to interpretthe objects as known objects after the experiment, subjects werecreative enough to come up with interpretations (Op de Beeck etal., 2006). However, subjects did not report using such interpre-tations to guide their similarity ratings, and probably the oppositeis happening: shape similarity guides the interpretation of thestimuli. The irrelevance of these interpretations for the similarityratings was further illustrated by the high intersubject variabilityin these interpretations, whereas the ratings (both shape ratingsand ratings of overall similarity) were highly consistent acrosssubjects (see Results).
The importance of the intersubject consistency of perceivedshape ratings is illustrated by a recent study published in parallelwith the preparation of this report. Haushofer et al. (2008) re-ported that manipulations of objective shape parameters relate toneural similarity in area LO but not in area PF, whereas behav-ioral confusion rates between stimuli correlated with neural sim-ilarity only in area PF. These confusion rates are a measure ofoverall similarity, not perceived shape similarity, and were veryvariable among subjects. This measure might reflect the variableinterpretations of the stimuli by the subjects as the stimulus setconsisted of ambiguous two-dimensional shape contours (DeWinter and Wagemans, 2004; Wagemans et al., 2008). Further-more, shape contours are suboptimal to activate LOC (Georgievaet al., 2008), and the stimulus set included only four contours thatlacked many of the shape features manipulated in our study.Future studies are needed to investigate the role of each of thesemethodological differences and many other questions about therepresentation of shape in the human brain. Our study is the firstdemonstration that the selectivity patterns in area LO as well asarea PF reflect the perceived shape of shaded three-dimensionalobjects varying in a range of shape properties.
For familiar objects, it is conceivable that several other factorsin addition to perceived shape contribute significantly to the ob-served selectivity patterns. Selectivity patterns in high-level visualcortex change when additional experience is acquired with ini-tially novel objects (Op de Beeck et al., 2006; Weisberg et al.,2007), thus the response pattern to familiar objects might bedetermined strongly by factors that have little relationship toperceived shape (Mahon et al., 2007). LOC is probably organizedin terms of multiple properties, shape being one of them, and thesame set of factors might have a different weight depending onobject familiarity. How the different properties are combined, therelative weight of each property, and how these weights dependon familiarity, are all important questions for future research (Opde Beeck et al., 2008a).
ReferencesAllred S, Liu Y, Jagadeesh B (2005) Selectivity of inferior temporal neurons
for realistic pictures predicted by algorithms for image database naviga-tion. J Neurophysiol 94:4068 – 4081.
Ashburner J, Friston KJ (2005) Unified segmentation. Neuroimage26:839 – 851.
Op de Beeck et al. • Shape Similarity in Human Cortex J. Neurosci., October 1, 2008 • 28(40):10111–10123 • 10121

Biederman I (1987) Recognition-by-components: a theory of human imageunderstanding. Psychol Rev 94:115–147.
Biederman I, Ju G (1988) Surface versus edge-based determinants of visualrecognition. Cognit Psychol 20:38 – 64.
Brainard DH (1997) The psychophysics toolbox. Spat Vis 10:433– 436.Brewer AA, Liu J, Wade AR, Wandell BA (2005) Visual field maps and stim-
ulus selectivity in human ventral occipital cortex. Nat Neurosci8:1102–1109.
Chao LL, Haxby JV, Martin A (1999) Attribute-based neural substrates intemporal cortex for perceiving and knowing about objects. Nat Neurosci2:913–919.
Cox DD, Savoy RL (2003) Functional magnetic resonance imaging (fMRI)“brain reading”: detecting and classifying distributed patterns of fMRIactivity in human visual cortex. Neuroimage 19:261–270.
Cronbach LJ (1949) Essentials of psychological testing. New York: Harper.Cutzu F, Edelman S (1998) Representation of object similarity in human
vision: psychophysics and a computational model. Vision Res38:2229 –2257.
De Winter J, Wagemans J (2004) Contour-based object identification andsegmentation: stimuli, norms and data, and software tools. Behav ResMethods Instrum Comput 36:604 – 624.
Dobbins A, Zucker SW, Cynader MS (1987) Endstopped neurons in thevisual cortex as a substrate for calculating curvature. Nature329:438 – 441.
Downing PE, Jiang Y, Shuman M, Kanwisher N (2001) A cortical area selec-tive for visual processing of the human body. Science 293:2470 –2473.
Downing PE, Chan AW, Peelen MV, Dodds CM, Kanwisher N (2006) Do-main specificity in visual cortex. Cereb Cortex 16:1453–1461.
Downing PE, Wiggett AJ, Peelen MV (2007) Functional magnetic reso-nance imaging investigation of overlapping lateral occipitotemporal acti-vations using multi-voxel pattern analysis. J Neurosci 27:226 –233.
Dumoulin SO, Wandell BA (2008) Population receptive field estimates inhuman visual cortex. Neuroimage 39:647– 660.
Edelman S (1998) Representation is representation of similarities. BehavBrain Sci 21:449 – 467; discussion 467– 498.
Edelman S, Intrator N (2000) (Coarse coding of shape fragments) � (reti-notopy) approximately � representation of structure. Spat Vis13:255–264.
Edelman S, Grill-Spector K, Kushnir T, Malach R (1998) Toward directvisualization of the internal shape representation space by fMRI. Psycho-biology 26:309 –321.
Epstein R, Kanwisher N (1998) A cortical representation of the local visualenvironment. Nature 392:598 – 601.
Ewbank MP, Schluppeck D, Andrews TJ (2005) fMR-adaptation reveals adistributed representation of inanimate objects and places in human vi-sual cortex. Neuroimage 28:268 –279.
Fujita I, Tanaka K, Ito M, Cheng K (1992) Columns for visual features ofobjects in monkey inferotemporal cortex. Nature 360:343–346.
Gallant JL, Braun J, Van Essen DC (1993) Selectivity for polar, hyperbolic,and Cartesian gratings in macaque visual cortex. Science 259:100 –103.
Gauthier I I (2000) What constrains the organization of the ventral tempo-ral cortex? Trends Cogn Sci 4:1–2.
Georgieva SS, Todd JT, Peeters R, Orban GA (2008) The extraction of 3Dshape from texture and shading in the human brain. Cereb Cortex18:2416 –2438.
Grill-Spector K, Malach R (2004) The human visual cortex. Annu Rev Neu-rosci 27:649 – 677.
Grill-Spector K, Kushnir T, Edelman S, Itzchak Y, Malach R (1998a) Cue-invariant activation in object-related areas of the human occipital lobe.Neuron 21:191–202.
Grill-Spector K, Kushnir T, Hendler T, Edelman S, Itzchak Y, Malach R(1998b) A sequence of object-processing stages revealed by fMRI in thehuman occipital lobe. Hum Brain Mapp 6:316 –328.
Grill-Spector K, Kushnir T, Edelman S, Avidan G, Itzchak Y, Malach R(1999) Differential processing of objects under various viewing condi-tions in the human lateral occipital complex. Neuron 24:187–203.
Hasson U, Levy I, Behrmann M, Hendler T, Malach R (2002) Eccentricitybias as an organizing principle for human high-order object areas. Neu-ron 34:479 – 490.
Haxby JV, Ishai I I, Chao LL, Ungerleider LG, Martin I I (2000) Object-formtopology in the ventral temporal lobe. Response to I. Gauthier (2000)Trends Cogn Sci 4:3– 4.
Haxby JV, Gobbini MI, Furey ML, Ishai A, Schouten JL, Pietrini P (2001)Distributed and overlapping representations of faces and objects in ven-tral temporal cortex. Science 293:2425–2430.
Haushofer J, Livingstone MS, Kanwisher N (2008) Multivariate patterns inobject-selective cortex dissociate perceptual and physical shape similarity.PLoS Biol 6:e187.
Hayworth KJ, Biederman I (2006) Neural evidence for intermediate repre-sentations in object recognition. Vision Res 46:4024 – 4031.
Hegde J, Van Essen DC (2000) Selectivity for complex shapes in primatevisual area V2. J Neurosci 20:RC61.
Hegde J, Van Essen DC (2007) A comparative study of shape representationin Macaque visual areas V2 and V4. Cereb Cortex 17:1100 –1116.
Jiang X, Rosen E, Zeffiro T, Vanmeter J, Blanz V, Riesenhuber M (2006)Evaluation of a shape-based model of human face discrimination usingFMRI and behavioral techniques. Neuron 50:159 –172.
Kamitani Y, Tong F (2005) Decoding the visual and subjective contents ofthe human brain. Nat Neurosci 8:679 – 685.
Kanwisher N, McDermott J, Chun MM (1997a) The fusiform face area: amodule in human extrastriate cortex specialized for face perception.J Neurosci 17:4302– 4311.
Kanwisher N, Woods RP, Iacoboni M, Mazziotta JC (1997b) A locus inhuman extrastriate cortex for visual shape analysis. J Cogn Neurosci9:133–142.
Kayaert G, Biederman I, Vogels R (2003) Shape tuning in macaque inferiortemporal cortex. J Neurosci 23:3016 –3027.
Kayaert G, Biederman I, Vogels R (2005) Representation of regular and ir-regular shapes in macaque inferotemporal cortex. Cereb Cortex15:1308 –1321.
Kiani R, Esteky H, Mirpour K, Tanaka K (2007) Object category structure inresponse patterns of neuronal population in monkey inferior temporalcortex. J Neurophysiol 97:4296 – 4309.
Kobatake E, Tanaka K (1994) Neuronal selectivities to complex object fea-tures in the ventral visual pathway of the macaque cerebral cortex. J Neu-rophysiol 71:856 – 867.
Kourtzi Z, Kanwisher N (2000) Cortical regions involved in perceiving ob-ject shape. J Neurosci 20:3310 –3318.
Kourtzi Z, Kanwisher N (2001) Representation of perceived object shape bythe human lateral occipital complex. Science 293:1506 –1509.
Larsson J, Heeger DJ (2006) Two retinotopic visual areas in human lateraloccipital cortex. J Neurosci 26:13128 –13142.
Lerner Y, Hendler T, Malach R (2002) Object-completion effects in the hu-man lateral occipital complex. Cereb Cortex 12:163–177.
Lewis-Beck MS (1994) Basic measurement. London: Sage.Li S, Ostwald D, Giese M, Kourtzi Z (2007) Flexible coding for categorical
decisions in the human brain. J Neurosci 27:12321–12330.Mahon BZ, Milleville SC, Negri GA, Rumiati RI, Caramazza A, Martin A
(2007) Action-related properties shape object representations in the ven-tral stream. Neuron 55:507–520.
Malach R, Reppas JB, Benson RR, Kwong KK, Jiang H, Kennedy WA, LeddenPJ, Brady TJ, Rosen BR, Tootell RB (1995) Object-related activity re-vealed by functional magnetic resonance imaging in human occipital cor-tex. Proc Natl Acad Sci U S A 92:8135– 8139.
Murray SO, Kersten D, Olshausen BA, Schrater P, Woods DL (2002) Shapeperception reduces activity in human primary visual cortex. Proc NatlAcad Sci U S A 99:15164 –15169.
Norman KA, Polyn SM, Detre GJ, Haxby JV (2006) Beyond mind-reading:multi-voxel pattern analysis of fMRI data. Trends Cogn Sci 10:424 – 430.
Nosofsky RM (1986) Attention, similarity, and the identification-categorization relationship. J Exp Psychol Gen 115:39 – 61.
Op de Beeck H, Wagemans J, Vogels R (2001) Inferotemporal neurons rep-resent low-dimensional configurations of parameterized shapes. NatNeurosci 4:1244 –1252.
Op de Beeck HP, Baker CI, DiCarlo JJ, Kanwisher NG (2006) Discrimina-tion training alters object representations in human extrastriate cortex.J Neurosci 26:13025–13036.
Op de Beeck HP, Haushofer J, Kanwisher NG (2008a) Interpreting fMRIdata: maps, modules and dimensions. Nat Rev Neurosci 9:123–135.
Op de Beeck HP, Deutsch JA, Vanduffel W, Kanwisher NG, DiCarlo JJ(2008b) A stable topography of selectivity for unfamiliar shape classes inmonkey inferior temporal cortex. Cereb Cortex 18:1676 –1694.
O’Toole AJ, Jiang F, Abdi H, Haxby JV (2005) Partially distributed repre-
10122 • J. Neurosci., October 1, 2008 • 28(40):10111–10123 Op de Beeck et al. • Shape Similarity in Human Cortex

sentations of objects and faces in ventral temporal cortex. J Cogn Neurosci17:580 –590.
Pasupathy A, Connor CE (1999) Responses to contour features in macaquearea V4. J Neurophysiol 82:2490 –2502.
Pasupathy A, Connor CE (2001) Shape representation in area V4: position-specific tuning for boundary conformation. J Neurophysiol86:2505–2509.
Riesenhuber M, Poggio T (1999) Hierarchical models of object recognitionin cortex. Nat Neurosci 2:1019 –1025.
Riesenhuber M, Poggio T (2000) Models of object recognition. Nat Neuro-sci [Suppl] 3:1199 –1204.
Rosch E, Mervis C, Gray W, Johnson D, Boyes-Braem P (1976) Basic objectsin natural categories. Cognit Psychol 8:382– 439.
Schwarzlose RF, Baker CI, Kanwisher N (2005) Separate face and body se-lectivity on the fusiform gyrus. J Neurosci 25:11055–11059.
Serre T, Oliva A, Poggio T (2007) A feedforward architecture accounts forrapid categorization. Proc Natl Acad Sci U S A 104:6424 – 6429.
Shepard RN (1980) Multidimensional scaling, tree-fitting, and clustering.Science 210:390 –398.
Spiridon M, Kanwisher N (2002) How distributed is visual category infor-mation in human occipito-temporal cortex? An fMRI study. Neuron35:1157–1165.
Spiridon M, Fischl B, Kanwisher N (2006) Location and spatial profile ofcategory-specific regions in human extrastriate cortex. Hum Brain Mapp27:77– 89.
Tversky B, Hemenway K (1984) Objects, parts, and categories. J Exp PsycholGen 113:169 –197.
Ullman S (2007) Object recognition and segmentation by a fragment-basedhierarchy. Trends Cogn Sci 11:58 – 64.
Ullman S, Vidal-Naquet M, Sali E (2002) Visual features of intermediatecomplexity and their use in classification. Nat Neurosci 5:682– 687.
Van Essen DC (2002) Windows on the brain: the emerging role of atlasesand databases in neuroscience. Curr Opin Neurobiol 12:574 –579.
Van Essen DC, Drury HA, Dickson J, Harwell J, Hanlon D, Anderson CH(2001) An integrated software suite for surface-based analyses of cerebralcortex. J Am Med Inform Assoc 8:443– 459.
Vuilleumier P, Henson RN, Driver J, Dolan RJ (2002) Multiple levels ofvisual object constancy revealed by event-related fMRI of repetition prim-ing. Nat Neurosci 5:491– 499.
Wagemans J, De Winter J, Op de Beeck HP, Ploeger A, Beckers T, Vanroose P(2008) Identification of everyday objects on the basis of silhouette andoutline versions. Perception 37:207–244.
Wang G, Tanaka K, Tanifuji M (1996) Optical imaging of functional orga-nization in the monkey inferotemporal cortex. Science 272:1665–1668.
Weisberg J, van Turennout M, Martin A (2007) A neural system for learningabout object function. Cereb Cortex 17:513–521.
Williams MA, Dang S, Kanwisher NG (2007) Only some spatial patterns offMRI response are read out in task performance. Nat Neurosci 10:685–686.
Op de Beeck et al. • Shape Similarity in Human Cortex J. Neurosci., October 1, 2008 • 28(40):10111–10123 • 10123