perceived employer attractiveness of undergraduate
TRANSCRIPT

i
PERCEIVED EMPLOYER ATTRACTIVENESS OF
UNDERGRADUATE STUDENTS OF A PRIVATE
HIGHER EDUCATION INSTITUTION IN THE
NORTHERN REGION OF PENINSULAR MALAYSIA
CHIN GUO HAO
MASTER OF BUSINESS ADMINISTRATION
(CORPORATE MANAGEMENT)
UNIVERSITI TUNKU ABDUL RAHMAN
FACULTY OF BUSINESS AND FINANCE
AUGUST 2017

Employer Attractiveness
ii
PERCEIVED EMPLOYER ATTRACTIVENESS OF
UNDERGRADUATE STUDENTS OF A PRIVATE
HIGHER EDUCATION INSTITUTION IN THE
NORTHERN REGION OF PENINSULAR MALAYSIA
BY
CHIN GUO HAO
A research project submitted in partial fulfillment of the
requirement for the degree of
MASTER OF BUSINESS ADMINISTRATION
(CORPORATE MANAGEMENT)
UNIVERSITI TUNKU ABDUL RAHMAN
FACULTY OF BUSINESS AND FINANCE
DEPARTMENT OF BUSINESS
AUGUST 2017

Employer Attractiveness
iii
Copyright @ 2017
ALL RIGHTS RESERVED. No part of this paper may be reproduced, stored in a
retrieval system, or transmitted in any form or by any means, graphic, electronic,
mechanical, photocopying, recording, scanning, or otherwise, without the prior
consent of the authors.

Employer Attractiveness
iv
DECLARATION
I hereby declare that:
(1) This postgraduate project is the end result of my own work and that due
acknowledgement has been given in the references to ALL sources of
information be they printed, electronic, or personal.
(2) No portion of this research project has been submitted in support of any
application for any other degree or qualification of this or any other university, or
other institutes of learning.
(3) The word count of this research report is 15,874 words.
Name of Student: Student ID: Signature:
CHIN GUO HAO 16ABM07287 _______________
Date: 25 August 2017

Employer Attractiveness
v
ACKNOWLEDGEMENT
This research has been carried out successfully with the assistance and co-operation of
various authorities. I would like to take this opportunity to express my
appreciativeness towards the people who had lending helping hand in contributing
their ideas and guidelines in development of this research project. I would also like to
thank UTAR in giving opportunity for me to conduct this research project, and
provide facilities such as library and internet lab for me in completing this research
project.
Besides that, I would like to thank our supervisor, Ms Rajaletchumy a/p Mani for her
motivation and strong guidance by providing me wise professional knowledge and
valuable opinion to the completion of this research project. Her patient and dedication
in helping me during this period meant a lot to me.
Last but not least, I would like to express my deepest gratitude to my lovely parent for
their boundless support and blessing for me to complete this research project. Apart
from that, I would also want to take this opportunity to thank to my respondents and
friends who have kindly and patient in spent out their precious time in helping my
filled out my questionnaire. Without the participation of them, I would not complete
my research project successfully.
Thank you.
Employer Attractiveness
vi
TABLE OF CONTENTS
Page
Copyright Page ……………………………………………………………..……….. ii
Declaration …………………………………………………………….……………. iii
Acknowledgement ……………………………………………………..…………… iv
Table of Contents …………………………………………………………..……….. v
List of Tables ………………………………………………………....…………….. vi
List of Figures ………………………………………………….….……………….. vii
List of Abbreviations ……………………………………………………..……….. viii
List of Appendices ………………………………………………….….…………… ix
Preface ………………………………………………………………….......………. x
Abstract ………………………………………………………………..…………… xi
CHAPTER 1 RESEARCH OVERVIEW ………………………………………….. 1
1.0 Introduction ……………………………………………...………… 1
1.1 Research Background …………………………………….……….. 1
1.2 Problem Statement …………………………………..…..………… 2
1.3 Research Objectives …………………………………..…………… 4
1.4 Research Questions ……………………………………...………… 5
1.5 Significance of the Study ……………………………..…………… 5
1.6 Chapter Layout …………………………………………….……… 6
1.7 Conclusion ………………………………………………………… 7
CHPATER 2 LITERATURE REVIEW …………………………………...………. 8

Employer Attractiveness
vii
2.0 Introduction ……………………………………………….………. 8
2.1 Review of the Literature …………………………………..….…… 8
2.1.1 Dependent Variable – Employer Attractiveness ………..…… 8
2.1.2 Independent Variable – Interest Value ………………….…… 9
2.1.3 Independent Variable – Social Value ………………..………. 9
2.1.4 Independent Variable – Application Value …………....…….. 9
2.1.5 Independent Variable – Economic Value …………….….…. 10
2.1.6 Independent Variable – Development Value ................…...... 10
2.2 Review of Relevant Theoretical Models ……………….…...…… 10
2.3 Proposed Theoretical/Conceptual Framework ……………….….. 11
2.4 Hypotheses Development ……………………………………..… 12
2.5 Conclusion ……………………………………………….……… 13
CHAPTER 3 METHODOLOGY ………………………………………..………. 15
3.0 Introduction ……………………………………………..……….. 15
3.1 Research Design ………………………………………….……… 15
3.2 Data Collection Methods ……………………………….……….. 16
3.2.1 Primary Data ……………………………………….………. 16
3.2.2 Secondary Data …………………………………..………… 17
3.3 Sampling Design …………………………………………...…… 17
3.3.1 Target Population ………………………………………….. 17
3.3.2 Sampling Frame and Sampling Location ………………….. 17
3.3.3 Sampling Elements ………………………………...……… 19
3.3.4 Sampling Technique ………………………………………. 19

Employer Attractiveness
viii
3.3.5 Sampling Size …………………………………...…………. 20
3.4 Research Instrument …………………………………………….. 22
3.4.1 Questionnaire Design …………………………….……..….. 22
3.4.2 Pilot Test …………………………………………...….…… 23
3.5 Constructs Measurement (Scale and Operational Definitions) .… 23
3.5.1 Scale Measurement …………………………….……….….. 23
3.6 Data Processing ……………………………………….…..…….. 24
3.6.1 Data Checking …………………………………….……….. 24
3.6.2 Data Editing …………………………………….….………. 24
3.6.3 Data Coding ………………………………….…….………. 25
3.6.4 Data Transcribing ………………………………....……….. 26
3.7 Data Analysis ………………………………………...….……… 26
3.7.1 Descriptive Analysis ………………………………....……. 26
3.7.2 Scale Measurement (Reliability Analysis) …………....…… 27
3.7.3 Inferential Analysis ………………………………….….…. 28
3.7.3.1 Pearson’s Correlation Analysis ……………........…. 28
3.7.3.2 Multiple Regression Analysis …………….…….…. 31
3.8 Conclusion …………………………………………….….…….. 31
CHAPTER 4 DATA ANALYSIS ……………………………………….……… 32
4.0 Introduction ……………………………………………..……… 32
4.1 Descriptive Analysis ………………………………..…….……. 32
4.1.1 Respondent Demographic Profile ……………………....… 32
4.1.2 Central Tendencies Measurement of Constructs ……….… 38

Employer Attractiveness
ix
4.2 Scale Measurement (Reliability Analysis) ……………….……. 52
4.3 Inferential Analyses ………………………………………….… 53
4.3.1 Pearson Correlation Analysis …………………….……..… 53
4.3.2 Multiple Linear Regression Analysis ……………….…….. 58
4.4 Conclusion ………………………………………………......….. 61
CHAPTER 5 DISCUSSION, CONCLUSION & IMPLICATIONS ……....…… 62
5.0 Introduction ………………………………………………...…… 62
5.1 Summary of Statistical Analyses ……………………….…...….. 62
5.1.1 Summary of Descriptive Analysis …………………...……. 62
5.1.2 Central Tendencies Measurement of Construct …….….….. 63
5.1.3 Reliability Analysis …………………………………..……. 65
5.1.4 Pearson Correlation Analysis ………………………....…… 65
5.1.5 Multiple Linear Regressions ……………………….…...…. 66
5.2 Discussions of Major Findings …………………………….…… 66
5.3 Implication of Study to Public &or Private Policy …….……..… 69
5.4 Limitations of the Study …………………………….……..……. 70
5.5 Recommendations for Future Research ……………………..….. 72
5.6 Conclusion ………………………………………………..…….. 73
References ……………………………………………………...…………….…. 74
Appendices ………………………………………………………….……..……. 78

Employer Attractiveness
x
LIST OF TABLES
Page
Table 1.1: Looking to leave their job in the next 6 months (%) ……………….…… 2
Table 1.2: Why are you planning to leave your job? (%) ………………………..…. 3
Table 3.1: Computation of Sample Size ……………………………………...……. 21
Table 3.2 Interpretation of Cronbach’s Alpha ………………………………..……. 28
Table 3.3: Pearson Correlation Coefficients ……………………………………….. 29
Table 4.1: Gender of Respondents …………………………………………….…… 32
Table 4.2: Race of Respondents ……………………………………………...…….. 33
Table 4.3: Faculty …………………………………………………………….…….. 34
Table 4.4: Entry Qualification of Respondents ……………………………….……. 37
Table 4.5: Central Tendencies Measurement of Constructs: Interest Value ……….. 38
Table 4.6: Central Tendencies Measurement of Constructs: Social Value ……...…. 40
Table 4.7: Central Tendencies Measurement of Constructs: Application Value …... 42
Table 4.8: Central Tendencies Measurement of Constructs: Economic Value …..… 44
Table 4.9: Central Tendencies Measurement of Constructs: Development Value .... 47
Table 4.10: Central Tendencies Measurement of Constructs: Perceived Employer
Attractiveness ……………………………………………………………………..... 49
Table 4.11: Scale Measurement (Reliability Analysis) ………………….…………. 52
Table 4.12: Correlation between Interest Value and Perceived Employer
Attractiveness ……………………………………………………………………..... 53
Table 4.13: Correlation between Social Value and Perceived Employer
Attractiveness …………………………………………………………....…………. 54

Employer Attractiveness
xi
Table 4.14: Correlation between Application Value and Perceived Employer
Attractiveness ……………………………………………………………………… 55
Table 4.15: Correlation between Economic Value and Perceived Employer
Attractiveness ……………………………………………………………………… 56
Table 4.16: Correlation between Development Value and Perceived Employer
Attractiveness ………………………………………………………………...……. 57
Table 4.17: Analysis of Variance ………………………………………………….. 58
Table 4.18: Model Summary ………………………………………………….…… 59
Table 4.19: Coefficients ………………………………………………………...…. 59
Table 5.1: Summary of Result …………………………………………………..… 66

Employer Attractiveness
xii
LIST OF FIGURES
Page
Figure 2.1: Exploring the relationship between corporate social performance and
employer attractiveness ………………………………………………………...….. 10
Figure 2.2: Proposed Theoretical / Conceptual Framework ………………..……… 11
Figure 4.1: Gender of Respondents ………………………………………….…….. 33
Figure 4.2: Race of Respondents ……………………………………………...…… 34
Figure 4.3: Faculty ………………………………………………...………….……. 36
Figure 4.4 Entry Qualifications of Respondents …………………………………… 37

Employer Attractiveness
xiii
LIST OF APPENDICES
Page
Appendix A: Questionnaire …………………………………………..……………. 74
Appendix B: Personal Data Protection Statement …………………………………. 79
Appendix C: Letter of Request Information of Number of
Students ………………………………………………………………………..…… 81

Employer Attractiveness
xiv
LIST OF ABBREVIATIONS
FAS Faculty of Arts and Social Science
FBF Faculty of Business and Finance
FEGT Faculty of Engineering and Green Technology
FICT Faculty of Information and Communication Technology
FSc Faculty of Science
ICS Institute of Chinese Studies
MEF Malaysian Employer Federation
SPSS Statistical Package for Social Science
UTAR Universiti Tunku Abdul Rahman

Employer Attractiveness
xv
PREFACE
This research is intended to examine the relationship between interest value, social
value, application value, economic value, development value and perceived employer
attractiveness of undergraduate students of a private higher education institution in the
northern region of Peninsular Malaysia. The research would contribute toward several
parties in solving the issue of the employer attractiveness in Malaysia.
Several managerial implications can be acquired from this research. One of the
managerial implications is the top management of the employers or organizations
should be recognizing the rising of the competitiveness in the war of talent although
there are many graduates in the labor market. Therefore, the independent variables
(interest value, social value, application value, economic value, and development
value) are studied so as to support employers to improve their attractiveness. Thereby,
the employers should implement effective recruitment strategies that will enhance the
attractiveness of employers so that they will be more attractive to the graduates or
talents. Employers are also required to redesign or restructure their recruitment
activities to improve their attractiveness.
In addition, this research is also significant to the government, Ministry of Human
Resources, and Malaysian Employer Federation (MEF). The Ministry of Human
Resources should collaborate with the Malaysian Employer Federation (MEF) and
explore on how to offer the essential values to the potential employees or graduates.
As the Ministry of Human Resources and Malaysian Employer Federation (MEF),
their responsibility is to be the leader in the encouragement of excellent employment
practices and harmonious industrial relations and facilitate the development of
excellence in human resource management to enable Malaysia’s employers to react
the present and future business challenges.

Employer Attractiveness
xvi
ABSTRACT
The objective of this research is to determine the relationship between personal values
and perceived employer attractiveness of undergraduate students of a Malaysia’s
private higher education institution in the northern region of Peninsular Malaysia.
The war for talented workers is biting. Based on one of the newest survey of CEOs by
Accenture, it is illustrated that 60% of the CEOs are concern regarding the demand to
attract and retain the top personnel.
The target population would be the undergraduate students of UTAR main campus,
namely UTAR Kampar campus. The undergraduate students were selected from
Faculty of Business and Finance (FBF), Faculty of Information and Communication
Technology (FICT), Faculty of Science (FSc), Faculty of Engineering and Green
Technology (FEGT), Faculty of Arts and Social Science (FAS), and Institute of
Chinese Studies (ICS). Total 372 sets of questionnaires were distributed to the
undergraduate students in UTAR Kampar campus. All the data collected are analyzed
by the IBM SPSS Statistics software package. Pearson Correlation Analysis and
Multiple Linear Regression Analysis were executed through the software stated above.
Moreover, the theoretical implications and managerial implications are discussed in
the research. The limitation of study and recommendation for future study are also
discussed in this study.

Employer Attractiveness
1
CHAPTER 1: RESEARCH OVERVIEW
1.0 Introduction
The objective of this research is to determine the relationship between personal values
and perceived employer attractiveness of undergraduate students of a Malaysia’s
private higher education institution in the northern region of Peninsular Malaysia.
Firstly, the background of the research and problem statement was outlined. The
research objectives are divided into two categories, which are general objective and
specific objectives which are adopted for formulating the research questions. Lastly,
the significance of the research was expressed and followed by the chapter layout and
conclusion.
1.1 Research Background
The evolution of globalization, the expanding competition for talented employees, and
the pressure for innovation and speed have given corporations added stimulus to re-
examine their employee relations strategies for the purpose of attract, motivate, and
retain the human resources that will support the corporation to be successful
(Zivnuska, Ketchen, & Snow, 2001).
Jamrog (2002) has mentioned about the current era as the era of the employees. The
earnest job applicants are probably to show a lot of attention regarding selecting the
most suitable corporation for them to perform and the most suitable job for them to
pursue. Thus, it is essential for a corporation to establish a strong human resource
strategy to serve as the main differentiator in the prosperity of its organization through
the unceasing supply of the suitable talent (Rynes & Cable, 2003).

Employer Attractiveness
2
1.2 Problem Statement
Every year, there are more than 200,000 students graduate from Malaysia higher
education institutions (Tan, 2016). The war for talented workers is biting. Based on
one of the newest survey of CEOs by Accenture, it is illustrated that 60% of the CEOs
are concern regarding the demand to attract and retain the top personnel. It is forcing
the companies to examine themselves and review their relationship with their workers
and their human resource strategies to search and recruit the talent they desire
(Barrow, House, Housley, Jenner, Martin, Mensink & Taylor, 2007).
Barrow et al (2007) are also mentioned that one corporation should not be aiming to
be all objects to all individuals. Therefore, recently the focal point has shifted to what
it takes to establish and sustain an employer reputation that ties up and attracts the
right people. In addition, future’s CEO will consume more time on the reputation of
their corporations.
The Regional Communications head of Jobstreet.com, Simon Si, stated that based on
a survey carried out by JobStreet.com in November 2016, the fresh graduates are
being choosy about the firm or the job, are one of the tops cited factors given by
Malaysia employers on the reasons why is difficult for young graduates to obtain
employment nowadays (Sani, 2016).
Sabah Tourism, Culture, and Environment minister, Datuk Seri Masidi Manjun, he
expressed that many people complain they are unemployed because they are still
looking for a job which they consider suitable for them. Their no acceptance to the job
will have an impact on the nation’s economy in the long run (Miwil, 2016).
Table 1.1: Looking to leave their job in the next 6 months (%)
Source: Media release: Over 1/3 of employees looking to leave their jobs: Randstad
Employer Brand Research 2017. (2017, June 15). Randstad. Retrieved from

Employer Attractiveness
3
https://www.randstad.com.sg/workforce360/articles/media-release-over-13-of-
employees-looking-to-leave-their-jobs-randstad-employer-brand-research-2017
Table 1.2: Why are you planning to leave your job? (%)
Source: Media release: Over 1/3 of employees looking to leave their jobs: Randstad
Employer Brand Research 2017. (2017, June 15). Randstad. Retrieved from
https://www.randstad.com.sg/workforce360/articles/media-release-over-13-of-
employees-looking-to-leave-their-jobs-randstad-employer-brand-research-2017
According to the report of Randstad Employer Brand Research 2017, there are over a
third of staffs (37.36%) in Malaysia, Hong Kong, and Singapore are considering on
departing their corporations in the next six months. There are about 35% of the
Malaysian employees searching for new profession opportunities. In addition, the
demographic profiling demonstrated that young male workers across the all three
nations were the most likely to depart their current profession. When considering the
causes behind why employees were intending to depart, insubstantial wages and
benefits along with a short of career advancement were the 2 major elements in
Malaysia, Hong Kong, and Singapore. The 3rd
largest element in Malaysia and
Singapore was the deficiency of appreciation from the employers (Randstad, 2017).
The Managing Director of Randstad Malaysia, Singapore, and Hong Kong, Michael
Smith mentioned that: “While organizations look at improving their employer brands
to attract the best new talent in their ranks, management needs to be wary of the high
risk of losing their staff. Our latest research highlights the unsettling number of
employees planning to leave their jobs in the near future. This reinforces the need for
organizations to not only look out at new talent but also inwards to ensure the

Employer Attractiveness
4
retention of their best staff. Research has shown that the cost replacing a lost
employee can be very high in terms of time and money”. (Randstad, 2017).
The supplementary explanation by Mr. Michael Smith is also complemented: “While
bringing in talent with great salaries and promises of career progression opportunities,
organizations must not rest once those individuals have settled in. These companies
must consistently monitor the advancement of these factors as the individuals grow
within the organization”. (Randstad, 2017).
1.3 Research Objectives
1.3.1 General Objective
The main objective of this research is to disclose the relationship between five
particular values and perceived employer attractiveness of undergraduate students
of a private higher education institution in Malaysia.
1.3.2 Specific Objectives
To identify whether there is a significant relationship between social value and
perceived employer attractiveness.
To identify whether there is a significant relationship between development
value and perceived employer attractiveness.
To identify whether there is a significant relationship between application
value and perceived employer attractiveness.
To identify whether there is a significant relationship between interest value
and perceived employer attractiveness.
To identify whether there is a significant relationship between economic value
and perceived employer attractiveness.
To identify whether there is a significant relationship between social value,
development value, application value, interest value, economic value, and
perceived employer attractiveness in Malaysia.

Employer Attractiveness
5
1.4 Research Questions
The research questions of this study are as the following:
1) What is the relationship between social value and perceived employer
attractiveness of undergraduate students of a private higher education
institution in Malaysia?
2) What is the relationship between development value and perceived employer
attractiveness of undergraduate students of a private higher education
institution in Malaysia?
3) What is the relationship between application value and perceived employer
attractiveness of undergraduate students of a private higher education
institution in Malaysia?
4) What is the relationship between interest value and perceived employer
attractiveness of undergraduate students of a private higher education
institution in Malaysia?
5) What is the relationship between economic value and perceived employer
attractiveness of undergraduate students of a private higher education
institution in Malaysia?
6) What is the relationship between social value, development value, application
value, interest value, economic value, and perceived employer attractiveness
of undergraduate students of a private higher education institution in Malaysia?
1.5 Significance of the Study
The impression of job seeker on a prospective employer, involving the perceptions of
a corporation’s attractiveness, is essential to organizational success in fascinating job
seekers (Carless, 2003).
This objective of this research project is intended to study the relationship between
interest value, social value, application value, economic value, development value,
and perceived employer attractiveness of undergraduate students of a private higher

Employer Attractiveness
6
education institution in the northern region of Peninsular Malaysia. This research
would contribute to several parties in resolving the problems of the employer
attractiveness in Malaysia.
First and foremost, the employers in Malaysia will be benefited. The employers in
Malaysia would conscious of their attractiveness from the perceptions of
undergraduate students in Malaysia. The employers in Malaysia would also recognize
the significance of the factors which influence their attractiveness in attracting the
young talents in Malaysia, those factors such as interest value, social value,
application value, economic value, and development value. In addition to this, this
research would support the employers to further enhance their attractiveness which
perceived by young graduates so as to capable to attract more young talents.
Furthermore, this research would also helpful to the undergraduate students and fresh
graduates in Malaysia. As the issue of turnover intention and job hopping in the
workplace becoming more severe in Malaysia, by disclosing the several significant
factors of employer attractiveness, for instance, interest value, social value,
application value, economic value, and development value, the undergraduate
students and fresh graduates will obtain an insight on the important elements of
attractiveness employers. The undergraduate students and fresh graduates will be
conscious of the significant elements of employer attractiveness and are capable to
have better decision making when submitting their job applications and receiving job
offers.
1.6 Chapter Layout
Chapter 1: Research Overview
In chapter 1, the purpose of this study is to determine the relationship between social
value, development value, application value, interest value, economic value and
perceived employer attractiveness of undergraduate students of a private higher
education institution in Malaysia. In this chapter, the background of the research,
problem statement, research objectives, research questions, the research’s significance,
the research’s chapter layout, and the research’s conclusion will also discourse.

Employer Attractiveness
7
Chapter 2: Literature Review
In chapter 2, the secondary data which based on journal articles and research studies
will be examined and discussed in order to comprehend the relationship between
personal values and perceived employer attractiveness of undergraduate students. In
this section, the connections between variables will be identified. A proposed
theoretical/conceptual framework will be formulated. This section also could be said
is the cornerstone for the hypotheses.
Chapter 3: Methodology
In chapter 3, it will illustrate the process of obtaining the data, measurement of the
variables, and reliability test that conducted. Research design, data collection methods,
sampling design, research instrument, and construct measurement will be determined
corresponding to offer a comprehensible view of the instrument. The data processing
and data analysis will be emphasized in this chapter too.
Chapter 4: Data Analysis
In chapter 4, the data gathered from the questionnaire will be analyzed in line with the
hypotheses. The survey is accomplished through a questionnaire. The outcome is
analyzed by employing IBM SPSS Statistics software package.
Chapter 5: Discussion, Conclusion, and Implications
In chapter 5, it will comprise the summary of statistical analyses, discussions of major
findings, and limitations of the study. Finally, recommendations for future research
and conclusion will be discussed in this chapter.
1.7 Conclusion
A better comprehension of the importance of employer attractiveness in this chapter 1
has reviewed. This study also explained the research background and problem
statement. In the end of this chapter determined about the significance of study which
dedicates to our study.

Employer Attractiveness
8
CHAPTER 2: LITERATURE REVIEW
2.0 Introduction
A literature review is an essential and comprehensive evaluation of the study. The
literature review summarizes the study and synthesizes it as a synopsis of the research.
Secondary sources are utilized to generate information in this chapter. In chapter 2,
the dependent variable (employer attractiveness) and five independent variables
(interest value, social value, application value, economic value, and development
value) are explored. The relevant theoretical models for the research and influence of
independent variables to the dependent variables are also examined in this chapter.
Conceptual framework and hypotheses that will be examined also included in this
chapter.
2.1 Review of the Literature
2.1.1 Dependent Variable – Employer Attractiveness
Berthon, Ewing, & Hah (2005) explained that the concept of employer
attractiveness has broadly explored in the fields of organizational behavior,
applied psychology, management, marketing, and communication. Employer
attractiveness has also turn into a progressively popular topic in the current
business press and those organizations are competing for status and award for
“Best Employer” is more and more, as awareness is drawn to employer
attractiveness in both the contemporary print and electronic media. The Berthon
et al (2005) determined employer attractiveness as the expected benefits and
interests that a potential worker views in working for a particular organization.
Employer attractiveness is defined by Tsai and Yang (2010) as the willingness of
job seekers to seek for jobs and to accept job offers from a corporation. Perceived

Employer Attractiveness
9
employer attractiveness refers to the extent to which an individual
enthusiastically perceives a corporation as a working place or the ordinary
perceived desirability of working for a corporation (Rynes, Bretz, & Gerhart,
1991; Aiman-Smith, Bauer, & Cable, 2001). Attractiveness is demonstrated when
individual effectively look for a chance to engage in the employee selection
processes in a particular corporation (Aiman-Smith et al, 2001).
2.1.2 Independent Variable – Interest Value
Interest value is one of the dimensions of employer attractiveness and it is
referred to the degree of an organization exercising those practices which consist
of offering a working environment that facilitates innovation and creativity,
generating creative products and services, featuring innovative working practices,
and offering a stimulating and challenging task (Reis & Braga, 2016).
2.1.3 Independent Variable – Social Value
Social value is defined as the degree to which a job seeker is attracted to an
employer that offers the chance to obtain appreciation and recognition, good
feelings and job security, acceptance and belonging, good promotion
opportunities, and career enhancing the experience (Alnıaçık & Alnıaçık, 2012).
Reis and Brage (2016) expressed that social value is one of the employer
attractiveness dimension, it describes a corporation’s practices which offering a
delightful interpersonal and social and energetic working environment.
2.1.4 Independent Variable – Application Value
Application value is defined as the degree to which a job seeker is attracted to an
employer that offers the chance to teach someone else what we have learned and
contributes to the community (Alnıaçık & Alnıaçık, 2012). Reis and Braga (2016)
describes the application value as the extent of the organization provides the

Employer Attractiveness
10
chance to employees to utilize their know-hows and express their information to
another person, work in a humanitarian and client-oriented workplace.
2.1.5 Independent Variable – Economic Value
Economic value is defined as the degree to which a job seeker is attracted to an
employer that offers a favorable compensation package, job security, and above-
average wages (Alnıaçık & Alnıaçık, 2012; Reis & Braga, 2016).
2.1.6 Independent Variable – Development Value
According to Reis and Braga (2016), the development value describes the
organizational practices which offering the opportunities for employees to receive
career-enhancing experiences, skills’ development, confident, self-worth, and
recognition from the employer.
2.2 Review of Relevant Theoretical Models
Figure 2.1: Exploring the relationship between corporate social performance and
employer attractiveness
Community Relations
Environment
Employee Relations
Product Issues
Diversity Employer Attractiveness

Employer Attractiveness
11
Adapted from: Backhaus, K. B., Stone, B. A., & Heiner, K. (2002). Exploring the
relationship between corporate social performance and employer
attractiveness. Business & Society, 41(3), 292-318.
The Backhaus, Stone, and Heiner (2002) are investigated the perceptions of the
significance of the corporate social performance (CSP) to the job seekers and examine
the influences of the dimensions of corporate social performance on organizational
attractiveness.
According to Bachaus et al (2002), they stated that the five particular corporate social
performance (CSP) dimensions are considered by job seekers as the significant factors
when they evaluate the organizations. The researchers have also applied the social
identity theory and signaling theory in order to study the influences of corporate
social performance (CSP) on the grading of employer attractiveness.
2.3 Proposed Theoretical / Conceptual Framework
Figure 2.2: Proposed Theoretical / Conceptual Framework
A theoretical/conceptual framework has been developed and proposed based on the
literature review. This is a diagram that visually demonstrates and links the variables
in which to be examined in this study. In this theoretical/conceptual framework, the
Social Value
Interest Value
Development Value
Economic Value
Application Value Perceived Employer
Attractiveness

Employer Attractiveness
12
independent variables are interest value, social value, application value, economic
value, development value. The dependent variable will be inspected to determine the
effect of all the five independent variables.
2.4 Hypotheses Development
2.4.1 Interest Value
There is a connection between the interest value and employer attractiveness.
Employees will regard an employer as an attractive employer when the particular
employer is capable to offer an exciting and challenging task, with novel working
application, up-to-date products and services, and in an environment where it is
facilitating and stimulating innovation and imagination (Reis & Braga, 2016).
Hypothesis 1:
H0: There is no significant relationship between interest value and perceived
employer attractiveness.
H1: There is a significant relationship between interest value and perceived
employer attractiveness.
2.4.2 Social Value
According to the past study, there is indicated that there is a connection between
social value and the perceptions of employer attractiveness. The workers are
more desire and willing to work with a corporation, a leader, or an employer they
have faith in, and where the social environment is unrestrained and comfortable
(Reis & Braga, 2016).
Hypothesis 2:
H0: There is no significant relationship between social value and perceived
employer attractiveness.

Employer Attractiveness
13
H1: There is a significant relationship between social value and perceived
employer attractiveness.
2.4.3 Application Value
According to Reis and Braga (2016), there is a significant relationship between
the application value and the attractiveness of employers. The employees will be
satisfied when they possess the opportunities to utilize their know-how and
capabilities and transmit their experience and knowledge to other colleagues.
Hypothesis 3:
H0: There is no significant relationship between application value and perceived
employer attractiveness.
H1: There is a significant relationship between application value and perceived
employer attractiveness.
2.4.4 Economic Value
The economic value has a significant relationship with the employer
attractiveness. The more economic value is allocated, such as extrinsic
remuneration, there are more employees tend to admire and enjoy working with
the corporation or employers (Reis & Braga, 2016).
Hypothesis 4:
H0: There is no significant relationship between economic value and perceived
employer attractiveness.
H1: There is a significant relationship between economic value and perceived
employer attractiveness.

Employer Attractiveness
14
2.4.5 Development Value
According to Deal, Altman, and Rogelberg (2010), there is a notable relationship
between development value and perceived employer attractiveness. The
researchers were stated that if employers are willing to offer their employees with
amusing and fascinating job, favourable compensation packages, and the
learning’s opportunities, those employers are more likely to be perceived as
attractive employers or organizations.
Hypothesis 5:
H0: There is no significant relationship between development value and perceived
employer attractiveness.
H1: There is a significant relationship between development value and perceived
employer attractiveness.
2.5 Conclusion
In chapter 2, relevant literature in my proposed framework and hypotheses
development are determined. Next, the research methodology that employed in this
research will be further discussed in detail in next chapter.

Employer Attractiveness
15
CHAPTER 3: METHODOLOGY
3.0 Introduction
The methodology of this research will be discussed in this chapter, method that will
be employed to collect data on independent variables and dependent variables. The
collected data is then evaluated and the hypotheses were examined through
correlation and regression analysis. IBM SPSS Statistics software package is
employed as data analysis tool for the data analysis in this study.
3.1 Research Design
“Quantitative research” and “Qualitative research” are the measurement that applied
in devising a research. Creswell (2013) has stated a very laconic definition of
quantitative research as a kind of research that is employed in order to describe
phenomena through gathering numerical data that are analyzed by employing
mathematically based methods. In contrast, qualitative research is an in-depth
examination which constitutes an observation of target respondents and unstructured
questions (Milman, 1993). In this study, quantitative research is employed.
Quantitative research works when researcher intends to investigate a large number of
population and summarizes the samples to a broader group. Swanson and Holton
(2005) explained the benefits of quantitative research would be low expenses as the
population can be signified via a small portion of respondents from the targeted
population.
Zikmund, Babin, Carr, and Griffin (2013) justify that research is capable to identify
the effects and causes between two variables by means of causal research design.
Causal research is adopted to study the causal relationship between variables that
requires research to search for more substantial evidence in examining the hypotheses.
In causal research, the researcher would have a good comprehension of phenomena
and can formulate an educated forecast regarding the cause and effect relationship that
will be studied.

Employer Attractiveness
16
The questionnaire is employed as a research instrument in this research for the
purpose of determines the corresponding variables that would have an effect on the
dependent variable (perceived employer attractiveness). A small representative from
the targeted population is identified as to obtain a thorough description.
3.2 Data Collection Methods
There are two components in the data collection methods. First of all, primary data is
acquired in the first time and gathered in the absence of any procedure with the target
respondents. Next, the secondary data is defined as the data that will be utilized in a
research that was not produced directly for the research project under consideration.
These two types of data can be utilized for the purpose of answer the research
questions and research hypotheses.
3.2.1 Primary Data
Primary data is referred to the data that collected specifically for the research
project. Primary data is the original data that has not been introduced to the
general public yet. Primary data can be utilized to address the research problem
and the research objectives.
The questionnaire is the main component of primary data. Survey questionnaires
are printed and hand out to the respondents. The target respondents will complete
the survey questionnaires within a period of time. Target respondents are
requested to answer the survey questionnaires on the basis of their knowledge,
experience, and opinion. The data gathered will be utilized by the researcher to
examine the hypotheses of the research project.
The benefits of employing survey questionnaire are an efficient, cost-effective,
and handy method to gather data from numerous target respondents. In addition,
the data collected through survey questionnaires are valid and reliable because
the data has not been transformed by other persons.

Employer Attractiveness
17
3.2.2 Secondary Data
Secondary data is referred to data that gathered in advance, it is already
obtainable, and not an original data. The benefits of employing secondary data
are inexpensive, handy, and not time-consuming (Zikmund et al, 2013).
Secondary data for this research project is collected by several manners, for
instance, journal articles, latest news, and internet/websites which are applicable
and related to the research. Online academic databases and search engines are
utilized to search for academic journals and articles, for instance, ScienceDirect,
JSTOR, SAGE journals, and Google Scholar.
3.3 Sampling Design
3.3.1 Target Population
The target population was defined by Sekaran and Bougie (2016) as the
consensus group of phenomena, objects, or persons that the scholars desire to
study. The primary goal of this research is to examine the relationship between
personal values and perceived employer attractiveness of undergraduate students
of a private higher education institution in the northern region of Peninsular
Malaysia. Thence, my target population would be the private higher education
institution’s undergraduate students. The target population is only undergraduate
students, foundation students and postgraduate students will not be included in
this study.
3.3.2 Sampling Frame and Sampling Location
One private higher education institution in the Peninsular Malaysia’s northern
region was chosen in this research, which is Universiti Tunku Abdul Rahman
(UTAR). UTAR is a private, comprehensive, and non-profit higher education
institution in Malaysia; it is one of the most distinguished private higher
education institutions in Malaysia. UTAR possesses two campuses, namely

Employer Attractiveness
18
Kampar campus and Sungai Long campus. The Kampar campus is situated in
Perak and the Sungai Long campus is situated in Selangor. As the UTAR Kampar
campus is the main campus of UTAR, consequently the UTAR Kampar campus
was selected by the researcher as the sampling location in this research. UTAR
Kampar campus consists of five faculties, one institution, and one centre, which
are Faculty of Business and Finance (FBF), Faculty of Information and
Communication Technology (FICT), Faculty of Science (FSc), Faculty of
Engineering and Green Technology (FEGT), Faculty of Arts and Social Science
(FAS), Institute of Chinese Studies (ICS), and Centre for Foundation Studies
(Kampar Campus). However, the only center in UTAR Kampar campus will be
excluded in this research as the center has not consisted of any undergraduate
students.
In addition, UTAR was ranked in the 111th
to the 120th
band in the Times Higher
Education Asia University Rankings (2017), which is second-ranked Malaysia
higher education institution and also the first-ranked private higher education
institution in the nation. In the Times Higher Education Young University
Rankings (2017), UTAR was ranked in the 101st to the 150
th band. In the Times
Higher Education Young University Ranking 2017: Millennial universities
(2017), UTAR was ranked at 14th
. Furthermore, UTAR was ranked at 251-300
band in the QS University Rankings: Asia (2016).

Employer Attractiveness
19
Source: Rankings by Times Higher Education 2017. (2017) Universiti Tunku
Abdul Rahman. Retrieved from
http://www.utar.edu.my/econtent_sub.jsp?fcatid=25&fcontentid=91394
Source: QS University Rankings: Asia 2016. (2016). Top Universities. Retrieved
from https://www.topuniversities.com/asia-rankings/methodology
3.3.3 Sampling Elements
The undergraduate students in UTAR Kampar campus will be surveyed through
questionnaires in this study. The undergraduate students from Faculty of Business
and Finance (FBF), Faculty of Information and Communication Technology
(FICT), Faculty of Science (FSc), Faculty of Engineering and Green Technology
(FEGT), Faculty of Arts and Social Science (FAS), and Institute of Chinese
Studies (ICS) will be included as the target respondents in this research. Those
undergraduate students from the five faculties and institution stated above are
essential in order to accomplish the research objectives.
3.3.4 Sampling Technique
There are two types of sampling techniques, namely probability sampling
technique and non-probability sampling technique. For non-probability sampling
technique, it is employed when the sampling elements of the target population are
unknown and depends on the assessment of researcher. In contrast, probability
sampling technique is employed when the sampling elements of the target
population are recognized and each sampling elements possess the same
probability to be selected in the study.
Employer Attractiveness
20
Because of the number of undergraduate students from each faculty in UTAR
Kampar campus are known, thence, the probability sampling technique is applied
in this research. “Stratified sampling” and “Simple Random Sampling” are the
two types of probability sampling technique which are adopted in this study.
There are two types of stratified sampling, namely proportionate stratified
sampling and disproportionate stratified sampling.
In this study, proportionate stratified sampling will be utilized. Under
proportionate stratified sampling technique, the target population will be
subdivided into six strata or subpopulations according to the five faculties and
one institute in UTAR Kampar campus, which are Faculty of Business and
Finance (FBF), Faculty of Information and Communication Technology (FICT),
Faculty of Science (FSc), Faculty of Engineering and Green Technology (FEGT),
Faculty of Arts and Social Science (FAS), and Institute of Chinese Studies (ICS).
Afterwards, the sampling elements are chosen from each subpopulation based on
simple random sampling. Simple random sampling is referred to each sampling
element from the target population has an equal possibility of being elected.
3.3.5 Sampling Size
The number of questionnaires distributed to undergraduate students from Faculty
of Business and Finance (FBF), Faculty of Information and Communication
Technology (FICT), Faculty of Science (FSc), Faculty of Engineering and Green
Technology (FEGT), Faculty of Arts and Social Science (FAS), and Institute of
Chinese Studies (ICS) were 372 sets. Sample sizes for the survey should be larger
than 30 sets and not more than 500 sets for most of the study (Roscoe, 1975).
Sekaran and Bougie (2016) stated that data collected from the samples rather than
the whole population probably to generate more reliable results. The sample size
should be several times (ideally ten times) more than the number of variables in
the research. Thence, the sample size should be more than 50 (5 variables) and
300 are sufficient for the research.
Since the population size is known in the research, the following formula is
adopted in order to compute the precise sample size for the research.

Employer Attractiveness
21
Adopted from: Krejcie, R. V., & Morgan, D. W. (1970). Determining sample size
for research activities. Educational and psychological measurement, 30(3), 607-
610.
Table 3.1: Computation of Sample Size
Faculty
Number of
Elements in
Stratum
% of
Elements
Stratum
Number of
Elements
Selected for The
Sample
Faculty of Business and
Finance (FBF) 5,914 51 190
Faculty of Information
and Communication
Technology (FICT)
1,068 9 34
Faculty of Science (FSc) 1,486 13 48
Faculty of Engineering
and Green Technology
(FEGT)
832 7 26
Faculty of Arts and Social
Science (FAS) 2,093 18 67
Institute of Chinese
Studies (ICS) 267 2 7

Employer Attractiveness
22
Total 11,660 100 372
3.4 Research Instrument
3.4.1 Questionnaire Design
Personal self-administration questionnaire is designed for the purpose of data
collection. The questions in the questionnaire are adopted from the Employer
Attractiveness Scale which is initiated by the Berthon et al (2005). The Employer
Attractiveness Scale was selected in view of the fact that the Employer
Attractiveness Scale has already been applied in many types of research in the
international stage, and it is indicating favorable dependability (Alniaçik &
Alniaçik, 2012; Arachchige & Robertson, 2011; Roy, 2008; Sivertzen, Nilsen, &
Olafsen, 2013; Wallace, Lings & Cameron, 2012).
The questionnaire is composed of 29 questions and classified into three sections,
which are “part A”, “part B, and “part C”. Four questions are inquired about the
personal information of the target respondents in part A. The gender, race, faculty
and entry qualification of the target respondents will be queried. One
dichotomous question and one multiple choice question are employed to gather
the personal information of the target respondents. The dichotomous question has
merely two options for the target respondents to answer. For the multiple choice
question, it has a choice of responses for the target respondents to select one of
the alternatives given (Zikmund et al, 2013).
In part B, it is constructed by twenty questions which are intended to inquire the
target respondents regarding four independent variables that influence perceived
employer attractiveness of undergraduate students. The four independent
variables are interest value, social value, application value, economic value, and
development value. Each independent variable contains four questions that need
the target respondents to reply.

Employer Attractiveness
23
In part C, it is constructed by five questions which are aims to inquire the target
respondents regarding the perceived employer attractiveness. The objective of
questions inquired in part C is to learn the perceived employer attractiveness of
undergraduate students.
3.4.2 Pilot Test
The pilot test is referred to a reliability analysis in a research which executed
through a small group of respondents so as to ensure the questions in the
questionnaire and consequently, the analysis generated is consistent. 30
respondents were asked to complete the questionnaires in order to make sure the
questionnaire is dependable and also recognize the latent issues which contained
in the questionnaire.
3.4.2.1 Result of Pilot Test
Variables Results
Interest Value 0.748
Social Value 0.792
Application Value 0.653
Economic Value 0.790
Development Value 0.800
Perceived Employer Attractiveness 0.792
3.5 Constructs Measurement (Scale and Operational
Definitions)
3.5.1 Scale Measurement
In this research project, all the two fundamental types of scales are employed. In
the questionnaire, the nominal scale is employed to identify the respondents’

Employer Attractiveness
24
gender, race, faculty, and their entry qualification into university. Only one
answer for each question is selected by the target respondents. In part B and part
C, interval scale is employed. In part B, it is consists of 4 items for each of the
independent variable and 5 items for the dependent variable, the items are
measured through a five-point Likert scale with 1 expresses strongly disagree, 2
expresses disagree, 3 expresses neutral, 4 expresses agree, and 5 expresses
strongly agree. By applying five-point Likert scale, it allows the researcher to
analyze the data via Pearson Correlation Coefficient and Multiple Regression
Analysis.
3.6 Data Processing
One of the most crucial components of this research project is “data processing”. In
the process of data processing, the data collected from the questionnaire will be
produced to transform into meaningful information. There are several procedures
included in this process, namely data checking, data editing, data coding, and data
transcribing. The accuracy and quality of the data will be assured.
3.6.1 Data Checking
The first procedure of the data processing is data checking; it continues to
guarantee that the data collected is entirely completed and there are no
uncompleted answers in the questionnaire collected. The uncompleted answers in
the questionnaire could influence the validity and dependability of the data.
Thence, the researcher should ensure the data is completed in this procedure.
3.6.2 Data Editing
The second procedure of the data processing is data editing. The objective of data
editing and adjusting is to control the readability and conformity of the data
collected. This procedure also relates the examination of unreadable and

Employer Attractiveness
25
inconsistent of the data collected. Thence, the revision of the data collected could
prepare the data collected to be more precise and consistent (Zikmund et al, 2013).
3.6.3 Data Coding
The third procedure of the data processing is data coding. The purpose of data
coding is to determine and assert every answer from the questionnaire collected
and code the answer with numeral value.
In part A, the questions are concerning with the demographic information, for
instance, the first question is concerning with the gender of the target respondents,
“Male” is asserted as “1” and “Female” is asserted as “2”. The second question is
concerning with the race of the target respondents, “Chinese” is asserted as “1”,
“Malay” is asserted as “2”, “Indian” is asserted as “3”, and “Other” is asserted as
“4”. The other two questions in part A have also assorted accordingly as well. In
this procedure, the data is asserted by employing IBM SPSS Statistics software
package.
In part B and C, the options for answers of questions are also assorted
accordingly. “Strongly Disagree” is asserted as “1”, “Disagree” is asserted as “2”,
“Neutral” is asserted as “3”, “Agree” is asserted as “4”, and “Strongly Agree” is
asserted as “5”.
The sample is indicated in the table below:
Part Name of Variable Value and Label
A “Gender” “Male” ---- 1
“Female” ---2
B “I would like to work with an employer who
provides me good promotion opportunities -----
----- EA1”
“Strongly Disagree” --- 1
“Disagree” -------------- 2
“Neutral” --------------- 3
“Agree” ----------------- 4
“Strongly Agree” ------ 5
C “I perceive that an employer is an attractive
employer where I can gain recognition and
“Strongly Disagree” --- 1
“Disagree” -------------- 2

Employer Attractiveness
26
appreciation from management -------- PEA1” “Neutral” --------------- 3
“Agree” ----------------- 4
“Strongly Agree” ------ 5
3.6.4 Data Transcribing
The last procedure of the data processing is data transcribing. The assorted data
from the questionnaire collected that coded in IBM SPSS Statistics software
package are utilized to analyze and summarize the data after the data processed
through IBM SPSS Statistics software package.
3.7 Data Analysis
After the data is acquired and collected, the researcher will analyze the data by IBM
SPSS Statistics software package. The data gathered was analyzed statistically by a
researcher in order to examine whether the hypotheses generated have been accepted
and supported (Sekaran & Bougie, 2016). The definition of data analysis is the
application of inference to explain the data gathered. In the data analysis, there are
three types of major statistical techniques, namely descriptive analysis, scale
measurement (reliability analysis), and inferential analysis (Zikmund et al, 2013).
3.7.1 Descriptive Analysis
Descriptive analysis indicates that the major transformation of data in a manner
that explains the fundamental aspects, such as distribution, variability, and central
tendency. There are four types of scale measurement, namely ratio scale, interval
scale, ordinal scale, and nominal scale. For ratio and interval scale measurement,
the data gathered will be transformed into statistics, such as mean, standard
deviation, and histogram. In contrast, for ordinal and nominal scale measurement,
the data gathered will be transformed into a percentage, frequencies, bar chart.

Employer Attractiveness
27
Based on the research, the descriptive analysis’s result will be formed through
tables and charts to reveal the patterns of frequencies and percentages. By tables
and charts, it allows the researchers and scholars comprehend the details and
figures comfortably and conveniently. Moreover, the aspects that will be studied
under descriptive analysis comprise gender, race, faculty, and entry qualification.
These aspects might be significantly affecting the employer attractiveness in
Malaysia.
3.7.2 Scale Measurement (Reliability Analysis)
The dependability of a measure indicates the extent of error free and thereby
ensures reliable measurement across the time and across the different items in the
research instrument (Sekaran & Bougie, 2016).
Golafshani (2003) has defined the reliability as the degree of the result is
persistent over time and an accurate indicator of the entire population in the
research. If the outcome of a research is able to be duplicated with the similar
research methodology, then it is considered to be reliable.
Cronbach’s alpha refers to a reliability coefficient that indicates how well the
items in a group are positively related to one another. Cronbach’s alpha is
computed in terms of the mean of correlations between the items measuring the
concept. The closer the value of Cronbach’s alpha to 1, the internal consistency
reliability is greater (Sekaran & Bougie, 2016).
Sekaran and Bougie (2016) expressed that Cronbach’s alpha ranges in value over
0.80 are represented very good reliability, 0.70 to 0.80 are represent good
reliability, 0.60 to 0.70 are represent fair reliability, below 0.60 are represent poor
reliability.

Employer Attractiveness
28
Table 3.2 Interpretation of Cronbach’s Alpha
Source: Sekaran, U., & Bougie, R. (2016). Research methods for business: A skill
building approach. John Wiley & Sons.
3.7.3 Inferential Analysis
The inferential analysis is referred to the result acquired from sample elements is
signifying the aspects of the target population. It assists in building and
concluding the relationship between variables. In the inferential analysis, there
are two types of analyses have been applied, namely Pearson’s Correlation
Analysis and Multiple Regression Analysis (Zikmund et al, 2013).
The inferential analysis is a type of data analysis to utilize the results that have
been generated from experimental research so as to generalize populations. It
entails inferential analysis try to answer the issues regarding samples and
populations (Kalla, 2010).
3.7.3.1 Pearson’s Correlation Analysis
The objective of Pearson’s Correlation Analysis is to explain the significance,
direction, and strength of the relationship between two variables. In general,
Pearson’s Correlation Analysis is utilized to measure ratio and interval variables.
(Sekaran & Bougie, 2016).

Employer Attractiveness
29
The result of Pearson’s Correlation Analysis can be perfect negative (-1) or
perfect positive (+1) correlation, it expresses the perfect correlation among two
variables. A zero value indicates that the variables are not linearly associated with
each other.
If the result of the coefficient is lower, it is indicated that the smaller the strength
of the relationship between two variables. There is a high correlation if the
coefficient range is above ± 0.70 if the coefficient range is below ± 0.40, it
represents small correlation.
Table 3.3: Pearson Correlation Coefficients
Source: Hair, Jr., Money, A. H., Samouel, P., and Page, M. (2007). Research
Methods for Business. West Sussex: John Wiley Sons.
Hypothesis 1:
There is a significant relationship between interest value and perceived employer
attractiveness.
“Pearson Correlation Analysis” is applied for hypothesis 1 because the standard
of measurement for both interest value and perceived employer attractiveness are
metric scale. Simultaneously, it is one-to-one testing and both variables are
continuous variables. Thence, Pearson Correlation Coefficient is the most
appropriate analysis to apply.

Employer Attractiveness
30
Hypothesis 2:
There is a significant relationship between social value and perceived employer
attractiveness.
“Pearson Correlation Analysis” is applied for hypothesis 2 because of the
standard of measurement for both social value and perceived employer
attractiveness are metric scale. Simultaneously, it is one-to-one testing and both
variables are continuous variables. Thence, Pearson Correlation Coefficient is the
most appropriate analysis to apply.
Hypothesis 3:
There is a significant relationship between application value and perceived
employer attractiveness.
“Pearson Correlation Analysis” is applied for hypothesis 3 because the standard
of measurement for both application value and perceived employer attractiveness
are metric scale. Simultaneously, it is one-to-one testing and both variables are
continuous variables. Thence, Pearson Correlation Coefficient is the most
appropriate analysis to apply.
Hypothesis 4:
There is a significant relationship between economic value and perceived
employer attractiveness.
“Pearson Correlation Analysis” is applied for hypothesis 4 because of the
standard of measurement for both economic value and perceived employer
attractiveness are metric scale. Simultaneously, it is one-to-one testing and both
variables are continuous variables. Thence, Pearson Correlation Coefficient is the
most appropriate analysis to apply.
Hypothesis 5:
There is a significant relationship between development value and perceived
employer attractiveness.

Employer Attractiveness
31
“Pearson Correlation Analysis” is applied for hypothesis 5 because the standard
of measurement for both development value and perceived employer
attractiveness are metric scale. Simultaneously, it is one-to-one testing and both
variables are a continuous variable. Thence, Pearson Correlation Coefficient is
the most appropriate analysis to apply.
3.7.3.2 Multiple Regression Analysis
Multiple Regression Analysis is defined by Zikmund et al (2013) as an
enhancement of simple regression analysis which allowing a metric dependent
variable to be predicted by multiple independent variables. The purpose of
Multiple Regression Analysis is to explore the effects of several independent
variables on dependent variable concurrently.
Hypothesis 6:
There is a significant relationship between interest value, social value, application
value, economic value, development value, and perceived employer
attractiveness.
“Multiple Linear Regression Analysis” is applied for hypothesis 6 because the
standard of measurement for interest value, social value, application value,
economic value, and development value are metric scale as well as perceived
employer attractiveness is also metric scale. Since interest value, social value,
application value, economic value, and development value have more than two
groups of samples, thus the most appropriate analysis would be multiple linear
regressions.
3.8 Conclusion
The research methodology has mentioned the procedures how the data were collected
for analysis. The type of data analysis is also specified in chapter 3 and the application
of sampling technique is also discussed.

Employer Attractiveness
32
CHAPTER 4: DATA ANALYSIS
4.0 Introduction
The data that have been gathered is explored by IBM SPSS Statistics software
package. Tables and pie charts are utilized to demonstrate the descriptive analysis.
Afterwards, it is accompanied by the reliability analysis and the Cronbach’s alpha
ranges. Next, there are inferential analyses through applying “Pearson’s Correlation
Analysis” and “Multiple Linear Regression Analysis”.
4.1 Descriptive Analysis
4.1.1 Respondent Demographic Profile
4.1.1.1 Gender
Table 4.1: Gender of Respondents
Frequency Percentage
(%)
Cumulative
Frequency
Cumulative
Percentage
(%)
Male 169 45.4 169 45.4
Female 203 54.6 372 100
Total 372 100 372 100
Source: Developed for the research

Employer Attractiveness
33
Figure 4.1: Gender of Respondents
Source: Developed for the research
Both of table 4.1 and figure 4.1 illustrate the highest number of respondents are
female with 54.6% and 45.4% are male. Thence, the number of female
respondents are 203 and 169 are male respondents.
4.1.1.2 Race
Table 4.2: Race of Respondents
Frequency Percentage
(%)
Cumulative
Frequency
Cumulative
Percentage
(%)
Chinese 350 94 350 94
Malay 0 0 350 94
Indian 17 4.6 367 98.6
Other 5 1.4 372 100
Total 372 100 372 100
45.4%
54.6%
Gender
Male
Female

Employer Attractiveness
34
Source: Developed for the research
Figure 4.2: Race of Respondents
Source: Developed for the research
Table 4.2 and figure 4.2 are illustrating the race of respondents. The highest
number of respondents is Chinese with 350 respondents or 94%, while Indians
respondents are the second highest with 17 respondents or 4.6%. The third
highest number of respondents is other races with 5 respondents or 1.4%. None of
the respondents are Malay.
4.1.1.3 Faculty
Table 4.3: Faculty
Frequency Percentage
(%)
Cumulative
Frequency
Cumulative
Percentage
(%)
Faculty of
Business and
Finance (FBF)
190 51 190 51
94%
0% 4.6% 1.4%
Race
Chinese
Malay
Indian
Other

Employer Attractiveness
35
Faculty of
Information
and
Communication
Technology
(FICT)
34 9 224 60
Faculty of
Science (FSc) 48 13 272 73
Faculty of
Engineering
and Green
Technology
(FEGT)
26 7 298 80
Faculty of Arts
and Social
Science (FAS)
67 18 365 98
Institute of
Chinese Studies
(ICS)
7 2 372 100
Total 372 100 372 100
Source: Developed for the research

Employer Attractiveness
36
Figure 4.3 Faculty
Source: Developed for the research
Table 4.3 and figure 4.3 are illustrating the number of students from each faculty
in the UTAR Kampar campus. The highest number of respondents is from
Faculty of Business and Finance (FBF) which are 51% or equivalent to 190
students. Following by student from Faculty of Arts and Social Science (FAS) are
18% or 67 students. The number of respondents from Faculty of Science (FSc)
and Faculty of Information and Communication Technology (FICT) are 13% and
9% or 48 and 34 respondents respectively. The number of respondents from
Faculty of Engineering and Green Technology (FEGT) is 7% or 26 students. The
lowest number of respondents is from Institute of Chinese Studies (ICS) which is
only 2% or 7 students.
51%
9%
13%
7%
18%
2%
Faculty
Faculty of Business andFinance (FBF)
Faculty of Informationand CommunicationTechnology (FICT)
Faculty of Science (FSc)
Faculty of Engineeringand Green Technology(FEGT)
Faculty of Arts and SocialScience (FAS)
Institute of ChineseStudies (ICS)

Employer Attractiveness
37
4.1.1.4 Entry Qualification
Table 4.4: Entry Qualification of Respondents
Frequency Percentage
(%)
Cumulative
Frequency
Cumulative
Percentage
(%)
Foundation
Program 236 63.4 236 63.4
Sijil Tinggi
Persekolahan
Malaysia
(STPM)
90 24.3 326 87.7
Diploma 27 7.1 353 94.9
A-Level 4 1.1 357 96.0
Matriculation 2 0.6 359 96.6
Other 13 3.4 372 100
Total 372 100 372 100
Source: Developed for the research
Figure 4.4 Entry Qualifications of Respondents
63.4%
24.3%
7.1%
1.1% 0.6% 3.4%
Entry Qualification
Foundation Program
Sijil Tinggi PersekolahanMalaysia (STPM)
Diploma
A-Level
Matriculation
Other

Employer Attractiveness
38
Source: Developed for the research
Table and pie chart above is illustrating the number of respondents with different
entry qualifications. Based on the table, most of the students are the entry with
UTAR Foundation Program, which are 236 students or 63.4%. Following by Sijil
Tinggi Persekolahan Malaysia (STPM) are 90 students or 24.3%, Diploma is 27
students or 7.1%, another qualification is 13 students or 3.4%. A number of
students with A-Level is 4 or 1.1%. The least number are students who entry with
Matriculation which is only 2 students or 0.6%.
4.1.2 Central Tendencies Measurement of Constructs
4.1.2.1 Interest Value
Table 4.5: Central Tendencies Measurement of Constructs: Interest Value
Statements Percentage (%)
Mean Stand.
Dev Rank
SD D N A SA
1. “I would like to work
with an innovative
employer who
applies novel
practices/forward-
thinking.”
0 0 9.1 57.4 33.4 4.24 0.606 4
2. “I would like to work
with an employer
who appreciates and
utilizes my
creativity.”
0 0.9 1.4 57.1 40.6 4.37 0.561 1
3. “I would like to work
with an employer
who produces
excellent products
and services."
0 0.9 6.0 55.1 38.0 4.30 0.619 3

Employer Attractiveness
39
4. “I would like to work
with an employer
who produces
innovative products
and services.”
0 0.9 4.3 55.1 39.7 4.34 0.601 2
Source: Developed for the research
The table above indicates the percentage, mean, and standard deviation of
respondents concerning interest value.
There are four components included in the table above. The statement of “I would
like to work with an employer who appreciates and utilizes my creativity.” is
ranked with the highest mean value of 4.37. There are 57.1% of respondents
selected “Agree”, followed by 40.6% of respondents who picked “Strongly Agree”
on this statement and 1.4% of respondents choose “Neutral”. There are 0.9% of
respondents voted ‘Disagree” and none of the respondents selected “Strongly
Disagree” with this statement.
The second highest ranking of statement is “I would like to work with an
employer who produces innovative products and services.” which gain the mean
value of 4.34. There are 55.1% of respondents voted “Agree” with this statement
and 39.7% of respondents selected “Strongly Agree”, followed by 4.3% of
respondents voted “Neutral”. 0.9% of respondents choose “Disagree” and none of
the respondents selected “Strongly Disagree”.
The third highest ranking of statement is “I would like to work with an employer
who produces excellent products and services." which gain the mean value of
4.30. There are 55.1% of respondents selected “Agree” with this statement and
38.0% of respondents selected “Strongly Agree”, followed by 6.0% of
respondents voted “Neutral”. 0.9% of respondents choose “Disagree” and none of
the respondents picked “Strongly Disagree”.
The lowest ranking of statement is “I would like to work with an innovative
employer who applies novel practices/forward-thinking.” which scores the mean
of 4.24. Majority of 57.4% among the respondents picked “Agree” with this

Employer Attractiveness
40
statement, and 33.4% of respondents choose “Strongly Agree” on this statement,
followed by 9.1% of respondents voted “Neutral” selected ‘Strongly Disagree”
with this statement. None of the respondents selected “Disagree” and “Strongly
Disagree” with this statement.
The statement “I would like to work with an employer who produces excellent
products and services." has the highest “Standard Deviation” which the value is
0.619. The second highest ranking of “Standard Deviation” is belonged to the
statement of “I would like to work with an innovative employer who applies
novel practices/forward-thinking.” with the value of 0.606. The statement “I
would like to work with an employer who produces innovative products and
services.” is the third highest ranking of “Standard Deviation”, which scores the
value of 0.601. The lowest “Standard Deviation” statement is “I would like to
work with an employer who appreciates and utilizes my creativity.” which being
scores 0.561.
4.1.2.2 Social Value
Table 4.6: Central Tendencies Measurement of Constructs: Social Value
Statements
Percentage (%)
Mean Stand.
Dev Rank
SD D N A SA
1. “I would like to
work with an
employer where I
can have a friendly
relationship with my
colleagues.”
0 0.9 2.6 38.6 58.0 4.54 0.594 2
2. “I would like to
work with an
employer where I
can have a friendly
relationship with my
0 0.9 7.7 44.3 47.1 4.38 0.665 4

Employer Attractiveness
41
superiors.”
3. “I would like to
work with an
employer who
provides me a happy
work environment.”
0 0.9 3.1 28.3 67.7 4.63 0.591 1
4. “I would like to
work with an
employer who
provides me a fun
working
environment.”
0 1.7 8.6 32.9 56.9 4.45 0.723 3
Source: Developed for the research
The table above indicates the percentage, mean, and standard deviation of
respondents concerning social value.
There are four components included in the table above. Statement “I would like
to work with an employer who provides me a happy work environment.” gets the
highest mean value of 4.63. There are 67.7% of respondents choose “Strongly
Agree” with this statement, 28.3% of respondents choose “Agree”. There are 3.1%
of respondents choose “Neutral” and 0.9% of respondents choose “Disagree”.
None of the respondents choose “Strongly Disagree” with this statement.
The second highest ranking statement is “I would like to work with an employer
where I can have a friendly relationship with my colleagues.” which gets the
mean value of 4.54. 58.0% of respondents selected “Strongly Agree” with this
statement, 38.6% choose “Agree”, and 2.6% of respondents selected “Neutral”.
There are 0.9% of respondents selected “Disagree” and none of the respondents
are “Strongly Disagree” with this statement.
The third highest ranking statement is “I would like to work with an employer
who provides me a fun working environment.” with a mean value of 4.45. 56.9%
of respondents voted “Strongly Agree”, 32.9% selected “Agree”, and 8.6%

Employer Attractiveness
42
choose “Neutral”. There are 1.7% of respondents voted “Disagree” with this
statement and none of the respondents selected “Strongly Disagree”.
The lowest ranking of mean score statement is “I would like to work with an
employer where I can have a friendly relationship with my superiors.” with mean
value 4.38. 47.1% of respondents voted “Strongly Agree”, 44.3% of respondents
“Agree”, and 7.7% of respondents are voted “Neutral” with this statement”.
There are 0.9% of respondents voted “Disagree” and none of the respondents
voted ‘Strongly Disagree” with this statement.
“I would like to work with an employer who provides me a fun working
environment.” statement has the highest “Standard Deviation” value of 0.723,
followed by “I would like to work with an employer where I can have a friendly
relationship with my superiors.” statement with the “Standard Deviation” value
of 0.665. The statement “I would like to work with an employer where I can
have a friendly relationship with my colleagues.” is the third highest ranking of
‘Standard Deviation”, which scores the value of 0.594. The lowest “Standard
Deviation” statement is “I would like to work with an employer who provides me
a happy work environment.” with the value of 0.591.
4.1.2.3 Application Value
Table 4.7: Central Tendencies Measurement of Constructs: Application Value
Statements
Percentage (%)
Mean Stand.
Dev Rank
SD D N A SA
1. “I would like to
work with a
humanitarian
employer who
contributes to the
society.”
0 1.4 23.1 49.7 25.7 4.00 0.740 1
2. “I would like to 3.4 2.9 19.7 45.4 28.6 3.93 0.950 3

Employer Attractiveness
43
work with an
employer who
provides me the
opportunity to apply
what was learned in
university.”
3. “I would like to
work with an
employer who
provides me the
opportunity to teach
others what I have
learned.”
0 2.9 20.6 53.7 22.9 3.97 0.741 2
4. “I would like to
work with an
employer who is
customer-
orientated.”
0.9 6.6 32.0 41.4 19.1 3.71 0.879 4
Source: Developed for the research
The table above indicates the percentage, mean, and standard deviation of
respondents concerning application value.
There are four components included in the table above. The statement with the
highest mean value is “I would like to work with a humanitarian employer who
contributes to the society.” with a mean value of 4.00. There is 49.7% of the
respondents choose “Agree”. Followed by 25.7% of respondents picked
“Strongly Agree”, 23.1% of respondents selected “Neutral”, and 1.4% of
respondents choose “Disagree”. None of the respondents selected “Strongly
Disagree” with this statement.
The second highest ranking of statement is “I would like to work with an
employer who provides me the opportunity to teach others what I have learned.”
which scores the mean 3.97. There is 53.7% of respondents selected “Agree”.

Employer Attractiveness
44
Followed by 22.9% of respondents picked “Strongly Agree”, 20.6% of
respondents selected “Neutral”, and 2.9% of respondents picked “Disagree”. In
this statement, there are none of the respondents selected “”Strongly Disagree”.
The third highest ranking of statement is “I would like to work with an employer
who provides me the opportunity to apply what was learned in university.” with
the mean value of 3.93. There are 45.4% of the respondents selected “Agree”
with this statement. Followed by 28.6% of respondents choose “Strongly Agree”
and 19.7% of the respondents picked “Neutral”. 3.4% of the respondents selected
“Strongly Disagree” with the statement and 2.9% of the respondents picked
“Disagree”.
The lowest ranking score of mean is the statement of “I would like to work with
an employer who is customer-orientated.” with 3.71. There are 41.4% of the
respondents selected “Agree”, 32.0% of the respondents picked “Neutral”. 19.1%
of the respondents selected “Strongly Agree”, 6.6% of the respondents picked
“Disagree”, and 0.9% of the respondents voted “Strongly Disagree” with the
statement.
The statement “I would like to work with an employer who provides me the
opportunity to apply what was learned in university.” has the highest “Standard
Deviation” value which is 0.950. The second highest ranking of “Standard
Deviation” value is 0.879 which belongs to the statement of “I would like to work
with an employer who is customer-orientated.” Followed by statement “I would
like to work with an employer who provides me the opportunity to teach others
what I have learned.” with the “Standard Deviation” value of 0.741. The lowest
value statement of “Standard Deviation” is “I would like to work with a
humanitarian employer who contributes to the society.” with the value of 0.740.
4.1.2.4 Economic Value
Table 4.8: Central Tendencies Measurement of Constructs: Economic Value
Statements Percentage (%) Mean Stand. Rank

Employer Attractiveness
45
SD D N A SA Dev
1. “I would like to
work with an
employer who
provides me good
promotion
opportunities.”
0.9 1.7 6.3 47.1 44.0 4.32 0.741 2
2. “I would like to
work with an
employer who
provides me an
above average basic
salary.”
0 0.6 7.7 45.1 46.6 4.38 0.652 1
3. “I would like to
work with an
employer who
provides me an
attractive
comprehensive
compensation
package.”
0.9 0 10.6 46.6 42.0 4.29 0.722 3
4. “I would like to
work with an
employer who
provides me job
security within the
organization.”
0 2.0 4.0 53.7 40.3 4.32 0.648 2
Source: Developed for the research
The table above indicates the percentage, mean, and standard deviation of
respondents concerning economic value.
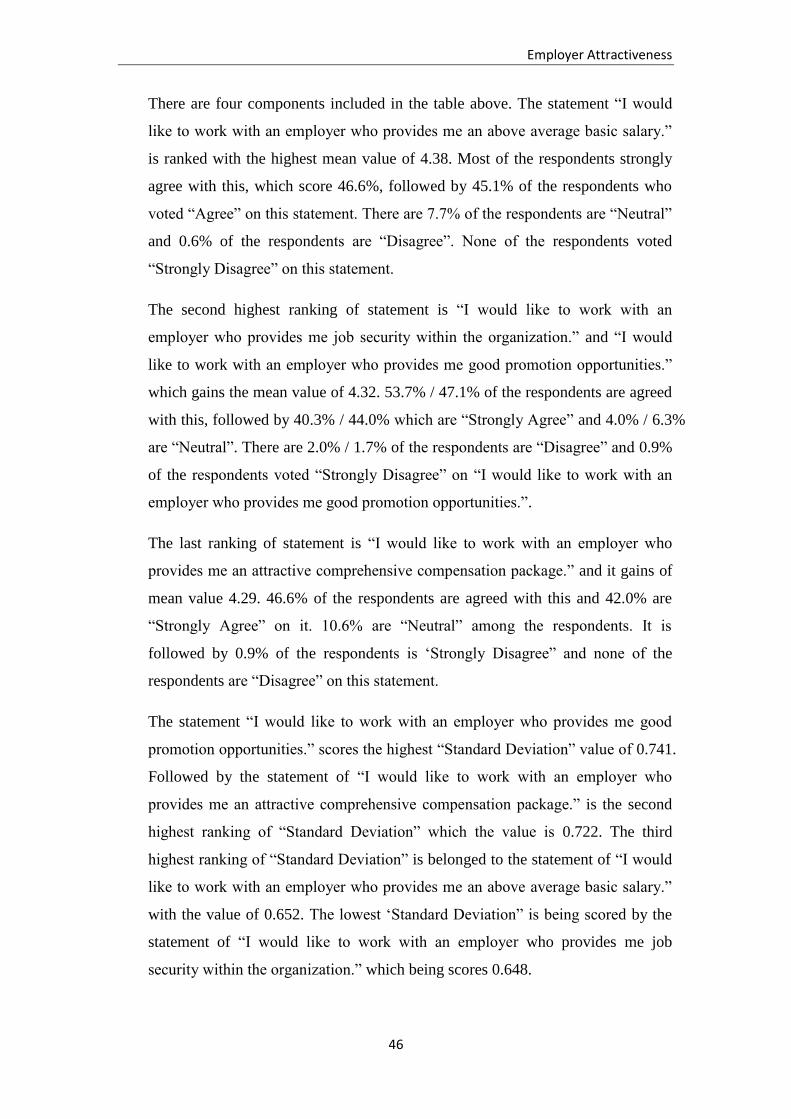
Employer Attractiveness
46
There are four components included in the table above. The statement “I would
like to work with an employer who provides me an above average basic salary.”
is ranked with the highest mean value of 4.38. Most of the respondents strongly
agree with this, which score 46.6%, followed by 45.1% of the respondents who
voted “Agree” on this statement. There are 7.7% of the respondents are “Neutral”
and 0.6% of the respondents are “Disagree”. None of the respondents voted
“Strongly Disagree” on this statement.
The second highest ranking of statement is “I would like to work with an
employer who provides me job security within the organization.” and “I would
like to work with an employer who provides me good promotion opportunities.”
which gains the mean value of 4.32. 53.7% / 47.1% of the respondents are agreed
with this, followed by 40.3% / 44.0% which are “Strongly Agree” and 4.0% / 6.3%
are “Neutral”. There are 2.0% / 1.7% of the respondents are “Disagree” and 0.9%
of the respondents voted “Strongly Disagree” on “I would like to work with an
employer who provides me good promotion opportunities.”.
The last ranking of statement is “I would like to work with an employer who
provides me an attractive comprehensive compensation package.” and it gains of
mean value 4.29. 46.6% of the respondents are agreed with this and 42.0% are
“Strongly Agree” on it. 10.6% are “Neutral” among the respondents. It is
followed by 0.9% of the respondents is ‘Strongly Disagree” and none of the
respondents are “Disagree” on this statement.
The statement “I would like to work with an employer who provides me good
promotion opportunities.” scores the highest “Standard Deviation” value of 0.741.
Followed by the statement of “I would like to work with an employer who
provides me an attractive comprehensive compensation package.” is the second
highest ranking of “Standard Deviation” which the value is 0.722. The third
highest ranking of “Standard Deviation” is belonged to the statement of “I would
like to work with an employer who provides me an above average basic salary.”
with the value of 0.652. The lowest ‘Standard Deviation” is being scored by the
statement of “I would like to work with an employer who provides me job
security within the organization.” which being scores 0.648.

Employer Attractiveness
47
4.1.2.5 Development Value
Table 4.9: Central Tendencies Measurement of Constructs: Development Value
Statements
Percentage (%)
Mean Stand.
Dev Rank
SD D N A SA
1. “I would have a
feeling of more self-
confident because
of working for a
particular
employer.”
1.7 2.3 26.3 44.0 25.7 3.90 0.870 4
2. “I would have a
good feeling about
myself because of
working for a
particular
employer.”
0.9 1.4 28.3 44.9 24.6 3.91 0.810 3
3. “I would like to
work with an
employer where I
can gain career-
enhancing
experience.”
0.9 0.9 3.4 47.1 47.7 4.40 0.681 1
4. “I would like to
work with an
employer who
provides me a
springboard for my
future
employment.”
0 2.6 4.3 51.7 41.4 4.32 0.677 2
Source: Developed for the research

Employer Attractiveness
48
The table above indicates the percentage, mean, and standard deviation of
respondents concerning development value.
There are four components included in the table above. The statement of “I would
like to work with an employer where I can gain career-enhancing experience.” is
ranked with the highest mean score of 4.40. Most of the respondents strongly
agree with this, which score 47.7%, followed by 47.1% of the respondents who
voted “Agree” and 3.4% of the respondents voted “Neutral. There are 0.9% of the
respondents choose “Disagree” and also 0.9% of the respondents choose
“Strongly Disagree”.
The second highest ranking of statement is “I would like to work with an
employer who provides me a springboard for my future employment.” which
gains the mean value of 4.32. 51.7% of the respondents are agreed with this,
followed by 41.4% which is “Strongly Agree” and 4.3% are “Neutral” with this.
There are 2.6% of the respondents are “Disagree” and none of the respondents
voted ‘Strongly Disagree” on this statement.
The third highest ranking of statement is “I would have a good feeling about
myself because of working for a particular employer.” and it gains 3.91 of the
mean value. 44.9% of the respondents are agreed with this and 28.3% are
“Neutral” on it. 24.6% are “Strongly Agree”. It is followed by 1.4% of the
respondents are ‘Disagree” and 0.9% of the respondents are “Strongly Disagree”
on this statement.
The last ranking of statement is “I would have a feeling of more self-confident
because of working for a particular employer.”. The mean of this statement is
being scored as 3.90. Majority of the respondents which are 44.0% voted “Agree”
with this statement, while 26.3% of the respondents voted “Neutral” with this
statement. Following by 25.7% of the respondents voted “Strongly Agree”, 2.3%
of the respondents voted “Disagree”, and 1.7% of the respondents voted
‘Strongly Disagree” regarding this statement.
The statement “I would have a feeling of more self-confident because of working
for a particular employer.” scores the highest “Standard Deviation” value of
0.870. Followed by the statement of “I would have a good feeling about myself

Employer Attractiveness
49
because of working for a particular employer.” is the second highest ranking of
“Standard Deviation” which the value is 0.810. The third highest ranking of
“Standard Deviation” is belonged to the statement of “I would like to work with
an employer where I can gain career-enhancing experience.” with the value of
0.681. The lowest ‘Standard Deviation” is being scored by the statement of “I
would like to work with an employer who provides me a springboard for my
future employment.” which being scores 0.677.
4.1.2.6 Perceived Employer Attractiveness
Table 4.10: Central Tendencies Measurement of Constructs: Perceived Employer
Attractiveness
Statements
Percentage (%)
Mean Stand.
Dev Rank
SD D N A SA
1. “I perceive that an
employer who
provides me an
exciting,
challenging and
energetic
environment as an
attractive
employer.”
0 3.4 13.7 47.1 35.7 4.15 0.781 3
2. “I perceive that an
employer is an
attractive employer
where I can work
with encouraging
and supportive
colleagues.”
0 1.7 7.7 50.0 40.6 4.29 0.683 2
3. “I perceive that an 0 1.4 6.9 52.9 38.9 4.29 0.656 2

Employer Attractiveness
50
employer who
provides me the
sense of acceptance
and belongingness
as an attractive
employer.”
4. “I perceive that an
employer is an
attractive employer
where I can hand-on
inter-departmental
experience.”
0.9 1.7 19.4 50.6 27.4 4.02 0.785 4
5. “I perceive that an
employer is an
attractive employer
where I can gain
recognition and
appreciation from
management.”
0.9 1.7 8.3 45.1 44.0 4.30 0.763 1
Source: Developed for the research
The table above indicates the percentage, mean, and standard deviation of
respondents concerning perceived employer attractiveness.
There are five components included in the table above. Statement “I perceive that
an employer is an attractive employer where I can gain recognition and
appreciation from management.” gets the highest mean value of 4.30. There are
45.1% of the respondents selected “Agree”, 44.0% selected “Strongly Agree”, 8.3%
choose “Neutral”. 1.7% of the respondents are “Disagree and 0.9% of the
respondents are “Strongly Disagree” with this statement.
The statement of “I perceive that an employer is an attractive employer where I
can work with encouraging and supportive colleagues.” and “I perceive that an
employer who provides me the sense of acceptance and belongingness as an

Employer Attractiveness
51
attractive employer.” which ranked the second with a mean value of 4.29. 50.0%
/ 52.9% of the respondents selected “Agree”, 40.6% / 38.9% of the respondents
are selected “Strongly Agree”, and 7.7% / 6.9% of the respondents are “Neutral”
and none of respondents are “Strongly Disagree” with this statement.
The third highest ranking statement is “I perceive that an employer who provides
me an exciting, challenging and energetic environment as an attractive employer.”
with a mean value of 4.15. 47.1% of the respondents are “Agree” with this
statement, 35.7% are “Strongly Agree”, and 13.7% are “Neutral”. 3.4% of the
respondents are “Disagree” and none of the respondents selected “Strongly
Disagree”.
The lowest ranking of statement is “I perceive that an employer is an attractive
employer where I can hand-on inter-departmental experience.” with a mean value
of 4.02. 50.6% of the respondents choose “Agree”, 27.4% are “Strongly Agree”,
and 19.4% are ‘Neutral”. There are 1.7% of the respondents are ‘Disagree” and
0.9% of the respondents are ‘Strongly Disagree” with this statement.
The statement “I perceive that an employer is an attractive employer where I can
hand-on inter-departmental experience.” has the highest standard deviation value
of 0.785, followed by “I perceive that an employer who provides me an exciting,
challenging and energetic environment as an attractive employer.” statement with
the second ranking with “Standard Deviation” value of 0.781. The third ranking
of “Standard Deviation” is belonged to the statement of “I perceive that an
employer is an attractive employer where I can gain recognition and appreciation
from management.” with the value of 0.763. The fourth ranking ‘Standard
Deviation” statement is “I perceive that an employer is an attractive employer
where I can work with encouraging and supportive colleagues.” with the value of
0.683. The lowest ranking of “Standard Deviation” statement is “I perceive that
an employer who provides me the sense of acceptance and belongingness as an
attractive employer.” with the value of 0.656.

Employer Attractiveness
52
4.2 Scale Measurement (Reliability Analysis)
The actual reliability test is generated via IBM SPSS Statistics software package to
explore the consistency of all the variables, namely interest value, social value,
application, economic value, development value, and perceived employer
attractiveness.
Table 4.11: Scale Measurement (Reliability Analysis)
Variables Cronbach’s Alpha
(Pilot Study)
Cronbach’s Alpha
(Actual Study)
Interest Value 0.748 0.804
Social Value 0.792 0.716
Application Value 0.653 0.666
Economic Value 0.790 0.722
Development Value 0.800 0.756
Perceived employer
attractiveness 0.792 0.798
Source: Developed for the research
The table above indicates that all the variables have very good, good, and fair
reliability. The interest value has very good reliability which the Cronbach’s Alpha
value is 0.804. The social value, economic value, development value, and perceived
employer attractiveness have good reliability which the Cronbach’s Alpha value is
0.716, 0.722, 0.756, and 0.798 respectively. The application value has fair reliability
which the Cronbach’s Alpha value is 0.666.

Employer Attractiveness
53
4.3 Inferential Analyses
4.3.1 Pearson Correlation Analysis
4.3.1.1 Hypothesis 1
Table 4.12: Correlation between Interest Value and Perceived Employer
Attractiveness
Correlations
IV EA
IV
Pearson Correlation 1 .369**
Sig. (2-tailed) .000
N 372 372
EA
Pearson Correlation .369** 1
Sig. (2-tailed) .000
N 372 372
**. Correlation is significant at the 0.01 level (2-tailed).
Source: Developed for the research
H0: There is no significant relationship between interest value and perceived
employer attractiveness.
H1: There is a significant relationship between interest value and perceived
employer attractiveness.
The table above indicates that the result of Pearson Correlation Analysis. The
positive and significant relationship between interest value and perceived
employer attractiveness are demonstrated by the positive value of “Correlation
Coefficient” and “P-value” of less than 0.01. The “Correlation Coefficient” is
+0.369. This shows that when interest value is high, the perceived employer
attractiveness is high. The “Correlation Coefficient” value is +0.369 which is
within the range from ±0.21 to ±0.40. Thence, there is a small but definite
relationship between interest value and perceived employer attractiveness.
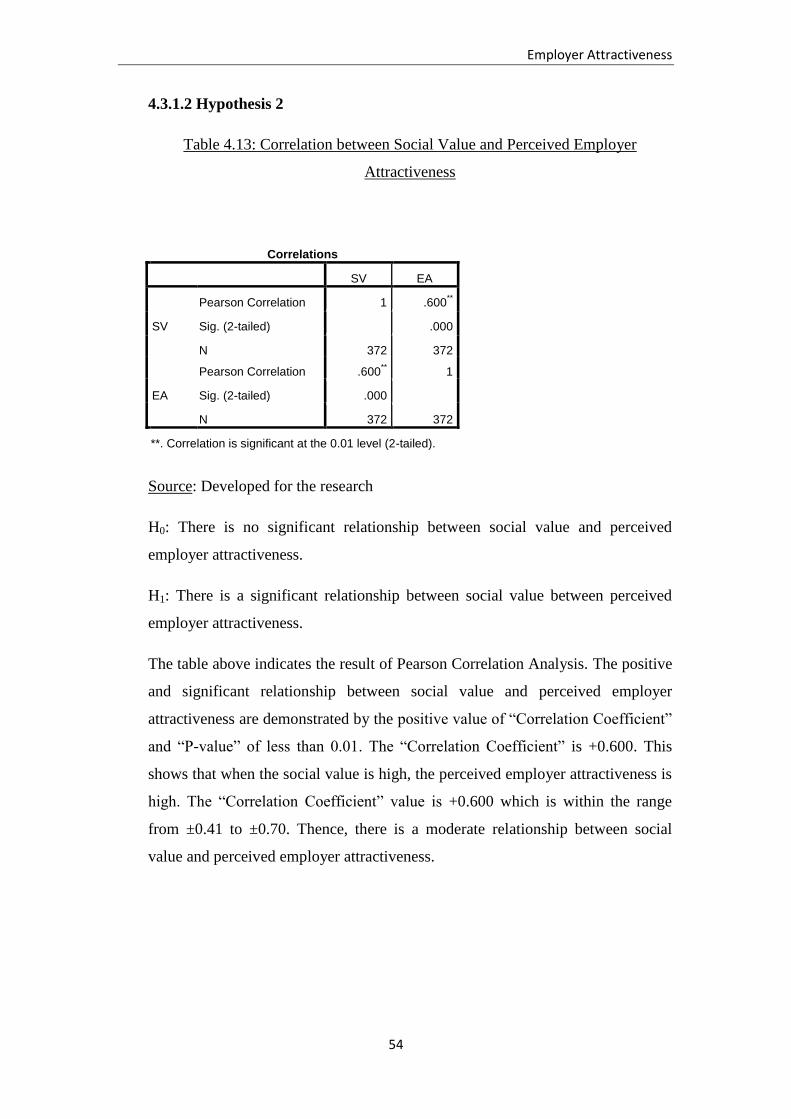
Employer Attractiveness
54
4.3.1.2 Hypothesis 2
Table 4.13: Correlation between Social Value and Perceived Employer
Attractiveness
Correlations
SV EA
SV
Pearson Correlation 1 .600**
Sig. (2-tailed) .000
N 372 372
EA
Pearson Correlation .600** 1
Sig. (2-tailed) .000
N 372 372
**. Correlation is significant at the 0.01 level (2-tailed).
Source: Developed for the research
H0: There is no significant relationship between social value and perceived
employer attractiveness.
H1: There is a significant relationship between social value between perceived
employer attractiveness.
The table above indicates the result of Pearson Correlation Analysis. The positive
and significant relationship between social value and perceived employer
attractiveness are demonstrated by the positive value of “Correlation Coefficient”
and “P-value” of less than 0.01. The “Correlation Coefficient” is +0.600. This
shows that when the social value is high, the perceived employer attractiveness is
high. The “Correlation Coefficient” value is +0.600 which is within the range
from ±0.41 to ±0.70. Thence, there is a moderate relationship between social
value and perceived employer attractiveness.

Employer Attractiveness
55
4.3.1.3 Hypothesis 3
Table 4.14: Correlation between Application Value and Perceived Employer
Attractiveness
Correlations
AV EA
AV
Pearson Correlation 1 .398**
Sig. (2-tailed) .000
N 372 372
EA
Pearson Correlation .398** 1
Sig. (2-tailed) .000
N 372 372
**. Correlation is significant at the 0.01 level (2-tailed).
Source: Developed for the research
H0: There is no significant relationship between application value and perceived
employer attractiveness.
H1: There is a significant relationship between application value and perceived
employer attractiveness.
The table above indicates the result of Pearson Correlation Analysis. The positive
and significant relationship between application value and perceived employer
attractiveness are demonstrated by the positive value of “Correlation Coefficient”
and “P-value” of less than 0.01. The “Correlation Coefficient” is +0.398. This
shows that when the application value is high, the perceived employer
attractiveness is high. The “Correlation Coefficient” value is +0.398 which is
within the range from ±0.21 to ±0.40. Thence, there is a small but definite
relationship between application value and perceived employer attractiveness.
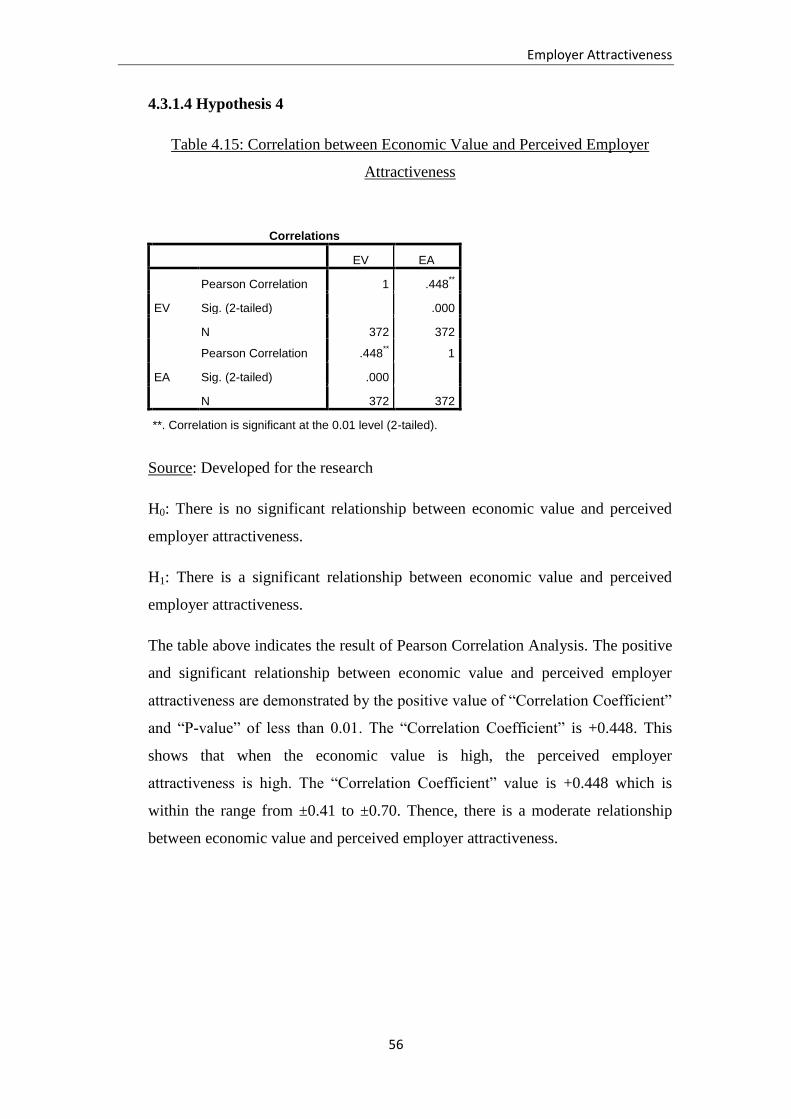
Employer Attractiveness
56
4.3.1.4 Hypothesis 4
Table 4.15: Correlation between Economic Value and Perceived Employer
Attractiveness
Correlations
EV EA
EV
Pearson Correlation 1 .448**
Sig. (2-tailed) .000
N 372 372
EA
Pearson Correlation .448** 1
Sig. (2-tailed) .000
N 372 372
**. Correlation is significant at the 0.01 level (2-tailed).
Source: Developed for the research
H0: There is no significant relationship between economic value and perceived
employer attractiveness.
H1: There is a significant relationship between economic value and perceived
employer attractiveness.
The table above indicates the result of Pearson Correlation Analysis. The positive
and significant relationship between economic value and perceived employer
attractiveness are demonstrated by the positive value of “Correlation Coefficient”
and “P-value” of less than 0.01. The “Correlation Coefficient” is +0.448. This
shows that when the economic value is high, the perceived employer
attractiveness is high. The “Correlation Coefficient” value is +0.448 which is
within the range from ±0.41 to ±0.70. Thence, there is a moderate relationship
between economic value and perceived employer attractiveness.

Employer Attractiveness
57
4.3.1.5 Hypothesis 5
Table 4.16: Correlation between Development Value and Perceived Employer
Attractiveness
Correlations
DV EA
DV
Pearson Correlation 1 .484**
Sig. (2-tailed) .000
N 372 372
EA
Pearson Correlation .484** 1
Sig. (2-tailed) .000
N 372 372
**. Correlation is significant at the 0.01 level (2-tailed).
Source: Developed for the research
H0: There is no significant relationship between development value and perceived
employer attractiveness.
H1: There is a significant relationship between development value and perceived
employer attractiveness.
The table above indicates the result of Pearson Correlation Analysis. The positive
and significant relationship between development value and perceived employer
attractiveness are demonstrated by the positive value of “Correlation Coefficient”
and “P-value” of less than 0.01. The “Correlation Coefficient” is +0.484. This
shows that when the development value is high, the perceived employer
attractiveness is high. The “Correlation Coefficient” value is +0.484 which is
within the range from ±0.41 to ±0.70. Thence, there is a moderate relationship
between development value and perceived employer attractiveness.

Employer Attractiveness
58
4.3.2 Multiple Linear Regression Analysis
Multiple linear regression analysis is an analysis to describe variance in a
dependent variable through more than one independent variable.
H0: There is no significant relationship between interest value, social value,
application value, economic value, development value, and perceived employer
attractiveness.
H1: There is significant relationship between interest value, social value,
application value, economic value, development value, and perceived employer
attractiveness.
Table 4.17: Analysis of Variance
ANOVAa
Model Sum of Squares df Mean Square F Sig.
1
Regression 49.601 5 9.920 62.275 .000b
Residual 54.798 344 .159
Total 104.399 349
a. Dependent Variable: EA
b. Predictors: (Constant), DV, IV, SV, AV, EV
Source: Developed for the research
From the table above, the “P-value” is 0.000 which is less than the “Alpha Value”
0.01. Thence, the F-statistic is significant. Thence, the model proposed is an
excellent descriptor of the connection between interest value, social value,
application value, economic value, development value, and perceived employer
attractiveness. Therefore, interest value, social value, application value, economic
value, and development value are significant to describe the perceived employer
attractiveness.

Employer Attractiveness
59
Table 4.18: Model Summary
Model Summary
Model R R Square Adjusted R
Square
Std. Error of the
Estimate
1 .689a .475 .467 .39912
a. Predictors: (Constant), DV, IV, SV, AV, EV
Source: Developed for the research
The R square is the percentage or value of the independent variables can describe
the variation in the dependent variable. The higher of the R square value indicates
the higher of the value of independent variables can describe the dependent
variable. The value of the R square in this research project is 0.475. It expresses
that the independent variables (interest value, social value, application value,
economic value, and development value) can describe 47.5% of the variation in
the dependent variable (perceived employer attractiveness). However, there are
52.5% left undescribed in this research project. Thence, there are other additional
elements that are significant in describe the perceived employer attractiveness.
Table 4.19: Coefficients
Coefficientsa
Model Unstandardized Coefficients Standardized
Coefficients
t Sig. 95.0% Confidence Interval for B
B Std. Error Beta Lower Bound Upper Bound
1
(Constant) -.267 .268 -.995 .321 -.794 .261
IV .174 .049 .151 3.536 .000 .077 .271
SV .509 .051 .442 10.022 .000 .409 .609
AV .117 .044 .126 2.665 .008 .031 .204
EV .142 .054 .133 2.621 .009 .035 .249
DV .087 .050 .093 1.740 .083 -.011 .186
a. Dependent Variable: EA
Source: Developed for the research

Employer Attractiveness
60
Interest value is significant to describe the dependent variable (perceived
employer attractiveness) for this research project as the “P-value” is 0.000 which
is less than the “Alpha Value” 0.05.
Social value is significant to describe the dependent variable (perceived employer
attractiveness) for this research project as the “P-value” is 0.000 which is less
than the “Alpha Value” 0.05.
Application value is significant to describe the dependent variable (perceived
employer attractiveness) for this research project as the ‘P-value” is 0.008 which
is less than the “Alpha Value” 0.05.
Economic value is significant to describe the dependent variable (perceived
employer attractiveness) for this research project as the “P-value” is 0.009 which
is less than the “Alpha Value” 0.05.
Development value is not significant to describe the dependent variable
(perceived employer attractiveness) for this research project as the “P-value” is
0.083 which is more than the “Alpha Value” 0.05.
Regression Equation:
Ŷ = α + b1 (x1) + b2 (x2) + b3 (x3) + b4 (x4) + b5 (x5)
Perceived Employer Attractiveness = -0.267 + 0.174 (Interest Value) + 0.509
(Social Value) + 0.117 (Application Value) + 0.142 (Economic Value) + 0.087
(Development Value)
The social value is the predictor variable that dedicates the highest to the
variation of the perceived employer attractiveness with the highest parameter
estimate of 0.509. The second contributor to the variation of the perceived
employer attractiveness is interest value with parameter estimate of 0.174. The
third highest contributor to the variation of the perceived employer attractiveness
is economic value with parameter estimate of 0.142. The fourth highest
contributor to the variation of the perceived employer attractiveness is application
value with parameter estimate of 0.117. The lowest contributor to the variation of
the perceived employer attractiveness is development value with parameter
estimate of 0.087.

Employer Attractiveness
61
4.4 Conclusion
In conclusion, this chapter offers the analysis generated from the data collected from
the questionnaire. The data collected is analyzed by descriptive, reliability, and
inferential analysis through employing the IBM SPSS Statistics software package.
Afterwards, the result of the analyses in chapter 4 will be discussed in chapter 5.

Employer Attractiveness
62
CHAPTER 5: DISCUSSION, CONCLUSION &
IMPLICATIONS
5.0 Introduction
In this chapter, the discussion of the analysis of the data will be demonstrated. The
discussion is concerned on whether the hypotheses are accepted or not. Next, the
implications and limitations of the research, and recommendations for future research
are also discussed. Finally, the entire research project will be discussed at the end of
this chapter.
5.1 Summary of Statistical Analyses
5.1.1 Summary of Descriptive Analysis
Survey questionnaires were distributed to 372 undergraduate students studying in
Faculty of Business and Finance (FBF), Faculty of Information and
Communication Technology (FICT), Faculty of Science (FSc), Faculty of
Engineering and Green Technology (FEGT), Faculty of Arts and Social Science
(FAS), and Institute of Chinese Studies (ICS) which are situated in UTAR
Kampar campus. The result of the survey questionnaires indicates that 203
respondents are female (54.6%) and 169 (45.4%) respondents are male. There are
350 (94%) respondents are Chinese, 17 (4.6%) respondents are Indians, 5 (1.4%)
respondents are other races, and there have not Malay respondents.
Most of the respondents are from the Faculty of Business and Finance (FBF),
which is 190 (51%) respondents. 67 (18%) respondents are from Faculty of Arts
and Social Science (FAS), 48 (13%) respondents are from Faculty of Science
(FSc), and 34 (9%) respondents are from Faculty of Information and
Communication Technology (FICT). 26 (7%) respondents are from Faculty of
Engineering and Green Technology (FEGT) and 7 (2%) respondents are from
Institute of Chinese Studies (ICS).

Employer Attractiveness
63
Majority of the respondents are entry with Foundation program, which are 236
respondents or 63.4% of the entire respondents. 90 (24.3%) respondents are entry
with Sijil Tinggi Persekolahan Malaysia (STPM), 27 (7.1%) respondents are
entry with Diploma, 13 (3.4%) respondents are entry with other academic
qualification, and 4 (1.1%) respondents are entry with A-Level. There is only 2
(0.6%) respondents entry from Matriculation.
5.1.2 Central Tendencies Measurement of Construct
In the aspect of interest value, the statement “I would like to work with an
employer who appreciates and utilizes my creativity.” has the highest mean
which is 4.37, followed by “I would like to work with an employer who produces
innovative products and services.” which is 4.34. The statement with the lowest
mean is “I would like to work with an innovative employer who applies novel
practices/forward-thinking.” which is 4.24. Meanwhile, “I would like to work
with an employer who produces excellent products and services." has the highest
“Standard Deviation” value which is 0.619. The statement with the lowest
“Standard Deviation” is “I would like to work with an employer who appreciates
and utilizes my creativity.” which is 0.561.
In the aspect of social value, the statement “I would like to work with an
employer who provides me a happy work environment.” has the highest mean
which is 4.63, followed by “I would like to work with an employer where I can
have a friendly relationship with my colleagues.” which is 4.54. The statement
with the lowest mean is “I would like to work with an employer where I can have
a friendly relationship with my superiors.” which is 4.38. Meanwhile, “I would
like to work with an employer who provides me a fun working environment.” has
the highest “Standard Deviation” value which is 0.723. The statement with the
lowest “Standard Deviation” is “I would like to work with an employer who
provides me a happy work environment.” which is 0.591.
In the aspect of application value, the statement “I would like to work with a
humanitarian employer who contributes to the society.” has the highest mean
which is 4.00, followed by “I would like to work with an employer who provides

Employer Attractiveness
64
me the opportunity to teach others what I have learned.” which is 3.97. The
statement with the lowest mean is “I would like to work with an employer who is
customer-orientated.” which is 3.71. Meanwhile, “I would like to work with an
employer who provides me the opportunity to apply what was learned in
university.” has the highest “Standard Deviation” value which is 0.950. The
statement with the lowest “Standard Deviation” is “I would like to work with a
humanitarian employer who contributes to the society.” which is 0.740.
In the aspect of economic value, the statement “I would like to work with an
employer who provides me an above average basic salary.” has the highest mean
which is 4.38, followed by “I would like to work with an employer who provides
me good promotion opportunities.” and “I would like to work with an employer
who provides me job security within the organization.” which is 4.32. The
statement with the lowest mean is “I would like to work with an employer who
provides me an attractive comprehensive compensation package.” which is 4.29.
Meanwhile, “I would like to work with an employer who provides me good
promotion opportunities.” has the highest ‘Standard Deviation” value which is
0.741. The statement with the lowest “Standard Deviation” is “I would like to
work with an employer who provides me job security within the organization.”
which is 0.648.
In the aspect of development value, the statement “I would like to work with an
employer where I can gain career-enhancing experience.” has the highest mean
which is 4.40, followed by “I would like to work with an employer who provides
me a springboard for my future employment.” which is 4.32. The statement with
the lowest mean is “I would have a feeling of more self-confident because of
working for a particular employer.” which is 3.90. Meanwhile, “I would have a
feeling of more self-confident because of working for a particular employer.” has
the highest “Standard Deviation” value which is 0.870. The statement with the
lowest “Standard Deviation” is “I would like to work with an employer who
provides me a springboard for my future employment.” which is 0.677.
In the aspect of perceived employer attractiveness, the statement “I perceive that
an employer is an attractive employer where I can gain recognition and
appreciation from management.” has the highest mean which 4.30, followed by “I

Employer Attractiveness
65
perceive that an employer is an attractive employer where I can work with
encouraging and supportive colleagues.” and “I perceive that an employer who
provides me the sense of acceptance and belongingness as an attractive employer.”
which is 4.29. The statement with the lowest mean is “I perceive that an employer
is an attractive employer where I can hand-on inter-departmental experience.”
which is 4.02. Meanwhile, “I perceive that an employer is an attractive employer
where I can hand-on inter-departmental experience.” has the highest “Standard
Deviation” which is 0.785. The statement with the lowest “Standard Deviation” is
“I perceive that an employer who provides me the sense of acceptance and
belongingness as an attractive employer.” which is 0.656.
5.1.3 Reliability Analysis
The reliability analysis is generated via IBM SPSS Statistics software package to
examine the consistency of all the variables (interest value, social value,
application value, economic value, development value, and perceived employer
attractiveness). The application value (0.666) has fair reliability. The social value
(0.716), economic value (0.722), development value (0.756), and perceived
employer attractiveness (0.798) have good reliability. The interest value (0.804)
has very good reliability.
5.1.4 Pearson Correlation Analysis
Based on the Pearson Correlation Analysis, the researcher is capable to explore
the relationship between the five independent variables and perceived employer
attractiveness in this research.
The result revealed that the five independent variables have a positive and
significant relationship with perceived employer attractiveness. The highest
“Correlation Coefficient” is the relationship between social value and perceived
employer attractiveness which is 0.600, while the second highest “Correlation
Coefficient” is the relationship between development value and perceived
employer attractiveness which is 0.484. The “Correlation Coefficient” of the

Employer Attractiveness
66
relationship between economic value and perceived employer attractiveness is
0.448 and the “Correlation Coefficient” of the relationship between application
value and perceived employer attractiveness is 0.398. The lowest “Correlation
Coefficient” is the relationship between interest value and perceived employer
attractiveness which is 0.369.
5.1.5 Multiple Linear Regressions
Through the result mentioned in chapter 4, the “P-value” is 0.000 which is less
than the “Alpha Value” 0.01. Thence, the F-statistic is significant. Thence, the
model proposed is an excellent descriptor of the connection between interest
value, social value, application value, economic value, development value, and
perceived employer attractiveness.
The value of the R square in this research project is 0.475. It is implied that
independent variables can describe 47.5% of the variation in the dependent
variable. However, there are 52.5% left undescribed in this research project.
Regression Equation:
Ŷ = α + b1 (x1) + b2 (x2) + b3 (x3) + b4 (x4) + b5 (x5)
Perceived Employer Attractiveness = -0.267 + 0.174 (Interest Value) + 0.509
(Social Value) + 0.117 (Application Value) + 0.142 (Economic Value) + 0.087
(Development Value)
5.2 Discussions of Major Findings
Table 5.1: Summary of Result
Hypotheses Result Accepted / Rejected
“H1: There is significant
relationship between
interest value and
r = 0.369
p = 0.000 (p < 0.01) Accepted

Employer Attractiveness
67
perceived employer
attractiveness.”
“H2: There is significant
relationship between social
value and perceived
employer attractiveness.”
r = 0.600
p = 0.000 (p < 0.01) Accepted
“H3: There is significant
relationship between
application value and
perceived employer
attractiveness.”
r = 0.398
p = 0.000 (p < 0.01) Accepted
“H4: There is significant
relationship between
economic value and
perceived employer
attractiveness.”
r = 0.448
p = 0.000 (p < 0.01) Accepted
“H5: There is significant
relationship between
development value and
perceived employer
attractiveness.”
r = 0.484
p = 0.000 (p < 0.01) Accepted
H1: There is a significant relationship between interest value and perceived
employer attractiveness.
The hypothesis 1 (H1) identified the relationship between interest value and perceived
employer attractiveness. According to the result indicated in the table, the hypothesis
above is been verified. The “P-value” is 0.000 which is lower than the “Alpha Value”
0.01. It is revealed that “There is a significant relationship between interest value and
perceived employer attractiveness”. The relationship is also verified by the
“Correlation Coefficient” with the positive value of 0.369. The result is consistent
with the result of several types of research that have been conducted by the scholars.

Employer Attractiveness
68
H2: There is a significant relationship between social value and perceived
employer attractiveness.
The hypothesis 2 (H2) identified the relationship between social value and perceived
employer attractiveness. According to the result indicated in the table, the hypothesis
above is been verified. The “P-value” is 0.000 which is lower than the “Alpha Value”
0.01. It is revealed that “There is a significant relationship between social value and
perceived employer attractiveness”. The relationship is also verified by the
“Correlation Coefficient” with the positive value of 0.600. The result is consistent
with the result of several types of research that have been conducted by the scholars.
H3: There is a significant relationship between application value and perceived
employer attractiveness.
The hypothesis 3 (H3) identified the relationship between application value and
perceived employer attractiveness. According to the result indicated in the table, the
hypothesis above is been verified. The “P-value” is 0.000 which is lower than the
“Alpha Value” 0.01. It is revealed that “There is a significant relationship between
application value and perceived employer attractiveness”. The relationship is also
verified by the “Correlation Coefficient” with the positive value of 0.398. The result
is consistent with the result of several types of research that have been conducted by
the scholars.
H4: There is a significant relationship between economic value and perceived
employer attractiveness.
The hypothesis 4 (H4) identified the relationship between economic value and
perceived employer attractiveness. According to the result indicated in the table, the
hypothesis above is been verified. The “P-value” is 0.000 which is lower than the
“Alpha Value” 0.01. It is revealed that “There is a significant relationship between
economic value and perceived employer attractiveness”. The relationship is also
verified by the “Correlation Coefficient” with the positive value of 0.448. The result

Employer Attractiveness
69
is consistent with the result of several types of research that have been conducted by
the scholars.
H5: There is a significant relationship between development value and perceived
employer attractiveness.
The hypothesis 5 (H5) identified the relationship between development value and
perceived employer attractiveness. According to the result indicated in the table, the
hypothesis above is been verified. The “P-value” is 0.000 which is lower than the
“Alpha Value” 0.01. It is revealed that “There is a significant relationship between
development value and perceived employer attractiveness”. The relationship is also
verified by the “Correlation Coefficient” with the positive value of 0.484. The result
is consistent with the result of several types of research that have been conducted by
the scholars.
5.3 Implications of the Study to Public &/or Private Policy
5.3.1 Theoretical Implications
This research theoretically dedicates to the conceptualization of model that
influences the perceived attractiveness of employer. The research of perceived
employer attractiveness is significant as there is short of research on perceived
employer attractiveness from the perspective of undergraduate students in private
higher education institutions. Most of the researchers are concentrated from the
perspective of all the university students in all higher education institutions in
Malaysia. The theoretical framework initiated will assist the researchers for
further research on the notion of perceived employer attractiveness.
5.3.2 Managerial Implications
Several managerial implications can be acquired from this research. One of the
managerial implications is the top management of the employers or organizations
should be recognizing the rising of the competitiveness in the war of talent

Employer Attractiveness
70
although there are many graduates in the labor market. Therefore, the
independent variables (interest value, social value, application value, economic
value, and development value) are studied so as to support employers to improve
their attractiveness. Thereby, the employers should implement effective
recruitment strategies that will enhance the attractiveness of employers so that
they will be more attractive to the graduates or talents. Employers are also
required to redesign or restructure their recruitment activities to improve their
attractiveness.
In addition, this research is also significant to the government, Ministry of
Human Resources, and Malaysian Employer Federation (MEF). The Ministry of
Human Resources should collaborate with the Malaysian Employer Federation
(MEF) and explore on how to offer the essential values to the potential
employees or graduates. As the Ministry of Human Resources and Malaysian
Employer Federation (MEF), their responsibility is to be the leader in the
encouragement of excellent employment practices and harmonious industrial
relations and facilitate the development of excellence in human resource
management to enable Malaysia’s employers to react the present and future
business challenges.
5.4 Limitations of the Study
5.4.1 Time Constraint
In order to complete a thoughtful research, the researcher is required a longer
time to conduct the research. There are merely 13 weeks for the researcher to
execute the research. The researcher requires more time to look for the
information, distribute the questionnaires to target respondents, and execute data
entry process for interpretation. All of the procedures are required a longer period
of time to be accomplished.

Employer Attractiveness
71
5.4.2 Budget Constraint
The expenses needed for accomplishing the research is a burden for a researcher
who has not incomes. The researcher has not sufficient budget to conduct the
research, specifically the expenses of printing and costs of distributing the
questionnaires. Since there is no funding from external parties and subsidy from
the university to conduct the research, the research is required to undertake all the
research expenses.
5.4.3 Determinants Examined in the Research
One of the limitations of the research is there may have additional factors that are
significant in describing the perceived employer attractiveness which is not
included in this research, for instance, a situational factor which comprises labor
market environment and labor market opportunities that may influence the
attractiveness of employers.
5.4.4 Research Instrument
There is only survey questionnaires are adopted as the research instrument to
gather the data in this research which will lead to item context effects. In the
questionnaire, the questions are classified into several fixed categories which do
not allow the respondents to respond freely when they having other thought. The
flexibility of the respondents is also limited when they answer the questionnaire
as they may have other answers which are not included in the questionnaire
(Meade, Watson, & Kroustalis, 2007). The number of the questions in the
research instrument for each variable respectively may not adequate for data
interpretation.

Employer Attractiveness
72
5.4.5 Sampling Frame and Sampling Elements
The sampling frame and sampling elements are confined to only undergraduate
students from one private higher education institution in Malaysia. The target
respondents are choosing according to the Times Higher Education University
Rankings 2017 and QS University Rankings: Asia (2016). Malaysia has 64
universities which consist of 20 public universities, 37 private universities, and 7
foreign universities. The undergraduate students from UTAR Kampar campus are
not representing all the undergraduate students from private universities in
Malaysia.
5.5 Recommendations for Future Research
With regard to the determinants, it is significant and important to pay more attention
at the significant and influences of the situational and individual factors. This could be
achieved by two means. First of all, a new research should be executed which is all-
around enough, in which the possibility of additional determinants can be researched.
It is always crucial to learn how the distinct situational factors are since the external
environment and labor market is continuously changing, for instance, the
organizational factors, the structure of the labor market, and opportunities which
affect the perception of employer attractiveness. In fact, additional individual factors
need to be studied if researchers desire to obtain a more thorough picture of the
concept of perceived employer attractiveness. Attitudes, characteristics, and
demographics are all relevant and significant to study in this aspect. It would be a
highly effective manner of evolving the knowledge of the determinants and to learn
how other situational and individuals factors interact in the formation of the
perceptions of employer attractiveness.
Researchers are also suggested to apply dual approach effectively which is personal
interview and open-ended questions. The personal interview should be premeditated
in assessing the perception of employer attractiveness as the personal interview is
specifically pragmatic for obtaining the unstructured information on employer
attractiveness. Open-ended responsive question is another manner that should be
employed. Through open-ended responsive question, it may reveal the concealed

Employer Attractiveness
73
responses on the perceptions of employer attractiveness. Thus, human resources
practitioners are capable to establish effective strategies for human resource planning.
Researchers are also recommended that the sampling frame and sampling elements
should not be confined to only undergraduate students from one private higher
education institution in Malaysia. Undergraduate students from other private or public
higher education institutions should also involve in the research so as to offer a
dependable and comprehensible notion of the perceived employer attractiveness in
Malaysia.
The expenses used in executing an all-around research would be costly to the
researcher who has inadequate monetary resources. The government, Ministry of
Human Resources, employers, higher education institutions, and other concerned
parties may offer monetary resources and financial assistance to researcher so as to
support researcher to conduct the research thoroughly.
5.6 Conclusion
Based on the inferential analysis, it is proving that the independent variables (interest
value, social value, application value, economic value, and development value) and
perceived employer attractiveness have a significant relationship. This research
theoretically conduces to the conceptualization of model that has an impact on the
perceived employer attractiveness of undergraduate students. The study is significant
as there is short of research on perceived employer attractiveness from the perspective
of undergraduate students from private higher education institutions. The notion of
perceived employer attractiveness is also significant in interpreting the employer
attractiveness. The research was executed so as to enhance the employer
attractiveness of employers in Malaysia. This is because of the war of talent is
becoming more competitive among the employers in Malaysia. In spite of there are
several imperfections of the research, however, there are suggestions have been
proposed.

Employer Attractiveness
74
References
Aiman-Smith, L., Bauer, T. N., & Cable, D. M. (2001). Are you attracted? Do you
intend to pursue? A recruiting policy-capturing study. Journal of Business
and psychology, 16(2), 219-237.
Alnıaçık, E., & Alnıaçık, Ü. (2012). Identifying dimensions of attractiveness in
employer branding: effects of age, gender, and current employment
status. Procedia-Social and Behavioral Sciences, 58, 1336-1343.
Alnıaçık, E., & Alnıaçık, Ü. (2012). Identifying dimensions of attractiveness in
employer branding: effects of age, gender, and current employment
status. Procedia-Social and Behavioral Sciences, 58, 1336-1343.
Arachchige, B. J., & Robertson, A. (2011). Business Student Perceptions of a
Preferred Employer: A Study Identifying Determinants of Employer
Branding. IUP Journal of Brand Management, 8(3).
Asia University Rankings 2017. (2017). Times Higher Education (THE). Retrieved
from https://www.timeshighereducation.com/world-university-
rankings/2017/regional-
ranking#!/page/4/length/25/sort_by/rank/sort_order/asc/cols/stats
Backhaus, K. B., Stone, B. A., & Heiner, K. (2002). Exploring the relationship
between corporate social performance and employer attractiveness. Business
& Society, 41(3), 292-318.
Barrow, S., House, G., Housley, S., Jenner, S., Martin, G., Mensink, J., ... & Taylor, S.
(2007). Employer branding: The latest fad or the future for HR. London:
Chartered Institute of Personnel and Development.
Berthon, P., Ewing, M., & Hah, L. L. (2005). Captivating company: dimensions of
attractiveness in employer branding. International journal of
advertising, 24(2), 151-172.
Carless, S. A. (2003). A longitudinal study of applicant reactions to multiple selection
procedures and job and organizational characteristics. International Journal
of Selection and Assessment, 11(4), 345-351.

Employer Attractiveness
75
Creswell, J. W. (2013). Research design: Qualitative, quantitative, and mixed
methods approaches. Sage publications.
Deal, J. J., Altman, D. G., & Rogelberg, S. G. (2010). Millennials at work: What we
know and what we need to do (if anything). Journal of Business and
Psychology, 25(2), 191-199.
Golafshani, N. (2003). Understanding reliability and validity in qualitative
research. The qualitative report, 8(4), 597-606.
Hair, Jr., Money, A. H., Samouel, P., and Page, M. (2007). Research Methods for
Business. West Sussex: John Wiley Sons
Jamrog, J. J. (2002). Current practices: The coming decade of the employee. People
and Strategy, 25(3), 5.
Kalla, S. (2010). Inferential Statistics. Retrieved from
https://explorable.com/inferential-statistics
Krejcie, R. V., & Morgan, D. W. (1970). Determining sample size for research
activities. Educational and psychological measurement, 30(3), 607-610.
Meade, A. W., Watson, A. M., & Kroustalis, C. M. (2007, April). Assessing common
methods bias in organizational research. In 22nd annual meeting of the
society for industrial and organizational psychology, New York (pp. 1-6).
Media release: Over 1/3 of employees looking to leave their jobs: Randstad Employer
Brand Research 2017. (2017, June 15). Randstad. Retrieved from
https://www.randstad.com.sg/workforce360/articles/media-release-over-13-
of-employees-looking-to-leave-their-jobs-randstad-employer-brand-research-
2017
Milman, A. (1993). Maximizing the value of focus group research: Qualitative
analysis of consumer's destination choice. Journal of Travel Research, 32(2),
61-64.
Miwil, O. (2016, January 28). Don't be choosy, or you might be replaced by a foreign
worker: Masidi. New Straits Times. Retrieved from

Employer Attractiveness
76
http://www.nst.com.my/news/2016/01/124488/dont-be-choosy-or-you-
might-be-replaced-foreign-worker-masidi
QS University Rankings: Asia 2016. (2016). Top Universities. Retrieved from
https://www.topuniversities.com/asia-rankings/methodology
Rankings by Times Higher Education 2017. (2017). Universiti Tunku Abdul Rahman.
Retrieved from
http://www.utar.edu.my/econtent_sub.jsp?fcatid=25&fcontentid=91394
Reis, G. G., & Braga, B. M. (2016). Employer attractiveness from a generational
perspective: Implications for employer branding. Revista de
Administração, 51(1), 103-116.
Roscoe, J. T. (1975). Fundamental research statistics for the behavioral sciences [by]
John T. Roscoe.
Roy, S. K. (2008). Identifying the Dimensions of Attractiveness of an Employer
Brand in the Indian Context. South Asian Journal of Management, 15(4).
Rynes, S. L., & Cable, D. M. (2003). Recruitment research in the twenty‐first
century. Handbook of psychology.
Rynes, S. L., Bretz, R. D., & Gerhart, B. (1991). The importance of recruitment in job
choice: A different way of looking. Personnel psychology, 44(3), 487-521.
Sani, R. (2016, December 22). Seriously? Fresh grads asking for RM3k to 6k salaries,
says survey. New Straits Times. Retrieved from
http://www.nst.com.my/news/2016/12/198756/seriously-fresh-grads-asking-
rm3k-6k-salaries-says-survey
Sekaran, U., & Bougie, R. (2016). Research methods for business: A skill building
approach. John Wiley & Sons.
Sivertzen, A. M., Nilsen, E. R., & Olafsen, A. H. (2013). Employer branding:
employer attractiveness and the use of social media. Journal of Product &
Brand Management, 22(7), 473-483.

Employer Attractiveness
77
Swanson, R. A., & Holton, E. F. (2005). Research in organizations: Foundations and
methods in inquiry. Berrett-Koehler Publishers.
Tan, E. J. (2016, May 17). How to ace a job interview. New Straits Times. Retrieved
from http://www.nst.com.my/news/2016/05/146094/how-ace-job-interview
Tsai, W. C., & Yang, I. W. F. (2010). Does image matter to different job applicants?
The influences of corporate image and applicant individual differences on
organizational attractiveness. International Journal of Selection and
Assessment, 18(1), 48-63.
Wallace, M., Lings, I., & Cameron, R. (2012). Industry branding: attracting talent to
weaker profile industries. Asia Pacific Journal of Human Resources, 50(4),
483-502.
Young University Rankings 2017. (2017). Times Higher Education (THE). Retrieved
from https://www.timeshighereducation.com/world-university-
rankings/2017/young-university-
rankings#!/page/0/length/25/locations/MY/sort_by/rank/sort_order/asc/cols/s
tats
Young University Rankings 2017: Millennial universities. (2017). THE Rankings.
Retrieved from https://www.timeshighereducation.com/world-university-
rankings/young-university-rankings-2017-millennial-universities
Zikmund, W. G., Babin, B. J., Carr, J. C., & Griffin, M. (2013). Business research
methods. Cengage Learning.
Zivnuska, S., Ketchen, D. J., & Snow, C. C. (2001). Implications of the converging
economy for human resource management. In Research in Personnel and
Human Resources Management (pp. 371-405). Emerald Group Publishing
Limited.

Employer Attractiveness
78
Appendix A
Universiti Tunku Abdul Rahman
Faculty of Business and Finance
Project Title:
Perceived Employer Attractiveness of Undergraduate Students of A
Private Higher Education Institution in The Northern Region of
Peninsular Malaysia
Survey Questionnaire
Dear Respondents:
I am a Master of Business Administration (Corporate Management)’s student from
Universiti Tunku Abdul Rahman (UTAR). The objective of this research is to
determine the relationship between personal values and perceived employer
attractiveness of undergraduate students of a Malaysia’s private higher education
institution in the northern region of Peninsular Malaysia.
Instruction:
1. The questionnaire consists of 3 parts. Answer all.
2. The completion of the survey will take you about 10 minutes to 15 minutes.
3. Please feel free to share your comment in the space provided. The contents of this
questionnaire will be kept strictly confidential.
4. Please be informed that in accordance with Personal Data Protection Act 2010(“PDPA”)
which came into force on 15 November 2013, Universiti Tunku Abdul Rahman
(“UTAR”) is hereby bound to make notice and require consent in relation to the
collection, recording, storage, usage and retention of personal information.
Acknowledgment of Notice,
I have been notified by you and that I hereby understood, consented and agreed
per UTAR notice (refer to Appendix I).
I disagree; my personal data will not be processed.
Contact Information
Name Student ID E-mail Address Phone No.
Chin Guo Hao 16ABM07287 [email protected] 017-8250993

Employer Attractiveness
79
Part A: Personal Information
Tick your answer in the appropriate box.
1. Gender:
Male
Female
2. Race:
Chinese
Malay
Indian
Other (Please specify: _______________ )
3. Faculty:
Faculty of Business and Finance (FBF)
Faculty of Information and Communication Technology (FICT)
Faculty of Science (FSc)
Faculty of Engineering and Green Technology (FEGT)
Faculty of Arts and Social Science (FAS)
Institute of Chinese Studies (ICS)
4. Entry Qualification:
Foundation Programme
Sijil Tinggi Persekolahan Malaysia (STPM)
Diploma
A Level
Matriculation
Other (Please specify: _______________ )

Employer Attractiveness
80
Part B: Personal Values Influence Perceived Employer Attractiveness of
Undergraduate Students
The following statement is related to the personal values influence perceived
employer attractiveness of undergraduate students. The numbers 1 to 5 represent a
continuum with 1 represents strong disagreement while 5 represents strong agreement.
As undergraduate student in private higher education institution, please circle the
number that is best reflects your opinion about the statement.
SD = Strongly Disagree, D=Disagree, N= Neutral, A=Agree, SA= Strongly Agree
A. Interest Value SD D N A SA
1. I would like to work with an innovative
employer who applies novel practices/forward-
thinking.
1 2 3 4 5
2. I would like to work with an employer who
appreciates and utilizes my creativity. 1 2 3 4 5
3. I would like to work with an employer who
produces excellent products and services. 1 2 3 4 5
4. I would like to work with an employer who
produces innovative products and services. 1 2 3 4 5
B. Social Value SD D N A SA
1. I would like to work with an employer where I
can have a friendly relationship with my
colleagues.
1 2 3 4 5
2. I would like to work with an employer where I
can have a friendly relationship with my
superiors.
1 2 3 4 5
3. I would like to work with an employer who
provides me a happy work environment. 1 2 3 4 5
4. I would like to work with an employer who
provides me a fun working environment. 1 2 3 4 5

Employer Attractiveness
81
C. Application Value SD D N A SA
1. I would like to work with a humanitarian
employer who contributes to the society. 1 2 3 4 5
2. I would like to work with an employer who
provides me the opportunity to apply what was
learned in university.
1 2 3 4 5
3. I would like to work with an employer who
provides me the opportunity to teach others
what I have learned.
1 2 3 4 5
4. I would like to work with an employer who is
customer-orientated. 1 2 3 4 5
D. Economic Value SD D N A SA
1. I would like to work with an employer who
provides me good promotion opportunities. 1 2 3 4 5
2. I would like to work with an employer who
provides me an above average basic salary. 1 2 3 4 5
3. I would like to work with an employer who
provides me an attractive comprehensive
compensation package.
1 2 3 4 5
4. I would like to work with an employer who
provides me job security within the
organization.
1 2 3 4 5
E. Development Value SD D N A SA
1. I would have a feeling of more self-confident
because of working for a particular employer. 1 2 3 4 5
2. I would have a good feeling about myself
because of working for a particular employer. 1 2 3 4 5
3. I would like to work with an employer where I
can gain career-enhancing experience. 1 2 3 4 5
4. I would like to work with an employer who
provides me a springboard for my future
employment.
1 2 3 4 5

Employer Attractiveness
82
Part C: Perceived Employer Attractiveness
Perceived Employer Attractiveness SD D N A SA
1. I perceive that an employer who provides me an
exciting, challenging and energetic environment
as an attractive employer.
1 2 3 4 5
2. I perceive that an employer is an attractive
employer where I can work with encouraging
and supportive colleagues.
1 2 3 4 5
3. I perceive that an employer who provides me
the sense of acceptance and belongingness as an
attractive employer.
1 2 3 4 5
4. I perceive that an employer is an attractive
employer where I can hand-on inter-
departmental experience.
1 2 3 4 5
5. I perceive that an employer is an attractive
employer where I can gain recognition and
appreciation from management.
1 2 3 4 5
-----------------------You have reached the end of the questionnaire. -----------------------
Thank you very much for participating in this research.
Your assistance is greatly appreciated.

Employer Attractiveness
83
Appendix B
PERSONAL DATA PROTECTION STATEMENT
Please be informed that in accordance with Personal Data Protection Act 2010
(“PDPA”) which came into force on 15 November 2013, Universiti Tunku Abdul
Rahman (“UTAR”) is hereby bound to make notice and require consent in relation to
the collection, recording, storage, usage and retention of personal information.
Notice:
1. The purposes for which your personal data may be used are inclusive but not
limited to:-
• For assessment of any application to UTAR
• For processing any benefits and services
• For communication purposes
• For advertorial and news
• For general administration and record purposes
• For enhancing the value of education
• For educational and related purposes consequential to UTAR
• For the purpose of our corporate governance
•For consideration as a guarantor for UTAR staff/ student applying for his/her
scholarship/ study loan
2. Your personal data may be transferred and/or disclosed to third party and/or
UTAR collaborative partners including but not limited to the respective and
appointed outsourcing agents for purpose of fulfilling our obligations to you in
respect of the purposes and all such other purposes that are related to the purposes
and also in providing integrated services, maintaining and storing records. Your
data may be shared when required by laws and when disclosure is necessary to
comply with applicable laws.
3. Any personal information retained by UTAR shall be destroyed and/or deleted in
accordance with our retention policy applicable to us in the event such
information is no longer required.
4. UTAR is committed to ensuring the confidentiality, protection, security, and
accuracy of your personal information made available to us and it has been our
ongoing strict policy to ensure that your personal information is accurate,
complete, not misleading and updated. UTAR would also ensure that your
personal data shall not be used for political and commercial purposes.
Consent:
1. By submitting this form you hereby authorize and consent to us processing
(including disclosing) your personal data and any updates of your information, for
the purposes and/or for any other purposes related to the purpose.
2. If you do not consent or subsequently withdraw your consent to the processing
and disclosure of your personal data, UTAR will not be able to fulfill our

Employer Attractiveness
84
obligations or to contact you or to assist you in respect of the purposes and/or for
any other purposes related to the purpose.
3. You may access and update your personal data by writing to me at
[email protected] or via phone no: 017-8250993.
Thank you for your time, opinions and comments.

Employer Attractiveness
85
Appendix C: Letter of Request Information of Number of Students
Chin Guo Hao (James)
186, Jalan Sentosa,
86600 Paloh, Kluang,
Johor.
7th
August 2017
Dear Sir / Madam,
Division of Admissions and Credit Evaluation
Unversiti Tunku Abdul Rahman
Jalan Universiti, Bandar Barat
31900 Kampar, Perak.
Dear Sir / Madam,
Request Information of Number of Students
I am Master of Business Administration (Corporate Management)’s student which
under the Faculty of Business and Finance. I am writing to request for the following
details:
1) Number of students of UTAR
2) Number of students of UTAR Kampar campus
3) Number of students of the following faculties: FBF, FICT, FSc, FEGT,
FAS, and ICS.
The purpose of requesting the information stated above is for the application of
research project. The information is required so as to the research project can be
performed smoothly.
You may contact me for any further information. Thanks you for your prompt
collaboration.
Yours faithfully,
Chin Guo Hao (James) / 017-8250993 / [email protected]