perceived causes of poverty in a south african …
TRANSCRIPT

PERCEIVED CAUSES OF POVERTY IN A SOUTH AFRICAN TOWNSHIP
RUFARO GARIDZIRAI
Honours Bcom (Economics)
Dissertation submitted in fulfilment of the requirements for the degree
MAGISTER COMMERCII (Economics)
In the
School of Economic Sciences and Information Technology
at the
NORTH-WEST UNIVERSITY
(Vaal Triangle Campus)
Supervisor: Dr TJ.SEKHAMPU
November 2013
Vanderbijlpark

Perceived causes of poverty in a South African Township i
DECLARATION
I, GARIDZIRAI RUFARO declare that PERCEIVED CAUSES OF POVERTY IN A
SOUTH AFRICAN TOWNSHIP: A CASE OF KWAKWATSI is my own work and that
all the resources used or quoted have been duly acknowledged by means of
complete references and that I have not previously submitted the dissertation for a
degree at another university.
Student:
Signature: _____________________________
Date: _____________________________
Supervisor: Signature: _____________________________
Date: _____________________________
Perceived causes of poverty in a South African Township ii
DEDICATION
“True education does not ignore the value of scientific knowledge or literary
acquirements; but above information it values power; above power, goodness; above
intellectual acquirements, character” Ellen G White

Perceived causes of poverty in a South African Township iii
ACKNOWLEDGMENT
I would like to express my deepest appreciation to the Almighty for sustaining me
through my studies. In everything let Him increase as I decrease. I extend my
appreciation to Frank and Laura Garidzirai who have provided physical, emotional,
financial and spiritual support throughout my life. To Dr Joseph Sekhampu, thanks
for investing your time in my studies and your maximum efforts and influence has led
to the completion of this dissertation. Be assured that what you have planted will
produce fruits in season and out of season. Additional thanks goes to Mr Paul
Muzindutsi for all the support he provided especially in econometrics and reviews.
May you all keep with the good work till Jesus comes.

Perceived causes of poverty in a South African Township iv
ABSTRACT
The main aim of this study was to investigate the perceived causes of poverty in a
South African township of Kwakwatsi. The objective of the study was to investigate if
the participants perceived causes of poverty in individualistic, structural and fatalistic
terms. Furthermore, the study investigated the impact of socioeconomic factors on
the residents‟ perceptions of the causes of poverty. In achieving these objectives a
quantitative research technique was adopted. A sample size of 225 households was
interviewed using a questionnaire.
A literature review indicates that poverty is a multidimensional concept alluded to a
number of causes. People tend to blame external forces, government and
themselves for being poor. In an attempt to investigate the perceived causes of
poverty in the area, a scale developed by Joe Feagin was used. The scale groups
causes of poverty into; individualistic, structural and fatalistic. Individualistic
perceptions puts the blame for being poor on the individual, while structural factors is
when individuals blame the economic and political forces, and fatalistic factors is
when individuals blame unexpected events, such as illness and accidents for
poverty. In addition, the study employed a linear regression model to analyse the
relationship between perceived causes of poverty and socio-economic variables.
There were more male than female headed households in Kwakwatsi. Few
household heads obtained tertiary education while others never attended school.
Regarding the employment status, a large number of the participants were found to
be informally employed. Those who were unemployed possessed skills such as
retailing, building, catering, and hairdressing. The majority of the unemployed are
looking for jobs while others are helping with chores at home.
Further analysis revealed the individualistic index as the most dominant, implying
that residents of Kwakwatsi blame the individual for being poor. A reasonable
number of participants also viewed poverty in structural and fatalistic dimensions. In
the regression analysis; age, marital status, education, gender and employment
status were significant predictors of the individualistic index. For the structural index
the following factors were statistically significant: gender, age, income, education
and employment status of the household head. In addition, age, education and

Perceived causes of poverty in a South African Township v
employment status are found to be significant predictors of the fatalistic index. It was
interesting to note that the variable for household size had no significant in all the
three indices.
Kwakwatsi is regarded as a poor area and the majority of the participants in this
study blame the individual for being poor. This provides an opportunity for the
government to partner with the community in the upliftment of the area. Further
analysis can compare the perceived causes of poverty and the socioeconomic/
poverty status of the individual.

Perceived causes of poverty in a South African Township vi
TABLE OF CONTENTS
DECLARATION ........................................................................................................... i
ACKNOWLEDGMENT ............................................................................................... iii
ABSTRACT ................................................................................................................ iv
TABLE OF CONTENTS ............................................................................................. vi
LIST OF TABLES ....................................................................................................... xi
LIST OF ABBREVIATIONS ...................................................................................... xiv
CHAPTER 1: BACKGROUND OF THE STUDY ........................................................ 1
1.1 INTRODUCTION ........................................................................................... 1
1.2 PROBLEM STATEMENT .............................................................................. 3
1.3 GEOGRAPHICAL AREA OF THE STUDY ................................................... 4
1.4 OBJECTIVES OF THE STUDY ..................................................................... 4
1.4.1 Primary objectives .................................................................................. 4
1.4.2 Theoretical objectives ............................................................................. 4
1.4.3 Empirical objectives ................................................................................ 5
1.5 LITEREATURE REVIEW .............................................................................. 5
1.5.1 Theoretical review .................................................................................. 5
1.5.2 Empirical study ....................................................................................... 5
1.6 RESEARCH DESIGN AND METHODOLOGY .............................................. 5
1.6.1 Research design ..................................................................................... 5
1.6.2 Sampling process ................................................................................... 6
1.6.3 The measurement of the perceptions of the causes of poverty .............. 6
1.6.4 Factor analysis ....................................................................................... 7
1.6.5 Linear regression model ......................................................................... 7
1.7 ETHICAL CONSIDERATIONS ...................................................................... 9
1.8 CHAPTER CLASSIFICATION ....................................................................... 9
CHAPTER 2: LITERATURE REVIEW ...................................................................... 10

Perceived causes of poverty in a South African Township vii
2.1 INTRODUCTION ......................................................................................... 10
2.2 DEFINITION AND APPROACHES TO POVERTY ..................................... 10
2.2.1 Absolute poverty ................................................................................... 11
2.2.2 Relative poverty .................................................................................... 12
2.2.3 Monetary approach ............................................................................... 13
2.2.4 Capability approach .............................................................................. 14
2.2.5 Social exclusion approach .................................................................... 15
2.2.6 Multi-dimensional approach .................................................................. 15
2.2.7 Concluding remarks on approaches to poverty .................................... 16
2.3 MEASURING POVERTY ............................................................................ 17
2.3.1 Poverty line ........................................................................................... 17
2.3.2 Headcount Index .................................................................................. 21
2.3.3 Poverty gap Index ................................................................................. 22
2.3.4 Sen Index ............................................................................................. 23
2.3.5 The Foster-Greer-Thorbecke (FGT) measure ...................................... 25
2.3.6 Concluding remarks .............................................................................. 25
2.4 CAUSES OF POVERTY ............................................................................. 26
2.4.1 Proneness to income shocks ................................................................ 27
2.4.2 Institutional failures ............................................................................... 27
2.4.3 Human capital ....................................................................................... 28
2.4.4 Blaming game, corruption and poor administration .............................. 28
2.5 CATEGORIES OF PERCEIVED CAUSES OF POVERTY ......................... 29
2.5.1 Individualistic perceptions of the causes of poverty .............................. 29
2.5.2 Structural perceptions of the causes of poverty .................................... 32
2.5.3 Fatalistic perceptions of the causes of poverty ..................................... 33
2.5.4 Psychological perceptions of the causes of poverty ............................. 34
2.6 EMPERICAL FINDINGS ON THE PERCEIVED CAUSES OF POVERTY . 34

Perceived causes of poverty in a South African Township viii
2.6.1 Poverty perceptions indices .................................................................. 35
2.6.2 Perceptions of causes of poverty and socio-economic factors ............. 38
2.7 SUMMARY AND CONCLUSIONS .............................................................. 41
CHAPTER 3: RESEARCH METHODOLOGY .......................................................... 45
3.1 INTRODUCTION ......................................................................................... 45
3.2 RESEARCH DESIGN ................................................................................. 45
3.3 SAMPLING PROCESS ............................................................................... 46
3.3.1 Target population .................................................................................. 46
3.3.2 Sampling frame .................................................................................... 46
3.3.3 Sample size .......................................................................................... 47
3.3.4 Sampling procedure ............................................................................. 47
3.4 GEOGRAPHICAL LOCATION .................................................................... 48
3.5 QUESTIONNAIRE DESIGN ........................................................................ 48
3.6 STATISTICAL ANALYSIS ........................................................................... 49
3.6.1 Factor analysis ..................................................................................... 49
3.6.2 Linear regression model ....................................................................... 50
3.7 THE DEMOGRAPHIC PROFILE OF KWAKWATSI TOWNSHIP ................ 52
3.7.1 Members of the household ................................................................... 52
3.7.2 Composition of household heads ......................................................... 53
3.7.3 Gender distribution of the population .................................................... 54
3.7.4 Gender of household head ................................................................... 54
3.7.5 Average household size ....................................................................... 55
3.7.6 Marital status of the population ............................................................. 55
3.7.7 Marital status of the household head .................................................... 56
3.7.8 Average length of stay in Kwakwatsi .................................................... 57
3.7.9 Qualifications of the population at school ............................................. 58
3.7.10 Qualification of the population out of school ......................................... 58

Perceived causes of poverty in a South African Township ix
3.7.11 Educational level of household head .................................................... 59
3.7.12 Employment status ............................................................................... 60
3.7.13 Duration of unemployment in years ...................................................... 61
3.7.14 Skills of the unemployed ....................................................................... 62
3.7.15 What are the unemployed doing? ......................................................... 63
3.7.16 Employment status of household head ................................................. 64
3.7.17 Sector of employment for the employed ............................................... 65
3.7.18 Sources of income ................................................................................ 66
3.8 SUMMARY AND CONCLUSIONS .............................................................. 67
CHAPTER 4: THE PERCEIVED CAUSES OF POVERTY ....................................... 70
4.1 INTRODUCTION ......................................................................................... 70
4.2 DETERMINATION OF THE PERCEIVED CAUSES OF POVERTY ........... 70
4.2.1 Principal Component Analysis (PCA) ................................................... 71
4.2.2 How do Kwakwatsi households perceive the causes of poverty? ......... 74
4.2.3 Descriptive analysis of responses to the three indices ......................... 74
4.3 HOUSEHOLD FACTORS AND PERCEPTIONS OF THE CAUSES OF
POVERTY ............................................................................................................. 77
4.3.1 Gender and perceptions of the causes of poverty ................................ 77
4.3.2 Household size and perceptions of the causes of poverty .................... 79
4.3.3 Age and perceptions of the causes of poverty ...................................... 81
4.3.4 Marital status and perception of the causes of poverty ......................... 82
4.3.5 Educational level and perceptions of the causes of poverty ................. 84
4.3.6 Employment status and perceptions of the causes of poverty .............. 86
4.3.7 Income and perceptions of the causes of poverty ................................ 87
4.4 DETERMINANTS OF THE PERCEIVED CAUSES OF POVERTY ............ 89
4.4.1 Correlation of variables ......................................................................... 89
4.4.2 Regression analysis ............................................................................. 90

Perceived causes of poverty in a South African Township x
4.5 SUMMARY AND CONCLUSIONS .............................................................. 96
CHAPTER 5: SUMMARY AND CONCLUSION ..................................................... 100
5.1 INTRODUCTION ....................................................................................... 100
5.2 THE THEORETICAL BACKGROUND OF THE STUDY ........................... 100
5.3 METHODOLOGY OF THE STUDY ........................................................... 104
5.4 THE DEMOGRAPHIC PROFILE OF KWAKWATSI TOWNSHIP .............. 104
5.5 THE EMPIRICAL FINDINGS OF THE STUDY ......................................... 105
5.6 CONCLUSIONS ........................................................................................ 106
5.7 REFERENCES .......................................................................................... 108
Perceived causes of poverty in a South African Township xi
LIST OF TABLES
Table 3.1: Household Average size.......................................................................... 55
Table 3.2: Average length to stay ............................................................................. 57
Table 4.1: KMO and Bartlett`s test of Sphericity ...................................................... 71
Table 4.2: Total variance explained ......................................................................... 72
Table 4.3: PCA of perceptions of the causes of poverty........................................... 73
Table 4.4: Perceptions of the causes of poverty ...................................................... 74
Table 4.5: Response to the three indices (percent) .................................................. 76
Table 4.6: Gender and individualistic perception ...................................................... 77
Table 4.7: Gender and structural perception ............................................................ 78
Table 4.8: Gender and fatalistic perception .............................................................. 78
Table 4.9: Household size and individualistic perception ......................................... 79
Table 4.10: Household size and structural perception.............................................. 80
Table 4.11: Household size and fatalistic perception ............................................... 80
Table 4.12: Age and individualistic perception ......................................................... 81
Table 4.13: Age and structural perception ............................................................... 82
Table 4.14: Ages and fatalistic perception ................................................................ 82
Table 4.15 Marital status and Individualistic perception ........................................... 83
Table 4.16: Marital status and individualistic perception .......................................... 83
Table 4.17: Marital status and fatalistic perception .................................................. 84
Table 4.18: Educational level and individualistic perception ..................................... 84

Perceived causes of poverty in a South African Township xii
Table 4.19: Educational level and structural perception ........................................... 85
Table 4.20: Educational level and fatalistic perception ............................................. 85
Table 4.21: Employment status and individualistic perception ................................. 86
Table 4.22: Employment status and structural perception........................................ 86
Table 4.23: Employment status and fatalistic perception ......................................... 87
Table 4.24: Household income and individualistic perception .................................. 87
Table 4.25: Income and structural perception .......................................................... 88
Table 4.26: Income and fatalistic perception ............................................................ 89
Table 4.27: Correlation among variables .................................................................. 90
Table 4.28: Individualistic regression analysis ......................................................... 92
Table 4.29: Structural regression analysis ............................................................... 93
Table 4.30: Fatalistic regression analysis ................................................................ 94
Table 4.31: Summary of the three regression models .............................................. 95

Perceived causes of poverty in a South African Township xiii
LIST OF FIGURES
Figure 3.1: Composition of household members ...................................................... 53
Figure 3.2: Composition of households heads ......................................................... 54
Figure 3.3: Marital Status of the participants ............................................................ 56
Figure 3.4: Marital status of the household head ..................................................... 57
Figure 3.5: Qualifications of the population in school ............................................... 58
Figure 3.6: Out of school population......................................................................... 59
Figure 3.7: Educational level of household head ...................................................... 60
Figure 3.8: Employment status ................................................................................. 61
Figure 3.9: Duration of unemployment in years ........................................................ 62
Figure 3.10: Skills of the unemployed ...................................................................... 63
Figure 3.11 What are the unemployed doing ........................................................... 64
Figure 3.12: Employment status of household head ................................................ 65
Figure 3.13: Sector of employment for the employed ............................................... 66
Figure 3.14: Sources of income ............................................................................... 67

Perceived causes of poverty in a South African Township xiv
1 LIST OF ABBREVIATIONS
EAPN European Anti -Poverty Network
EU European Union
EUC European Commission Union
FGT The Foster-Greer-Thorbecke (FGT) measure
FPL Food Poverty Line
HI Household Index
ILO International Labor Organization
KMO Kaiser-Meyer-Oklin Measure of Sampling Adequacy
MDGS Millennium Development Goals
PCA Principal Component Analysis
PPS Perceptions of Poverty Scale
S.A South Africa
SAGCS South Africa Gold Coin Store
Stats S.A Statistics South Africa
SPC Social Policy Connections
UN United Nations
UNICEF United Nations Children Funds
UNHDR United Nations Human Development Report

Perceived causes of poverty in a South African Township 1
CHAPTER 1: BACKGROUND OF THE STUDY
1.1 INTRODUCTION
Poverty is one of the major problems facing human kind today. Poverty has been
associated with suffering, diseases, and deaths (Seimenis, 2012:1). A report by the
United Nations (2012) concluded that more than three billion people in the world
were living under extreme poverty. Haydar (2005:240) mentioned that a large part of
the world‟s population lack the basic commodities for survival, such as food, shelter,
clothing, energy and medicine. Although the challenge of poverty has been dominant
in both developed and developing countries, it is more common in sub-Saharan
Africa (Gafar, Adeyani & Raheem 2009, Human Development Report, 2012). Based
on $1.25 per day poverty line, about 65% of Sub-Saharan Africa‟s population was
said to be living in poverty in 2011 (World Bank, 2011). The Human Development
Report (2012) found that the majority of poor countries are in Sub-Saharan Africa.
Some of the countries mentioned in the report include Zimbabwe, Uganda, Rwanda,
Malawi and Burundi. With regard to South Africa, a study by the World Bank (2011)
found that almost half of South Africa‟s population are living under poor conditions. A
report by UNICEF (2012) indicates that poverty in South Africa is rising.
Despite prevalence of poverty in many parts of the world, there are contrasting views
on what the concept of poverty entails. The general consensus is that poverty is a
multidimensional concept and has alluded to a number of causes such as socio-
economic, demographic factors, corruption and structural problems (Davids, 2010;
Lopez, Gurin & Nagda, 2008, White & Killick, 2001). However, people tend to blame
and perceive some factors as the causes of their poverty. The causes of poverty are
generally grouped into: structural, individualistic and fatalistic dimensions (Bullock &
Waugh, 2005: 1133, Hajnal, 2007:560, Shek, 2004:273). Individualistic factors are
when individuals blame themselves for being poor, structural factors are when
individuals blame the economic and political forces and fatalistic factors are when
individuals blame unexpected events, such as illness and accidents for being poor
(Davids, 2010:8).
Individualistic, structural and fatalistic perceptions of the causes of poverty are
influenced by socio-economic and demographic factors such as race, education,

Perceived causes of poverty in a South African Township 2
employment status, income, cultural beliefs and age (Davids, 2010). Halman and
Oorschot (1999:3) found that Finns blamed the flaws and lack of labour markets as
causes of poverty compared to individuals and social injustice factors. In Finland
structural factors were perceived the most important determinants of poverty. It was
also found that the employed Latinos minorities were inclined to individualistic
factors, while the same Latinos inclined themselves to structural ones when they
compare themselves with the upper class (Hunt, 1996:310). A later study by Hunt
(2004:843) found that the Latino‟s perceived causes of poverty can be grouped into
structural and individualistic dimensions.
Empirical studies done by Hamel, Brodie and Morin (2005:352) and Aliber (2002:2)
found that race is one of the distinguishing factors in the understanding of how
people perceive causes of poverty in South Africa. These studies indicated that
whites and coloureds were inclined to fatalistic factors while blacks were more
inclined to structural factors. Moreover, employment was found to influence people‟s
perceptions of the causes of poverty. Davids (2010) observed that those who were
employed perceived the causes of poverty as individualistic while those who were
not employed perceived causes of poverty in structural terms. Employed
respondents blamed themselves by seeing poverty as a condition caused by their
work ethic and attitude towards work. The unemployed felt that poverty was due to
bad luck and had little influence on their social economic status. Similarly, Sun
(2001:167) observed that social work students have different views on perceived
causes of poverty. White social work students perceived poverty in structural terms,
while non-social work students were inclined to blame individualistic factors for being
poor.
Overall, studies on the perceptions of the causes of poverty have reached different
conclusions. Understanding the perceptions of the causes of poverty can increase
our knowledge of the subject matter. This research will focus on how township
residents perceive the causes of poverty and how socio-economic and demographic
factors influence their reported perceptions. Findings from this study might assist
policy makers in developing more targeted programmes aimed at poverty alleviation.

Perceived causes of poverty in a South African Township 3
1.2 PROBLEM STATEMENT
Poverty is attributed to many causes, such as overpopulation, environmental
degradation, lack of education and economic and demographic trends, shortage of
job opportunities and individual responsibility and welfare dependency. Gafar et al.,
(2009) found that Africa is mainly affected by a shortage of skilled labour, scarcity of
natural resources and location disadvantages, structural adjustments, a change in
economic policies and natural disasters, such as wars and earthquakes. Moreover,
in South Africa poverty cannot be divorced from the non-default apartheid system,
which brought unequal distribution of resources (Bhorat & Kanbur, 2003:43). The
observed impact of poverty includes an environment where child abuse, debt
pressure, an increase in crime and education deprivation is prevalent (UNDP, 2003).
According to Haydar (2005:240), a “significant number of people in the world today
live under conditions of extreme poverty and most of them lack access to basic
goods such as food, water and health care”. A general view is that all returns should
be amassed on the eradication of poverty. Haydar (2005:240) alludes to the
importance of research in understanding what it means to be poor.
The Millennium Development Goals (MDGs) that emerged from the UN Millennium
Declaration has the goal of reducing poverty among the more than 1 billion poor
people worldwide by 2015 (UN, 2005). Despite widespread poverty and the
commitment from the vast majority of countries there is no agreement as to who is
supposed to do what and when to achieve the goal of alleviating poverty. This has
resulted in many questions: why poverty? What are the causes? Who is to blame?
What are the solutions to poverty?
Davids (2010) noted that understanding people‟s view about poverty can aid the
government and the non-governmental organisations to minimise its impact.
Empirical research shows that studies in South Africa focused on what poverty
means, what are the causes of poverty, and what are the solutions to minimise
poverty (Noble et al., 2007:117, Wright, 2008:2). There is scarcity of studies on the
perceived causes of poverty, and those available are mainly based on national
surveys/ data (Shek, 2004; Davids 2010). Of the few studies done it was concluded
that South Africans perceived the causes of poverty in structural terms. This study
will be at a household level and on existing findings on poverty in South Africa by

Perceived causes of poverty in a South African Township 4
modelling and determining the perceptions of the causes of poverty amongst
households in a semi-urban township of Kwakwatsi, South Africa. The results of the
study can be used as a reference source for understanding the dynamics of urban
poverty in a typical South African township.
1.3 GEOGRAPHICAL AREA OF THE STUDY
Although poverty affects most areas of South Africa, Kwakwatsi will be the focus
area of the study. The area is a former black residential township located
approximately 180 km south of Johannesburg and 280 km north of Bloemfontein in
the Free State province of South Africa. The area is part of the Ngwathe Local
Municipality, with its head office in Parys (Ngwathe Municipality, 2009). The area
could be classified as a semi-rural township, with little economic activity. The nearest
industrial town of Sasolburg is 70 km away. The estimated population size of
Kwakwatsi is 15 095. A study by Sekhampu (2012) found increased incidents of
poverty in the area. Of the sampled households, 50% were found to be poor. On
average, poor households have an income shortage of 56% of their poverty line
when using the lower bound poverty line. This, therefore, provides ample ground for
testing the perceptions of these residents on what causes poverty.
1.4 OBJECTIVES OF THE STUDY
The following objectives have been formulated for the study:
1.4.1 Primary objectives
The primary aim of this study was to analyse the perceived causes of poverty
amongst households in Kwakwatsi.
1.4.2 Theoretical objectives
In order to achieve the primary objective, the following theoretical objectives were
formulated for the study:
to define poverty as a concept;
to conduct a literature review on various measures of poverty;
to review the literature on poverty theories;
to review the literature on perceptions of poverty; and

Perceived causes of poverty in a South African Township 5
to conduct an empirical literature review on the effects of poverty.
1.4.3 Empirical objectives
In accordance with the primary objective of the study, the following empirical
objectives were formulated:
to determine whether poverty is viewed in structural, individualistic and fatalistic
dimension;
to determine how socio-economic factors such as race, geographic location,
educational level, gender and employment status impact on the reported
perceptions of the causes of poverty.
1.5 LITEREATURE REVIEW
This section comprises a theoretical review and an empirical study.
1.5.1 Theoretical review
The theoretical review on the perception of the causes of poverty was conducted
using textbooks, journal articles, newspapers, articles, government publications,
dissertations and previous studies. Books and articles enabled the review the theory
of perceptions of poverty.
1.5.2 Empirical study
The empirical analysis of this study comprises a review of previous empirical studies
on issues related to poverty.
1.6 RESEARCH DESIGN AND METHODOLOGY
A quantitative research method was used to analyse perceptions of the causes of
poverty and a questionnaire survey method was used to obtain the required
information.
1.6.1 Research design
This section outlines the design used in this study. A quantitative research design
was deemed fit and suitable for the purposes of this study.

Perceived causes of poverty in a South African Township 6
1.6.2 Sampling process
A sampling process comprises the target population, sampling frame and technique
as well as the sample size.
1.6.2.1 Target population
The target population are residents of Kwakwatsi Township. The approach to be
used is as follows:
Element: comprises both male and female head households;
Sampling unit: Kwakwatsi Township households;
Extent: Free State Province, South Africa;
Time: 2013.
1.6.2.2 Sampling frame
The sampling frame of the study comprises households residing in the Kwakwatsi
Township.
1.6.2.3 Sample size
A sample size of 200 questionnaires is deemed sufficiently large for the study
(MacCallum & Preacher, 2001).
1.6.2.4 Sampling procedure
The respondents in Kwakwatsi were randomly selected from the sampling frame of
Kwakwatsi Township residents.
1.6.3 The measurement of the perceptions of the causes of poverty
A Perceptions of Poverty Scale (PPS) was adopted from Feagin (1975) to measure
the perceived causes of poverty in this study. Minor modifications were made to the
PSS to suit the purpose of the current study. A questionnaire protocol was followed
as a primary means of data collection. The questionnaire consists of two sub
sections, Section A- questions addressing households‟ perceptions of poverty
causes as structural, individual and or fatalistic indices. The section comprises 12
questions where each index is captured by a set of questions and households had to

Perceived causes of poverty in a South African Township 7
either agree or disagree. All the items in section A were measured on a five point
Likert scale, with anchors ranging from 1- strongly disagree, 2- disagree, 3- neutral,
4-agree and 5- strongly agree. Section B comprise questions related to
socioeconomic factors, such as education level of the household, employment status
of the household, income level of the household, age of the household and gender of
the household. The purpose of Section B was to determine how these socio-
economic factors influence households‟ perceptions as to the causes of poverty.
1.6.4 Factor analysis
Factor analysis is a statistical method used when interpreting questionnaires (William
et al., 2012:2). This is a method used to analyse the interrelation between variables
(DeCoster, 1999). More so, it determines the nature of a relationship between
variables (Beavers et al., (2013:1). Two methods are used to determine the nature of
a relationship: exploratory and principal component analysis (Suhr, 2005:1). In order
to establish the relationship between perceptions of poverty, twelve perceptions of
poverty factors were grouped into three factor components, namely, individualistic,
structural and fatalistic perceptions of poverty (Davids, 2010). This was done using
the statistical software SPSS. The individualistic factor component was composed of
five factors; structural was composed of four factors while fatalistic was composed of
three factors. Moreover, each factor component was evaluated for dimensionality
and reliability through the factor analysis (Davids 2010). The higher the factor of
perceptions of poverty the greater it is inclined to the factor component.
1.6.5 Linear regression model
Once perceptions of the causes of poverty were identified, linear regression and
correlation was used to identify the effect of the socio-economic factors on the
identified perceptions. Gujarati (2004:18) defined linear regression as the study of
one dependent variable and more than two independent variables. Regression
analysis was used to analyse the relationship between a dependent variable and
independent variables. More precisely, it identifies and characterises the nature of
the relationship among variables, estimates variables as well as predicting their
behaviors. Furthermore, Correlation was used to measure the strength of the
socioeconomic and the perceptions of the causes of poverty. The dependent

Perceived causes of poverty in a South African Township 8
variables of this study comprised the three perceptions of poverty: individualistic,
structural and fatalistic, while, socio-economic and demographic variables were the
independent variables. The gathered data of all these variables was analysed using
STATA 11 software package, with the aim of describing the nature of the
relationship. The study used all the three models to explain if factor analysis shows
that all three factors are significant. These models are illustrated below:
Y= perceptions of poverty (Individualistic, structural and fatalistic)
.................. (1)
.................. (2)
..................(3)
The three linear regression models above represent perceptions of poverty as
structural (1), individualistic (2) and fatalistic (3) respectively. The model implies that
the probability of people perceiving poverty in structural, individualistic and fatalistic
terms depends on individual socioeconomic characteristics such as income,
employment, age, and marital status, gender of the head, household size, and
education level of households. The following are the explanatory variables for the
study:
X1= Income level of the household head
X2 = employment status of the household head
X3 = age of household head
X4 = Education level of the household head
X5 = marital status of the household head
X6 = number of children of the household head
X7 = household size
X8 = gender of the head
α = intercept
, = the coefficients.

Perceived causes of poverty in a South African Township 9
1.7 ETHICAL CONSIDERATIONS
This study was in line with the ethical standards of academic research. Information
was obtained from the head of the household. Information obtained from the
respondents was kept in strict confidence and the participants were not required to
write their names.
1.8 CHAPTER CLASSIFICATION
Chapter 1: The problem and its setting
This chapter focuses on the introduction and background of the study. It also
includes the problem statement, objectives and the research methodology used.
Chapter 2: Literature review on perceptions of poverty
This chapter provides a literature review on perceptions of the causes of poverty. It
also focuses on the approaches, definitions and measurements of poverty.
Chapter 3: Research design and methodology
This chapter provides the research methodology and profile of Kwakwatsi Township.
Chapter 4: Results and findings
The chapter aims to provide a detailed analysis of perceptions of the causes of
poverty.
Chapter 5: Conclusions and recommendations
The chapter summarises and conclude the study.

Perceived causes of poverty in a South African Township 10
2 CHAPTER 2: LITERATURE REVIEW
2.1 INTRODUCTION
Poverty is a multifaceted phenomenon that affects people in different ways. This
implies that the extent of poverty differs from region to region and different reasons
are attached to what causes poverty (Davids, 2010). Some people blame
themselves, their parents, government and external forces for the predicament. All
these differing views provide an understanding of poverty and its eradication
methods (Wilson, 1996:414). Poverty is a permanent problem which has plagued the
whole world for years. In many parts of the world, there is overwhelming evidence of
a large number of people living in conditions of poverty, while a minority enjoys
luxurious goods and services (Griffths & Zhou, 2012:16). As a result, institutions like
the World Bank have committed to the eradication of poverty. Thus, research on
poverty aids the institutions on poverty reduction methods and provides inputs to
policy making decisions.
The objective of this chapter is to provide a literature review of the concept of
poverty. It discusses different approaches poverty is defined. These approaches
include: absolute poverty, relative poverty, monetary approach, capability approach,
multidimensional approach and social exclusion. The chapter further provide a
discussion of the common measures of poverty. Furthermore, causes of poverty
forms part of this chapter. In addition, empirical findings on the perceived causes of
poverty will be discussed.
2.2 DEFINITION AND APPROACHES TO POVERTY
Poverty definition remains debatable, questionable with multifaceted arguments that
oppose each other (Saunders, 2004; Noble, Ratcliffe & Wright, 2004; Ratcliffe, 2007;
Sekatane, 2006:30). Over the years, many authors have come up with different ways
to define poverty (Nyasulu, 2010:1). Some have defined poverty in statistical terms,
income definitions, political definitions, psychological definitions, capabilities
definitions and social definitions (World Bank, 2007; Saunders, 2004). Despite many
definitions of poverty, this study adopted two definitions: lack of resources and lack
of freedom (Francis, 2001; Hirschowits, Orkin & Alberts 2000:54; ILO, 1976;
UNHDR, 1997; World Bank, 2005: Yunus, 1994).

Perceived causes of poverty in a South African Township 11
Several researchers (Francis, 2001) and organisations (ILO, 1976; UNHDR, 1997;
World Bank, 2005) have defined poverty as a form of lack of resources. The World
Bank (2005) defines poverty as lack of resources to attain a minimum standard of
living. The rationale is that for an individual to afford basic needs resources must be
available and lack of resources makes one prone to poverty. Moreover, UNHDR
(1998) defined poverty as a concept that summarises the inadequacy of resources
and lack of choices that hinders an individual to live a decent lifestyle. The emphasis
was on shortage of resources, which leads to indecision that in turn compromises
the human standard of living.
In contrast, poverty can also be defined as lack of choices (Francis, 2001;
Hirschowits et al., 2000:54; Yunus, 1994). Yunus (1994) defined poverty as lack of
human rights which leads to low lifestyle, while Francis (2001) defined poverty as
lack of peace in a person. Lack of peace and low lifestyle attributing to poverty can
result from hunger, lack of medical care, lack of human rights and freedom of
speech. Hirschowits et al., (2000:54) defined poverty as the disowning of prospects
and choices that are essential to human development, which promotes healthy living,
a creative mind, freedom of speech, high self-esteem and the ability to respect
others. These definitions have shown lack of choice which has led to insecurity, low
self-esteem, and social exclusion.
Despite debatable definitions of poverty, a number of approaches can be used to
explain poverty, namely: absolute, relative, a capability, a multidimensional, a social
exclusion and a monetary approach (Davids, 2010, Laderchi et al., 2003). These
approaches form the basis of the discussion in the subsections that follows.
2.2.1 Absolute poverty
Absolute poverty is a concept introduced by Rowntree (1901). It is a subsistence
concept that puts the emphasis on survival. Subsistence defines the minimum basic
goods and services needed for survival. Rowntree (1901:87) mentioned that the
minimum basic goods and services constitute food, clothes and shelter that are
required to maintain standard of life. The minimum basic goods and services are
measured by using income. Living below the minimum level defines absolute poverty
(Alcock, 1997:68).

Perceived causes of poverty in a South African Township 12
Rowntree (1901) defined absolute poverty as the minimum income sufficient to buy
goods and services to maintain the standard of living. In support, Alcock (1993:58)
defined absolute poverty as not having sufficient basic commodities for survival.
Thus, shortage of food, clothing, shelter and medical care enhances vulnerability to
poverty. It is this absence of basic goods and services that is absolute poverty.
People living in absolute poverty can stay for long while their physical and health
(Alcock, 1993:59).
The concept of absolute poverty went unchallenged for almost 50 years (Lotter,
2007:1206). Absolute poverty was then challenged by Townsend (1979) when he
mentioned that the poverty cannot only be measured by minimum basic goods and
services. More so, absolute poverty does not take into account social needs in its
definition (Townsend, 1976). Despite these shortcomings; absolute poverty is the
most widely used definition of poverty, although its shortcomings introduced relative
poverty.
2.2.2 Relative poverty
In contrast to absolute poverty is relative poverty. The setbacks of an absolute
definition of poverty have led to an alternative definition (Laderchi et al., 2003). It was
the works of Townsend (1954, 1979) who introduced the concept of relative poverty.
Townsend (1976) defined relative poverty as individuals living under an
unacceptable standard in a community Townsend (1976). The concept of relative
poverty is mainly used in the developed world. For example, Saundres and Tsumori
(2002) write that in Australia every individual is expected to own a car and if a citizen
does not own a car he is regarded as relatively poor.
Relative poverty has two characteristics, namely; social exclusion and relative in
nature (Saunders, 1997; Lotter, 2007). Social exclusion is experienced when poor
cannot participate in certain activities in a society. For example, when the resources
of the poor fall below the rest of society‟s resources an individual is relatively poor
and is excluded from society‟s activities. Townsend (1954:133) explained that
poverty is relative according to the society in which an individual lives. Thus, the
behaviour or norms of a society determines the standard of the society.
Critics of the relative approach argued that:

Perceived causes of poverty in a South African Township 13
Relative definition is biased. The complication is that who decides the poverty
line and on which criteria? This leaves the relative approach with many
questions and arguments (World Bank, 2005).
The definition is self-contradictory. It uses different standards, other people
are wealthier and yet they are considered poor compared to others with the
less wealthy considered rich (World Bank, 2005).
Based on these arguments, relative poverty implies that although you can afford
basic commodities such as food, shelter, energy, clothing, health and do not
participate in the society‟s activities you are regarded as poor. Hazlitt (1973:33)
concluded that relative poverty implies that one is worse off than others.
2.2.3 Monetary approach
The monetary approach to understanding poverty is the most commonly used
method in poverty identification and measurement (Laderchi et al., 2003:6). Income
or consumption is the basic measures of monetary approach to poverty. The income
or consumption is expressed as a poverty line, which is defined as an income/
expenditure level used to separate the poor from the non-poor (Van Praag et al.,
1982: 345). The monetary approach detects poverty by the shortfall of income or
consumption from the accepted poverty line (Laderchi et al., 2003:6). Grosh and
Glewwe (2000) as mentioned by (Laderchi et al., 2003:6) argued that all the
valuations must be done using the market value prices for uniformity.
A general consensus by Rowntree (1901) and Townsend (1979) was that a
monetary approach is objective in nature and its objective illustrates that poverty
exists in the community. In addition, monetary approach was an external
assessment used by other researchers in an attempt to identify the poor. More so, a
monetary approach perceived poverty as individualistic, where it is described
according to individual situations and behaviour. These three features are central to
a monetary approach.
However, the monetary approach is not a perfect approach to poverty and has its
own disadvantages. Kamanou (2005:3) notes that this approach has a disadvantage
on the choice of an indicator. There are two indicators - income and consumption
and the question posed is, which the better measure of the two is. Another

Perceived causes of poverty in a South African Township 14
disadvantage is that the monetary approach tends to use household decisions rather
than individual ones (Laderchi et al., 2003:249). Yet many decision makers and
policy makers use individual decisions in policy making. A negative result is seen
when the policies are more inclined to private income and disfavour social income
(Laderchi et al., 2003:249).
2.2.4 Capability approach
The capability approach was developed by Sen (1985). A capability approach as
defined by Sen (1997:40) is a combination of abilities that a person can attain to
improve the standard of living. It puts the main focus on development which is driven
by human capabilities. Using the capability approach, poverty can be defined as lack
of capabilities to improve the standard of living (Sen, 1993:41).
The capability approach entails living a valued or improved life which realises
individual‟s potentials (Laderchi et al., 2003:253). This involves the process of
moving from monetary measures to non-monetary measures (Laderchi et al., 2003;
14). The movement was also supported by Nussbaum (2000:74) who mentioned
some of the important capabilities:
“Normal length of life”;
“Health: good health, adequate nutrition and shelter”;
“Bodily integrity: movement; choice in reproduction”;
“Senses: imagination and thought, informed by education”;
“Emotions: attachments”;
“Practical reason: critical reflection and planning life”;
“Affiliation: social interaction; protection against discrimination”;
“Other species: respect for and living with other species”; and
“Control over ones environment, politically (choice) and materially (property)”.
However, the capability approach has a major challenge that when Sen (1985)
developed the capability approach, no list or guidelines of capabilities were given.
Instead, it was only a mention of aspects such as morbidity and being well
nourished. This gives a room for arguments and creates many definitions of
capabilities.

Perceived causes of poverty in a South African Township 15
2.2.5 Social exclusion approach
The social exclusion approach was introduced around the 1990s (Wagle, 2002:160).
This stems from the thinking that poverty is not only limited to income or
consumption but also focuses on resource allocation and participation in society
(Room, 1999:169). The European Union (1995) defined social exclusion as a
process through which individuals or groups are wholly or partially excluded from full
participation in the society in which they live. From the definition above one can
suggest that social exclusion deals with individual participation and authority in a
community. The reason why individuals do not participate in social activities is
because they lack resources and authority (Room 1999:169).
Atkinson (1998) notes three main features of social exclusion: relativity, agency and
dynamics. Firstly, Relativity implies that exclusion depends on a particular society.
Secondly, poor people are excluded because of the agent or agents who fail to
represent them. The last feature is that future opportunities are important as well as
the current situations. Thus, for an individual to be excluded the society standards
must be defined. Social exclusion is generally within the confines of features such as
age, culture, gender, nationality, physical disability and ethnic groups. Social
exclusion is a process where individual disabilities lead to social exclusion, which
adds more disadvantages (Steward, 2004:2). The usage of a social exclusion
concept in third world countries has been found to be difficult because social
exclusion factors of developed countries are different from those of developing
countries (Steward, 2004:2). It is not easy to come up with the guidelines which
measure social exclusion from the sector to the public at large (Laderchi et al.,
2003:22).
2.2.6 Multi-dimensional approach
A multi-dimensional approach is a concept that includes social exclusion and lack of
basic needs that are deemed as not to do without (Davids, 2010; Room, 1999). This
approach implies that individuals lack basic needs for survival, such as food,
clothing, energy, health and transport. In support, Room (1999:169) mentioned some
basic needs, such as education, finance and skills level. Lack of these basic needs
can lead to social exclusion in society. When individuals lack resources deemed

Perceived causes of poverty in a South African Township 16
necessary in a society they exclude themselves from social activities. Hence lack of
basic commodities and social exclusion forms the multidimensional approach.
The multi-dimensional approach focuses on the many facets of poverty. Absence of
factors, such as skills, housing, health, income, food, energy and transport can make
an individual vulnerable to poverty (Davids, 2010). The approach depends on three
elements: social exclusion, economic wellbeing and capabilities (Wagle, 2007:4). In
other words all these concepts are interrelated and its measures are more accurate
compared to other approaches. Households are considered poor when they have
failed to meet these three elements. For example, if a household meets two of these
elements it might be considered very poor because it lacks two elements (Wagle,
2007:4).
Like other approaches, a multidimensional approach has its own disadvantages.
This approach includes social exclusion, economic wellbeing and capabilities. It can
be biased when measuring poverty by focusing on one or two of the three and
neglecting the other (Wagle, 2007:4).
2.2.7 Concluding remarks on approaches to poverty
Despite the debatable, questionable definitions of poverty, one should not be vague
on what it means. There are no universal definitions of poverty. Some define poverty
in social, political, income and capability definitions. Thus poverty can be defined as
a lack of resources or freedom of choice. Poverty is seen as a lack of basic goods
and services for survival; at the same time if one lacks freedom of choice this can be
defined as being poor.
There are other approaches used to explain and define poverty, namely; absolute
poverty, relative poverty, a multidimensional approach, social exclusion and a
monetary approach. An absolute approach is an objective concept which uses
income or consumption as a poverty measure. This measure puts the main focus on
the minimum level of basic goods and services. In contrast, relative poverty is a
subjective concept that measures poverty according to society‟s standards. It is
relative in nature and excludes the poor. A monetary approach measures the
shortfall from the poverty line. It uses consumption or income in measuring poverty.
However, there is a debate as to which is the best measure between income and

Perceived causes of poverty in a South African Township 17
consumption, and consumption was seen as the best measure because it accounts
for fluctuations. In addition, the capability approach takes into account individual
abilities which improves peoples standard of living. If an individual lacks these
capabilities, lack of basic goods and services deemed necessary by society, then
they can be socially excluded. Poverty is multidimensional when it socially excludes.
There is economic deprivation when individuals lack the abilities to improve
themselves. Lack of the three elements implies deep poverty. However, all these
approaches have their own weaknesses hence it is advised that they be used
together to complement each other.
2.3 MEASURING POVERTY
Measuring poverty has been a problem for researchers, analysts, practitioners,
government and non-governmental institutions for a number of years (Saunders,
2004; Ratcliffe, 2007). The problem was in defining the standards of living whose
absence reflects poverty and how researchers decide upon the relative value of each
standard of living (Sen, 1987).
Despite these challenges in measuring poverty, a number of accepted international
measures are generally used (De Swardt, 2004). These measures are made up of
objective indicators and subjective indicators. Objective indicators include
consumption, income, life expectancy and housing standards (De Swardt, 2004:18).
In contrast, subjective indicators include needs perceptions and the use of
participatory approaches (De Swardt, 2004:18). The next section discusses the
common poverty measures used in this study: poverty lines, headcount index,
poverty gap index, Sen Index and FGT measure.
2.3.1 Poverty line
A poverty line is one of the measurements of poverty mainly used by researchers
and economists. The origin of a poverty line is not clear but it is believed that Charles
Booth invented the concept in the late 1880s (Gille, 1996:10). In the early 1900s
some researchers started using the poverty line; thus the concept became popular.
Even now the poverty line is still among the popular measurements of poverty (World
Bank, 2012). Thus it still serves the same purpose of separating the poor from non-
poor.

Perceived causes of poverty in a South African Township 18
One of the widely accepted definitions of the poverty line was developed by the
World Bank in 2005. This definition identifies it as the minimum expenditure
necessary for an individual to meet basic food and non-food needs (World Bank,
2005:43). Basic foods are a basket of food that is deemed necessary for survival.
They include items such as bread, sugar, salt, meat, vegetables, fruits, potatoes,
maize meal, juice, eggs and soups (SPC, 2007:4). These basic foods are chosen as
a basket and a market value is attached to each item in order to establish the total
value of items (Lanjouw, 2001:8). However, basic foods differ from one country to
another because staple foods are not similar across countries. For example, in
Zimbabwe the staple food is maize meal while Malawi‟s staple food is cassava,
potatoes and maize (Glantz, 1987:222 & Minot, 2010).
In contrast, non-food needs involves items such as clothing, transport, fuel, lighting,
cleaning, rent, care, pension, insurance and medical aid (Mokoena, 2001:22). After a
basket of non-food needs is identified, a market value is attached to each item
(Lanjouw, 2001:8). Similarly to basic food, these basic non-foods also differ from
country to country. For example, South Africa considered electricity and medical aids
as basic, while in other African countries such as Zimbabwe these are luxurious
goods. The total market values of both basic food and non-food needs make up a
poverty line (Lanjouw, 2001:8). Since these items used to measure a poverty line,
differ from one country to another; a poverty line also varies from country to country.
This implies that the use of a poverty line cannot be generalised.
There are two basic approaches of measuring/identifying a poverty line. These
include: an absolute poverty line and a relative poverty line (Oosthuizen, 2008:2).
These were discussed earlier in this chapter in Section 2.3.1 and 2.3.2 respectively
as approaches to poverty; hence this section only focuses on information which
affects the poverty line.
2.3.1.1 Absolute poverty line
Absolute poverty is a poverty measure which separates the poor from non-poor
based on income and expenditure on basic goods and services. It is made up of
goods and services expressed in monetary value that is required to meet a minimum
standard of living (Oosthuizen, 2008:2). Goods and services include: food, clothing,
shelter, transport, energy, education, rent and care. All these goods and services are

Perceived causes of poverty in a South African Township 19
expressed in monetary value. This means that a poverty line can be expressed in
monetary value. The absolute line is fixed in terms of the minimum standard of living
(Lanjouw, 2001:8; World Bank 2005:48; Oosthuizen, 2008:2). It implies that an
absolute poverty line does not change over time. Thus absolute poverty makes the
comparison of poverty rates easier. It allows poverty rates of the late 1990s to be
compared with the current rates and allows for inflation rate considerations.
Absolute poverty lines include food and non-food elements (Rio, 2006:54). The food
poverty line (FPL) takes into account the least nutritious diet appropriate for an adult
in attainment of better lifestyle and balanced nutrition (SPC, 2007). FPL considers
the cost of a food basket which caters for an adequate nutrition and health. The main
focus of FPL is on an individual enjoying healthy food and getting balanced nutrients.
Some of the items included in calculating the poverty line are chicken, bread, bun,
coconut, sugar, fruits, cooking oil, rice, flour and meat (SPC, 2007:4). Attainment of a
FPL implies that a healthy life and balanced nutrition are achieved. Those with
income to buy the items included in the poverty line are non-poor. This poverty line is
generally regarded as a normative poverty line. In contrast, a semi-normative Food
Poverty Line accounts for cost of a basket attached to definite nutritional guidelines
according to consumption habits (Rio, 2006;54). This implies that a food poverty line
signifies the nutritional cost which at the same time takes into accounts consumer
behaviour. This is the widely used method for measuring absolute poverty (SPC,
2007:2). The semi-normative Food Poverty Line is used with many methodological
variations (SPC, 2007:2). Methods vary from nation to nation but the food must be
nutritional and represent consumer behaviour.
A non-food poverty line is added to the FPL to get a holistic picture of the poverty
situation for an individual or country (World Bank, 2012). In the case for FPL, a
nutritional level was used as an objective criterion but there is no criterion set for a
non-food poverty line (Rio, 2006:58-59). Determining the quantities and prices for a
non-food poverty line is subject to debates. However, countries such as Mexico,
Indonesia and Canada identified their non-food poverty line as clothing, shelter and
transportation (Rio, 2006:59). In South Africa, a number of researchers (Mokoena,
2001; Slabbert, 2004; Sekhampu, 2010) have identified common elements to be
included in the non-food poverty line as clothing, transport, fuel, lighting, cleaning,
rent, pensions, insurance and medical aid. All these non-foods must be expressed

Perceived causes of poverty in a South African Township 20
as a basket which reflects consumption habits of the population (Rio, 2006:59). A
single value can be used for total non-food poverty expenditure and that value is
added with the (FPL) to make up an absolute poverty line (Rio, 2006:60).
2.3.1.2 Relative poverty line
Contrary to an absolute poverty line, relative poverty uses a relative measurement to
separate the poor from non-poor. Townsend (1979) defined relative poverty as the
individuals in society living under the unaccepted standard of the community. In
supporting Townsend‟s definition, Saundres and Tsumori (2002) defined relative
poverty as households living below the acceptable standards of the society. From
the above definitions, a relative poverty status is determined by looking at the
acceptable standard in a society. Relative poverty is a shift from money metric
approaches to the idea that poverty is a lack of resources within the society (Rio,
2006:73). This means that the society considers the amount of resources an
individual has. For example, Adam Smith gave an example that, in his time, an
individual who cannot afford a linen shirt is considered poor (Worstal, 2012). The
result of not owning a shirt leads to social exclusion in that a failure to own a shirt
makes an individual feel inferior and they can exclude themselves from those with
shirts. This approach is mostly used in developed countries where absolute poverty
is very low (Oosthuizen, 2008:7).
Relative poverty has two characteristics, namely; social exclusion and relative
approach (Lotter, 2007 & Sunders, 1997). Social exclusion is experienced when a
poor person cannot participate in certain activities in a society. For example, in a
society where cycling is considered as a major activity some individuals in such a
society who cannot afford bicycles are excluded from that major activity. Thus those
excluded individuals are identified as poor within that society. The second
characteristic of a relative poverty line is that it is relative to the context. Townsend
(1954:133) mentions that poverty is relative according to the society in which an
individual lives. This means the society can determine the standard which may differ
from one society to the other. The difference in standards makes poverty perceptual
to the society in which an individual belongs.
Poverty can be measured in both absolute and relative terms. On one hand,
absolute poverty focuses more on minimum basic goods and services for poor

Perceived causes of poverty in a South African Township 21
individuals. On the other hand, relative poverty deals with the standards of the
society where they can afford basic commodities. Relative poverty includes absolute
poverty even though the former is determined by society‟s standards. This means
that the relative poverty line is higher than the absolute one.
2.3.2 Headcount Index
Headcount index (HI) is an index which was constructed by Foster et al., (1984) in
1984. There is not much literature concerning the origin of this index rather what
there was focused more on its weakness. A headcount index is the simplest way of
measuring poverty. It is easy to construct and easy to understand (World Bank,
2005:70), as it is the proportion of the population that is counted poor (World Bank,
2005). The purpose of the headcount index is to count the physical number of the
poor. All people who fall below the poverty line are counted as poor and expressed
as a ratio of the whole population. It can be calculated as follows (World Bank,
2005:70).
P0 = Np/N............................................................................. (3.1)
Where; P0 = headcount index;
Np = is the number of the poor;
N = is the total population;
This formula can also be rewritten as;
P0 = 1/N ∑ ( ) ........................................................ (3.2)
Where: P0 = headcount index;
N = is the total population;
I = is an indicator function that takes on a value of 1 if the bracketed
expression is true and 0 otherwise (World Bank, 2005:70).
If expenditure (yi) is less than poverty line (z), then I (.) equal to 1 and the household
would be counted as poor

Perceived causes of poverty in a South African Township 22
Sen (1983) has criticised the headcount index because it ignores the depth of
poverty. The headcount index also does not reflect the level of poverty among the
poor. This implies that it does not change if a poor person gets poorer. Most of the
time, a headcount index measures the poor according to households and not
individuals. This may compromise policy making since the policy makers are more
concerned with individuals rather than households (World Bank, 2005). The
headcount index was also described as a very crude index (Sen, 1976:1). The index
is crude in that people who are living below the poverty line may increase in the
magnitude of the shortfall of income from the poverty line and the improvement not
captured through the index. Sen (1976:1) further explained that headcount index is
unresponsive to distribution of the poor, and that a transfer of income from the
poorest to the poorer will leave the headcount unchanged or reduce it.
2.3.3 Poverty gap Index
In addition to the headcount index is the poverty gap index. World Bank (2005:71)
defines the poverty gap index as a poverty line less the actual income for the poor. A
poverty gap is also defined as the total shortfall of income of all poor from the
poverty line (Sen, 1976:220). From the above definitions a poverty gap index
measures the income shortfalls of the poor from the poverty line. For example, if a
poverty line is set at R400 per month, it means that an individual who earns R300
per month has a shortfall of R100. This means the poverty gap is more concerned
with the shortfall of R100. Hence the poverty gap measures the depth of poverty
because it is concerned with people below the poverty line. Makoka (2005:16)
mentions that the poverty gap index can also be called a depth of poverty. According
to the World Bank (2012: 2), the poverty gap index is calculated as follows:
Pi =
∑
( ) ( )
( )
Where y = income of poor household
z = poverty line
N = total number of the population
Gn = difference between poverty line (z) and income of the poor (y).

Perceived causes of poverty in a South African Township 23
The formula shows the average shortfall of the poor from the poverty line and
provides a broad understanding of the depth of poverty. Poverty gap index formula
reflects how much is needed for their expenditure to meet the poverty line (Makoka,
2005:20). Sen (1976) stipulated two conditions a poverty measure must meet:
monotonicity axiom and transfer axiom. Monotonicity axiom is when a decrease in
income of the poor person increases the poverty measure (Sen, 1976:219). Bellu
(2005:2) defines monotonicity as when the poor‟s income increases and poverty
measure decreases. From the two definitions above income and the poverty gap
index must move in an opposite direction. In contrast, a transfer axiom is when there
is a real transfer of money by someone below the poverty line to anyone who is less
poor, which must increase the poverty measure (Sen, 1976:219). Bellu (2005:2)
mentions that a transfer axiom is when a poverty measure decreases as a result of a
progressive transfer of income and increases after a regressive transfer. The poverty
gap only meets the monotonicity axiom by reducing the poverty gap index after the
poor‟s income has increased. In contrast, a poverty gap does not meet the transfer
axiom because it does not show the distribution of unmet needs in the population
(Betson & Warlick 1999:9). Another weakness is that the poverty gap index does not
capture variances in severity among the poor and takes no charge of inequality on
the poor (Makoka, 2005:20).
2.3.4 Sen Index
It was the failure of the headcount index, poverty line and poverty gap index to meet
axioms that made Sen (1976) to devise his own measure. The Sen Index is the
combination of several measures, such as a poverty gap index, Gini coefficient and
the headcount index (Sen, 1976). The main reason why the Sen Index is attractive is
that it is decomposable into three areas: incidence of poverty, depth of poverty and
inequality among the poor (Mussadi & Xu, 2008:1).
There are three axioms introduced by Sen (1976), which are the monotonicity axiom,
transfer axiom and the focus axiom. The monotonicity axiom is when a reduction of
income by the poor leads to an increase in the poverty measure (Sen, 1976:219).
The transfer axiom is simply a guarantee that a transfer of income from a poor
person to a less poor person must increase the poverty measure (Mitra & Ok,
1995:1). Mitra et al., (1995:5) mentions that focus axiom is when the value of the

Perceived causes of poverty in a South African Township 24
poverty index is independent from the income of the non-poor. However, the
headcount measure only meets the focus axiom and violates the other two while the
poverty gap index satisfies the monotonicity axiom and the focus axiom. Gini
coefficient satisfies the focus axiom and transfer axiom and violates the monotonicity
(Blackwood & Lynch 1994:571-572).
Sen Index formula is written as:
S = H + [1(1 - I) Gp]............................................................ (3.4)
This formula can also be rewritten as
∑ ( .................................................................... (3.5)
Where y= income of the poor
Z= poverty line
qz= number of households with income less than (z)
H= q/n Headcount ratio
N= total number of households
Gp= Gini coefficient among the poor
This formula shows that the Sen Index is an increasing function of both headcount
index and poverty gap index (Blackwood & Lynch 1994:571). In addition, since the
Gp ranges from 0 to 1, thus the Sen Index is also an increasing function of Gini
coefficient (Blackwood & Lynch 1994:571). The Sen Index has its own weakness as
a poverty measure. It is biased towards policies that reduce the number of the poor
(Blackwood et al., 1994:571). In other words, the Sen Index is more responsive to
the headcount index than in reducing income gaps and distributing income among
the poor. In addition, the Sen Index is undesirable on those who believe in social
equality and those who believe in a Rawlisian approach. However, those who
believe in social equality prefer reducing poverty inequality as a way of reducing
poverty. In contrast, the Rawlsians believe in helping the poorest of the poor
(Blackwood et al., 1994:571).

Perceived causes of poverty in a South African Township 25
2.3.5 The Foster-Greer-Thorbecke (FGT) measure
This measure was introduced by Foster, Greer and Thorbecke in 1981 (Foster et al.,
2010:1). FGT is a decomposable measure implying that it takes into account the
weighted average measures of individuals in a group (Foster et al., 1984:1). FGT
managed to meet all the axioms set by Sen (1976) hence it is understandable, sound
and easy to apply. The FGT measure includes sensitive factors, such as change in
the number of people, change in income shortfall and change in inequality
(Blackwood &Lynch 1994:571). FGT can be calculated as Foster et al., 2010:3);
= ∑ ( )
........................................................... (3.6)
Where z is the poverty line
Yi is the lowest income
n is the population
q is the number of people who are poor.
Given that α =1, the FGT is equal to headcount and the average shortfall of income.
This implies that the number of the poor and the depth of poverty is being measured
ignoring the distribution of income among the poor (Blackwood & Lynch 1994:571-
572). As α is given values which are one, the Gini coefficient becomes more
applicable in measuring the FGT. The income gaps become the weights. Thus, the
income gap of the poorer weights more than those who are less poor. There is need
of consistency when using FGT between the values of the poverty measure and the
values of the policy makers (Blackwood & Lynch 1994:572). A random selection of α
can affect the nature of the bias and the degree of bias of FGT (Blackwood & Lynch
1994:572). From the above explanation, one can note that FGT is difficult to
measure.
2.3.6 Concluding remarks
Despite the challenges in measuring poverty, a number of accepted international
measures exist. These include the poverty line, headcount index, poverty gap, Sen
Index, and Foster, Greer and Thorbecke measure. The most common measure of

Perceived causes of poverty in a South African Township 26
poverty is the headcount index. It is simple to use and to understand. The poverty
line measures the minimum expenditure needed for the standard of living. The
minimum expenditure consists of basic food and non-basic food. It is measured
using income. Individuals who fall below the poverty line are poor and those above
the poverty line are non-poor. The poverty line can be absolute or relative. It puts the
main focus on the minimum income required and ignores the inequality, the relative
and intensity of poverty.
A poverty line has its own disadvantages as a poverty measurement. Firstly, it does
not explain the depth of poverty as it only distinguishes the poor from non-poor .This
implies that a poverty line does not identify the intensity of poverty among the poor
people below the poverty line. Secondly, the poverty line does not account for
subjective, relative and non-income effects It puts the main focus on minimum
income needed for survival and disregards other aspects. Lastly, the number of
people who are above the poverty line could fall below it if the poverty line changes.
Hence risk, vulnerability and change are not favourable for absolute measures.
The poverty gap index measures an individual income shortfall from the poverty line.
This measure takes into account the depth of poverty. It has become one of the
favourite of policy makers because it shows much is needed from the poverty line.
The poverty gap index violates the transfer axiom. However, the weakness of the
headcount index, poverty line and poverty gap index brought about the Sen Index.
The latter identified the number of poor, depth of poverty and how income is
distributed among the poor. The FGT was introduced in 1981 and met the entire
three axioms. This made it understandable, sound and easy to apply. FGT is
decomposable implying that it can take the weight of individuals in a group.
However, the FGT measure is difficult to measure
2.4 CAUSES OF POVERTY
The causes of poverty differ from one region to another. In Europe, the causes are
unemployment, low levels of education, household size, gender and remoteness of
the community (EAPN, 2013). In Africa, the main causes of poverty are corruption,
lack of resources, poor governance, poor infrastructure, wars and limited
opportunities (SAGCS, 2013). This justifies the need for this study to uncover the

Perceived causes of poverty in a South African Township 27
common causes of poverty, namely, income shocks, institutional failures, human
capital and corruption.
2.4.1 Proneness to income shocks
Most of Sub-African countries rely on agricultural products in sustenance of their
economy and in poverty alleviation (Mukherjee & Benson, 1998). Yet agriculture
cannot sustain the economy due to lack of resources and other unforeseen events
such as floods, wind and drought (Narayan & Petesch, 2000a). This means that the
people who depend on agriculture get less income, which does not cover basic
goods and services. Due to income shocks income citizens cannot afford to buy
basic needs and are vulnerable to poverty. For instance, Malawi depends on
agriculture and yet almost three quarters of its population are poor (Mukherjee &
Benson 1998:1).
Another factor which has exposed people to income shocks was the Global Financial
Crisis. This has left many people unemployed (Australian Report, 2011:1-2). Due to
unemployment households are left with less or nothing to spent on basic goods and
services. It has exposed citizens to absolute and relative poverty. Moreover, income
shocks have created a dependency syndrome on social grants and resulted in
increased deprivation (Australian Report, 2011:1-2). Thus, the global financial crisis
has led to increased rates of poverty and created some institutional failures because
people cannot afford basic goods and services and some are left unemployed
(Australian Report, 2011).
2.4.2 Institutional failures
Some of the important aspects of institutional failures are in labour markets,
employment, governance, education and property rights (Anon, 2006; Yahie, 1993;
White & Killick, 2001). Anon (2006) reported that America‟s labour markets have
declined and its manufacturing companies have closed down and yet the labour
force is increasing. These have left many unemployed and have not met the basic
needs and standards of society. The government and the private sector are
supposed to create employment to boost economic growth, reduce the level of
unemployment and minimise poverty. In contrast to the objective they are failing to
deliver the services hence poverty rates increased (World Bank, 2005). A general

Perceived causes of poverty in a South African Township 28
consensus by Brew (2001:1) and (May et al., (1995; 24) is that the South African
government have failed to deliver the services to the poor. This is evident by the
majority of South Africans who are living in informal settlements (White & Killick,
2001). One of the causes is that the government have failed to define property rights
(White & Killick, 2001). This makes one vulnerable to poverty because shelter is a
basic commodity.
2.4.3 Human capital
A general observation by Woolard (2002:3) was that the majority of unemployed
constituted the uneducated. However, this idea is debatable because some are
educated but not employed due to economic and political instabilities in their
countries. Moreover, Woolard (2002:3) estimated that the majority of South Africans
lack formal education and are mainly found among the poor. Low levels of education
are linked with high unemployment rates and poverty rates. This makes an individual
vulnerable to poverty. For instance, households who have low income levels cannot
afford to pay fees or to attain higher level of education.
Furthermore, Francis (2001:8) pointed out that illiteracy is one of the main causes of
poverty and has influenced development in a negative way. It has hampered
economic growth due to less productivity. Research done by the World Bank (2012)
concluded that the adult literacy rate in some sub-Saharan African countries is below
40%. Lack of education and lower education standards has contributed to the low
literacy rate, which has caused poverty in Africa. Low levels of education contribute
to less formally employed and less skilled households. Some people could not
access education due to financial constraints (Mofokeng, 2005:29). Therefore
education and skills are required for personal development and their absence make
an individual vulnerable to poverty.
2.4.4 Blaming game, corruption and poor administration
It is believed that a combination of colonisation and apartheid formulated the basis
for poverty in South Africa (Aliber, 2001; Shinns & Lyne 2003). A combination of
colonisation and apartheid resulted in deprivation of resources, land, education and
income for the majority of the population (Aliber, 2001:5). Due to lack of resources,
the World Bank (2011) reported that almost half of South African citizens were living

Perceived causes of poverty in a South African Township 29
under $1.25 per day and cannot afford basic needs. Corruption has contributed to
poverty. Poverty can only be minimised by incorrupt government and through equal
distribution of resources. In Africa there are good initiatives to minimise poverty but
the funds end up in the hands of corrupt leaders. Due to poor governance by the
South African governance, the authorities have failed to control corruption. This has
causes imbalances which leads to poverty (SGCS, 2013).
2.5 CATEGORIES OF PERCEIVED CAUSES OF POVERTY
Poverty is a multifaceted phenomenon. This means that by its nature, explanations
and understanding of poverty differ from country to country and from one individual
to another. Individuals may have different perceptions on the causes of poverty
(Wilson, 1999:413). According to Baldwin (2006:6) perception is a concept which has
to do more than observing poverty. This means that from observing an opinion is
formulated. Sometimes a perception depends on the experience of an individual.
Noel (2003) mentioned that perceptions are open for arguments that an individual
has a view on a certain issue. This study focusses on the perceived causes of
poverty. A general consensus has grouped these causes into three categories,
namely; individualistic, structural and fatalistic (Hunt, 2004; Shek, 2004; Sun, 2001;
Davids, 2005). In addition to the three perceptions, Weiss and Gal (2007:894)
identified another category known as psychological perception. Each of these
categories is discussed in detail in the following sub-sections.
2.5.1 Individualistic perceptions of the causes of poverty
Individualistic perceptions deal with the individual failures and blames individuals for
being poor (Davids 2010:51). An individualistic approach puts the main emphasis on
behavioural and cultural factors. These factors include undesirable behaviour,
inappropriate life style and lack of mental capabilities (Buz et al., 2012:187). It is in
these factors that an individual puts the blame on themselves for their poverty
situation. As a result, such individuals are characterised by intergenerational transfer
of poverty (Buz et al., 2012:187). This means that poverty is transferable from one
individual to another.
There are two classes of individualistic perceptions, the underclass and the culture of
poverty (Wilson, 1987; Hunt, 1997; Davids, 2010). Underclass poverty is a group of

Perceived causes of poverty in a South African Township 30
people living in poverty guided by certain values and behaviour. For example, poor
people may live in an informal settlement and survive through prostitution. In
addition, Murray (1996:3) suggested three kinds of underclass: an economic
underclass; a moral underclass and an education underclass. An economic
underclass accounts for those who are not capable of getting a job but have the
abilities while moral underclasses are individuals who deviate from their morals
(Murray, 1993:4). An education underclass is when individuals lack a social and
cultural skill. All these kind of underclass poverty results in undesirable behaviour
such as drug abuse, crime, unemployment, illegitimacy and violence (Murray,
1993:4).
The second class is the culture of poverty where many individuals get used to their
conditions of being poor, adopt it and live with it for their entire lives (Davids,
2010;52). Wilson (1987:13) further explained that the culture of poverty is
characterised by lack of ambition, lack of work ethics and self-reliance. Such a
culture is generational in nature and tends to affect the whole family including the
upcoming generations once it comes to existence. Moreover, an individualistic
approach is attached to many explanations why individuals are poor. Wilson
(1993:413) mentioned that poor people are poor due to reasons that they do not
maintain their moral standard and do not put much or no effort to improve
themselves. Davids (2010) alluded that people lack the ability to improve
themselves; they spend their income on non-basic commodities and they do not
seek to improve themselves. Both Wilson (1993) and Davids (2010) identified
common explanations why people are poor and why they blame themselves. This
common explanation is that people do not have the ability to improve themselves.
A number of theoretical approaches support the thinking that an individual is
responsible for his/her socio-economic status. Theories underlying the perceptions of
poverty are divided into two categories, namely, the conservative and the liberal
approaches. A conservative approach attempts to explain the causes of poverty in
an individualistic dimension while the liberal approach focuses on the structural
dimension (Davids, 2010:58). The next section discusses the individual‟s
explanations framework and victim blaming framework.

Perceived causes of poverty in a South African Township 31
2.5.1.1 Individualistic explanations framework
An individualistic explanations approach explains individual characteristics an
individual possesses, which include character and intelligence (Andy, 2011:1). In
other words, the poor are poor because of their inability. Their inabilities see them in
deep poverty (Andy, 2011:1). The individualistic framework alludes to factors such as
absence of ability, lack of intelligence, no goals and lack of morals to be closely
related to the situation one finds themselves in (Davids, 2010:58). In contrast, the
framework credits the rich for their affluence, noting that they are hardworking,
dedicated, goal oriented and can handle pressure.
This notion seems to resonate high in the developed world where there are many
opportunities for individuals to improve themselves (Bullock & Limbert, 2003:696).
Even the individuals who do not utilise such opportunities tends to blame themselves
because they lack the ability and are penalised with a poorer standard of living
(Smith & Stone, 1989:94). Bandura (1999:35) differentiates between the
individualism and collectivism concepts. Individualism is when people work
individually to achieve their goals and improve themselves while collectivism is when
individuals work together to improve themselves (Bandura, 1999:35). Individualism is
mainly practised in countries such as United States, Sweden and Russia. In contrast,
collectivism is practised in countries such as China, Japan and South Korea.
Collectivism and the individualistic possess a certain feature of consistency in the
sense that all these approaches are intertwined. Therefore individuals from countries
which practise individualism tend to blame themselves for being poor, while those
individuals from collectivism put the blame on the system. An addition to the
individualistic approach is the victim-blaming framework.
2.5.1.2 Victim-blaming framework
Victim-blaming framework is a multi-dimensional concept, attached to many
definitions and many complexities (Davids, 2010:61). Wright (1993:3) defined victim
blaming as situations that put the blame or responsibility on individual actions for
being poor. For example, in a family of six if only five are poor the responsibility is
put on those who are poor (Giddens, 2009:5). In other words, they should explain
why they are poor. Giddens (2009:5) mentioned that a victim blame framework is

Perceived causes of poverty in a South African Township 32
linked with the culture of poverty. Buz et al., (2005:187) stipulated that individualistic
perception deals with behavioural and cultural factors. The poverty life style makes a
poverty culture, which is made up of social, economic and psychological
characteristics (Buz et al., 2005:187).
Lewis (1969) identified some features of poverty culture as: no efficiency, social
exclusion, doubt and lack of education. More emphasis is put on misfortunes, and an
accident of staying with the wrong people in the wrong places (Giddens, 2009). This
implies that poverty is perceived to be caused by some undesirable factors, mental
problems and an undesirable life style. The setback of an individualistic approach is
that it is transferable to the next generation because young people adopt all the
values from their parents (Davids, 2010).
2.5.2 Structural perceptions of the causes of poverty
The second perception of the causes of poverty is structural perception. Shek
(2004:273) described structural causes of poverty as caused by unfairness within the
society or the system. The structural explanations accounts for external forces which
individuals cannot control. In addition, David (2005:54) alluded that structural
perception causes of poverty are caused by economic disorders. Structural
perceptions are attached to external explanations (Buz et al., 2012:188).
From this view, people can complain of the unfairness in the society as caused by
exploitation by capitalist and lack of social opportunities (Shek, 2004:273). David
(2010:54) alluded to economic disorders as social and economic injustice. Social
injustice accounts for factors such as lack of opportunities and the poor living in
under-resourced conditions. Economic injustice accounts for factors such as unequal
distribution of resources as the rich exploits the poor (David, 2010:54). In addition,
structural views are associated with lack of education, low income and victims of
social structures (Buz et al., 2012:188). To understand structural perception causes
of poverty structural and situational framework and public arena framework can be
explained. The next sub-section discusses these theories.
In the structural framework, social structures and situational forces are perceived to
be the main causes of poverty (Smith & Stone, 1989:95). These forces are
independent from individual characters and traits; structural explanations focus on

Perceived causes of poverty in a South African Township 33
societal characteristics to explain individual situations (Wright, 1993:2). Davids
(2010:54) mentions that structural explanations result from external factors that
affect an individual such as lack of education and employment. This framework
insists that structures do not provide equal opportunities for all people in education,
employment and capital (Smith, 1989:95), which are considered to be beyond
human control. In other words, there is nothing an individual can do when the system
has failed to provide for education and job opportunities.
Structural and situational framework group causes of poverty ascribe to uneven
changes in technology, unemployment, a dual economy and unequal distribution of
resources (Kerbo, 1991). Furthermore, Davids (2010:61) mentioned that structural
and the situational explanations act independently with individual attributes. In other
words, it is a matter of who can make use of available opportunities to the best of
their abilities.
The public arena framework was used to analyse the structural explanations to
poverty (Davids, 2005:63). This framework originates from sociological research on
social problems (Wilson, 1996:415), and offers a theory which supports structural
perception of the causes of poverty. Hilgartnar and Bosk (1988) allude that at any
given point any issues which attempt to deal the problem of poverty can be
addressed in public arenas, such as media, government institutions and private
institutions. Wilson (1996) mentioned that a structural explanation is seen as
multifaceted which alludes to many explanations. Some of these include: social
injustice, unequal distribution of resources and the rich exploiting the poor. However,
the findings on this framework were that people have different beliefs on types of
poverty and what causes poverty (Davids, 2010:62). Examples of these beliefs are
that poverty is caused by rich exploiting poor, social injustice, unequal distribution of
resources and inability of the government to reduce poverty.
2.5.3 Fatalistic perceptions of the causes of poverty
Some researchers have criticised the individualistic and structural approach and
came up with the third explanation to poverty as a fatalistic approach (Waxman,
1983; Feagin, 1975; Thom, 1977; Morcöl, 1997; Saunders, 2002). Fatalistic
perception forms the third perception of the causes of poverty. Bègue and Bastounis
(2003:456) mentioned that the fatalistic approach is used by individuals to explain

Perceived causes of poverty in a South African Township 34
how they were victimised and ill-treated. Fatalistic causes of poverty include societal
problems such as accidents, death and bad luck (Bullock & Waugh, 2005:1133).
Fatalistic perceptions of the causes of poverty can be called accidental causes by
being aligned with misfortunes (Shek, 2004:273). Furthermore, they assert that
fatalistic perception is a result of unavoidable situations which individuals do not
have control over (Bullock & Waugh 2005:1133). Smith & Stone (1989:95) identified
bad fate, unlucky as fatalistic factors that affect poverty. Individuals have no control
over these factors due to unforeseen circumstances.
2.5.4 Psychological perceptions of the causes of poverty
Besides individualistic, structural and fatalistic perceptions of causes of poverty,
there is the psychological perception. Weiss and Gale (2007:894) identified a
psychological element as the way poverty is perceived. The individualistic, structural
and fatalistic causes of poverty do not account for emotional problems and lack of
some abilities. Psychological perceptions of the causes of poverty are mainly
characterised on how individuals think (Davids, 2005). Weiss and Gale‟s study
(2007:905) found that social workers realised that many causes of poverty are
inclined to structural changes, while they have put their focus on the psychological
perception. Perceptions of the causes of poverty are dominated by uncertainty. For
example, other studies mention that the poor must not be neglected and must be
respected. In contrast, other studies ascribe to the negative stereotype of poverty
(Underlid, 2005:274). Davids (2010) suggested that studies on perceptions of
poverty complement policy making, hence understanding people‟s perception may
have an impact in policy formulation (May & Norton, 1997:98). Shek (2004:273)
observed that a study on perceptions into the causes of poverty can help understand
the humiliation related to poverty, and aid in breaking the cycle of poverty.
2.6 EMPERICAL FINDINGS ON THE PERCEIVED CAUSES OF
POVERTY
Most of the studies done on perceptions of the causes of poverty grouped
perceptions as individualistic, structural, and fatalistic with psychological
explanations (De Haan et al., 2003; Davids, 2010; May et al., 2000; Moore et al.,
1998; May & Norton 1997). These four perceptions of poverty were used to identify

Perceived causes of poverty in a South African Township 35
perceived causes of poverty. In addition, some of these investigated the effect of
socio-economic and demographic factors on perceptions of the causes of poverty.
Some of these factors include education, race, employment status, age, household
size and geographical location. The common findings from these studies are that
perceptions of the causes of poverty tend to differ from country to country. The next
section discusses the empirical evidence on the perceptions causes in structural,
individualistic, fatalistic terms, and on how socio-economic and demographic factors
affect these perceptions.
2.6.1 Poverty perceptions indices
Some of the aforementioned studies (Oorschot & Halman, 2010) and (Halman &
Oorschot, 1999) found empirical evidence supporting that perceptions of the causes
of poverty are in structural terms.
2.6.1.1 Structural perceptions of the causes of poverty
A study done by Oorschot and Halman (2010:1) and Halman & Oorschot, (1999)
explored popular perceptions of the causes of poverty in eastern European countries
(Poland, East Germany, Bulgaria, Czech, Holland and Slovakia). They grouped
these into individual blame, individual fate; social blame and social fate. A
questionnaire was designed, which considered aspects, such as religion, morale
level, politics, leisure time, family and marriage. Factor analysis was used in
measuring the four perceptions and social blame was the most perceived cause of
poverty in eastern European countries (Oorschot & Halman, 2010:11). The main
reason for social blame was that the majority of people living in these countries
believe that poverty is a result of social actors compared to individual fate and social
fate (Oorschot & Halman, 2010:1). However, they were other factors which also
contributed to why western countries are poor (Halman & Oorschot, 1999:10).
Other studies (Bobbio et al., 2010; Oorschot & Halman, 2010) found that people
perceive poverty in structural terms. Bobbio et al., (2010:223) grouped European
Union Countries perceptions into three explanations: internal-individualistic, external
structural and external fatalistic. The main findings were that the European Union
Citizens perceived causes of poverty mostly in structural terms; 37% of the sample
perceived social injustice as the main cause of poverty (Bobbio et al., 2010:223).

Perceived causes of poverty in a South African Township 36
The European Union Commission (2007) also reported that of all the factors
perceived as causes of poverty social injustice accounted the most (34%). In other
words, the European Union countries put the blame on the society at large as the
main cause of poverty. The main reasons for this blame are that some governments
failed to give good services to its citizens and that industries were offering low wages
to its employees (Bobbio et al., 2010:227-228).
Another study done by Abouchedid and Nasser (2001:276) observed that structural
factors were more dominant in three groups, namely, Muslim, Lebanese and
Christian university students. Their study was done in Turkey, Philippines, Hong
Kong, India and Iran. All these countries were more inclined to structural
explanations (Shek, 2004; Haati & Karam, 2005; Hine & Montiel, 2005). Factors
which led to structural perceptions were social changes, social and economic crisis
and failure by the government to provide public goods and services (Abouchedid &
Nasser, 2001:277). Philippines perceived poverty as corruption, improper distribution
of resources, traditional ruling, unwillingness of the government to minimise poverty
and dictatorship in the ruling of Marcos.
In the South African context, a study was done by Davids (2010) based on a survey
of 3510 South African participants, which found that South Africans perceived
causes of poverty in structural terms rather than in individualistic and fatalistic terms.
A greater percentage (44%) believed that the poor were exploited by the rich. Other
reasons behind structural perceptions were identified as social injustice, uneven
distribution of resources in a society and lack of opportunities because they were
born poor (Davids (2010:19).
From the above empirical studies which concluded in favour of structural causes of
poverty three methodologies were used, namely, descriptive, factor analysis and
regression analysis. From these methods it was found that there are factors which
contributed to structural views, such as policies that are self-centred, the
unavoidable part of modern times, the rich exploiting the poor, lack of job
opportunities, lack of education, uneven distribution of resources, incompetency of
government and that they were born in areas of fewer opportunities. The similarities
in these studies are that they all perceived causes of poverty in structural terms. The
difference is that every country or continent attached different reasons to the poverty

Perceived causes of poverty in a South African Township 37
situation. However, some other studies found that evidence supporting individualistic
and fatalistic perceptions of the causes of poverty. The next section discusses the
empirical findings of the individualistic perceptions.
2.6.1.2 Individualistic perceptions of the causes of poverty
Bobbio et al., (2010:223) grouped individualistic perceptions of the causes of poverty
into three explanations: internal-individualistic, external structural and external
fatalistic. Their study was done on ex-East German and Denmark, where it was
found that Europeans citizen‟s favoured some individualistic explanations compared
to structural and fatalistic explanations (Bobbio et al., 2010:223). Other studies have
also indicated that Americans are more inclined to individualistic factors (Feagin,
1972; Hunt, 1996; Zucker & Weiner, 1993; Cozzareli et al., 2001). In addition,
Lithunia and Sweden also perceived individual choices as a cause of poverty
(Bobbio et al., 2010:223).
These studies generally conclude that people blamed the inability to manage money
as a cause of being poor. However, they were number of reasons why poor people
think they are poor. People perceived that they are poor because: they lack skills,
lack abilities, lack opportunities, do not seek to improve themselves, spend their
money on unnecessary goods and services and are lazy.
2.6.1.3 Fatalistic perceptions of the causes of poverty
The literature review has shown that there are other researchers (Feagin, 1972;
Smith & Stone, 1989; Zucker & Weiner 1993) who realised that poverty also
accounts to factors such as accidents, lack of opportunities, and bad luck, which are
beyond individual control. All these can be classified under fatalistic perception. A
study on the perceptions of poverty by Halman et al. (2010) used the data from
Social and Cultural Developments in the Netherlands in 1995 (SOCON95). The
study presented four perceptions of poverty, namely, individual-blame, individual-
fate, social-blame and social-fate. The results showed that Dutch respondents/
participants perceived poverty to be caused by fatalistic factors, accounting for
factors such as bad fate. Davids (2010) notes that fatalistic views accounted for 30%
in a South African sample. Factors attached to fatalistic perceptions were: lack of
motivation due to welfare, encountering some misfortunes and lack of luck.

Perceived causes of poverty in a South African Township 38
From the above literature, they are similar reasons why people think they are poor.
People have encountered misfortunes, accidents, lack of opportunities and bad luck.
However, they are other factors which were not similar to the studies, such as they
were born inferior and were unlucky. From the above findings, structural,
individualistic and fatalistic perception causes of poverty were found to be the main
perceived causes of poverty. Among these three perceptions causes of poverty,
structural perception is the common one. Many respondents perceived structural
explanations, especially blacks, developing countries and the uneducated. In
addition, it was found that socio-economic and demographic factors tend to influence
perceptions of the causes of poverty. The next section discusses the empirical
findings on the effect of socio-demographic on the perceptions of the causes of
poverty.
2.6.2 Perceptions of causes of poverty and socio-economic factors
There are studies done on perceptions of causes of poverty linked with socio-
economic factors, such as age, race, education, employment and gender (Bullock,
1999; Davids, 2005; Limbert, 2003). The impact of socio-economic and demographic
factors on perceptions differs from country to country. (De Haan et al., 2003:352;
May & Norton 2000:5; Moore et al., 1998:3; May et al., 1997:96). Socio-economic
factors were discussed to compare the differences.
2.6.2.1 Perceptions of the causes of poverty and race
Race is perceived in a multifaceted way and has a role to play in influencing the
perception into the causes of poverty (Davids, 2010:71). Davids (2010:149)
mentioned that many blacks in South Africa stayed for long without basic
commodities more than other races. This group tends to favour structural
explanations, blaming society or the system for their predicament. Bullock (2005)
alludes to similar findings that black Americans perceived causes of poverty in
structural explanations while whites perceived poverty in as an individual cause. In
support of Bullock and Waugh (2005) and Davids (2010), Hunt (1996) and Kluegel &
Smith (1986) found that black people are more inclined to view structural factors
while whites are inclined to be individualistic. The reason is that the white population

Perceived causes of poverty in a South African Township 39
is perceived to have had more opportunities while blacks got less and they tend to
blame the rich exploiting the poor (Bullock & Waugh, 2005).
The white population appears to have been given more opportunities, which many
people have utilised (Bullock & Waugh 2005; Hunt, 1996; Davids, 2010). The black
race tends to blame social injustice where the rich exploit the poor. Blacks mostly
tend to blame the system for failing to provide food, energy and housing. Many black
people in South Africa did not receive quality education and this contributed to their
poverty status.
2.6.2.2 Perceptions of the causes of poverty and education
Davids (2005:77) mentioned that education has an impact on how people perceive
the causes of poverty. The education level of an individual has both positive and
negative effects on how they perceive poverty (Davids, 2005:78). A study done by
Hunt (k21996:296) observed that highly educated participants perceived poverty in a
positive way compared to those who are not educated. The educated blamed
themselves for being poor while the uneducated put the blame on external forces
and unforeseen factors. A study by Weiss and Gale (2007:905) in Israel concluded
that professionals blamed psychological factors compared to all the other types of
explanations for poverty. Participants with lower education levels experienced
scarcity in basic goods and services compared with those with higher levels of
education (Weiss & Gale, 2007:905). However, people with less education tend to
blame the government and other institutions for not providing goods and services.
Another study done by Reutter et al., (2005) examined how educated students
(nurses) perceived poverty, and the results showed that the more educated
individuals are, the more they are inclined to structural terms. However, Federico
(2004:387) predicted some complications on the influence of education on poverty.
One of these is the discrimination involved in the level of education. He noted that it
is perceived that black Americans are lazy no matter how educated they are.
Federico (2004:387) also observed that many black Americans purely rely on grants
and/or other government support for survival. As a result, they tend to blame
government for their poverty status.

Perceived causes of poverty in a South African Township 40
In general, education tends to influence perceptions of poverty in individualistic and
structural terms. The more an individual is educated, the more they perceive poverty
in individualistic terms because they would blame themselves from not improving
their socio-economic status. In contrast, those with less education or no education
always blame the government or any other relevant system that they do not provide
for them.
2.6.2.3 Perceptions of the causes of poverty and geographical location
Geographical location plays a role in perceptions causes of poverty. Perceptions
tend to differ according to geographical location. Literature shows that that each
geographical location has its opinions about what causes poverty (De Haan et al.,
2003:352; May 2000:5; Moore et al., 1998:3; May & Norton, 1997:96). Urban areas
showed that few individuals lack basic necessities, while traditional rural formal and
informal urban areas may lack basic commodities. This implies that people in the
rural areas tend to perceive poverty in structural terms, while those in urban areas
perceive poverty in individualistic terms.
From the above studies, geographical location influenced perceptions of poverty.
People in developed countries perceived causes of poverty in individualistic terms
because they can afford to buy basic commodities. In contrast, those in developing
countries perceived causes of poverty in structural terms because they blame the
government for not providing public services, social injustice and exploitation of the
poor by the rich.
2.6.2.4 Perceptions of the causes of poverty and age
Shek (2004:277) observed that age is one of the socio-economic variables that
influenced views about poverty. Shek (2004) found that there is a difference between
how a Chinese parent and adolescent perceive poverty. Adolescents perceived the
causes of poverty to be victim blaming, while parents perceived the causes of
poverty in fatalistic terms (Shek, 2004:287). Parents were more inclined to bad fate
as a cause of poverty although women were found to be prevalent in this category
(Shek, 2004:288). In addition, Shek (2002:790) observed that adolescents blamed
structural explanations for the low level of income and shortage of jobs.

Perceived causes of poverty in a South African Township 41
From the above studies, adolescents are more inclined towards structural
explanations. They blamed society, institutions, and the government for low level of
income and lack of job opportunities. Parents believe in fatalistic explanations
attaching their reasons to bad fate and accidents. Thus age plays an important role
in influencing perceptions of poverty.
2.6.2.5 Perceptions of the causes of poverty and gender
Gender has a role to play on how people perceive poverty. Buz et al., (2005:193)
observed that there is a relationship between gender, income and corruption. His
study on students showed that male students blamed corruption of moral values
compared to women. (Buz et al., 2005:193). A general consensus also showed that
males are more inclined to the structural dimension compared to females (Smith,
1986; Hunt, 1996; Sun, 2001). Morcoi (1997) also concluded that males are more
inclined to structural explanations compared to women because economic structures
tend to support women in terms of social grants and employment equity. Other
researchers (Buz et al., 2005 & Cozzarelli et al., 2001), however, thought that gender
has nothing to do with poverty.
Literature shows that male and female perceive the causes of poverty in different
ways. It also differs from country to country. For example, if a country supports
women more than men, the former might not support structural factors. Thus gender
has a role to play in determining the perceived causes of poverty, although other
researchers would argue that it has nothing to do with poverty (Buz et al., 2005 &
Cozzarelli et al., 2001).
2.7 SUMMARY AND CONCLUSIONS
Poverty is a broad concept attached to many approaches, definitions and
measurements. Many theories have been developed in an attempt to understand
poverty, on the other hand, disagreements, challenges and debates have argued on
how to define and measure poverty. Despite the disagreements and debates, the
study defined poverty as a lack of resources and lack of freedom of choice. Lack of
resources constitutes the deprivation of basic goods and services to attain a
minimum standard of living. Poverty can also be understood as lack freedom of
choice. This will result in lack of peace, human rights, freedom of speech.

Perceived causes of poverty in a South African Township 42
Since poverty is a multifaceted concept, there are various approaches used in
understanding it: absolute, relative, monetary, social exclusion, capabilities and
multidimensional approaches. An absolute approach is objective, which measures
the minimum basic needs for survival. It measures the basic goods and services
deemed necessary by society and the goods and services are expressed in
monetary terms. In contrast, the relative approach is a more subjective measure
compared to absolute poverty. Relative poverty compares one individual to society‟s
standards. The monetary approach is used in poverty identification and
measurement. It makes use of the income or consumption to measure the shortfall
from the poverty line. Poverty approaches are not only limited to monetary values but
take abilities of an individual into account. The capability approach is a combination
of all the abilities an individual can attain to have better lifestyle. Failure to obtain
such abilities, such as to attain basic goods and services and living under the
standards of society makes one to be socially excluded, which is one of the
approaches to poverty. These approaches have their own weaknesses. Despite their
weaknesses, these approaches must be used interchangeably and sometimes they
must all be used to achieve the objective of defining and measuring poverty.
Although measuring poverty is complex there are common measures of measuring
it: a poverty line, headcount index, poverty gap index, Sen Index and FGT measure.
The poverty line is the most common measure of poverty. This is the minimum
expenditure on basic food and non-basic food needs. If the expenditure is below the
poverty line an individual is poor and above it he/she is non-poor. It is used to
separate the poor from the non-poor. A headcount index is simply identifying those
who are poor in the population. It quantifies the number of the poor in a society
though it does not account for the depth of poverty. Furthermore, the poverty gap is
the measure which accounts for the depth of poverty. It measures the shortfall from
the poverty line. Sen introduced three axioms: focus, monocotiny and the transfer
axiom. A good measure must meet these three axioms which the Sen Index does.
This measure is decomposable in that it accounts for incidents of poverty, depth of
poverty and the inequality among the poor. Another measure which is decomposable
is the FGT. An FGT measure is a decomposable measure that takes into account
the weighted average measures of individuals in a group. The FGT meets all the

Perceived causes of poverty in a South African Township 43
axioms; hence it is understandable, sound and easy to apply. All these measures
have its disadvantages but they must be used interchangeably in measuring poverty.
The causes of poverty differ from one region to another. Europe, Africa, Asia have
different cause of poverty. Despite these different causes of poverty the common
causes are: income shocks, institutional failures, gender discrimination, human
capital and corruption. A country which depends on agriculture or one sector is prone
to income shocks. Due to insufficient funds individuals cannot afford basic
commodities and are vulnerable to poverty. Institutional failures have also
contributed to poverty. The government has failed to provide public goods and
services, health services and creating employment. This is one of the main causes of
poverty. Furthermore, gender discrimination is another cause of poverty. Failure to
provide credit, land and resources to women can make them poor. They can become
lazy to work very hard because the system has failed to support them. Shortage of
skilled labour, lack of education has hampered the economy at large as well as
individuals. They cannot sustain themselves, which make them vulnerable to
poverty. The blame is put on western countries, unfaithful leaders and corruption. A
combination of these is a setback to the whole nation and individual at large.
Perceptions of causes of poverty were grouped into three: structural, individualistic
and fatalistic explanations. Structural explanations put the blame on external forces,
such as social injustice and uneven distribution of resources in a society. In contrast,
an individualistic explanation blames individuals for being poor. It attaches factors
such as laziness, lacking the ability to manage money and money spent on non-
basic commodities. Fatalistic explanations put the blame on accidents, bad fate, lack
luck and misfortunes. They are theories which support these perceptions causes of
poverty, such as conservative and liberal approaches. Conservative approaches are
more inclined to individualistic explanations while liberal explanations are structurally
inclined.
The literature review has shown that studies done on the perceptions causes of
poverty grouped perceptions into three: individualistic, structural and fatalistic. Factor
analysis, descriptive and regression analysis were used in identifying the perceived
causes of poverty. It was found that many people perceived causes of poverty in
structural explanations as well as individualistic explanations. It was also found that

Perceived causes of poverty in a South African Township 44
South Africans perceive causes of poverty in structural explanations. They put their
blame on social injustice, lack of opportunities, uneven distribution of resources and
lack of welfare as their main causes of poverty. In contrast, other studies identified
that an individualistic approach was the main perceived cause of poverty. The
reasons attached to this approach were that people were lazy, lacked authority and
they did not want to improve themselves. Individualistic perception of poverty was
mainly favoured by developed countries where many people had been given more
opportunities to improve themselves. However, even those who failed to improve
themselves would still perceive causes of poverty in individualistic terms. The few
studies done on perceptions of poverty have shown that people blamed or
experienced misfortunes of being poor. Other reasons which were attached to a
fatalistic perception was that people are lazy, they are not intelligent, they do not put
much more effort, they have a low income and they went to poor schools. The
literature review also extended to the non-poor who perceived the poor as being
poor because they do not have money to buy basic commodities, they are lazy, lack
opportunities, fear the unknown and lack ability.

Perceived causes of poverty in a South African Township 45
3 CHAPTER 3: RESEARCH METHODOLOGY
3.1 INTRODUCTION
A research methodology is one of the most important components in research hence
it must be clearly defined. Cant, Gerber-Nel, Nel and Kotze (2003:65) advocate that
a research methodology comprises of techniques and mechanisms of formulating
the problem statement and obtaining results as well conclusions. They further argue
that it entails producing a research design, scope, sample, instrument, as well as
validity and reliability testing, and analysis (Cant et al., 2003:65). This chapter seeks
to discuss the research methodology used in this study.
3.2 RESEARCH DESIGN
A research design as defined by Parahoo (1997:142) is a “plan that describes how,
when and where data should be collected and analysed”. In other words, a research
design consists of methods used to collect data, the period as well as the
geographical location of the data collection. Data collection as subscribed to by
Seeberg (2012:4-5) can either be qualitative, quantitative and or a combination of the
two commonly known as triangulation. Qualitative research involves understanding
what people think and how they perceive things through experiences in the real
world (Merriam, 2009:13). It uses films, observations and focus groups (Seeberg,
2012:4-5). In contrast, quantitative research is a systematic and neutral process
which follows a certain method. More so, it describes, investigates and tests the
causal-effect relationships between variables (Burns & Grove, 1993:777). Soemarno
(2007:227) in support mentions that quantitative research follows the collection of
data, descriptive statistics and hypothesis testing. More so, Nicholls (2011:2)
suggests that a quantitative research design constitutes attributes such as the use of
common methods like percentages, means and models in predicting events as well
as determining actions. This design can be utilised in the collection of large amounts
of data and its results tend to be numerical (objective) (Sukamolson, 2009:11). In
light of the above, a quantitative research design was deemed fit and suitable for the
purposes of this study. The next section discusses the sampling process.

Perceived causes of poverty in a South African Township 46
3.3 SAMPLING PROCESS
A sampling process comprises the target population, sampling frame and technique
as well as the sample size (Kinnear & Taylor, 1991:395). The next section focuses
on the target population.
3.3.1 Target population
A target population is an entire group of individuals, corporations, objects or any
other items sharing at least a set of characteristics (Zikmund, 2000:339). Kinnear
and Taylor (1991:395) suggest that it includes elements of the population, sampling
units, extent and time. The derived implication is that a target population needs to be
well-defined in terms of population elements, sampling units, extent and time. A
population element as defined by Zikmund (2000:339) refers to an individual,
corporation, item and or object which form part of the population. West (1999:63), on
one hand, defined a sampling unit as a participant to be sampled which may include
an individual, a retail outlet, an advisor, a company, a school, a university and or a
consultant. On the other hand, an extent, commonly referred to as a research scope,
defines the research focus in terms of the geographic location and boundaries, such
as the town, city, province and or country in which the study is conducted. Thus, the
sampling units of this study were both the male and female households, the extent or
research scope was Kwakwatsi Township in the Free State province of South Africa.
Lastly, the survey time or period of this study was two months (from April to May
2013).
3.3.2 Sampling frame
A sampling frame is a list of population elements from which a sample is chosen
(Zikmund, 2000:344). Its purpose is to select suitable members of the targeted
population to be surveyed (Turner, 2003:3). Turner (2003:4) in complement with the
aforementioned suggests that a sampling frame must be accurate, up-to-date and
complete. A list of households residing in the Kwakwatsi Township obtained from the
Ngwathe Municipality was used as the sampling frame of this study. This is mainly
because the residents of Kwakwatsi Township engage in less economic activities
and ultimately experience increasing rates of poverty. The next section focuses on
the sample size.

Perceived causes of poverty in a South African Township 47
3.3.3 Sample size
Gerber-Nel et al. (2003:48) refers to a sample size as the number of participants to
be included in an investigation. In addition, they associated a sample size with the
quality and simplification of data as well as population representation (Gerber-Nel et
al., 2003:48). Statistically, a sample size of 30 is deemed normal, while any size of
less than 30 is small and more than 30 is said to be big. As such, small sample sizes
might not be representative of the targeted population whereas normal and bigger
sample sizes can be representative of the population elements. In light of the above,
a sample size of 225 which was used in this study, was deemed relatively big and
therefore, representative of the population elements of the Kwakwatsi Township
households.
3.3.4 Sampling procedure
There are different sampling procedures used in academic research when choosing
a sample. McDaniel and Gates (2001:31) suggest that researchers may use the
probability or non-probability samples. A probability sample is a sample in which all
elements have the same chance of being selected into a sample (West, 1999:68). In
other words all elements have a known and equal chance of being included in the
sample. The probability sample includes methods such as simple random,
systematic, stratified and cluster sampling (Gerber-Nel et al., 2003:48). Simple
random sampling is a method that assures equal chance of selection of the
population elements into a sample, while systematic sampling involves the selection
of population elements after every nth element in the sampling frame.
Non-probability samples refer to subsets of a population with little or no chance of
being chosen into the sample (McDaniel & Gates, 2001:31). Convenience, quota,
snowball and judgmental sampling constitute non-probability sampling techniques
(Gerber-Nel et al., 2003:49). In all these techniques, the researchers apply personal
judgement to select the sampling units (ZikMund, 2000:350).
For the purpose of this study, a simple random sampling technique to select the
households of Kwakwatsi Township into a sample size of 225 respondents. Thus,
the respondents in Kwakwatsi were randomly selected from the sampling frame of
Kwakwatsi Township residents. Where households were not available, fieldworkers

Perceived causes of poverty in a South African Township 48
went to the next pre-selected. The next provides an overview of the geographical
location of this study.
3.4 GEOGRAPHICAL LOCATION
The study was based on Kwakwatsi Township located in the Free State, South
Africa. Kwakwatsi is a small township near Koppies, about 70 km away from
Sasolburg, 180 km south of Johannesburg and 280 km north of Bloemfontein.
Kwakwatsi is a former black residential township and its head office is in Parys under
Ngwathe Municipality (Ngwathe Municipality, 2009). It is a semi-urban area
associated with less economic activities and its population is approximately 15 095.
In this population, Sekhampu (2010; 2012; 2013) found that poverty was high in the
area, and therefore provided ample ground for testing the perceptions of these
residents on what causes poverty.
3.5 QUESTIONNAIRE DESIGN
The research instrument used in this study is a questionnaire, which was mainly
made up of dichotomous, multiple choice and Likert scale questions and divided into
two sections: A and B. Section A was composed of socio-economic and
demographic factors, such as household size, number of children, gender, age,
marital status, level of education, employment status and income of the household
heads.
Section B of the questionnaire measured perceptive causes of poverty which
borrowed information from the Perceptions of the Causes of Poverty Scale (PCPS)
developed by Joe Feagin (Bobbio et al., 2010:223; Buz et al., 2012:191; Davids,
2010:14). The question responses were based on a Likert scale ranging from 1
(strongly disagree) to 5 (strongly agree). The higher the scale for example a scale of
4 and 5, the more important the factor is to the causes of poverty. Below are the
perceived reasons of the poor people‟s poor status.
“They lack the ability to manage money”;
“They waste their money on inappropriate items”;
“They do not actively seek to improve their lives”;
“They are exploited by rich people”;

Perceived causes of poverty in a South African Township 49
“The society lacks social justice”;
“Distribution of wealth in the society is uneven”;
“They lack opportunities due to the fact that they live in poor families”;
“They live in places where there are not many opportunities”;
“They have bad fate”;
“They lack luck”;
“They have encountered misfortunes”;
“They are not motivated because of welfare (grants)”; and
“They are born inferior” (Davids, 2010).
The above perceived reasons were divided into three indices: individualistic,
structural and fatalistic. The individualistic index was measured by question 1 to 3,
the structural index was measured by question 4 to 8 and fatalistic index was
measured by question 9 to 13. This questionnaire was used by a fieldworker to
interview 225 respondents and was done in the months of April and May 2013. The
language used in the questionnaire was English. In cases where the respondents did
not understand English the fieldworker interpreted from English to Sotho and
Tswana.
3.6 STATISTICAL ANALYSIS
This study used two steps of approaching statistical analysis, namely, factor analysis
and linear regression analysis. Factor analysis was used in determining how
respondents perceived causes of poverty, which were categorised into individualistic,
structural and fatalistic. The linear regression model measured the impact of socio-
economic and demographic factors on perceptions of causes of poverty. The
predominant index was regressed against a set of demographic variables to identify
the determinants that well explained the perceived causes of poverty. The next
section discusses the factor analysis and linear regression model.
3.6.1 Factor analysis
Factor analysis is a statistical method used when interpreting questionnaires (William
et al., 2012:2). It determines the nature of a relationship between variables (Beavers
et al., (2013:1). In determining the nature of relationship, factor analysis minimises a

Perceived causes of poverty in a South African Township 50
large number of variables into manageable variables called factors (William et al.,
2012:3). Two methods are used: exploratory and principal component analysis
(Suhr, 2005:1).
Khalife (2009:17) notes that three steps are used in factor analysis, namely the
sampling adequacy, factor extraction and the interpretation of the results. The work
of Comrey (1973) is mainly used in determining an adequate sample size, which is
the first step in factor analysis. Different sizes were identified: 100 by way of poor,
200 as fair, 300 good, 500 by way of very good and 1000 as excellent. The second
step is factor extraction where decisions are made as to what factors can be used in
factor analysis (Khalife, 2009:17). There are certain rules used in factor extraction,
such as Eigenvalue, percentage of variance and the Kronbach alpha. Percentage of
variance and eigenvalues helps in explaining and analysing the factors while
Kronbach alpha determines the reliability. The eigenvalue must be above 0.4 for a
factor to be meaningful. Interpretation, which is the last stage in the factor analysis,
includes identification of factors with higher and lower loadings (Khalife, 2009:26). It
is done after the identification of factor loadings using the theory underlying the
analysis as well as the meaning of variables (Khalife, 2009:26).
For the purpose of this study, Principal Component Analysis was used to determine
whether there was double factor counting. Thirteen factors were loaded in factor
analysis and grouped into three categories, namely individualistic, structural and
fatalistic. In addition, this study identified factors with higher and lower factor
loadings, with higher factor loadings denoting the greater degree at which a factor is
perceived as a cause of poverty and the opposite is true. An interpretation was then
provided using the eigenvalues, percentage of variance and the Kronbach alpha.
3.6.2 Linear regression model
A regression analysis is a statistical data analysis method used to analyse the
relationship between a dependent variable and independent variables. More
precisely, it identifies and characterises the nature of the relationship among
variables, estimates variables as well as predicting their behaviors. Artze (2010:3), in
support, notes that regression analysis estimates the values of the dependent
variable by the behavior of the independent variables.
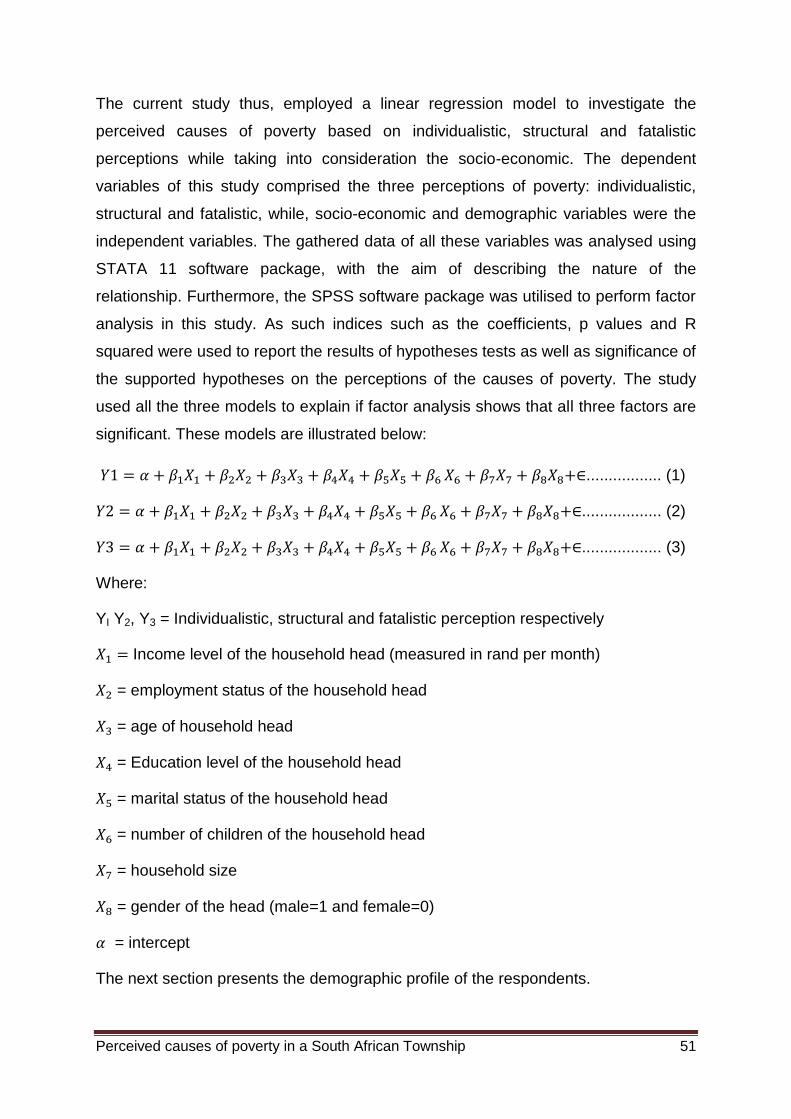
Perceived causes of poverty in a South African Township 51
The current study thus, employed a linear regression model to investigate the
perceived causes of poverty based on individualistic, structural and fatalistic
perceptions while taking into consideration the socio-economic. The dependent
variables of this study comprised the three perceptions of poverty: individualistic,
structural and fatalistic, while, socio-economic and demographic variables were the
independent variables. The gathered data of all these variables was analysed using
STATA 11 software package, with the aim of describing the nature of the
relationship. Furthermore, the SPSS software package was utilised to perform factor
analysis in this study. As such indices such as the coefficients, p values and R
squared were used to report the results of hypotheses tests as well as significance of
the supported hypotheses on the perceptions of the causes of poverty. The study
used all the three models to explain if factor analysis shows that all three factors are
significant. These models are illustrated below:
................. (1)
.................. (2)
.................. (3)
Where:
YI Y2, Y3 = Individualistic, structural and fatalistic perception respectively
Income level of the household head (measured in rand per month)
= employment status of the household head
= age of household head
= Education level of the household head
= marital status of the household head
= number of children of the household head
= household size
= gender of the head (male=1 and female=0)
= intercept
The next section presents the demographic profile of the respondents.

Perceived causes of poverty in a South African Township 52
3.7 THE DEMOGRAPHIC PROFILE OF KWAKWATSI TOWNSHIP
This section fully describes and analyses the demographic profile of the sampled
population. The profile includes the household size, various sources of income within
a household, employment, age, gender, marital status as well as education of
household heads. These factors were obtained from a review of relevant previous
studies such Mbele (2012), Sekhampu (2010) and Statistics South Africa.
3.7.1 Members of the household
Members of the household refer to the number of persons within a household. The
composition of household members is presented in Figure 3.1. As seen in Figure
3.1, the composition of household members comprise of mothers who account for
21.40 percent while fathers accounted for 17.20 percent of the total number of
household members in Kwakwatsi. The figure also shows that sons count for 16
percent of the total number of household members, while daughters count for 25
percent of household‟s members. Furthermore, the composition reveals that the
grandfathers and grandmothers account to 1.3% and 1.2% respectively. Uncles and
aunts also share a more or less distribution of 0.20% and 0.40% respectively.
Sekhampu (2010) found more or less similar trends in his study of the same area.
The study accounted to 17% fathers, 22% mothers, 25% daughters and 16% sons.
Stats S.A (2010) found that in the Free State mothers/wife, daughters, grandmother
and aunts equalled to 48.5%. These results are consistent with the current survey
findings.

Perceived causes of poverty in a South African Township 53
Figure 3.1: Composition of household members
Source: Survey data (2013).
3.7.2 Composition of household heads
The composition of household heads in this study refers to the respondents who
support their families. Figure 3.2, presents the composition of household heads and
reveals a higher percentage for fathers/husband (75.60%) relative to that of
mothers/wives (22.70%). The population of household head of daughters and
grandmothers is 1.30 percent and 0.40 percent respectively. The Stats S.A (2011)
shows a national household head composition of 60.6 percent males and 39.6
percent females. The Kwakwatsi figures are consistent with the national statistics
department figures. From the above trend, fathers/husbands are the most common
household‟s head in Kwakwatsi Township.
17.20%
21.40%
16%
24.90%
1.30% 1.20% 0.20% 0.40%
17.40%
0%
5%
10%
15%
20%
25%
30%

Perceived causes of poverty in a South African Township 54
Figure 3.2: Composition of households heads
Source: Survey data (2013).
3.7.3 Gender distribution of the population
Gender distribution of the population in this study describes the percentage of male
and female in Kwakwatsi Township. The results indicate that about 40 percent of the
population are males and 60 percent are female residents of Kwakwatsi Township.
In comparison to Stats S.A (2011), the national gender distribution was 48.2 percent
and 51.7 percent for males and females (gender) respectively. In both the national
survey and the current study‟s survey results there are more females than males.
3.7.4 Gender of household head
The gender of household head in this study refers to the percentage of males and
females who support their families. The results indicate that male household heads
account for 69.30 percent whilst the female household heads account for 30.70
percent. Stats SA (2008) reported that national male households head accounted for
61.1 percent, while females accounted for 38.9 percent. In 2011, Kwakwatsi
Township had a gender household head of 59.20% and 41.80% for male and
female, respectively (Stats S.A, 2011). The survey data suggests an increase in
male household head from 2011 to 2013 and a decrease in female household head
during the same period.
75.60%
22.70%
1.30% 0.40% 0%
10%
20%
30%
40%
50%
60%
70%
80%
Father/Husband Mother/Wife Daughter Grandmother

Perceived causes of poverty in a South African Township 55
3.7.5 Average household size
The household size refers to the number of respondents sampled for the current
study. Table 3.1, presents the average household size and reveals an average
household size of 4.39 members per household. The average household size in
2011 was 3.6 for South Africa (Economic update, 2012:2). In the average household
size the national figures had a similar make-up from the above trends.
Table 3.1: Household Average size
Demography Average household size
FHH 3.9
MHH 4.6
Total Average 4.39
Source: Survey data (2013).
3.7.6 Marital status of the population
The marital status of sampled population is shown in Figure 3.3. The figure shows
that 33.80 percent are children and not married. In addition, the figure reveals that
the greatest percentage of members is married 34.70 percent. The percentage of
those divorced and separated is 1.40 percent and 0.60 percent respectively. Those
who are widowed amount to 5.40 percent of the total number of the population. A
comparison with Stats S.A (2011:19) shows that those who were never
married/children are 61% whilst those who are married are 31% in the Free State
province. The national data does not correspond with the current survey results on
those who were never married but it corresponds with those who were married.

Perceived causes of poverty in a South African Township 56
Figure 3.3: Marital Status of the participants
Source: Survey data (2013).
3.7.7 Marital status of the household head
Figure 3.4 reports the marital status of household head in this study. The figure
indicates that the greatest percentage is the married/living together and is
represented by 70.60%. The widows amounted to 18.70% while the divorced
amounted to 4.90%. Household heads who reported that they were never married
accounted to 4% while those who were separated amounted to 1.80%. Booyson et
al., (2013:7) reported that a majority of household heads are married and are living
together, with single parents being the second highest. These results are in line with
the current survey results.
34.70%
1.40% 0.60%
5.40%
33.80%
0%
5%
10%
15%
20%
25%
30%
35%
40%
Married/Livingtogether
Divorced Separated Widower Child (notmarried)

Perceived causes of poverty in a South African Township 57
Figure 3.4: Marital status of the household head
Source: Survey data (2013).
3.7.8 Average length of stay in Kwakwatsi
Table 3.2 presents the average length of stay in Kwakwatsi. The figure shows that
54 percent of the households have moved to the township in the last ten years. As
also shown on the figure, approximately 19 percent of the respondents have been in
the township for a period of 21-25 years.
Table 3.2: Average length to stay
Average stay in years Frequencies Percentages
1-5 1 0.4
6-10 7 3.1
11-15 5 2.2
16-20 122 54.2
21-25 42 18.7
26-30 29 12.9
31-35 15 6.7
36-40 4 1.8
Source: Survey data (2013).
4.00%
70.60%
4.90% 1.80%
18.70%
0%
10%
20%
30%
40%
50%
60%
70%
80%
Never married Married/Livingtogether
Divorced Separated Widow/er

Perceived causes of poverty in a South African Township 58
3.7.9 Qualifications of the population at school
The education level of the population is presented in Figure 3.5. This Figure
indicates that all the enrolments of the school-attendance of the sampled population.
The majority of the school-going population is in the first three grades (32.42%).
Approximately 59 percent of the sample is still in primary school. The enrolment of
matric students/grade 12 is 10.09 percent, while for grade 8 to 11 combined is 30
percent. A lower percentage on tertiary education was recorded at 0.31 percent. A
comparison with the National Department of Education (2010:10) shows that primary
school enrolment is 88.6 percent whilst the grade 12 is at 17.12 percent and tertiary
accounts for 0.68 percent at national level.
Figure 3.5: Qualifications of the population in school
Source: Survey data (2013).
3.7.10 Qualification of the population out of school
Figure 3.8 presents the educational levels of the household members who are
school leavers in the sampled population. The grade 12 or higher educational
qualifications accounted for 14 percent among the sampled population, whilst the
32.42%
2.45%
6.73%
3.06%
15.29%
12.84%
3.36%
11.93%
1.53%
10.09%
0.31%
0%
5%
10%
15%
20%
25%
30%
35%

Perceived causes of poverty in a South African Township 59
grade 7 or those with lower educational qualifications amounted to 60 percent.
Approximately 5 percent of Kwakwatsi population has never gone to school while 22
percent has passed grade 8-11. Sekhampu (2010:128) shows more or less the same
percentage of grade 12. Stats SA (2009:51) also recorded a 27.7 percent on those
with grade 12 and higher education qualification. Thus, from the above statistics, it
can be seen that the higher level of education is increasing though it is not sufficient
for development.
Figure 3.6: Out of school population
Source: Survey data (2013)
3.7.11 Educational level of household head
Figure 3.7, reports on the educational level of the household head of the sampled
population. The figure shows that about (21%) attended school up to grade 3, about
(12%) up to grade 8 and (12%) matric, whilst 5 percent of the household heads had
no school. The highest percentage is (20.90%) for those who have grade 3.
Statistics SA (2012:13) reported that (5.7%) of household heads are without
education at national level. This is consistent with the (5%) from this current survey‟s
results for the households without schooling.
20.90%
16%
0.40%
18.70%
4.40%
11.60%
0.90%
3.60%
4.90%
12.40%
1.30%
4.90%
0% 5% 10% 15% 20% 25%
Up to grade 3 (std1)
Grade 4 (std 2)
Grade 5 (std 3)
Grade 6 (std 4)
Grade 7 (std 5)
Grade 8 (std 6)
Grade 9 (std7)
Grade 10 (std 8)
Grade 11 (std 9)
Grade 12 (std 10)
Tertiary first diploma
No schooling

Perceived causes of poverty in a South African Township 60
Figure 3.7: Educational level of household head
Source: Survey data (2013).
3.7.12 Employment status
The employment status of the sampled population is presented in Figure 3.8. As
shown in the figure, the unemployment rate of the sampled population is at 15.7
percent. On the contrary, approximately 12.2 percent of Kwakwatsi Township
households are formally employed while 72.1 percent are informally employed.
Statistics SA (2013) reported a decrease of 1.6 percent in the unemployment rate
and an increase of 6 percent in the informal sector jobs in Free State province for the
past year. The current national unemployment rate is approximately 25 percent,
whilst in Free State it is 31 percent.
20.90%
16%
0.40%
18.70%
4.40%
11.60%
0.90%
3.60%
4.90%
12.40%
1.30%
4.90%
0% 5% 10% 15% 20% 25%
Up to grade 3
Grade 4
Grade 5
Grade 6
Grade 7
Grade 8
Grade 9
Grade 10
Grade 11
Grade 12
Tertiary first diploma
No schooling

Perceived causes of poverty in a South African Township 61
Figure 3.8: Employment status
Source: Survey data (2013).
3.7.13 Duration of unemployment in years
Figure 3.9 presents the duration of unemployment of the respondents expressed in
years. The figure reveals that 19.77 percent of the unemployed respondents have
been without work for 2 years. Approximately 17 percent of the sampled population
has been unemployed for more than 10 years, whilst 15.12 percent has been
unemployed for about 5 years. 12.79 percent and 9.30 percent of the respondents
have been without work for 6 years and 4 years respectively. Sekhampu (2010)
found out that 34 percent of the population stayed more than 11 years without
employment.
12.2%
72.1%
15.7%
0% 10% 20% 30% 40% 50% 60% 70% 80%
Formally employed
Informal activities
Unemployed
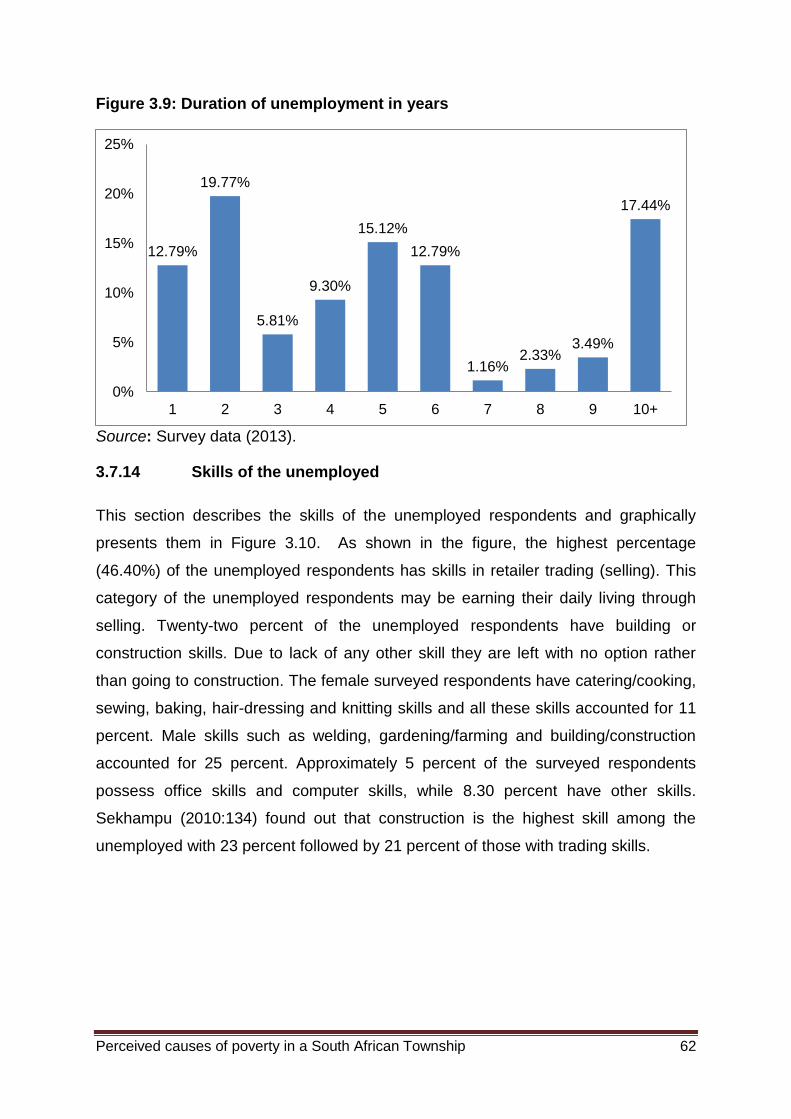
Perceived causes of poverty in a South African Township 62
Figure 3.9: Duration of unemployment in years
Source: Survey data (2013).
3.7.14 Skills of the unemployed
This section describes the skills of the unemployed respondents and graphically
presents them in Figure 3.10. As shown in the figure, the highest percentage
(46.40%) of the unemployed respondents has skills in retailer trading (selling). This
category of the unemployed respondents may be earning their daily living through
selling. Twenty-two percent of the unemployed respondents have building or
construction skills. Due to lack of any other skill they are left with no option rather
than going to construction. The female surveyed respondents have catering/cooking,
sewing, baking, hair-dressing and knitting skills and all these skills accounted for 11
percent. Male skills such as welding, gardening/farming and building/construction
accounted for 25 percent. Approximately 5 percent of the surveyed respondents
possess office skills and computer skills, while 8.30 percent have other skills.
Sekhampu (2010:134) found out that construction is the highest skill among the
unemployed with 23 percent followed by 21 percent of those with trading skills.
12.79%
19.77%
5.81%
9.30%
15.12%
12.79%
1.16% 2.33%
3.49%
17.44%
0%
5%
10%
15%
20%
25%
1 2 3 4 5 6 7 8 9 10+

Perceived causes of poverty in a South African Township 63
Figure 3.10: Skills of the unemployed
Source: Survey data (2013).
3.7.15 What are the unemployed doing?
This section describes what the unemployed are currently doing. Figure 3.11
illustrates what the unemployed are currently doing and shows that about 93.5
percent of these respondents are actively looking for a job. Most of them are looking
for jobs related to their skills and also seeking for any other employment. About 4
percent of the sampled population is helping the other employed households with
duties while 2.60 percent is just idle. According to Mbele (2012:63), in 2012, 79
percent of households were actively looking for a job, 17 percent were helping with
the household duties while 3 percent were just idle in Boitumelo area which is the
same setup with Kwakwatsi. The trends are more the same and they show that the
unemployed are looking for jobs related to the skills they have listed.
46.40%
7.10%
2.40%
2.40%
3.60%
1.20%
1.20%
21.40%
2.40%
1.20%
2.40%
8.30%
0% 10% 20% 30% 40% 50%
Retail trader (selling)
Catering / cooking
Sewing
Baking
Hair dressing
Knitting
Welding
Building / construction
Gardening / farming
Computer
Office
Other

Perceived causes of poverty in a South African Township 64
Figure 3.11 What are the unemployed doing
Source: Survey data (2013).
3.7.16 Employment status of household head
The employment status of the household heads is reported in Figure 3.12. An
analysis of the employed as shown by the survey results in Figure 3.12 shows that
50.70 percent of the household heads are informally employed whilst 22.20 percent
are formally employed. The figure further shows that about 23 percent of the
household heads are not economically active whilst 4.40 percent is unemployed.
93.50%
3.90% 2.60%
0%
10%
20%
30%
40%
50%
60%
70%
80%
90%
100%
Actively looking for a job Helping with householdduties
Idle

Perceived causes of poverty in a South African Township 65
Figure 3.12: Employment status of household head
Source: Survey data (2013).
3.7.17 Sector of employment for the employed
Figure 3.13 reports on the employed respondents‟ sectors of employment.
Approximately 55 percent of the surveyed respondents are employed in the following
sectors community, social, education, training and personal service. About 28
percent of the surveyed respondents are employed in other sectors which fall under
the informal sector. The wholesale, retail, trade and catering sectors accounted for
about 6 percent, agriculture accounted for 7 percent while construction, electricity,
manufacturing, mining and transport recorded about 5 percent in total (Stats SA,
2013). The national reports also showed that community, social, education, training
and personal service are the sectors which employs many people in the Free State
province (Stats SA, 2013). Thus, due to less economic and social activities
Kwakwatsi Township households relies on the informal sectors for survival.
22.20%
50.70%
4.40%
22.70%
0%
10%
20%
30%
40%
50%
60%
Formallyemployed
Informal activities Unemployed Not economicallyactive
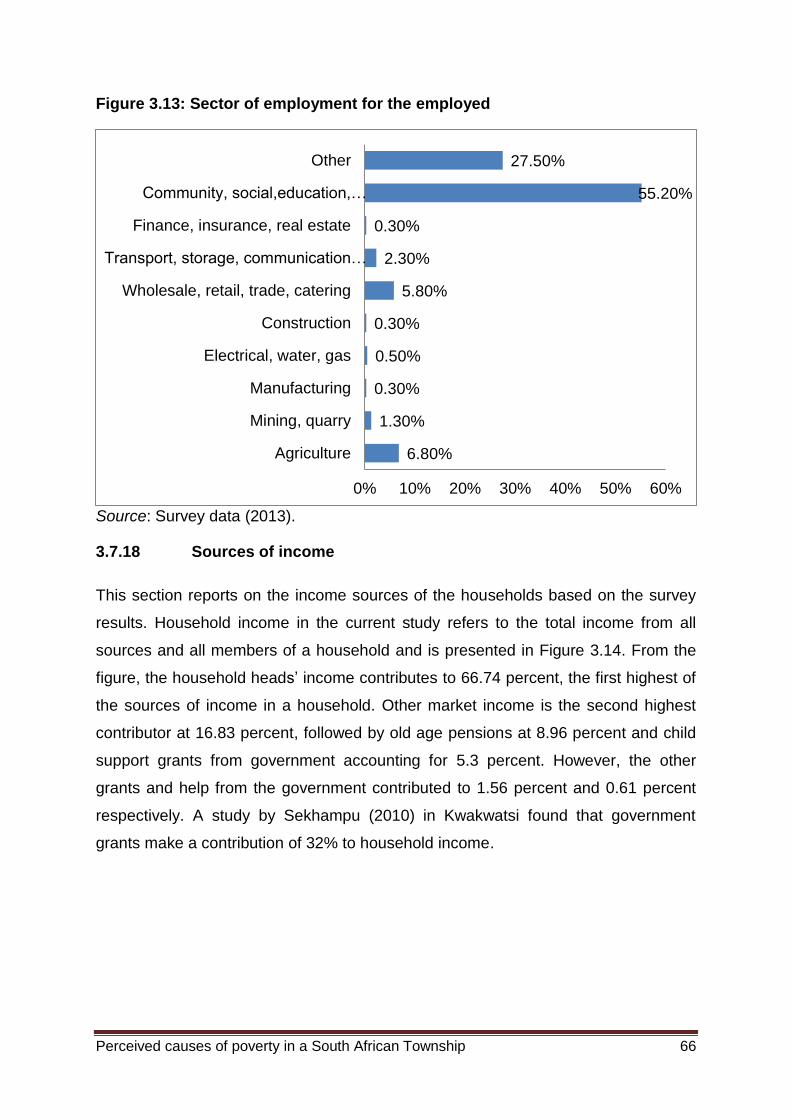
Perceived causes of poverty in a South African Township 66
Figure 3.13: Sector of employment for the employed
Source: Survey data (2013).
3.7.18 Sources of income
This section reports on the income sources of the households based on the survey
results. Household income in the current study refers to the total income from all
sources and all members of a household and is presented in Figure 3.14. From the
figure, the household heads‟ income contributes to 66.74 percent, the first highest of
the sources of income in a household. Other market income is the second highest
contributor at 16.83 percent, followed by old age pensions at 8.96 percent and child
support grants from government accounting for 5.3 percent. However, the other
grants and help from the government contributed to 1.56 percent and 0.61 percent
respectively. A study by Sekhampu (2010) in Kwakwatsi found that government
grants make a contribution of 32% to household income.
6.80%
1.30%
0.30%
0.50%
0.30%
5.80%
2.30%
0.30%
55.20%
27.50%
0% 10% 20% 30% 40% 50% 60%
Agriculture
Mining, quarry
Manufacturing
Electrical, water, gas
Construction
Wholesale, retail, trade, catering
Transport, storage, communication…
Finance, insurance, real estate
Community, social,education,…
Other
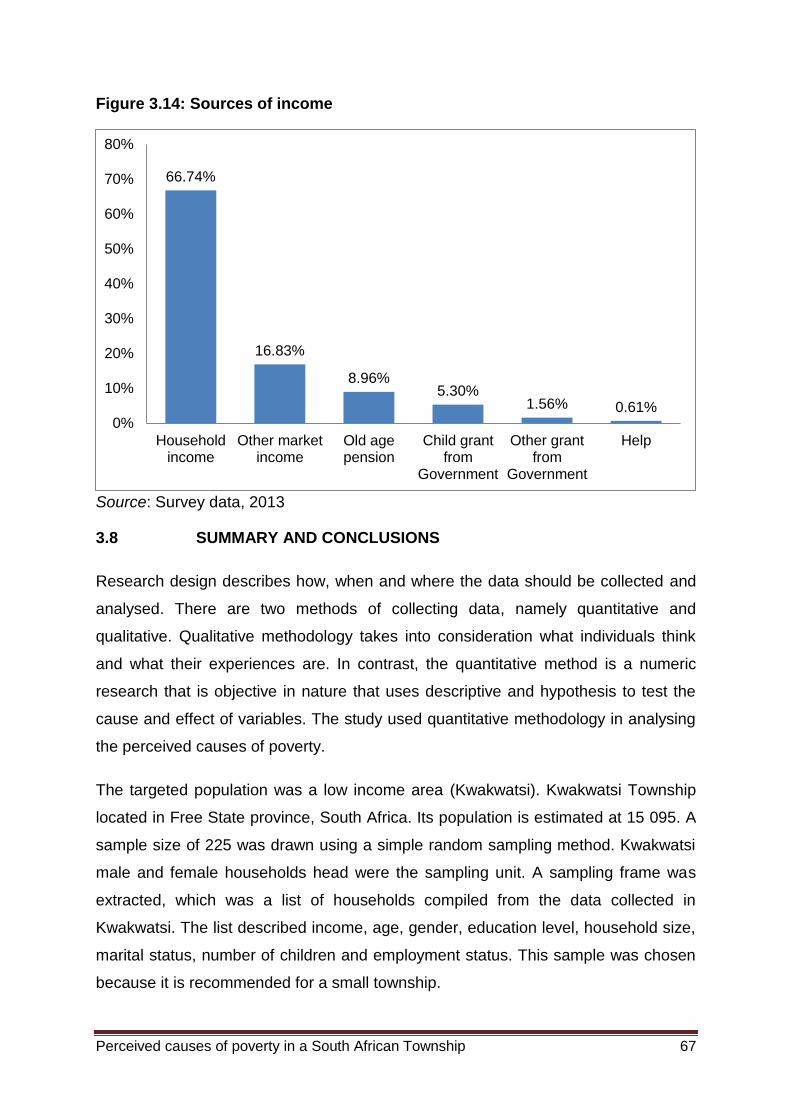
Perceived causes of poverty in a South African Township 67
Figure 3.14: Sources of income
Source: Survey data, 2013
3.8 SUMMARY AND CONCLUSIONS
Research design describes how, when and where the data should be collected and
analysed. There are two methods of collecting data, namely quantitative and
qualitative. Qualitative methodology takes into consideration what individuals think
and what their experiences are. In contrast, the quantitative method is a numeric
research that is objective in nature that uses descriptive and hypothesis to test the
cause and effect of variables. The study used quantitative methodology in analysing
the perceived causes of poverty.
The targeted population was a low income area (Kwakwatsi). Kwakwatsi Township
located in Free State province, South Africa. Its population is estimated at 15 095. A
sample size of 225 was drawn using a simple random sampling method. Kwakwatsi
male and female households head were the sampling unit. A sampling frame was
extracted, which was a list of households compiled from the data collected in
Kwakwatsi. The list described income, age, gender, education level, household size,
marital status, number of children and employment status. This sample was chosen
because it is recommended for a small township.
66.74%
16.83%
8.96% 5.30%
1.56% 0.61% 0%
10%
20%
30%
40%
50%
60%
70%
80%
Householdincome
Other marketincome
Old agepension
Child grantfrom
Government
Other grantfrom
Government
Help

Perceived causes of poverty in a South African Township 68
The study used a questionnaire to measure perception causes of poverty. The
questionnaire was divided into two sections. Section A was composed of socio-
economic and demographic characteristics, such as income, age, gender, education
level, household size, marital status, number of children and employment status.
Section B of the questionnaire measured the perceptions as to the causes of
poverty. A study borrowed reasons why people think they are poor from Feagin.
Thirteen questions were asked why, and respondents responded using a Likert scale
of 5, 1 strongly disagrees and 5 strongly agree.
Two statistical approaches were used, namely the factor analysis and linear
regression analyses. Factor analyses used three indices: individualistic, structural
and fatalistic indexes in an attempt to investigate how respondents perceive causes
of poverty. It used Principal Component Analysis (PCA) which determined the
reliability and dimensionality of the study. To determine dimensionality and reliability,
thirteen factors were loaded into factor analyses according to three indices and PCA
was used to check double counting of factors. In addition, eigenvalue, percentage of
variance and Kronbach alpha were used in analysing the data. The linear regression
model deals were also used to investigate the perceived causes of poverty and
socioeconomic variables. However, the literature has shown that education was
perceived in structural perception, while gender was perceived in in all the three
perceptions. In addition, employment status perceived causes of poverty in both
structural and individualistic perception.
The demographic profile such as household size, various sources of income within a
household, employment, age, and education of household members, number of
children within a household and marital status and gender of the household head
were described. The Kwakwatsi population is 15 095 and an average household size
is calculated at 4.39. The average household size for the nation was 4 in 2011. This
shows an increase in the average households. In this population, there are more
mothers than fathers, 21.4 percent and 17.2 percent respectively. In Kwakwatsi, 60
percent are females and 40 percent are males. Sixty-nine percent of the sampled
population are male household heads whilst thirty-one percent are females. About 54
percent of the sampled population moved into Kwakwatsi in the past 10 years.
Approximately 54 percent of the population comprises of primary school students

Perceived causes of poverty in a South African Township 69
and 10 percent are matriculates. 0.31 percent represents the educational level of the
household head is 14 percent matric and who went to tertiary while 5 percent have
not gone to school.
The Kwakwatsi unemployment status of the sampled population was calculated at
15.7 percent compared to national figures‟ unemployment rate, which is 25 percent
in 2013. For those who are employed 12.2 percent are formally employed whilst 72.1
percent are informally employed. About 18 percent went unemployed for 2 years
while 17 percent of the sampled population has been without work for more than 10
years.
The majority of Kwakwatsi sampled population are informally employed. The
description shows that the unemployed possess skills in retailer trading 46 percent,
building 21 percent, catering 7 percent and hairdressing 4 percent. Most of the
unemployed 94 percent are looking for jobs, while 4 percent are helping the
household head with daily duties at home and 2 percent is just idle at home. The
employment status of household head indicates that 51 percent are informally
employed while 22 percent are formally employed. About 23 percent are
economically inactive. Fifty five percent is employed in the community, social,
education, training and personal service, whilst 28 percent is employed in other
sectors. Some are in wholesale, retail trading, catering and agriculture at 13 percent
whilst transport, construction, electricity and mining are 5 percent. The employed get
their sources of income from household income, market income, old age pensions
and child grants. Household income is the most household source at 67 percent.
Market income 17 percent, old age pensions 9 percent and child grants 5.3 percent.

Perceived causes of poverty in a South African Township 70
4 CHAPTER 4: THE PERCEIVED CAUSES OF POVERTY
4.1 INTRODUCTION
Poverty is a complex concept that is associated with many definitions and causes.
As earlier noted the causes of poverty are perceived in different ways depending on
various factors, such as geographical location and socio-economic variables of the
respondents. This chapter presents results on how the residents of Kwakwatsi
Township perceive the causes of poverty. It is divided into two sections; the first
section reports on the three dimensions of perceived poverty causes including the
individualistic, structural and fatalistic, using factor analysis. The second section
presents the impact of socio-economic and demographic factors on individualistic,
structural and fatalistic perceptions using the linear regression model.
4.2 DETERMINATION OF THE PERCEIVED CAUSES OF POVERTY
Following the works of Feagin (1975), three dimensions were used to measure the
perceived causes of poverty and these encompassed individualistic, structural and
fatalistic perceptions. The individualistic dimension inquired whether the surveyed
households perceive poverty as an effect of three individual factors, namely:
“wasting money on inappropriate items”, “not actively seeking to improve
themselves” and lacking the ability to improve themselves”. This means that the
score for the individualistic dimension was expected to range from 3 (minimum) to 15
(maximum). The fatalistic index inquired whether the surveyed households perceive
poverty as an effect of five individual factors, namely: “lack of luck”, “not motivated
because of welfare”, “have encountered misfortunes”, “have bad fate” and “are born
inferior”. This implies that the score for this dimension was expected to range from 5
to 25 scores. The structural index inquired whether the surveyed households
perceive poverty as an outcome of structural factors such as: “lack social justice”,
“lacking opportunities because they were born in poor families”, “they are born in
places where they have no opportunities”, “distribution of wealth is uneven” and “the
rich exploits the poor”. This dimension was expected to range between 5 and 25
scores. Generally, all the three dimensions generated 13 questions which were
loaded in the factor analysis for reliability and dimensionality using the Principal
Component Analysis and Varimax rotation. Table 4.1 shows that the Kaiser-Meyer-

Perceived causes of poverty in a South African Township 71
Olkin Measure of Sampling Adequacy (KMO) is 0.66, which is above 0.6 suggested
by Pallant (2013:199) and that the Bartlett`s Test of Sphericity value is 0.000. Thus,
the data is appropriate for factor analysis, since both the Kaiser-Olkin Measure of
Sampling Adequacy and the Bartlett`s Test of Sphericity are significant.
Table 4.1: KMO and Bartlett`s test of Sphericity
Kaiser-Meyer-Olkin Measure of Sampling Adequacy 0.66
Bartlett`s Test of Sphericity 0.000
Source: Survey data (2013)
4.2.1 Principal Component Analysis (PCA)
In this study, PCA was used to investigate the perceptions of poverty. The principal
component known as factor analysis mainly explains the relationship between
variables in assessing the dimensionality and reliability. Dimensionality and reliability
were achieved by significant Kaiser-Oklin Measure and Bartletts Test which showed
significant results. Furthermore, 13 items were loaded into PCA with the Varimax
rotation. Results for the eigenvalue and the percentage of variance are shown in
Table 4.2. All the eigenvalues of more than 1 are considered valid when using the
Kaiser`s criterion. Component 1 (Individualistic perception) recorded an eigenvalue
of 2.610 and a percentage of variance of (20.07%). Component 2 (Fatalistic index)
recorded eigenvalue of 2.419, which is above 1 and percentage of variance of
(18.61%). Component 3 (structural index) has an eigenvalue of 1.987 and a
percentage of (15.286%). From the above results all the eigenvalues are above 1. A
similar study done by Davids (2010) on the perceived causes of poverty (using a
national dataset for South Africa) has also shown high eigenvalues in all the three
components. The study also used factor analysis (Principal Component Analysis and
the Varimax rotation) to determine dimensionality and reliability. The three
components recorded eigenvalues of above 1, fatalistic index with eigenvalue of
3.492 and (29.10%) variance, structural index with eigenvalue 2.071 and 17.25
variance and individualistic index with an eigenvalue of 1.55 and 12.91 percent of
variance. In total all the three components explain about (54%) of the common
variance and thus confirms the reliability and dimensionality of the three
components.

Perceived causes of poverty in a South African Township 72
Table 4.2: Total variance explained
Component Rotation Sums of squared Loadings
Eigenvalue % of Variance
1 2.610 20.073
2 2.419 18.606
3 1.987 15.286
Source: Survey data (2013).
The findings of the PCA for all factors are presented in Table 4.3. The table shows
that all the loaded 13 items generate three components. As earlier noted, component
1 includes 4 variables “namely: “waste money on inappropriate items” (0.807), “not
actively seek to improve themselves” (0.801), “the rich exploit the poor‟ (0.761), and
“lacking the ability to manage money” (0.694). In the previous section, the
individualistic perception comprised three items nevertheless; a fourth item on “the
rich exploiting the poor” was added to the individualistic perception from structural
perception. This was mainly because the added item is closely associated with
individualistic views rather than structural causes, which contradicted the theory. The
theory suggested that the item of „the rich exploiting the poor‟ is a structural factor
but the participants of this study perceived it in an individualistic dimension. The
Kronbach`s Alpha was used to measure internal reliability in this study, and it
accounted for 0.8, which exceeded the recommended threshold of greater than 0.5.
Thus, the first component (individualistic perceptions) of the current study is
internally reliable.
The factors in the second component include: “lack luck” (0.735), “not motivated by
welfare” (0.687), “have encountered misfortunes” (0.681), “have bad fate” (0.556)
and “are born inferior” (0.493). These factors refer to fatalistic causes of poverty and
are in line with the theory. The Kronbach`s Alpha for this component accounted for
0.622 which is above 0.5 suggested by (Pallant, 2013:199) and therefore, suggests
good internal consistency. The third component which related to structural
perceptions of poverty, shows that; „lack social justice‟ (0.325), „lacking opportunities
due to the fact that they are born in poor families‟ (0.735), „they live in places they
not many opportunities‟ (0.703) and „distribution of wealth is uneven‟ (0.634). The
results have shown that the structural component is composed of 4 factors instead of

Perceived causes of poverty in a South African Township 73
5 identified by theory, as discussed in Section 3.4 of Chapter 3. The factor of “being
exploited by the rich” was categorised as an individualistic perception of the causes
of poverty in the PCA results. The structural Kronbach`s Alpha was at 0.69, which
suggests good reliability of the data.
The literature review has shown that perceptions of the causes of poverty are
grouped in a similar way to the results of this study: individualistic, structural and
fatalistic (Hunt, 2004; Shek, 2004; Sun, 2001; Davids, 2010; Wollie, 2009). These
studies used PCA to group factors into three dimensions of the perceptions of the
causes of poverty. The difference between these studies and the current is that one
item was found in the group of individualistic perceptions of the causes instead of in
structural perceptions after the PCA.
Table 4.3: PCA of perceptions of the causes of poverty
Reasons why poor people are poor Components
1 2 3
Factor 1: Individualistic
They waste money on inappropriate items 0.807
They do not actively seek to improve themselves
0.801
They are exploited by rich people 0.761
They lack the ability to manage money 0.694
Factor 2: Fatalistic
They lack luck 0.735
They are not motivated because of welfare 0.687
They have encountered misfortune 0.681
They have bad fate 0.556
They are born inferior 0.493
Factor 3: Structural
The society lacks social justice 0.325
They lack opportunities due to the fact that they born in poor families
0.733
They live in places where they are not many opportunities
0.703
Distribution of wealth is uneven 0.634
Kaiser-Meyer Olkin Measure 0.665 0.665 0.665
Kronbach`s Alpha 0.8 0.622 0.69
Source: Survey data (2013).

Perceived causes of poverty in a South African Township 74
4.2.2 How do Kwakwatsi households perceive the causes of poverty?
Table 4.4 presents results in relation to the three perceptions of poverty mean scores
and their standard deviations. The results show that the individualistic perceptions
recorded a mean of 3.631 and a standard deviation of 0.964, whilst fatalistic
perceptions recorded a mean of 3.248 and a standard deviation of 0.879. The
structural perceptions recorded a mean of 3.134 and a standard deviation of 0.926.
From the above results, the respondents are inclined to first see poverty as being
individualistic, structural and then as a fatalistic problem. Moreover, the highest
standard deviation was recorded in individualistic perception (0.984) compared to
fatalistic and structural, 0.877 and 0.782 respectively. This implies that the variations
in the individualistic dimension were more than the variations in both the fatalistic
and structural dimensions. Furthermore, the differences in all the three perceptions
of the causes of poverty are reasonably small. Therefore, in light of the above results
one can conclude that the Kwakwatsi household heads tend to perceive the causes
of poverty as individualistic rather than structural and fatalistic.
Table 4.4: Perceptions of the causes of poverty
Indices Number Mean Standard Deviation
Individualistic index 225 3.631 0.964
Fatalistic index 225 3.134 0.879
Structural index 225 3.248 0.926
Source: Survey data (2013)
4.2.3 Descriptive analysis of responses to the three indices
The table 4.5 shows responses of the surveyed households to each factor that
causes poverty. Under individualistic, fifty-two percent of the sampled population
agreed that they lack the ability to manage money and about twenty-nine percent
disagreed and strongly disagreed. The respondents also agreed that poverty is
caused by wasting their money on inappropriate items (81.8%), whilst (6%) disagree.
The fact that the rich exploit the poor was seen as an individualistic factor by the
respondents with a subscription of (71%) whilst, (27%) percent disagreed and
strongly disagreed. This suggests that the participants think that the poor‟s

Perceived causes of poverty in a South African Township 75
exploitation by the rich is individualistic and not inherent in the system of the country.
Lastly, on the individualistic perceptions related to the poor not seeking to improve
themselves, about (71%) agreed to the fact that they do not seek to improve
themselves, while about (25%) disagreed. In comparison to Davids (2010:19), three
items influenced the individualistic perception, whilst the present study had four
items. The similarity of the study is seen on the factor that “they waste money on
inappropriate items” which contributes most to the individualistic factors perceived to
be causing poverty.
In terms of fatalistic causes of poverty, it is evident that the notion that “the poor were
born inferior” was the most chosen factor by the participants. At least, 70 percent of
the respondents agreed that the poor were born inferior whilst about twenty-nine
percent disagreed. A Greater percentage (63%) of these households agreed to the
fact that the poor were not motivated by the welfare system. In contrast, about (31%)
disagreed and strongly disagreed to the fact that they are not motivated by welfare. It
is also evident that about (48%) of the participants disagreed that bad fate was the
cause of the poor‟s poverty predicament. About (55%) perceived poverty as a result
of bad luck, while 48% of the participants viewed it as a result of bad fate. These
results suggest that in Kwakwatsi Township the fatalistic perceptions of the causes
of poverty seem to be dominated by items of being born inferior, welfare and
misfortune. This is similar to other studies (Zucker & Weiner, 1993; Halman &
Oorschot 2010) which concluded that under the fatalistic dimension, with factors
such as “the poor are poor because they were born inferior”, “welfare dependency”
and “misfortunes” were more prevalent.
In structural perceptions, the majority were inclined to lack social justice in society.
About 68 percent at least agreed that the society lacks social justice, whilst about
(29%) disagreed. In addition, the participants ascribed to the unfair distribution of
wealth, which accounted for about 58 percent as the cause of poverty, with 38
percent of the households strongly disagreeing. Forty-seven percent disagreed that
the poor live in places where they have no opportunities, whilst about 48 percent
ascribed to the lack of opportunities for the poor to improve themselves as a
perceived cause of their poverty. About 4 percent remained neutral to the fact that
the poor live in places where there are no opportunities. Furthermore, about 52

Perceived causes of poverty in a South African Township 76
percent strongly agreed that the poor lack opportunities due to the fact that they
were born in poor families, whilst 6 percent remained neutral. In contrast, 42 percent
strongly disagreed that poor people lack opportunities because of being born in poor
families. These results imply that the Kwakwatsi Township households perceive the
causes of poverty from a structural dimension, as shown in similar studies which also
perceived structural factors as the causes of poverty (Davids, 2010; Oorschot and
Halman, 2010:1 and Halman & Oorschot, 1999)
Table 4.5: Response to the three indices (percent)
Reasons why poor people are poor
Strongly disagree
Disagree Neutral Agree Strongly agree
Individualistic Causes
they lack the ability to manage money
13.3% 15.6% 4.9% 52.4% 13.8%
they waste their money on inappropriate
3.1% 12.9% 3.1% 40.4% 40.4%
they do not seek to improve their lives
7.1% 23.1% 6.7% 47.1% 16%
they are exploited by rich people
9.8% 15.1% 4.4% 36% 34.7%
Fatalistic Causes
they lack lucky 18.2% 25.8% 2.2% 35% 19.1%
they are not motivated because of welfare
11.6% 20.4% 2.2% 48% 17.8%
they have encountered misfortune
13.3% 19.6% 3.6% 49% 14.7%
they have bad fate 19.1% 28% 4.9% 36% 11.60%
they are born inferior 12% 16.9% 1.3% 50% 20%
Structural Causes
the society lacks social justice 12% 27.1% 2.7% 42.7% 15.6%
they lack opportunities due to poor families
16.9% 25.8% 5.8% 40% 11.6%
they live in places without opportunities
18.7% 28% 4.4% 31% 17.9%
distribution of wealth in the society is uneven
16% 21.8% 4.4% 35.6% 22.2%
Source: Survey data (2013).

Perceived causes of poverty in a South African Township 77
4.3 HOUSEHOLD FACTORS AND PERCEPTIONS OF THE CAUSES OF
POVERTY
This section provides a descriptive analysis of the link between the participants‟
perceived causes of poverty and socio-economic and demographic factors, such as
household size, age, educational level, marital status, income and gender of
household head. The main objective of this section is to identify socio-economic and
demographic variables that may have influenced the outcomes on the perceived
causes of poverty. The mean scores were used to identify those who perceived
poverty in individualistic, structural and fatalistic terms. If the mean of a household
was less than the mean of an index then they perceive poverty otherwise. The higher
the mean of an individual, the more they perceive poverty in that particular category
i.e. individualistic, structural or fatalistic.
4.3.1 Gender and perceptions of the causes of poverty
The data in Table 4.6 show gender distribution of individualistic perception of the
causes of poverty. Table 4.6 reports the number of males and females who are
inclined to individualistic and not to individualistic perceptions. Table 4.1 shows that
out of 100 males in the sample, 52 percent perceive poverty to be an individual
problem; whilst 48 percent do not perceive poverty as an individual problem. For
females out of 100, 48 percent of them are inclined to individualistic perception,
whilst 52 percent do not perceive causes of poverty as individualistic. These results
show that there are more males who ascribed to poverty being an individual's
predicament compared to females. Similar studies (Buz et al., 2005 & Cozzarelli,
2001) have shown that males were more inclined to blame an individual for not
improving his/ her economic situation compared to females.
Table 4.6: Gender and individualistic perception
Gender of the Household head
individualistic perception
Otherwise (Do not perceive poverty as individualistic)
Yes (perceive poverty as individualistic)
Number Percentage Number Percentage
Male 75 48.1% 81 51.9%
Female 36 52.2% 33 47.8%
Source: Survey data (2013

Perceived causes of poverty in a South African Township 78
Table 4.7 reports the gender distribution of structural perceptions of the causes of
poverty. It shows that 75 percent of males do not perceive causes of poverty as
structural, whilst 25 percent perceive causes of poverty in structural perception. For
females, 65 percent do not blame the structural dimension for their poverty, whilst
about 35 percent blame the causes of poverty as structural. From the results above,
it is evident that both males and females do not see poverty in structural causes of
poverty. However, other studies found that males are more inclined to think that the
structure of a society has an impact on a person‟s economic status, compared to
females (Hunt, 1996; Morcoi, 1997; Sun, 2001).
Table 4.7: Gender and structural perception
Gender of the Household head
Structural perception
Not inclined structural perception
Inclined with structural perception
Number Percentage Number Percentage
Male 117 75% 39 25%
Female 45 65.2% 24 34.8%
Source: Survey data (2013).
Table 4.8 presents a summary of gender and fatalistic perceptions. Table 4.8 shows
that more males (71.2%) do not perceive the causes of poverty as a fatalistic
perception, while a less number of males (about 29%) perceive causes of poverty as
fatalistic. Females have the highest percentage (80%) that does not subscribe to a
fatalistic perception, whilst 20% subscribed to fatalistic perception. The results show
that both males and females are less inclined to a fatalistic perception. A similar
study by Sun (2001:166) found similar results that males are more inclined to
fatalistic perception than females.
Table 4.8: Gender and fatalistic perception
Gender of the Household head
Fatalistic perception
Otherwise (Not inclined to fatalistic perception)
Yes (inclined to fatalistic perception)
Number Percentage Number Percentage
Male 111 71.2% 45 28.8%
Female 55 79.7% 14 20.3%
Source: Survey data (2013).

Perceived causes of poverty in a South African Township 79
From the above results, males are more inclined to individualistic perception
compared to females. In contrast, both males and females did not subscribe to
structural and fatalistic perceptions. The findings of the current study correspond with
the findings of other researchers (Buz et al., 2005 & Cozzarelli, 2001) that males are
more individualistic than females. On the other hand, the results of gender
distribution of fatalistic and structural perceptions are different to other studies
(Klueel, 1986; Hunt, 1996; Morcoi, 1997; Sun, 2001) which found that males are
more structural and fatalistic than females.
4.3.2 Household size and perceptions of the causes of poverty
There are greater variations between the size of a household and the three
dimensions of poverty (individualistic, structural and fatalistic perceptions). Table 4.9
presents results on household size and individualistic perception. This section
describes the relationship between the number of household members and how they
perceive the causes of poverty. Household sizes of 1 and 2-4 see poverty as causes
by individualistic factors (60%). In larger households (5-7 and 8+), smaller
percentages (41% and 44%) think poverty is an individualistic problem. From these
results, one can conclude that individualistic factors are negatively related with an
increase in household size: smaller households blame the individual for being poor
while larger households do not agree with that way of thinking. These results are
similar to findings by Gustafsson (2006:10-11) who concluded that households with a
bigger size appear to be poor and tend to blame others for their poverty. This seems
to be the case with the present study in Kwakwatsi.
Table 4.9: Household size and individualistic perception
Household Size
Individualistic perception
Otherwise (Inclined to individualistic perception)
Yes (Individualistic perception)
Number Percentage Number Percentage
1 3 40% 4 60%
2-4 49 41.5% 69 58.5%
5-7 55 59.1% 38 40.9%
8+ 5 55.6% 4 44.4%
Source: Survey data (2013).
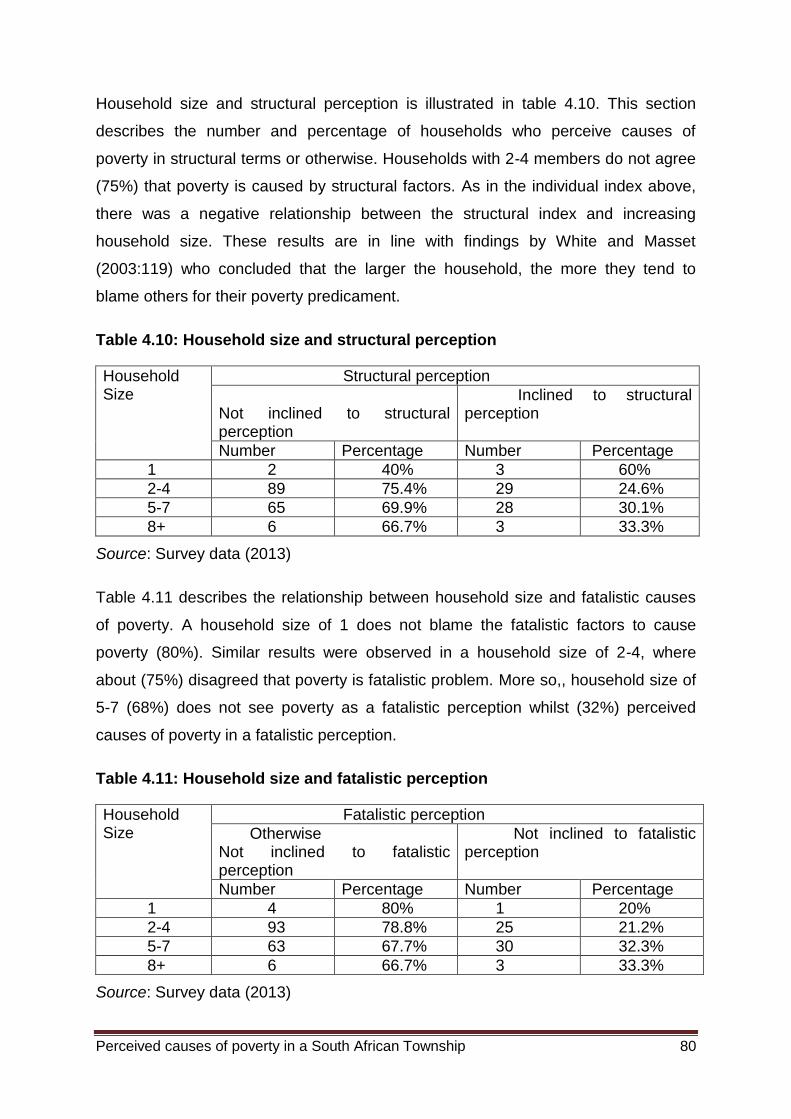
Perceived causes of poverty in a South African Township 80
Household size and structural perception is illustrated in table 4.10. This section
describes the number and percentage of households who perceive causes of
poverty in structural terms or otherwise. Households with 2-4 members do not agree
(75%) that poverty is caused by structural factors. As in the individual index above,
there was a negative relationship between the structural index and increasing
household size. These results are in line with findings by White and Masset
(2003:119) who concluded that the larger the household, the more they tend to
blame others for their poverty predicament.
Table 4.10: Household size and structural perception
Household Size
Structural perception
Not inclined to structural perception
Inclined to structural perception
Number Percentage Number Percentage
1 2 40% 3 60%
2-4 89 75.4% 29 24.6%
5-7 65 69.9% 28 30.1%
8+ 6 66.7% 3 33.3%
Source: Survey data (2013)
Table 4.11 describes the relationship between household size and fatalistic causes
of poverty. A household size of 1 does not blame the fatalistic factors to cause
poverty (80%). Similar results were observed in a household size of 2-4, where
about (75%) disagreed that poverty is fatalistic problem. More so,, household size of
5-7 (68%) does not see poverty as a fatalistic perception whilst (32%) perceived
causes of poverty in a fatalistic perception.
Table 4.11: Household size and fatalistic perception
Household Size
Fatalistic perception
Otherwise Not inclined to fatalistic perception
Not inclined to fatalistic perception
Number Percentage Number Percentage
1 4 80% 1 20%
2-4 93 78.8% 25 21.2%
5-7 63 67.7% 30 32.3%
8+ 6 66.7% 3 33.3%
Source: Survey data (2013)

Perceived causes of poverty in a South African Township 81
4.3.3 Age and perceptions of the causes of poverty
Age also relates to individualistic, structural and fatalistic perceptions. Table 4.12
presents the number of respondents who agree and disagree to individualistic
factors as cause of poverty. An early age of 20-30 and old age of 71-80 seem to be
undecided on individualistic causes of poverty (50% agreed, while the other 50%
disagreed). The highest percentage was recorded between the ages of 31-40, where
64% perceived the causes of poverty to be individualistic. Nasser et al., (2005) notes
that early age and old age people perceived causes of poverty to have an
individualistic perception.
Table 4.12: Age and individualistic perception
Age of then Household head
individualistic perception
Otherwise Not inclined to individualistic perception
Yes Inclined to individualistic
Number Percentage Number Percentage
20-30 1 50% 1 50%
31-40 19 35.8% 34 64.2%
41-50 50 50.5% 49 49.5%
51-60 25 55.6% 20 44.4%
61-70 10 71.4% 4 28.6%
71-80 6 50% 6 50%
Source: Survey data (2013)
Table 4.13 describes age and structural perception of the causes of poverty.
Participants aged between 20-30 years perceived causes of poverty as being a
structural perception and (100%) was recorded. In contrast, other age categories do
not perceive structural perception as a cause of poverty. Household heads between
ages of 31-40 did not perceive poverty in a structural perception; only 24% favoured
perceptions of the causes of poverty. Similar result was observed between the ages
of 51-80 years where all are not inclined to structural perceptions. A study done by
Shek (2002:90) found that lower aged participants have a strong belief in structural
perceptions due to lower levels of satisfaction in their daily life. These results are in
line with the current observation since an early age ascribes to structural perceptions
and declines with increasing age. In addition, Wollie (2009:251) found that the youth
are inclined to have a structural perception of poverty.

Perceived causes of poverty in a South African Township 82
Table 4.13: Age and structural perception
Age group Structural perception
Otherwise
Yes
Number Percentage Number Percentage
20-30 0 0% 2 100%
31-40 40 75.5% 13 24.5%
41-50 71 71.7% 28 28.3%
51-60 33 73.3% 12 26.7%
61-70 9 64.3% 5 35.7%
71-80 9 75% 3 25%
Source: Survey data (2013).
Table 4.14 gives the results of age and fatalistic perceptions‟. Participants between
20-30 years subscribed to both fatalistic causes of poverty (50% agreed, with 50%
disagreeing). About (87%) of those aged between 31-40 years disagree that poverty
is a fatalistic phenomenon. All age groups from 51-80 years were not inclined to
fatalistic perceptions. An empirical literature review (Shek, 2002:290) indicates that
the youth or early age perceived causes of poverty in fatalistic perception terms due
to having less control of events in their life. In addition, old age (females) in China
perceived causes of poverty in fatalistic terms. This was due to lack of opportunities
and transmission by their family.
Table 4.14: Ages and fatalistic perception
Age of then Household head
Fatalistic perception
Otherwise
Yes
Number Percentage Number Percentage
20-30 1 50% 1 50%
31-40 46 86.8% 7 13.2%
41-50 73 73.7% 26 26.3%
51-60 30 66.7% 15 33.3%
61-70 8 57.1% 6 42.9%
71-80 8 66.7% 4 33.3%
Source: Survey data (2013).
4.3.4 Marital status and perception of the causes of poverty
Marital status, married and not married, influence individualistic, structural and
fatalistic perceived causes of poverty. Table 4.15 presents the marital status of the
participants and an individualistic index. It reports the number and percentage of

Perceived causes of poverty in a South African Township 83
married and not married, and how they perceive the causes of poverty. The majority
of those who were married (55%) disagree with the view that poverty is an
individualistic problem. Similarly, those who are not married (47%) are not
individualistically inclined compared to (43%). The above results shows that both
married and not married participants do not perceive poverty to be caused by an
individual‟s characteristics.
Table 4.15 Marital status and Individualistic perception
Marital status of then Household head
individualistic perception
Otherwise
Yes
Number Percentage Number Percentage
Married 36 54.5% 30 45.5%
Not married 75 47.2% 84 42.8%
Source: Survey data (2013).
Table 4.16 shows the results of marital status and structural perception of poverty.
About 68% of disagreed that poverty is caused by structural factors, whilst about
33% agreed. Not married individuals present more similar results, with 74% not
agreeing. From the results above, one can conclude that both married and not
married do not perceive causes of poverty in structural terms.
Table 4.16: Marital status and individualistic perception
Marital status of then Household head
structural perception
Otherwise
Yes
Number Percentage Number Percentage
Married 44 66.7% 22 33.3%
Not married 118 74.2% 41 25.8%
Source: Survey data (2013)
Table 4.17 presents the marital status of the participants and fatalistic perceptions.
About 76% of the married were not inclined to fatalistic perceptions. The same
finding was evident in the unmarried group – 73% were found to disagree with the
thinking that poverty is a fatalistic problem.

Perceived causes of poverty in a South African Township 84
Table 4.17: Marital status and fatalistic perception
Marital status of then Household head
Fatalistic perception
Otherwise
Yes
Number Percentage Number Percentage
Married 50 75.8% 16 24.2%
Not married 116 73% 43 27%
Source: Survey data (2013)
4.3.5 Educational level and perceptions of the causes of poverty
The education level is also found to influence how individuals perceive the causes of
poverty. Table 4.18 reports the educational level and individualistic perception. It
illustrates how respondents with primary, secondary, tertiary education and those
who are not educated perceive causes of poverty. Participants with primary
education perceived poverty as individualistic (50%) and otherwise (50%). Those
with secondary education were inclined to individualistic perception (54%), whilst
those who went to colleges, universities do not see poverty as individualistic (58). In
contrast, those who never went to school failed to blame themselves (56%) while
(44%) see poverty as an individualistic phenomenon. Wollie (2009:267) found that
secondary school participants were a group more inclined to perceive poverty in
individualistic terms.
Table 4.18: Educational level and individualistic perception
Educational level of the Household head
individualistic perception
Otherwise
Yes
Number Percentage Number Percentage
Primary school
2 50% 2 50%
Secondary school
75 46.3% 87 53.7%
Tertiary 29 58% 21 52%
No school 5 55.6% 4 54.4%
Source: Survey data (2013)
The results on an educational level and structural terms are shown in table 4.19.
Those with primary school perceived poverty in non-structural terms (75%) whilst
those who did not go to school did not subscribe to structural perception (78%).

Perceived causes of poverty in a South African Township 85
Similar results were observed when individuals with secondary school education did
not see poverty in structural perception (74%). Campbell et al., (2001:424) found that
the educated were inclined to individualistic perceptions. A study by Wollie
(2009:266) concluded that high school students were inclined to individualistic
perceptions. In addition, Sun (2001:167) asserts that those who are educated
perceive causes of poverty in structural terms. In addition, Kreidi (2000) found that
education has nothing to do with the structural perceptions of poverty.
Table 4.19: Educational level and structural perception
Educational level of the Household head
structural perception
Otherwise
Yes
Number Percentage Number Percentage
Primary school
3 75% 1 25%
Secondary school
119 73.5% 43 26.5%
Tertiary 33 66% 17 34%
No school 7 77.8% 2 22.2%
Source: Survey data (2013)
Table 4.20 describes the relationship between the educational level and the fatalistic
index. The table shows that (76.5%) of those with secondary school education do not
agree with the view that poverty has a fatalistic dimension. The same outcome was
evident in both household heads with tertiary education and no school. Kreidi (2000)
observed a negative relationship between educational attainment and the fatalistic
index.
Table 4.20: Educational level and fatalistic perception
Educational level of the Household head
Fatalistic perception
Otherwise
Yes
Number Percentage Number Percentage
Primary school
2 50% 2 50%
Secondary school
124 76.5% 38 23.5%
Tertiary 34 68% 16 32%
No school 6 66.7% 3 33.3%
Source: Survey data (2013)

Perceived causes of poverty in a South African Township 86
4.3.6 Employment status and perceptions of the causes of poverty
Table 4.21 shows the relationship between employment status and individualistic
perceptions. The highest percentage was recorded on the employed (54.1%) who
perceived causes of poverty as an individualistic perception whilst only (49.4%) of
those who are unemployed perceived causes of poverty in individualistic terms.
From the above analysis, one can conclude that participants who are employed
perceive causes of poverty in individualistic terms. In contrast, those who are not
employed perceive causes of poverty otherwise. Bullock (2003:695) observed that
low-income women put the blame on themselves for their lack of success in their
lives.
Table 4.21: Employment status and individualistic perception
Employment status of the Household head
individualistic perception
Otherwise
Yes
Number Percentage Number Percentage
Employed 28 45.9% 33 54.1%
Not employment 83 50.6% 81 49.4%
Source: Survey data (2013)
Employment status of household head and structural perception is illustrated in table
4. About (77%) of those who are employed do not see poverty in structurally factors
whilst (29.9%) of the unemployed see poverty in structural factors. The results have
shown that both employed and unemployed perceived causes do not blame the
external forces. A similar study by Davids (2010) using national data for South Africa
found that both employed and unemployed did not perceive causes of poverty in
structural terms (Davids, 2010:150).
Table 4.22: Employment status and structural perception
Employment status of Household head
structural perception
Otherwise
Yes
Number Percentage Number Percentage
Employed 47 77% 14 23%
Not employed 115 70.1% 49 29.9%
Source: Survey data (2013)
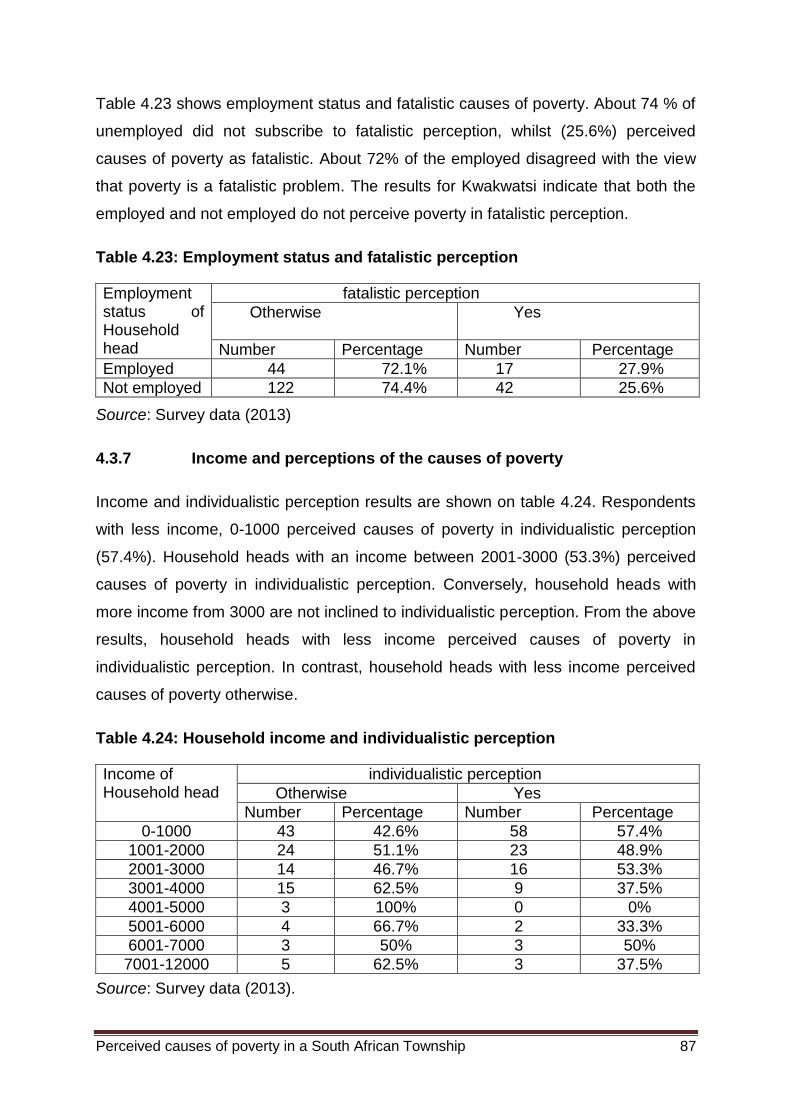
Perceived causes of poverty in a South African Township 87
Table 4.23 shows employment status and fatalistic causes of poverty. About 74 % of
unemployed did not subscribe to fatalistic perception, whilst (25.6%) perceived
causes of poverty as fatalistic. About 72% of the employed disagreed with the view
that poverty is a fatalistic problem. The results for Kwakwatsi indicate that both the
employed and not employed do not perceive poverty in fatalistic perception.
Table 4.23: Employment status and fatalistic perception
Employment status of Household head
fatalistic perception
Otherwise
Yes
Number Percentage Number Percentage
Employed 44 72.1% 17 27.9%
Not employed 122 74.4% 42 25.6%
Source: Survey data (2013)
4.3.7 Income and perceptions of the causes of poverty
Income and individualistic perception results are shown on table 4.24. Respondents
with less income, 0-1000 perceived causes of poverty in individualistic perception
(57.4%). Household heads with an income between 2001-3000 (53.3%) perceived
causes of poverty in individualistic perception. Conversely, household heads with
more income from 3000 are not inclined to individualistic perception. From the above
results, household heads with less income perceived causes of poverty in
individualistic perception. In contrast, household heads with less income perceived
causes of poverty otherwise.
Table 4.24: Household income and individualistic perception
Income of Household head
individualistic perception
Otherwise Yes
Number Percentage Number Percentage
0-1000 43 42.6% 58 57.4%
1001-2000 24 51.1% 23 48.9%
2001-3000 14 46.7% 16 53.3%
3001-4000 15 62.5% 9 37.5%
4001-5000 3 100% 0 0%
5001-6000 4 66.7% 2 33.3%
6001-7000 3 50% 3 50%
7001-12000 5 62.5% 3 37.5%
Source: Survey data (2013).

Perceived causes of poverty in a South African Township 88
Income and structural perception results are shown on table 4.25. The sampled
population with less income, 0-1000 perceived causes of poverty disagree (73%)
with the view that poverty is caused by structural factors. From the above results,
household heads with less income perceived causes of poverty in individualistic
perception. In contrast, household heads with more income perceived causes of
poverty otherwise.
Table 4.25: Income and structural perception
Income of Household head
structural perception
Otherwise
Yes
Number Percentage Number Percentage
0-1000 74 73.3% 27 26.7%
1001-2000 31 66% 16 34%
2001-3000 26 86.7% 4 13.3%
3001-4000 15 62.5% 9 37.5%
4001-5000 2 66.7% 1 33.3%
5001-6000 3 50% 3 50%
6001-7000 6 100% 0 0%
7001-12000 5 62.5% 3 37.5%
Source: Survey data (2013)
Income and fatalistic perception results are shown on table 4.26. About (80%), with
income of 0-1000 perceived causes of poverty in non-structural terms (80%) whilst
(20%) perceive poverty in fatalistic terms. Household heads with an income between
7001-12000 perceived causes of poverty as fatalistic perception (62.5%).
Conversely, household heads with more income from 1001-12000 do not perceive
causes of poverty in a structural view. From the above results, household heads with
less or more income are not inclined to fatalistic perceptions. Nasser and Aboucheid
(2001) found that high income households are more structural than those with low
income.

Perceived causes of poverty in a South African Township 89
Table 4.26: Income and fatalistic perception
Income of Household head
fatalistic perception
Otherwise
Yes
Number Percentage Number Percentage
0-1000 81 80.2% 20 19.8%
1001-2000 36 76.6% 11 23.4%
2001-3000 20 66.7% 10 33.3%
3001-4000 16 66.7% 8 33.3%
4001-5000 1 33.3% 2 66.7%
5001-6000 4 66.7% 2 33.3%
6001-7000 3 50% 3 50%
7001-8000 5 62.5% 1 37.5%
Source: Survey data (2013)
4.4 DETERMINANTS OF THE PERCEIVED CAUSES OF POVERTY
This section discusses the influence of some socioeconomic and demographic
variables on individualistic, structural, and fatalistic indices. These factors include
gender, age, marital status; employment status of the household head, household‟s
income and household size. The correlation analysis and regression are used to
determine the relationship between socioeconomic and demographic factors and
perceptions of the causes of poverty.
4.4.1 Correlation of variables
The results from descriptive analysis in section 4.3 suggest that socioeconomic
variables and the three indices are related and that identifying the nature of the
relationship is necessary. Table 4.27 presents the results of correlation between the
three indices and socio-economic and demographic factors. Their variables include
gender, household size, age, marital status, education, employment status and
income. The results show a significant association between structural index and
gender, age and employment status correlation coefficients. Gender relates to
structural index positively (0.0810). This means that females are more inclined to the
structural index, holding other things constant. In contrast, age and employment
status are negatively related to the structural index. Correlation coefficient for age
and employment status is significant at the 10% level of significance. This implies
that the employed are less inclined to choose structural factors compared to those

Perceived causes of poverty in a South African Township 90
who are unemployed, ceteris paribus. Furthermore, there is no significant
association between a fatalistic, individualistic index, and household size, age,
marital status, education, employment and income. However, the correlation seems
not to give good results between perceptions of poverty and socioeconomic
variables, thus a regression analysis present much better results.
Table 4.27: Correlation among variables
Variables Gender HH-Size Age Marital Education
Empl status
Income
Individualistic index
-0.048 0.052 0.014 0.058 -0.075 -0.016 0.042
Structural index
0.081** -0.052 -0.150** -0.095 0.102 0.186*** -0.72
Fatalistic index
-0.127 0.039 0.061 0.028 0.039 0.002 0.076
*** Significant at 1%,** significant at 5%,* significant at 10%
Source: Survey data (2013)
4.4.2 Regression analysis
This section discusses regression results from the three indices. It should be noted
that a high index score is associated with a high level of the perceptions of poverty.
In other words, the higher the index score; the more a household is inclined to
perceive the causes of poverty as individualistic, structural or fatalistic. The first
regression involves analysis of the effect of socioeconomic and demographic
variables on the individualistic index.
4.4.2.1 Determinants of individualistic factors of poverty
Ordinary least square regression was used to estimate how individualistic perception
(the dependent variable) is affected by a socioeconomic and demographic factor
(independent variables). The results of linear regression analysis on determinant of
individualistic perception are presented in Table 4.28. The results show that gender,
age, marital status, education and employment status are important predictors of the
index. The results show that gender (0=female, 1=male) (p= 0.005) significantly
explains individualistic perception at the 1% level of significance. The positive sign of
the coefficient (2.7762) shows that a positive relationship exists between gender and
individualistic perception. This implies having a female household head increases

Perceived causes of poverty in a South African Township 91
the individualistic index compared to having a male head, holding other factors
constant. In addition, age is found to be significant (at the 1% level of significance) in
explaining the individualistic perception. The results also show a positive coefficient
of (0.17) implying that an additional year in age of the household head increases the
individualistic index by 0.17, holding other factors constant. Marital status is also
significant at the 1% level of significance with a coefficient of 2.68. Holding other
factors constant, having a married household head increases the individualistic index
compared to having a non-married household head. These findings are similar to
other studies by Buz et al., (2005), Cozzarelli (2001) and Hunt (1996) which found
that gender and employment status were significant in explaining individualistic
perception of causes of poverty. In addition, Weiss (2007) also found out that
education had a significant effect on individualistic perception.
In contrast, household income and size do not have a significant effect on
individualistic perception of the causes of poverty. The non-significant of household
income can be associated with high deviations in income of Kwakwatsi dwellers.
Household size does not clearly determine how individuals perceive causes of
poverty as having individualistic perception. Hence one could not expect a significant
relationship between household size and the individualistic index. The R-squared
(0.9248) is significant (F-value =7,218) at the 1% level of significance. This indicates
that all independent variables jointly have a significant effect on the dependent
variable.

Perceived causes of poverty in a South African Township 92
Table 4.28: Individualistic regression analysis
Individualistic Coefficient Standard Error T P>t
Gender 2.7762 0.9857 2.82 0.005
HH Size 0.1100 0.2034 0.54 0.589
Age 0.1699 0.0193 8.88 0.000
Marital status 2.6883 0.9879 2.72 0.007
Education 0.4 0.0757 1.85 0.066
Employ status 2.421 0.6853 3.55 0.000
Income 0.00006 0.0001 0.02 0.982
F(7,218)=383.14 Prob>F=0.0000 Rsquared 0.9248
Source: Survey data (2013)
Overall, age, gender, marital status, education and employment status influence
individualistic perception. All these variables influence perception of poverty in a
positive way. This implies that older, male, employed and more educated household
heads tend to be inclined to have an individualistic perception of poverty. However,
there appears to be no relationship between individualistic perception and income
and household size in Kwakwatsi Town. Studies by Buz et al., (2005), Cozzarelli
(2001) and Hunt (1996) also found similar results in their study.
4.4.2.2 Determinant of structural index
A linear regression model was used to estimate how structural perceptions
(dependent variable = index) is influenced by socioeconomic and demographic
factors. The results of linear regression analysis on structural index are shown on
table 4.29. The results show that gender, age, education and employment status are
important predictors of this index. It shows that age and employment (p= 0.000)
significantly explains structural perception at the 1% level of significance. Age and
employment shows a positive sign of the coefficient of (1.160) and (3.8074)
respectively, illustrating the existence of a positive relationship between age,
employment and structural perception. This implies that those who are employed
were inclined to choose structural problems as causes of poverty compared with the
unemployed, who hold other factors constant. Education is also significant at the 1%

Perceived causes of poverty in a South African Township 93
level of significance with a coefficient of 0.2307. Holding other factors constant,
being educated increases the structural index compared to not being educated.
In addition, gender and income are found to be significant (at the 10% level of
significance) in explaining the structural perception. The results also show a positive
coefficient of (1.160) and a negative coefficient of (0.0002) on gender and income,
respectively. This implies having a female household head increases the structural
index compared to having a male head, holding other factors constant and an
additional year in age of the household head increases the structural index holding
other factors constant. In addition, income has a negative coefficient, implying that
the higher the income of the household, the less likely that they will not perceive the
causes of poverty in structural terms. These findings are similar to other studies
(Hunt, 1996; Shek, 2004; Reutter et al., 2005) which found that age, education,
gender and income are significant variables in structural perception.
In contrast, marital status and size do not have a significant effect on structural
perceptions of the causes of poverty. However, there are no studies which explain
the link between household size, marital status and structural perceptions of poverty.
The non-significant of household income can be associated with high deviations in
income by of Kwakwatsi dwellers.
Table 4.29: Structural regression analysis
Structural Coefficient Standard Error T P>t
Gender 1.1600 0.904 1.78 0.076
HH Size 0.2921 0.1865 1.57 0.119
Age 0.1369 0.0175 7.80 0.000
Marital status 0.5759 0.906 0.64 0.526
Education 0.2307 0.0694 3.32 0.001
Employ status 3.8074 0.9285 6.06 0.000
Income -0.0002 0.0001 1.89 0.059
F(7,218)=383.14 Prob>F=0.000 Rsquared=0.9248
Source: Survey data (2013)
4.4.2.3 Determinants of fatalistic index
The last model also used ordinary least square regression to estimate how
dependent variable (fatalistic perception) is influenced by socioeconomic and

Perceived causes of poverty in a South African Township 94
demographic factors (independent variables). The results of linear regression
analysis on the determinants of individualistic perception are shown in Table 4.30.
The results show that age, education and employment status are significant. They
show that age, education and employment (p= 0.000) significantly explains fatalistic
perception at the 1% level of significance. The positive sign of the coefficient age
(0.233), education (0.3182) and employment (2.7455) shows a positive relationship
exists between these variables and a fatalistic perception. An additional year in age
of the household head increases the individualistic index, holding other factors
constant. A study done by Shek (2004:288) concluded that age is significant as to
having a fatalistic perception. In addition, Hunt (1996) found that education is
significant to having a fatalistic perception of the causes of poverty.
In contrast, gender, household size, household income and marital status do not
have a significant effect on a fatalistic perception. To support this, other studies (
Hunt, 1996; Sun, 2001; Buz et al., 2005; Morcoi, 2007) found that gender is not
inclined to a fatalistic perception of the causes of poverty. Household size does not
clearly determine how individuals perceive causes of poverty in a fatalistic
perception. The R-squared (0.9267) is significant (F-value =7,218) at the 1% level of
significance. This indicates that all independent variables jointly have a significant
effect on the dependent variable.
Table 4.30: Fatalistic regression analysis
Fatalistic Coefficient Standard Error T P>t
Gender 0.0649 0.081 0.06 0.953
HH Size -0.1086 0.2248 -0.48 0.629
Age 0.2333 0.0211 11.04 0.000
Marital status 0.4475 1.092 0.41 0.682
Education 0.3182 0.0847 3.80 0.000
Employ status 2.7455 0.7575 3.62 0.000
Income 0.000 0.00014 0.55 0.584
F(7,218)=393.86 Prob>F=0.0000 Rsquared=0.9267
Source: Survey data (2013)
Dependent variable: Fatalistic index

Perceived causes of poverty in a South African Township 95
Table 4.31: Summary of the three regression models
Variable Individualistic (p values)
Structural (p values)
Fatalistic (p values)
HH gender 0.005 0.076 0.953
Size 0.589 0.119 0.629
Age 0.000 0.000 0.000
Marital status 0.682 0.526 0.007
Education 0.000 0.001 0.066
Employment 0.000 0.000 0.000
Income 0.584 0.069 0.982
Source: Survey data (2013)
The results in table 4.31 show that gender is significant to individualistic perception
at 1% level and structural at 10% level. This means that household head gender
perceive poverty as individualistic and structural. Household size is found to be
insignificant in all three perceptions of the causes of poverty. Furthermore, age is
found to be significant in all perceptions of the causes of poverty at a significant level
of 1%. The marital status is found significant only in a fatalistic perception at a level
of 1%. This means that those who are married only increase the fatalistic index;
hence they do not perceive the causes of poverty as individualistic and structural.
Education is significant in all three perceptions of poverty. It significally explains
individualistic and structural terms at the 1% level of being significant. It is also
significally explained at the 10% level considering a fatalistic perception.
Employment is found to be significant in all three perceptions of the causes of
poverty; individualistic, structural and fatalistic. The results show that gender
significally explains individualistic, structural and fatalistic perception at the 10% level
of significance. Moreover, income significally explains structural perception at the
level of significance. This means that those with less income put the blame on their
society.
Overall, individualistic perception is influenced by age, gender, marital status,
education and employment. A positive relationship is seen between these variables
and an individualistic perception. However, there appears to be no relationship
between individualistic perception and income and household size in Kwakwatsi
Township. Structural perception is influenced by age, education of the household,
employment, household gender and income. Age, gender, education, employment

Perceived causes of poverty in a South African Township 96
has a positive relationship with structural perception, whilst income has a negative
perception. In contrast, household size and marital status are insignificant to
structural perception. Fatalistic perception is influenced by age, marital status,
education and employment. These entire variables influence fatalistic perception
positively.
4.5 SUMMARY AND CONCLUSIONS
The perceived causes of poverty differ with geographical location and the
participants‟ socioeconomic factors. In an attempt to investigate the perceived
causes of poverty in Kwakwatsi, factor analysis and linear regression was used.
Firstly, the study carried out a factor analysis to investigate the perception of the
causes of poverty in individualistic, structural and fatalistic dimensions. Three indices
were used to measure these three perceptions of the causes of poverty.
Individualistic, structural and fatalistic perceptions were generated from 13
questions, where an individualistic index comprised 3 factors, the structural index
comprised 5 items and the fatalistic perception also comprised 5 factors. All 13 items
were loaded in the factor analysis for reliability and dimensionality using Principal
Component Analysis and Varimax rotation. The results illustrated a Kaiser-Meyer-
Olkin Measure of Sampling Adequacy (KMO) of 0.66 and the Bartlett`s Test of
Sphericity value of 0.000. The Kaiser-Olkin Measure of Sampling Adequacy and the
Bartlett`s Test of Sphericity are significant, thus factor analysis was appropriate. The
eigenvalues were recorded as Component 1 (Individualistic perception) eigenvalue
of 2.610, Component 2 (Fatalistic index) eigenvalue of 2.419 and Component 3
(Structural index) an eigenvalue of 1.987. The eigenvalue of more than 1 is
considered valid when using the Kaiser`s criterion hence eigenvalues were more
than 1. In addition, similar results were found, which were consistent with the current
study (Davids, 2010).
Component 1 (individualistic) comprised three items but an additional factor of the
„rich exploiting the poor‟ was included from the structural perception. This means the
respondents blame themselves of being exploited by rich people. Three items results
of factor loading were „they waste money on inappropriate items‟ (0.807),„they do not
actively seek to improve themselves‟ (0.801), „the rich exploit the poor‟ (0.761), „they
lack the ability to manage money‟ (0.694). Factors in the second component include:

Perceived causes of poverty in a South African Township 97
„they lack luck‟ (0.735), „they are not motivated by welfare‟ (0.687),‟ they have
encountered misfortunes‟ (0.681), „they have bad fate‟ (0.556) and „they are born
inferior‟ (0.493). These factors refer to fatalistic causes of poverty and are in line with
the theory.
Furthermore, the third component related to structural perception of poverty shows
that; „they lack social justice‟ (0.325), „they lack opportunities due to the fact that they
are born in poor families‟ (0.735), „they live in places they not many opportunities‟
(0.703) and „distribution of wealth is uneven‟ (0.634). The results of factor analysis
were also in line with (Hunt, 2004; Shek, 2004; Sun, 2001; Davids, 2010; Wollie,
2009). These studies used PCA to group factors into three indices of the perceptions
of the causes of poverty. The current one is that one variable was found in the group
of individualistic perceptions of the causes instead of structural perceptions.
The study also considered three perceptions‟ mean scores and their stand
deviations. The results show that individualistic perception recorded a mean of 3.631
and a standard deviation of 0.964, whilst fatalistic perception recorded a mean of
3.248 and a standard deviation of 0.879. Structural perception recorded a mean of
3.134 and a standard deviation of 0.926. The mean results reported that
respondents were more inclined to individualistic structural and fatalistic perceptions
of poverty although the differences in all three perceptions of the causes of poverty
are reasonably small.
The second subsection presented the impact of socio-economic and demographic
factors on individualistic, structural and fatalistic perceptions using descriptive,
correlation and the linear regression model. The main objective was to describe the
link between the perceptions of the causes of poverty and identify variables that
influence perception of the causes of poverty. Seven variables were taken into
consideration as the demographic and economic factors; Household size, age,
gender, marital status, employment, education and income. Gender was linked with
individualistic perception, where (52%) of males perceived causes of poverty as
individualistic and (48%) perceived the causes of poverty as individualistic. This
implies that males are more individualistic. In addition, results showed that both
males and females were less inclined to have both a structural and fatalistic
perception

Perceived causes of poverty in a South African Township 98
A household size of 1 is more inclined to individualistic perception (60%) whilst 40%
do not ascribe to an individualistic perception. Households with more than two
members perceived poverty not in individualistic terms. The same trend was also
seen as a structural perception where a household size of 1 perceived causes of
poverty in individualistic terms and a household of more than two were not
structurally inclined. Under fatalistic perception, all households did not perceive the
causes of poverty as a fatalistic perception. The results has also indicated that at an
early age the causes of poverty are perceived as individualistic and structural while
the old age group perceived the causes of poverty as fatalistic. Furthermore, both
married and not married do not perceive causes of poverty in individualist, structural
and fatalistic terms.
A relationship exists between education and perceptions of poverty. Education
influences perceptions of poverty, both structurally and individualistically. The results
have shown that both the employed and not employed are not inclined to have a
fatalistic perception. In addition, the unemployed perceived causes of poverty in
structural perception. Household heads with less income perceived causes of
poverty in individualistic perception whilst household heads with less income
perceived causes of poverty otherwise. In addition, household heads with less
income perceived causes of poverty in a structural perception and household heads
with less income perceived causes of poverty otherwise.
Regression analysis was also used in individualistic, structural and fatalistic models.
Ordinary least square was used to estimate how these three dependent variables,
structural, individualistic and fatalistic index are influenced by socioeconomic and
demographic factors (independent variables). For the individualistic model gender,
age, marital status, education and employment status are significant. Gender, age
and marital status are all significant at 1%. A positive relationship exists between
these variables and an individualistic perception. These findings are similar to other
studies by Buz et al., (2005), Cozzarelli (2001) and Hunt (1996). In contrast,
household size and income were found to be insignificant on individualistic
perception. The R-squared (0.9248) are significant (F-value =7,218) at the 1% level
of significance. This indicates that all independent variables jointly have a significant
effect on the dependent variable.

Perceived causes of poverty in a South African Township 99
The second model illustrated structural perception as a dependent variable and
socioeconomic and demographic factors (independent variables). It was found that
gender, age, education and employment status are significant. Age, education and
employment are found significant at the 1% level. Age, education and employment
showed a positive coefficient, implying a positive link between these variables and
perceptions of the causes of poverty. In addition, gender and income were found to
be significant (at the 10% level of significance) in explaining the structural
perception. The results also show a positive coefficient of and a negative coefficient
on gender and income respectively. The negative coefficient on income implies that
the lower the income of the household, the more they perceive the causes of poverty
in a structural index. These findings are similar to other studies by Hunt (1996); Shek
(2004) Reutter et al., (2005) which found that age, education, gender and income are
significant variables in a structural perception. In contrast, household income and
size do not have a significant effect on an individualistic perception of the causes of
poverty. The R-squared (0.9248) is significant (F-value =7,218) at the 1% level of
significance. This indicates that all independent variables jointly have a significant
effect on the dependent variable.
The last model also used ordinary least square regression to estimate dependent
variable (fatalistic perception) and is influenced by socioeconomic and demographic
factors (independent variables). The fatalistic model showed age, education and
employment status are significant at 1% level. Significant variables showed positive
coefficients, which imply a positive relationship between perceptions of the causes of
poverty and socioeconomic variables. In contrast, gender, household size,
household income and marital status do not have a significant effect on fatalistic
perception. The R-squared (0.9267) is significant (F-value =7,218) at the 1% level of
significance. This indicates that all independent variables jointly have a significant
effect on the dependent variable.

Perceived causes of poverty in a South African Township 100
5 CHAPTER 5: SUMMARY AND CONCLUSION
5.1 INTRODUCTION
Poverty is one of the major problems affecting human kind today. Its causes depend
on the geographical location as well as the socioeconomic factors experienced by
the respondents. This study explored the perceived causes of poverty in Kwakwatsi
Township from the household‟s perspective. The main aim was to determine whether
the Kwakwatsi residents perceive the poverty causes from an individualistic,
structural and fatalistic dimension. In addition, the study also investigated the
influence of socioeconomic and demographic factors on households‟ perceptions of
the poverty causes. In achieving these two objectives, descriptive analyses and
regression model were used. This chapter summarises the theoretical background,
study methodology and the statistical analysis of the results. It also provides
conclusions and necessary recommendations.
5.2 THE THEORETICAL BACKGROUND OF THE STUDY
Poverty is a multi-dimensional concept attached to many definitions, measures and
causes. This means that it has a number of approaches, measures and causes. The
theoretical analysis of poverty formed the basis of the current study. In providing this
theoretical basis, absolute, relative, capability, multi-dimensional, social exclusion
and monetary approaches to poverty were defined. An absolute approach, as earlier
noted in chapter 2, is an objective concept which mainly focuses on the minimum
level of basic goods and services, constituting food, clothes and shelter, required to
maintain a bare minimum standard of living. However, poverty cannot be measured
by basic goods and services only as suggested by the absolute approach, hence the
introduction of relative poverty. Relative poverty as defined in chapter 2, is a
subjective concept that measures poverty according to the society‟s standards. In
other words, if say a household does not partake of the society‟s activities,
regardless of his/her affordability to buy basic commodities such as food, shelter,
energy, clothing and health, non-participation in those societal activities makes that
particular household to be regarded as poor.

Perceived causes of poverty in a South African Township 101
The multi-dimensional approach emphasises several aspects of poverty, such as
lack of skills, health, income, food, transport and shelter. Based on this approach,
failure to attain such aspects is claimed to result in poverty. The monetary approach
uses income or consumption in poverty identification and measurement. The income
or consumption is used to separate the poor from the non-poor. The capability
approach, in addition, takes into account the individual abilities which improve one`s
standard of living. If individuals lack capabilities such as, health, shelter, senses,
emotions, integrity and affiliation they are considered poor. Another approach is the
social exclusion, which is defined as the process that excludes poor individuals from
participating in the society they live in. All in all, these approaches have their
strengths and weaknesses in measuring and defining poverty, suggesting that a
combination of these measures provides better results.
Despite the existence of many methods of measuring poverty, a number of accepted
international measures are generally made available. These measures include
objective indicators and subjective indicators, such as the headcount index, poverty
line, poverty gap index, Sen Index, the Foster-Greer-Thorbecke (FGT) measures. A
Poverty line is the most common used measure of poverty because it is easier to
use. It is defined as the minimum expenditure/income that is required to cover basic
food and non-food items. These expenditures are added together and are compared
with the poverty line. On one hand, a headcount index is a fraction of the population
that live below the poverty line. Its purpose is to quantify the physical number of the
poor. A poverty gap index measures the income gap of the poor from the poverty line
and also focuses on the depth of poverty. It shows how much is needed for a poor
individual to meet the poverty line. The Sen Index is defined as a combination of
head count index and poverty gap index. It is decomposable into the physical
number of the poor and depth of poverty. The FGT, on the other hand is a measure
which takes into consideration the weighted average measures of individuals. One of
FGT strengths is that it is understandable, sound and it is easy to apply.
Since poverty is a multifaceted concept, it is important to identify its causes because
they differ from one region to another. The literature review grouped the European
causes of poverty into demographic, neighbourhood, cultural and labour markets. It
also grouped Africa`s causes of poverty as inadequate access to employment
opportunities, lack of assets, lack of competitiveness markets and human capital.

Perceived causes of poverty in a South African Township 102
However, this study highlighted the following as the causes of poverty: proneness to
income, institutional failures, corruption, lack of skilled labour and individual
responsibility. More so, the global financial crises for instance, have greatly affected
Africa because of its dependency syndrome on European countries. This has led to
unemployment and a decrease in economic activities which exposed Africans to
absolute and relative poverty. South Africa faced some institutional problems such
as governance, housing and education. This is evident in poor service delivery, lack
of sufficient formal settlement and a high illiterate level.
In achieving the empirical objectives of this study, it was necessary to consider the
perceptions of the causes of poverty and the empirical findings of the literature
review. Previous literature grouped perceptions of the poverty causes into
individualistic, structural and fatalistic dimensions. As noted in chapter 2, an
individualistic perception is a concept which blames individuals for their poverty.
Individual factors that support individualistic perception of why poor people are poor
are: they are lazy, they lack the ability to manage money and they spent the money
on non-basic commodities. Structural explanations places the blame on external
forces, such as social injustice and an uneven distribution of resources in a society,
while fatalistic explanations blame accidents, bad fate, lack of luck and misfortunes.
The perceptions of poverty causes were supported by conservative and liberal
approaches. Conservative approaches are ones that support the claim that an
individual is responsible for his/her poverty, while, liberal approaches support the
view that the structure of the economy can have an impact on poverty outcomes.
Conservative approaches include individualistic explanations and victim blaming.
The individualistic explanation describes an individual‟s character and intelligence
such as absence of ability, lack of intelligence and lack of goals. Victim blaming
include multi-dimensional definitions and mainly focuses on an individual‟s
responsibility for being poor. Under a structural framework, the social structures and
situational forces are seen as the main causes of poverty. These situational factors
affect the poor in an economic way and ascribe to uneven changes in technology
and unemployment.
Perceived causes of poverty in a South African Township 103
The empirical findings on perceptions of poverty causes revealed that many
respondents tend to perceive the causes of poverty mainly as individualistic and
structural factors. In addition, previous research indicates that South Africans
perceived the perception of the causes of poverty in a structural perception (Davids,
2010). In other words, the households blamed external forces which resulted in their
lack of opportunities, prevalence of social injustice, uneven distribution of resources
and their lack of welfare. A similar study in Lebanon indicated that university
students tend to perceive the poverty causes in structural terms. They subscribed to
structural factors because of social changes, social and economic crisis and failure
by the government to provide for their people (Kerbo, 1991). Furthermore, the
literature review has shown that Americans, and people in Lithunia as well as
Sweden are more likely to ascribe poverty to individualistic factors like the inability to
manage money, lack of skills, lack of abilities, and lack of opportunities, and that they
do not seek to improve themselves. The empirical findings on a fatalistic perception
showed that the causes of poverty involve accidents, lack of opportunities and bad
luck (Bullock & Waugh, 2005:1133).
Socioeconomic and demographic variables such as education, age, race,
employment and gender appear to influence the perceptions of the causes of
poverty. The literature review showed that race influenced the structural and
individualistic perceptions of poverty causes. Generally, blacks tend to blame the
structural perception while whites appear to blame themselves. Education tends to
influence perceptions of the causes of poverty in individualistic and structural terms.
The literature has established that the more an individual is educated, the more they
perceive the causes of poverty as structural. Furthermore, geographical location had
an impact on the perceived causes of poverty as an individualistic problem while
those in developed countries tend to perceive poverty as a structural factor. Age also
contributed to structural and fatalistic views where adolescents were more inclined to
have a structural perception and parents believed in bad fate and accidents.
Furthermore, a general consensus by researchers indicated that males are more
inclined to have a structural perception compared to females.

Perceived causes of poverty in a South African Township 104
5.3 METHODOLOGY OF THE STUDY
The research methodology used in this study is quantitative. A questionnaire was
used which measured the perceived causes of poverty in a low Township of
Kwakwatsi from an individualistic, structural and fatalistic dimension. The objectives
of the study were achieved through the use of Principal Component Analysis and a
linear regression model. The Principal Component Analysis was used to determine
whether the Kwakwatsi households perceive the poverty causes in individualistic,
structural and fatalistic terms. Thirteen factors were loaded into factor analysis and
grouped into three components of an individualistic, structural and fatalistic. The
Principal Component Analysis used an eigenvalue of above or equal to 1 for a factor
to be meaningful. Furthermore, percentage of variance and Kronbach alpha were
considered in determining the reliability of the study. The second objective of the
current study was achieved by correlations analysis and the linear regression model.
Three linear regressions (one for each component) were estimated. Each
component was regressed on socio-economic and demographic factors in order to
identify factors that have a significant effect on perceptions of the poverty causes.
5.4 THE DEMOGRAPHIC PROFILE OF KWAKWATSI TOWNSHIP
Kwakwatsi Township was the focus area of the study. As earlier noted, it is a former
black residential township located approximately 180 km south of Johannesburg and
280 km north of Bloemfontein in the Free State province of South Africa. Its
estimated population size is 15 095 and a sample of 225 was used to investigate
perceptions of the causes poverty. Within the sampled population socioeconomic
and demographic factors such as household size, various sources of income within a
household, employment, age, and education levels of the household members,
marital status as well as the gender of the household heads of Kwakwatsi are
summarized.
The Kwakwatsi average household size was calculated at 4.39. The gender
distribution of the sample was 60 percent females and 40 percent males. In addition,
69 percent of the household heads were males, while 31 percent were females. The
population distribution has also shown that about 71 percent of household heads are
married, 19 percent are widowed while 5 percent are divorced. Furthermore, the

Perceived causes of poverty in a South African Township 105
findings revealed that 54 percent of the participants migrated into Kwakwatsi in the
past 10 years, while 19 percent have been staying there for the past 20-25 years.
Approximately (54%) of the population are primary school students and (10%) are
matriculants. A small percentage of the household heads (0.31%) had tertiary
education while (5%) percent never attended school. The Kwakwatsi unemployment
rate was calculated at (15.7%). The results also showed that (18%) of the
participants were unemployed for 2 years while (17%) went for 10 years without
employment. In addition, (12.2%) of the households are formally employed while
(72.1%) are informally employed and (15.7%) are unemployed. Retailing, building,
catering, and hairdressing were the identified skills which the unemployed possess.
The majority of the unemployed were looking for jobs while others were helping with
chores at home.
5.5 THE EMPIRICAL FINDINGS OF THE STUDY
In this study a Factor Analysis (Principal Component Analysis) was used. The PCA
explained the nature of relationships between the research variables in assessing
dimensionality and reliability. Dimensionality is the measurement of perceptions of
the causes of poverty while reliability measures the accuracy of the perceived
poverty causes items or factors. In this study, dimensionality and reliability were
achieved through the performance of the Kaiser-Olkin Measure of Sampling
Adequacy and the Bartlett`s Test of Sphericity. The two tests‟ significance in the
current study indicated that the data was appropriate for PCA. In addition, all the
eigenvalues were found to be significant because they were all more than 1 for the
three components. The eigenvalues were 2.610 for component 1 (individualistic
perception), 2.419 for component 2 (fatalistic perception) and 1.987 for component 3
(structural).
The results on the individualistic dimension/component identified four factors,
namely: „waste money on inappropriate items‟, „not actively seek to improve
themselves‟, „the rich exploit the poor‟ and „lacking the ability to manage money‟. The
“rich exploit the poor” was seen as an individual factor because it was more
associated with individualistic views rather than structural causes. The fatalistic
component results included factors related to: lack of luck, demotivation by welfare,
encountering misfortunes, having bad fate and being born inferior. In addition, the

Perceived causes of poverty in a South African Township 106
structural component revealed the perceptions that the poor are poor because „they
lack social justice‟; „they lack opportunities due to the fact that they born in poor
families‟ „they live in places where there are not many opportunities‟ and „distribution
of wealth is uneven‟.
The socioeconomic and demographic variables such as gender, household size,
education, employment status, marital status, age and income were considered in
determining the perceptions of poverty causes. The results showed that males
subscribed to individualistic perceptions more than females. In contrast both males
and females did not subscribe to structural and fatalistic perceptions. Individualistic
and structural factors were found to be negatively related with household size. This
implies that smaller households tend to blame the individual and structure challenges
for poverty, while larger households do not agree with that thinking.
The findings also indicated that there is no relationship between marital status and
all perceptions of poverty causes. Furthermore, the results showed that the
participants of a young age tend to perceive the causes of poverty as individualistic,
while those of an old age perceive the causes in fatalistic and structural terms. In
addition, education was found to have a significant effect on structural and
individualistic perceptions. More so, the findings report that household heads with
less income tend to perceive the causes of poverty in individualistic and structural
terms. Lastly, the results found an insignificant effect of the respondents‟
employment status on structural and fatalistic perceptions of poverty causes.
5.6 CONCLUSIONS
In the investigation of the perceived causes of poverty, residents of Kwakwatsi were
viewed in the three dimensions tested, namely individualistic, structural and fatalistic.
However, the individualistic perception of the causes of poverty appears to carry
more weight than the other two. This implies that the residents of Kwakwatsi
Township mostly associate the causes of poverty with the inability to manage
money, waste money on inappropriate items; do not seek to improve themselves and
see themselves as being exploited by the rich.
In addition, under the socioeconomic variable, the study found that:

Perceived causes of poverty in a South African Township 107
gender, age, marital status, education and employment status are important
predictors of the individualistic dimension;
gender, age, education and employment status are important predictors of
structural dimension; and,
age, education and employment status are significant predictors of fatalistic
dimension.
The item on the “rich exploiting the poor” was added to the individualistic perception
from the structural perception. This component includes factors of individualistic
perceptions of poverty causes. This means that the respondents blame themselves
of being exploited by the rich. More so, poor people allow the rich to exploit them
hence they perceive it in individualistic terms.
However, the study had its limitations. The first is that the questionnaire was unable
to include important variables such as politics, religion (Nasser et al., (2002:113).
Politics tend to influence perceptions of poverty causes because individuals live in a
political environment. In addition, religion also influences how people think about the
causes of their poverty.
Kwakwatsi is regarded as a poor area and the majority of the participants in this
study blame the individual for being poor. This provides an opportunity for the
government to partner with the community in the upliftment of the area. Further
analysis can compare the perceived causes of poverty and the socioeconomic/
poverty status of the individual.

Perceived causes of poverty in a South African Township 108
5.7 REFERENCES
Abouchedid, K. & Nasser, R. 2001. Poverty attitudes and their determinants in
Lebanon‟s plural society. Journal of Economic Psychology, 22(1):271–282.
Alcock, P. 1997. Understanding poverty. London: MacMillan Press.
Aliber, M. 2002. Poverty-eradication and sustainable development. Integrated
Rural and Regional Development Research Programme.
http://www.hsrcpress.ac.za/product.php?productid=2022&cat=1&page=1 Date of
access: 7 Feb. 2013.
Andy, E. 2011. Critical Analysis of poverty theories.
http://www.academia.edu/1116707/Critical_Analysis_of_Poverty_Theories Date
Access: 23 Oct. 2013.
Anon. 2009. The promotion of sustainable enterprises.
http://www.ilo.org/wcmsp5/groups/public/---
ed_emp/emp_ent/documents/publication/wcms_093969.pdf Date of access: 3 Nov.
2013.
Atkinson, A. B. 1998. Social Exclusion, Poverty and Unemployment.
www.gsdrc.org/go/display&type=Document&id=3549. Date of access: 10 Mar. 2013.
Baldin, T. 2007. Perception, Reference and Causation. Proceedings of the
Aristotelian Society, CVII(I):1-25.
Bandura, A. 1999. Social cognitive theory: An agentic perspective. Asian Journal of
Social Psychology, 2:21–41.
Beavers, A. S., Lounsbury, W., Richards, J. K., Huck, W. S. & Esquivel, G.J. 2013.
Practical Assessment, Research & Evaluation. A peer-reviewed electronic journal.
http://www.pareonline.net/pdf/v18n6.pdf Date of access: 5 March. 2013.
Bègue, L. & Bastounis, M. 2003. Two Spheres of belief in justice: extensive support
for the dimensional model of belief in a just world. Journal of Personality, 71(33):
435-463.
Bellu, L. G. 2005. Agricultural policy support service, policy assistance division and
FAO. Rome: Italy.

Perceived causes of poverty in a South African Township 109
Betson, D. M. & Warlick, J.L. 1999. Reshaping the historical record with a
comprehensive measure of poverty. South Bend, IN: Department of Economics,
University of Notre Dame.
Bhorat, H. & Kanbur, R. 2005. Poverty and well-being in post-apartheid South
Africa: an overview of data, outcomes and policy. Pretoria: HSRC Press
Blackwood, D.L. & Lynch, R.G. 1994. The measurement of inequality and poverty:
a policy maker‟s guide to the literature. World Development, 22(4):567-578.
Bobbio, A., Canova., Manganelli, A. M. 2010. Conservative ideology, economic
conservatism, and casual attributions for poverty and wealth. Current Psychology,
23(3):222-234.
Booysen, F., Guvuriro, S., Campher, C. & Mudzingiri, C. 2013. The Who‟s Who of
decision-making in South African households?. Paper presented to the Biennial
Conference of the Economic Society of South Africa (ESSA), 25-27 September
2013, Bloemfontein.
Bullock, H.E. & Limbert, W.M. 2003. Scaling the socioeconomic ladder: low-income
women‟s perceptions of class status and opportunity. Journal of Social Issues,
59(4):693–709.
Bullock, H. E. & Waugh, I. M. 2005. Beliefs about poverty and opportunity among
Mexican Immigrant Farm Workers. Journal of Applied Social Psychology,
35(6):1132–1149.
Burns, N. & Groove, S. 1993. The practice of nursing research: conduct, critique
and utilization. Philadelphia, W.B.Saunders.
Buz, S., Ontas, O. C. & Hotiboglu, B. 2012. Opinions of social work students from
Turkey on poverty and wealth. International journal of business and social sciences,
3(5):187-196.
Cant, M., Gerber-Nel, C., Nel, D. and Kotze, T. 2003. Marketing Research.
Cleremont: New Africa Books (Pty) Ltd.
Comrey, A. L. 1973. A first course in factor analysis. New York: Academic Press.
Cozzarelli, C., Wilkinson, A. V., & Tagler, M. J. 2001. Attitudes towards the poor
and attributions for poverty. Journal of Social Issues, 57(3):207–227.
Perceived causes of poverty in a South African Township 110
Crossette, B. 2002. Bad government often the cause of poverty in causes and
alleviation of poverty. New York: Nova Science.
Davids, Y. D. 2010. Explaining poverty: A comparison between perception and
condition of poverty in South Africa. Stellenbosch: Stellenbosch University. (Thesis-
Phd).
De Haan, A. 2002. Migration and livelihoods in historical perspective: a case study
of Bihar, India. Journal of Development Studies, 38(5):115-142.
Deaton, A. 1997. The analysis of household survey: A micro econometric approach
to development policy. Washington DC: World Bank.
DeCoster, J. 1999. Overview of factor analysis. http://www.stathelp.com/factor.pdf.
Date of Access: 1 March. 2012.
De Swaedt, C. 2004. Cape Town‟s African poor: programme for land and agrarian
studies. http://www.plaas.org.za/sites/default/files/publications-pdf/CP03.pdf Date of
access: 4 Sept. 2013.
European Ant-Poverty Network. 2013. Causes of poverty and inequality.
www.eapn.eu.eu/what-is-poverty/causes of poverty-and-inequality Date of access:
22 Oct 2013.
Feagin, J. R. 1975. Subordinating the poor: welfare and American beliefs.
Englewood Cliffs, NM: Prentice Hall.
Federico, C.M. 2005. Racial perceptions and evaluative responses to welfare: does
education attenuate race of target effects. Political Psychology, 26(5):683-697.
Francis, T. 2001. Poverty and sustainable development. (Paper Conference.
Bordeaux, France).
Foster, E. J., Greer, J. Thorbecke, E. 1984. A class of decomposable poverty
measures. Econometria Society, 52(3):761-766.
Foster, E. J., Greer, J. Thorbecke, E. 2010. FGT Poverty measure. Institute of
Economic policy. Washington DC: George Washington University.
Gafar, T. I., Adeyani, L. S. & Raheem, U. A. 2009. Determinants of poverty in Sub-
Saharan Africa. http://www.ajol.info/index.php/afrrev/article/view/43617. Date of
access: 27 Aug 2013.

Perceived causes of poverty in a South African Township 111
Gerber-Nel, C., Nel, D. & Kotz‟e, T. 2003. Marketing Research. Pretoria: Van
Schaik.
Giddens, A. & Sutton, P. W. 2009. Sociology: Introductory Readings. Cambridge:
Polite Press.
Gillie, A. 1996. The origin of the poverty line. The Economic History Review, 4(4):
715-730.
Glantz, M. H. 1987. Drought and hunger in Africa: denying famine a future.
Cambridge, England: Cambridge Univ. Press.
Griffths, S. & Zhou, X. N. 2012. Why research infectious diseases of poverty?
http://www.who.int/tdr/capacity/global_report/2012/chapitre1_web.pdf Date of
access: 5 October 2013.
Grosh, M.E. & Glewwe, P. 2000. Designing Household survey: Questionnaires for
developing countries. Washington DC: World Bank
Gujurati, D. N. 2004. Basic econometrics. New York: McGraw-Hill.
Gustafsson, B. & Yue, X. Rural people's perception of poverty in China. (Discussion
paper series, IZA DP No. 2486).
Hajnal, Z. 2007. Black class exceptionalism: Insights from direct democracy on the
race versus class debate. Public Opinion Quarterly, 71(4):560–587.
Halgartner, S. & Bosk, C. 1988. The rise and fall of social problems: A public
arenas model. Journal of Sociology, 94(1):53-78.
Halman, L. & Van Oorschot, W. 1999. Popular perceptions of poverty in Dutch
society. Work and Organization Research Centre, Tilburg University, Work Paper
16. http://greywww.kub.nl:2080/greyfiles/worc/1999/doc/16.pdf. Date of Access: 3
February 2012.
Hamel, E., Brodie, M. & Morin, R. 2005. A survey of South Africa ten years into the
new democracy. International Journal of Public Opinion Research, 18(3):351-363.
Hayati, D. & Karami, E. 2005. Typology of causes of poverty: the perception of
Iranian farmers. Journal of Economic Psychology, 26:884–901.
Haydar, B. 2005. Extreme poverty and global responsibility. Metaphilosophy:
36(1/2):240–253.

Perceived causes of poverty in a South African Township 112
Hazlitt, H. 1973. The conquest of poverty. New York: Arlington House.
Hine, D. & Montiel, C. 1999. Poverty in developing nations: A cross-cultural
attributional analysis. European Journal of Social Psychology, 29:943–959.
Hirschowiz, R. Orkin, M. & Alberts, P. 2000. Key baseline statistics for poverty
measurement in South Africa.
http://www.statssa.gov.za/publications/PovertyReport/PovertyReport.zip. Date of
access: 22 Oct. 2013.
Hunt, M. O. 2004. Race/Ethnicity and Beliefs about Wealth and Poverty. Social
Science Quarterly, 85(3):827-853.
Hunt, M. O. 1996. A comparison of Black, Latino and White beliefs about the
causes of poverty. Social Forces, 75(1):293–323.
International Labour Organisation. 1976. Meeting Basic Needs: Strategies for
eradicating mass poverty and unemployment. Geneva: ILO.
Kamanou, G. 2005. Methods of Factor Analysis for ordinal Categorical Data and
application to poverty Data. (International Conference 29-31 August. Brazil).
Kerbo, H. R. 1991. Social stratification and inequality: Class conflict in historical and
comparative perspective. New York: McGraw-Hill.
Khelife, M. B. 2009. Factor Analysis: SPSS window Intermediate and Advanced
Applied Statistics.
www.zu.ac.ae/main/files/contents/research/training/factoranalysis.ppt . Date of
access: 6 March 2013.
Kinnear, T. C. & Taylor, J. R. 1991. Marketing Research: an applied research. New
York, McGraw-Hill.
Kluegel, J. & Smith, E. 1986. Beliefs about inequality: Americans‟ views of what
island what ought to be. New York: de Gruyter.
Laderchi, C. R., Saith R. & Stewart, F. 2003. Does it matter that we don‟t agree on
the definition of poverty? A comparison of four approaches. New York: Oxford
University Press.

Perceived causes of poverty in a South African Township 113
Lanjouw, J. O. 2001. Demystifying Poverty Lines.
http://siteresources.worldbank.org/PGLP/Resources/LanjouwDemystifyingPovertyLin
es.pdf Date of Access: 7 July. 2013.
Lewis, O. 1969. The Culture of poverty, in an understanding poverty. New York.
Basic Books.
Lopez, G.E., Gurin, P. & Nagda, B.A. 1998. Education and understanding structural
causes for group inequalities. Political Psychology, 19(2):305–329.
Lotter, H. P. P. 2007. Defining poverty as distinctively human. HTS Theological
Studies, 63(3):1195-1212.
MacCallum, R. C., Preacher, K.J. 2001. Exploratory factor analysis in behavioural
genetics research. http://www.ncbi.nlm.nih.gov/pubmed/12036113. Date of access:
5 Aug. 2013.
May, J., Woolard, I. & Klasen, S. 2000. The Nature and measurement of poverty
and inequality. Cape Town: Zed Books.
May, J. & Norton, A. 1997. A difficult life: the perceptions and experience of poverty
in South Africa. Social Indicators Research, 41:94–118.
Mbele, K. M. 2012. Survival strategies of poor households in Boitumelo Township.
Vanderbjlpark: NWU. (Dissertation- Masters).
McDaniel, C. & Gates, R. 2001. Marketing research essentials. United States of
America: South-Western College Publishing.
Merriam, S. 2009. Qualitative Research; a guide to design and implementation. San
Francisco, CA: Jossey-Bass.
Mitra, T. & Ok, E. F. 1995. On the measurement of economic poverty. New
Reports. New York: New York University.
Minot, N. 2010. Variation in staple food Prices in Eastern and Southern Africa.
http://www.aec.msu.edu/fs2/aamp/_3/AAMP_Maputo_food_price_variability_synthes
is%20.pdf 3 Aug. 2013.
Mofokeng, T. J. 2005. The role of the agricultural and agro processing sectors in
reducing unemployment and poverty in the Townships of Lessdi. NWU.
(Dissertation- Masters).

Perceived causes of poverty in a South African Township 114
Mokoena, T. D. 2000. The status of material poverty in the Vaal Triangle Area in
the year 2000. Vista University, Vaal Triangle: South Africa. (Dissertation- Masters).
Morcöl, G. 1997. Lay explanations for poverty in Turkey and their determinants.
Journal of Social Psychology, 137:728-738.
Morris, E. 2011. Sampling from small populations.
https://www.google.co.za/#q=.Morris%2C+E.++2011.++Sampling+from+small+popul
ations Date accessed: 6 July. 2013.
Mukherjee, S & Benson, T. 1998. The determinants of poverty in Malawi. Bangkok,
Thailand: International Labour Organisation.
Murray, C. A. 1996. Underclass: the developing debate. London: IEA Health and
Welfare Unit.
Murray, C.A. 1984. Losing ground: American social policy 1950-1960. New York:
Basic Books.
Mussard, S. & Xu, K. 2008. Multidimensional decomposition of the Sen Index;
some further thoughts. http://ideas.repec.org/p/shr/wpaper/06-08.html. Date of
access: 9 October 2013
Narayan, D. & Petesch, P. 2000. From many lands. Voice of the poor series. New
York, Oxford University Press: World Bank.
National Department of Education. 2010. Education Ii South Africa.
http://www.education.gov.za/LinkClick.aspx?fileticket=VlqIdHT7qZ8%3D&tabid=462
&mid=1326. Date of Access 24 Oct 2013.
Ngwathe Municipality. 2009a. Annual Report 2009-2010. Parys: Ngwathe
Municipality.
Ngwathe Municipality. 2009b. The Local Government Handbook.
http://webcache.googleusercontent.com/search?q=cache:h-
Dsup3qDbkJ:www.municipalities.co.za/south-africa/local-municipality/42/ngwathe-
local-municipality+(Ngwathe+Municipality,+2009).&cd=2&hl=en&ct=clnk&gl=za.
Date of access: 12 March. 2013.

Perceived causes of poverty in a South African Township 115
Nicholls, B. 2011. The advantages of using qualitative research methods.
http://www.alexander-technique-colledge.com/files/2011/10books-article-
qaulitative.pdf. Date of access: 7 Aug. 2013.
Noble, M. J., Wright, G., Magasela, W. & Ratcliffe, A. 2007. Developing a
democratic definition of poverty South Africa. Journal of Poverty, 11(4):117-141.
Noe, A. 2003. Causation and perception: the puzzle unravelled. Analysis, 63(2):93-
100.
Nussbaum, M. 2000. Women and human development: a study in human
capabilities. Cambridge: Cambridge University Press.
Nyasulu, G. 2010. Revisiting the definition of poverty. Journal of Sustainable
Development in Africa, 12(7):1520-5509.
Oosthuizen, M. 2008. Estimating poverty lines for South Africa. Department of
Social Development. Development Policy Research Unit. Cape Town: University of
Cape Town.
Oorschot, W. V. & Halman, L. 2010. Blame or fate, individual or social. Journal of
European Union, 2(1):1-28
Pallant, J. 2013. A step by step guide to data analysis using IBM SPSS. Survival
Manual. Washington DC: McGraw Hill.
Parahoo, K. 1997. Nursing research: principles, process and issues. Basingstoke:
Macmillan.
Ratcliffe, A. 2007. The measurement of poverty in South Africa project: Key issues.
http://www.treasury.gov.za/publications/other/povertyline/SPII%20document.pdf.
Date of access: 23 Oct. 2013.
Reutter, L.I., Veenstra, G., Stewart, M.J., Raphael, D., Love, R., Makwarimba., E. &
McMurray, S. 2005. Lay understandings of the effects of poverty: A Canadian
perspective. Health and Social Care in the Community, 13(6):514–530.
Rio Group. 2006. Expert group on poverty statistics. Seventh meeting, Rio de
Janerio, Brazillian Geographical and statistical Institute (IBGE).
Room, G. 1999. Social exclusion, solidarity and the challenge of globalisation.
International Journal of Social welfare, 8:66-74.

Perceived causes of poverty in a South African Township 116
Rowntree, B. S. 1901. Poverty: a study in town life. London: Macmillan and
Company.
Saunders, P. & Bradbury, B. 2006. Monitoring trends in poverty and income
distribution: data, methodology and measurement. The Economic Record,
82(258):341–364.
Saunders, P. 2002. The ends and means of welfare, coping with economic and
social change in Australia. Cambridge: Cambridge University Press.
Secretariat of the Pacific Community. 2007. Regional poverty analysis. Noumea,
New Caledonia. http://www.spc.int/sdd/index.php/en/downloads/cat_view/27-
conferenceworkshop-papers-and-articles/30-regional-poverty-analysis-technical-
workshop-2007. Date of access: 17 July 2013.
Seeberg, J. 2012. Qualitative methodology.
http://bsusdr.org/fileadmin/user_upload/bsusdr/Nepal_WG/Qualitative_methodology_
Jens_Seeberg.pdf Date of access: 9 Oct. 2013.
Seimenis, A. 2012. Zooness and poverty: A long road to alleviation of suffering.
Vetarinaria Italiana, 48(1):5-13.
Sekatane, M.B. 2006. An analysis and application of different methodologies for
measuring poverty in Sharpeville. Vanderbjlpark: NWU. (Thesis-PHD).
Sekhampu, T. J. 2013. Determinants of poverty in a South African Township.
Journal of Social Science, 34(2): 145-153.
Sekhampu, T. J. 2012. Poverty in South African township: the case of Kwakwatsi.
Journal of business management 6(33):9504-9509.
Sen, A. 1997. Inequality re-examined. Cambridge: Harvard University Press.
Sen. A.K. 1993. Capability and well-being. Oxford: Clarendon Press.
Sen, A.K. 1987. The Standard of living. Cambridge: Cambridge University Press.
Sen. A. K. 1985. Commodities and Capabilities. Amsterdam: North-Holland
Publishers.
Shek, D. T. L. 2004. Beliefs about the causes of poverty in parents and
adolescents. Experiencing economic disadvantage in Hong Kong.
.http://www.tandfonline.com/loi/vgnt20 Date of access: 8 Jan. 2013.

Perceived causes of poverty in a South African Township 117
Shinns,L.H. & Lyne, M.C. 2003. Possible causes of poverty within a group of land
reform beneficiaries in the Midlands of KwaZulu-Natal: Analysis and Policy
Recommendations. Agrekon, 44(1):157-169.
Slabbert, T.J.C. 2004. An investigation into state of affairs and sustainability of the
Emfuleni economy. Pretoria University. (Thesis-Phd.)
Smith, K. B. & Stone, L. H. 1989. Rage, riches and bootstraps: beliefs about causes
of wealthy and poverty. The Sociological Quarterly, 30(1):93-107
Stewart, L. 2004. Poverty and social exclusion. www.poverty.ac.uk/analysis-
poverty-measurement-life-chances-government-policy/redidining-poverty Date of
access: 20 Oct. 2013.
Soemarno, T. 2007. Quantitative and Qualitative Research.
www.slideshare.net/guest3bd2a12/quantitative-research-presentation . Date of
access 24 Oct. 2013
Suhr, D.D. 2005. Principal component analysis vs explaratory factor analysis.
University of Northern Colorado. (Thesis-PHD)
Sukamolson, S. 2009. Fundamentals of quantitative research. Language Institute;
Chalalongkorn University.
Sun, A. P. 2001. Perceptions among social work and non-social work students
concerning causes of poverty. Journal of Social Work Education, 37(1):161-174.
Statistics South Africa (Stats S.A). 2013. Quarterly Labour Force Survey. Statistical
Release. South Africa.
Statistics South Africa (Stats S.A). 2012. South African Statistics. Pretoria:
Statistics South Africa.
Statistics South Africa (Stats S.A). 2011. Income and expenditure of households.
http://www.statssa.gov.za/publications/P0100/P01002011.pdf Date accessed: 9
Sept. 2013.
South Africa Gold Coin Store. 2013. Causes of poverty in Africa.
www.sadoldcoin.co.za Date of access 23 October 2013.
The Australian Collaboratation. 2011. Poverty and its causes. A collaboration of
National Community Organisations.

Perceived causes of poverty in a South African Township 118
http://www.australiancollaboration.com.au/pdf/FactSheets/Fair-Australia-
FactSheet.pdf Date of access: 9 Aug. 2013.
Thom, E. 1977. Strategies against poverty: A Policy Analysis.
http://asj.sagepub.com/content/51/1/23.refs?patientinformlinks=yes&legid=spasj;51/1
/23. Date of access 7 Oct. 2013.
Turner, A. G. 2003. Sampling frames and master samples.
http://unstats.un.org/unsd/demographic/meetings/egm/Sampling_1203/docs/no_3.pd
f Date of access: 1 June 2013.
Townsend, P. 1979. Poverty in the United Kingdom: a survey of household
resources and standards of living. London: Allen Lane.
Townsend, P. 1954. Measuring Poverty. The British Journal of Sociology 5(2):130-
137.
Underlid, K. 2005. Poverty and experiences of social devaluation: A qualitative
interview study of 25 long-standing recipients of social security payments.
Scandinavian Journal of Psychology, 46:273–283.
United Nations Development Programme. 2012. Human Development Report.
New York: UN Plaza.
United Nations Development Programme. 2005. Human Development Report.
New York: Oxford University.
United Nations Development Programme. 2003. A compact among Nations to end
human poverty. New York: UNDP.
United Nations Development Programme. 1997. Human Development Report.
Urban Indicators for Managing Cities. Oxford: Westfall.
UNICEF (United Nations Children's Fund). 2012. Infant and under-five mortality.
http://www.unicef.org. Date of access: 26 Feb. 2013.
Van Praag, B. M., Haganaars, A.J. & Van Weerden, H. 1982. Poverty in Europe.
Review of income and wealth, 28(3):345-359
Wagle, U. 2002. Rethinking poverty: definition and measurement. International
Social Science Journal, 54(171):155-65.

Perceived causes of poverty in a South African Township 119
Waxman, C.I. 1983. The stigma of poverty: a critique of poverty theories. New
York: Pergamon Press.
West, C. 1999. Marketing research. London: Macmillan Business Masters.
Weiss, I. & Gal, J. 2007. Social workers' attitudes towards social welfare policy.
International Journal of Social Welfare, 16:349-357.
White, E. G. 1952. Education. Chicago: Pacific Press Pub. Association.
White, C., Van, G. F. & Chow, Y. N. 2003. Trends in social class differences in
mortality by cause. Quarterly bulletin, 25(37):1986-2000.
White, H. & Killick, T. 2001. African poverty at the millennium, causes, complexities
and challenges. Washington DC: World Bank.
White, H. & Masset, E. 2003. The Importance of household size and composition in
constructing poverty profiles. Brighton: Oxford Press.
Wilson, G. 1996. Toward a revised framework for examining beliefs about the
causes of poverty. The Sociological Quarterly, 37(3):413-428.
William, B., Brown, T. & Onsman, A. 2012. Exploratory factor analysis: a five step
guide for the novice. Australasian Journal of Paramedicine, 8(3):1-3.
Wilson, W.J. 1987. The truly disadvantaged: the inner city, the underclass, and
public policy. Chicago: University of Chicago Press.
Wollie, C.W. 2009. Causal attributions for poverty among youths in Bahir Dar,
Amhara region, Ethiopia. Journal of Social, Evolutionary, and Cultural Psychology, 3:
251-272.
Woolard, I. 2002. An overview of poverty and inequality in South Africa.
http://sarpn.org/documents/e0000006/Poverty_Inequality_SA.pdf Date of access: 19
Sept. 2013.
World Bank. 2011. Poverty estimates and outlook.
http://go.worldbank.org/VL7N3V6F20. Date of Access: 4 March 2013.
World Bank. 2012. Poverty Reduction Equity.web.worldbank.org. Date of access 4
August 2013.

Perceived causes of poverty in a South African Township 120
World Bank. 2005. Introduction to poverty analysis.
http://siteresources.worldbank.org/INTANNREP2K5/Resources/51563_English.pdf.
Date of access: 23 Aug. 2013
Worstal, T. 2012. The problem with relative poverty. London: Adam Smith Institute.
Wright, G. 2008. Findings from the Indicators of Poverty and Social Exclusion
Project. Pretoria: Statistics South Africa.
Yunus, M. 1994. Alleviation of poverty is a matter of will, not of means.
http://www.grameeninfo.org/index.php?option=com_content&task=view&id=323&Ite
mid=275&limit=1&limitstart=4. Date of access: 7 June 2013.
Zikmund, W.G. 2000. Business Research. Chicago: Dryden Press.
Zucker, G. S. & Weiner, B. 1993. Conservatism and perceptions of poverty: an
attributional analysis. Journal of Applied Social Psychology, 23,925–943.