pepfar and treatment 2 - whopepfar evaluation of poc cd4, through cdc quality indicators:...
TRANSCRIPT

PEPFAR and Treatment 2.0
Charles Holmes, MD, MPHOffice of the US Global AIDS CoordinatorPresident’s Emergency Plan for AIDS
Relief
World Health Assembly Treatment 2.0 Side Meeting
May 19, 2011

Drug Optimization
• At a global-level:– Purchasing power to drive demand for ARV regimens with
better profiles for TB, pregnancy, durability, toxicity and simplicity
– Build on the work CHAI, UNITAID and others have done to ensure manufacturers are moving toward more efficient process chemistry and co-formulations
• At country-level:– Annual guidance to PEPFAR country teams encourages use
of 2010 WHO guideline regimens and movement to FDCs; emphasizes support to national program guidelines committees
– PEPFAR works with SCMS and other ARV procurement partners to ensure that suppliers are responsive to the needs of the national programs we support
Pillar 1: Drug Optimization

Diagnostics and Monitoring Optimization
• PEPFAR believes that improvements in laboratory platforms and systems and use patterns are essential to improving the impact and efficiency of our programs
• Working with country teams to support national governments in the evaluation of basic packages of laboratory support that are needed and ensuring greater consistency in laboratory use across implementing partners.
• As part of tiered laboratory systems, PEPFAR sees value in careful adoption of POC diagnostics

Point-of-Care CD4 Testing
Available Now: Pima CD4 Assay
In Evaluation or soon to be in evaluation:ZAHA! By Force DiagnosticsDaktari Zyomax
Pillar 2: Improving Diagnostics

PEPFAR Evaluation of POC CD4, Through CDC
Quality Indicators:Accuracy- Comparison with other CD4 assays
CD4 counts <500: R2= 0.93CD4 counts >500: R2= 0.96
Bias- Variation from other CD4 assaysCD4 counts <500: 1 cell/uLCD4 counts >500: -15 cells/uL
Precision- Reproducibility (Average CV%)CD4 counts <200: 13.4%CD4 counts >200: 5.9%
0
100
200
300
400
500
600
02468
1012141618 Pima CD4
FACSCountFACSCalibur TriTestGuava Easy CD4
CV%
CD
4 co
unt
(cel
ls/μ
L)
Source: John Nkengesong, CDCPillar 2: Improving Diagnostics

Select PEPFAR Implementation and Field ActivitiesFor POC CD4
• Tanzania: Protocol for validation of specimen type (venous vs finger-stick blood) and acceptance by healthcare worker performing testing
• Dominican Republic: Protocol for Quality Monitoring and acceptance by healthcare worker performing testing
• Supporting national governments in the development of plans that promote standards, guidelines and policy for the quality management and monitoring
Pillar 2: Improving Diagnostics

• Pilot rollout phase 1 for evaluation
– 23 sites, 30 instruments in 9 provinces
– 54 individuals trained
– 10,423 samples processed to date nationally
• Pilot will help facilitate costing, algorithm development, performance of instrumentation, future research and development
– Pilot EQA program developed
GeneXpert Implementation to date through Government of South Africa/PEPFAR Partnership
Source: Wendy Stevens, NHLSPillar 2: Improving Diagnostics

Reducing Costs
• Cost savings in PEPFAR HIV treatment programs over time
• Addressing service delivery costs• ARV price and delivery savings through PEPFAR
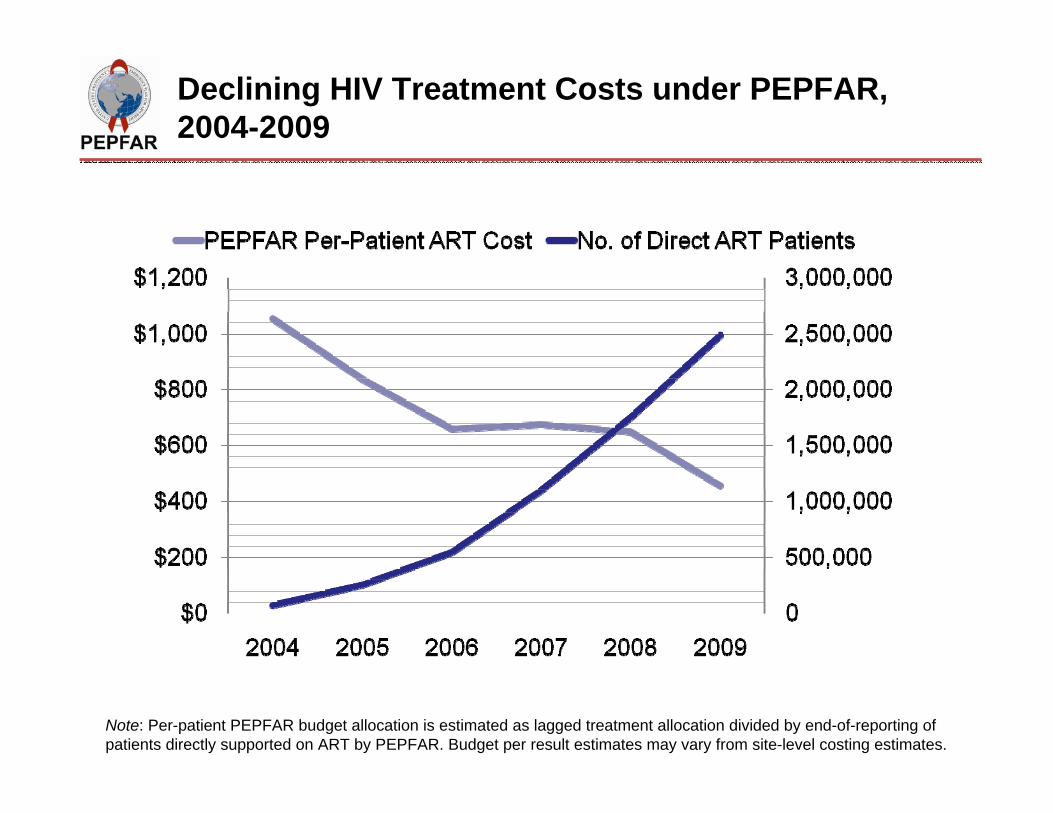
Declining HIV Treatment Costs under PEPFAR, 2004-2009
Note: Per-patient PEPFAR budget allocation is estimated as lagged treatment allocation divided by end-of-reporting of patients directly supported on ART by PEPFAR. Budget per result estimates may vary from site-level costing estimates.

Sample PEPFAR Expenditure Analysis Results: HIV Testing and Counseling. Driving Efficiency Through Better Information
13%
64%
23%
$11.34 Category Mean Range
Central Support 1.48 0.38‐12.41
Operating 7.24 1.66‐21.43
Investment 2.62 0.27‐5.88
Total 11.34 2.63‐32.82
Category ALL Partners Range
Central Support 13 % 5 %‐57 %
Operating 64 % 30 %‐84 %
Investment 23 % 2 %‐37 %
Cost Per Client by Cost Category (2009 USD)
Distribution of Costs by Category
Pillar 3: Reducing CostsNote: Sample data from a single country. There are multiple sources of observed heterogeneity that may be assessed by local program managers.

Savings in ARVs
16% Generic
88% Generic
89% Generic
73% Generic
40% Generic
* Monthly pack volume decrease d in 2009 due to increased purchasing of fixed dose combinations
*
JAMA, 2010

International SCMS ARV Transport, by Mode
Pillar 3: Reducing Costs Source: SCMS

Adapting Delivery Systems
• Shifts toward lower level care delivery
• Integration of TB/HIV services
• Integration of PMTCT/MNCH services- new guidance
Pillar 4: Adapting Delivery Systems

Early Benefits of Lower-Level ART Delivery
•At the lower level sites:— Patient outcomes are as good as or better than at hospital‐based sites— Costs are lower (9% in South Africa, 21% in Zambia)— Most of the savings come from lower fixed and staff costs and fewer lab tests
Pillar 4: Adapting Delivery Systems Source: Sydney Rosen

TB/HIV Integration in Rwanda
• TB - One-stop service– Early HIV diagnosis– ART, CD4, clinical
care, cotrimoxazole• ART
– TB screening with checklist
– Rapid and accurate TB diagnosis
Pillar 4: Adapting Delivery Systems Source: Greet Vanderbriel, ICAP Rwanda

PEPFAR Supports Strategic HIV-MNCH Integration to Improve PMTCT and ART Outcomes
• HIV care and treatment in MNCH settings increases ART enrollment– Swaziland : Enrolling women on ART in ANC
services increased eligible women receiving ART from 5% to 45%. Pilot rolled out nation-wide
– Zambia: Enrolling women on ART in ANC services more than doubled the proportion of eligible women starting treatment from 14% to 33%
Source: Elizabeth Glaser Pediatric AIDS FoundationPillar 4: Adapting Delivery Systems


Community Mobilization
• Peer support to provide individuals with the comfort and information needed to be successful on treatment and PMTCT– PEPFAR supports partners and we’re beginning to see
national adoption of best practices• Mobilization of civil society
– Working to support groups of PLWHA and most at risk populations, especially in concentrated epidemics to design systems to support access and rights
• Community support– Supporting affected individuals to map available care
resources, support and education groups that improve adherence and encourage greater testing of partners and community members
Pillar 5: Community Mobilization

For further information, please visit:www.PEPFAR.gov
www.facebook.com/PEPFARhttp://twitter.com/USPEPFAR
Thank You!